motley fool one mindset charts
TRANSCRIPT
37323 37468 37621 37772 37925 38077 38230 38383 38533 38686 38837 38990 39141 39294 39447 39599 39752 39903 40056 40209 40359 40512 40663 40816 40968 41121 41274 41425 41578 41729 41882 42035 42185 42338 $-
$2,000
$4,000
$6,000
$8,000
$10,000
$12,000
$14,000
$16,000
$18,000
$20,000
0
10
20
30
40
50
60
70
80
90
100
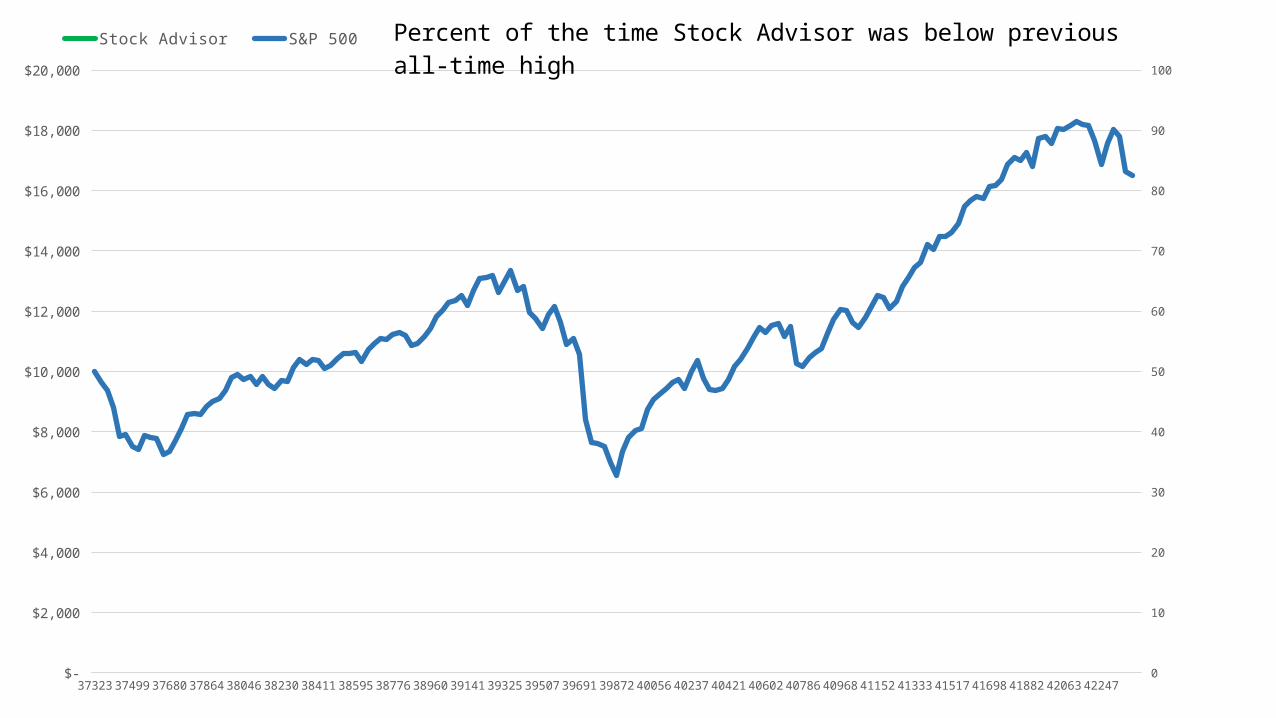
Stock Advisor S&P 500 Percent of the time Stock Advisor was below previous all-time high
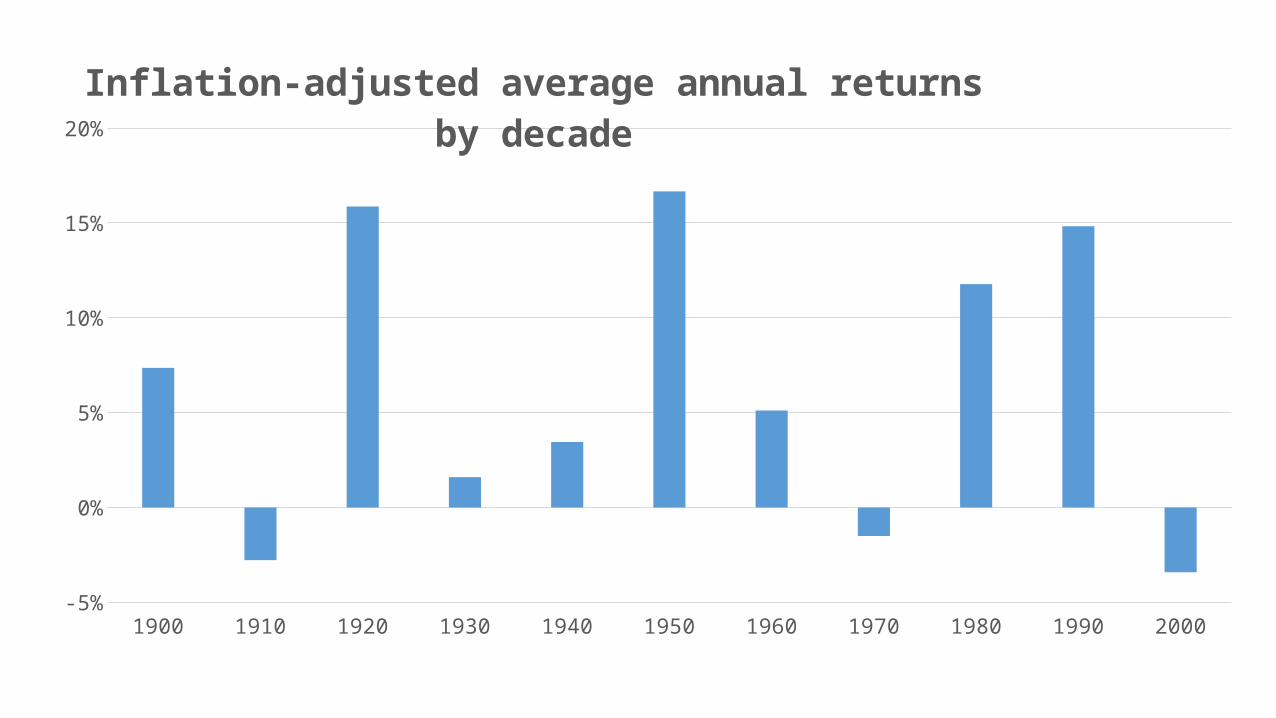
1900 1910 1920 1930 1940 1950 1960 1970 1980 1990 2000-5%
0%
5%
10%
15%
20%
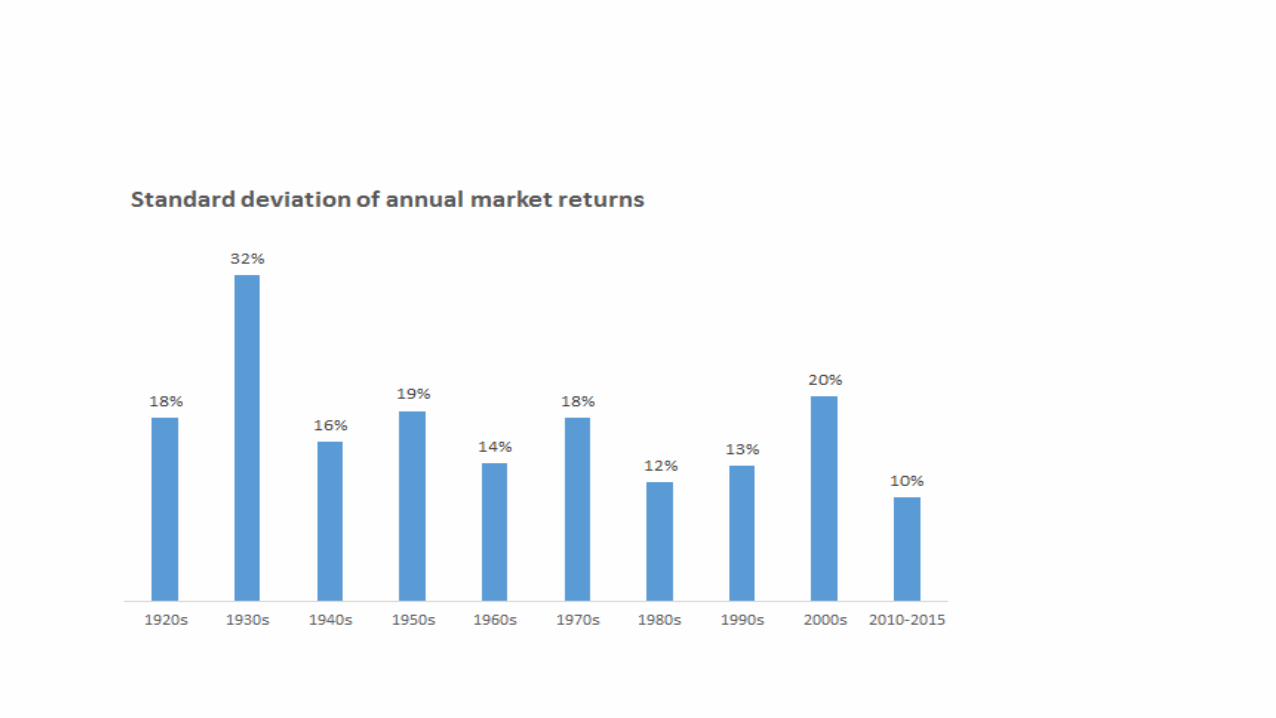
Inflation-adjusted average annual returns by decade
13 18 23 280
1
2
3
4
5
6
7
8
9
10
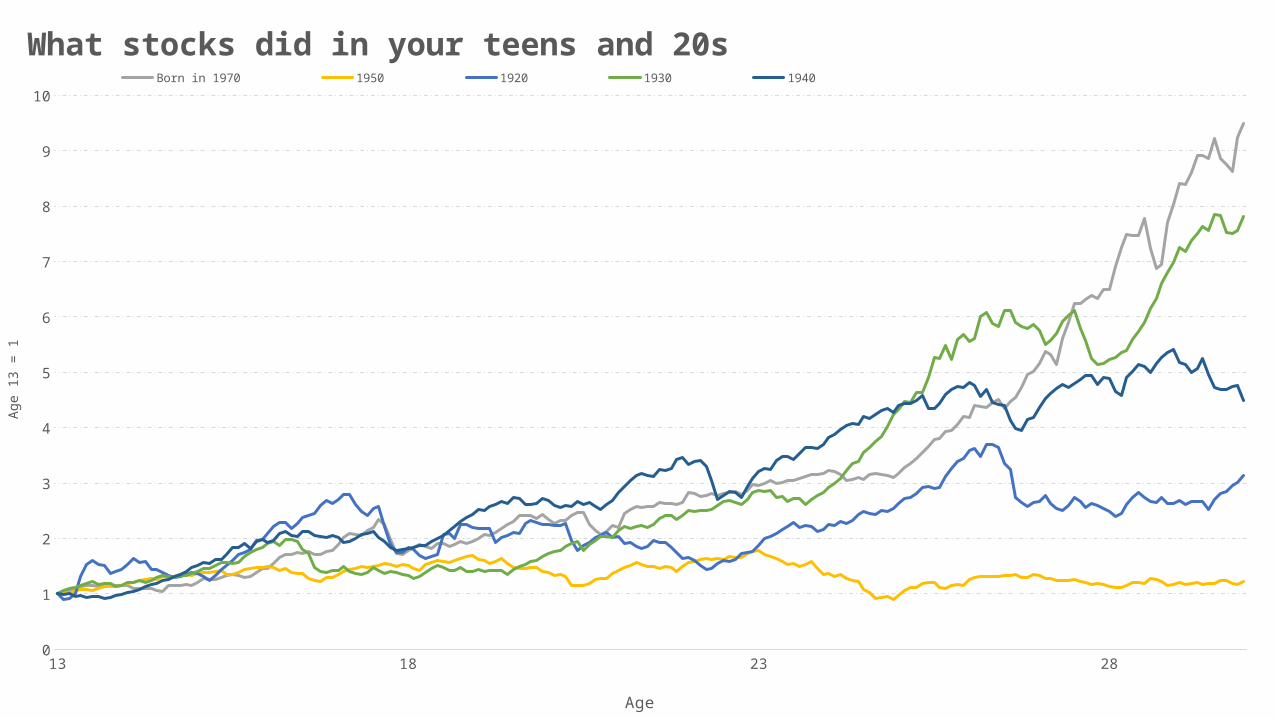
What stocks did in your teens and 20sBorn in 1970 1950 1920 1930 1940
Age
Age
13 =
1
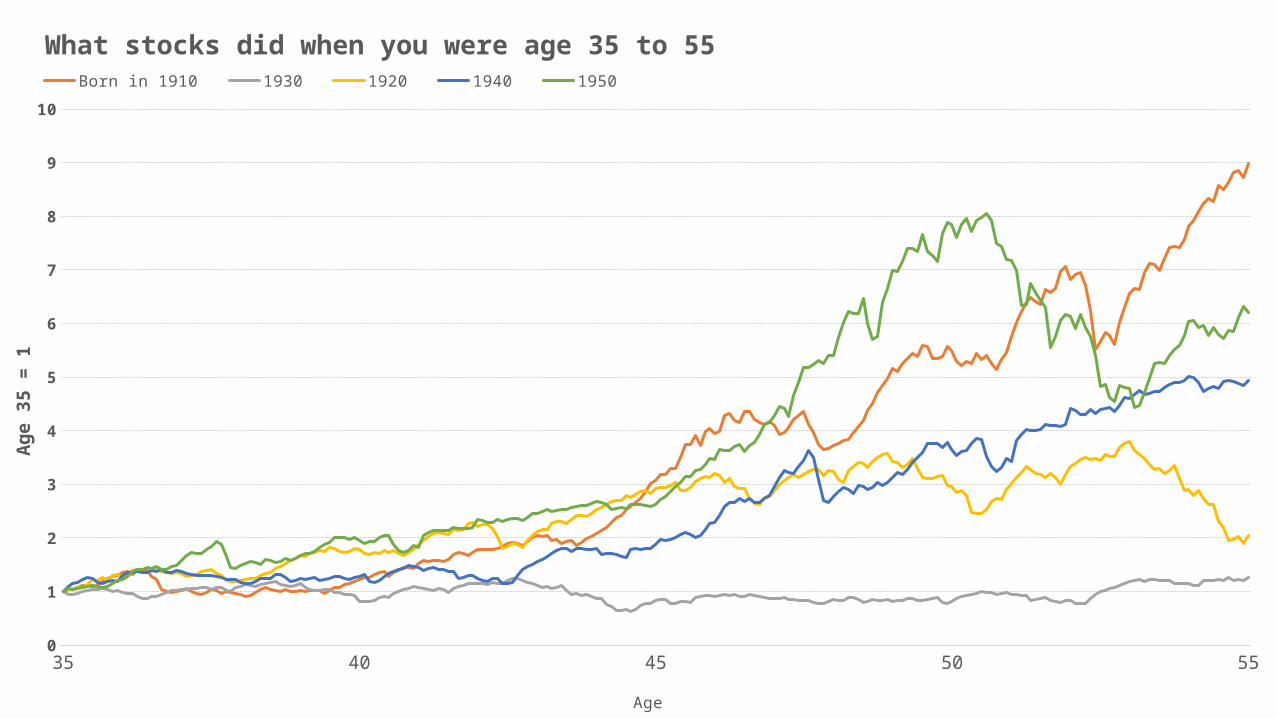
35 40 45 50 550
1
2
3
4
5
6
7
8
9
10
What stocks did when you were age 35 to 55 Born in 1910 1930 1920 1940 1950
Age
Age
35 =
1
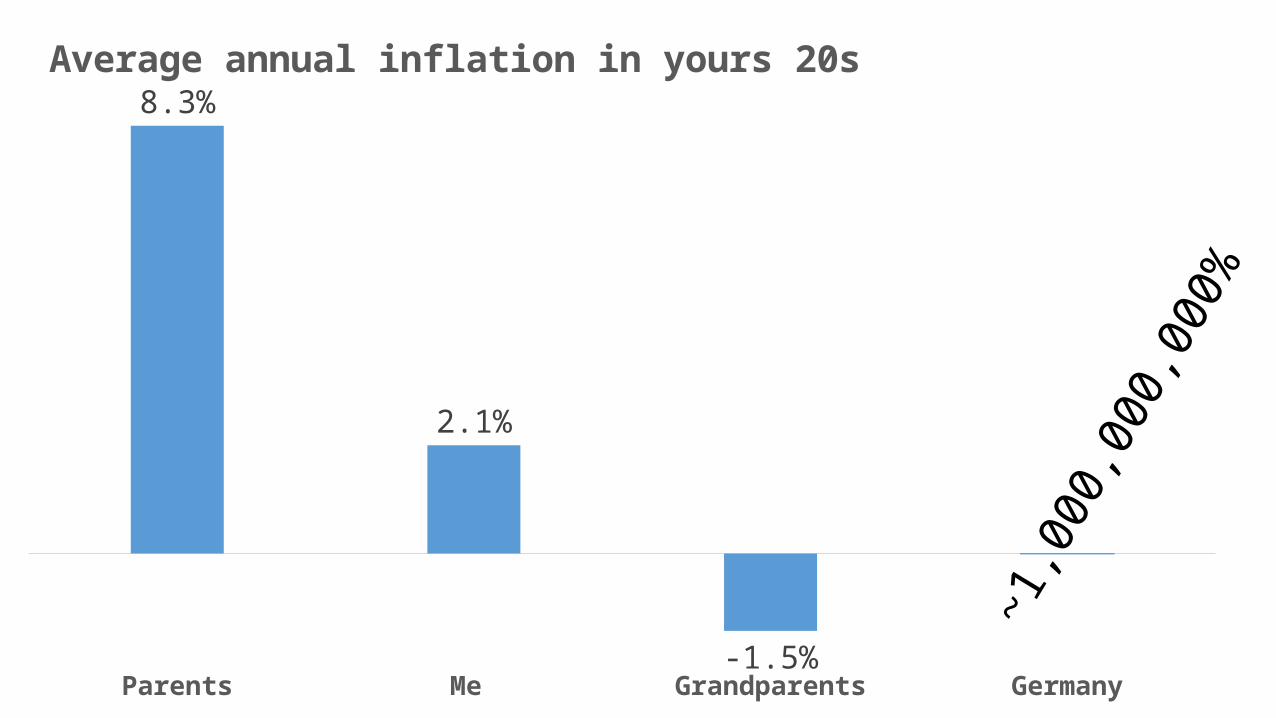
Parents Me Grandparents Germany
8.3%
2.1%
-1.5%
Average annual inflation in yours 20s
~1,0
00,0
00,0
00%
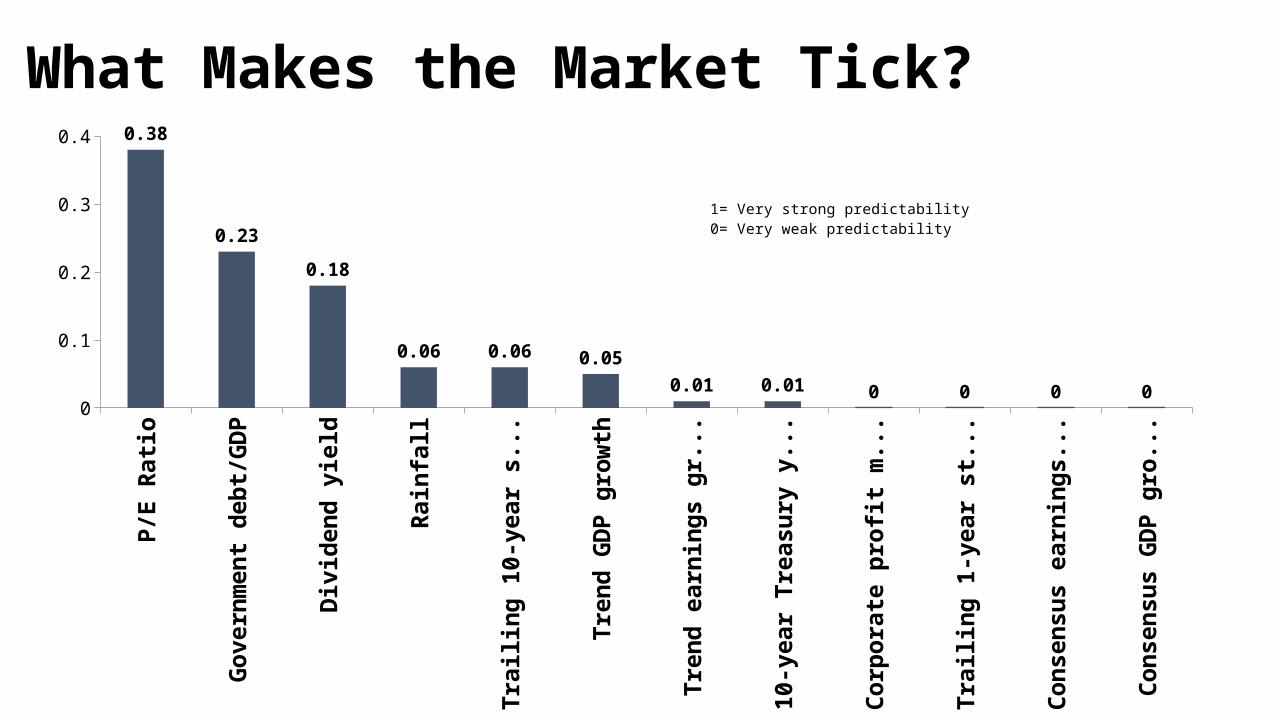
What Makes the Market Tick? P/
E Ra
tio
Gove
rnm
ent d
ebt/
GDP
Divi
dend
yie
ld
Rain
fall
Trai
ling
10-y
ear s
tock
retu
rns
Tren
d GD
P gr
owth
Tren
d ea
rnin
gs g
row
th
10-y
ear T
reas
ury
yiel
d
Corp
orat
e pr
ofit m
argi
ns
Trai
ling
1-ye
ar st
ock
retu
rns
Cons
ensu
s ear
ning
s gro
wth
Cons
ensu
s GDP
gro
wth
0
0.1
0.2
0.3
0.4 0.38
0.23
0.18
0.06 0.06 0.050.01 0.01 0 0 0 0
1= Very strong predictability0= Very weak predictability
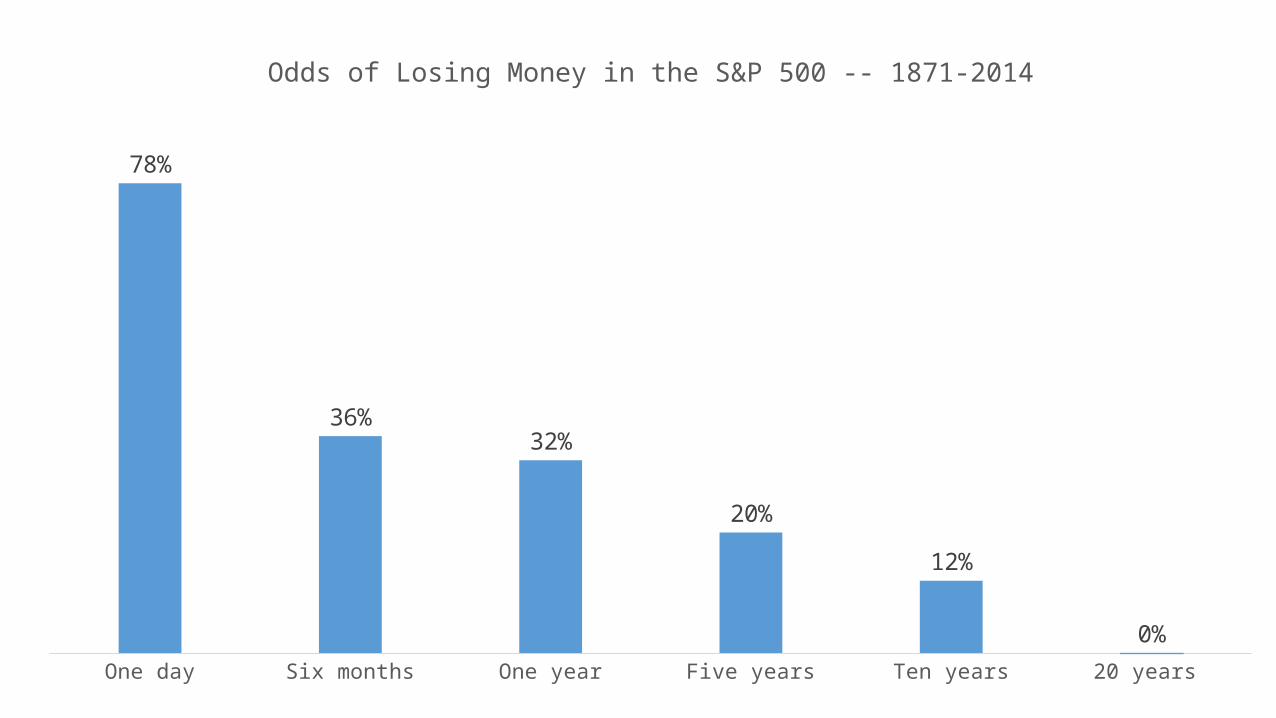
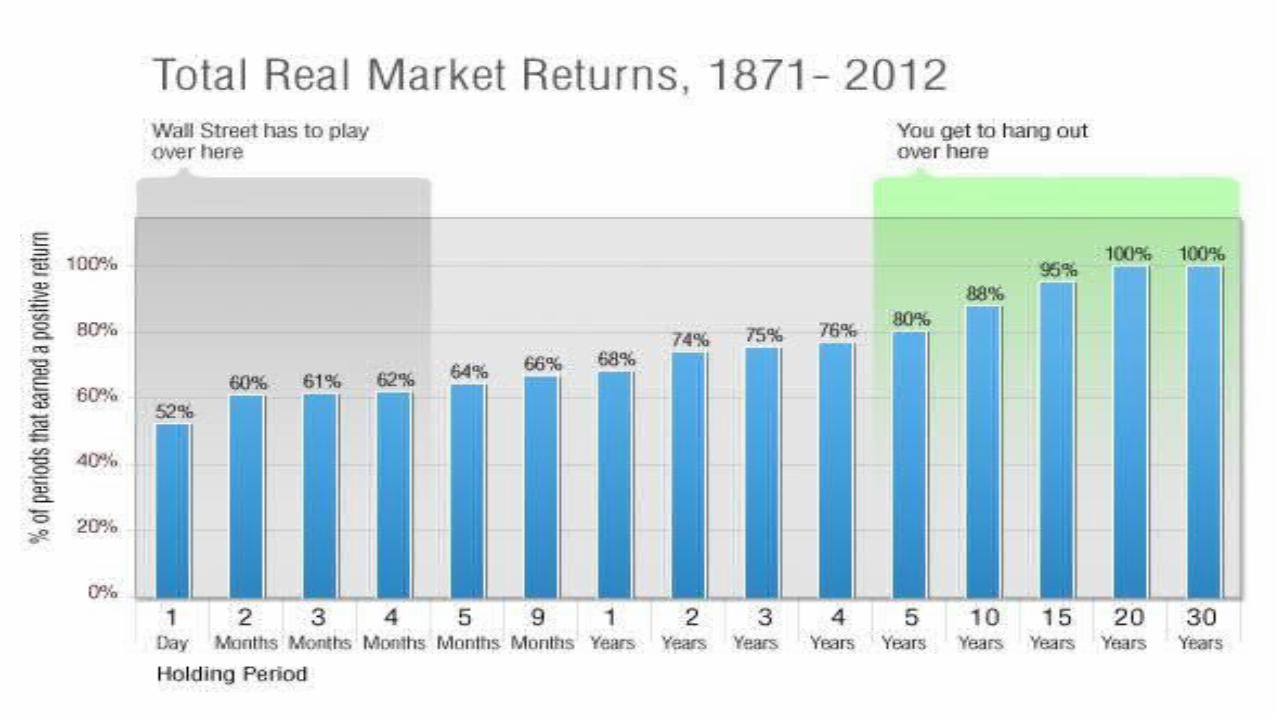
One day Six months One year Five years Ten years 20 years
78%
36%32%
20%
12%
0%
Odds of Losing Money in the S&P 500 -- 1871-2014
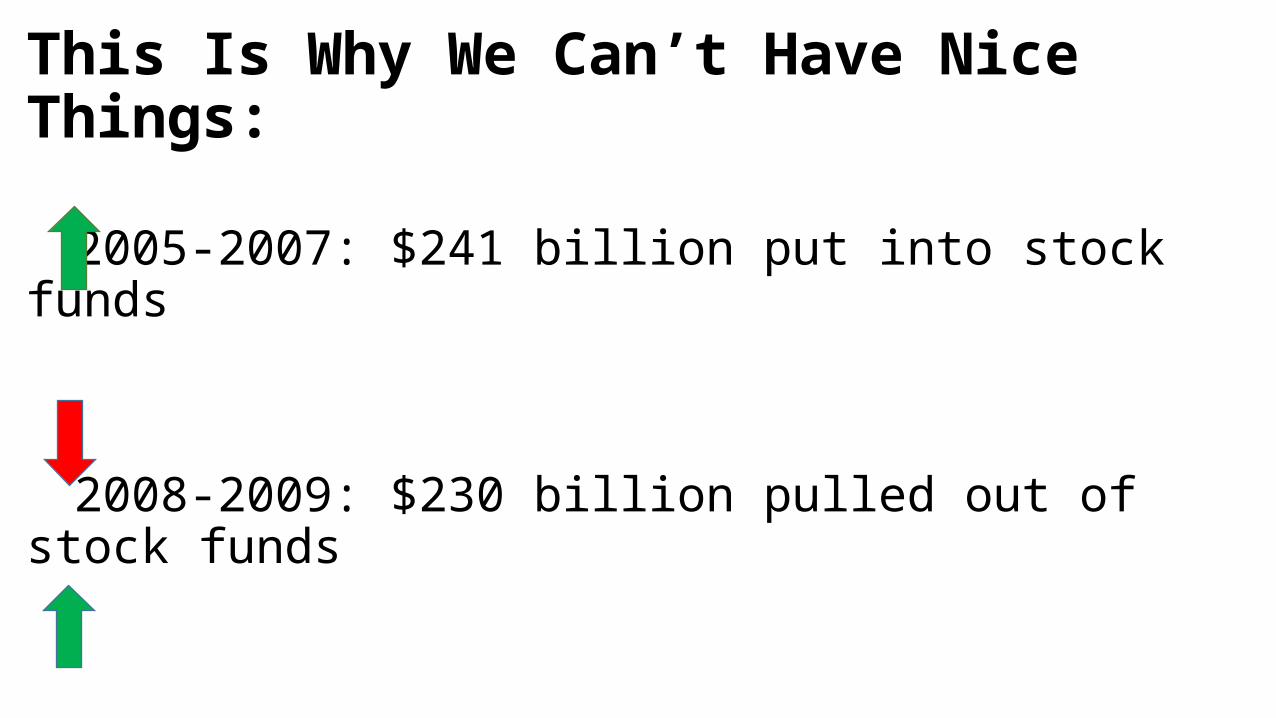
This Is Why We Can’t Have Nice Things:
2005-2007: $241 billion put into stock funds
2008-2009: $230 billion pulled out of stock funds
2013-2014: $239 billion put into stock funds
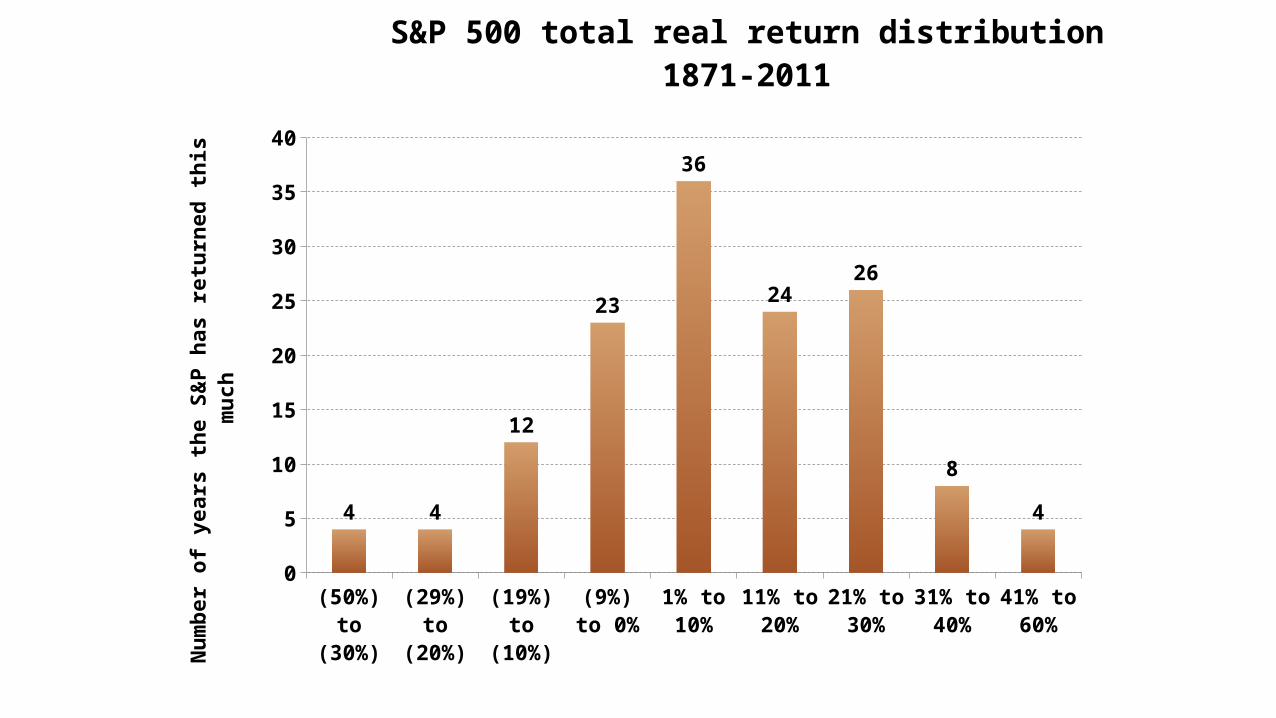
(50%) to (30%)
(29%) to (20%)
(19%) to (10%)
(9%) to 0%
1% to 10%
11% to 20%
21% to 30%
31% to 40%
41% to 60%
0
5
10
15
20
25
30
35
40
4 4
12
23
36
2426
8
4
S&P 500 total real return distribution1871-2011
Num
ber o
f yea
rs th
e S&
P ha
s ret
urne
d th
is m
uch