motor vehicle exhaust emissions - - over · pdf filemotor vehicle exhaust emissions emission...
TRANSCRIPT

Motor Vehicle
Exhaust Emissions
Emission Control and Standards
Self-Study ProgramCourse Number 943003

Audi of America, Inc.Service TrainingPrinted in U.S.A.Printed 3/01Course Number 943003
©2001 Audi of America, Inc.
All rights reserved. Information containedin this manual is based on the latest information available at the time of printing and is subject to the copyright and other intellectual property rights of Audi of America, Inc., its affiliated companies and its licensors. All rights are reserved to make changes at anytime without notice. No part of this documentmay be reproduced, stored in a retrievalsystem, or transmitted in any form or by anymeans, electronic, mechanical, photocopying,recording or otherwise, nor may these materials be modified or reposted to other sites without the prior expressed writtenpermission of the publisher.
All requests for permission to copy and redistribute information should be referred to Audi of America, Inc.
Always check Technical Bulletins and theAudi Worldwide Repair InformationSystem for information that may supersedeany information included in this booklet.

Course Goals . . . . . . . . . . . . . . . . . . . . . . . . . . . . . . . . . . . . . . . . . . . . ii
Introduction . . . . . . . . . . . . . . . . . . . . . . . . . . . . . . . . . . . . . . . . . . . . . 1
Composition . . . . . . . . . . . . . . . . . . . . . . . . . . . . . . . . . . . . . . . . . . . . 2
Exhaust Gas Components . . . . . . . . . . . . . . . . . . . . . . . . . . . . . . . . . . . 3
Operating Conditions and their Effect on Exhaust Gas Composition . . . . 7
Methods of Reducing Emissions . . . . . . . . . . . . . . . . . . . . . . . . . . . . 11
Reduction of Fuel Consumption . . . . . . . . . . . . . . . . . . . . . . . . . . . . . . 11
Management of Fuel Vapor Losses . . . . . . . . . . . . . . . . . . . . . . . . . . . 15
Treatment of Exhaust Gases . . . . . . . . . . . . . . . . . . . . . . . . . . . . . . . . 16
Performance Monitoring (On Board Diagnostics) . . . . . . . . . . . . . . . . . 17
Certification and Testing . . . . . . . . . . . . . . . . . . . . . . . . . . . . . . . . . . 18
Federal Emissions Certification . . . . . . . . . . . . . . . . . . . . . . . . . . . . . . 18
California Emissions Standards . . . . . . . . . . . . . . . . . . . . . . . . . . . . . . 22
Regional Differences . . . . . . . . . . . . . . . . . . . . . . . . . . . . . . . . . . . . . . 23
Emissions Inspection . . . . . . . . . . . . . . . . . . . . . . . . . . . . . . . . . . . . . 24
Summary . . . . . . . . . . . . . . . . . . . . . . . . . . . . . . . . . . . . . . . . . . . . . . 25
Teletest . . . . . . . . . . . . . . . . . . . . . . . . . . . . . . . . . . . . . . . . . . . . . . . 27
Table of Contents
Page
i

Course goals
• Recognize the need for emissionscontrols
• Review the composition of exhaust gases
• Identify methods for reducing harmfulpollutants
• Outline specific testing procedures
ii
Course Goals

1
Introduction
The effects of the internal combustionengine on air quality have been an environ-mental concern for many years. TheEnvironmental Protection Agency (EPA) rais-es the average fuel economy requirementyearly, and reduces allowable emissionsevery few years.
Emissions control efforts appear to be work-ing. While the number of automobile regis-trations has risen sharply, fuel consumptionhas risen only slightly. Today, passengervehicles account for less than 24 percent ofsmog in major cities, compared to 40 per-cent in 1970. These findings are more prom-ising when we take into account that thenumber of miles driven per year hasincreased to 2 1/2 times the amount drivenin 1970, and that light truck/SUV registra-tions have nearly doubled during the past 5years.
It has been determined that half of all auto-mobile pollution is generated by those 10percent of the vehicles in the worst runningcondition. Modern emissions control stan-dards ensure that today’s automobiles runcleaner, but today’s technicians ensure thepercentage of gross polluters will continueto decline, ensuring that the quality of theenvironment will continue to increase in thefuture.
Introduction
CO, NOx, HC
100%
80%
60%
40%
20%
0%1975 1980 1985 1990 1995 2000
HC
NOx
CO
SSP 9430/01
Allowable Emissions
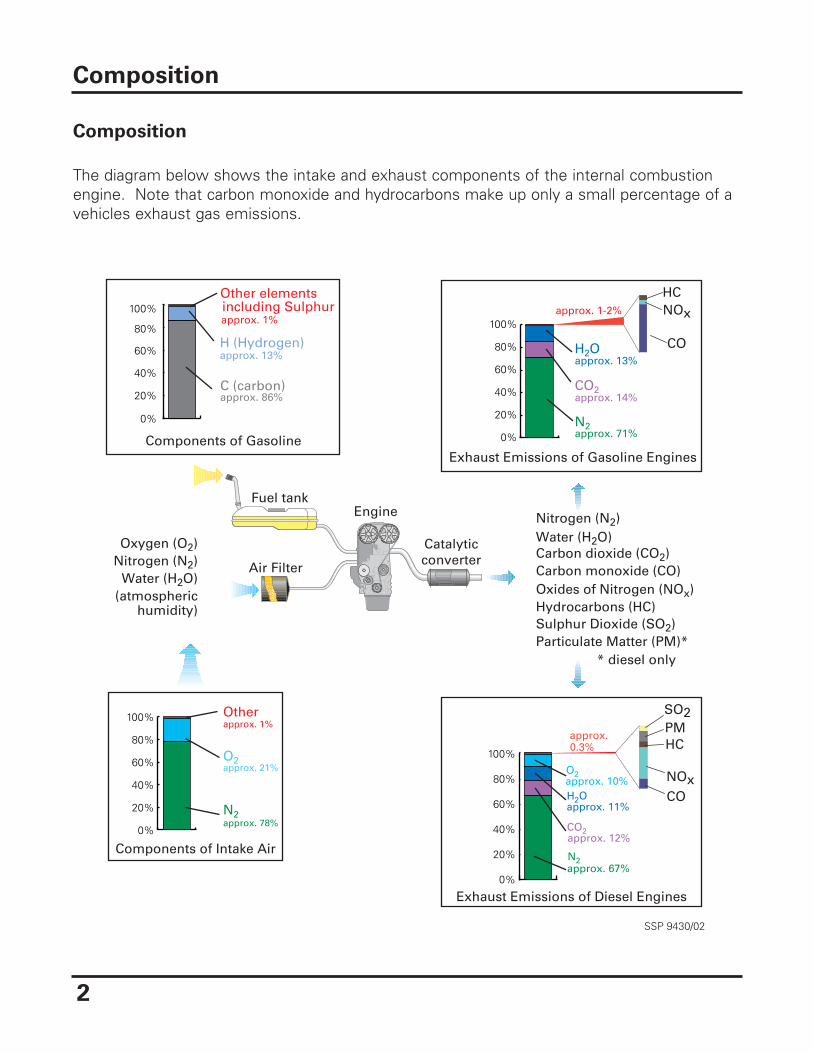
Composition
The diagram below shows the intake and exhaust components of the internal combustionengine. Note that carbon monoxide and hydrocarbons make up only a small percentage of avehicles exhaust gas emissions.
Composition
2
(atmospheric
Fuel tank
Air Filter
Engine
Catalyticconverter
SSP 9430/02
N2approx. 78%
O2approx. 21%
approx. 1%Other
0%
20%
40%
60%
80%
100%
Components of Intake Air
H2O
N2
HCNOx
CO
approx. 14%
approx. 13%
approx. 71%
approx. 1-2%
CO2
0%
20%
40%
60%
80%
100%
Exhaust Emissions of Gasoline Engines
approx. 12%
approx. 11%
approx. 10%
CO2
H2O
O2
N2approx. 67%
0%
20%
40%
60%
80%
100%
SO2PMHC
NOxCO
approx.
Exhaust Emissions of Diesel Engines
* diesel only
0%
20%
40%
60%
80%
100%
C (carbon)approx. 86%
H (Hydrogen)
Other elements
Components of Gasoline
Oxides of Nitrogen (NOx)Hydrocarbons (HC)Sulphur Dioxide (SO2)Particulate Matter (PM)*
Nitrogen (N2)Water (H2O)Carbon dioxide (CO2)Carbon monoxide (CO)Water (H2O)
Nitrogen (N2)Oxygen (O2)
humidity)
0.3%
including Sulphurapprox. 1%
approx. 13%
3
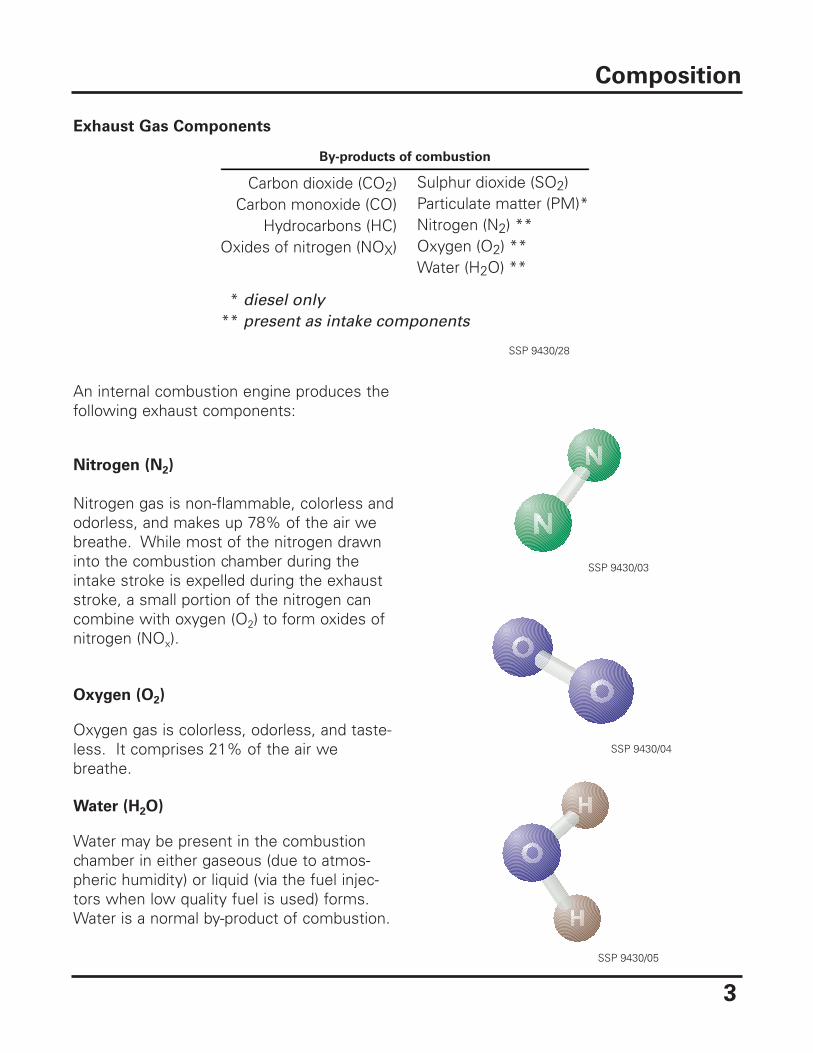
Exhaust Gas Components
An internal combustion engine produces thefollowing exhaust components:
Nitrogen (N2)
Nitrogen gas is non-flammable, colorless andodorless, and makes up 78% of the air webreathe. While most of the nitrogen drawninto the combustion chamber during theintake stroke is expelled during the exhauststroke, a small portion of the nitrogen cancombine with oxygen (O2) to form oxides ofnitrogen (NOx).
Oxygen (O2)
Oxygen gas is colorless, odorless, and taste-less. It comprises 21% of the air webreathe.
Water (H2O)
Water may be present in the combustionchamber in either gaseous (due to atmos-pheric humidity) or liquid (via the fuel injec-tors when low quality fuel is used) forms.Water is a normal by-product of combustion.
Composition
By-products of combustion
Carbon dioxide (CO2)Carbon monoxide (CO)
Hydrocarbons (HC)Oxides of nitrogen (NOX)
* diesel only** present as intake components
Sulphur dioxide (SO2)Particulate matter (PM)*Nitrogen (N2) **Oxygen (O2) **Water (H2O) **
SSP 9430/28
SSP 9430/03
SSP 9430/04
SSP 9430/05
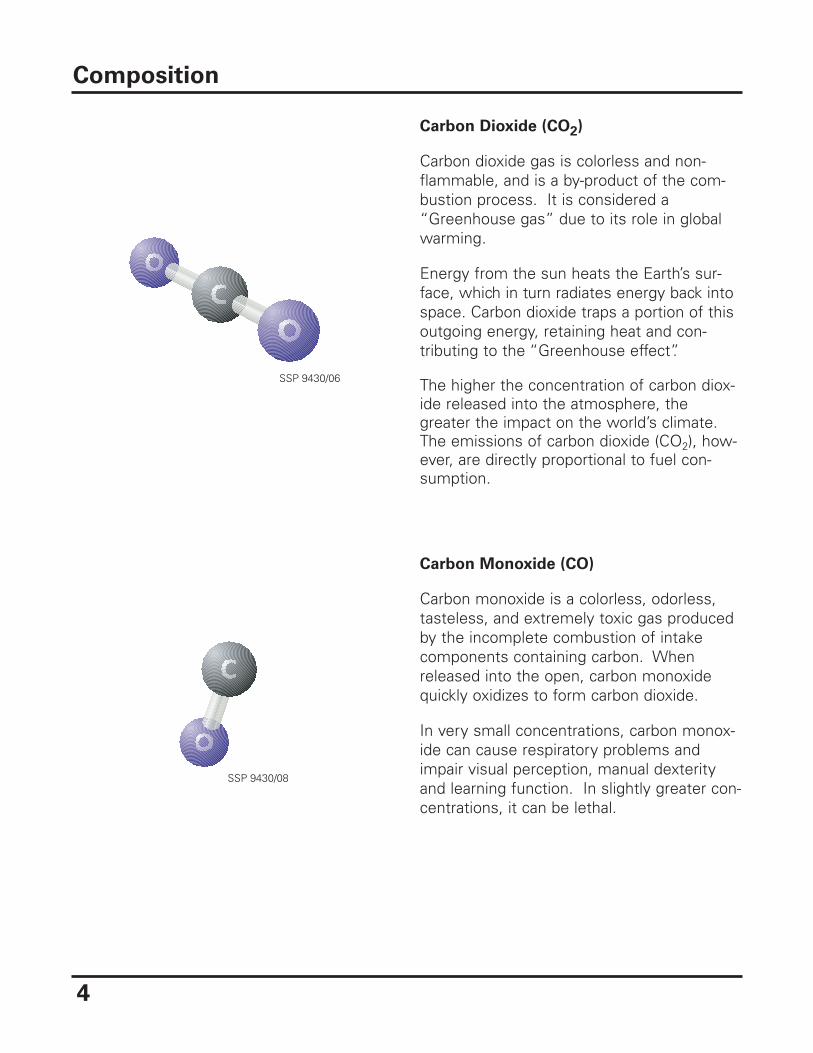
Carbon Dioxide (CO2)
Carbon dioxide gas is colorless and non-flammable, and is a by-product of the com-bustion process. It is considered a“Greenhouse gas” due to its role in globalwarming.
Energy from the sun heats the Earth’s sur-face, which in turn radiates energy back intospace. Carbon dioxide traps a portion of thisoutgoing energy, retaining heat and con-tributing to the “Greenhouse effect”.
The higher the concentration of carbon diox-ide released into the atmosphere, thegreater the impact on the world’s climate.The emissions of carbon dioxide (CO2), how-ever, are directly proportional to fuel con-sumption.
Carbon Monoxide (CO)
Carbon monoxide is a colorless, odorless,tasteless, and extremely toxic gas producedby the incomplete combustion of intakecomponents containing carbon. Whenreleased into the open, carbon monoxidequickly oxidizes to form carbon dioxide.
In very small concentrations, carbon monox-ide can cause respiratory problems andimpair visual perception, manual dexterityand learning function. In slightly greater con-centrations, it can be lethal.
Composition
4
SSP 9430/08
SSP 9430/06

5
Oxides of Nitrogen (NOx)
Oxides of nitrogen are compounds of nitro-gen (N2) and oxygen (O2) (e.g. NO, NO2,N2O, etc). Oxides of nitrogen are producedby high pressure, high temperature, and asurplus of oxygen in the engine during thecombustion cycle.
Several oxides of nitrogen are harmful tohealth. Action taken to reduce fuel con-sumption has, unfortunately, often led to arise in nitrogen oxide concentrations inexhaust emissions. This is because a moreefficient combustion process generates high-er temperatures.
Hydrocarbons (HC)
Hydrocarbons are unburned fuel compo-nents which occur in the exhaust emissionsafter incomplete combustion. Hydrocarbonsoccur in a variety of forms, including C6H6(benzene) and C8H18 (octane). Each has dif-ferent effects on humans; some irritate sen-sory organs, while others, such as benzene,are cancer causing.
Hydrocarbons mix with the oxides of nitro-gen in sunlight to form ozone, which dam-ages lung tissue, aggravates respiratory dis-ease, and increases susceptibility to respira-tory infections.
Composition
SSP 9430/07
SSP 9430/10
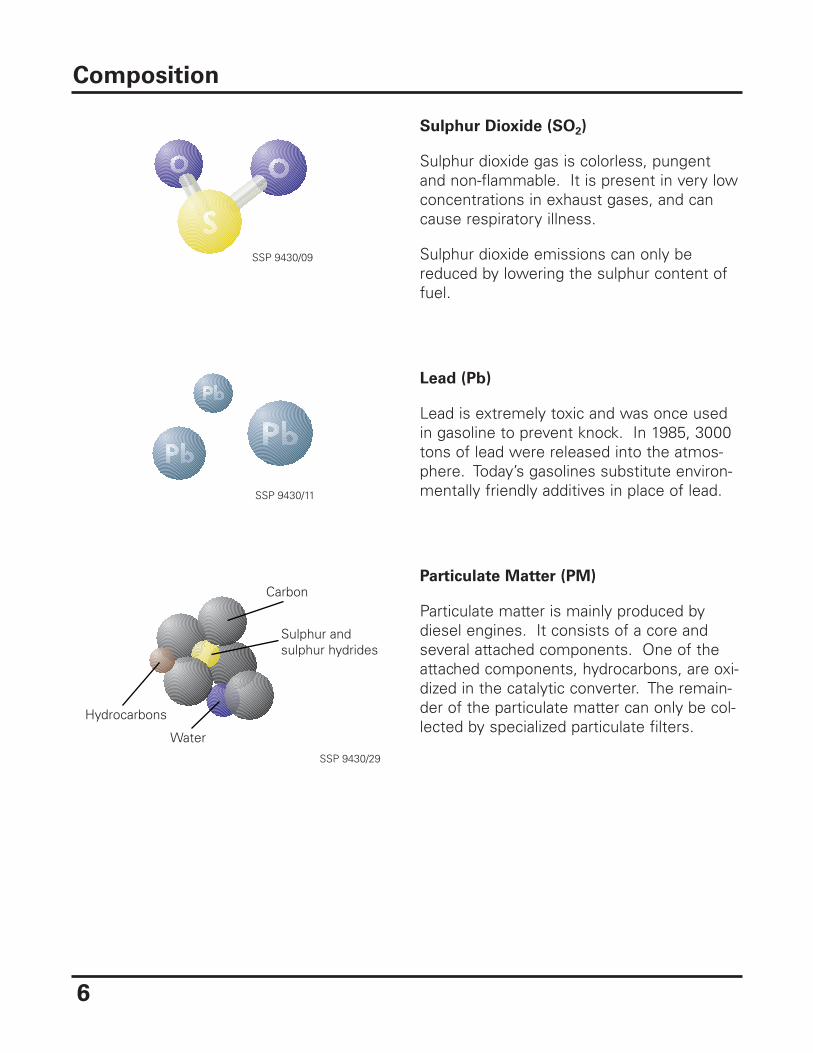
Sulphur Dioxide (SO2)
Sulphur dioxide gas is colorless, pungentand non-flammable. It is present in very lowconcentrations in exhaust gases, and cancause respiratory illness.
Sulphur dioxide emissions can only bereduced by lowering the sulphur content offuel.
Lead (Pb)
Lead is extremely toxic and was once usedin gasoline to prevent knock. In 1985, 3000tons of lead were released into the atmos-phere. Today’s gasolines substitute environ-mentally friendly additives in place of lead.
Particulate Matter (PM)
Particulate matter is mainly produced bydiesel engines. It consists of a core andseveral attached components. One of theattached components, hydrocarbons, are oxi-dized in the catalytic converter. The remain-der of the particulate matter can only be col-lected by specialized particulate filters.
Composition
6
SSP 9430/09
SSP 9430/11
SSP 9430/29
Carbon
Sulphur and sulphur hydrides
Water
Hydrocarbons

7
Operating Conditions and the Effect on
Exhaust Gas Composition
Operating conditions of the engine effect thecomposition of the exhaust gases produced.For example, a leaking injector will causehydrocarbon emissions to rise.
Harmful exhaust emissions, with the excep-tion of NOx, are at their lowest levels whenthe air to fuel mixture is 14.7 parts air to 1part fuel by weight. This is called the stoi-chiometric point, and is the same for allgasoline powered internal combustionengines.
Note: All the charts show readings beforethe catalytic converter.
Hydrocarbons
Hydrocarbon emissions tend to remain fairlyconstant unless the mixture is very rich orvery lean. HC tends to rise when the fuelmixture becomes so lean that the flamefront in the combustion chamber cannotignite all the fuel molecules. This is called alean misfire. High HC often indicates incom-pletely atomized fuel (leaking injector), or anignition problem.
HC levels after the catalytic converter will below, because the catalytic converter will con-vert most hydrocarbons to CO2 and H2O.
Composition
HC
(p
pm
)
0
500
1000
1500
2000
Hydrocarbon Levels Compared With Air/Fuel Ratio
10:1 12:1 14.7:1 16:1 Air/Fuel Ratio
Rich
HC
Lean
SSP 9430/48
CO
, C
O2, O
2 (
% v
ol)
NO
X, H
C (
PP
M)
0
500
1000
1500
2000
2
4
6
8
10
12
14
Exhaust Gas Levels Compared With Air/Fuel Ratio
10:1 12:1 14.7:1 16:1 Air/Fuel Ratio
Rich Lean
CO2
CONOX
HC
O2
SSP 9430/45
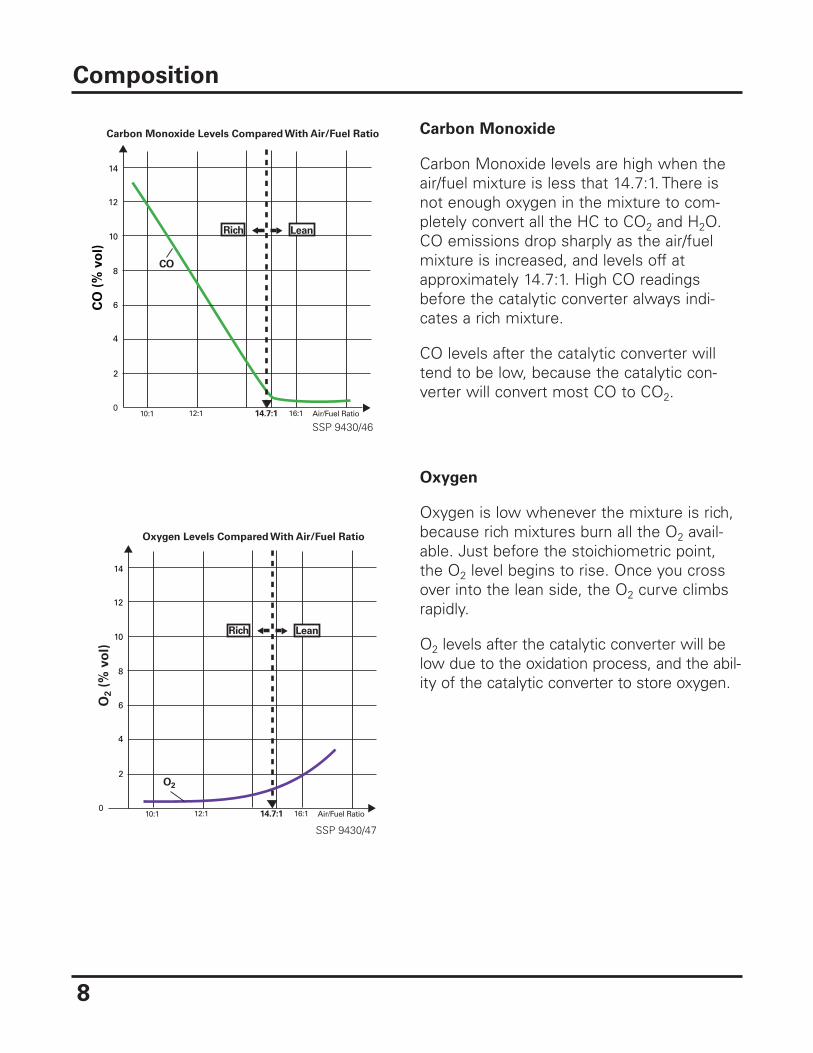
Carbon Monoxide
Carbon Monoxide levels are high when theair/fuel mixture is less that 14.7:1. There isnot enough oxygen in the mixture to com-pletely convert all the HC to CO2 and H2O.CO emissions drop sharply as the air/fuelmixture is increased, and levels off atapproximately 14.7:1. High CO readingsbefore the catalytic converter always indi-cates a rich mixture.
CO levels after the catalytic converter willtend to be low, because the catalytic con-verter will convert most CO to CO2.
Oxygen
Oxygen is low whenever the mixture is rich,because rich mixtures burn all the O2 avail-able. Just before the stoichiometric point,the O2 level begins to rise. Once you crossover into the lean side, the O2 curve climbsrapidly.
O2 levels after the catalytic converter will below due to the oxidation process, and the abil-ity of the catalytic converter to store oxygen.
Composition
8
CO
(%
vo
l)
0
2
4
6
8
10
12
14
Carbon Monoxide Levels Compared With Air/Fuel Ratio
10:1 12:1 14.7:1 16:1 Air/Fuel Ratio
Rich
CO
Lean
SSP 9430/46
O2 (
% v
ol)
0
2
4
6
8
10
12
14
Oxygen Levels Compared With Air/Fuel Ratio
10:1 12:1 14.7:1 16:1 Air/Fuel Ratio
Rich
O2
Lean
SSP 9430/47

9
Carbon Monoxide and Oxygen
Carbon monoxide and oxygen values equal-ize at 14.7:1, the stoichiometric point. If theexhaust gases are measured before the cat-alytic converter, the following will always betrue: If O2 is higher than CO it is a leanmixture, and if CO is higher than O2 it is arich mixture.
Carbon Dioxide
Carbon dioxide indicates combustion effi-ciency. The more efficient the burn, the high-er the CO2 readings; the less efficient, thelower the CO2.
Adding CO2 to the chart provides an efficien-cy indicator. As the mixture nears 14.7:1,CO2 rises to its highest levels.
Oxides of Nitrogen
Oxides of nitrogen levels are at their highestwhen the mixture is near 14.7:1. NOx pro-duction can be controlled both during pre-combustion and post-combustion.
The primary method of controlling NOx is bykeeping the combustion temperatures andpressures low. Low compression, variablevalve timing, and exhaust gas recirculation allhelp to reduce NOx.
Post-combustion NOx control is accom-plished by the 3-way catalytic converter.However, a catalytic converter cannot over-come the emissions from an engine that isproducing too much NOx.
Comparing the relationship between HC,CO, O2, CO2 and NOx in this way provides a"window" into both the air/fuel mixture andthe operating conditions within the engine.
Composition
CO
, C
O2 O
2 (
% v
ol)
0
2
4
6
8
10
12
14
Carbon Monoxide, Carbon Dioxide and Oxygen Levels
Compared With Air/Fuel Ratio
10:1 12:1 14.7:1 16:1 Air/Fuel Ratio
Rich
CO
O2
Lean
SSP 9430/49
CO2
NO
X (
pp
m)
0
500
1000
1500
2000
Oxides of Nitrogen Levels
Compared With Air/Fuel Ratio
10:1 12:1 14.7:1 16:1 Air/Fuel Ratio
Rich
NOX
Lean
SSP 9430/51
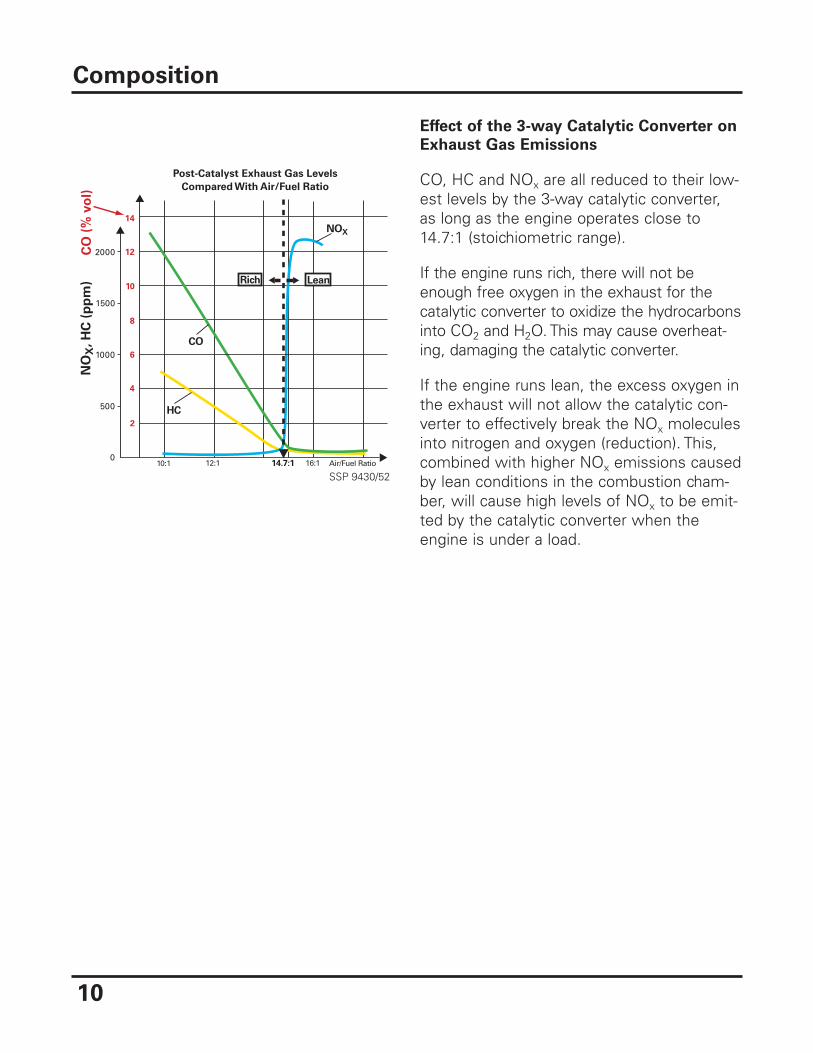
Effect of the 3-way Catalytic Converter on
Exhaust Gas Emissions
CO, HC and NOx are all reduced to their low-est levels by the 3-way catalytic converter,as long as the engine operates close to14.7:1 (stoichiometric range).
If the engine runs rich, there will not beenough free oxygen in the exhaust for thecatalytic converter to oxidize the hydrocarbonsinto CO2 and H2O. This may cause overheat-ing, damaging the catalytic converter.
If the engine runs lean, the excess oxygen inthe exhaust will not allow the catalytic con-verter to effectively break the NOx moleculesinto nitrogen and oxygen (reduction). This,combined with higher NOx emissions causedby lean conditions in the combustion cham-ber, will cause high levels of NOx to be emit-ted by the catalytic converter when theengine is under a load.
Composition
10
CO
(%
vo
l)N
OX
, H
C (
pp
m)
0
500
1000
1500
2000
2
4
6
8
10
12
14
Post-Catalyst Exhaust Gas Levels
Compared With Air/Fuel Ratio
10:1 12:1 14.7:1 16:1 Air/Fuel Ratio
Rich
CO
NOX
HC
Lean
SSP 9430/52
11
Methods of Reducing Emissions
Exhaust emissions standards adopted acrossEurope and the United States have prompt-ed the automotive industry to develop newmethods for reducing exhaust gas pollution.
Unfortunately, the development of individualautomotive technologies is not sufficient.The vehicle must instead be looked at as anintegral whole, matching all components toone another. Taking this holistic approach tovehicle development, four main exhaustemission control strategies can be defined:
• Reduction of fuel consumption
• Management of fuel vapor losses
• Treatment of exhaust gases beforethey are released into the atmosphere
• Emissions component performancemonitoring (On Board Diagnostics)
Reduction of Fuel Consumption
Many recent engineering advancementshave reduced fuel consumption, includingimproved aerodynamics, tires with lowerrolling resistance, the use of lightweightmaterials, transmission optimization, andmore accurate engine management.
It is important to consider that these engi-neering advancements are partially negatedby the increase in new vehicle registrationsand the current trend towards more power-ful and heavier vehicles.
Improved aerodynamics
The styling of the modern automobile muststrike a balance between space efficiency,aesthetics, and aerodynamics. By reducingdrag, less power (and therefore less fuel) isneeded to maintain a given speed.
Reduced rolling resistance
A portion of the power required to maintaina given speed is used to overcome therolling resistance caused by the flexing ofthe tire’s sidewall as the contact patchmeets the road surface.
Because this flexing converts the energyprovided by the engine into heat, fuel con-sumption can be reduced by specifying tireswith a higher silica content and lower rollingresistance. As a general rule, rolling resist-ance decreases with increasing tire pres-sure, and increases with vehicle weight.
Methods of Reducing Emissions

Reduction of vehicle mass
Each year, safety standards and standardequipment levels increase. This additionalequipment adds mass, and unfortunatelymuch of a vehicle’s fuel consumption is usedto accelerate a vehicle’s mass up to speed.As a general rule, about 1.15 gallons of fuelis saved over 1000 miles of driving for each100 lb. reduction in weight.
To offset the additional weight, Audi engi-neers have begun to utilize advanced materi-als with higher strength to weight ratios thanconventional steel. Both the Audi A8 andAudi A2, for example, have aluminum struc-tures and body panels, resulting in a weightsavings of approximately 43% over conven-tional steel.
Due to cost and manufacturing constraints,aluminum is rarely used in high percentages.The trunklid of the Audi TT, for example, isformed from aluminum, as are the fendersof the A6 4.2.
High-strength steel is more common due tothe material’s lower cost and ease of manu-facture when compared to aluminum. Ahigh strength steel panel is thinner than aconventional steel panel of the samestrength, which in turn reduces vehicleweight.
Methods of Reducing Emissions
12

13
Transmission optimization
Fuel efficiency is strongly influenced by thedesign of a vehicle’s transmission.Traditionally, there have been two types oftransmission: manual and automatic.Automatic transmissions are less efficientdue to the decoupling effect of the torqueconverter, and their fewer number of ratios.Having a greater number of ratios allows theengine to operate in its optimal RPM rangemore often, which results in better fueleconomy.
Two transmission concepts recently intro-duced in some markets combine the per-formance and efficiency of the manual trans-mission design with the ease of use of anautomatic transmission. The first of theseconcepts is the automated direct shift manu-al gearbox, essentially a conventional manualtransmission with electro-hydraulic clutchengagement and gear selection. In the sys-
tem’s driver-selectable “economy” drivingmode, the transmission’s control unit selectsthe most fuel efficient shift points based onthe driving situation. The system also allowsthe engine to shut down when the car is sta-tionary and the driver’s foot is on the brake,and can disengage the clutch when the vehi-cle is coasting, reducing drag force andincreasing fuel economy.
The second of these concepts is theContinuously Variable Transmission (CVT),which uses a chain drive mechanism toadjust reduction ratios continuously betweenthe starting torque and final torque multipli-cation ratios. As a result, the engine canalways operate in its optimum RPM rangefor performance or fuel economy, dependingon driving conditions. The CVT uses an elec-tro-hydraulically controlled wet plate clutchrather than a torque converter, furtherincreasing efficiency.
Methods of Reducing Emissions

More accurate engine management
Modern engine management systems useinput signals from sensors (e.g. enginespeed, throttle position, and mass air flow)to determine control values for the control-lable components (e.g. spark advance andfuel injection quantity). This control loopallows the ECU to adapt to changes inatmospheric conditions, fuel quality or theengine’s running condition.
The largest concentration of HC and CO isemitted just after a cold start, before theemissions equipment reaches operatingtemperature and while the ECU is still in“open loop” mode. Modern Audi vehiclesuse heated oxygen sensors and have theircatalytic converters placed close to theengine, allowing both components to reachoperating temperature (approx. 572°F/300°Cin the case of the catalytic converter) morequickly. The heated planar oxygen sensor,for example, is operational as few as 10 sec-onds after engine start-up.
Engine optimization
Recently introduced in some markets, theGasoline Direct Injection engine designincreases power and efficiency by injectingthe fuel directly into the combustion cham-ber under extremely high pressure. Thisdirect injection improves swirl, while thehigh fuel system pressure results in fineratomization of the fuel. As an added benefit,the Gasoline Direct Injection engine usesmixtures as lean as 19:1 under light loadconditions.
Methods of Reducing Emissions
14
SSP 9430/16
Engine Management Control Loopsignals from the sensors
signals to the actuators
Catalytic converter

15
Management of Fuel Vapor Losses
Evaporative Emissions (EVAP)
Fuel vapor escaping into the atmospherecontains more hydrocarbons than a vehicle’sexhaust emissions. When these unburnedhydrocarbons are exposed to sunlight, low-level ozone is created. Low-level ozone isthe primary cause of smog, and has beenlinked to respiratory disorders.
EVAP systems prevent gasoline vapors thatform above the surface of the fuel in the tankfrom being released into the atmosphere.When the vehicle is not in use, gasolinevapor is routed through the Breather Bottleand Roll-over valve to the EVAP Canister,where it is captured by activated charcoal.This vapor is reintroduced into the intakemanifold when the engine is restarted.
Methods of Reducing Emissions
Leak Detection Pump (LDP)
The Leak Detection Pump (LDP) was addedto the EVAP systems on 1999 model yearand later Audi vehicles to satisfy the OBD IIrequirement of an automatic leak-checkevery drive cycle.
On Board Refueling Vapor Recovery
(ORVR)
More hydrocarbons are released into theatmosphere during refueling than during theuse of one tank of gasoline. Some stateshave attempted to combat this by requiringgas stations to fit vapor recovery nozzlesthat capture gasoline vapor for storage in anunderground storage tank. All 1999 andlater model year Audi vehicles are equippedwith ORVR systems to meet FederalEmission standards.
For more information, refer to SSP 941903,EVAP Systems, Operation and Diagnosis.

Treatment of Exhaust Gases
Before being released into the atmosphere,exhaust gases pass through the catalyticconverter. The catalytic converter contains aceramic or metallic monolith coated with arough “wash coat” of platinum, rhodiumand/or palladium. The wash coat maximizesthe internal surface area exposed to exhaustflow, increasing efficiency. The metals with-in the wash coat act as a catalyst, facilitatingtwo chemical reactions: reduction and oxida-tion.
In reduction, oxides of nitrogen (NOx) are“reduced,” leaving oxygen (O2) and nitrogen(N2) — both harmless, naturally occurringgases.
In oxidation, oxygen (O2) oxidizes carbonmonoxide (CO) to form carbon dioxide, andoxidizes hydrocarbons (HC) to form carbondioxide (CO2) and water (H2O).
The reduction process is most efficient in alow O2 environment, while the oxidationprocess is most efficient in a high O2 envi-ronment.
Methods of Reducing Emissions
16
Reduction
Oxides of nitrogen (NOx) are reduced to formoxygen (O2) and nitrogen (N2)
SSP 9430/18
Carbon monoxide (CO) is oxidized to formcarbon dioxide (CO2)
Oxidation
Oxidation
Hydrocarbons (HC) are oxidized to formcarbon dioxide (CO2) and water (H2O)
SSP 9430/20
NOx HC
CO2CO2 H2ON2 +
COCatalyst coat
Wash-coat
Base material(substrate)
SSP 9430/43

17
Exhaust Gas Recirculation (EGR)
Some vehicles are equipped with EGR sys-tems, which inject a small amount ofexhaust gas into the intake manifold. Sincethere is very little combustibility left in theinjected gas, it simply occupies space. Thislowers combustion chamber temperature,which reduces oxide of nitrogen (NOx) emis-sions. The same effect can be accomplishedthrough the use of variable valve timing.
Performance Monitoring (On Board
Diagnostics)
The On Board Diagnostics system wasdesigned to reduce pollution emitted bymotor vehicles by monitoring the function ofemissions-related components. If a malfunc-tion is detected, a Diagnostic Trouble Code(DTC) is stored in DTC memory and the driv-er is alerted by the illumination of theMalfunction Indicator Lamp (MIL.)
The second-generation version, OBD II, wasintroduced in the 1996 model year. OBD IIretains the functions of OBD I, and adds thecapability to:
• determine plausibility of signals receivedfor emissions control components andrelated sensors
• monitor system functions (e.g.Secondary Air Injection system)
• monitor the entire drivetrain (e.gautomatic transmission emergencymode status)
• monitor catalytic converter efficiency
Methods of Reducing Emissions
Incoming exhaust gas
Inducedambient air
Fuel injector
SSP 9430/21
Exhaust Gas Recirculation

Federal Emissions Certification
Before a vehicle intended for use on publicroadways can be sold in the United States, itmust be “certified” by the EnvironmentalProtection Agency (EPA). In addition, manu-facturers are required to meet specifiedsales-weighted fleet emissions averages.
The certification procedure requires the useof a chassis dynamometer as well as special-ized equipment for exhaust gas collectionand analysis.
Certification and Testing
18
The test vehicle is secured with the drivewheels on the measuring rollers of thedynamometer and a collecting tube over theexhaust pipe. A specially trained technicianthen modulates the accelerator and brake to“drive” the prescribed cycle.
Tailpipe emissions are collected for analysisof hydrocarbons, carbon monoxide andoxides of nitrogen while the vehicle is oper-ated under varying engine loads.

19
FTP (Federal Test Procedure) 75 driving cycle
Vehicles certified for sale in the United States must pass the FTP75 emissions test. The totalFTP75 cycle is 1874 seconds long and represents a 11.04 mile route with a 21.2 mile per houraverage speed. It consists of three phases:
• the cold start phase
• the transient phase
• the hot start phase
The initial 505 seconds is referred to as the “cold start phase.” This phase of the FTP75 isespecially stringent because of the high speeds and sudden acceleration/deceleration soonafter startup, before the catalytic converter has reached operating temperature.
The second phase, known as the transient phase, simulates the speeds and stop and startdriving conditions experienced while driving in heavy traffic.
Once the cold start and transient phases are completed, the vehicle is shut down. Ten min-utes later, a hot start cycle is run, with a driving pattern similar to the cold start phase.Emissions are expressed in grams per mile (g/mi).
Certification and Testing
20
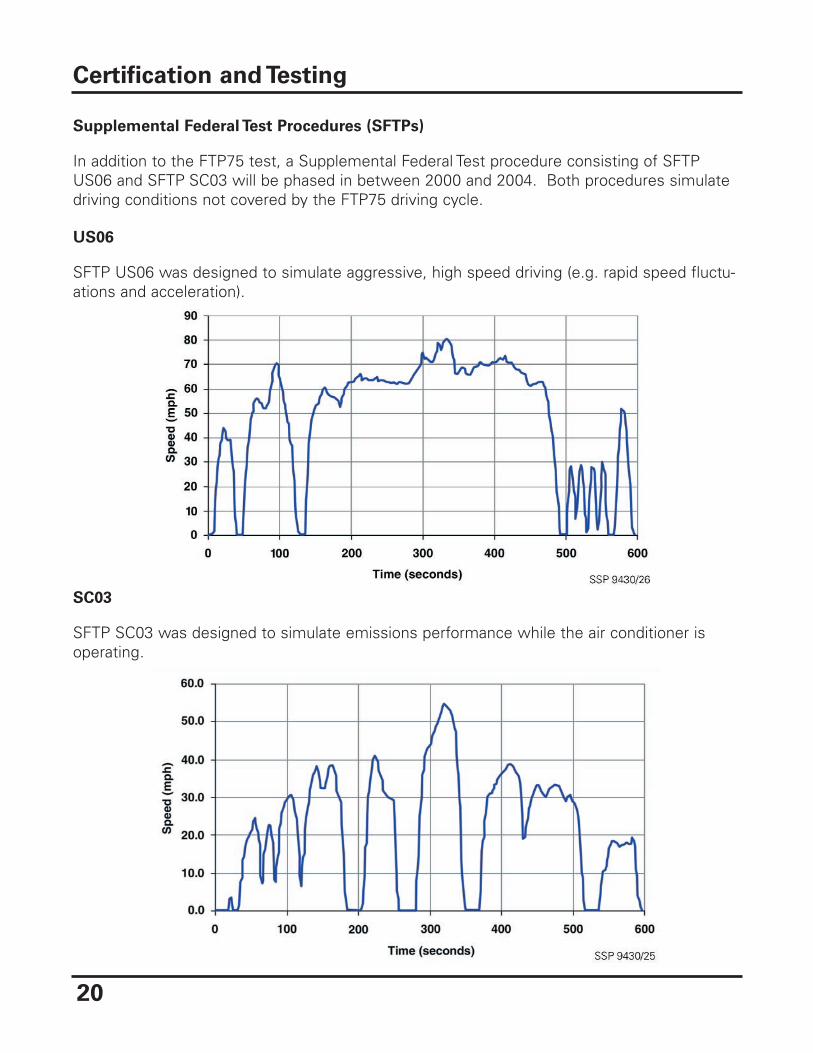
Supplemental Federal Test Procedures (SFTPs)
In addition to the FTP75 test, a Supplemental Federal Test procedure consisting of SFTPUS06 and SFTP SC03 will be phased in between 2000 and 2004. Both procedures simulatedriving conditions not covered by the FTP75 driving cycle.
US06
SFTP US06 was designed to simulate aggressive, high speed driving (e.g. rapid speed fluctu-ations and acceleration).
Certification and Testing
SC03
SFTP SC03 was designed to simulate emissions performance while the air conditioner isoperating.

21
Tier 1 and Tier 2 standards
The Tier 1 standard for light-duty vehicleswas defined by the Clean Air ActAmendments of 1990. Vehicles must meetthese standards over a 100,000 mile period,with an intermediate standard for the later50,000 miles.
Tier 1 standards were published in 1991, andphased-in progressively between 1994 and1997. The Tier 2 standards, adopted in 1999,are to be phased in beginning in 2004.
Unlike the Tier 1 standard, the Tier 2 stan-dard holds all vehicles to the same emis-sions limits, regardless of fuel type. Tier 2also requires fuel refiners and importers toprogressively reduce the levels of sulphur inboth gasoline and diesel fuels starting in2004. Temporary, less stringent standardswill apply to certain areas of the westernU.S. between 2004 and 2006.
National Low Emission Vehicle (NLEV)
program
NLEV is a voluntary agreement betweennortheastern states and automotive manu-facturers. Starting with the northeasternstates in model year 1999 and nationally inmodel year 2000, NLEV requires vehiclessold to meet more stringent emissions stan-dards than the Federal Government canmandate before Tier 2 is enacted in 2004.The average emission level must meet LEVor better emission standards.
Certification and Testing
Emission Standard Programs
Tier 1
National Low
Emissions
Vehicle Program
(NLEV)
California - Low
Emission Vehicle
Program (LEV I)
and LEV II
The least stringent Federal emissionstandards.An agreement between the Northeaststates and automotive manufacturers.Average emissions must meet LEV orbetter emission standards.
Due to its unique air quality problems,California has special authority underthe Clean Air Act to set its ownemission standards.
Tier 2 New Federal standards for cars andtrucks to replace the Federal Tier 1standards in place since 1994. Tier 2 tobe phased in from 2004 through 2009and is optional from 2001 to 2003.
SSP 9430/55
TLEV Transitional Low Emissions Vehicle
LEV Low Emissions Vehicle
ULEV Ultra Low Emissions Vehicle
SULEV Super Ultra Low Emissions Vehicle
ZEV Zero Emissions Vehicle
SSP 9430/57
California Air Resources Board
(CARB) Emissions Classifications
22
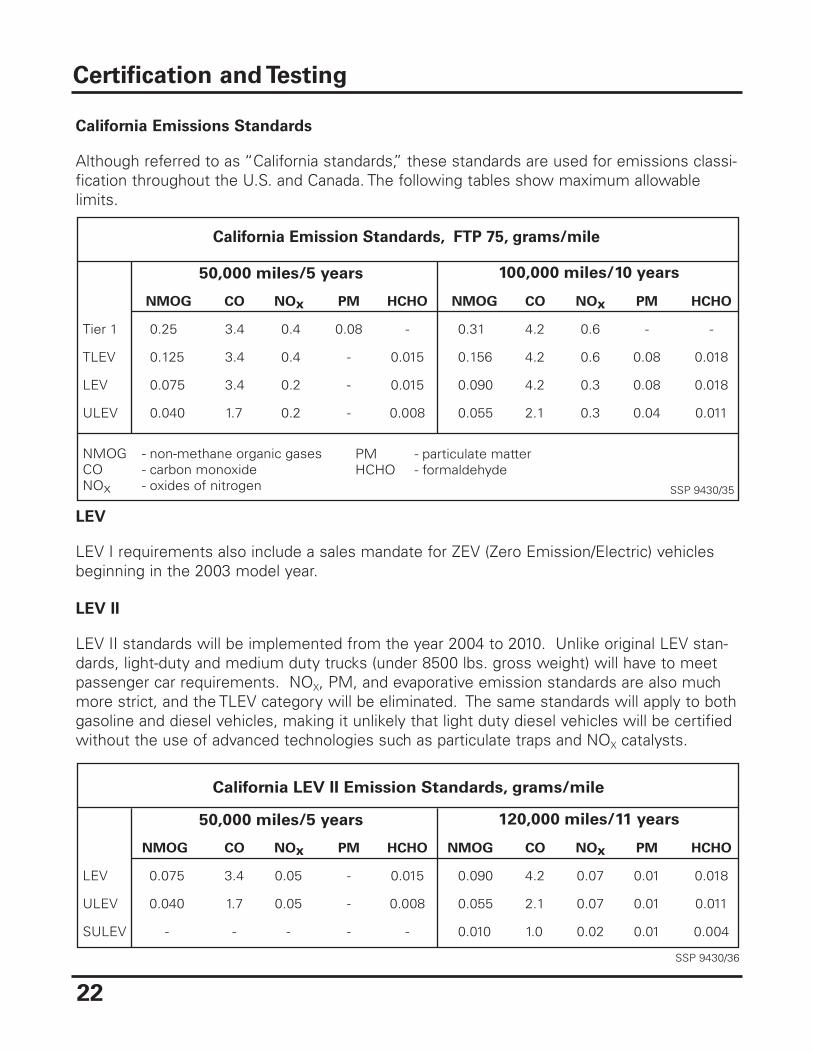
California Emissions Standards
Although referred to as “California standards,” these standards are used for emissions classi-fication throughout the U.S. and Canada. The following tables show maximum allowablelimits.
LEV
LEV I requirements also include a sales mandate for ZEV (Zero Emission/Electric) vehiclesbeginning in the 2003 model year.
LEV II
LEV II standards will be implemented from the year 2004 to 2010. Unlike original LEV stan-dards, light-duty and medium duty trucks (under 8500 lbs. gross weight) will have to meetpassenger car requirements. NOX, PM, and evaporative emission standards are also muchmore strict, and the TLEV category will be eliminated. The same standards will apply to bothgasoline and diesel vehicles, making it unlikely that light duty diesel vehicles will be certifiedwithout the use of advanced technologies such as particulate traps and NOX catalysts.
Certification and Testing
NMOG CO NOx PM HCHO NMOG CO NOx PM HCHO
Tier 1 0.25 3.4 0.4 0.08 - 0.31 4.2 0.6 - -
TLEV 0.125 3.4 0.4 - 0.015 0.156 4.2 0.6 0.08 0.018
LEV 0.075 3.4 0.2 - 0.015 0.090 4.2 0.3 0.08 0.018
ULEV 0.040 1.7 0.2 - 0.008 0.055 2.1 0.3 0.04 0.011
50,000 miles/5 years 100,000 miles/10 years
NMOG - non-methane organic gasesCO - carbon monoxideNOx - oxides of nitrogen SSP 9430/35
California Emission Standards, FTP 75, grams/mile
PM - particulate matterHCHO - formaldehyde
NMOG CO NOx PM HCHO NMOG CO NOx PM HCHO
LEV 0.075 3.4 0.05 - 0.015 0.090 4.2 0.07 0.01 0.018
ULEV 0.040 1.7 0.05 - 0.008 0.055 2.1 0.07 0.01 0.011
SULEV - - - - - 0.010 1.0 0.02 0.01 0.004
50,000 miles/5 years 120,000 miles/11 years
SSP 9430/36
California LEV II Emission Standards, grams/mile

23
Regional Differences
The EPA allows states to individually determine the emissions limits required before a vehiclecan be sold. As the following table demonstrates, California and certain Northeastern Stateshave chosen to adopt more stringent standards than much of the rest of the country.
Certification and Testing
m.y. 1999 m.y. 2000 m.y. 2001State
California
Vermont2
Various other states
CA LEV CA LEV CA LEV
CA LEVCA LEVFederal Tier 1
NLEVCA LEV
Federal Tier 1
NLEV
Federal Tier 1
NLEV
Federal Tier 11
NLEV
Footnotes:
SSP 9430/34
1. Tier 1 vehicles and TLEVs may be introduced only if also introduced in California.2. CA LEV requirements in Vermont become effective for model year 1999 engine
families that start production late in 1998.
Notes:Underlined text indicates the minimum requirement, plain text indicates availablealternatives.
Gra
ms
per
Mile
0
0.2
0.4
0.6
Tier 1 TLEV LEV ULEV SULEV
Hydrocarbons
SSP 9430/56
Cars and small trucks
Medium trucks
Large trucks
**
Gra
ms
per
Mile
0
1
2
Tier 1 TLEV LEV ULEV SULEV
Cars and small trucks
Medium trucks
Large trucks
Oxides of Nitrogen
*Trace amounts
The following graphs highlight the difference in emissions levels between the various emis-sions standards.

24
Emissions Inspection
In the past, emissions inspections for vehicles registered in the United States sampledtailpipe emissions with the test vehicle at idle. This method allowed vehicles that were grosspolluters on the road (i.e. while the engine is under load) to pass the emissions inspection.To reduce this risk, enhanced emission testing procedures have been implemented.
The Inspection/Maintenance (I/M) Flexibility Amendments, passed by the EPA in 1995, allowstates options on how to meet enhanced emission program requirements. Pollution and pop-ulation levels within the state are used to determine whether a state can use either a “high”or “low” enhanced emissions test. A Low Enhanced test allows the use of an idle test. AHigh Enhanced test, such as the IM240 driving cycle, requires the vehicle to be tested underload using a chassis dynamometer.
States are awarded emission reduction credit depending on the number of model years andvehicle weight classes included for tailpipe and evaporative emissions testing.
IM240 driving cycle
The IM240 driving cycle is a 240 second long test representing a 1.96 mile route with a 29.4mile per hour average speed and and a maximum speed of 56.7 miles per hour. The techni-cian must modulate the accelerator and brake to maintain the appropriate speed. If the vehi-cle speed falls outside the specified range, the test must be restarted.
Based on emissions sampling gathered during the test, a vehicle with very low emissionsmay receive a “fast pass” in as little as 31 seconds. Vehicles that fail but are within 200% ofthe pollution limit are allowed a second test. Vehicles that fail the test must be repaired. Awaiver may be granted if the cost of these repairs exceeds approximately $450 (may varyaccording to local regulations).
Certification and Testing
25
Summary
Additional vehicles are put into service eachday, adding to the automobile’s already con-siderable impact on the environment.Although Audi is extremely proactive in theirefforts to minimize motor vehicle pollution, itis ultimately the responsibility of the techni-cian to ensure that Audi vehicles continue tooperate at peak efficiency.
In states that have recently moved from"static" inspections to "driving cycle" typeinspections, an increasing number of vehi-cles are likely to fail and show up in servicedepartments for diagnosis.
In this Self Study Program, we have:
• Recognized the need for emissionscontrols
• Reviewed the composition of exhaust gases
• Identified methods for reducingharmful pollutants
• Outlined current emissions testingprocedures
Armed with this knowledge, the technicianis able to diagnose emissions-related prob-lems quickly and efficiently, reducing theimpact of the automobile on our environ-ment.
Certification and Testing

Notes
26

27
5. Which of the following contributes
to oxides of nitrogen production?
a) high pressure
b) high temperature
c) a surplus of O2 during combustion
d) all of the above
6. At what air to fuel ratio are harmful
exhaust emissions (with the
exception of NOx) at their lowest
levels?
a) 10:1
b) 12:1
c) 14.7:1
d) 16:1
7. HC levels after the catalytic converter
will usually remain ___________,
because the catalytic converter
oxidizes hydrocarbons to CO2 and
H2O.
a) same
b) high
c) low
d) none of the above
8. A high CO2 reading indicates which of
the following?
a) a rich mixture
b) a lean mixture
c) an inoperative EGR valve
d) combustion efficiency
1. To which of the following is carbon
dioxide (CO2) emissions directly
proportional?
a) fuel octane
b) engine operating temperature
c) fuel consumption
d) fuel sulphur content
2. Which of the following measures
reduces sulphur emissions?
a) the use of oxygenated fuels
b) reduced sulphur in fuels
c) the use of particulate filters
d) primary catalysts
3. Under what operating conditions
does the catalytic converter perform
the reduction process most efficiently?
a) high O2
b) low O2
c) high CO2
d) low CO2
4. Under what operating conditions
does the catalytic converter perform
the oxidation process most efficiently?
a) high O2
b) low O2
c) high CO2
d) low CO2
Teletest

28
9. High O2 levels in the exhaust before
the catalytic converter indicate:
a) a rich mixture
b) a lean mixture
c) high fuel pressure
d) none of the above
10. High CO levels in the exhaust before
the catalytic converter indicate:
a) a rich mixture
b) a lean mixture
c) an inoperative Secondary Air Injection system
d) none of the above
11. Which of the following is produced
when unburned hydrocarbons are
exposed to sunlight?
a) carbon monoxide
b) water
c) low level ozone
d) particulate matter
12. Water is present in the combustion
chamber during combustion:
a) due to atmospheric humidity
b) due to low quality fuels
c) as a normal by-product ofcombustion
d) all of the above
Teletest
13. The heated planar oxygen sensor can
become operational in as little as:
a) 10 seconds
b) 15 seconds
c) 30 seconds
d) 60 seconds
14. Which of the following emissions do
EGR systems reduce?
a) hydrocarbons
b) fuel vapor emissions
c) oxides of nitrogen
d) carbon monoxide
15. What percentage of smog in major
cities is caused by passenger
vehicles?
a) less than 15%
b) less than 18%
c) less than 24%
d) less than 35%
16. Which of the following is NOT a
category used in California emissions
standards?
a) Transitional Low EmissionVehicle (TLEV)
b) Super Ultra Low Emission Vehicle(SULEV)
c) Marginal Emission Vehicle (MEV)
d) Zero Emission Vehicle (ZEV)

29
17. Which of the following emissions
tests requires the use of a
dynamometer?
a) IM240
b) FTP75
c) SFTP US06
d) all of the above
18. By 2004, which of the following tests
must a vehicle pass before it can be
sold in the United States?
a) FTP75
b) SFTP SCO3
c) SFTP US06
d) all of the above
Teletest
19. Which of the following systems or
components reduce emissions during
refueling?
a) LDP
b) EGR
c) ORVR
d) all of the above
20. What is the purpose of moving the
catalytic converter and oxygen sensor
closer to the exhaust manifold?
a) to reduce particulate matteremissions
b) to improve swirl in the combustion chamber
c) to shorten the warm-up phase and clean exhaust gases more quickly
d) to inject a small amount of exhaust gas into the intake manifold

Notes
30
31
Teletest


Audi of America, Inc.3800 Hamlin RoadAuburn Hills, MI 48326Printed in U.S.A.March 2001