motor vehicle theft from the cars database · motor vehicle theft in south australia, 1998 a...
TRANSCRIPT


MOTOR VEHICLE THEFT
IN SOUTH AUSTRALIA, 1998
A S T AT I S T I C AL R E P O R T
FROM THE CARS DATABASE
BY
KRISTIN ZEMAN
and
PAUL THOMAS
OFFICE OF CRIME STATISTICS
SEPTEMBER 1999

2 MOTOR VEHICLE THEFT IN SOUTH AUSTRALIA, 1998
First published September 1999 by:
Office of Crime StatisticsSouth Australian Attorney-General’s DepartmentGPO Box 464Adelaide, South Australia 5001
ISSN 1328-830X
Printed by Graphic Print Group
Copyright 1999 South Australian Attorney-General’s DepartmentAll rights reserved.

CONTENTS
CONTENTS 3
ACKNOWLEDGMENTS 9
SPONSORS 10
1. INTRODUCTION 11 2. SOUTH AUSTRALIAN & INTERSTATE TRENDS 17Table 2.1 South Australian motor vehicle theft and recovery statistics, 1971 - 1998. 20Table 2.2 Rate of motor vehicle theft per 100,000 population and per 100,000 registrations,
1971 - 1998. 21Table 2.3 Rate per 100,000 population of selected property offences in South Australia,
1971 - 1998. 22Table 2.4 Relative change of selected property offences per 100,000 population indexed
to 1971/72. 22Table 2.5 Number of thefts reported to police by State, 1993 - 1998. 24Table 2.6 Rate of motor vehicle theft per 100,000 population by State, 1993 - 1998. 24Table 2.7 Community Crime & Safety Surveys - household victimisation rates by State,
1995 - 1998. 25Table 2.8 Community Crime & Safety Surveys - multiple victimisation rates by State, 1995 - 1998. 25Table 2.9 Community Crime & Safety Surveys - rate of reporting of last incident to police by
State, 1995 - 1998. 25
Figure 2.1 South Australian motor vehicle theft and recovery statistics, 1971 - 1998. 20Figure 2.2 Rate of motor vehicle theft per 100,000 population and 100,000 registrations,
1971 - 1998. 21Figure 2.3 Relative change of selected property offences per 100,000 population indexed
to 1971/72. 23Figure 2.4 Rate of motor vehicle theft per 100,000 population by State, 1993 - 1998. 24 3. TEMPORAL CHARACTERISTICS 27Table 3.1 Thefts and recoveries of vehicles by month reported stolen and recovered, 1998. 30Table 3.2 Thefts by month stolen, 1998. 30Table 3.3 Thefts and recoveries by day of week, 1998. 31Table 3.4 Percentage of vehicles recovered by day of theft, 1998. 31Table 3.5 Thefts and recoveries by time of day, 1998. 32Table 3.6 Percentage of vehicles recovered by time of theft, 1998. 33Table 3.7 Thefts and recoveries by day of week and time of day, 1998. 34Table 3.8 Percentage of vehicles recovered by day of week and time of theft, 1998. 35Table 3.9 Time elapsed between theft and reporting to police, 1998. 36Table 3.10 Cumulative percentage of vehicles recovered by days elapsed since theft, 1998. 36Table 3.11 Number of multiple thefts of the same vehicle during 1998. 37Table 3.12 Multiple victimisation - time interval between recovery and subsequent theft, 1998. 38
Figure 3.1 Thefts and recoveries by month, 1998. 30Figure 3.2 Thefts and recoveries by day of week, 1998. 31Figure 3.3 Thefts and recoveries by time of day, 1998. 32Figure 3.4 Percentage of thefts recovered as at 31 December 1998 by time of theft. 33

4 MOTOR VEHICLE THEFT IN SOUTH AUSTRALIA, 1998
Figure 3.5 Percentage of thefts recovered as at 31 December 1998 by time and day of week of theft. 35
Figure 3.6 Cumulative percentage of vehicles recovered by days elapsed since theft, 1998. 37Figure 3.7 Multiple victimisation - time interval between recovery and subsequent theft, 1998. 38
4. SPATIAL CHARACTERISTICS 39Table 4.1 Thefts and recoveries of vehicles by location type, 1998. 42Table 4.2 Percentage of vehicles reported stolen and recovered during 1998 by location
type. 43Table 4.3 Location of thefts and recoveries by metropolitan Statistical Local Areas, 1998. 44Table 4.4 Location of thefts and recoveries by country Statistical Local Areas, 1998. 45Table 4.5 Percentage of vehicles recovered by metropolitan Statistical Local Areas of
theft, 1998. 47Table 4.6 Percentage of vehicles recovered by country Statistical Local Areas of theft, 1998. 48Table 4.7 Distance between collector district stolen and collector district recovered. 50Table 4.8 Location of theft by Statistical Local Area (SLA) of owner, 1998. 52Table 4.9 Location of recovery by Statistical Local Area (SLA) of theft, 1998. 52Table 4.10 Location of thefts and recoveries by postcode, 1998. 53Table 4.11 Location of thefts and recoveries by metropolitan suburb, 1998. 61Table 4.12 Location of thefts and recoveries by country region, 1998. 69
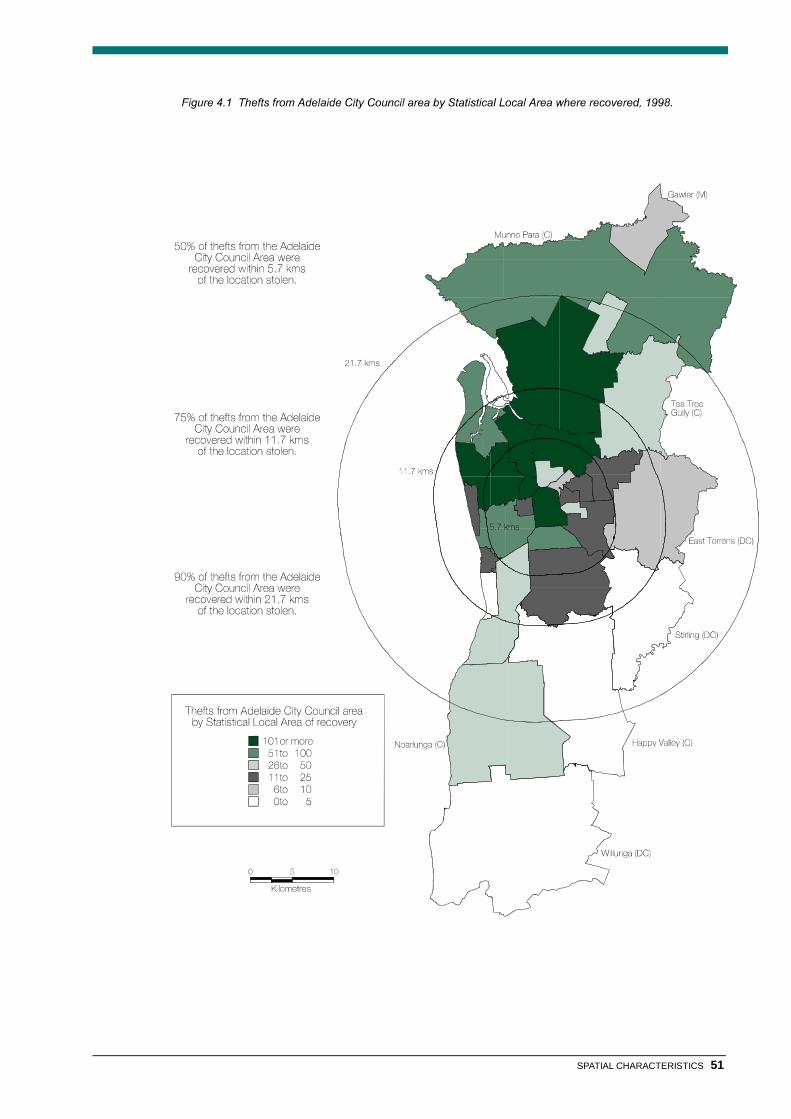
Figure 4.1 Thefts from Adelaide City Council area by the statistical local area where recovered, 1998. 51
Figure 4.2 Location of theft by Statistical Local Area (SLA) of owner, 1998. 52Figure 4.3 Location of recovery by Statistical Local Area (SLA) of theft, 1998. 52Figure 4.4 Location of thefts within the Adelaide metropolitan area by postcode, 1998. 59Figure 4.5 Location of recoveries within the Adelaide metropolitan area by postcode, 1998. 60
5. VEHICLE CHARACTERISTICS 75Table 5.1 Thefts and recoveries by type of vehicle, 1998. 78Table 5.2 Thefts and recoveries of vehicles by manufacturer, 1998. 80Table 5.3 Thefts and recoveries of vehicles by manufacturer and vehicle type, 1998. 82Table 5.4 Multiple victimisation by manufacturer, 1998. 83Table 5.5 Thefts and recoveries by year of manufacture, 1998. 84Table 5.6 Thefts and recoveries by year of manufacture and vehicle type, 1998. 86Table 5.7 Multiple victimisation by year of manufacture, 1998. 87Table 5.8 Rate of theft by year of manufacture for selected makes, 1998. 87Table 5.9 Number of vehicles stolen and subsequently recovered during 1998 by make,
model and year of manufacture. 91Table 5.10 Thefts and recoveries by colour of vehicle, 1998. 101Table 5.11 Thefts and recoveries by type of number plate, 1998. 101Table 5.12 Motorcycle thefts and recoveries by engine size, 1998. 103Table 5.13 Thefts and recoveries by fuel type, 1998. 103Table 5.14 Thefts and recoveries by type of transmission, 1998. 103Table 5.15 Thefts and recoveries by number of cylinders, 1998. 103Table 5.16 Condition of recovered vehicles, 1998. 104Table 5.17 Number of vehicles recovered with damage by year of manufacture, 1998. 105Table 5.18 Number of vehicles recovered with damage by manufacturer, 1998. 107Table 5.19 Parts missing from recovered vehicles, 1998. 108Table 5.20 Means of entry, 1998. 109Table 5.21 Reason for theft, 1998. 109Table 5.22 Thefts and recoveries by presence of anti-theft device, 1998. 109

CONTENTS 5
Table 5.23 Thefts and recoveries by financial encumbrance, 1998. 110Table 5.24 Thefts and recoveries by estimated value of the vehicle, 1998. 110
Figure 5.1 Rate of theft by type of vehicle, 1998. 79Figure 5.2 Rate of theft per 10,000 registered vehicles by manufacturer, 1998. 81Figure 5.3 Rate of theft by year of manufacture, 1998. 85Figure 5.4 Rate of theft by year of manufacture for selected makes, 1998. 88Figure 5.5 Rate of theft by colour of vehicle, 1998. 102Figure 5.6 Condition of recovered vehicles, 1998. 104Figure 5.7 Percentage of recovered vehicles damaged by type of damage, 1998. 104Figure 5.8 Percentage of vehicles recovered with damage by year of manufacture, 1998. 106Figure 5.9 Parts missing from recovered vehicles, 1998. 108Figure 5.10 Percentage of thefts by estimated value of the vehicle, 1998. 111Figure 5.11 Percentage of recoveries by estimated value of the vehicle at the time of
the theft, 1998. 111 6. INSURANCE ANALYSES 113Table 6.1 Percentage of victims covered by insurance, 1998. 116Table 6.2 Overview of insurance costs, 1998. 116Table 6.3 Costs incurred to insurer by condition of recovered vehicle, 1998. 116Table 6.4 Salvage revenue and costs by type of salvage, 1998. 118Table 6.5 Costs incurred to insurer by type of cover, 1998. 118Table 6.6 Costs incurred to insurer by type of policy, 1998. 118Table 6.7 Costs incurred to insurer by purpose of vehicle’s use prior to theft, 1998. 118Table 6.8 Recovery and insurer’s outgoing costs by year of manufacture, 1998. 119Table 6.9 Insurer’s outgoing costs for selected manufacturers, 1998. 119Table 6.10 Payments to policyholders and insurer’s outgoing costs for Holden
Commodores, 1998. 121Table 6.11 Payments to policyholders and insurer’s outgoing costs for Ford Falcons, 1998. 121Table 6.12 Number of claims by year of manufacture and suspicion of fraud, 1998. 122Table 6.13 Number of days between theft and expiry of insurance policy by suspicion
of fraud, 1998. 123Table 6.14 Direct payments to policyholders and insurer’s costs, by suspicion of fraud
and recovery of vehilce, 1998. 123
Table 6.15 Age and sex of last person to drive the vehicle, 1998. 124
Figure 6.1 Percentage of claims by condition of vehicle, 1998. 117Figure 6.2 Average cost of insurance claims by condition of vehicle, 1998. 117Figure 6.3 Percentage of claims by year of manufacture of the stolen vehicle, 1998. 120Figure 6.4 Average cost per claim by year of manufacture of the stolen vehicle, 1998. 120Figure 6.5 Average cost per claim by recovery and suspicion of fraud, 1998. 124 7. OFFENDER PROFILES 125Table 7.1 Number of apprehensions, unique individuals and counts relating to larceny
or illegal use of a motor vehicle during 1998. 128Table 7.2 Age and sex of alleged offenders apprehended during 1998 (based on
apprehensions). 128Table 7.3 Age and sex of alleged offenders apprehended during 1998 (based on
unique individuals). 128Table 7.4 Total number of counts of larceny or illegal use of a motor vehicle per individual by
gender, 1998. 129

6 MOTOR VEHICLE THEFT IN SOUTH AUSTRALIA, 1998
Table 7.5 Number of apprehensions for larceny or illegal use of a motor vehicle per individualby gender, 1998. 129
Table 7.6 Number of counts of larceny or illegal use of a motor vehicle per apprehension by gender, 1998. 129
Table 7.7 Alleged offenders by country of birth, ethnic appearance and sex, 1998. 130Table 7.8 Age by ethnic appearance of alleged offenders, 1998 (based on unique individuals). 130Table 7.9 Age by ethnic appearance of alleged offenders, 1998 (based on apprehensions). 131Table 7.10 Number of counts of larceny or illegal use of a motor vehicle per individual by ethnic
appearance, 1998 131Table 7.11 Number of apprehensions for larceny or illegal use of a motor vehicle per individual
by ethnic appearance, 1998. 131Table 7.12 Number of counts of larceny or illegal use of a motor vehicle per apprehension by
ethnic appearance, 1998. 132Table 7.13 Marital status of alleged offenders, 1998. 132Table 7.14 Employment status of alleged offenders, 1998. 132Table 7.15 Number of prior convictions for any offence, at the time of apprehension by sex, 1998. 133Table 7.16 Prior convictions for any offence by age at time of apprehension, 1998 (Numbers). 133Table 7.17 Prior convictions for any offence by age at time of apprehension, 1998
(Percentages of each age group). 133Table 7.18 Prior detention or imprisonment for any offence by age at time of apprehension, 1998. 134Table 7.19 Time since last conviction for any offence and current apprehension for larceny/illegal 1
use of a motor vehicle by age at time of apprehension, 1998. 134Table 7.20 Number of prior convictions for larceny/illegal use of a motor vehicle at the time of
apprehension by sex, 1998. 135Table 7.21 Prior convictions for larceny/illegal use of a motor vehicle by age at time of
apprehension, 1998 (Numbers). 135Table 7.22 Prior convictions for larceny/illegal use of a motor vehicle by age at time of
apprehension, 1998 (Percentage). 135Table 7.23 Prior detention or imprisonment for larceny/illegal use of a motor vehicle by age, 1998. 136Table 7.24 Time since last conviction for larceny/illegal use of a motor vehicle and current
apprehension for larceny/illegal use of a motor vehicle by age at time of apprehension, 1998. 136
8. RESPONSES BY THE CRIMINAL JUSTICE SYSTEM 137Table 8.1 Juvenile Offenders - Actions by Police: number of actions by major offence
charged, 1998. 140Table 8.2 Juvenile Offenders - Actions by Police: age and sex of offender by major
offence alleged, 1998. 140Table 8.3 Juvenile Offenders - Actions by police: race and major offence alleged, 1998. 140Table 8.4 Juvenile Offenders - Actions by Police: sex and type of action by major
offence alleged, 1998. 141Table 8.5 Juvenile Offenders - Actions by Police: age and sex of offender by type of
action, 1998. 141Table 8.6 Juvenile Offenders - Actions by Police: race and type of action by major
offence alleged, 1998. 142Table 8.7 Juvenile Offenders - Youth Court: cases finalised by major offence charged, 1998. 142Table 8.8 Juvenile Offenders - Youth Court: court outcome for the major offence charged, 1998. 142Table 8.9 Juvenile Offenders - Youth Court: appearances where major offence proved by
major penalty imposed for that charge, 1998. 143
Table 8.10 Juvenile Offenders - Youth Court: age and sex of defendant by major offence charged, 1998. 143
Table 8.11 Juvenile Offenders - Youth Court: age and sex by race of defendant, 1998. 144

CONTENTS 7
Table 8.12 Juvenile Offenders - Family Conferences by major offence alleged, 1998. 144Table 8.13 Juvenile Offenders - Family Conferences: age and sex of defendant by
major offence alleged, 1998. 145Table 8.14 Juvenile Offenders - Family Conferences: age and sex by race of defendant, 1998. 145Table 8.15 Juvenile Offenders - Family Conferences: most serious outcome for the
major offence charged, 1998. 146Table 8.16 Juvenile Offenders - Juvenile Cautions: number of formal cautions that resulted in
sanctions, 1998. 146Table 8.17 Juvenile Offenders - Juvenile Cautions: sanctions for major offence admitted, 1998. 146Table 8.18 Magistrates Court - Outcomes of cases involving larceny/illegal use of a motor
vehicle as the major charge, 1998. 146Table 8.19 Magistrates Court - major penalty for cases where the major charge convicted was
larceny/illegal use of a motor vehicle, 1998. 147Table 8.20 District & Supreme Courts - outcomes of cases involving larceny/illegal use of a
motor vehicle as the major charge, 1998. 147Table 8.21 District & Supreme Courts - major penalty for cases where the major charge
convicted was larceny/illegal use of a motor vehicle, 1998. 147
APPENDIX A: STATISTICAL LOCAL AREA PROFILES 149Table A.1 SLA Profile - Adelaide (C) 150Table A.2 SLA Profile - Brighton (C) 152Table A.3 SLA Profile - Burnside (C) 154Table A.4 SLA Profile - Campbelltown (C) 156Table A.5 SLA Profile - East Torrens (DC) 158Table A.6 SLA Profile - Elizabeth (C) 160Table A.7 SLA Profile - Enfield (C) 162Table A.8 SLA Profile - Gawler (M) 164Table A.9 SLA Profile - Glenelg (C) 166Table A.10 SLA Profile - Happy Valley (C) 168Table A.11 SLA Profile - Henley & Grange (C) 170Table A.12 SLA Profile - Hindmarsh & Woodville (C) 172Table A.13 SLA Profile - Kensington & Norwood (C) 174Table A.14 SLA Profile - Marion (C) 176Table A.15 SLA Profile - Mitcham (C) 178Table A.16 SLA Profile - Munno Para (C) 180Table A.17 SLA Profile - Noarlunga (C) 182Table A.18 SLA Profile - Payneham (C) 184Table A.19 SLA Profile - Port Adelaide (C) 186Table A.20 SLA Profile - Prospect (C) 188Table A.21 SLA Profile - Salisbury (C) 190Table A.22 SLA Profile - St Peters (M) 192Table A.23 SLA Profile - Stirling (DC) 194Table A.24 SLA Profile - Tea Tree Gully (C) 196Table A.25 SLA Profile - Thebarton (M) 198Table A.26 SLA Profile - Unley (C) 200Table A.27 SLA Profile - Walkerville (M) 202Table A.28 SLA Profile - West Torrens (C) 204Table A.29 SLA Profile - Willunga (DC) 206
APPENDIX B: EXPLANATORY NOTES & DEFINITIONS 209

8 MOTOR VEHICLE THEFT IN SOUTH AUSTRALIA, 1998

ACKNOWLEDGMENTS
INTRODUCTION 9
The production of this report would not have been possible without thesupport and encouragement provided by a wide range of individuals andorganisations throughout the entire life of the Project. The authors wishto thank all who have directly or indirectly contributed to either the workof the Project or the production of this report.
Firstly, we would like to express our sincere thanks to those whoprovided essential financial support and access to data. In particular,the Royal Automobile Association of South Australia, each of theinsurance companies and Transport SA assisted the Project to continueeach year with their generous contributions.
Furthermore, our thanks must also be expressed for the assistanceprovided to the Project by Mr. Chris Newland and the Insurance Councilof Australia, Mr. Theo Sarantaugas and Mr. Ty Cheng (StatisticalServices, SA Police) and the Registration and Licensing staff fromTransportSA.
Within the Office of Crime Statistics we greatly acknowledge the effortsof Lynne Sampson, Adrian Barnett, Carol Castle and Justine Dohertyfor the production of the tables in chapters 7 (Offender Profiles) and 8(Responses by the Criminal Justice System).
Finally we convey our thanks to the Attorney-General, The Hon. TrevorGriffin and Joy Wundersitz, Director, Office of Crime Statistics whohave both been enthusiastic supporters of the project and facilitated itsongoing development.
Kristin ZemanPaul Thomas

SPONSORS
INTRODUCTION 10
The following organisations provided generous support and cooperationwith the CARS project
Accident Insurance Mutual Holdings Ltd.AMP General Insurance Ltd.ANSVAR Australia Insurance Ltd.Attorney-General’s DepartmentAustralian Alliance Insurance Co. Ltd.Australian Associated Motor Insurers Ltd.Catholic Church Insurance Co.CIC Insurance Ltd.Colonial Mutual General Insurance Co. Ltd.CGU Insurance Ltd.FAI Insurance GroupGuild Insurance Co. Pty. Ltd.Heath, C.E. Underwriting and InsuranceHIH Insurance GroupInsurance Council of Australia Ltd.Insurance Exchange of Australia Group Pty. Ltd.Lumley General Insurance Ltd.Mercantile Mutual Insurance Ltd.MLC Insurance Ltd.MMI General Insurance Ltd.Mutual Community General Insurance Pty. Ltd.National Transport Insurance Ltd.OAMPS International Insurances Ltd.Provincial Insurance (Aust.) Ltd.QBE Insurance Ltd.RAA - GIO Insurance Ltd.Royal Automobile Association of SA Inc.Sirius Insurance Company Ltd.South Australian Police DepartmentState Government Insurance CommissionSun Alliance & Royal Insurance Australia Ltd.Swann Insurance Ltd.TransportSA (Registration and Licensing Section)VACC Insurance Co. Ltd.Western QBE Pty. Ltd.Wesfarmers Federation Insurance Ltd.World Marine & General Insurance Ltd.Zurich Australia Insurance Ltd.

11
I N T R O D U C T I O N
12 MOTOR VEHICLE THEFT IN SOUTH AUSTRALIA, 1998

INTRODUCTION
INTRODUCTION 13
or the first time in several years South Australia has experienced asignificant increase in the number of vehicles stolen during 1998, withrecorded thefts increasing 37.2% to 10,487. This is the largest singleyear increase in motor vehicle theft for thirteen years and follows aseven year period that saw thefts reduce from 15,303 in 1990/91 to7,645 in 1997. The current level of vehicle theft is still 31.5% lower thanthe peak of 15,303 in 1990/91 and equivalent to rates South Australiawas experiencing during the mid 1980s.
Based on an average insurance payout of $4,757 per claim and anaverage policy excess of $268 a conservative estimate of the impact ofmotor vehicle theft on South Australia during 1998 is $53 million. Inaddition there are the costs associated with the criminal and justicesystems, the possibility of lost productivity (if the vehicle was acommercial vehicle or contain work related tools), and the impact ofreduced mobility on one’s daily life. Nationally the direct impact ofvehicle theft is in the order of $700 million and this figure is likely tosurpass $1 billion if all the indirect costs are included.
While the number of recorded thefts increased in South Australia during1998 recovery rates have also risen two percentage points to 89.9%,indicating almost nine out of every ten stolen vehicles are eventuallylocated. Assuming recovery rates are a crude indicator of the level ofjoyriding as opposed to professional theft, then comparison with the1997 figures suggests that the number of thefts relating to joyriding hasincreased by 41% while professional thefts may have increased 11%during the past 12 months.
Nationally, vehicle theft increased 1.1% during 1998 although thisincrease was far from consistent across the jurisdictions. For example,substantial increases were recorded in the ACT (up 54.9%), Tasmania(up 21.8%) and Western Australia (up 8.7%), while reductions wererecorded in Queensland (down 8.0%), Northern Territory (down 4.1%),New South Wales (down 3.4%) and Victoria (down 2.9%). A total of131,752 motor vehicles were recorded stolen throughout Australiaduring 1998 and while there are no national statistics on recovery ratesit is estimated that 15% (or 20,000) of these vehicles will never berecovered, either being stripped for parts, re-birthed and sold tounsuspecting buyers, or dumped in remote locations.
Other key findings contained in this report include:• Overall motor vehicles were reported stolen at a rate of 95 per
10,000 registrations, although for passenger sedans and motorcycles this rate increases to 118 per 10,000 registrations.
• Recovery rates for motor cycles continue to remain low with only43% recovered compared to 89.9% for all vehicles.
• Police apprehensions increased by over a fifth (20.1%) to 1,386involving 1,123 individuals.
• Juveniles (10-17 years old) accounted for 44% of allapprehensions, up from 38.3% in 1996.
F

14 MOTOR VEHICLE THEFT IN SOUTH AUSTRALIA, 1998
• Amongst alleged female offenders the average age was 19 yearsalthough 56.4% were aged 10-17 years. The average age of malesapprehended during 1998 was 21.2 years.
• The average offender apprehended during 1998 was 20.7 yearsold, male and at the time of apprehension had 12 prior convictionsfor any offence and 1 prior conviction for motor vehicle theft.
• Nearly three quarters (73.9%) of alleged offenders had no priorconviction for motor vehicle theft at the time of their apprehension.
• 54% of adults charged with larceny or illegal use as their majorcharge were convicted in the Magistrates Court. Of these 30.4%were sentenced to immediate imprisonment, with the average termbeing 28 weeks.
• Insurance companies paid policyholders an average of $4,757 (up5.2%) per claim and their total outgoing costs per claim averaged$5,611.
• The percentage of insurance theft claims involving arson continuesto increase now accounting for 11.8% of all claims compared to5.8% in 1995.
• Likewise the percentage of insurance claims considered suspiciousand possibly fraudulent reached 17.8% during 1998 compared toonly 5.9% in 1995.
• One third (34%) of vehicle thefts occurred from the owner’s homewhile 53.3% occurred within the statistical local area of the owner’sresidence.
• 52% of stolen vehicles were recovered within 24 hours and by theend of the first week 79.4% were recovered.
• When recovered, 55.8% of vehicles were located within fivekilometres of where they were stolen.
• Newer vehicles are at a much lower risk of theft than older vehicles.Table 5.5 reveals that vehicles manufactured during the 1990s are7.6 times less likely than 1970s models to be stolen, and 3.9 timesmore likely to be recovered. Vehicles built during the 1990s arealso 4.9 times less likely than 1980s models to be stolen and 2.8times more likely to be recovered.
• Over half (51%) of stolen vehicles were valued at $3,000 or lessand 77% were valued at $7,000 or less. Vehicles valued at over$30,000 accounted for only 1% of all thefts during 1998.
The increase in South Australia’s vehicle thefts during 1998 was notunpredicted. In the 1997 CARS Report it was noted that while SouthAustralia’s level of vehicle theft was declining, the size of this reductionwas decreasing and was possibly approaching the end of a downwardtrend. It was also noted that there had been a number of significantincreases in other Australian jurisdictions suggesting South Australiamay be about to experience the ‘lag’ effects of a more national increasein vehicle theft.
Despite this current increase the strategies implemented bystakeholders during the 1990s has seen South Australia fare better thanmost other jurisdictions. For example, since 1993 South Australia hasrecorded a 6.7% increase in vehicle theft compared to a nationalaverage of 16.9%. In many jurisdictions the increase has been evenlarger, for example, since 1993 Tasmania has recorded a 125.2%

INTRODUCTION 15
increase, while over the same period increases have been recorded inthe ACT (up 44.6%), New South Wales (up 35.2%), Northern Territory(28.6%) and Victoria (up 7.5%).
This current increase in vehicle theft has re-ignited stakeholder interestwithin South Australia and will hopefully result in a renewed effort andthe introduction of a new coordinated campaign of initiatives. Some ofthese initiatives are already in place, for example, as of 6th September1999 changes to the South Australian Wrecked and Written-off VehicleRegister came into effect thereby reducing the opportunity forprofessionals to ‘re-birth’ a stolen vehicle using a wrecked or written-offvehicle. Furthermore, the commencement of the National Motor VehicleTheft Reduction Council on 24th February 1999 will play a pivotal role inimplementing national initiatives and assisting State and Territories withthe development of their strategies.
It is hoped that the combined effect of this renewed emphasis onvehicle theft should see current theft rates stabilize and then graduallydecline again over the next 18 months.
While mentioning the National Motor Vehicle Theft Reduction Council, ithas been announced that the Council has contracted the SouthAustralian Office of Crime Statistics to expand its CARS database into anational collection system.
This will provide significant advantages including:• Access to a larger pool of national data that will allow emerging
trends to be detected more readily including the theft risks of newvehicles, displacement effects of individual initiatives to surroundingjurisdictions, etc.
• The increase in sample size will facilitate the use of more powerfuland more meaningful statistical analyses, which in turn increasesthe reliability and confidence in the conclusions drawn.
• The availability of a readily accessible integrated dataset willfacilitate the work of governments and industry groups,criminologists, researchers and policy analysts by eliminating thedata collection and purification costs associated with any researchproject.
Work on the development of the National CARS database commencedon 1st July 1999. It is anticipated the database will be developed by theend of 1999 with statistical reports from the database being availablethrough the Council.
This ReportThis report provides a snapshot of vehicle theft in South Australia during1998. It is intended that it will serve as a reference tool for researchersand policy advisers by providing accurate and reliable statistics fromwhich trends can be monitored and prevention initiatives accuratelyevaluated. It is also hoped that the project will encourage greaterinterest and attention to the issue of motor vehicle theft and stimulatefurther research.

16 MOTOR VEHICLE THEFT IN SOUTH AUSTRALIA, 1998
Chapter 2 of the report reviews general vehicle theft and recoverytrends in South Australia during the last 28 years and compares recentstatistics with those from across the country. Chapters 3 to 5 analysevarious factors associated with thefts and recoveries. Specificallychapter 3 looks at the temporal characteristics associated with theftsand recoveries while chapter 4 analyses spatial characteristics. Vehiclecharacteristics such as body type, make, year of manufacturer, enginesize, etc. have been analysed in chapter 5, along with factors such asmeans of entry, type of damage sustained and estimated value of thevehicle. Chapter 6 focuses on the insurance data with estimates ofinsurers’ costs cross-tabulated by type of cover, condition of the vehicleat recovery, type of salvage, make, year of manufacture, and ananalysis of claims suspected of possibly being fraudulent.Apprehended offenders are profiled in chapter 7 while chapter 8analyses the responses by the criminal justice system to allegedoffenders. Appendix A contains a profile of thefts and recoveries withineach metropolitan statistical local area and Appendix B lists thedefinitions used throughout.
Finally, a few cautionary notes. While care has been taken to ensurethe data presented in this report are as accurate as possible minordifferences may occur between the statistics from the CARS databaseand those published by other agencies. These differences can occurfor a number of reasons and readers are encouraged to refer toAppendix B for a detailed description of these reasons. Likewisereaders should be aware that the sequence of events in this publicationmight have taken place over a period of time exceeding the 12-monthperiod covered in this report. For example, a proportion of therecoveries analysed in the following chapters will relate to thefts thatoccurred prior to 1998. Readers may also be tempted to try and usefigures in the report to construct indicators of the State’s success (orotherwise) in ‘clearing up’ crime and prosecuting offenders. Howeverthis would not be a valid exercise. For example, many offences andoffenders that came to the attention of the Police Department duringthat year would have been cleared up or taken to court in subsequentyears. In other words it is more appropriate to treat the report as a‘snapshot’ of vehicle theft statistics rather than a ‘motion picture’ of theprocessing of offences or defendants through the system.
17
S O U T H A U S T R A L I A N & I N T E R S T A T E T R E N D S

18 MOTOR VEHICLE THEFT IN SOUTH AUSTRALIA, 1998

SOUTH AUSTRALIAN & INTERSTATE TRENDS
SOUTH AUSTRALIAN & INTERSTATE TRENDS 17
hapter 2 analyses theft and recovery trends since the early 1970sand compares the South Australian figures with those from across thenation.
During 1998 South Australia recorded 10,487 motor vehicle thefts and9,428 recoveries. This represents a considerable increase of 37.2%over the 1997 figure of 7,645 thefts and is in contrast to the last sevenyears whereby motor vehicle theft had shown a steady 50% decline.Table 2.2 shows that the theft rate per 100,000 population and per100,000 registered vehicles has also increased substantially over the1997 rates. However, the 1998 theft rate per 100,000 registrations isstill lower than the rates recorded over the ten years between 1985 and1995.
Table 2.4 compares the relative change in the rate of motor vehicle theftper 100,000 population indexed to 1971/72 with those of other propertyoffences. While other property offences also recorded increased ratesof theft during 1998, the percentage increase in the rate for motorvehicle theft was almost four times the average for all property offences.
Figures released by the Australian Bureau of Statistics indicate thatoverall Australia recorded a 1.1% increase in motor vehicle thefts during1998, although there were considerable variations between thejurisdictions. For example, substantial increases were recorded in theAustralian Capital Territory (up 54.9%), South Australia (up 36.2%) andTasmania (up 21.8%) while Queensland, Northern Territory, New SouthWales and Victoria all recorded small decreases. Nationally, SouthAustralia’s motor vehicle theft rate of 738.32 thefts per 100,000population places it fourth behind Western Australia (880.20), NewSouth Wales (833.12) and the ACT (786.94) and marginally ahead ofthe Australian average of 701.80 (see Table 2.6).
Since the introduction of uniform crime statistics in 1993 Australia hasseen annual recorded thefts increase from 112,578 to 131,572, anincrease of 17.0%. During this same period South Australia’s theft ratehas increased by 6.7%. In comparison, some jurisdictions haverecorded substantial increases, including Tasmania (up 125.2% since1993), Australian Capital Territory (up 44.6%), New South Wales(35.2%) and the Northern Territory (28.6%).
Findings from the 1998 ABS National Crime and Safety survey (tables2.7 - 2.9) reveal the level of both reported and unreported vehicle theftin Australia during the period April 1997 – April 1998. With theexception of the Australian Capital Territory the rate of reporting ofmotor vehicle theft to police was above 90% in all jurisdictions. SouthAustralia’s level of reporting was 94.9% of all incidents compared to theAustralian average of 97.8%.
C

18 MOTOR VEHICLE THEFT IN SOUTH AUSTRALIA, 1998
Table 2.1 South Australian motor vehicle theft and recovery statistics, 1971 - 1998.
Year No. of vehicles stolen No. of vehicles recovered Recovery rate1971/72 2,990 n/a n/a1972/73 3,380 n/a n/a1973/74 4,169 3,968 95.21974/75 4,679 4,456 95.21975/76 4,846 4,571 94.31976/77 4,496 4,067 90.51977/78 5,510 5,037 91.41978/79 6,492 5,800 89.31979/80 5,850 5,103 87.21980/81 5,802 5,122 88.31981/82 5,584 4,852 86.91982/83 5,635 5,175 91.81983/84 6,413 5,929 92.51984/85 7,548 6,935 91.91985/86 10,780 9,831 91.21986/87 10,118 9,183 90.81987/88 10,166 9,081 89.31988/89 11,886 10,813 91.01989/90 13,046 11,850 90.81990/91 15,303 13,890 90.81991/92 12,875 10,838 84.21992/93 11,299 9,703 85.91993/94 9,360 8,167 87.31994/95 9,732 8,635 88.71995 calendar year 9,495 8,448 89.01996 8,032 7,151 89.01997 7,645 6,721 87.91998 10,487 9,428 89.9
Sources: Financial year statistics from the S.A. Commissioner of Police Annual Reports and Statistical Reviews.1995 - 1998 calendar year data from the CARS database.
Figure 2.1 South Australian motor vehicle theft and recovery statistics, 1971 - 1998.
0
2,000
4,000
6,000
8,000
10,000
12,000
14,000
16,000
18,000
71/72 73/74 75/76 77/78 79/80 81/82 83/84 85/86 87/88 89/90 91/92 93/94 1996 1998
Num
ber o
f veh
icle
s
Thefts Recoveries

SOUTH AUSTRALIAN & INTERSTATE TRENDS 21
Table 2.2 Rate of motor vehicle theft per 100,000 population and per 100,000 registrations, 1971 - 1998.
Year Theft rate per 100,000 population Theft rate per 100,000 registrations1971/72 250 5861972/73 280 6551973/74 340 7621974/75 373 8101975/76 382 7851976/77 351 7011977/78 427 8251978/79 500 9531979/80 449 8491980/81 442 8191981/82 421 7701982/83 421 7571983/84 474 8401984/85 553 9551985/86 783 1,3201986/87 729 1,2111987/88 727 1,2181988/89 841 1,4041989/90 915 1,5131990/91 1,063 1,7321991/92 887 1,5011992/93 774 1,2701993/94 639 1,0351994/95 663 1,0581995 calendar year 646 9261996 calendar year 545 7631997 calendar year 517 7061998 calendar year 705 953
Source of registration figures is the Australian Bureau of Statistics’ South Australia Year Books, Catalogue No. 1301.4. Rate per100,000 population for 1971/72 - 1994/95 from S.A. Police Commissioner’s Annual Reports and Statistical Reviews. Calendar yearpopulation rates based on estimated resident population as at 30th June, ABS Catalogue 3204.4 and 3101.0.
Figure 2.2 Rate of motor vehicle theft per 100,000 population and 100,000 registrations, 1971 - 1998.
0
300
600
900
1200
1500
1800
2100
71/72 73/74 75/76 77/78 79/80 81/82 83/84 85/86 87/88 89/90 91/92 93/94 1995 1997
Num
ber o
f veh
icle
s
Rate/100,000 population Rate/100,000 registrations

22 MOTOR VEHICLE THEFT IN SOUTH AUSTRALIA, 1998
Table 2.3 Rate per 100,000 population of selected property offences in South Australia, 1971 - 1998.
Year Motor Vehicle Theft Robbery Break & Enter Larceny (exc. MV Theft)
False Pretences,Fraud, Forgery,
Misappropriation
All PropertyOffences
1971/72 250.1 15.4 1,032.6 2,046.5 282.3 3,611.51972/73 279.5 15.2 1,034.1 2,078.8 305.1 3,697.31973/74 339.7 20.9 1,087.7 2,211.1 451.3 4,089.71974/75 372.9 22.2 1,170.6 2,357.2 223.9 4,124.61975/76 381.6 21.2 1,104.7 2,167.0 194.7 3,847.91976/77 351.3 20.9 1,138.1 2,493.2 204.6 4,137.11977/78 426.5 16.5 1,181.1 2,600.3 152.0 4,360.01978/79 499.9 25.3 1,383.0 2,960.4 216.8 5,060.11979/80* 448.5 37.9 1,829.7 4,378.0 291.9 6,948.21980/81 442.0 29.6 1,666.6 3,576.7 238.5 5,923.81981/82 421.4 29.3 1,594.1 3,422.9 273.7 5,712.21982/83 421.1 26.2 1,638.4 3,537.0 265.2 5,861.71983/84 474.0 30.8 1,932.3 3,632.2 276.4 6,314.71984/85 552.7 28.5 2,030.9 3,526.5 313.2 6,423.31985/86 783.0 40.2 2,246.8 3,958.2 397.3 7,385.21986/87 729.2 52.3 2,574.8 4,130.7 453.2 7,887.91987/88 726.6 48.5 2,735.5 4,262.8 459.4 8,184.41988/89 841.4 48.9 2,732.7 4,084.2 498.7 8,157.11989/90 915.1 55.5 2,977.1 4,130.0 434.7 8,456.91990/91 1,063.2 93.2 3,314.8 4,675.5 519.5 9,573.01991/92 886.8 90.8 2,792.1 3,586.0 529.9 7,794.81992/93 774.6 109.3 2,851.6 3,707.0 528.6 7,861.81993/94 639.4 106.7 2,712.5 3,516.7 526.6 7,395.31994/95 663.1 107.7 2,305.0 3,428.9 563.3 6,960.31995/96 638.1 101.2 2,095.1 3,533.2 676.5 6,942.91996/97 543.8 86.2 1,974.2 3,339.2 677.0 6,534.21997/98 648.7 90.4 2,021.4 3,473.0 711.0 6,854.2Source: S.A. Police Commissioners Annual Reports and Statistical Reviews. * 1979/80 police statistics were affected by the processing of a backlog ofreports.
Table 2.4 Relative change of selected property offences per 100,000 population indexed to 1971/72.
Year Motor Vehicle Theft Robbery Break & Enter Larceny (exc. MV Theft)
False Pretences,Fraud, Forgery,
Misappropriation
All PropertyOffences
1971/72 100.0 100.0 100.0 100.0 100.0 100.01972/73 111.8 98.7 100.1 101.6 108.1 102.41973/74 135.8 135.7 105.3 108.0 159.9 113.21974/75 149.1 144.2 113.4 115.2 79.3 114.21975/76 152.6 137.7 107.0 105.9 69.0 106.51976/77 140.5 135.7 110.2 121.8 72.5 114.61977/78 170.5 107.1 114.4 127.1 53.8 120.71978/79 200.0 164.3 133.9 144.7 76.8 140.11979/80 179.3 246.1 177.2 213.9 103.4 192.41980/81 176.7 192.2 161.4 174.8 84.5 164.01981/82 168.5 190.3 154.4 167.3 97.0 158.21982/83 168.4 170.1 158.7 172.8 93.9 162.31983/84 189.5 200.0 187.1 177.5 97.9 174.81984/85 221.0 185.1 196.7 172.3 110.9 177.91985/86 313.1 261.0 217.6 193.4 140.7 204.51986/87 291.6 339.6 249.4 201.8 160.5 218.41987/88 290.5 314.9 264.9 208.3 162.7 226.61988/89 336.4 317.5 264.6 199.6 176.7 225.91989/90 365.9 360.4 288.3 201.8 154.0 234.21990/91 425.1 605.2 321.0 228.5 184.0 265.11991/92 354.6 589.6 270.4 175.2 187.7 215.81992/93 309.7 709.7 276.2 181.1 187.2 217.71993/94 255.7 692.9 262.7 171.8 186.5 204.8

SOUTH AUSTRALIAN & INTERSTATE TRENDS 23
1994/95 265.1 699.4 223.2 167.5 199.5 192.71995/96 255.1 657.1 202.9 172.6 239.6 192.21996/97 217.4 559.7 191.2 163.2 239.8 180.91997/98 259.4 587.0 195.8 169.7 251.9 189.8
Figure 2.3 Relative change of selected property offences per 100,000 population indexed to 1971/72.
50
150
250
350
450
71/72 73/74 75/76 77/78 79/80 81/82 83/84 85/86 87/88 89/90 91/92 93/94 95/96 97/98
Rel
ativ
e C
hang
e (i
ndex
ed to
197
1/72
)
MV Theft Break & Enter Larceny All Property Offences
Financial Year

24 MOTOR VEHICLE THEFT IN SOUTH AUSTRALIA, 1998
Table 2.5 Number of thefts reported to Police by State,1993-1998.
State/ Number of thefts % ChangeTerritory 1993 1994 1995 1996 1997 1998 1997 - 1998 1993 - 1998N.S.W 39,066 45,477 46,591 48,842 54,711 52,833 - 3.4 35.2VIC 27,509 27,410 29,259 28,764 30,453 29,563 - 2.9 7.5Qld. 15,746 16,528 18,416 17,274 17,058 15,691 - 8.0 - 0.3S.A. 10,292 9,350 9,974 8,449 8,060 10,981 36.2 6.7W.A. 16,208 16,625 17,869 14,016 14,827 16,120 8.7 - 0.5TAS. 1,328 1,706 2,251 2,893 2,455 2,991 21.8 125.2N.T. 751 767 1,022 1,107 1,007 966 - 4.1 28.6A.C.T 1,678 1,606 1,557 1,569 1,567 2,427 54.9 44.6Australia 112,578 119,469 126,939 122,914 130,138 131,572 1.1 16.9Source: Australian Bureau of Statistics National Crime Statistics, (Catalogue No. 4510.0). Data refers to calendar years. SouthAustralia data is supplied directly to the ABS by the SA Police, these figures differ slightly from the CARS figures. Prior to 1997Western Australia’s statistics included the theft of caravans and trailers and are not comparable to other jurisdictions.
Table 2.6 Rate of motor vehicle theft per 100,000 population by State, 1993-1998.
State/territory Rate of MV theft per 100,000 population1993 1994 1995 1996 1997 1998
New South Wales 651.38 751.79 761.08 787.18 872.20 833.12Victoria 616.21 612.45 647.88 630.76 661.27 634.28Queensland 505.33 517.13 564.30 517.39 502.14 453.98South Australia 703.53 636.31 678.78 573.09 544.71 738.32Western Australia 966.89 977.31 1,030.86 593.97 824.70 880.20Tasmania 281.71 361.06 475.17 609.82 518.50 633.84Northern Territory 443.59 448.28 574.70 608.91 538.77 508.45Australian Capital Territory 561.39 533.73 511.23 508.92 508.75 786.94Australia 637.60 669.73 702.23 671.27 702.65 701.80Source: Australian Bureau of Statistics National Crime Statistics (Catalogue No. 4510.0). Data refers to calendar years. Revisedpopulation estimates have been used in the calculation of previous years rates.
Figure 2.4 Rate of motor vehicle theft per 100,000 population by State during 1993-1998.
0
150
300
450
600
750
900
1050
NSW VIC QLD SA WA TAS NT ACT Australia
Rat
e pe
r 100
,000
pop
ulat
ion
1993 1998

SOUTH AUSTRALIAN & INTERSTATE TRENDS 25
Table 2.7 Community Crime & Safety Surveys - household victimisation rates by State, 1995 - 1998.
State Number of households victimised atleast once during previous 12 months
Victimisation Rate(% of households in each state)
1995 1996 1997 1998 1993 1995 1996 1997 1998NSW 46,200 46,400 45,900 48,100 2.0 2.1 2.0 2.0 2.1VIC 23,800 32,200 27,300 1.7 1.5 2.1 1.6QLD 16,500 13,800 1.3 1.4 1.1SA 6,600 7,200 1.7 1.1 1.2WA 19,100 16,700 2.2 3.3 2.4TAS n.a. 2,600 1.0 n.a. 1.4NT n.a. 600 0.7* n.a. 1.2ACT 1,000* 1,600 0.8* 1.0* 1.3AUST n.a. 117,900 1.7 n.a. 1.7
* Use estimate with caution, relative standard error 25% or higher. Sources: Crime and Safety, New South Wales and AustralianCapital Territory (ABS Cat. No. 4509.1); Crime and Safety, Victoria (ABS Catalogue No. 4509.2); Crime and Safety, Queensland(ABS Catalogue No. 4509.3); Crime and Safety, South Australia (ABS Catalogue No. 4509.4); Crime and Safety, Western Australia(ABS Cat. No. 4509.5). 1996 Victorian statistics from “1996 Victorian Crime Victimisation Survey”, Department of Justice, Victoria.The 1996 Victorian survey was not conducted by the ABS and is based on a slightly different methodology. Crime and Safety,Australia, April 1998 (ABS Catalogue No. 4509.0).
Table 2.8 Community Crime & Safety Surveys - multiple victimisation rates by State, 1995 - 1998.
State Percentage of victimised householdsVictimised once only Victimised twice or more
1995 1996 1997 1998 1995 1996 1997 1998NSW 87.7 87.9 90.2 89.8 12.3 12.1 9.8 10.2 *VIC 89.7 89.0 91.6 10.3 11.0 8.4 *QLD 86.1 94.9 13.9 5.1 *SA 93.3 94.4 6.7 5.6 *WA 87.4 86.2 12.6 13.8 *TAS n.a. 96.2 n.a. 3.8 *NT n.a. 100.0 n.a -ACT n.a. 93.8 n.a. 6.2 *AUST n.a. 90.8 n.a. 9.2 *
* Use estimate with caution, relative standard error 25% or higher. Sources: Crime and Safety, New South Wales and AustralianCapital Territory (ABS Cat. No. 4509.1); Crime and Safety, Victoria (ABS Catalogue No. 4509.2); Crime and Safety, Queensland(ABS Catalogue No. 4509.3); Crime and Safety, South Australia (ABS Catalogue No. 4509.4); Crime and Safety, Western Australia(ABS Cat. No. 4509.5). 1996 Victorian statistics from “1996 Victorian Crime Victimisation Survey”, Department of Justice, Victoria.The 1996 Victorian survey was not conducted by the ABS and is based on a slightly different methodology.
Table 2.9 Community Crime & Safety Surveys - rate of reporting of last incident to Police by State, 1995 - 1998.
State % of victimised households that reported the last incident to Police % of all incidentsreported to police
1993 1995 1996 1997 1998 1998NSW 95.6 91.4 97.3 96.9 95.1 99.1VIC 94.2 96.5 98.9 97.1 98.7QLD 96.6 94.1 97.5 97.9SA 89.6 96.8 94.4 94.9WA 87.2 93.7 * 92.4 96.7TAS 94.4 n.a. 86.2 92.6NT n.a. n.a. 100.0 100.0ACT 88.1 100.0 * 85.2 83.3AUST 93.7 n.a. 95.7 97.8
* Use estimate with caution, relative standard error 25% or higher. Sources: Crime and Safety, New South Wales and AustralianCapital Territory (ABS Cat. No. 4509.1); Crime and Safety, Victoria (ABS Catalogue No. 4509.2); Crime and Safety, Queensland(ABS Catalogue No. 4509.3); Crime and Safety, South Australia (ABS Catalogue No. 4509.4); Crime and Safety, Western Australia(ABS Cat. No. 4509.5). 1996 Victorian statistics from “1996 Victorian Crime Victimisation Survey”, Department of Justice, Victoria.The 1996 Victorian survey was not conducted by the ABS and is based on a slightly different methodology.

26 MOTOR VEHICLE THEFT IN SOUTH AUSTRALIA, 1998

27
T E M P O R A L C H A R A C T E R I S T I C S

28 MOTOR VEHICLE THEFT IN SOUTH AUSTRALIA, 1998

TEMPORAL CHARACTERISTICS
TEMPORAL CHARACTERISTICS 29
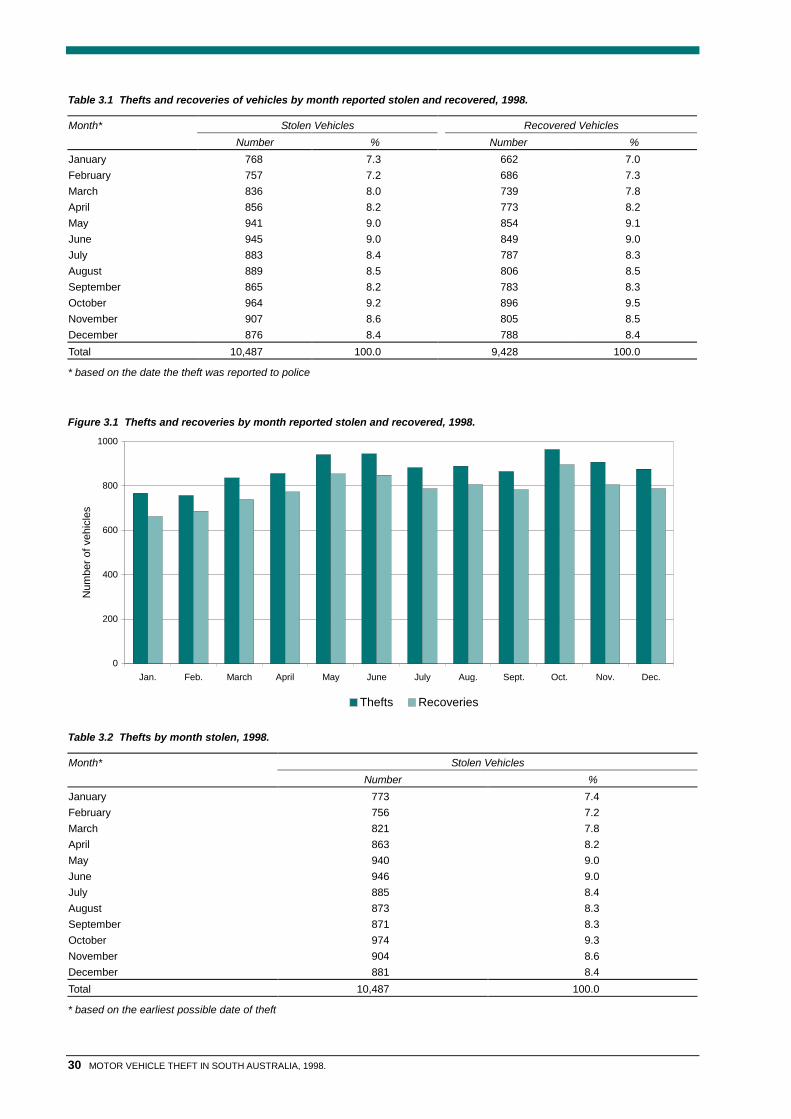
able 3.1 presents the number of thefts and recoveries by month ofreporting and Table 3.2 by month of theft. As with the 1997 theftpatterns, there were no clear seasonal trends in 1998. However, Mayand June were active months for thefts and recoveries with around 950thefts and 850 recoveries in both months. The lowest number of theftsand recoveries occurred at the start of the year with January andFebruary averaging 763 thefts a month or 25.8 thefts per day. Duringthe remainder of the year the monthly average increased to 896 theftsor an average of 3.5 additional thefts per day.
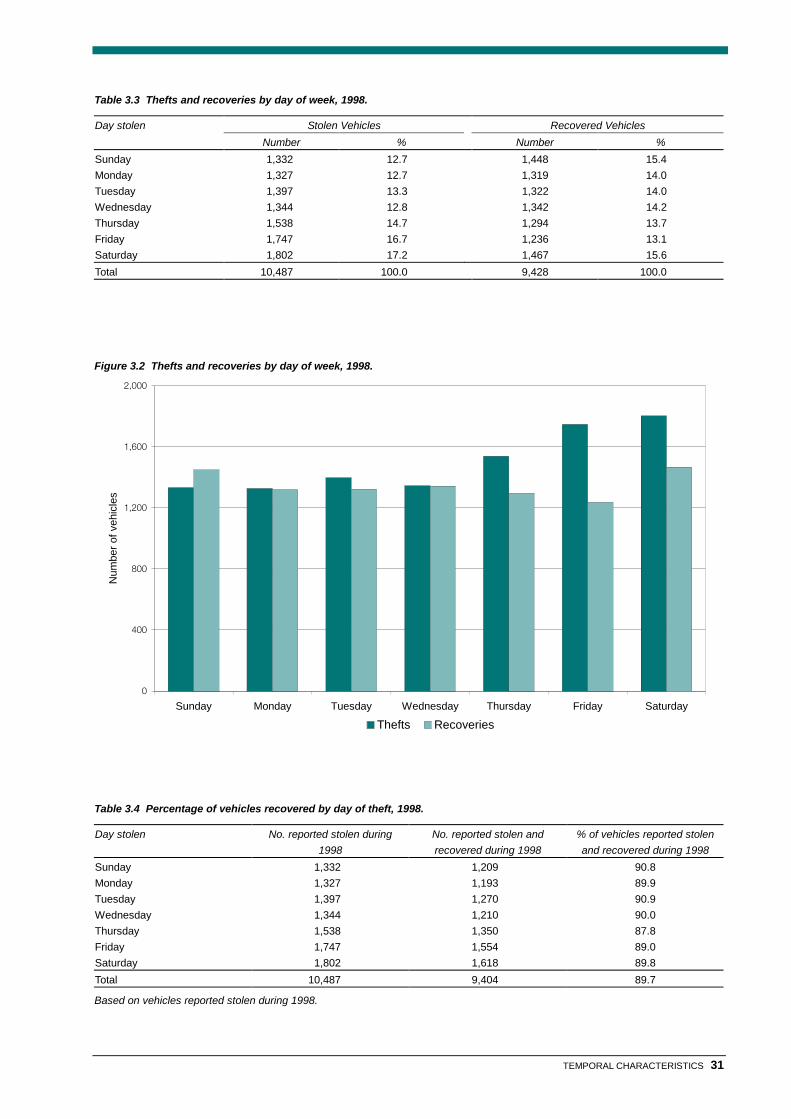
During 1998 thefts were more likely to occur on Thursdays, Fridays andSaturdays and vehicles stolen on Thursdays had a marginally lowerchance of being recovered, compared to those stolen earlier in theweek (see Table 3.4).
As with previous years, the highest percentage of thefts (47.3%) wasbetween 6.00pm and midnight and the lowest percentage (14.5%) ofthefts occurred between midnight and 6.00am (Table 3.5). Morespecifically, the greatest risk of theft was between 6.00pm and midnighton Friday and Saturday nights, accounting for nearly one in five of allthefts (17.3%).
Of the 10,487 thefts reported during 1998, 9,404 vehicles (89.7%) wererecovered by 31 December 1998. However, vehicles stolen between6.00am and 6.00pm had a lower chance of being recovered, having arecovery rate of 87.4% compared with 93.4% for thefts occurring before6.00am and 90.3% after 6pm (see Table 3.6). This suggests vehiclesstolen between 6am and 6pm are more likely to be stolen byprofessional thieves as opposed to joyriders. Table 3.10 shows theresults of a survival analysis that examines the elapsed time betweenthe theft and the subsequent recovery. The analysis reveals that 52.0%of the stolen vehicles were recovered within one day and by the end ofthe first week 79.4% of vehicles had been recovered. After one week,however, the rate at which vehicles were recovered decreasedsignificantly and between one week and one year only a further 10.8%of vehicles were recovered.
During 1998 10,102 individual vehicles were stolen, of which 361 (3.6%)were taken on two or more occasions, including 14 vehicles that werestolen three times and five vehicles that were stolen four times (seeTable 3.11). Over two fifths (42.1%) of the vehicles stolen more thanonce had a time interval of less than 30 days between thefts (see Table3.12).
T
30 MOTOR VEHICLE THEFT IN SOUTH AUSTRALIA, 1998.
Table 3.1 Thefts and recoveries of vehicles by month reported stolen and recovered, 1998.
Month* Stolen Vehicles Recovered VehiclesNumber % Number %
January 768 7.3 662 7.0February 757 7.2 686 7.3March 836 8.0 739 7.8April 856 8.2 773 8.2May 941 9.0 854 9.1June 945 9.0 849 9.0July 883 8.4 787 8.3August 889 8.5 806 8.5September 865 8.2 783 8.3October 964 9.2 896 9.5November 907 8.6 805 8.5December 876 8.4 788 8.4Total 10,487 100.0 9,428 100.0
* based on the date the theft was reported to police
Figure 3.1 Thefts and recoveries by month reported stolen and recovered, 1998.
0
200
400
600
800
1000
Jan. Feb. March April May June July Aug. Sept. Oct. Nov. Dec.
Num
ber o
f veh
icle
s
Thefts Recoveries
Table 3.2 Thefts by month stolen, 1998.
Month* Stolen VehiclesNumber %
January 773 7.4February 756 7.2March 821 7.8April 863 8.2May 940 9.0June 946 9.0July 885 8.4August 873 8.3September 871 8.3October 974 9.3November 904 8.6December 881 8.4Total 10,487 100.0
* based on the earliest possible date of theft
TEMPORAL CHARACTERISTICS 31
Table 3.3 Thefts and recoveries by day of week, 1998.
Day stolen Stolen Vehicles Recovered VehiclesNumber % Number %
Sunday 1,332 12.7 1,448 15.4Monday 1,327 12.7 1,319 14.0Tuesday 1,397 13.3 1,322 14.0Wednesday 1,344 12.8 1,342 14.2Thursday 1,538 14.7 1,294 13.7Friday 1,747 16.7 1,236 13.1Saturday 1,802 17.2 1,467 15.6Total 10,487 100.0 9,428 100.0
Figure 3.2 Thefts and recoveries by day of week, 1998.
0
400
800
1,200
1,600
2,000
Sunday Monday Tuesday Wednesday Thursday Friday Saturday
Num
ber o
f veh
icle
s
Thefts Recoveries
Table 3.4 Percentage of vehicles recovered by day of theft, 1998.
Day stolen No. reported stolen during1998
No. reported stolen andrecovered during 1998
% of vehicles reported stolenand recovered during 1998
Sunday 1,332 1,209 90.8Monday 1,327 1,193 89.9Tuesday 1,397 1,270 90.9Wednesday 1,344 1,210 90.0Thursday 1,538 1,350 87.8Friday 1,747 1,554 89.0Saturday 1,802 1,618 89.8Total 10,487 9,404 89.7
Based on vehicles reported stolen during 1998.

32 MOTOR VEHICLE THEFT IN SOUTH AUSTRALIA, 1998.
Table 3.5 Thefts and recoveries by time of day, 1998.
Time (earliest possible) Stolen Vehicles Recovered VehiclesNumber % Number %
12.00 -12.59 am 565 5.4 276 2.9 1.00 - 1.59 am 364 3.5 311 3.3 2.00 - 2.59 am 227 2.2 303 3.2 3.00 - 3.59 am 149 1.4 267 2.8 4.00 - 4.59 am 126 1.2 229 2.4 5.00 - 5.59 am 89 0.8 205 2.2 6.00 - 6.59 am 112 1.1 263 2.8 7.00 - 7.59 am 247 2.4 336 3.6 8.00 - 8.59 am 419 4.0 705 7.5 9.00 - 9.59 am 369 3.5 795 8.410.00 -10.59 am 271 2.6 695 7.411.00 -11.59 am 299 2.9 597 6.312.00 -12.59 pm 411 3.9 489 5.2 1.00 - 1.59 pm 302 2.9 454 4.8 2.00 - 2.59 pm 306 2.9 415 4.4 3.00 - 3.59 pm 327 3.1 291 3.1 4.00 - 4.59 pm 373 3.6 486 5.2 5.00 - 5.59 pm 569 5.4 415 4.4 6.00 - 6.59 pm 807 7.7 358 3.8 7.00 - 7.59 pm 815 7.8 318 3.4 8.00 - 8.59 pm 826 7.9 349 3.7 9.00 - 9.59 pm 789 7.5 319 3.410.00 -10.59 pm 856 8.2 316 3.411.00 -11.59 pm 869 8.3 236 2.5Total 10,487 100.0 9,428 100.0
Figure 3.3 Thefts and recoveries by time of day, 1998.
0
100
200
300
400
500
600
700
800
900
1000
12.0
0 -1
2.59
1.0
0 -
1.59
2.0
0 -
2.59
3.0
0 -
3.59
4.0
0 -
4.59
5.0
0 -
5.59
6.0
0 -
6.59
7.0
0 -
7.59
8.0
0 -
8.59
9.0
0 -
9.59
10.0
0 -1
0.59
11.0
0 -1
1.59
12.0
0 -1
2.59
1.0
0 -
1.59
2.0
0 -
2.59
3.0
0 -
3.59
4.0
0 -
4.59
5.0
0 -
5.59
6.0
0 -
6.59
7.0
0 -
7.59
8.0
0 -
8.59
9.0
0 -
9.59
10.0
0 -1
0.59
11.0
0 -1
1.59
am pm
% o
f tot
al th
efts
Thefts Recoveries

TEMPORAL CHARACTERISTICS 33
Table 3.6 Percentage of vehicles recovered by time of theft, 1998.
Time (earliest possible) No. reported stolen during1998
No. reported stolen andrecovered during 1998
% of vehicles reported stolenand recovered during 1998
12.00 -12.59 am 565 511 90.4 1.00 - 1.59 am 364 346 95.1 2.00 - 2.59 am 227 222 97.8 3.00 - 3.59 am 149 139 93.3 4.00 - 4.59 am 126 116 92.1 5.00 - 5.59 am 89 85 95.5 6.00 - 6.59 am 112 97 86.6 7.00 - 7.59 am 247 221 89.5 8.00 - 8.59 am 419 380 90.7 9.00 - 9.59 am 369 309 83.710.00 -10.59 am 271 246 90.811.00 -11.59 am 299 263 88.012.00 -12.59 pm 411 335 81.5 1.00 - 1.59 pm 302 269 89.1 2.00 - 2.59 pm 306 277 90.5 3.00 - 3.59 pm 327 283 86.5 4.00 - 4.59 pm 373 325 87.1 5.00 - 5.59 pm 569 497 87.3 6.00 - 6.59 pm 807 704 87.2 7.00 - 7.59 pm 815 730 89.6 8.00 - 8.59 pm 826 747 90.4 9.00 - 9.59 pm 789 727 92.110.00 -10.59 pm 856 777 90.811.00 -11.59 pm 869 798 91.8Total 10,487 9,404 89.7
Figure 3.4 Percentage of thefts recovered as at 31 December 1998 by time of theft.
70
75
80
85
90
95
100
12.0
0 -1
2.59
1.0
0 -
1.59
2.0
0 -
2.59
3.0
0 -
3.59
4.0
0 -
4.59
5.0
0 -
5.59
6.0
0 -
6.59
7.0
0 -
7.59
8.0
0 -
8.59
9.0
0 -
9.59
10.0
0 -1
0.59
11.0
0 -1
1.59
12.0
0 -1
2.59
1.0
0 -
1.59
2.0
0 -
2.59
3.0
0 -
3.59
4.0
0 -
4.59
5.0
0 -
5.59
6.0
0 -
6.59
7.0
0 -
7.59
8.0
0 -
8.59
9.0
0 -
9.59
10.0
0 -1
0.59
11.0
0 -1
1.59
am pm
% o
f 199
8 th
efts
reco
vere
d as
at 3
1 D
ecem
ber 1
998
Time

34 MOTOR VEHICLE THEFT IN SOUTH AUSTRALIA, 1998.
Table 3.7 Thefts and recoveries by day of week and time of day, 1998.
Day/Time (earliest possible) Stolen Vehicles Recovered VehiclesNumber % Number %
Sunday12.00 - 5.59am 372 3.5 275 2.96.00 - 11.59am 127 1.2 511 5.412.00 - 5.59pm 287 2.7 394 4.26.00 - 11.59pm 546 5.2 268 2.8
Monday12.00 - 5.59am 141 1.3 194 2.16.00 - 11.59am 283 2.7 480 5.112.00 - 5.59pm 327 3.1 383 4.16.00 - 11.59pm 576 5.5 262 2.8
Tuesday12.00 - 5.59am 132 1.3 187 2.06.00 - 11.59am 340 3.2 478 5.112.00 - 5.59pm 317 3.0 383 4.16.00 - 11.59pm 608 5.8 274 2.9
Wednesday12.00 - 5.59am 134 1.3 220 2.36.00 - 11.59am 252 2.4 484 5.112.00 - 5.59pm 278 2.7 351 3.76.00 - 11.59pm 680 6.5 287 3.0
Thursday12.00 - 5.59am 196 1.9 214 2.36.00 - 11.59am 284 2.7 470 5.012.00 - 5.59pm 320 3.1 322 3.46.00 - 11.59pm 738 7.0 288 3.1
Friday12.00 - 5.59am 203 1.9 199 2.16.00 - 11.59am 253 2.4 455 4.812.00 - 5.59pm 352 3.4 335 3.66.00 - 11.59pm 939 9.0 247 2.6
Saturday12.00 - 5.59am 342 3.3 302 3.26.00 - 11.59am 178 1.7 513 5.412.00 - 5.59pm 407 3.9 382 4.16.00 - 11.59pm 875 8.3 270 2.9
Total 10,487 100.0 9,428 100.0

TEMPORAL CHARACTERISTICS 35
Table 3.8 Percentage of vehicles recovered by day of week and time of theft, 1998.
Time (earliest possible) No. reported stolen during1998
No. reported stolen andrecovered during 1998
% of vehicles reported stolenand recovered during 1998
Sunday
12.00 - 5.59am 372 351 94.46.00 - 11.59am 127 114 89.812.00 - 5.59pm 287 250 87.16.00 - 11.59pm 546 494 90.5
Monday12.00 - 5.59am 141 126 89.46.00 - 11.59am 283 259 91.512.00 - 5.59pm 327 282 86.26.00 - 11.59pm 576 526 91.3
Tuesday12.00 - 5.59am 132 124 93.96.00 - 11.59am 340 310 91.212.00 - 5.59pm 317 281 88.66.00 - 11.59pm 608 555 91.3
Wednesday12.00 - 5.59am 134 125 93.36.00 - 11.59am 252 221 87.712.00 - 5.59pm 278 249 89.66.00 - 11.59pm 680 615 90.4
Thursday12.00 - 5.59am 196 190 96.96.00 - 11.59am 284 251 88.412.00 - 5.59pm 320 269 84.16.00 - 11.59pm 738 640 86.7
Friday12.00 - 5.59am 203 183 90.16.00 - 11.59am 253 212 83.812.00 - 5.59pm 352 309 87.86.00 - 11.59pm 939 850 90.5
Saturday12.00 - 5.59am 342 320 93.66.00 - 11.59am 178 149 83.712.00 - 5.59pm 407 346 85.06.00 - 11.59pm 875 803 91.8Total 10,487 9,404 89.7
Figure 3.5 Percentage of thefts recovered as at 31 December 1998 by time and day of week of theft.
50
60
70
80
90
100
12-6
am
6-12
am
12-6
pm
6-12
pm
12-6
am
6-12
am
12-6
pm
6-12
pm
12-6
am
6-12
am
12-6
pm
6-12
pm
12-6
am
6-12
am
12-6
pm
6-12
pm
12-6
am
6-12
am
12-6
pm
6-12
pm
12-6
am
6-12
am
12-6
pm
6-12
pm
12-6
am
6-12
am
12-6
pm
6-12
pm
% r
ecov
ered
as
at 3
1 D
ec. '
98
Sunday Monday Tuesday Wednesday Thursday Friday Saturday

36 MOTOR VEHICLE THEFT IN SOUTH AUSTRALIA, 1998.
Table 3.9 Time elapsed between theft and reporting to police, 1998.
Time elapsed between theft and reporting Stolen Vehiclesto police Number %0 - 12 hours 9,866 94.112:01 - 23:59 hours 185 1.8Sub total - Less than 24 hours 10,051 95.8
1 - less than 2 days 140 1.32- less than 4 days 141 1.34 - less than 5 days 56 0.55 - less than 6 days 43 0.46 - less than 7 days 16 0.2Sub total - 1 to less than 7 days 396 3.8
7 - less than 14 days 11 0.114 days or more days 29 0.3Sub total - 7 or more days 40 0.4
Total 10,487 100.0
Table 3.10 Cumulative percentage of vehicles recovered by days elapsed since theft, 1998.*
Time interval between theft and recovery Cumulative percentage of vehiclesrecovered
Standard Error
1 day 52.0 ±4.92 days 63.9 ±4.73 days 69.9 ±4.54 days 73.5 ±4.35 days 76.2 ±4.26 days 78.1 ±4.07 days 79.4 ±4.08 days 80.7 ±3.99 days 81.6 ±3.810 days 82.3 ±3.711 days 82.6 ±3.712 days 83.2 ±3.713 days 83.6 ±3.614 days 83.8 ±3.630 days 86.6 ±3.460 days 88.3 ±3.290 days 88.9 ±3.1120 days 89.3 ±3.1150 days 89.5 ±3.1180 days 89.6 ±3.1364 days 90.2 ±3.2
* Survival analysis of thefts reported during 1998 and recoveries to 31/12/98. Risk period calculated from date stolen to daterecovered.

TEMPORAL CHARACTERISTICS 37
Figure 3.6 Cumulative percentage of vehicles recovered by days elapsed since theft, 1998.
0
10
20
30
40
50
60
70
80
90
100
0 1 2 3 4 5 6 7 8 9 10 11 12 13 14 15 16 17 18 19 20 21 22 23 24 25 26 27 28 29 30
Number of days after theft
Cum
ulat
ive
% o
f veh
icle
s re
cove
red
Table 3.11 Number of multiple thefts of the same vehicle during 1998.
Number of thefts during 1998 Number % of victims*Once 9,741 96.4Twice 342 3.4Three times 14 0.1Four times 5 0.0Total 10,102 100.0
* ‘victims’ refers to unique vehicles - not their owners.

38 MOTOR VEHICLE THEFT IN SOUTH AUSTRALIA, 1998.
Table 3.12 Multiple victimisation - time interval between recovery and subsequent theft, 1998.*
Time interval between recovery andsubsequent theft
Number % of multiple thefts
1 day or less 61 15.82 - 7 days 33 8.68 - 14 days 20 5.215 - 30 days 48 12.5Subtotal - 30 days or less 162 42.1
31 - 60 days 54 14.061 - 90 days 40 10.491 - 120 days 34 8.8121 - 150 days 25 6.5151 - 180 days 17 4.4181 - 210 days 13 3.4211 - 240 days 21 5.5241 - 270 days 9 2.3271 - 300 days 7 1.8301 - 330 day 1 0.3331 + days 2 0.5Total 385 100.0
* ‘Recovery’ refers to the time at which the vehicle was recorded as being located - not the time it was collected by it’s owner.
Figure 3.7 Multiple victimisation - time interval between recovery and subsequent theft, 1998.
0
5
10
15
20
25
30
35
40
1 day or less 2 - 7 days 8 - 14 days 15 - 30 days 31 - 60 days 61 - 90 days 91 days or more
Time interval between recovery and subsequent theft
% o
f mul
tiple
thef
ts
Additional tables analysing make and year of manufacture of vehicles stolen multiple times during 1998 arepresented in chapter 5 ‘Vehicle Characteristics’.

TEMPORAL CHARACTERISTICS 39
S P A T I A L C H A R A C T E R I S T I C S

40 MOTOR VEHICLE THEFT IN SOUTH AUSTRALIA, 1998.

SPATIAL CHARACTERISTICS
SPATIAL CHARACTERISTICS 41
haracteristic of previous years, nearly half (46.4%) of the motorvehicles stolen during 1998 were from a street, followed by those stolenfrom a car park (28.1%) or from a house (18.7%). Almost all (87.2%) of themotor vehicles recovered during 1998 were found parked on a street(71.4%) or in a car park (15.7%) (see Table 4.1).
Tables 4.3 - 4.12 analyse thefts and recoveries by statistical local area,postcode and suburb. Readers should be cautious when drawingcomparisons across regions because factors such as the size of theregion, the population, the number of vehicles frequenting the region, andthe type of facilities (shopping centres, sporting stadiums, entertainmentvenues, etc.) can influence the region’s level of risk. These tables,however, will be useful for longitudinal comparisons within regions.
Nine out of every ten (90.6%) South Australian thefts occurred within theAdelaide Statistical Division (the Adelaide metropolitan area) and over onein every five (20.1%) of these thefts occurred within the Adelaide CityCouncil boundaries (see Table 4.3). Apart from the Adelaide City Councilarea, other metropolitan statistical local areas (SLAs) that revealed a hightheft rate in 1998 were to the north, west and south of Adelaide. Salisburyrecorded 9.5% of all metropolitan thefts, Hindmarsh and Woodvillerecorded 9.0% and Enfield, Tea Tree Gully and Noarlunga all recordedbetween 6 and 7 per cent of thefts occurring in the metropolitan area.These statistical areas showing high rates of vehicle theft are host to someof the types of high-risk facilities shown in Table 4.1. For example, theboundaries of Salisbury SLA include Globe Derby Park; Hindmarsh andWoodville Council hold an array of high-risk facilities, including West LakesShopping Centre, Football Park, the Entertainment Centre and QueenElizabeth Hospital; and, Noarlunga and Tea Tree Gully both have majorshopping centres. The location of vehicle recoveries during 1998 werealso mainly in the Adelaide Statistical Division (87.3%). The StatisticalLocal Areas of Salisbury, Enfield, Hindmarsh and Woodville and AdelaideCity held the highest proportion of recoveries, all accounting for around onein ten recovered vehicles in the Adelaide Statistical Division. The SLA ofEast Torrens was the only area in metropolitan Adelaide to record adecrease in the number of thefts between 1997 and 1998 (down from 11thefts to 9). Other areas recorded increases in the number of vehiclesstolen, to the extent that Marion recorded a percentage increase of138.3%. A further nine SLAs in the Adelaide Statistical Division recordedincreases greater than 50% (including: Brighton, Henley and Grange,Kensington and Norwood, Mitcham, Noarlunga, Salisbury, Tea Tree Gully,Walkerville and Willunga). Of the country Statistical Local Areas (Table4.4), the highest proportion of vehicle thefts occurred in major regionalcentres. Only a handful of councils recorded more than five per cent ofcountry vehicle thefts and these were Port Augusta (11.4%), MountGambier (7.5%), Murray Bridge (5.8%), Whyalla (5.3%) and Port Lincoln(5.1%).
As outlined in Table 4.7, the majority of vehicles stolen in South Australiaare recovered within five kms of the location stolen (55.8%). On average,vehicles are recovered 10.3 kms away from where they were stolen. Overhalf (53.3%) the vehicle thefts recorded in 1998 occurred within theStatistical Local Area of the owner’s residence (see Table 4.8).
C

42 MOTOR VEHICLE THEFT IN SOUTH AUSTRALIA, 1998.
Table 4.1 Thefts and recoveries of vehicles by location type, 1998.
Location Type Stolen Vehicles Recovered VehiclesNumber % Number %
Beach 4 0.0 32 0.3Business Premises 476 4.5 237 2.5Car park - attended 32 0.3 12 0.1Car park - educational 87 0.8 81 0.9Car park - hotel/club 296 2.8 126 1.3Car park - medical 111 1.1 39 0.4Car park - other 821 7.8 532 5.6Car park - private 209 2.0 97 1.0Car park - railway station 147 1.4 44 0.5Car park - recreational 184 1.8 155 1.6Car park - shopping centre 811 7.7 313 3.3Car park - units/flats 250 2.4 85 0.9Car yard 12 0.1 1 0.0Cliff 3 0.0 13 0.1Dirt track 3 0.0 85 0.9Factory 2 0.0 0 0.0Farm 18 0.2 8 0.1Flat/Unit 0 0.0 1 0.0Footpath 5 0.0 10 0.1House - driveway 1,681 16.0 136 1.4House - front yard 176 1.7 14 0.1House - rear yard 102 1.0 77 0.8Median strip 0 0.0 3 0.0Oval 2 0.0 35 0.4Parklands 6 0.1 24 0.3Petrol station 7 0.1 9 0.1Reserve 6 0.1 130 1.4River/creek 0 0.0 46 0.5Scrub land 8 0.1 168 1.8Shed 150 1.4 24 0.3Street 4,863 46.4 6,734 71.4Vacant land 15 0.1 157 1.7Total 10,487 100.0 9,428 100.0

SPATIAL CHARACTERISTICS 43
Table 4.2 Percentage of vehicles reported stolen and recovered during 1998 by location type of theft.
Location type No. stolen during1998
No. stolen & recoveredduring 1998
% stolen during 1998 andsubsequently recovered as at
31/12/98Beach 4 2 50.0Business Premises 476 382 80.3Car park - attended 32 32 100.0Car park - educational 87 81 93.1Car park - hotel/club 296 269 90.9Car park - medical 111 107 96.4Car park - other 821 748 91.1Car park - private 209 186 89.0Car park - railway station 147 141 95.9Car park - recreational 184 168 91.3Car park - shopping centre 811 694 85.6Car park - units/flats 250 228 91.2Car yard 12 11 91.7Cliff 3 3 100.0Dirt track 3 2 66.7Factory 2 2 100.0Farm 18 8 44.4Footpath 5 4 80.0House - driveway 1,681 1,543 91.8House - front yard 176 151 85.8House - rear yard 102 72 70.6Oval 2 2 100.0Parklands 6 4 66.7Petrol station 7 5 71.4Reserve 6 4 66.7Scrub land 8 7 87.5Shed 150 93 62.0Street 4,863 4,443 91.4Vacant land 15 12 80.0Total 10,487 9,404 89.7

44 MOTOR VEHICLE THEFT IN SOUTH AUSTRALIA, 1998.
Table 4.3 Location of thefts and recoveries by metropolitan Statistical Local Area, 1998.
Statistical Local Area Stolen Vehicles Recovered VehiclesNumber % Number %
Adelaide (C) 1,909 20.1 738 9.0Brighton (C) 113 1.2 78 0.9Burnside (C) 115 1.2 105 1.3Campbelltown (C) 210 2.2 185 2.2East Torrens (DC) 9 0.1 41 0.5Elizabeth (C) 371 3.9 300 3.6Enfield (C) 626 6.6 839 10.2Gawler (M) 111 1.2 88 1.1Glenelg (C) 180 1.9 101 1.2Happy Valley (C) 87 0.9 84 1.0Henley & Grange (C) 124 1.3 134 1.6Hindmarsh & Woodville (C) 853 9.0 826 10.0Kensington & Norwood (C) 156 1.6 96 1.2Marion (C) 548 5.8 476 5.8Mitcham (C) 243 2.6 232 2.8Munno Para (C) 286 3.0 431 5.2Noarlunga (C) 656 6.9 638 7.8Payneham (C) 108 1.1 116 1.4Port Adelaide (C) 331 3.5 443 5.4Prospect (C) 185 1.9 158 1.9Salisbury (C) 901 9.5 963 11.7St Peters (M) 77 0.8 67 0.8Stirling (DC) 23 0.2 36 0.4Tea Tree Gully (C) 570 6.0 383 4.7Thebarton (M) 116 1.2 108 1.3Unley (C) 220 2.3 153 1.9Walkerville (M) 41 0.4 32 0.4West Torrens (C) 291 3.1 314 3.8Willunga (DC) 43 0.5 63 0.8Total 9,503 100.0 8,228 100.0
C = Council; DC = District Council; M = Municipality. The Statistical Local Area refers to a region defined by the Australian Bureauof Statistics (as at the 1996 Census) and may not necessarily relate to the current local government boundaries.

SPATIAL CHARACTERISTICS 45
Table 4.4 Location of thefts and recoveries by country Statistical Local Area, 1998.
Statistical Local Area Stolen Vehicles Recovered VehiclesNumber % Number %
Angaston (DC) 5 0.5 10 0.8Barmera (DC) 17 1.7 11 0.9Barossa (DC) 3 0.3 12 1.0Beachport (DC) 1 0.1 3 0.3Berri (DC) 30 3.0 34 2.8Blyth & Snowtown (DC) 3 0.3 3 0.3Browns Well (DC) 0 0.0 0 0.0Burra Burra (DC) 3 0.3 1 0.1Bute (DC) 0 0.0 2 0.2Carrieton (DC) 0 0.0 0 0.0Ceduna (DC) 15 1.5 13 1.1Central Yorke Peninsula (DC) 17 1.7 19 1.6Clare (DC) 7 0.7 6 0.5Cleve (DC) 2 0.2 3 0.3Coober Pedy (DC) 14 1.4 12 1.0Coonalpyn Downs (DC) 1 0.1 1 0.1Crystal Brook & Redhill (DC) 3 0.3 6 0.5Dudley (DC) 1 0.1 0 0.0Ellliston (DC) 0 0.0 0 0.0Eudunda (DC) 0 0.0 0 0.0Franklin Harbor (DC) 1 0.1 2 0.2Gumeracha (DC) 24 2.4 66 5.5Hallett (DC) 0 0.0 0 0.0Hawker (DC) 0 0.0 1 0.1Jamestown (DC) 0 0.0 1 0.1Kanyaka - Quorn (DC) 5 0.5 3 0.3Kapunda (DC) 4 0.4 6 0.5Karoonda - East Murray (DC) 1 0.1 4 0.3Kimba (DC) 0 0.0 0 0.0Kingscote (DC) 3 0.3 4 0.3Lacepede (DC) 0 0.0 1 0.1Lameroo (DC) 0 0.0 1 0.1Le Hunte (DC) 0 0.0 1 0.1Light (DC) 9 0.9 34 2.8Lower Eyre Peninsula (DC) 4 0.4 1 0.1Loxton (DC) 19 1.9 13 1.1Lucindale (DC) 0 0.0 0 0.0Mallala (DC) 41 4.2 148 12.3Mannum (DC) 9 0.9 12 1.0Meningie (DC) 21 2.1 18 1.5Millicent (DC) 8 0.8 8 0.7Minlaton (DC) 2 0.2 3 0.3Morgan (DC) 6 0.6 3 0.3Mount Barker (DC) 44 4.5 64 5.3Mount Gambier (C) 74 7.5 60 5.0Mount Gambier (DC) 3 0.3 16 1.3Mount Pleasant (DC) 9 0.9 8 0.7Mount Remarkable (DC) 3 0.3 2 0.2Murray Bridge (RC) 57 5.8 62 5.2Naracoorte (DC) 1 0.1 2 0.2Naracoorte (M) 9 0.9 6 0.5Northern Yorke Peninsula (DC) 5 0.5 5 0.4Onkaparinga (DC) 15 1.5 8 0.7Orroroo (DC) 0 0.0 0 0.0

46 MOTOR VEHICLE THEFT IN SOUTH AUSTRALIA, 1998.
Table 4.4 Location of thefts and recoveries by country Statistical Local Area, 1998. (Continued)
Statistical Local Area Stolen Vehicles Recovered VehiclesNumber % Number %
Paringa (DC) 9 0.9 9 0.8Peake (DC) 0 0.0 0 0.0Penola (DC) 0 0.0 1 0.1Peterborough (DC) 1 0.1 1 0.1Peterborough (M) 4 0.4 4 0.3Pinnaroo (DC) 0 0.0 0 0.0Pirie (DC) 2 0.2 1 0.1Port Augusta (C) 112 11.4 104 8.7Port Broughton (DC) 3 0.3 5 0.4Port Elliot & Goolwa (DC) 20 2.0 16 1.3Port Lincoln (C) 50 5.1 48 4.0Port MacDonnell (DC) 4 0.4 8 0.7Port Pirie (C) 36 3.7 24 2.0Renmark (M) 24 2.4 12 1.0Ridley & Truro (DC) 16 1.6 16 1.3Riverton (DC) 3 0.3 0 0.0Robe (DC) 3 0.3 2 0.2Robertstown (DC) 0 0.0 0 0.0Rocky River (DC) 1 0.1 2 0.2Roxby Downs (DC) 15 1.5 11 0.9Saddleworth & Auburn (DC) 5 0.5 4 0.3Spalding (DC) 1 0.1 1 0.1Strathalbyn (DC) 16 1.6 17 1.4Streaky Bay (DC) 1 0.1 4 0.3Tanunda (DC) 2 0.2 2 0.2Tatiara (DC) 9 0.9 5 0.4Tumby Bay (DC) 3 0.3 5 0.4Unincorporated regions 29 2.9 38 3.2Victor Harbor (DC) 32 3.3 29 2.4Waikerie (DC) 11 1.1 12 1.0Wakefield Plains (DC) 11 1.1 11 0.9Wallaroo (M) 0 0.0 0 0.0Warooka (DC) 0 0.0 0 0.0Whyalla (C) 52 5.3 49 4.1Yankalilla (DC) 6 0.6 11 0.9Yorketown (DC) 4 0.4 3 0.3Interstate - NSW/ACT - - 13 1.1Interstate - QLD - - 4 0.3Interstate - VIC - - 28 2.3Interstate - WA - - 1 0.1Total 984 100.0 1,200 100.0
C = Council; DC = District Council; M = Municipality. The Statistical Local Area refers to a region defined by the Australian Bureauof Statistics (as at the 1996 Census) and may not necessarily relate to the current local government boundaries.

SPATIAL CHARACTERISTICS 47
Table 4.5 Percentage of vehicles recovered by metropolitan Statistical Local Area of theft, 1998.
Statistical Local Area No. stolen during the reporting period
No. stolen & recoveredduring the reporting period
%recovered
Adelaide (C) 1,909 1,755 91.9Brighton (C) 113 104 92.0Burnside (C) 115 103 89.6Campbelltown (C) 210 197 93.8East Torrens(DC) 9 6 66.7Elizabeth (C) 371 324 87.3Enfield (C) 626 560 89.5Gawler (M) 111 100 90.1Glenelg (C) 180 158 87.8Happy Valley (C) 87 79 90.8Henley & Grange (C) 124 118 95.2Hindmarsh & Woodville (C) 853 757 88.7Kensington & Norwood (C) 156 145 92.9Marion (C) 548 482 88.0Mitcham (C) 243 226 93.0Munno Para (C) 286 252 88.1Noarlunga (C) 656 587 89.5Payneham (C) 108 102 94.4Port Adelaide (C) 331 306 92.4Prospect (C) 185 165 89.2Salisbury (C) 901 804 89.2St. Peters (M) 77 68 88.3Stirling (DC) 23 17 73.9Tea Tree Gully (C) 570 508 89.1Thebarton (M) 116 108 93.1Unley (C) 220 196 89.1Walkerville (M) 41 35 85.4West Torrens (C) 291 265 91.1Willunga (DC) 43 36 83.7Total 9,503 8,563 90.1
C = Council; DC = District Council; M = Municipality. The Statistical Local Area refers to a region defined by the Australian Bureauof Statistics (as at the 1996 Census) and may not necessarily relate to the current local government boundaries.

48 MOTOR VEHICLE THEFT IN SOUTH AUSTRALIA, 1998.
Table 4.6 Percentage of vehicles recovered by country Statistical Local Area of theft, 1998.
Statistical Local Area No. stolen during the reporting period
No. stolen & recoveredduring the reporting period
%recovered
Angaston (DC) 5 4 80.0Barmera (DC) 17 11 64.7Barossa (DC) 3 3 100.0Beachport (DC) 1 1 100.0Berri (DC) 30 28 93.3Blyth & Snowtown (DC) 3 1 33.3Browns Well (DC) 0 0 0.0Burra Burra (DC) 3 2 66.7Bute (DC) 0 0 0.0Carrieton (DC) 0 0 0.0Ceduna (DC) 15 15 100.0Central Yorke Peninsula (DC) 17 15 88.2Clare (DC) 7 6 85.7Cleve (DC) 2 2 100.0Coober Pedy (DC) 14 12 85.7Coonalpyn Downs (DC) 1 0 0.0Crystal Brook & Redhill (DC) 3 2 66.7Dudley (DC) 1 1 100.0Elliston (DC) 0 0 0.0Eudunda (DC) 0 0 0.0Franklin Harbor (DC) 1 1 100.0Gumeracha (DC) 24 19 79.2Hallett (DC) 0 0 0.0Hawker (DC) 0 0 0.0Jamestown (DC) 0 0 0.0Kanayaka - Quorn (DC) 5 5 100.0Kapunda (DC) 4 4 100.0Karoonda - East Murray (DC) 1 1 100.0Kimba (DC) 0 0 0.0Kingscote (DC) 3 3 100.0Lacepede (DC) 0 0 0.0Lameroo (DC) 0 0 0.0Le Hunte (DC) 0 0 0.0Light (DC) 9 7 77.8Lower Eyre Peninsula (DC) 4 2 50.0Loxton (DC) 19 14 73.7Lucindale (DC) 0 0 0.0Mallala (DC) 41 20 48.8Mannum (DC) 9 8 88.9Meningie (DC) 21 17 81.0Millicent (DC) 8 8 100.0Minlaton (DC) 2 2 100.0Morgan (DC) 6 4 66.7Mount Barker (DC) 44 38 86.4Mount Gambier (C) 74 72 97.3Mount Gambier (DC) 3 2 66.7Mount Pleasant (DC) 9 7 77.8Mount Remarkable (DC) 3 1 33.3Murray Bridge (RC) 57 51 89.5Naracoorte (DC) 1 1 100.0Naracoorte (M) 9 9 100.0Northern Yorke Peninsula (DC) 5 5 100.0Onkaparinga (DC) 15 10 66.7Orroroo (DC) 0 0 0.0

SPATIAL CHARACTERISTICS 49
Table 4.6 Percentage of vehicles recovered by country Statistical Local Area of theft, 1998. (Continued)
Statistical Local Area No. stolen during the reporting period
No. stolen & recoveredduring the reporting period
%recovered
Paringa (DC) 9 5 55.6Peake (DC) 0 0 0.0Penola (DC) 0 0 0.0Peterborough (DC) 1 1 100.0Peterborough (M) 4 4 100.0Pinnaroo (DC) 0 0 0.0Pirie (DC) 2 2 100.0Port Augusta (C) 112 105 93.8Port Broughton (DC) 3 3 100.0Port Elliot & Goolwa (DC) 20 18 90.0Port Lincoln (C) 50 47 94.0Port MacDonnell (DC) 4 3 75.0Port Pirie (C) 36 29 80.6Renmark (M) 24 16 66.7Ridley & Truro (DC) 16 14 87.5Riverton (DC) 3 1 33.3Robe (DC) 3 3 100.0Roberstown (DC) 0 0 0.0Rocky River (DC) 1 0 0.0Roxby Downs (DC) 15 14 93.3Saddleworth & Auburn (DC) 5 4 80.0Spalding (DC) 1 1 100.0Strathalbyn (DC) 16 14 87.5Streaky Bay (DC) 1 1 100.0Tanunda (DC) 2 1 50.0Tatiara (DC) 9 8 88.9Tumby Bay (DC) 3 3 100.0Unincorporated regions 29 26 89.7Victor Harbor (DC) 32 30 93.8Waikerie (DC) 11 10 90.9Wakefield Plains (DC) 11 6 54.5Wallaroo (M) 0 0 0.0Warooka (DC) 0 0 0.0Whyalla (C) 52 51 98.1Yankalilla (DC) 6 3 50.0Yorketown (DC) 4 4 100.0Total 984 841 85.5
C = Council; DC = District Council; M = Municipality. The Statistical Local Area refers to a region defined by the Australian Bureauof Statistics (as at the 1996 Census) and may not necessarily relate to the current local government boundaries.

50 MOTOR VEHICLE THEFT IN SOUTH AUSTRALIA, 1998.
Table 4.7 Distance between collector district stolen and collector district recovered.
SLA Stolen Percentage of vehicles recovered within: Mean StandardSame CD ≤ 1 km ≤ 5 km ≤ 10 km ≤ 20 km (kms) Deviation
(kms)Adelaide (C) 6.3 17.0 46.3 69.5 88.1 10.5 24.5Brighton (C) 5.8 17.3 54.8 67.3 89.4 11.8 27.6Burnside (C) 10.0 25.0 59.0 73.0 91.0 7.8 14.8Campbelltown (C) 13.7 26.4 65.0 86.3 93.4 5.8 8.5East Torrens (DC) 33.3 33.3 50.0 100.0 100.0 3.5 3.5Elizabeth (C) 12.4 20.4 52.6 69.3 87.6 9.2 17.5Enfield (C) 10.6 24.8 62.3 81.1 93.5 7.6 24.3Gawler (M) 6.0 15.0 33.0 49.0 80.0 13.9 20.2Glenelg (C) 6.3 21.5 41.1 57.0 81.0 13.8 34.5Happy Valley (C) 12.7 20.3 40.5 70.9 87.3 9.1 12.0Henley & Grange (C) 4.3 22.2 67.5 86.3 97.4 5.8 12.2Hindmarsh & Woodville (M) 7.5 21.3 62.4 83.3 94.2 6.7 14.4Kensington & Norwood (C) 6.9 18.6 55.9 77.9 92.4 6.8 8.7Marion (C) 9.8 23.6 56.9 72.6 91.8 7.8 10.4Mitcham (C) 10.7 28.6 57.1 76.3 90.6 7.3 10.8Munno Para (C) 12.3 25.8 59.5 78.6 91.7 8.4 21.5Noarlunga (C) 10.5 19.2 59.2 76.8 87.0 9.8 37.3Payneham (C) 11.8 28.4 64.7 81.4 92.2 6.3 8.7Port Adelaide (C) 12.8 29.8 63.6 78.7 92.5 8.1 25.2Prospect (C) 9.8 18.9 51.8 71.3 89.0 8.9 13.4St Peters (M) 5.9 19.1 57.4 83.8 91.2 9.1 26.2Salisbury (C) 11.1 23.2 59.0 75.1 91.9 9.2 27.4Stirling (DC) 29.4 35.3 47.1 58.8 76.5 10.1 10.2Tea Tree Gully (C) 10.3 20.8 52.3 70.9 90.3 9.2 15.8Thebarton (M) 8.3 22.2 57.4 80.6 94.4 6.2 6.8Unley (C) 4.6 18.4 48.5 68.9 89.8 14.1 79.1Walkerville (M) 5.7 14.3 57.1 80.0 94.3 6.5 6.2West Torrens (C) 5.3 19.5 60.3 80.5 92.7 8.5 19.3Willunga (DC) 5.9 5.9 17.6 55.9 85.3 12.8 10.7
Adelaide Statistical Division(ASD)
9.0 21.2 55.1 74.6 90.4 9.0 25.1
Outside ASD 27.0 37.1 63.1 68.6 78.2 23.5 66.3South Australia 10.6 22.6 55.8 74.1 89.3 10.3 31.4
Based on vehicles stolen and recovered during 1998. Excludes vehicles recovered interstate or where a collector district could notbe determined.The Statistical Local Area refers to a region defined by the Australian Bureau of Statistics and may not necessarily relate to thecurrent local government boundaries.
SPATIAL CHARACTERISTICS 51

52 MOTOR VEHICLE THEFT IN SOUTH AUSTRALIA, 1998.
Table 4.8 Location of theft by Statistical Local Area (SLA) of owner, 1998.
Location of theft Number % of theftsTheft occurred within owner’s SLA 5,586 53.3Theft occurred outside owner’s SLA 4,901 46.7Total 10,487 100.0
Figure 4.2 Location of theft by Statistical Local Area (SLA) of owner, 1998.
Outside owner's SLA
46.7%
Within owner's SLA
53.3%
Table 4.9 Location of recovery by Statistical Local Area (SLA) of theft, 1998.
Location of recovery Number % of recoveriesSA thefts recovered within the same SLA as thetheft
4,209 44.6
SA thefts recovered in a different SLA to the theft(excluding interstate and overseas recoveries)
5,170 54.8
SA thefts recovered interstate/overseas 46 0.5Interstate thefts that were recovered in SouthAustralia
3 0.0
Total 9,428 100.0
Figure 4.3 Location of recovery by Statistical Local Area (SLA) of theft, 1998.
Recovered within SA but different SLA
54.8%
Recovered in same SLA
44.6%
Interstate thefts recovered in SA
0.0%
Recovered interstate0.5%

SPATIAL CHARACTERISTICS 53
Table 4.10 Location of thefts and recoveries by postcode, 1998.
Postcode Stolen Vehicles Recovered VehiclesNo. stolen % of total
stolenNo. of home
thefts% of home theftswithin postcode
No.recovered
% of total recovered
5000 1,417 13.5 45 3.2 554 5.95006 492 4.7 41 8.3 184 2.05007 129 1.2 32 24.8 81 0.95008 112 1.1 47 42.0 146 1.55009 110 1.0 16 14.5 96 1.05010 69 0.7 19 27.5 89 0.95011 116 1.1 24 20.7 98 1.05012 90 0.9 37 41.1 139 1.55013 105 1.0 45 42.9 184 2.05014 105 1.0 52 49.5 171 1.85015 134 1.3 33 24.6 119 1.35016 45 0.4 23 51.1 48 0.55017 17 0.2 12 70.6 44 0.55018 15 0.1 8 53.3 53 0.65019 60 0.6 29 48.3 72 0.85020 14 0.1 11 78.6 6 0.15021 120 1.1 17 14.2 38 0.45022 118 1.1 61 51.7 140 1.55023 87 0.8 42 48.3 110 1.25024 66 0.6 33 50.0 73 0.85025 22 0.2 11 50.0 22 0.25031 152 1.4 38 25.0 132 1.45032 67 0.6 30 44.8 80 0.85033 66 0.6 15 22.7 66 0.75034 87 0.8 27 31.0 55 0.65035 43 0.4 16 37.2 53 0.65037 33 0.3 13 39.4 39 0.45038 85 0.8 36 42.4 92 1.05039 93 0.9 29 31.2 73 0.85040 4 0.0 1 25.0 4 0.05041 40 0.4 25 62.5 33 0.45042 83 0.8 38 45.8 72 0.85043 92 0.9 39 42.4 106 1.15044 56 0.5 22 39.3 32 0.35045 182 1.7 45 24.7 107 1.15046 161 1.5 17 10.6 61 0.65047 32 0.3 21 65.6 50 0.55048 83 0.8 35 42.2 58 0.65049 40 0.4 28 70.0 46 0.55050 12 0.1 6 50.0 6 0.15051 21 0.2 7 33.3 21 0.25052 19 0.2 8 42.1 20 0.25061 52 0.5 18 34.6 34 0.45062 59 0.6 29 49.2 75 0.85063 53 0.5 24 45.3 33 0.45064 23 0.2 8 34.8 26 0.35065 35 0.3 12 34.3 31 0.35066 16 0.2 10 62.5 18 0.25067 154 1.5 38 24.7 99 1.15068 43 0.4 29 67.4 29 0.35069 77 0.7 35 45.5 67 0.7
Continued next page

54 MOTOR VEHICLE THEFT IN SOUTH AUSTRALIA, 1998.
Table 4.10 Location of thefts and recoveries by postcode, 1998. (Continued)
Postcode Stolen Vehicles Recovered VehiclesNo. stolen % of total
stolenNo. of home
Thefts% of home theftswithin postcode
No.Recovered
% of total recovered
5070 97 0.9 40 41.2 107 1.15072 43 0.4 26 60.5 35 0.45073 50 0.5 34 68.0 37 0.45074 46 0.4 24 52.2 55 0.65075 73 0.7 21 28.8 54 0.65076 21 0.2 11 52.4 32 0.35081 51 0.5 25 49.0 41 0.45082 128 1.2 51 39.8 115 1.25083 84 0.8 23 27.4 61 0.65084 94 0.9 41 43.6 126 1.35085 88 0.8 49 55.7 140 1.55086 93 0.9 35 37.6 98 1.05087 89 0.8 28 31.5 106 1.15088 21 0.2 10 47.6 25 0.35089 25 0.2 18 72.0 19 0.25090 23 0.2 13 56.5 18 0.25091 49 0.5 34 69.4 36 0.45092 286 2.7 50 17.5 120 1.35093 36 0.3 23 63.9 50 0.55094 17 0.2 3 17.6 43 0.55095 52 0.5 27 51.9 55 0.65096 62 0.6 45 72.6 68 0.75097 51 0.5 29 56.9 48 0.55098 103 1.0 49 47.6 83 0.95106 26 0.2 0 0.0 44 0.55107 93 0.9 60 64.5 115 1.25108 360 3.4 148 41.1 313 3.35109 139 1.3 85 61.2 155 1.65110 42 0.4 8 19.0 99 1.15111 0 0.0 0 0.0 1 0.05112 285 2.7 67 23.5 205 2.25113 186 1.8 100 53.8 233 2.55114 143 1.4 62 43.4 187 2.05115 17 0.2 12 70.6 30 0.35116 19 0.2 7 36.8 29 0.35117 4 0.0 3 75.0 11 0.15118 96 0.9 29 30.2 79 0.85120 21 0.2 7 33.3 39 0.45121 3 0.0 2 66.7 35 0.45125 44 0.4 13 29.5 30 0.35126 41 0.4 33 80.5 42 0.45127 17 0.2 10 58.8 18 0.25131 2 0.0 1 50.0 19 0.25132 1 0.0 0 0.0 8 0.15133 4 0.0 2 50.0 3 0.05134 2 0.0 1 50.0 23 0.25136 1 0.0 1 100.0 1 0.05137 0 0.0 0 0.0 3 0.05138 2 0.0 0 0.0 2 0.05140 1 0.0 0 0.0 1 0.05141 0 0.0 0 0.0 1 0.05142 1 0.0 0 0.0 0 0.0
Continued next page

SPATIAL CHARACTERISTICS 55
Table 4.10 Location of thefts and recoveries by postcode, 1998. (Continued)
Postcode Stolen Vehicles Recovered VehiclesNo. stolen % of total
stolenNo. of home
thefts% of home theftswithin postcode
No.Recovered
% of total recovered
5151 0 0.0 0 0.0 4 0.05152 11 0.1 4 36.4 15 0.25153 5 0.0 2 40.0 17 0.25154 1 0.0 1 100.0 1 0.05155 7 0.1 2 28.6 1 0.05156 0 0.0 0 0.0 4 0.05157 0 0.0 0 0.0 18 0.25158 85 0.8 48 56.5 95 1.05159 70 0.7 52 74.3 60 0.65161 78 0.7 34 43.6 91 1.05162 169 1.6 99 58.6 143 1.55163 97 0.9 58 59.8 158 1.75164 38 0.4 21 55.3 49 0.55165 42 0.4 16 38.1 20 0.25166 10 0.1 3 30.0 13 0.15167 31 0.3 21 67.7 30 0.35168 143 1.4 13 9.1 66 0.75169 44 0.4 21 47.7 50 0.55170 5 0.0 3 60.0 9 0.15171 16 0.2 2 12.5 22 0.25172 3 0.0 2 66.7 21 0.25173 18 0.2 10 55.6 17 0.25174 5 0.0 3 60.0 7 0.15201 1 0.0 1 100.0 14 0.15202 0 0.0 0 0.0 4 0.05203 2 0.0 2 100.0 2 0.05204 4 0.0 1 25.0 5 0.15210 3 0.0 0 0.0 1 0.05211 32 0.3 9 28.1 29 0.35212 4 0.0 1 25.0 3 0.05213 3 0.0 1 33.3 1 0.05214 10 0.1 4 40.0 11 0.15221 1 0.0 0 0.0 0 0.05223 3 0.0 0 0.0 4 0.05231 3 0.0 2 66.7 7 0.15232 1 0.0 1 100.0 14 0.15233 8 0.1 7 87.5 11 0.15234 3 0.0 2 66.7 3 0.05235 7 0.1 3 42.9 5 0.15236 2 0.0 2 100.0 1 0.05237 0 0.0 0 0.0 2 0.05238 9 0.1 5 55.6 13 0.15240 0 0.0 0 0.0 1 0.05241 5 0.0 2 40.0 2 0.05242 2 0.0 2 100.0 2 0.05243 1 0.0 0 0.0 1 0.05244 9 0.1 6 66.7 5 0.15245 7 0.1 2 28.6 8 0.15250 4 0.0 3 75.0 4 0.05251 23 0.2 10 43.5 27 0.35252 8 0.1 5 62.5 10 0.15253 51 0.5 30 58.8 48 0.5
Continued next page

56 MOTOR VEHICLE THEFT IN SOUTH AUSTRALIA, 1998.
Table 4.10 Location of thefts and recoveries by postcode, 1998. (Continued)
Postcode Stolen Vehicles Recovered VehiclesNo. stolen % of total
stolenNo. of home
Thefts% of home theftswithin postcode
No.Recovered
% of total recovered
5254 5 0.0 4 80.0 14 0.15255 16 0.2 6 37.5 13 0.15256 0 0.0 0 0.0 1 0.05259 4 0.0 2 50.0 0 0.05260 13 0.1 8 61.5 15 0.25264 5 0.0 2 40.0 3 0.05266 1 0.0 0 0.0 1 0.05267 5 0.0 1 20.0 2 0.05268 3 0.0 2 66.7 3 0.05269 1 0.0 1 100.0 0 0.05271 10 0.1 3 30.0 8 0.15275 0 0.0 0 0.0 1 0.05276 3 0.0 0 0.0 2 0.05277 0 0.0 0 0.0 1 0.05280 9 0.1 5 55.6 11 0.15290 74 0.7 25 33.8 60 0.65291 7 0.1 2 28.6 24 0.35302 0 0.0 0 0.0 1 0.05306 0 0.0 0 0.0 1 0.05307 1 0.0 0 0.0 3 0.05320 2 0.0 2 100.0 1 0.05321 4 0.0 4 100.0 2 0.05322 0 0.0 0 0.0 1 0.05330 11 0.1 8 72.7 11 0.15333 19 0.2 9 47.4 13 0.15340 8 0.1 5 62.5 5 0.15341 24 0.2 12 50.0 12 0.15342 1 0.0 1 100.0 0 0.05343 25 0.2 12 48.0 32 0.35344 9 0.1 1 11.1 8 0.15345 16 0.2 11 68.8 11 0.15346 1 0.0 0 0.0 0 0.05350 0 0.0 0 0.0 2 0.05351 3 0.0 2 66.7 9 0.15352 3 0.0 1 33.3 2 0.05353 10 0.1 7 70.0 10 0.15354 4 0.0 2 50.0 3 0.05355 3 0.0 2 66.7 5 0.15356 4 0.0 2 50.0 4 0.05357 1 0.0 1 100.0 3 0.05360 1 0.0 1 100.0 1 0.05371 1 0.0 1 100.0 4 0.05372 1 0.0 1 100.0 2 0.05373 4 0.0 2 50.0 6 0.15400 0 0.0 0 0.0 1 0.05401 4 0.0 4 100.0 4 0.05412 3 0.0 1 33.3 0 0.05413 3 0.0 1 33.3 2 0.05414 1 0.0 0 0.0 1 0.05417 2 0.0 0 0.0 1 0.05418 1 0.0 0 0.0 0 0.05422 5 0.0 2 40.0 5 0.1
Continued next page

SPATIAL CHARACTERISTICS 57
Table 4.10 Location of thefts and recoveries by postcode, 1998. (Continued)
Postcode Stolen Vehicles Recovered VehiclesNo. stolen % of total
stolenNo. of home
thefts% of home theftswithin postcode
No.Recovered
% of totalrecovered
5433 5 0.0 4 80.0 3 0.05434 0 0.0 0 0.0 1 0.05440 0 0.0 0 0.0 1 0.05451 1 0.0 0 0.0 1 0.05453 7 0.1 1 14.3 6 0.15454 1 0.0 0 0.0 1 0.05460 1 0.0 0 0.0 1 0.05461 3 0.0 0 0.0 0 0.05462 0 0.0 0 0.0 1 0.05473 1 0.0 1 100.0 2 0.05485 1 0.0 0 0.0 0 0.05491 0 0.0 0 0.0 1 0.05495 2 0.0 2 100.0 1 0.05501 37 0.4 22 59.5 143 1.55502 4 0.0 3 75.0 5 0.15510 3 0.0 2 66.7 2 0.05521 2 0.0 0 0.0 4 0.05522 3 0.0 1 33.3 5 0.15523 1 0.0 0 0.0 2 0.05540 38 0.4 20 52.6 26 0.35550 3 0.0 1 33.3 6 0.15554 4 0.0 2 50.0 4 0.05555 1 0.0 1 100.0 1 0.05558 1 0.0 0 0.0 1 0.05560 0 0.0 0 0.0 2 0.05570 0 0.0 0 0.0 1 0.05571 0 0.0 0 0.0 1 0.05572 1 0.0 0 0.0 0 0.05573 15 0.1 3 20.0 16 0.25575 2 0.0 0 0.0 2 0.05576 2 0.0 1 50.0 1 0.05581 0 0.0 0 0.0 1 0.05582 1 0.0 0 0.0 1 0.05583 1 0.0 1 100.0 1 0.05600 16 0.2 6 37.5 21 0.25601 2 0.0 1 50.0 2 0.05602 1 0.0 0 0.0 2 0.05603 0 0.0 0 0.0 1 0.05604 2 0.0 0 0.0 1 0.05605 1 0.0 1 100.0 4 0.05606 50 0.5 18 36.0 49 0.55607 2 0.0 0 0.0 0 0.05608 32 0.3 22 68.8 27 0.35609 5 0.0 4 80.0 5 0.15630 1 0.0 1 100.0 0 0.05631 1 0.0 0 0.0 0 0.05640 1 0.0 0 0.0 1 0.05642 1 0.0 0 0.0 1 0.05652 0 0.0 0 0.0 1 0.05680 2 0.0 0 0.0 5 0.15690 19 0.2 3 15.8 16 0.25700 106 1.0 58 54.7 91 1.0
Continued next page

58 MOTOR VEHICLE THEFT IN SOUTH AUSTRALIA, 1998.
Table 4.10 Location of thefts and recoveries by postcode, 1998. (Continued)
Postcode Stolen Vehicles Recovered VehiclesNo. stolen % of total
stolenNo. of home
Thefts% of home theftswithin postcode
No.Recovered
% of total recovered
5710 8 0.1 5 62.5 17 0.25720 5 0.0 1 20.0 8 0.15722 1 0.0 0 0.0 0 0.05723 15 0.1 4 26.7 12 0.15724 1 0.0 0 0.0 0 0.05725 15 0.1 1 6.7 11 0.15731 1 0.0 0 0.0 2 0.00872* 5 0.0 2 40.0 4 0.0Interstate- NSW/ACT - - - - 13 0.1- QLD - - - - 4 0.0- VIC - - - - 28 0.3- WA - - - - 1 0.0Total 10,487 100.0 3,561 34.0 9,428 100.0
Postcodes not listed in the table had no thefts or recoveries recorded during 1998.* Although this is a Northern Territory postcode it services part of the Far North of South Australia.
Legend for the postcodes displayed in Figures 4.4 and 4.5
Postcode Suburb5000 Adelaide5006 North Adelaide5092 Modbury, Modbury Heights, Modbury North5013 Gillman, Ottoway, Pennington, Rosewater, Rosewater East, Wingfield5014 Albert Park, Alberton, Cheltenham, Hendon, Queenstown, Royal Park5108 Paralowie, Salisbury, Salisbury Downs, Salisbury North5109 Brahma Lodge, Salisbury East, Salisbury Heights, Salisbury Park, Salisbury Plain5112 Elizabeth, Elizabeth East, Elizabeth Grove, Elizabeth South, Elizabeth Vale, Hillbank5113 Davoren Park, Davoren Park North, Davoren Park South, Elizabeth Downs, Elizabeth North, Elizabeth Park, Elizabeth
West5114 Andrews Farm, Blakeview, Craigmore, Gould Creek, Humbug Scrub, One Tree Hill, Sampson Flat, Smithfield,
Smithfield Plains, Smithfield West, Uleybury, Yattalunga5163 Hackham, Hackham West, Huntfield Heights, Onkaparinga Hills

SPATIAL CHARACTERISTICS 59

60 MOTOR VEHICLE THEFT IN SOUTH AUSTRALIA, 1998.

SPATIAL CHARACTERISTICS 61
Table 4.11 Location of thefts and recoveries by metropolitan suburb, 1998.
Suburb Stolen Vehicles Recovered VehiclesNumber % Number %
Aberfoyle Park 23 0.2 21 0.3Adelaide 1,495 15.7 575 7.0Adelaide Airport 5 0.1 5 0.1Albert Park 23 0.2 33 0.4Alberton 17 0.2 22 0.3Aldgate 1 0.0 1 0.0Aldinga 4 0.0 9 0.1Aldinga Beach 6 0.1 9 0.1Allenby Gardens 7 0.1 18 0.2Andrews Farm 10 0.1 13 0.2Angle Park 14 0.1 27 0.3Angle Vale 4 0.0 9 0.1Ascot Park 16 0.2 12 0.1Ashford 6 0.1 3 0.0Ashton 1 0.0 0 0.0Athelstone 21 0.2 35 0.4Athol Park 15 0.2 26 0.3Auldana 0 0.0 0 0.0Banksia Park 25 0.3 21 0.3Basket Range 1 0.0 1 0.0Beaumont 4 0.0 5 0.1Bedford Park 29 0.3 21 0.3Belair 10 0.1 18 0.2Bellevue Heights 5 0.1 4 0.0Beulah Park 6 0.1 4 0.0Beverley 19 0.2 17 0.2Bibaringa 1 0.0 3 0.0Birkenhead 10 0.1 12 0.1Black Forest 9 0.1 3 0.0Blackwood 15 0.2 10 0.1Blair Athol 43 0.5 64 0.8Blakeview 12 0.1 31 0.4Blewitt Springs 0 0.0 2 0.0Bolivar 20 0.2 20 0.2Bowden 25 0.3 16 0.2Bradbury 0 0.0 2 0.0Brahma Lodge 17 0.2 46 0.6Bridgewater 7 0.1 1 0.0Brighton 39 0.4 22 0.3Broadview 18 0.2 23 0.3Brompton 29 0.3 26 0.3Brooklyn Park 26 0.3 29 0.4Brown Hill Creek 0 0.0 11 0.1Buckland Park 0 0.0 6 0.1Burnside 9 0.1 4 0.0Burton 18 0.2 35 0.4Camden Park 18 0.2 25 0.3Campbelltown 34 0.4 36 0.4Castambul 0 0.0 4 0.0Cavan 5 0.1 17 0.2Chandlers Hill 0 0.0 1 0.0Cheltenham 15 0.2 24 0.3Cherry Gardens 0 0.0 6 0.1
Continued next page

62 MOTOR VEHICLE THEFT IN SOUTH AUSTRALIA, 1998.
Table 4.11 Location of thefts and recoveries by metropolitan suburb, 1998. (Continued)
Suburb Stolen Vehicles Recovered VehiclesNumber % Number %
Cherryville 0 0.0 2 0.0Christie Downs 36 0.4 46 0.6Christies Beach 46 0.5 23 0.3Clapham 5 0.1 2 0.0Clarence Gardens 8 0.1 7 0.1Clarence Park 6 0.1 7 0.1Clarendon 0 0.0 7 0.1Clearview 21 0.2 45 0.5Clovelly Park 21 0.2 20 0.2College Park 10 0.1 5 0.1Collinswood 9 0.1 7 0.1Colonel Light Gardens 7 0.1 9 0.1Coromandel Valley 4 0.0 3 0.0Cowandilla 11 0.1 16 0.2Crafers 6 0.1 5 0.1Crafers West 1 0.0 2 0.0Craigburn 0 0.0 1 0.0Craigmore 32 0.3 20 0.2Croydon 11 0.1 18 0.2Croydon Park 32 0.3 38 0.5Cumberland Park 8 0.1 4 0.0Darlington 3 0.0 6 0.1Davoren Park 63 0.7 80 1.0Daw Park 6 0.1 7 0.1Dernancourt 8 0.1 15 0.2Devon Park 11 0.1 11 0.1Direk 0 0.0 7 0.1Dover Gardens 12 0.1 15 0.2Dry Creek 9 0.1 14 0.2Dudley Park 3 0.0 13 0.2Dulwich 10 0.1 1 0.0Eagle On The Hill 1 0.0 2 0.0Eastwood 4 0.0 5 0.1Eden Hills 7 0.1 3 0.0Edwardstown 66 0.7 45 0.5Elizabeth 157 1.7 48 0.6Elizabeth Downs 45 0.5 63 0.8Elizabeth East 25 0.3 34 0.4Elizabeth Field 0 0.0 1 0.0Elizabeth Grove 15 0.2 19 0.2Elizabeth North 26 0.3 30 0.4Elizabeth Park 34 0.4 33 0.4Elizabeth South 27 0.3 34 0.4Elizabeth Vale 47 0.5 50 0.6Elizabeth West 15 0.2 21 0.3Enfield 43 0.5 58 0.7Erindale 0 0.0 1 0.0Ethelton 21 0.2 21 0.3Evandale 2 0.0 5 0.1Evanston 13 0.1 12 0.1Evanston Gardens 1 0.0 2 0.0Evanston Park 3 0.0 2 0.0Evanston South 1 0.0 7 0.1
Continued next page
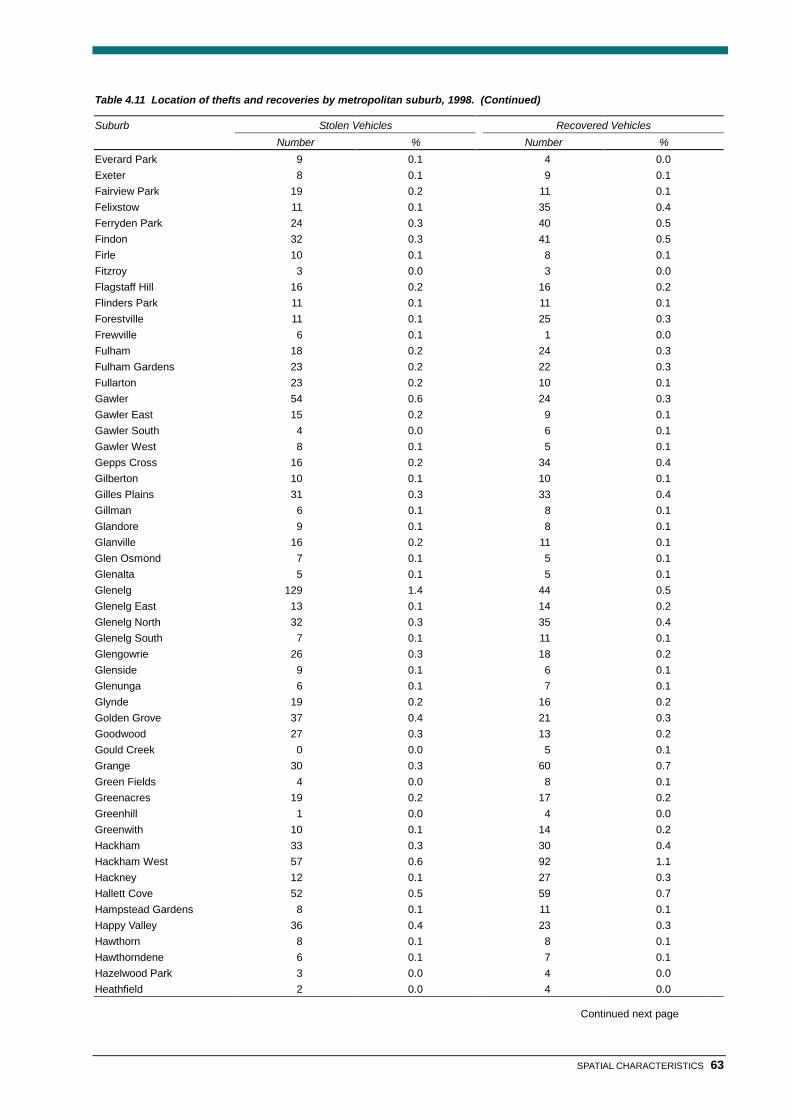
SPATIAL CHARACTERISTICS 63
Table 4.11 Location of thefts and recoveries by metropolitan suburb, 1998. (Continued)
Suburb Stolen Vehicles Recovered VehiclesNumber % Number %
Everard Park 9 0.1 4 0.0Exeter 8 0.1 9 0.1Fairview Park 19 0.2 11 0.1Felixstow 11 0.1 35 0.4Ferryden Park 24 0.3 40 0.5Findon 32 0.3 41 0.5Firle 10 0.1 8 0.1Fitzroy 3 0.0 3 0.0Flagstaff Hill 16 0.2 16 0.2Flinders Park 11 0.1 11 0.1Forestville 11 0.1 25 0.3Frewville 6 0.1 1 0.0Fulham 18 0.2 24 0.3Fulham Gardens 23 0.2 22 0.3Fullarton 23 0.2 10 0.1Gawler 54 0.6 24 0.3Gawler East 15 0.2 9 0.1Gawler South 4 0.0 6 0.1Gawler West 8 0.1 5 0.1Gepps Cross 16 0.2 34 0.4Gilberton 10 0.1 10 0.1Gilles Plains 31 0.3 33 0.4Gillman 6 0.1 8 0.1Glandore 9 0.1 8 0.1Glanville 16 0.2 11 0.1Glen Osmond 7 0.1 5 0.1Glenalta 5 0.1 5 0.1Glenelg 129 1.4 44 0.5Glenelg East 13 0.1 14 0.2Glenelg North 32 0.3 35 0.4Glenelg South 7 0.1 11 0.1Glengowrie 26 0.3 18 0.2Glenside 9 0.1 6 0.1Glenunga 6 0.1 7 0.1Glynde 19 0.2 16 0.2Golden Grove 37 0.4 21 0.3Goodwood 27 0.3 13 0.2Gould Creek 0 0.0 5 0.1Grange 30 0.3 60 0.7Green Fields 4 0.0 8 0.1Greenacres 19 0.2 17 0.2Greenhill 1 0.0 4 0.0Greenwith 10 0.1 14 0.2Hackham 33 0.3 30 0.4Hackham West 57 0.6 92 1.1Hackney 12 0.1 27 0.3Hallett Cove 52 0.5 59 0.7Hampstead Gardens 8 0.1 11 0.1Happy Valley 36 0.4 23 0.3Hawthorn 8 0.1 8 0.1Hawthorndene 6 0.1 7 0.1Hazelwood Park 3 0.0 4 0.0Heathfield 2 0.0 4 0.0
Continued next page

64 MOTOR VEHICLE THEFT IN SOUTH AUSTRALIA, 1998.
Table 4.11 Location of thefts and recoveries by metropolitan suburb, 1998. (Continued)
Suburb Stolen Vehicles Recovered VehiclesNumber % Number %
Heathpool 2 0.0 2 0.0Hectorville 15 0.2 12 0.1Hendon 7 0.1 17 0.2Henley Beach 64 0.7 52 0.6Henley Beach South 15 0.2 21 0.3Highbury 24 0.3 18 0.2Highgate 5 0.1 3 0.0Hillbank 17 0.2 23 0.3Hillcrest 22 0.2 24 0.3Hillier 0 0.0 3 0.0Hilton 9 0.1 13 0.2Hindmarsh 51 0.5 23 0.3Holden Hill 23 0.2 25 0.3Hope Forest 0 0.0 2 0.0Hope Valley 27 0.3 20 0.2Hove 15 0.2 5 0.1Humbug Scrub 0 0.0 6 0.1Hyde Park 8 0.1 3 0.0Ingle Farm 99 1.0 81 1.0Ironbank 1 0.0 0 0.0Joslin 3 0.0 1 0.0Kangarilla 0 0.0 4 0.0Kensington 8 0.1 8 0.1Kensington Gardens 4 0.0 1 0.0Kensington Park 9 0.1 6 0.1Kent Town 28 0.3 34 0.4Keswick 10 0.1 20 0.2Kidman Park 11 0.1 10 0.1Kilburn 42 0.4 60 0.7Kilkenny 84 0.9 57 0.7Kings Park 2 0.0 1 0.0Kingston Park 2 0.0 5 0.1Kingswood 11 0.1 9 0.1Klemzig 45 0.5 36 0.4Kudla 1 0.0 10 0.1Kurralta Park 18 0.2 19 0.2Lake View 1 0.0 0 0.0Largs Bay 18 0.2 18 0.2Largs North 14 0.1 16 0.2Leabrook 5 0.1 0 0.0Leawood Gardens 0 0.0 2 0.0Linden Park 2 0.0 2 0.0Lockleys 22 0.2 22 0.3Longwood 0 0.0 1 0.0Lonsdale 18 0.2 39 0.5Lower Mitcham 6 0.1 11 0.1MacDonald Park 1 0.0 5 0.1Magill 36 0.4 28 0.3Malvern 10 0.1 9 0.1Manningham 4 0.0 3 0.0Mansfield Park 34 0.4 53 0.6Marble Hill 0 0.0 2 0.0Marden 19 0.2 19 0.2
Continued next page

SPATIAL CHARACTERISTICS 65
Table 4.11 Location of thefts and recoveries by metropolitan suburb, 1998. (Continued)
Suburb Stolen Vehicles Recovered VehiclesNumber % Number %
Marino 7 0.1 8 0.1Marion 30 0.3 22 0.3Marleston 22 0.2 8 0.1Marryatville 4 0.0 2 0.0Maslin Beach 5 0.1 9 0.1Maylands 13 0.1 9 0.1McLaren Flat 1 0.0 2 0.0McLaren Vale 14 0.1 10 0.1Medindie 10 0.1 5 0.1Medindie Gardens 1 0.0 1 0.0Melrose Park 17 0.2 20 0.2Mile End 52 0.5 57 0.7Mile End South 5 0.1 7 0.1Millswood 5 0.1 4 0.0Mitcham 10 0.1 13 0.2Mitchell Park 24 0.3 36 0.4Moana 10 0.1 15 0.2Moana Heights 3 0.0 0 0.0Modbury 235 2.5 78 0.9Modbury Heights 22 0.2 15 0.2Modbury North 30 0.3 29 0.4Montacute 2 0.0 16 0.2Morphett Vale 135 1.4 124 1.5Morphettville 23 0.2 19 0.2Munno Para 19 0.2 17 0.2Munno Para Downs 1 0.0 1 0.0Munno Para West 1 0.0 4 0.0Mylor 0 0.0 3 0.0Myrtle Bank 6 0.1 5 0.1Nailsworth 18 0.2 12 0.1Netherby 8 0.1 6 0.1Netley 0 0.0 4 0.0Newton 15 0.2 20 0.2Noarlunga 33 0.3 2 0.0Noarlunga Centre 91 1.0 24 0.3Noarlunga Downs 14 0.1 30 0.4North Adelaide 412 4.3 159 1.9North Brighton 3 0.0 6 0.1North Haven 12 0.1 8 0.1North Plympton 6 0.1 8 0.1Northfield 22 0.2 36 0.4Norton Summit 1 0.0 5 0.1Norwood 114 1.2 49 0.6Novar Gardens 5 0.1 4 0.0O’Halloran Hill 13 0.1 13 0.2O’Sullivan Beach 10 0.1 15 0.2Oakden 9 0.1 10 0.1Oaklands Park 133 1.4 41 0.5Old Noarlunga 7 0.1 22 0.3Old Reynella 4 0.0 2 0.0One Tree Hill 5 0.1 18 0.2Onkaparinga Hills 7 0.1 31 0.4Osborne 4 0.0 19 0.2
Continued next page
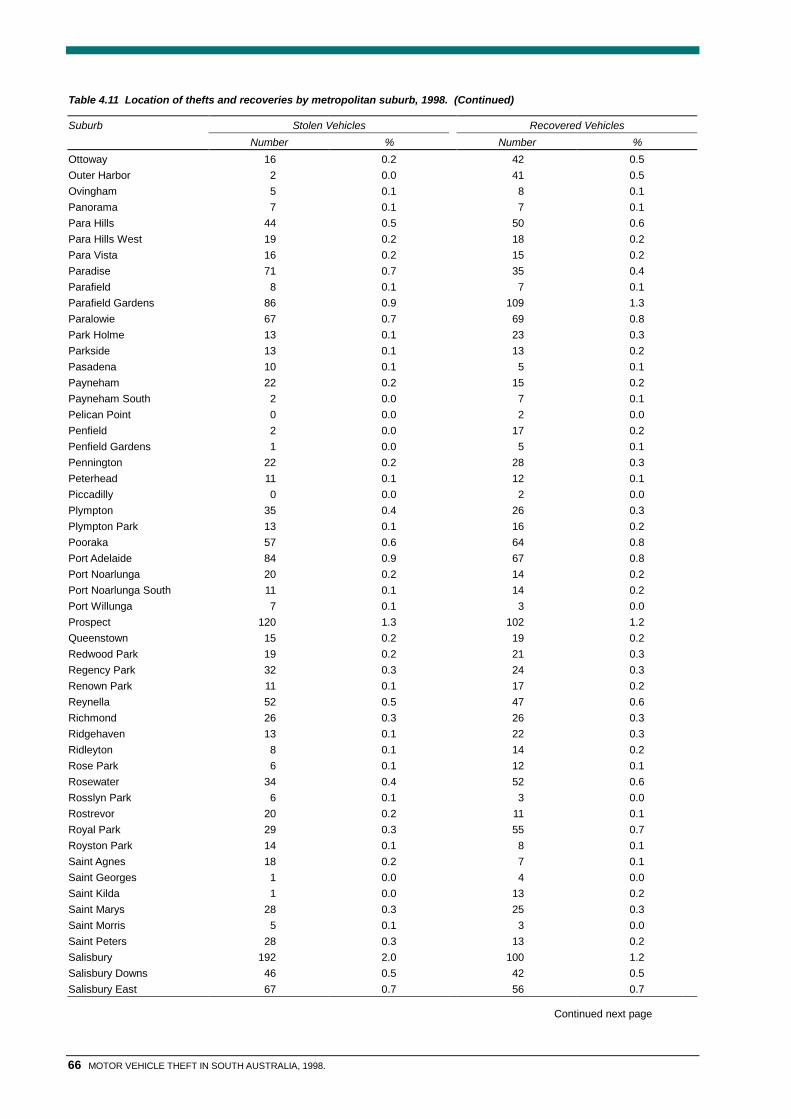
66 MOTOR VEHICLE THEFT IN SOUTH AUSTRALIA, 1998.
Table 4.11 Location of thefts and recoveries by metropolitan suburb, 1998. (Continued)
Suburb Stolen Vehicles Recovered VehiclesNumber % Number %
Ottoway 16 0.2 42 0.5Outer Harbor 2 0.0 41 0.5Ovingham 5 0.1 8 0.1Panorama 7 0.1 7 0.1Para Hills 44 0.5 50 0.6Para Hills West 19 0.2 18 0.2Para Vista 16 0.2 15 0.2Paradise 71 0.7 35 0.4Parafield 8 0.1 7 0.1Parafield Gardens 86 0.9 109 1.3Paralowie 67 0.7 69 0.8Park Holme 13 0.1 23 0.3Parkside 13 0.1 13 0.2Pasadena 10 0.1 5 0.1Payneham 22 0.2 15 0.2Payneham South 2 0.0 7 0.1Pelican Point 0 0.0 2 0.0Penfield 2 0.0 17 0.2Penfield Gardens 1 0.0 5 0.1Pennington 22 0.2 28 0.3Peterhead 11 0.1 12 0.1Piccadilly 0 0.0 2 0.0Plympton 35 0.4 26 0.3Plympton Park 13 0.1 16 0.2Pooraka 57 0.6 64 0.8Port Adelaide 84 0.9 67 0.8Port Noarlunga 20 0.2 14 0.2Port Noarlunga South 11 0.1 14 0.2Port Willunga 7 0.1 3 0.0Prospect 120 1.3 102 1.2Queenstown 15 0.2 19 0.2Redwood Park 19 0.2 21 0.3Regency Park 32 0.3 24 0.3Renown Park 11 0.1 17 0.2Reynella 52 0.5 47 0.6Richmond 26 0.3 26 0.3Ridgehaven 13 0.1 22 0.3Ridleyton 8 0.1 14 0.2Rose Park 6 0.1 12 0.1Rosewater 34 0.4 52 0.6Rosslyn Park 6 0.1 3 0.0Rostrevor 20 0.2 11 0.1Royal Park 29 0.3 55 0.7Royston Park 14 0.1 8 0.1Saint Agnes 18 0.2 7 0.1Saint Georges 1 0.0 4 0.0Saint Kilda 1 0.0 13 0.2Saint Marys 28 0.3 25 0.3Saint Morris 5 0.1 3 0.0Saint Peters 28 0.3 13 0.2Salisbury 192 2.0 100 1.2Salisbury Downs 46 0.5 42 0.5Salisbury East 67 0.7 56 0.7
Continued next page

SPATIAL CHARACTERISTICS 67
Table 4.11 Location of thefts and recoveries by metropolitan suburb, 1998. (Continued)
Suburb Stolen Vehicles Recovered VehiclesNumber % Number %
Salisbury Heights 17 0.2 15 0.2Salisbury North 65 0.7 107 1.3Salisbury Park 15 0.2 19 0.2Salisbury Plain 9 0.1 18 0.2Salisbury South 5 0.1 4 0.0Sampson Flat 0 0.0 4 0.0Scott Creek 0 0.0 3 0.0Seacliff 12 0.1 11 0.1Seacliff Park 7 0.1 10 0.1Seacombe Gardens 10 0.1 18 0.2Seacombe Heights 1 0.0 4 0.0Seaford 23 0.2 18 0.2Seaford Heights 0 0.0 1 0.0Seaford Meadows 0 0.0 2 0.0Seaford Rise 6 0.1 15 0.2Seaton 55 0.6 73 0.9Seaview Downs 13 0.1 12 0.1Sefton Park 50 0.5 25 0.3Sellicks Beach 5 0.1 7 0.1Semaphore 31 0.3 29 0.4Semaphore Park 19 0.2 25 0.3Semaphore South 1 0.0 7 0.1Sheidow Park 16 0.2 13 0.2Silver Sands 1 0.0 0 0.0Skye 0 0.0 3 0.0Smithfield 45 0.5 38 0.5Smithfield Plains 31 0.3 41 0.5Somerton Park 26 0.3 14 0.2South Brighton 11 0.1 11 0.1South Plympton 14 0.1 20 0.2Springfield 1 0.0 0 0.0Stepney 11 0.1 9 0.1Stirling 3 0.0 9 0.1Stoneyfell 1 0.0 2 0.0Sturt 15 0.2 19 0.2Summertown 0 0.0 2 0.0Surrey Downs 17 0.2 15 0.2Taperoo 13 0.1 27 0.3Tea Tree Gully 24 0.3 13 0.2Tennyson 6 0.1 9 0.1Teringie 1 0.0 2 0.0The Levels 4 0.0 10 0.1Thebarton 37 0.4 22 0.3Thorngate 1 0.0 3 0.0Toorak Gardens 10 0.1 14 0.2Torrens Park 11 0.1 11 0.1Torrensville 52 0.5 44 0.5Tranmere 15 0.2 13 0.2Trinity Gardens 7 0.1 7 0.1Trott Park 6 0.1 13 0.2Tusmore 2 0.0 4 0.0Uleybury 1 0.0 11 0.1Underdale 12 0.1 22 0.3
Continued next page

68 MOTOR VEHICLE THEFT IN SOUTH AUSTRALIA, 1998.
Table 4.11 Location of thefts and recoveries by metropolitan suburb, 1998. (Continued)
Suburb Stolen Vehicles Recovered VehiclesNumber % Number %
Unley 33 0.3 20 0.2Unley Park 4 0.0 3 0.0Upper Hermitage 2 0.0 2 0.0Upper Sturt 2 0.0 2 0.0Uraidla 1 0.0 0 0.0Urrbrae 3 0.0 2 0.0Vale Park 9 0.1 6 0.1Valley View 22 0.2 33 0.4Virginia 20 0.2 32 0.4Vista 0 0.0 4 0.0Walkerville 10 0.1 8 0.1Walkley Heights 0 0.0 1 0.0Warradale 18 0.2 16 0.2Waterloo Corner 5 0.1 23 0.3Wattle Park 1 0.0 4 0.0Wayville 49 0.5 31 0.4Welland 12 0.1 10 0.1West Beach 28 0.3 32 0.4West Croydon 32 0.3 36 0.4West Hindmarsh 15 0.2 8 0.1West Lakes 120 1.3 39 0.5West Lakes Shore 18 0.2 6 0.1West Richmond 1 0.0 1 0.0Westbourne Park 12 0.1 8 0.1Willaston 12 0.1 6 0.1Willunga 3 0.0 14 0.2Windsor Gardens 40 0.4 71 0.9Wingfield 31 0.3 58 0.7Woodcroft 31 0.3 21 0.3Woodville 66 0.7 42 0.5Woodville Gardens 19 0.2 36 0.4Woodville North 19 0.2 27 0.3Woodville Park 7 0.1 12 0.1Woodville South 31 0.3 27 0.3Woodville West 12 0.1 18 0.2Wynn Vale 17 0.2 19 0.2Yatala Vale 0 0.0 7 0.1Yattalunga 0 0.0 1 0.0Yundi 0 0.0 1 0.0Total 9,503 100.0 8,228 100.0
This table should be treated as a guide only and not a definitive listing of all the suburbs where vehicles were stolen and recovered.The suburb name has been derived from the collector district code which may not reflect newer suburbs.

SPATIAL CHARACTERISTICS 69
Table 4.12 Location of thefts and recoveries by country region, 1998.
Region Stolen Vehicles Recovered VehiclesNumber % Number %
Amata 1 0.1 0 0.0American River 1 0.1 0 0.0Andamooka 1 0.1 0 0.0Angaston 3 0.3 4 0.3Ardrossan 0 0.0 1 0.1Arno Bay 0 0.0 1 0.1Ashbourne 0 0.0 1 0.1Ashville 0 0.0 1 0.1Auburn 2 0.2 1 0.1Bagot Well 1 0.1 1 0.1Balaklava 3 0.3 0 0.0Balgowan 1 0.1 1 0.1Balhannah 2 0.2 3 0.3Barabba 4 0.4 4 0.3Barmera 15 1.5 9 0.8Beachport 1 0.1 2 0.2Beltana 0 0.0 1 0.1Berri 22 2.2 27 2.3Birdwood 3 0.3 4 0.3Blanchetown 1 0.1 4 0.3Booborowie 1 0.1 0 0.0Bookabie 1 0.1 0 0.0Bordertown 4 0.4 2 0.2Bow Hill 2 0.2 2 0.2Bray 1 0.1 0 0.0Brukunga 1 0.1 0 0.0Buchfelde 1 0.1 3 0.3Burra 2 0.2 2 0.2Burrungule 0 0.0 1 0.1Bute 0 0.0 1 0.1Cadell 4 0.4 1 0.1Callington 1 0.1 2 0.2Cambrai 2 0.2 0 0.0Cape Jervis 1 0.1 1 0.1Caroline 2 0.2 2 0.2Carpenter Rocks 1 0.1 2 0.2Ceduna 11 1.1 10 0.9Chain of Ponds 0 0.0 5 0.4Charleston 1 0.1 0 0.0Clare 7 0.7 6 0.5Cleve 1 0.1 1 0.1Cobdogla 1 0.1 0 0.0Cockatoo Valley 0 0.0 3 0.3Coffin Bay 1 0.1 0 0.0Compton 0 0.0 1 0.1Concordia 0 0.0 1 0.1Coober Pedy 16 1.6 12 1.0Cook 0 0.0 1 0.1Cowell 1 0.1 2 0.2Cromer 0 0.0 1 0.1Crystal Brook 1 0.1 4 0.3Cudlee Creek 1 0.1 10 0.9Cummins 1 0.1 0 0.0
Continued next page

70 MOTOR VEHICLE THEFT IN SOUTH AUSTRALIA, 1998.
Table 4.12 Location of thefts and recoveries by country region, 1998. (Continued)
Region Stolen Vehicles Recovered VehiclesNumber % Number %
Currency Creek 1 0.1 0 0.0Darke Peak 1 0.1 1 0.1Dawesley 0 0.0 1 0.1Dublin 3 0.3 9 0.8Echunga 1 0.1 0 0.0Eden Valley 1 0.1 2 0.2Edillilie 1 0.1 0 0.0Edithburgh 1 0.1 1 0.1Encounter Bay 1 0.1 0 0.0Ernabella 2 0.2 1 0.1Finniss 0 0.0 2 0.2Forest Range 0 0.0 1 0.1Forreston 0 0.0 1 0.1Fowlers Bay 1 0.1 1 0.1Frankton 0 0.0 1 0.1Freeling 1 0.1 2 0.2Fregon 0 0.0 1 0.1Furner 0 0.0 1 0.1Garden Island 1 0.1 6 0.5Gawler Belt 2 0.2 11 1.0Gawler River 1 0.1 6 0.5Gladstone 2 0.2 0 0.0Glenburnie 0 0.0 3 0.3Glendambo 0 0.0 1 0.1Glossop 4 0.4 3 0.3Gomersal 0 0.0 1 0.1Goolwa 10 1.0 11 1.0Gumbowie 1 0.1 1 0.1Gumeracha 8 0.8 7 0.6Hahndorf 4 0.4 6 0.5Harrogate 0 0.0 1 0.1Hawker 0 0.0 1 0.1Hewett 0 0.0 1 0.1Hindmarsh Tiers 0 0.0 1 0.1Houghton 1 0.1 4 0.3Hoyleton 0 0.0 1 0.1Inglewood 5 0.5 10 0.9Innamincka 1 0.1 1 0.1Iron Knob 1 0.1 2 0.2Jamestown 0 0.0 1 0.1Jervois 1 0.1 0 0.0Kadina 4 0.4 3 0.3Kalbeeba 0 0.0 2 0.2Kangaroo Flat 0 0.0 5 0.4Kanmantoo 0 0.0 1 0.1Kapunda 3 0.3 4 0.3Keith 5 0.5 3 0.3Kersbrook 3 0.3 7 0.6Kingscote 2 0.2 3 0.3Kinston S.E. 0 0.0 1 0.1Kongorong 1 0.1 0 0.0Kuitpo 0 0.0 2 0.2Lameroo 0 0.0 1 0.1
Continued next page

SPATIAL CHARACTERISTICS 71
Table 4.12 Location of thefts and recoveries by country region, 1998. (Continued)
Region Stolen Vehicles Recovered VehiclesNumber % Number %
Langhorne Creek 4 0.4 1 0.1Lenswood 1 0.1 1 0.1Lewiston 7 0.7 19 1.6Littlehampton 6 0.6 5 0.4Lobethal 4 0.4 1 0.1Lochiel 3 0.3 2 0.2Long Plains 1 0.1 1 0.1Loveday 0 0.0 2 0.2Lower Hermitage 0 0.0 1 0.1Lower Light 1 0.1 17 1.5Loxton 17 1.7 11 1.0Loxton North 2 0.2 1 0.1Lyrup 0 0.0 3 0.3Macclesfield 1 0.1 2 0.2Macgillivray 1 0.1 1 0.1Maitland 4 0.4 1 0.1Mallala 4 0.4 4 0.3Mannum 9 0.9 10 0.9Manoora 1 0.1 1 0.1Marla 3 0.3 3 0.3Meadows 1 0.1 11 1.0Meningie 5 0.5 2 0.2Middle Beach 1 0.1 8 0.7Middleton 3 0.3 1 0.1Milang 0 0.0 1 0.1Milendella 0 0.0 1 0.1Millicent 7 0.7 5 0.4Mimili 0 0.0 1 0.1Minlaton 2 0.2 2 0.2Moculta 0 0.0 1 0.1Monarto 2 0.2 1 0.1Moonta Bay 1 0.1 1 0.1Moorook 0 0.0 1 0.1Morgan 1 0.1 2 0.2Mount Barker 24 2.4 28 2.4Mount Compass 2 0.2 1 0.1Mount Crawford 0 0.0 3 0.3Mount Gambier 75 7.6 68 5.9Mount Pleasant 5 0.5 3 0.3Mount Torrens 2 0.2 3 0.3Mundoora 1 0.1 1 0.1Murray Bridge 53 5.4 57 4.9Murtho 1 0.1 1 0.1Mypolonga 0 0.0 1 0.1Myponga 0 0.0 4 0.3Nairne 6 0.6 7 0.6Nantawarra 0 0.0 2 0.2Napperby 1 0.1 1 0.1Naracoorte 11 1.1 8 0.7Nelshaby 2 0.2 0 0.0Normanville 1 0.1 1 0.1Nuriootpa 3 0.3 5 0.4Oakbank 1 0.1 1 0.1
Continued next page

72 MOTOR VEHICLE THEFT IN SOUTH AUSTRALIA, 1998.
Table 4.12 Location of thefts and recoveries by country region, 1998. (Continued)
Region Stolen Vehicles Recovered VehiclesNumber % Number %
Olary 0 0.0 1 0.1Olympic Dam 3 0.3 3 0.3Owen 1 0.1 1 0.1Pallamana 0 0.0 1 0.1Palmer 1 0.1 2 0.2Paracombe 1 0.1 7 0.6Parawa 0 0.0 1 0.1Paringa 7 0.7 3 0.3Peake 0 0.0 0 0.0Pelican Point 0 0.0 5 0.4Penola 0 0.0 1 0.1Penong 2 0.2 2 0.2Peterborough 4 0.4 4 0.3Pimba 1 0.1 0 0.0Point Mcleay 1 0.1 0 0.0Point Pearce 3 0.3 11 1.0Ponde 0 0.0 1 0.1Port Arthur 0 0.0 1 0.1Port Augusta 108 11.0 100 8.6Port Broughton 3 0.3 5 0.4Port Clinton 1 0.1 1 0.1Port Elliot 3 0.3 1 0.1Port Gawler 0 0.0 25 2.2Port Germein 2 0.2 1 0.1Port Lincoln 51 5.2 49 4.2Port Neill 2 0.2 1 0.1Port Parham 1 0.1 3 0.3Port Pirie 34 3.5 24 2.1Port Prime 0 0.0 8 0.7Port Victoria 7 0.7 3 0.3Port Vincent 0 0.0 1 0.1Port Wakefield 3 0.3 4 0.3Price 0 0.0 1 0.1Prospect Hill 0 0.0 1 0.1Quorn 5 0.5 4 0.3Ramco 1 0.1 0 0.0Rapid Bay 1 0.1 1 0.1Red Banks 0 0.0 2 0.2Redhill 1 0.1 3 0.3Reeves Plains 0 0.0 7 0.6Renmark 25 2.5 12 1.0Rhynie 1 0.1 0 0.0Riverton 2 0.2 0 0.0Robe 2 0.2 2 0.2Rosedale 1 0.1 0 0.0Roseworthy 2 0.2 3 0.3Roxby Downs 12 1.2 8 0.7Saddleworth 2 0.2 1 0.1Sandleton 1 0.1 0 0.0Sandy Creek 1 0.1 1 0.1Second Valley 1 0.1 1 0.1Sedan 2 0.2 2 0.2Spalding 1 0.1 1 0.1
Continued next page

SPATIAL CHARACTERISTICS 73
Table 4.12 Location of thefts and recoveries by country region, 1998. (Continued)
Region Stolen Vehicles Recovered VehiclesNumber % Number %
Springton 1 0.1 1 0.1Stansbury 1 0.1 1 0.1Stirling North 4 0.4 6 0.5Stonefield 1 0.1 0 0.0Strathalbyn 12 1.2 8 0.7Streaky Bay 0 0.0 2 0.2Swan Reach 5 0.5 5 0.4Tailem Bend 13 1.3 15 1.3Tantanoola 1 0.1 3 0.3Tanunda 2 0.2 2 0.2Tarlee 0 0.0 1 0.1Telowie 0 0.0 1 0.1Thevenard 4 0.4 3 0.3Tintinara 1 0.1 1 0.1Tooperang 0 0.0 1 0.1Torrens Island 0 0.0 1 0.1Towitta 1 0.1 0 0.0Truro 2 0.2 2 0.2Tumby Bay 1 0.1 4 0.3Tungkillo 2 0.2 1 0.1Two Wells 20 2.0 40 3.5Upper Hermitage 0 0.0 4 0.3Victor Harbor 32 3.3 30 2.6Waikerie 12 1.2 12 1.0Walker Flat 0 0.0 1 0.1Wallaroo 0 0.0 1 0.1Ward Belt 0 0.0 4 0.3Wasleys 0 0.0 1 0.1Weetulta 1 0.1 0 0.0Whyalla 21 2.1 40 3.5Whyalla Jenkins 1 0.1 2 0.2Whyalla Norrie 15 1.5 6 0.5Whyalla Playford 3 0.3 0 0.0Whyalla Stuart 15 1.5 5 0.4Wild Horse Plains 2 0.2 0 0.0Williamstown 2 0.2 4 0.3Wilmington 1 0.1 0 0.0Windsor 1 0.1 2 0.2Winkie 8 0.8 7 0.6Wirrulla 1 0.1 2 0.2Wistow 0 0.0 2 0.2Woodside 6 0.6 1 0.1Woomera 4 0.4 5 0.4Wudinna 0 0.0 1 0.1Wunkar 0 0.0 1 0.1Wynarka 0 0.0 1 0.1Yahl 1 0.1 2 0.2Yalata 1 0.1 1 0.1Yamba 0 0.0 1 0.1Yankalilla 2 0.2 2 0.2Yorketown 2 0.2 1 0.1Younghusband 1 0.1 0 0.0
Continued next page

74 MOTOR VEHICLE THEFT IN SOUTH AUSTRALIA, 1998.
Table 4.12 Location of thefts and recoveries by country region, 1998. (Continued)
Region Stolen Vehicles Recovered VehiclesNumber % Number %
Interstate- New South Wales/ACT - - 13 0.0- Queensland - - 4 0.0- Victoria - - 28 0.0- Western Australia - - 1 0.0
Total 984 100.0 1,200 100.0
Regions not listed in the table indicate that no thefts or recoveries were recorded for these areas.

75
V E H I C L E C H A R A C T E R I S T I C S

76 MOTOR VEHICLE THEFT IN SOUTH AUSTRALIA, 1998

VEHICLE CHARACTERISTICS
VEHICLE CHARACTERISTICS 77
uring 1998, motor vehicles were recorded stolen at an overall rate of 95 per10,000 registrations, although for passenger sedans and motor cycles this rateincreases to 118. Motor cycles, however, suffer from a significantly lower recoveryrate than passenger sedans with only 43% recovered compared to 92% recoveryfor passenger sedans. Interestingly, motor cycle thefts declined almost 8% duringthe past 12 months while overall vehicle thefts increased 37%. In contrast thetheft rates for tourers and vans doubled, with 56.4 tourers stolen per 10,000registration (compared with 21.1 in 1997) and 32.5 vans stolen per 10,000registrations (compared with 16.3 in 1997) although the relative numbers of theftin each of these categories is still relatively low.
Table 5.2 reveals the rate of theft by manufacturer. The highest rates are recordedby Holden (202 thefts per 10,000 registrations) and Chrysler (187), however,these figures are undoubtedly affected by their high number of pre 1980 vehiclesin the vehicle fleet. As demonstrated in Table 5.5 age of the vehicle fleet is animportant factor influencing manufacturer’s individual theft rates. Table 5.5 showsthat the rate of theft for vehicles manufactured in the 1970s is 7.6 times higherthan those manufactured in the 1990s (191.5 and 25.3 respectively). Furthermore,vehicles manufactured in the 1970s are almost 4 times less likely to be recoveredthan those from the 1990s (with non-recovery rates of 15.6 and 4.0 respectively).
In addition to vehicle age, make and model, another factor that is related to risk oftheft and recovery is the number of cylinders. As is shown in Table 5.15, thepercentage of recovered vehicles decreased as the number of cylindersincreased, falling from 94.1% recovery rate for four cylinder vehicles to only79.8% amongst eight cylinder vehicles and reflecting the popularity of the big andpowerful V8 engines amongst professional thieves.
The most common means of entry into a vehicle was by manipulation of the lock(57.5% of known cases). In addition, the offender had access to a key in 15.2% ofcases and obtained entry through breaking/smashing windows in 15.1% of knowncases. In 9.3% of known cases the vehicle was unlocked at the time of theft (seeTable 5.20).
Over half (54.1%) of the vehicles stolen in 1998 were recovered damaged. Innearly 1 in 5 cases (19.2%) the vehicle was so damaged it was renderedundriveable. In addition, 15.3% of recovered vehicles had ignition damage, 14.0%had suffered some degree of stripping and 3.7% had been burnt (see Table 5.16).
Table 5.17 shows that the proportion of vehicles recovered with damage wasgreatest for vehicles produced in the 1990s (64.2% recovered damaged) andlowest for those vehicles manufactured during the 1960s and 1970s (41.7% and44.7% respectively).
Analysis of parts missing indicates that audio equipment (taken from 9.7% ofrecovered vehicles) and wheels (4.5%) were the items most frequently removedby thieves (see Table 5.19).
Reflecting the finding that older vehicles are at greater risk of theft than newermodels Table 5.24 shows that over half (51.4%) the vehicles stolen during 1998were valued at less than $3,000 and 77.1% were less than $7,000.
D

78 MOTOR VEHICLE THEFT IN SOUTH AUSTRALIA, 1998.
Table 5.1 Thefts and recoveries by type of vehicle, 1998.
Body type Stolen Vehicles Recovered VehiclesNumber Theft rate per 10,000
registrationsNumber Non-recovery rate per
10,000 registrationsHire car 3 58.6* 3 0.0*Panel van 178 59.9 162 5.4Sedan 7,984 117.9 7,313 9.9Station wagon 1,456 88.7 1,376 4.9Taxi 1 10.5* 1 0.0*Tourer 29 56.4 23 11.7Touring ute 7 40.6 4 5.8Touring van 10 50.7 8 11.6Utility 318 43.1 264 7.3
Motor cycle ** 340 117.5 146 67.1
Amusement ** 1 416.7* 0 416.7*Bus 4 10.7 3 2.7Camper van 2 4.2 1 2.1Earth moving equipment ** 10 26.3 7 7.9Fork lift ** 4 14.0 3 3.5Industrial vehicle 2 23.0* 0 23.0*Land implement 2 5.7 0 5.7Low loader 1 3,333.3* 1 0.0*Mobile crane 1 24.2* 1 0.0*Mower 1 196.1* 1 0.0*Non-commercial van 1 66.7* 1 0.0*Not recorded - commercial 4 233.9* 8 0.0*Not recorded -noncommercial
2 - 0 -
Prime mover 7 13.7 7 0.0Tipper 7 9.1 7 0.0Tractor ** 16 4.6 14 0.6Tri Car 1 454.5* 0 454.5*Truck 69 18.8 53 4.4Van 26 32.5 21 6.3Total 10,487 95.3 9,428 9.6
* Indicates that these rates are based on less than 1,000 registrations and readers should use caution when interpreting thesefigures.
** The rates for these vehicles may be an overestimate as a number of these types of vehicles may not be driven on public roadsand therefore not registered.
The non-recovery rate represents, for each body type, the number of vehicles stolen and not recovered per 10,000 registrations, i.e.
Non-recovery rate = (Number of thefts - Number of recoveries) x 10,000 Number of registered vehicles

VEHICLE CHARACTERISTICS 79
Figure 5.1 Rate of theft by type of vehicle, 1998.
0 50 100 150 200 250
Camper Van
Tractor *
Land Implement
Tipper
Taxi
Bus
Prime Mover
Fork Lift *
Truck
Industrial Vehicle
Mobile Crane
Earth Moving Equipment*
Van
Touring Ute
Utility
Touring Van
Tourer
Hire-car
Panel Van
Non-commercial Van
Station Wagon
Motor cycle *
Sedan
Mower
Not recorded - commercial
Rate of theft per 10,000 registered vehicles
* Rates for these vehicles may be over-estimates as many are not driven on public roads and therefore not registered.
Theft rateNon-recovery rate

80 MOTOR VEHICLE THEFT IN SOUTH AUSTRALIA, 1998.
Table 5.2 Thefts and recoveries of vehicles by manufacturer, 1998.
Manufacturer Stolen Vehicles Recovered VehiclesNumber Theft rate per 10,000
registrationsNumber Non-recovery rate per
10,000 registrationsAlfa Romeo 7 38.4 7 0.0Audi 4 35.2 4 0.0Austin 10 108.5* 9 10.8*Bedford 4 10.1 2 5.0BMW 23 30.9 22 1.3Chevrolet 3 19.5 1 13.0Chrysler 368 186.7 341 13.7Daewoo 8 20.1 8 0.0Daihatsu 30 22.6 30 0.0Datsun 129 45.1 123 2.1Eunos 1 30.7* 1 0.0*Fiat 3 14.0 2 4.7Ford 2,314 103.2 2,055 11.6Harley Davidson 4 18.4 2 9.2Hillman 4 103.1* 4 0.0*Hino 6 20.1 5 3.4Holden 4,540 201.8 4,172 16.4Honda 157 67.7 98 25.5Hyundai 27 18.1 23 2.7International 9 8.7 7 1.9Isuzu 4 33.4 4 0.0Jaguar 13 60.7 8 23.3Jeep 3 25.6 3 0.0Kawasaki 47 131.4 18 81.1Land Rover 6 19.0 5 3.2Leyland 10 38.6 9 3.9M.G. 10 75.1 7 22.5Mazda 490 111.7 459 7.1Mercedes Benz 14 18.6 13 1.3Mitsubishi 430 36.7 396 2.9Morris 12 58.3 11 4.9Nissan 209 39.0 182 5.0Peugeot 1 4.4 1 0.0Porsche 4 42.9* 4 0.0*Renault 7 43.1 7 0.0Rover 8 37.2 8 0.0Saab 6 41.5 6 0.0Subaru 54 40.7 49 3.8Suzuki 91 63.8 52 27.4Toyota 1,180 75.5 1,122 3.7Triumph 4 27.7 4 0.0Vauxhall 2 94.8* 2 0.0*Vespa 2 188.7* 1 94.3*Volkswagen 34 39.5 33 1.2Volvo 15 17.3 13 2.3Yamaha 108 138.7 53 70.7Other 55 20.2 31 8.8Unknown 17 - 11 -Total 10,487 95.3 9,428 9.6
* Indicates that these rates are based on less than 1,000 registrations and readers should use caution when interpreting these figures.
The non-recovery rate represents, for each manufacturer, the number of vehicles stolen and not recovered per 10,000 registrations, ie.
Non-recovery rate = (Number of thefts - Number of recoveries) x 10,000 Number of registered vehicles

VEHICLE CHARACTERISTICS 81
Figure 5.2 Rate of theft per 10,000 registered vehicles by manufacturer, 1998.
0 30 60 90 120 150 180 210
Peugeot
International
Bedford
Fiat
Volvo
Hyundai
Harley Davidson
Mercedes Benz
Land Rover
Chevrolet
Daewoo
Hino
Other
Daihatsu
Jeep
Triumph
Eunos
BMW
Isuzu
Audi
Mitsubishi
Rover
Alfa Romeo
Leyland
Nissan
Volkswagen
Subaru
Saab
Porsche
Renault
Datsun
Morris
Jaguar
Suzuki
Honda
M.G.
Toyota
Vauxhall
Hillman
Ford
Austin
Mazda
Kawasaki
Yamaha
Chrysler
Vespa
Holden
Rate per 10,000 registered vehicles
Theft rateNon-recovery rate

82 MOTOR VEHICLE THEFT IN SOUTH AUSTRALIA, 1998.
Table 5.3 Thefts and recoveries of vehicles by manufacturer and vehicle type, 1998.
Manufacturer Stolen Vehicles Recovered VehiclesNumber % Number %
MotorcyclesBMW 1 0.3 0 0.0Ducati 1 0.3 0 0.0Harley Davidson 4 1.2 2 1.4Honda 105 30.9 46 31.5Kawasaki 47 13.8 18 12.3Suzuki 58 17.1 23 15.8Vespa 2 0.6 1 0.7Yamaha 108 31.8 53 36.3Other 10 2.9 2 1.4Unknown 4 1.2 1 0.7Total - motorcycles 340 100.0 146 100.0
Other vehiclesAlfa Romeo 7 0.1 7 0.1Audi 4 0.0 4 0.0Austin 10 0.1 9 0.1Bedford 4 0.0 2 0.0BMW 22 0.2 22 0.2Chevrolet 3 0.0 1 0.0Chrysler 368 3.6 341 3.7Daewoo 8 0.1 8 0.1Daihatsu 30 0.3 30 0.3Datsun 129 1.3 123 1.3Eunos 1 0.0 1 0.0Fiat 3 0.0 2 0.0Ford 2,314 22.8 2,055 22.1Hillman 4 0.0 4 0.0Hino 6 0.1 5 0.1Holden 4,540 44.7 4,172 44.9Honda 52 0.5 52 0.6Hyundai 27 0.3 23 0.2International 9 0.1 7 0.1Isuzu 4 0.0 4 0.0Jaguar 13 0.1 8 0.1Jeep 3 0.0 3 0.0Land Rover 6 0.1 5 0.1Leyland 10 0.1 9 0.1M.G. 10 0.1 7 0.1Mazda 490 4.8 459 4.9Mercedes Benz 14 0.1 13 0.1Mitsubishi 430 4.2 396 4.3Morris 12 0.1 11 0.1Nissan 209 2.1 182 2.0Peugeot 1 0.0 1 0.0Porsche 4 0.0 4 0.0Renault 7 0.1 7 0.1Rover 8 0.1 8 0.1Saab 6 0.1 6 0.1Subaru 54 0.5 49 0.5Suzuki 33 0.3 29 0.3Toyota 1,180 11.6 1,122 12.1Triumph 4 0.0 4 0.0Vauxhall 2 0.0 2 0.0Volkswagen 34 0.3 33 0.4Volvo 15 0.1 13 0.1Other 35 0.3 32 0.3Unknown 22 0.2 7 0.1Total - other vehicles 10,147 100.0 9,282 100.0

VEHICLE CHARACTERISTICS 83
Table 5.4 Multiple victimisation by manufacturer, 1998.
Manufacturer Stolen once only during 1998 Stolen twice or more during 1998 Total stolen during 1998Number % of manufacturer
theftsNumber % of manufacturer
theftsNumber % of manufacturer
theftsAlfa Romeo 7 100.0 0 0.0 7 100.0Audi 4 100.0 0 0.0 4 100.0Austin 8 88.9 1 11.1 9 100.0Bedford 4 100.0 0 0.0 4 100.0BMW 21 95.5 1 4.5 22 100.0Chevrolet 3 100.0 0 0.0 3 100.0Chrysler 346 96.9 11 3.1 357 100.0Daewoo 8 100.0 0 0.0 8 100.0Daihatsu 26 92.9 2 7.1 28 100.0Datsun 117 95.1 6 4.9 123 100.0Dodge 1 100.0 0 0.0 1 100.0Ducati 1 100.0 0 0.0 1 100.0Eunos 1 100.0 0 0.0 1 100.0Fiat 3 100.0 0 0.0 3 100.0Ford 2,173 96.9 69 3.1 2,242 100.0Harley Davidson 4 100.0 0 0.0 4 100.0Hillman 4 100.0 0 0.0 4 100.0Hino 6 100.0 0 0.0 6 100.0Holden 4,149 95.7 187 4.3 4,336 100.0Honda 150 98.0 3 2.0 153 100.0Hyundai 23 92.0 2 8.0 25 100.0International 9 100.0 0 0.0 9 100.0Isuzu 4 100.0 0 0.0 4 100.0Jaguar 13 100.0 0 0.0 13 100.0Jeep 3 100.0 0 0.0 3 100.0Kawasaki 47 100.0 0 0.0 47 100.0Lada 2 100.0 0 0.0 2 100.0Land Rover 6 100.0 0 0.0 6 100.0Leyland 10 100.0 0 0.0 10 100.0M.G. 10 100.0 0 0.0 10 100.0Mazda 458 96.6 16 3.4 474 100.0Mercedes Benz 14 100.0 0 0.0 14 100.0Mitsubishi 412 97.9 9 2.1 421 100.0Morris 12 100.0 0 0.0 12 100.0Nissan 207 99.5 1 0.5 208 100.0Peugeot 1 100.0 0 0.0 1 100.0Pontiac 2 100.0 0 0.0 2 100.0Porsche 4 100.0 0 0.0 4 100.0Renault 7 100.0 0 0.0 7 100.0Rover 8 100.0 0 0.0 8 100.0Saab 6 100.0 0 0.0 6 100.0Subaru 54 100.0 0 0.0 54 100.0Suzuki 91 100.0 0 0.0 91 100.0Toyota 1,075 95.5 51 4.5 1,126 100.0Triumph 4 100.0 0 0.0 4 100.0Vauxhall 2 100.0 0 0.0 2 100.0Vespa 2 100.0 0 0.0 2 100.0Volkswagen 34 100.0 0 0.0 34 100.0Volvo 13 92.9 1 7.1 14 100.0Yamaha 108 100.0 0 0.0 108 100.0Other 36 97.3 1 2.7 37 100.0Unknown 28 100.0 0 0.0 28 100.0Total 9,741 96.4 361 3.6 10,102 100.0

84 MOTOR VEHICLE THEFT IN SOUTH AUSTRALIA, 1998.
Table 5.5 Thefts and recoveries by year of manufacture, 1998.
Year of manufacture Stolen Vehicles Recovered VehiclesNumber Theft rate per 10,000
registrationsNumber Non-recovery rate per
10,000 registrations< 1960 11 10.4 7 3.8
1960 - 1964 34 36.4 25 9.61965 - 1969 128 62.9 114 6.9Subtotal - 1960s 162 40.2 139 5.7
1970 96 112.6 87 10.61971 101 120.2 93 9.51972 142 155.1 128 15.31973 190 166.0 172 15.71974 281 176.9 264 10.71975 436 211.3 400 17.41976 425 177.4 385 16.71977 466 204.8 430 15.81978 494 179.3 457 13.41979 842 254.7 774 20.6Subtotal - 1970s 3,473 191.5 3,190 15.6
1980 719 204.5 661 16.51981 724 187.2 671 13.71982 665 142.3 610 11.81983 524 116.3 461 14.01984 656 118.8 590 12.01985 667 108.3 606 9.91986 523 121.8 482 9.61987 500 131.9 456 11.61988 350 77.1 316 7.51989 351 69.5 311 7.9Subtotal - 1980s 5,679 123.7 5,164 11.2
1990 257 48.0 230 5.01991 141 34.2 126 3.61992 99 22.9 82 3.91993 111 25.6 83 6.51994 73 15.3 57 3.41995 93 18.2 78 2.91996 102 20.3 80 4.41997 96 18.0 82 2.6Subtotal - 1990-97 972 25.3 818 4.0
1998* 54 - 39 -
Unknown 136 - 71 -
Total 10,487 95.3 9,428 9.6
* A rate has not been calculated for vehicles manufactured in 1998, as most of these vehicles would not have been registered duringthe full reporting period.
The non-recovery rate represents, for each year of manufacture, the number of vehicles stolen and not recovered per 10,000registrations, ie.
Non-recovery rate = (Number of thefts - Number of recoveries) x 10,000 Number of registered vehicles

VEHICLE CHARACTERISTICS 85
Figure 5.3 Rate of theft by year of manufacture, 1998.
0 50 100 150 200 250 300
1997
1996
1995
1994
1993
1992
1991
1990
1989
1988
1987
1986
1985
1984
1983
1982
1981
1980
1979
1978
1977
1976
1975
1974
1973
1972
1971
1970
1965-69
1960-64
< 1960Ye
ar o
f Man
ufac
ture
Rate per 10,000 registered vehicles
Theft rateNon-recovery rate

86 MOTOR VEHICLE THEFT IN SOUTH AUSTRALIA, 1998.
Table 5.6 Thefts and recoveries by year of manufacture and vehicle type, 1998.
Year of manufacture Stolen Vehicles Recovered VehiclesNumber % Number %
Motorcycles <1960 5 1.5 2 1.41960 - 1969 1 0.3 0 0.01970 2 0.6 0 0.01971 1 0.3 1 0.71972 0 0.0 0 0.01973 2 0.6 2 1.41974 0 0.0 0 0.01975 2 0.6 2 1.41976 3 0.9 2 1.41977 2 0.6 2 1.41978 3 0.9 3 2.11979 2 0.6 2 1.41980 11 3.2 3 2.11981 6 1.8 3 2.11982 10 2.9 5 3.41983 11 3.2 7 4.81984 11 3.2 4 2.71985 15 4.4 11 7.51986 5 1.5 2 1.41987 17 5.0 12 8.21988 7 2.1 0 0.01989 11 3.2 5 3.41990 10 2.9 3 2.11991 10 2.9 1 0.71992 10 2.9 3 2.11993 21 6.2 7 4.81994 10 2.9 5 3.41995 8 2.4 3 2.11996 15 4.4 3 2.11997 16 4.7 9 6.21998 15 4.4 5 3.4Unknown 98 28.8 39 26.7
Total - motorcycles 340 100.0 146 100.0
Other vehicles <1960 6 0.1 5 0.11960 - 1969 161 1.6 139 1.51970 94 0.9 87 0.91971 100 1.0 92 1.01972 142 1.4 128 1.41973 188 1.9 170 1.81974 281 2.8 264 2.81975 434 4.3 398 4.31976 422 4.2 383 4.11977 464 4.6 428 4.61978 491 4.8 454 4.91979 840 8.3 772 8.31980 708 7.0 658 7.11981 718 7.1 668 7.21982 655 6.5 605 6.51983 513 5.1 454 4.91984 645 6.4 586 6.31985 652 6.4 595 6.41986 518 5.1 480 5.21987 483 4.8 444 4.81988 343 3.4 316 3.41989 340 3.4 306 3.31990 247 2.4 227 2.41991 131 1.3 125 1.31992 89 0.9 79 0.91993 90 0.9 76 0.81994 63 0.6 52 0.61995 85 0.8 75 0.81996 87 0.9 77 0.81997 80 0.8 73 0.81998 39 0.4 34 0.4Unknown 38 0.4 32 0.3
Total - other vehicles 10,147 100.0 9,282 100.0

VEHICLE CHARACTERISTICS 87
Table 5.7 Multiple victimisation by year of manufacture, 1998.
Years of Stolen once only during 1998 Stolen twice or more during 1998 Total stolen during 1998manufacture Number % of age group
theftsNumber % of age group
theftsNumber % of age group
thefts<1960 11 100.0 0 0.0 11 100.01960s 156 98.1 3 1.9 159 100.01970s 3,141 95.2 160 4.8 3,301 100.01980s 5,306 96.7 181 3.3 5,487 100.01990s 993 98.4 16 1.6 1,009 100.0Unknown 134 99.3 1 0.7 135 100.0Total 9,741 96.4 361 3.6 10,102 100.0
Table 5.8 Rate of theft by year of manufacture for selected makes, 1998.
Year of Rate of theft per 10,000 registered vehiclesmanufacture Ford Holden Mazda Mitsubishi Nissan Toyota<1960 - - - - - -1960 - 1964 20.0 72.7 - - - -1965 - 1969 42.7 122.6 160.0 - - 93.51970 113.4 213.9 708.7 357.1 - 146.31971 79.7 194.0 163.0 - - 195.71972 166.9 277.1 495.0 - - 332.81973 86.6 232.6 354.4 - - 378.51974 172.8 260.7 194.7 - - 424.81975 133.0 351.6 263.9 - - 467.71976 157.6 310.8 206.6 - - 316.81977 174.4 366.0 186.7 - - 281.11978 200.1 316.1 94.2 - - 243.01979 208.7 475.2 305.4 - - 230.01980 161.4 507.0 291.7 - 104.7 143.31981 205.6 420.9 177.1 114.3 416.7 131.51982 158.9 298.5 120.2 86.2 362.1 74.91983 181.1 242.4 125.8 69.7 110.4 41.51984 161.9 272.0 95.8 60.3 50.4 60.91985 166.8 234.2 66.8 51.4 41.8 34.41986 181.5 283.0 77.7 40.5 26.9 37.71987 189.1 307.5 97.1 26.6 31.2 18.51988 95.7 191.5 99.7 26.1 27.7 20.81989 69.6 169.6 142.8 31.3 23.9 28.11990 46.7 119.5 83.2 18.3 11.9 23.21991 24.6 80.6 49.8 27.1 9.2 17.71992 25.3 26.0 28.7 16.3 16.9 16.41993 25.8 28.5 25.5 16.1 10.8 15.11994 13.0 22.6 5.2 12.3 5.4 7.41995 16.4 25.0 5.3 21.6 11.0 7.41996 19.0 26.4 5.6 14.4 18.5 17.31997 8.6 17.5 4.8 16.8 10.9 14.2
A rate has not been calculated for vehicles manufactured in 1998 as most of these vehicles would not have been registered duringthe full reporting period. Makes selected on the basis of the highest number of registrations. Rates are only presented formanufacturer/year combinations with more than 1,000 registrations as at June 30 1998.

88 MOTOR VEHICLE THEFT IN SOUTH AUSTRALIA, 1998.
Figure 5.4 Rate of theft by year of manufacture for selected makes, 1998.
Ford
0
50
100
150
200
250
300
350
400
450
500
1960
- 19
64
1965
- 19
69
1970
1971
1972
1973
1974
1975
1976
1977
1978
1979
1980
1981
1982
1983
1984
1985
1986
1987
1988
1989
1990
1991
1992
1993
1994
1995
1996
1997
Year of manufacture
Rat
e pe
r 10,
000
regi
ster
ed v
ehic
les
Holden
0
50
100
150
200
250
300
350
400
450
500
1960
- 19
64
1965
- 19
69
1970
1971
1972
1973
1974
1975
1976
1977
1978
1979
1980
1981
1982
1983
1984
1985
1986
1987
1988
1989
1990
1991
1992
1993
1994
1995
1996
1997
Year of manufacture
Rat
e pe
r 10,
000
regi
ster
ed v
ehic
les

VEHICLE CHARACTERISTICS 89
Figure 5.4 Rate of theft by year of manufacture for selected makes, 1998. (Continued)
Mazda
0
50
100
150
200
250
300
350
400
450
50019
60 -
1964
1965
- 19
69
1970
1971
1972
1973
1974
1975
1976
1977
1978
1979
1980
1981
1982
1983
1984
1985
1986
1987
1988
1989
1990
1991
1992
1993
1994
1995
1996
1997
Year of manufacture
Rat
e pe
r 10,
000
regi
ster
ed v
ehic
les
Mitsubishi
0
50
100
150
200
250
300
350
400
450
500
1960
- 19
64
1965
- 19
69
1970
1971
1972
1973
1974
1975
1976
1977
1978
1979
1980
1981
1982
1983
1984
1985
1986
1987
1988
1989
1990
1991
1992
1993
1994
1995
1996
1997
Year of manufacture
Rat
e pe
r 10,
000
regi
ster
ed v
ehic
les

90 MOTOR VEHICLE THEFT IN SOUTH AUSTRALIA, 1998.
Figure 5.4 Rate of theft by year of manufacture for selected makes, 1998. (Continued)
Nissan
0
50
100
150
200
250
300
350
400
450
500
1960
- 19
64
1965
- 19
69
1970
1971
1972
1973
1974
1975
1976
1977
1978
1979
1980
1981
1982
1983
1984
1985
1986
1987
1988
1989
1990
1991
1992
1993
1994
1995
1996
1997
Year of manufacture
Rat
e pe
r 10,
000
regi
ster
ed v
ehic
les
Toyota
0
50
100
150
200
250
300
350
400
450
500
1960
- 19
64
1965
- 19
69
1970
1971
1972
1973
1974
1975
1976
1977
1978
1979
1980
1981
1982
1983
1984
1985
1986
1987
1988
1989
1990
1991
1992
1993
1994
1995
1996
1997
Year of manufacture
Rat
e pe
r 10,
000
regi
ster
ed v
ehic
les

VEHICLE CHARACTERISTICS 91
Table 5.9 Number of vehicles stolen and subsequently recovered during 1998 by make, model and year of manufacture. (Passenger and light commercial vehicles only)
Make/Model Year of Manufacture1983 1984 1985 1986 1987 1988 1989 1990 1991 1992 1993 1994 1995 1996 1997 1998 Total
ALFA ROMEOAlfa 33 S - - - 1 - - - - 1 - - - - - - - 2
R - - - 1 - - - - 1 - - - - - - - 2
GTV S 1 - - - - - - - - - - - - - - - 1R 1 - - - - - - - - - - - - - - - 1
AUDI80 S - - - - - - - - - - - - 1 - - - 1
R - - - - - - - - - - - - 1 - - - 1
Unknown/not recorded S - - - - - - - - - - - - - 2 - - 2R - - - - - - - - - - - - - 2 - - 2
BMW318i S - 2 1 - - - - - - 3 - - 1 - - - 7
R - 1 1 - - - - - - 3 - - 1 - - - 6
525i S - - - - - - 1 - - - - - - - - - 1R - - - - - - 1 - - - - - - - - - 1
528i S - - - - - - - - - - - - - - - 1 1R - - - - - - - - - - - - - - - 1 1
540 S - - - - - - - - - - 1 - - - - - 1R - - - - - - - - - - 1 - - - - - 1
735 S - - - - - 1 1 - - - - - - - - - 2R - - - - - 1 1 - - - - - - - - - 2
Unknown/not recorded S 1 1 - 1 - - - - - - - - - - - - 3R 1 1 - 1 - - - - - - - - - - - - 3
DAEWOO1.5i S - - - - - - - - - - - - 1 - - - 1
R - - - - - - - - - - - - 1 - - - 1
Cielo S - - - - - - - - - - - - - 1 2 - 3R - - - - - - - - - - - - - 1 2 - 3
Espero S - - - - - - - - - - - - 1 - - - 1R - - - - - - - - - - - - 1 - - - 1
Lanos S - - - - - - - - - - - - - - 1 - 1R - - - - - - - - - - - - - - 1 - 1
Nubira S - - - - - - - - - - - - - - 1 - 1R - - - - - - - - - - - - - - 1 - 1
Unknown/not recorded S - - - - - - - - - - - - - - - 1 1R - - - - - - - - - - - - - - - 1 1
Continued on next page

92 MOTOR VEHICLE THEFT IN SOUTH AUSTRALIA, 1998.
Table 5.9 Number of vehicles stolen and subsequently recovered during 1998 by make, model and year of manufacture.(Passenger and light commercial vehicles only) Continued
Make/Model Year of Manufacture1983 1984 1985 1986 1987 1988 1989 1990 1991 1992 1993 1994 1995 1996 1997 1998 Total
DAIHATSUApplause S - - - - - - - - - - 1 - - - - - 1
R - - - - - - - - - - 1 - - - - - 1
Charade S 1 1 2 - 1 - 2 2 - - 2 1 - 3 3 - 18R 1 1 2 - 1 - 2 2 - - 2 1 - 3 3 - 18
Feroza S - - - - - - - - - - - - - - - 1 1R - - - - - - - - - - - - - - - 1 1
Handivan S - - - 1 - - - - - - - - - - - - 1R - - - 1 - - - - - - - - - - - - 1
Mira S - - - - - - - - 1 - - - - - - - 1R - - - - - - - - 1 - - - - - - - 1
Unknown/Not recorded S - - 1 - - - - - - - - - - - - - 1R - - 1 - - - - - - - - - - - - - 1
EUNOS30X S - - - - - - - - - - - 1 - - - - 1
R - - - - - - - - - - - 1 - - - - 1FIATRegata S - - - - 1 - - - - - - - - - - - 1
R - - - - 0 - - - - - - - - - - - 0FORDBronco S - - 1 - - - - - - - - - - - - - 1
R - - 1 - - - - - - - - - - - - - 1
Capri S - - - - - - 3 1 2 1 1 - - - - - 8R - - - - - - 3 0 2 1 1 - - - - - 7
Corsair S - - - - - - - 1 - - - - - - - - 1R - - - - - - - 1 - - - - - - - - 1
Courier S 1 1 - 1 1 - - - - 1 - 1 - - - 1 7R 1 1 - 1 1 - - - - 0 - 1 - - - 1 6
Econovan S 1 2 2 - 1 - - 2 - - 2 - - 1 - - 11R 1 2 2 - 1 - - 2 - - 1 - - 1 - - 10
F100 S - - - 1 - - - - - - - - - - - - 1R - - - 0 - - - - - - - - - - - - 0
F150 S - - - - - - 1 1 - - - - - - - - 2R - - - - - - 1 1 - - - - - - - - 2
F250 S - 1 - - - - - - - - - - - - - - 1R - 0 - - - - - - - - - - - - - - 1
Fairmont S 10 16 29 20 25 7 7 2 1 - 2 1 2 - - 122R 10 12 24 18 24 7 4 2 0 - 1 1 2 - - 105
Continued on next page

VEHICLE CHARACTERISTICS 93
Table 5.9 Number of vehicles stolen and subsequently recovered during 1998 by make, model and year of manufacture.(Passenger and light commercial vehicles only) Continued
Make/Model Year of Manufacture1983 1984 1985 1986 1987 1988 1989 1990 1991 1992 1993 1994 1995 1996 1997 1998 Total
FORD (Cont.)Fairlane S 13 7 20 19 23 2 6 1 - 1 2 - 1 1 - - 96
R 13 7 16 17 22 2 3 1 - 1 0 - 1 1 - - 84
Falcon/Futura S 79 104 125 121 109 47 30 22 12 9 10 6 7 13 5 3 702R 67 91 109 113 97 40 24 18 8 7 9 5 7 12 5 3 615
Festiva S - - - - - - - - 1 1 1 2 6 4 2 - 17R - - - - - - - - 1 1 0 1 5 4 1 - 13
Laser S 41 15 27 19 16 21 18 15 5 2 3 1 1 - - - 184R 40 15 25 19 16 21 16 14 5 2 3 1 1 - - - 178
LTD S 1 3 1 1 2 1 - - - - - 1 1 - - - 11R 1 2 1 0 2 1 - - - - - 0 0 - - - 7
Maverick S - - - - - - - - - 1 2 - - - - - 3R - - - - - - - - - 1 1 - - - - - 2
Meteor S 6 3 1 3 4 - - - - - - - - - - - 17R 4 3 1 3 3 - - - - - - - - - - - 14
Mondeo S - - - - - - - - - - - - 1 - - - 1R - - - - - - - - - - - - 0 - - - 0
Spectron S 1 - - - - - - - - - - - - - - - 1R 1 - - - - - - - - - - - - - - - 1
Telstar S 20 30 26 17 12 30 19 11 2 7 3 - - - - - 177R 18 30 25 17 12 29 19 11 2 7 3 - - - - - 173
Unknown/Not recorded S 10 13 10 4 8 2 1 - - - - 1 - 1 - - 50R 8 11 9 4 8 2 1 - - - - 1 - 1 - - 45
HOLDENApollo S - - - - - - - 1 - - - - - - - - 1
R - - - - - - - 1 - - - - - - - - 1
Astra S - 2 3 1 1 2 1 - - - - - - - - - 10R - 2 2 1 1 1 1 - - - - - - - - - 8
Barina S - - - 1 - 1 - - - 2 4 3 2 3 1 1 18R - - - 1 - 1 - - - 1 4 3 2 3 1 0 16
Calais S - 17 16 19 15 14 12 1 2 1 1 - - - - - 98R - 12 14 16 15 11 12 0 1 1 1 - - - - - 83
Camira S 26 21 17 4 6 7 2 - - - - - - - - - 83R 23 21 17 3 5 6 2 - - - - - - - - - 77
Commodore/Berlina S 123 219 227 192 200 136 146 110 57 16 17 18 23 25 14 6 1,529R 111 201 212 181 189 128 136 105 56 16 12 13 20 19 12 5 1,416
Continued on next page

94 MOTOR VEHICLE THEFT IN SOUTH AUSTRALIA, 1998.
Table 5.9 Number of vehicles stolen and subsequently recovered during 1998 by make, model and year of manufacture.(Passenger and light commercial vehicles only) Continued
Make/Model Year of Manufacture1983 1984 1985 1986 1987 1988 1989 1990 1991 1992 1993 1994 1995 1996 1997 1998 Total
HOLDEN (Cont.)Drover 4×4 S - - - 1 - - - - - - - - - - - - 1
R - - - 1 - - - - - - - - - - - - 1
Frontera S - - - - - - - - - - - - - 1 - - 1R - - - - - - - - - - - - - 0 - - 0
Gemini S 23 5 5 4 1 - - - - - - - - - - - 38R 21 5 4 3 1 - - - - - - - - - - - 34
Jackaroo S - - - - - - - - - - 1 - 1 - 1 - 3R - - - - - - - - - - 1 - 1 - 1 - 3
Kingswood ute S - - 1 - - - - - - - - - - - - - 1R - - 1 - - - - - - - - - - - - - 1
Nova S - - - - - - 1 - - - - - - - - - 1R - - - - - - 1 - - - - - - - - - 1
Rodeo S 1 - - - - - 1 - - - - - - 1 1 - 4R 1 - - - - - 0 - - - - - - 1 1 - 3
Shuttle S - - 2 - - - - - - - - - - - - - 2R - - 2 - - - - - - - - - - - - - 2
Statesman S 2 4 2 - - - - 9 2 2 1 1 1 1 - 1 26R 0 2 0 - - - - 9 2 2 1 1 1 1 - 1 20
Ute S - - - - - - - 1 - - - - - - - - 1R - - - - - - - 1 - - - - - - - - 1
Unknown/Not recorded S 6 7 3 3 2 2 1 - - - - - - - - - 24R 6 5 3 3 2 2 0 - - - - - - - - - 21
HONDAAccord S - - - - - - - 1 1 1 3 1 - - - - 7
R - - - - - - - 1 1 1 3 1 - - - - 7
City van S - - 1 - - - - - - - - - - - - - 1R - - 1 - - - - - - - - - - - - - 1
Civic S - 3 - - - - - 1 - - - - - - - - 4R - 2 - - - - - 1 - - - - - - - - 3
Integra S - - - 1 - - - - - - - - - - - - 1R - - - 1 - - - - - - - - - - - - 1
Legend S - - - - - - - - - - - 1 - - - - 1R - - - - - - - - - - - 1 - - - - 1
Prelude S - 2 - - 1 2 1 1 - 1 - - - - 2 - 10R - 2 - - 1 1 1 1 - 1 - - - - 2 - 9
Continued on next page

VEHICLE CHARACTERISTICS 95
Table 5.9 Number of vehicles stolen and subsequently recovered during 1998 by make, model and year of manufacture.(Passenger and light commercial vehicles only) Continued
Make/Model Year of Manufacture1983 1984 1985 1986 1987 1988 1989 1990 1991 1992 1993 1994 1995 1996 1997 1998 Total
HONDA (Cont.)Unknown/not recorded S - 1 - - - - 1 - - - - - 1 - - - 3
R - 1 - - - - 1 - - - - - 0 - - - 2HYUNDAIExcel S - - - 1 - 4 - - - 1 1 - 4 2 6 2 21
R - - - 0 - 3 - - - 1 1 - 4 2 6 2 19
S Coupe S - - - - - - - - - - 1 - - - 1 - 2R - - - - - - - - - - 1 - - - 1 - 2
Lantra S - - - - - - - - 1 1 - - - - - - 2R - - - - - - - - 1 1 - - - - - - 2
Sonata S - - - - - - 1 - - - - - - - 1 - 2R - - - - - - 1 - - - - - - - 1 - 2
JAGUARXJ6/Sovereign S 2 - - - - - 1 - - - - - - - - - 3
R 1 - - - - - 0 - - - - - - - - - 1
XJS S - - - - - 1 1 - - - - - - - - - 2R - - - - - 1 1 - - - - - - - - - 2
JEEPCherokee 4x4 S - - - - - - - - - - - - - - 2 - 2
R - - - - - - - - - - - - - - 2 - 2
LADANiva 4x4 S - - - - 1 - - - - - - - - - - - 1
R - - - - 0 - - - - - - - - - - - 0
Samara S - - - - - - 1 - - - - - - - - - 1R - - - - - - 1 - - - - - - - - - 1
LANDROVERDiscovery S - - - - - - - - - - - - 1 - 1 - 2
R - - - - - - - - - - - - 1 - 1 - 2MAZDA121 S - - - - 1 - - - - - 1 - - - - - 2
R - - - - 1 - - - - - 1 - - - - - 2
323 S 8 2 3 1 - 1 - - - - - 1 - - - - 16R 7 2 3 1 - 1 - - - - - 0 - - - - 14
323 Astina S - - - - - - 1 - - 1 - - - 1 - - 3R - - - - - - 1 - - 1 - - - 1 - - 3
626 S 16 14 10 5 5 7 12 10 4 2 - - - - - - 85R 15 14 10 5 4 7 11 10 4 1 - - - - - - 81
929 S 3 4 2 1 1 - - 1 - - 1 - - - - - 13R 3 4 2 1 1 - - 1 - - 1 - - - - - 13
Bravo S - - - - - - - - - - 1 - 1 - - - 2R - - - - - - - - - - 1 - 1 - - - 2
Continued on next page

96 MOTOR VEHICLE THEFT IN SOUTH AUSTRALIA, 1998.
Table 5.9 Number of vehicles stolen and subsequently recovered during 1998 by make, model and year of manufacture.(Passenger and light commercial vehicles only) Continued
Make/Model Year of Manufacture1983 1984 1985 1986 1987 1988 1989 1990 1991 1992 1993 1994 1995 1996 1997 1998 Total
MAZDA (Cont.)E Series S - - 1 1 1 1 - 1 1 1 - - - - 1 1 9
R - - 1 1 1 1 - 1 1 1 - - - - 1 1 9
MX5 S - - - - - - - 1 1 1 - - - - - 1 4R - - - - - - - 1 0 1 - - - - - 1 3
MX6 S - - - - - 3 6 3 2 1 1 - - - - - 16R - - - - - 3 6 3 2 1 0 - - - - - 15
RX7 S 3 5 - - 1 - - - - - - - - - - - 9R 2 4 - - 1 - - - - - - - - - - 7
Unknown/Not recorded S 1 3 4 4 1 - 1 - - - - - - - - - 14R 1 3 4 3 1 - 1 - - - - - - - - 13
MERCEDES220E S - - - - - - - - - - 2 - - - - - 2
R - - - - - - - - - - 2 - - - - - 2
280 S - 1 - - - - - - - - - - - - - - 1R - 1 - - - - - - - - - - - - - - 1
300S S - - - - 1 - - - - 1 - - - - - - 2R - - - - 1 - - - - 1 - - - - - - 2
380 S - - 1 - - - - - - - - - - - - - 1R - - 1 - - - - - - - - - - - - - 1
500 S - - - - - - - 1 - - - - - - - - 1R - - - - - - - 1 - - - - - - - - 1
Unknown/not recorded S - - 1 - - - - - - - - - - - - - 1R - - 1 - - - - - - - - - - - - - 1
MITSUBISHIColt S 1 4 4 4 2 3 3 - - - - - - - - - 21
R 1 3 4 3 1 3 3 - - - - - - - - - 18
Cordia S 2 4 3 3 - - - - - - - - - - - - 12R 2 4 3 3 - - - - - - - - - - - - 12
Express S 2 - - - 1 2 2 3 2 1 1 - - 1 1 1 17R 1 - - - 1 2 2 3 2 1 1 - - 1 1 1 16
Galant S - - - - - - - - 1 1 1 - - - - - 3R - - - - - - - - 1 1 1 - - - - - 3
L300 Van/Wagon S 1 2 2 1 - - - - - - - - - - - - 6R 1 2 2 1 - - - - - - - - - - - - 6
Lancer S - - - - - - - 1 2 - 3 2 2 2 1 2 15R - - - - - - - 1 2 - 2 2 2 1 1 2 13
Continued on next page

VEHICLE CHARACTERISTICS 97
Table 5.9 Number of vehicles stolen and subsequently recovered during 1998 by make, model and year of manufacture.(Passenger and light commercial vehicles only) Continued
Make/Model Year of Manufacture1983 1984 1985 1986 1987 1988 1989 1990 1991 1992 1993 1994 1995 1996 1997 1998 Total
MITSUBISHI (Cont.)Magna S - - 22 16 11 11 16 9 6 6 3 5 7 4 8 3 127
R - - 20 12 8 8 13 7 6 6 3 5 7 4 8 3 110
Mirage S - - - - - - - - - - - - - - - 1 1R - - - - - - - - - - - - - - - 1 1
Nimbus S - 2 - - - 1 - - - - - - - - - - 3R - 2 - - - 0 - - - - - - - - - - 2
Pajero 4x4 S - 1 2 - - - 1 - - 2 2 - 2 - - - 10R - 1 2 - - - 1 - - 2 2 - 2 - - - 10
Scorpion S 3 4 - - - - - - - - - - - - - - 7R 2 4 - - - - - - - - - - - - - - 6
Sigma S 25 21 11 3 2 - - - - - - - - - - - 62R 23 20 10 3 2 - - - - - - - - - - - 58
Triton S - - - - - - 1 - 1 - 1 - 1 1 1 3 9R - - - - - - 1 - 1 - 1 - 1 1 1 2 8
Verada S - - - - - - - - 3 - - 1 1 - 1 - 6R - - - - - - - - 3 - - 1 1 - 1 - 6
Unknown/Not recorded S 6 3 1 - - 1 1 - - - - - - - 1 - 13R 6 2 1 - - 1 0 - - - - - - - 1 - 11
NISSAN200SX S - - - - - - - - - - - - - 1 - - 1
R - - - - - - - - - - - - - 1 - - 1
280ZX S - 1 - - - - - - - - - - - - - - 1R - 1 - - - - - - - - - - - - - - 1
300ZX S - - - 1 - - - - - - - - - - - - 1R - - - 1 - - - - - - - - - - - - 1
720 ute S - 1 - - - - - - - - - - - - - - 1R - 1 - - - - - - - - - - - - - - 1
Bluebird S 10 10 10 2 - - - - - - - - 1 - - - 33R 10 10 9 2 - - - - - - - - 1 - - - 32
EXA Pulsar S - - - - 4 2 1 - - - - - - - - - 7R - - - - 4 1 1 - - - - - - - - - 6
Gazelle S - 1 1 - - - - - - - - - - - - - 2R - 0 1 - - - - - - - - - - - - - 1
Navara S - - - 2 - 1 3 1 1 1 - - - - 1 - 10R - - - 2 - 1 3 0 1 1 - - - - 1 - 9
Continued on next page

98 MOTOR VEHICLE THEFT IN SOUTH AUSTRALIA, 1998.
Table 5.9 Number of vehicles stolen and subsequently recovered during 1998 by make, model and year of manufacture.(Passenger and light commercial vehicles only) Continued
Make/Model Year of Manufacture1983 1984 1985 1986 1987 1988 1989 1990 1991 1992 1993 1994 1995 1996 1997 1998 Total
NISSAN (Cont.)Nomad S - - - - - 1 - - - - - - - - - - 1
R - - - - - 1 - - - - - - - - - - 1
NX coupe S - - - - - - - - - - - 1 - - - - 1R - - - - - - - - - - - 1 - - - - 1
Pathfinder 4x4 S - - - - - - - - - - 1 - - 1 - - 2R - - - - - - - - - - 1 - - 1 - - 2
Patrol 4x4 S 3 2 - - - - - - - 1 - - - - 1 - 7R 1 1 - - - - - - - 0 - - - - 1 - 3
Pintara S - - - 2 2 - - 2 1 1 - - - - - - 8R - - - 2 2 - - 1 1 1 - - - - - - 7
Prairie S 1 2 - - - - - - - - - - - - - - 3R 1 2 - - - - - - - - - - - - - - 3
Pulsar S 10 3 5 - 1 1 1 3 1 2 1 - 1 1 - - 30R 8 3 4 - 1 1 1 3 1 1 1 - 1 1 - - 26
Skyline S 1 2 - - 1 6 4 - - - - - - - - - 14R 1 2 - - 1 6 3 - - - - - - - - - 13
Urvan S 2 - 2 - - - - - - - - - - - - - 4R 2 - 2 - - - - - - - - - - - - - 4
Vanette S - - - - - 1 - 1 - - - - - - - - 2R - - - - - 0 - 1 - - - - - - - - 1
Unknown/Not recorded S 2 7 3 1 1 - 3 - - - - - - - - - 17R 2 6 3 1 1 - 2 - - - - - - - - - 15
PEUGEOT406 S - - - - - - - - - - - - - - - 1 1
R - - - - - - - - - - - - - - - 1 1PORSCHE928S S 1 - - 1 - - - - - - - - - - - - 2
R 1 - - 0 - - - - - - - - - - - - 1
Boxster S - - - - - - - - - - - - - - - 1 1R - - - - - - - - - - - - - - - 1 1
PROTONPersona S - - - - - - - - - - - - 1 - - - 1
R - - - - - - - - - - - - 1 - - - 1ROVER3500SE S 1 - - - - - - - - - - - - - - - 1
R 1 - - - - - - - - - - - - - - - 1
825Si S - - - - - 1 - - - - - - - - - - 1R - - - - - 1 - - - - - - - - - - 1
Continued on next page

VEHICLE CHARACTERISTICS 99
Table 5.9 Number of vehicles stolen and subsequently recovered during 1998 by make, model and year of manufacture.(Passenger and light commercial vehicles only) Continued
Make/Model Year of Manufacture1983 1984 1985 1986 1987 1988 1989 1990 1991 1992 1993 1994 1995 1996 1997 1998 Total
ROVER (Cont.)Quintet S - 1 - - - - - - - - - - - - - - 1
R - 1 - - - - - - - - - - - - - - 1SAAB900i S 1 - - 1 - 2 - - - - - - - - - - 4
R 1 - - 1 - 2 - - - - - - - - - - 4SEATCordoba S - - - - - - - - - - - - - - 1 - 1
R - - - - - - - - - - - - - - 0 - 0SUBARUBrumby 4x4 S - - - - 2 - - - 1 - - - - - - - 3
R - - - - 2 - - - 1 - - - - - - - 3
Impreza S - - - - - - - - - - - - - - 1 - 1R - - - - - - - - - - - - - - 1 - 1
L series S 2 2 - 1 1 1 - 2 1 - - - - - - - 10R 1 1 - 1 1 1 - 2 1 - - - - - - - 8
Leone S 2 2 - - - - - - - - - - - - - - 4R 2 2 - - - - - - - - - - - - - - 4
Liberty S - - - - - - 1 - 1 1 - - 1 - 1 - 5R - - - - - - 1 - 1 1 - - 1 - 1 - 5
Sherpa S - - - 1 - - - - - - - - - - - - 1R - - - 1 - - - - - - - - - - - - 1
Unknown/not recorded S 2 - - - - - - - - - - - - - - - 2R 1 - - - - - - - - - - - - - - - 1
SUZUKIAlto hatch S - - - - 1 - - - - - - - - - - - 1
R - - - - 1 - - - - - - - - - - - 1
Mighty Boy S - - 1 - 1 - - - - - - - - - - - 2R - - 1 - 1 - - - - - - - - - - - 2
Sierra 4x4 S 1 - - - - 1 1 - - 2 - 1 - - - - 6R 1 - - - - 1 1 - - 1 - 1 - - - - 5
Swift S - - - 1 - - - 2 1 - 1 4 3 - - - 12R - - - 1 - - - 2 1 - 1 3 1 - - - 9
Vitara 4x4 S - - - - - 1 - - - - - - - - - 1 2R - - - - - 1 - - - - - - - - - 1 2
Unknown/not recorded S 2 1 - - - - - - - - - - - - - - 3R 2 1 - - - - - - - - - - - - - - 3
TOYOTA4Runner 4x4 S - - 1 - - - - - - - - - - - - - 1
R - - 1 - - - - - - - - - - - - - 1
Continued on next page
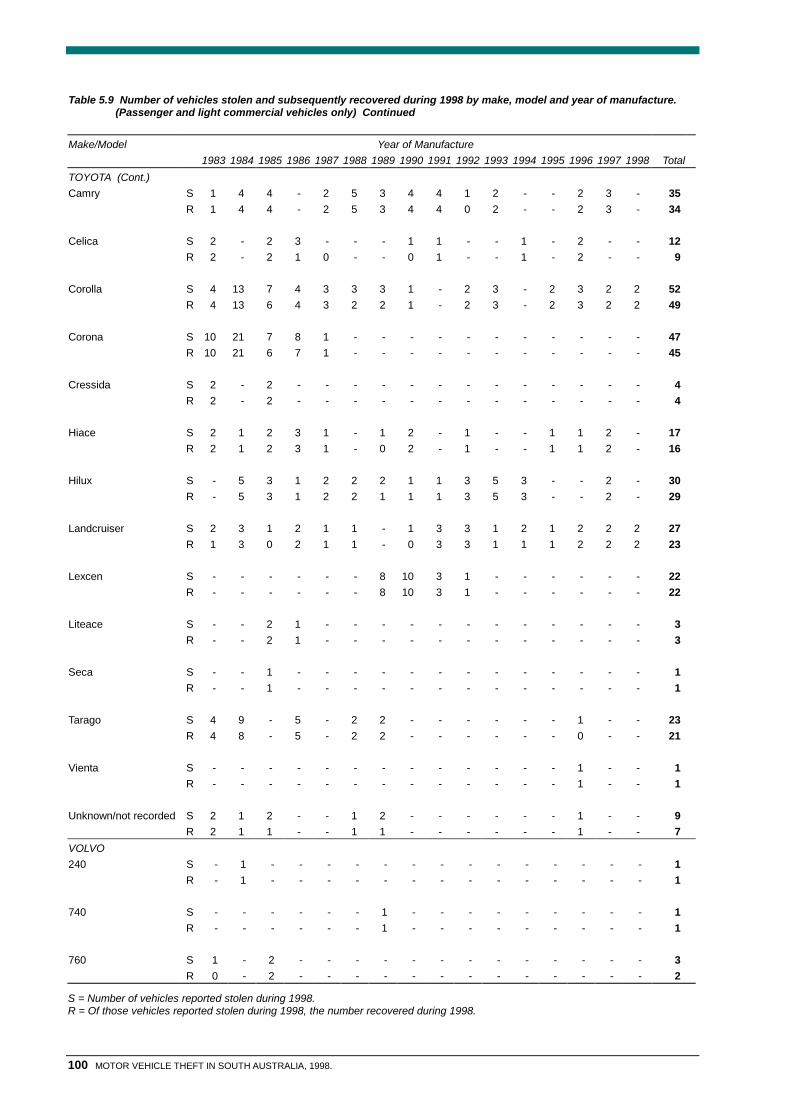
100 MOTOR VEHICLE THEFT IN SOUTH AUSTRALIA, 1998.
Table 5.9 Number of vehicles stolen and subsequently recovered during 1998 by make, model and year of manufacture.(Passenger and light commercial vehicles only) Continued
Make/Model Year of Manufacture1983 1984 1985 1986 1987 1988 1989 1990 1991 1992 1993 1994 1995 1996 1997 1998 Total
TOYOTA (Cont.)Camry S 1 4 4 - 2 5 3 4 4 1 2 - - 2 3 - 35
R 1 4 4 - 2 5 3 4 4 0 2 - - 2 3 - 34
Celica S 2 - 2 3 - - - 1 1 - - 1 - 2 - - 12R 2 - 2 1 0 - - 0 1 - - 1 - 2 - - 9
Corolla S 4 13 7 4 3 3 3 1 - 2 3 - 2 3 2 2 52R 4 13 6 4 3 2 2 1 - 2 3 - 2 3 2 2 49
Corona S 10 21 7 8 1 - - - - - - - - - - - 47R 10 21 6 7 1 - - - - - - - - - - - 45
Cressida S 2 - 2 - - - - - - - - - - - - - 4R 2 - 2 - - - - - - - - - - - - - 4
Hiace S 2 1 2 3 1 - 1 2 - 1 - - 1 1 2 - 17R 2 1 2 3 1 - 0 2 - 1 - - 1 1 2 - 16
Hilux S - 5 3 1 2 2 2 1 1 3 5 3 - - 2 - 30R - 5 3 1 2 2 1 1 1 3 5 3 - - 2 - 29
Landcruiser S 2 3 1 2 1 1 - 1 3 3 1 2 1 2 2 2 27R 1 3 0 2 1 1 - 0 3 3 1 1 1 2 2 2 23
Lexcen S - - - - - - 8 10 3 1 - - - - - - 22R - - - - - - 8 10 3 1 - - - - - - 22
Liteace S - - 2 1 - - - - - - - - - - - - 3R - - 2 1 - - - - - - - - - - - - 3
Seca S - - 1 - - - - - - - - - - - - - 1R - - 1 - - - - - - - - - - - - - 1
Tarago S 4 9 - 5 - 2 2 - - - - - - 1 - - 23R 4 8 - 5 - 2 2 - - - - - - 0 - - 21
Vienta S - - - - - - - - - - - - - 1 - - 1R - - - - - - - - - - - - - 1 - - 1
Unknown/not recorded S 2 1 2 - - 1 2 - - - - - - 1 - - 9R 2 1 1 - - 1 1 - - - - - - 1 - - 7
VOLVO240 S - 1 - - - - - - - - - - - - - - 1
R - 1 - - - - - - - - - - - - - - 1
740 S - - - - - - 1 - - - - - - - - - 1R - - - - - - 1 - - - - - - - - - 1
760 S 1 - 2 - - - - - - - - - - - - - 3R 0 - 2 - - - - - - - - - - - - - 2
S = Number of vehicles reported stolen during 1998.R = Of those vehicles reported stolen during 1998, the number recovered during 1998.

VEHICLE CHARACTERISTICS 101
Table 5.10 Thefts and recoveries by colour of vehicle, 1998.
Colour Stolen Vehicles Recovered VehiclesNumber Theft rate per 10,000
registrationsNumber Non-recovery rate per
10,000 registrationsBlack 108 82.4 86 16.8Blue 1,706 112.0 1,556 9.9Brown 557 155.9 506 14.3Cream 380 139.5 349 11.4Fawn 292 120.4 273 7.0Gold 484 146.8 453 9.4Green 922 97.7 811 11.8Grey 222 75.5 197 8.5Mauve 9 100.8* 9 0.0*Orange 144 113.5 130 11.0Pink 8 71.4 6 17.9Purple 42 150.0 34 28.6Red/Maroon 1,531 91.0 1,345 11.1Silver 732 84.0 673 6.8White 2,682 75.6 2,389 8.3Yellow 662 118.0 607 9.8Unknown 6 7.5 4 2.5Total 10,487 95.3 9,428 9.6
* Indicates that these rates are based on less than 1,000 registrations and readers should use caution when interpreting thesefigures.
The non-recovery rate represents, for each colour, the number of vehicles stolen and not recovered per 10,000 registrations, ie.
Non-recovery rate = (Number of thefts - Number of recoveries) x 10,000 Number of registered vehicles
Table 5.11 Thefts and recoveries by type of number plate, 1998.
Type of plate Stolen Vehicles Recovered VehiclesNumber % Rate/10,000
registrationsNumber %
Custom 12 0.1 41.6 10 0.1Federal 2 0.0 - 1 0.0Government 16 0.2 14.6 16 0.2Grand Prix 6 0.1 53.1 6 0.1Jubilee 2 0.0 18.4 2 0.0Lic. Chauffeur/Hire 3 0.0 55.9* 3 0.0Numeric 25 0.2 55.4 9 0.1Personal 143 1.4 58.9 126 1.3Standard 9,834 93.8 94.3 8,924 94.7Taxi 4 0.0 39.2 2 0.0Tow-truck 3 0.0 309.3* 1 0.0Unknown/unregistered 437 4.2 - 328 3.5Total 10,487 100.0 95.3 9,428 100.0
* Indicates that these rates are based on less than 1,000 registrations and readers should use caution when interpreting thesefigures
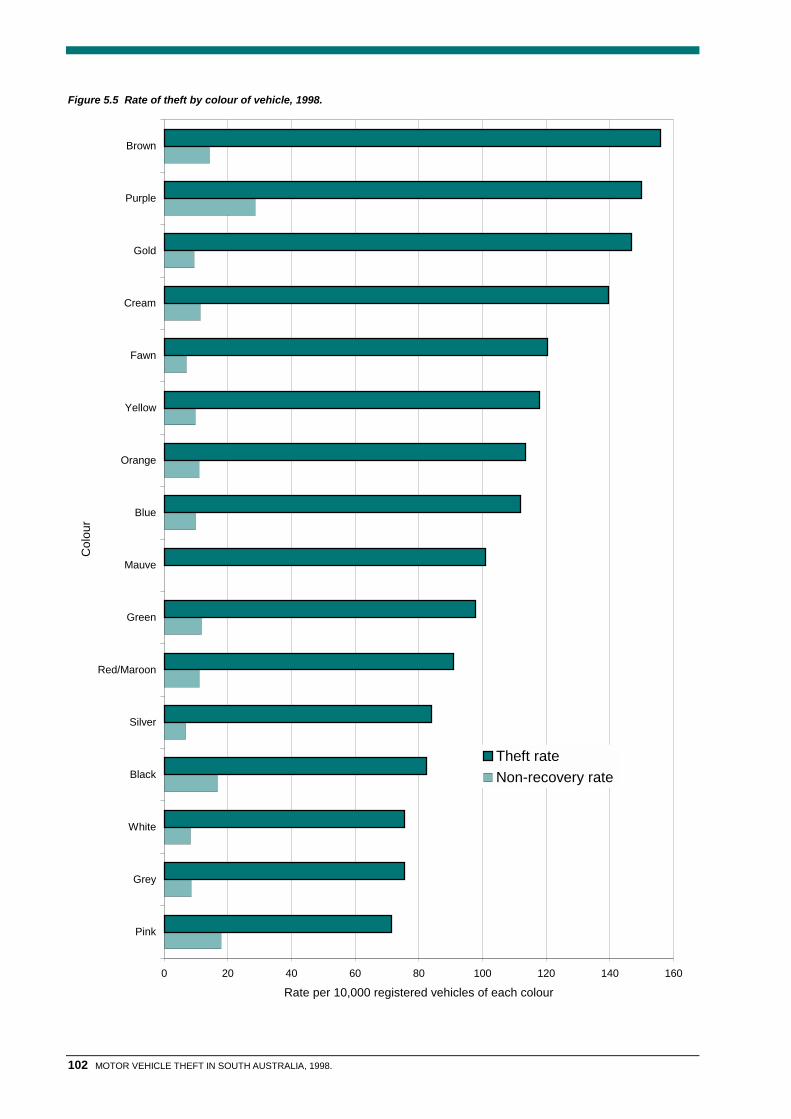
102 MOTOR VEHICLE THEFT IN SOUTH AUSTRALIA, 1998.
Figure 5.5 Rate of theft by colour of vehicle, 1998.
0 20 40 60 80 100 120 140 160
Pink
Grey
White
Black
Silver
Red/Maroon
Green
Mauve
Blue
Orange
Yellow
Fawn
Cream
Gold
Purple
Brown
Col
our
Rate per 10,000 registered vehicles of each colour
Theft rateNon-recovery rate

VEHICLE CHARACTERISTICS 103
Table 5.12 Motorcycle thefts and recoveries by engine size, 1998.
Engine Capacity Stolen Vehicles Recovered Vehicles Recovery RateNumber % Number % %
50 cc or less 32 9.4 10 6.8 31.351 - 100 cc 59 17.4 23 15.8 39.0101 - 150 cc 23 6.8 7 4.8 30.4151 - 200 cc 28 8.2 7 4.8 25.0201 - 250 cc 83 24.4 39 26.7 47.0251 - 500 cc 23 6.8 15 10.3 65.2501 - 750 cc 37 10.9 22 15.1 59.5751 - 1000 cc 10 2.9 12 8.2 120.01001 cc or more 7 2.1 4 2.7 57.1Unknown 38 11.2 7 4.8 18.4Total 340 100.0 146 100.0 42.9
Table 5.13 Thefts and recoveries by fuel type, 1998.
Type of fuel Stolen Vehicles Recovered VehiclesNumber % Rate/10,000
registrationsNumber % Non-recovery rate/
10,000 registrationsDiesel 144 1.4 15.2 128 1.4 1.7Electric 2 0.0 75.2* 2 0.0 0.0*Gas or Gas/Petrol 1,030 9.8 1,080.8 867 9.2 171.0Petrol 9,299 88.7 93.3 8,423 89.3 8.8Unknown 12 0.1 - 8 0.1 -Total 10,487 100.0 95.3 9,428 100.0 9.6
* indicates that these rates are based on less than 1,000 registrations and readers should use caution when interpreting thesefigures
Table 5.14 Thefts and recoveries by type of transmission, 1998.
Type of Stolen Vehicles Recovered Vehiclestransmission Number % % of known cases Number % % of known casesAutomatic 3,358 32.0 57.2 3,008 31.9 56.5Manual 2,514 24.0 42.8 2,314 24.5 43.5Unknown/not rec. 4,615 44.0 - 4,106 43.6 -Total 10,487 100.0 100.0 9,428 100.0 100.0
Table 5.15 Thefts and recoveries by number of cylinders, 1998.
Number of Stolen Vehicles Recovered Vehicles % Recoveredcylinders Number % % of known
casesNumber % % of known
caseswithin each
cylinder group< 4 67 0.6 0.7 35 0.4 0.4 52.24 4,277 40.8 44.8 4,025 42.7 46.1 94.15 4 0.0 0.0 2 0.0 0.0 50.06 4,377 41.7 45.8 4,019 42.6 46.0 91.88 802 7.6 8.4 640 6.8 7.3 79.812 1 0.0 0.0 0 0.0 0.0 0.0Rotary 23 0.2 0.2 17 0.2 0.2 73.9Unknown 936 8.9 - 690 7.3 - 73.7Total 10,487 100.0 100.0 9,428 100.0 100.0 89.9
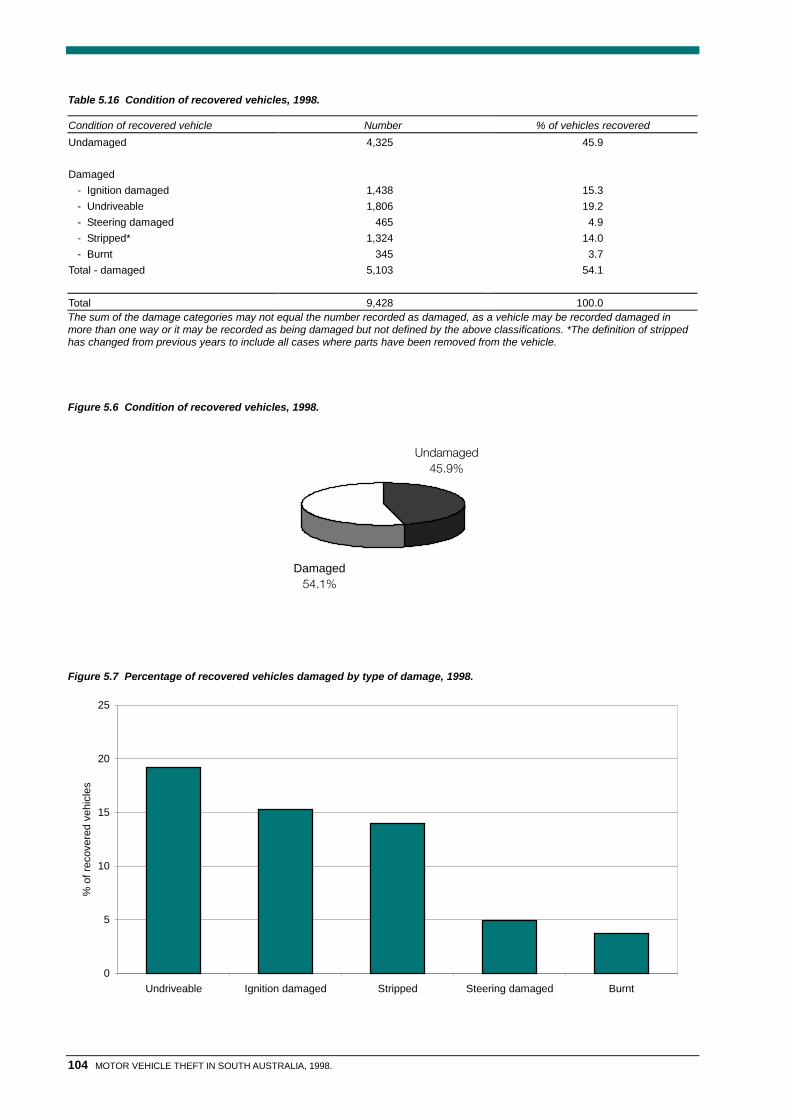
104 MOTOR VEHICLE THEFT IN SOUTH AUSTRALIA, 1998.
Table 5.16 Condition of recovered vehicles, 1998.
Condition of recovered vehicle Number % of vehicles recoveredUndamaged 4,325 45.9
Damaged - Ignition damaged 1,438 15.3 - Undriveable 1,806 19.2 - Steering damaged 465 4.9 - Stripped* 1,324 14.0 - Burnt 345 3.7Total - damaged 5,103 54.1
Total 9,428 100.0The sum of the damage categories may not equal the number recorded as damaged, as a vehicle may be recorded damaged inmore than one way or it may be recorded as being damaged but not defined by the above classifications. *The definition of strippedhas changed from previous years to include all cases where parts have been removed from the vehicle.
Figure 5.6 Condition of recovered vehicles, 1998.
Undamaged45.9%
Damaged54.1%
Figure 5.7 Percentage of recovered vehicles damaged by type of damage, 1998.
0
5
10
15
20
25
Undriveable Ignition damaged Stripped Steering damaged Burnt
% o
f rec
over
ed v
ehic
les

VEHICLE CHARACTERISTICS 105
Table 5.17 Number of vehicles recovered with damage by year of manufacture, 1998.
Year of manufacture Number recovered Number recovered withdamage
% of recovered vehicles thatwere damaged
<1960 7 1 14.3
1960 - 1964 25 8 32.01965 - 1969 114 50 43.9Subtotal - 1960s 139 58 41.7
1970 87 46 52.91971 93 36 38.71972 128 53 41.41973 172 66 38.41974 264 105 39.81975 400 163 40.81976 385 180 46.81977 430 199 46.31978 457 180 39.41979 774 397 51.3Subtotal - 1970s 3,190 1,425 44.7
1980 661 352 53.31981 671 359 53.51982 610 326 53.41983 461 262 56.81984 590 319 54.11985 606 370 61.11986 482 310 64.31987 456 282 61.81988 316 228 72.21989 311 229 73.6Subtotal - 1980s 5,164 3,037 58.8
1990 230 173 75.21991 126 83 65.91992 82 55 67.11993 83 50 60.21994 57 30 52.61995 78 55 70.51996 80 45 56.31997 82 44 53.71998 39 15 38.5Subtotal - 1990s 857 550 64.2
Unknown 71 32 45.1
Total 9,428 5,103 54.1
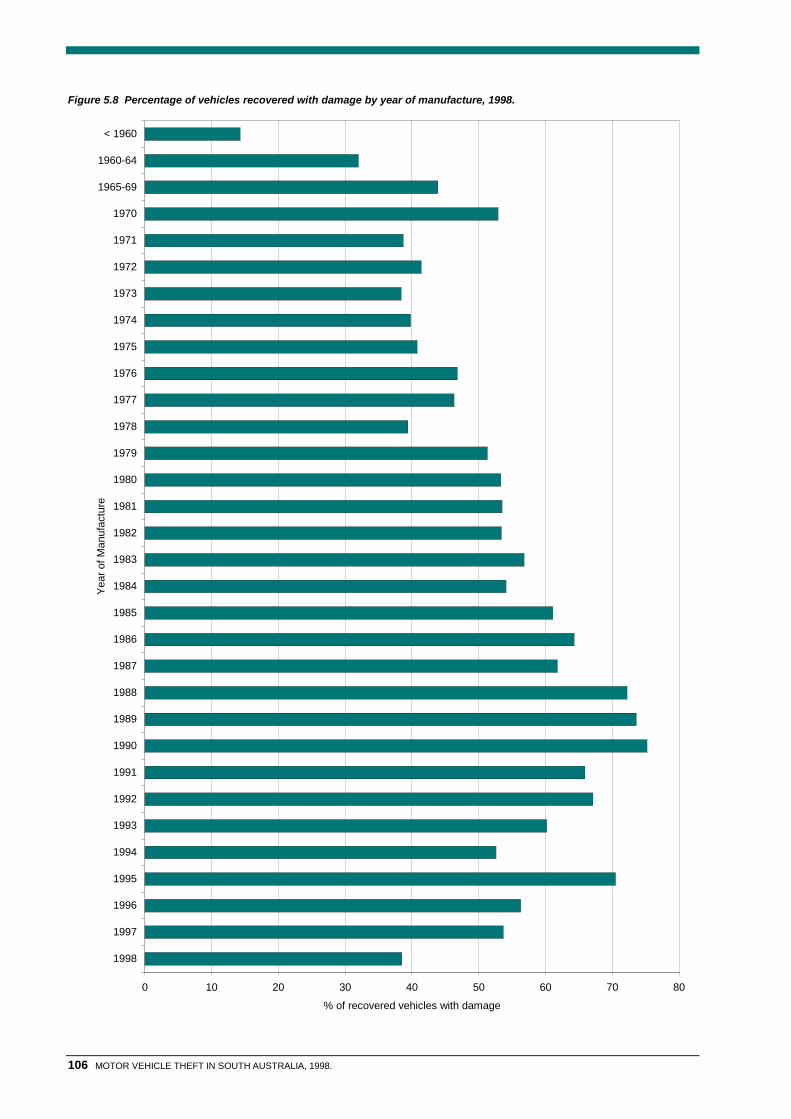
106 MOTOR VEHICLE THEFT IN SOUTH AUSTRALIA, 1998.
Figure 5.8 Percentage of vehicles recovered with damage by year of manufacture, 1998.
0 10 20 30 40 50 60 70 80
1998
1997
1996
1995
1994
1993
1992
1991
1990
1989
1988
1987
1986
1985
1984
1983
1982
1981
1980
1979
1978
1977
1976
1975
1974
1973
1972
1971
1970
1965-69
1960-64
< 1960
Year
of M
anuf
actu
re
% of recovered vehicles with damage

VEHICLE CHARACTERISTICS 107
Table 5.18 Number of vehicles recovered with damage by manufacturer, 1998.
Manufacturer Number recovered Number recovered withdamage
% of recovered vehicles thatwere damaged
Alfa Romeo 7 5 71.4Audi 4 0 0.0Austin 9 4 44.4Bedford 2 1 50.0BMW 22 12 54.5Chevrolet 1 0 0.0Chrysler 341 132 38.7Daewoo 8 2 25.0Daihatsu 30 17 56.7Datsun 123 69 56.1Eunos 1 0 0.0Fiat 2 1 50.0Ford 2,055 1,102 53.6Harley Davidson 2 1 50.0Hillman 4 0 0.0Hino 5 2 40.0Holden 4,172 2,506 60.1Honda 98 49 50.0Hyster 1 0 0.0Hyundai 23 14 60.9International 7 3 42.9Isuzu 4 2 50.0Jaguar 8 7 87.5Jeep 3 1 33.3Kawasaki 18 10 55.6Lancia 1 1 100.0Land Rover 5 0 0.0Leyland 9 4 44.4M.G. 7 4 57.1Mazda 459 273 59.5Mercedes Benz 13 7 53.8Mitsubishi 396 204 51.5Morris 11 5 45.5Nissan 182 97 53.3Peugeot 1 1 100.0Pontiac 2 1 50.0Porsche 4 2 50.0Renault 7 1 14.3Rover 8 4 50.0Saab 6 3 50.0Subaru 49 17 34.7Suzuki 52 28 53.8Toyota 1,122 455 40.6Triumph 4 1 25.0Vauxhall 2 1 50.0Volkswagen 33 10 30.3Volvo 13 4 30.8Vespa 1 1 100.0Yamaha 53 22 41.5Other 30 11 36.7Unknown 8 6 75.0Total 9,428 5,103 54.1
Note: readers should exercise caution when interpreting data for makes with low numbers of thefts.

108 MOTOR VEHICLE THEFT IN SOUTH AUSTRALIA, 1998.
Table 5.19 Parts missing from recovered vehicles, 1998.
Parts missing from recovered vehicles Number % of vehicles recoveredSound equipment 913 9.7Wheels 424 4.5Number plate 278 2.9Trim 180 1.9Mechanical parts 134 1.4Accessories 111 1.2Panels 79 0.8Personal effects 43 0.5Engine 48 0.5Engine numbertampered/damaged/removed
17 0.2
VIN tampered/damaged/removed 17 0.2Chassis No. tampered/damaged/removed 9 0.1
Figure 5.9 Parts missing from recovered vehicles, 1998.
0 1 2 3 4 5 6 7 8 9 10
Chassis No. tampered/damaged/removed
Engine number tampered/damaged/removed
VIN No. tampered/damaged/removed
Engine missing
Personal effects missing
Panels missing
Accessories missing
Mechanical parts missing
Trim missing
Number plates missing
Wheels missing
Sound equipment missing
% of recovered vehicles

VEHICLE CHARACTERISTICS 109
Table 5.20 Means of entry, 1998 (based on recovered vehicles).
Means of entry Recovered vehiclesNumber % % of those with known/recorded
means of entryBreak/smash 306 3.2 15.1Cut 0 0.0 0.0Deception 3 0.0 0.1Jemmied 53 0.6 2.6Keys 308 3.3 15.2Manipulated Lock 1,168 12.4 57.5Removed 4 0.0 0.2Unlocked 188 2.0 9.3Unknown/Not recorded 7,398 78.5 -Total 9,428 100.0 100.0
Table 5.21 Reason for theft, 1998 (based on recovered vehicles).
Reason for theft Recovered vehiclesNumber % % of those with known ‘reason
for theft’Joy riding 5,091 54.0 79.3For other criminal purposes 1,212 12.9 18.9For the purpose of reselling 86 0.9 1.3Not stolen 30 0.3 0.5Unknown 3,009 31.9 -Total 9,428 100.0 100.0
Note: ‘Reason for theft’ is assessed by police at the time of recovery. In addition to the above figures it can be assumed the vastmajority of the 10-15% of vehicles that are never recovered are stolen for the purpose of reselling.
Table 5.22 Thefts and recoveries by presence of anti-theft device, 1998.*
Anti-theft device fitted? Stolen Vehicles Recovered VehiclesNumber % Number %
Yes 1,459 13.9 1,267 13.4No 9,027 86.1 8,157 86.5Unknown 1 0.0 4 0.0Total 10,487 100.0 9,428 100.0
* Police record the presence of an anti-theft device (such as an alarm, engine immobiliser, full metal jacket, steering wheel lock etc.)only if the device is in use at the time of the theft.

110 MOTOR VEHICLE THEFT IN SOUTH AUSTRALIA, 1998.
Table 5.23 Thefts and recoveries by financial encumbrance, 1998.
Financially Stolen Vehicles Recovered Vehiclesencumbered? Number % % of known cases Number % % of known casesYes 1,024 9.8 19.0 910 9.7 18.7No 4,377 41.7 81.0 3,968 42.1 81.3Unknown/not rec. 5,086 48.5 - 4,550 48.3 -Total 10,487 100.0 100.0 9,428 100.0 100.0
Table 5.24 Thefts and recoveries by estimated value of the vehicle, 1998.
Engine Capacity Stolen Vehicles Recovered Vehicles* % recovered withinNumber % Number % each value range
$500 or less 689 6.6 609 6.5 88.4$501 - $1,000 1,291 12.3 1,194 12.7 92.5$1,001 - $2,000 1,883 18.0 1,742 18.5 92.5$2,001 - $3,000 1,525 14.5 1,389 14.7 91.1$3,001 - $4,000 875 8.3 798 8.5 91.2$4,001 - $5,000 943 9.0 816 8.7 86.5Subtotal - $5,000 or less 7,206 68.7 6,548 69.5 90.9
$5,001 - $6,000 513 4.9 449 4.8 87.5$6,001 - $7,000 370 3.5 310 3.3 83.8$7,001 - $8,000 422 4.0 365 3.9 86.5$8,001 - $9,000 229 2.2 205 2.2 89.5$9,001 - $10,000 483 4.6 436 4.6 90.3Subtotal - $5,001 - $10,000 2,017 19.2 1,765 18.7 87.5
$10,001 - $15,000 631 6.0 559 5.9 88.6$15,001 - $20,000 297 2.8 258 2.7 86.9Subtotal - $10,001 -$20,000
928 8.8 817 8.7 88.0
$20,001 - $25,000 131 1.2 114 1.2 87.0$25,001 - $30,000 90 0.9 83 0.9 92.2Subtotal - $20,001 -$30,000
221 2.1 197 2.1 89.1
$30,001 - $40,000 58 0.6 48 0.5 82.8$40,001 - $50,000 25 0.2 23 0.2 92.0$50,001 - $75,000 18 0.2 19 0.2 105.6$75,001 + 14 0.1 11 0.1 78.6Subtotal - $30,001 or more 115 1.1 101 1.1 87.8
Mean value $5,586 $5,522Median value $3,000 $3,000Standard Deviation $8,169 $8,241
Total 10,487 100.0 9,428 89.9
‘Estimated value’ is based on information supplied by the owner at the time of reporting the theft.*Includes vehicles which were stolen in previous years but recovered during current reporting period.

VEHICLE CHARACTERISTICS 111
Figure 5.10 Percentage of thefts by estimated value of the vehicle, 1998.
0
3
6
9
12
15
18
$500
or l
ess
$501
- $1
,000
$1,0
01 -
$2,0
00
$2,0
01 -
$3,0
00
$3,0
01 -
$4,0
00
$4,0
01 -
$5,0
00
$500
1 - $
6,00
0
$6,0
01 -
$7,0
00
$7,0
01 -
$8,0
00
$8,0
01 -
$9,0
00
$9,0
01 -
$10,
000
$10,
001
- $15
,000
$15,
001
- $20
,000
$20,
001
- $25
,000
$25,
001
- $30
,000
$30,
001
- $40
,000
$40,
001
- $50
,000
$50,
001
- $75
,000
$75,
001
+
Estimated value of stolen vehicle
% o
f sto
len
vehi
cles
Figure 5.11 Percentage of recoveries by estimated value of the vehicle at the time of the theft, 1998.
50
60
70
80
90
100
$500
or l
ess
$501
- $1
,000
$1,0
01 -
$2,0
00
$2,0
01 -
$3,0
00
$3,0
01 -
$4,0
00
$4,0
01 -
$5,0
00
$500
1 - $
6,00
0
$6,0
01 -
$7,0
00
$7,0
01 -
$8,0
00
$8,0
01 -
$9,0
00
$9,0
01 -
$10,
000
$10,
001
- $15
,000
$15,
001
- $20
,000
$20,
001
- $25
,000
$25,
001
- $30
,000
$30,
001
- $40
,000
$40,
001
- $50
,000
$50,
001
- $75
,000
$75,
001
+
Estimated value of stolen vehicle
% re
cove
red
with
in v
alue
rang
e

112 MOTOR VEHICLE THEFT IN SOUTH AUSTRALIA, 1998.

113
I N S U R A N C E A N A L Y S E S

114 MOTOR VEHICLE THEFT IN SOUTH AUSTRALIA, 1998.

INSURANCE ANALYSES
INSURANCE ANALYSES 115
Analysis of insurance c laims reveals that the averagepayment to policyholders increased by 5.2% to $4,757 during the last 12months. In addition each claimant had to meet an average of $268 in apolicy excess. Despite this increase insurer’s average total outgoing costsper claim, a figure which in addition to the payment to the policyholderincludes fees and charges relating to towing, hire cars, assessing,investigation etc., declined marginally to $5,611.
Average returns from the salvage of vehicles (i.e. salvage revenue lesssalvage costs) continued to decline with the 1998 figure of $915 being 22%lower than in 1997 value of $1,172 and 48% down on the 1995 figure of$1,767. Structural wrecks returned an average of $392 after costs, whileeconomic wrecks yielded an average of $984 (see Table 6.4).
Table 6.3 shows that recovered vehicles accounted for 70.2% of all claims,with the average outgoing costs to insurers (excluding salvage relatedrevenue and costs) being $4,911. This compares to $7,261 for claimswhere the vehicle was not recovered at the time of settlement.
Two fifths (40.6%) of insurer’s recovered vehicles had suffered accidentand/or arson damage after the theft and prior to recovery. The number ofvehicle theft claims involving arson has been steadily increasing in recentyears. In 1995 cases involving arson constituted 5.8% of all claims, in1996 it was 7.8%, by 1997 it had risen to 10.4% and during 1998 it reached11.8% of all claims. Consequently, the percentage of insurer’s totaloutgoing costs relating to thefts that involved arson has increased from8.8% in 1995 to 17.8% in 1998.
Table 6.6 demonstrates that market value policies comprise the majority oftheft claims (71.5%) followed by agreed value polices (19.2%) and suminsured policies (9.3%). Market value policies incurred an average cost toinsurers of $5,284 per claim of which $870 related to costs additional to thepayments to policy holders while for agreed value claims the average costswere $8,153 of which $1,090 over and above payments to policyholders.
The profile of claims by year of manufacturer presented in Table 6.8indicates that 65.0% are for vehicles manufactured during the 1980s,16.8% for vehicles from the 1970s, and 12.0% for vehicles manufactured in1990s. Stolen vehicles manufactured in the 1990s resulted in the largestaverage costs per claim ($11,335 compared to $5,001 for vehiclesmanufactured in the 1980s and $3,142 for those built in the 1970s).
In addition to an increase in the number of ‘theft and arson’ related claims,and possibly consequently, the proportion of claims which were flagged asbeing suspicious has increased during the last four years. In 1998, 17.7%of claims were regarded as suspicious and possibly fraudulent. Thiscompares with 10.4% during 1997 and only 5.9% during 1995. (It is noted,however, that it is difficult to determine if this is a real rise in the proportionof suspicious claims or the result of increased diligence and scrutiny on thepart of insurers.)

116 MOTOR VEHICLE THEFT IN SOUTH AUSTRALIA, 1998.
Table 6.1 Percentage of victims covered by insurance, 1998.*
Insured? Stolen Vehicles Recovered VehiclesNumber % of total
thefts% of ‘known’
theftsNumber % of total
recoveries% of ‘known’recoveries
Yes 3,600 34.3 61.7 3,198 33.9 60.7No 2,234 21.3 38.3 2,067 21.9 39.3Unknown 4,653 44.4 - 4,163 44.2 -Total 10,487 100.0 100.0 9,428 100.0 100.0
* based on information supplied to Police at the time of reporting the theft.
Table 6.2 Overview of insurance costs, 1998.
Number ofclaims
Percentage ofclaims
Sum$
Average$
Median$
Standarddeviation ($)
Amount of excess actuallyapplied to the claimClaims for which anexcess was imposed
873 95.6 245,042 281 250 103
All claims 913 100.0 245,042 268 250 116Amount of direct payments to policyholders1
Claims for which thepolicyholder receiveda payment
800 87.6 4,342,768 5,428 3,750 5,567
All claims 913 100.0 4,342,768 4,757 3,150 5,509Insurer’s outgoing costs2
All claims 913 100.0 5,122,947 5,611 3,859 5,640Salvage revenueRevenue earned fromsalvage of recoveredvehicles
493 100.0 523,562 1,062 450 2,050
Salvage costsSalvage costs 493 100.0 72,394 147 170 931 Includes only payments made directly to the policyholder, and excludes payments to third parties on behalf of the policyholder.2 Excludes salvage related costs such as towing fees, auction fees.
Table 6.3 Costs incurred to insurer by condition of recovered vehicle, 1998.
Number % Insurer’s outgoing costs ($)of claims of claims Sum of costs Average Median Standard
DeviationRecovered
Accidentdamage
152 16.6 759,258 4,995 4,121 3,417
Arson damage 104 11.4 847,228 8,146 5,237 8,477Accident &arson damage
4 0.4 64,365 16,091 8,174 19,731
Neither accidentnor arson damage
381 41.7 1,476,986 3,877 2,548 1,470
Total recovered 641 70.2 3,147,837 4,911 3,230 5,439
Unrecovered 272 29.8 1,975,110 7,261 5,437 5,769Total 913 100.0 5,122,947 5,611 3,859 5,640

INSURANCE ANALYSES 117
Figure 6.1 Percentage of claims by condition of vehicle, 1998.
0
10
20
30
40
50
60
70
80
Tota
l not
reco
vere
d
Tota
l rec
over
ed
Acci
dent
dam
age
Burn
t
Burn
t & a
ccid
ent
dam
age
Nei
ther
acc
iden
tda
mag
e no
r bur
nt
Perc
enat
ge o
f cla
ims
Figure 6.2 Average cost of insurance claims by condition of vehicle, 1998.
0
3,000
6,000
9,000
12,000
15,000
18,000
Tota
l not
reco
vere
d
Tota
l rec
over
ed
Acci
dent
dam
age
Burn
t
Burn
t & a
ccid
ent
dam
age
Nei
ther
acc
iden
tda
mag
e no
r bur
nt
Aver
age
cost
of c
laim
s ($
)

118 MOTOR VEHICLE THEFT IN SOUTH AUSTRALIA, 1998.
Table 6.4 Salvage revenue and costs by type of salvage, 1998.
Reason for salvage Number of $ obtained for salvage Salvage Costsvehicles Sum ($) Average ($) Median ($) Std. Dev. ($) Sum ($) Average ($) Median ($) Std. Dev. ($)
Structural wreck 112 56,264 502 138 977 12,265 110 100 79Economic wreck 363 414,311 1,141 600 1,930 57,050 157 180 94Other (ie. Recoveredafter claim finalised)
- - - - - - - - -
Unknown 18 52,987 2,944 583 5,493 3,079 171 185 97Total 493 523,562 1,062 450 2,050 72,394 147 170 93
Table 6.5 Costs incurred to insurer by type of cover, 1998.
Number % Insurer’s outgoing costs ($)Comprehensive of claims of claims Sum of costs ($) Average ($) Median ($) Std. Dev. ($)Recovered 492 71.0 2,772,148 5,634 4,023 5,976Unrecovered 201 29.0 1,749,443 8,704 7,288 6,025Total 693 100.0 4,521,591 6,525 4,750 6,146
Number % Insurer’s outgoing costs ($)TPP, Fire & Theft of claims of claims Sum of costs ($) Average ($) Median ($) Std. Dev. ($)Recovered 149 67.7 375,689 2,521 2,200 1,399Unrecovered 71 32.3 225,667 3,178 3,000 1,496Total 220 100.0 601,356 2,733 2,389 1,460
Table 6.6 Costs incurred to insurer by type of policy, 1998.
Type of No. of Direct payments to policyholder ($) Insurer’s outgoing costs ($)Policy claims Average Median s.d. Sum Average Median s.d. SumAgreedvalue
175 7,063 6,000 6,792 1,235,966 8,153 6,688 7,081 1,426,773
Marketvalue
653 4,414 2,958 2,559 2,882,284 5,284 3,615 5,284 3,450,504
Suminsured
85 2,641 2,250 1,655 224,518 2,890 2,597 1,719 245,670
Total 913 4,757 3,150 5,509 4,342,768 5,611 3,859 5,640 5,122,947
Table 6.7 Costs incurred to insurer by purpose of vehicle’s use prior to theft, 1998.
Purpose of vehicle’s use Number % Insurer’s outgoing costs ($)prior to theft of claims of claims Total Costs ($) Average Costs ($) Median Costs ($) Std. Dev. ($)Parked at home 305 33.4 1,721,431 5,644 3,530 6,734Travel to/from work 101 11.1 485,851 4,810 3,750 4,093Business 22 2.4 177,010 8,046 5,850 6,979Shopping 132 14.5 783,589 5,936 4,515 5,025Other 290 31.8 1,620,257 5,587 4,013 4,962Unknown 63 6.9 334,809 5,314 3,622 5,515Total 913 100.0 5,122,947 5,611 3,859 5,640

INSURANCE ANALYSES 119
Table 6.8 Recovery and insurer’s outgoing costs by year of manufacture, 1998.
Year No. No. not Total Insurer’s outgoing costs ($)Built recovered recovered No. % Average Median s.d. Sum of costs< 1960 0 0 0 0.0 - - - -1960 - 64 0 1 1 0.1 17,950 17,950 - 17,9501965 - 69 2 0 2 0.2 1,398 1,398 392 2,7961970 4 1 5 0.5 1,878 2,000 654 9,3911971 1 3 4 0.4 3,260 3,253 1,913 13,0381972 2 4 6 0.7 4,753 4,448 3,420 28,5161973 5 2 7 0.8 3,825 4,948 2,811 26,7741974 8 1 9 1.0 4,604 3,690 4,884 41,4351975 6 7 13 1.4 2,708 2,378 1,692 35,1981976 7 10 17 1.9 3,485 2,750 2,225 59,2431977 10 10 20 2.2 3,507 2,750 3,036 70,1461978 14 8 22 2.4 3,370 3,030 2,219 74,1331979 30 20 50 5.5 2,458 2,091 1,489 122,9181980 38 14 52 5.7 3,184 2,342 4,430 165,5861981 39 8 47 5.1 3,075 2,550 2,179 144,5211982 42 13 55 6.0 3,745 3,430 2,178 205,9991983 30 23 53 5.8 4,209 3,379 2,984 223,0931984 57 19 76 8.3 4,582 3,915 3,036 348,2521985 74 21 95 10.4 5,144 4,450 4,172 488,6681986 54 17 71 7.8 4,996 4,556 3,597 354,7161987 51 17 68 7.4 5,940 5,721 3,197 403,9491988 29 14 43 4.7 6,723 7,095 3,495 289,0851989 25 8 33 3.6 10,352 8,673 11,180 341,6231990 24 8 32 3.5 8,220 8,898 5,843 263,0401991 10 5 15 1.6 12,735 13,425 7,918 191,0231992 2 4 6 0.7 10,843 10,393 7,028 65,0561993 10 5 15 1.6 9,290 6,197 8,268 139,3431994 6 4 10 1.1 14,597 16,050 7,383 145,9681995 6 4 10 1.1 12,687 12,734 8,738 126,8671996 9 2 11 1.2 12,051 11,536 8,657 132,5571997 7 1 8 0.9 17,083 17,322 10,466 136,6661998 3 0 3 0.3 15,436 445 25,965 46,308Unknown 36 18 54 5.9 7,576 4,155 7,466 409,089Total 641 272 913 100.0 5,611 3,859 5,640 5,122,947
Table 6.9 Insurer’s outgoing costs for selected manufacturers, 1998.
Number % Insurer’s outgoing costsManufacturer of claims of claims Sum of costs Average Median Standard deviationHolden 393 43.0 2,093,139 5,326 3,961 4,975Ford 240 26.3 1,257,986 5,242 3,955 5,608Toyota 51 5.6 275,560 5,403 2,550 6,968Mitsubishi 43 4.7 298,493 6,942 5,316 5,330Mazda 37 4.1 164,634 4,450 3,007 4,721Nissan 20 2.2 114,034 5,702 3,926 4,130Honda 13 1.4 70,161 5,397 5,302 4,842Chrysler 11 1.2 20,289 1,844 1,600 616Suzuki 9 1.0 70,765 7,863 5,224 5,809Hyundai 7 0.8 97,268 13,895 13,544 8,083Yamaha 6 0.7 19,493 3,249 2,509 2,051Datsun 4 0.4 5,389 1,347 1,392 664Jaguar 4 0.4 53,154 13,289 10,827 9,761

120 MOTOR VEHICLE THEFT IN SOUTH AUSTRALIA, 1998.
Figure 6.3 Percentage of claims by year of manufacture of the stolen vehicle, 1998.
0
2
4
6
8
10
12<1
960
1960
-64
1965
-69
1970
1971
1972
1973
1974
1975
1976
1977
1978
1979
1980
1981
1982
1983
1984
1985
1986
1987
1988
1989
1990
1991
1992
1993
1994
1995
1996
1997
1998
Year of manufacture
% o
f cla
ims
Figure 6.4 Average cost per claim by year of manufacture of the stolen vehicle, 1998.
0
3,000
6,000
9,000
12,000
15,000
18,000
1960
-64
1965
-69
1970
1971
1972
1973
1974
1975
1976
1977
1978
1979
1980
1981
1982
1983
1984
1985
1986
1987
1988
1989
1990
1991
1992
1993
1994
1995
1996
1997
1998
Year of manufacture
Aver
age
cost
s pe
r cla
im ($
)

INSURANCE ANALYSES 121
Table 6.10 Payments to policyholders and insurer’s outgoing costs for Holden Commodores, 1998.
Year of No. of Direct payments to policyholder ($) Insurer’s outgoing costs ($)manufacture claims Average Median s.d. Sum Average Median s.d. Sum1979 19 2,167 2,019 1,055 41,174 2,392 2,106 991 45,4571980 22 1,920 1,904 1,487 42,247 2,660 2,481 1,285 58,5231981 20 2,498 2,493 1,566 49,958 2,738 2,712 1,483 54,7561982 18 3,339 3,646 1,983 60,110 4,169 4,300 1,832 75,0371983 14 3,617 4,003 2,000 50,638 3,973 3,950 1,672 55,6261984 26 4,066 4,750 2,384 105,723 4,787 5,079 1,903 124,4701985 32 4,007 3,875 3,169 128,222 4,678 4,209 2,911 149,6891986 23 4,825 6,250 3,431 110,969 5,742 6,283 2,636 132,0641987 31 5,363 6,450 4,179 166,249 6,268 6,730 3,588 194,3181988 18 4,463 3,800 4,373 80,338 6,011 5,525 3,819 108,1921989 15 7,318 7,356 7,040 109,774 9,451 8,673 7,578 141,7631990 10 8,639 9,726 8,141 86,387 9,799 9,914 7,273 97,9861991 4 5,477 3,954 6,796 21,907 7,603 7,332 5,558 30,4131992 1 17,150 17,150 - 17,150 17,150 17,150 - 17,1501993 4 14,008 13,634 1,247 56,030 14,463 13,814 1,636 57,8501994 4 13,240 15,025 7,104 52,961 18,518 18,385 3,727 74,0711995 3 16,216 18,250 15,300 48,647 19,659 18,250 11,101 58,9771996 0 - - - - - - - -1997 1 20,200 20,200 - 20,200 20,881 20,881 - 20,8811998 1 44,508 44,508 - 44,508 45,418 45,418 - 45,418Total 266 4,862 3,657 5,354 1,293,192 5,799 4,400 5,360 1,542,641
Table 6.11 Payments to policyholders and insurer’s outgoing costs for Ford Falcons, 1998.
Year of No. of Direct payments to policyholder Insurer’s outgoing costs ($)manufacture claims Average Median s.d. Sum Average Median s.d. Sum1972 1 2,662 2,662 - 2,662 3,142 3,142 - 3,1421973 0 - - - - - - - -1974 0 - - - - - - - -1975 0 - - - - - - - -1976 0 - - - - - - - -1977 1 2,300 2,300 - 2,300 3,000 3,000 - 3,0001978 1 6,050 6,050 - 6,050 7,288 7,288 - 7,2881979 3 4,616 5,000 2,300 13,848 5,049 5,400 2,743 15,1481980 4 2,419 2,239 1,160 9,677 2,663 2,426 1,378 10,6521981 2 3,600 3,600 141 7,200 3,655 3,655 64 7,3091982 7 2,407 3,140 1,802 16,852 4,492 3,821 3,270 31,4411983 8 2,935 3,100 1,811 23,477 3,297 3,352 1,934 26,3731984 15 2,727 2,118 2,407 40,910 3,135 2,600 2,448 47,0291985 19 3,028 3,083 2,329 57,540 3,977 3,363 2,372 75,5591986 13 2,567 1,480 2,971 33,367 3,358 2,837 2,558 43,6481987 15 4,785 4,577 2,055 71,780 5,076 4,625 1,884 76,1461988 8 4,996 6,585 4,268 39,964 6,580 7,667 3,304 52,6411989 3 5,733 7,550 4,837 17,198 6,433 7,550 4,063 19,2981990 4 7,695 9,515 5,425 30,780 8,946 9,687 3,396 35,7831991 2 6,410 6,410 9,065 12,820 8,848 8,848 6,474 17,6951992 0 - - - - - - - -1993 1 13,074 13,074 - 13,074 13,354 13,354 - 13,3541994 1 23,250 23,250 - 23,250 24,544 24,544 - 24,5441995 0 - - - -- - - - -1996 2 13,375 13,375 18,915 26,750 14,659 14,659 19,151 29,3171997 0 - - - - - - - -1998 0 - - - - - - - -Total 110 4,086 3,519 4,219 449,499 4,903 4,000 4,178 539,367
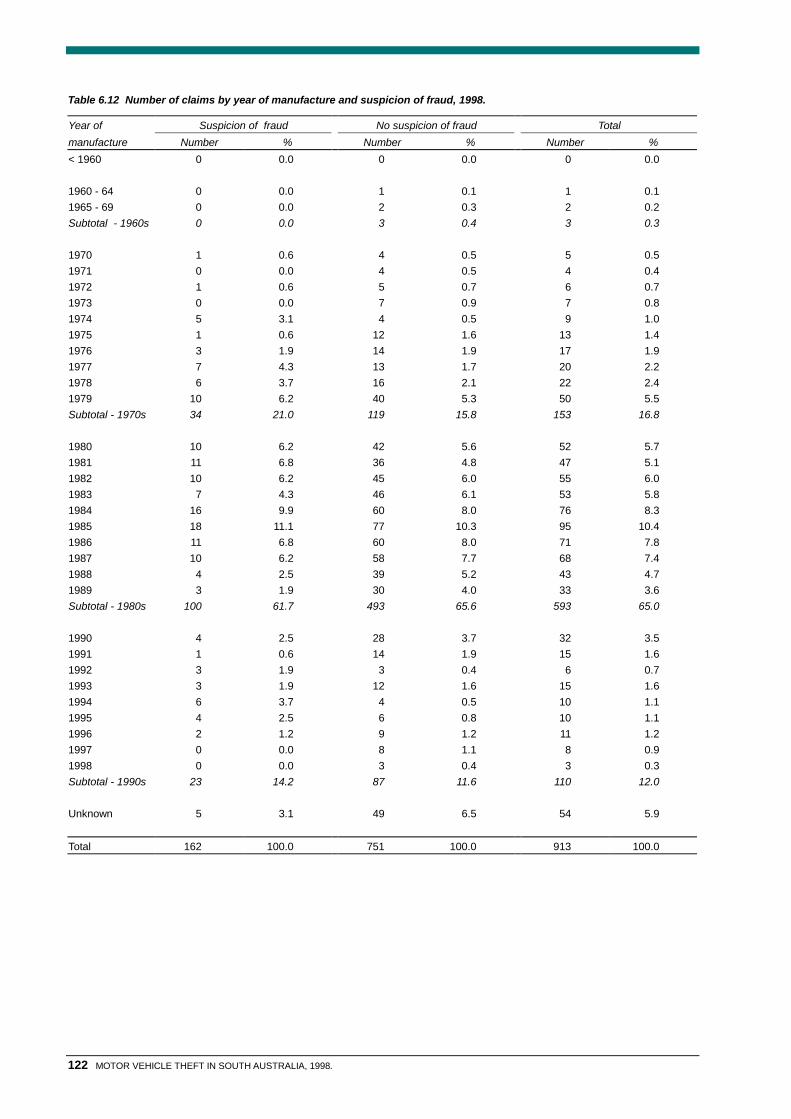
122 MOTOR VEHICLE THEFT IN SOUTH AUSTRALIA, 1998.
Table 6.12 Number of claims by year of manufacture and suspicion of fraud, 1998.
Year of Suspicion of fraud No suspicion of fraud Totalmanufacture Number % Number % Number %< 1960 0 0.0 0 0.0 0 0.0
1960 - 64 0 0.0 1 0.1 1 0.11965 - 69 0 0.0 2 0.3 2 0.2Subtotal - 1960s 0 0.0 3 0.4 3 0.3
1970 1 0.6 4 0.5 5 0.51971 0 0.0 4 0.5 4 0.41972 1 0.6 5 0.7 6 0.71973 0 0.0 7 0.9 7 0.81974 5 3.1 4 0.5 9 1.01975 1 0.6 12 1.6 13 1.41976 3 1.9 14 1.9 17 1.91977 7 4.3 13 1.7 20 2.21978 6 3.7 16 2.1 22 2.41979 10 6.2 40 5.3 50 5.5Subtotal - 1970s 34 21.0 119 15.8 153 16.8
1980 10 6.2 42 5.6 52 5.71981 11 6.8 36 4.8 47 5.11982 10 6.2 45 6.0 55 6.01983 7 4.3 46 6.1 53 5.81984 16 9.9 60 8.0 76 8.31985 18 11.1 77 10.3 95 10.41986 11 6.8 60 8.0 71 7.81987 10 6.2 58 7.7 68 7.41988 4 2.5 39 5.2 43 4.71989 3 1.9 30 4.0 33 3.6Subtotal - 1980s 100 61.7 493 65.6 593 65.0
1990 4 2.5 28 3.7 32 3.51991 1 0.6 14 1.9 15 1.61992 3 1.9 3 0.4 6 0.71993 3 1.9 12 1.6 15 1.61994 6 3.7 4 0.5 10 1.11995 4 2.5 6 0.8 10 1.11996 2 1.2 9 1.2 11 1.21997 0 0.0 8 1.1 8 0.91998 0 0.0 3 0.4 3 0.3Subtotal - 1990s 23 14.2 87 11.6 110 12.0
Unknown 5 3.1 49 6.5 54 5.9
Total 162 100.0 751 100.0 913 100.0

INSURANCE ANALYSES 123
Table 6.13 Number of days between theft and expiry of insurance policy by suspicion of fraud, 1998.
No. of days Suspicion of fraud No suspicion of fraud Totalbetween theft andexpiry of policy
Number % Number % Number %
0 - 14 days 7 4.3 35 4.7 42 4.615 - 30 days 10 6.2 29 3.9 39 4.331 - 60 days 12 7.4 50 6.7 62 6.861 - 90 days 9 5.6 54 7.2 63 6.991 - 120 days 15 9.3 74 9.9 89 9.7121 - 150 days 10 6.2 67 8.9 77 8.4151 - 180 days 16 9.9 53 7.1 69 7.6181 - 210 days 13 8.0 58 7.7 71 7.8211 - 240 days 6 3.7 59 7.9 65 7.1241 - 270 days 13 8.0 67 8.9 80 8.8271 - 300 days 16 9.9 69 9.2 85 9.3301 - 330 days 17 10.5 60 8.0 77 8.4331+ days 18 11.1 75 10.0 93 10.2Unknown 0 0.0 1 0.1 1 0.1Total 162 100.0 751 100.0 913 100.0
Table 6.14 Direct payments to policyholders and insurer’s costs, by suspicion of fraud and recovery of vehicle, 1998.
Recovered? Direct payments to policyholders Costs incurred by insurerSuspicion of
fraudNo suspicion
of fraudTotal Suspicion of
fraudNo suspicion
of fraudTotal
RecoveredNumber 109 532 641 109 532 641Sum ($) 539,043 1,991,657 2,530,700 660,038 2,487,799 3,147,837Average ($) 4,945 3,744 3,948 6,055 4,676 4,911Median ($) 3,250 2,186 2,500 4,035 3,054 3,230Standard deviation ($) 5,148 5,413 5,384 5,383 5,426 5,439
UnrecoveredNumber 53 219 272 53 219 272Sum ($) 366,946 1,445,122 1,812,068 399,476 1,575,634 1,975,110Average ($) 6,924 6,599 6,662 7,537 7,195 7,261Median ($) 5,200 4,900 4,924 6,015 5,250 5,437Standard deviation ($) 5,467 5,317 5,338 5,622 5,814 5,769
TotalNumber 162 751 913 162 751 913Sum ($) 905,989 3,436,779 4,342,768 1,059,514 4,063,433 5,122,947Average ($) 5,593 4,576 4,757 6,540 5,411 5,611Median ($) 3,713 3,000 3,150 4,444 3,729 3,859Standard deviation ($) 5,320 5,536 5,509 5,489 5,655 5,640

124 MOTOR VEHICLE THEFT IN SOUTH AUSTRALIA, 1998.
Figure 6.5 Average cost per claim by recovery and suspicion of fraud, 1998.
0
2,000
4,000
6,000
8,000
10,000
Vehicle Recovered Vehicle Unrecovered Total
Aver
age
cost
s pe
r cla
im ($
)
Claim suspicious Claim not suspicious
Table 6.15 Age and sex of last person to drive the vehicle, 1998.*
Age Males Females Unknown TotalNumber % Number % Number % Number %
<20 50 8.9 10 3.4 0 0.0 60 6.620 - 24 90 16.0 45 15.4 0 0.0 135 14.825 - 29 97 17.3 41 14.0 1 1.7 139 15.230 - 39 108 19.2 61 20.9 1 1.7 170 18.640 - 49 77 13.7 44 15.1 0 0.0 121 13.350 - 59 44 7.8 24 8.2 1 1.7 69 7.660 - 69 12 2.1 6 2.1 0 0.0 18 2.070 + 11 2.0 3 1.0 0 0.0 14 1.5Unknown 73 13.0 58 19.9 56 94.9 187 20.5Total 562 100.0 292 100.0 59 100.0 913 100.0
* based on data from insurance claims.

125
O F F E N D E R P R O F I L E S

126 MOTOR VEHICLE THEFT IN SOUTH AUSTRALIA, 1998

OFFENDER PROFILES
OFFENDER PROFILES 127
his chapter profiles individuals who have been apprehended bypolice during 1998 for either larceny or illegal use of a motor vehicle.The total number of apprehensions increased by 20.1% during the year,from 1,154 apprehensions in 1997 to 1,386 in 1998. Akin with previousyears, each individual was apprehended on average 1.2 times with 1.15counts of larceny or illegal use per apprehension (see Table 7.1).
Juveniles (10 - 17 years old) accounted for 43.9% of all apprehensionsduring 1998, up from 42.5% in 1997 and from 38.3% in 1996. Femalejuvenile offenders accounted for over half (56.4%) of all femaleapprehensions, while for males 42.4% of apprehensions were juvenile(Table 7.2).
Table 7.3 shows the age and sex of unique individuals apprehendedduring 1998. The mean age of female offenders dropped slightly in1998 to 19.0 (from 20.3) years but the average age of male offendersremained the same (21.2 years). The average offender apprehendedby police during 1998 was 20.7 years old, male and at the time ofapprehension had 12.7 prior convictions for any offence and 1.1convictions for larceny or illegal use of a motor vehicle. There was alsoa 29.1% likelihood of having served a previous period of detentionand/or imprisonment for any offence and a 16.6% (up from 6% in 1997)chance of having previously served detention and/or imprisonment for aprevious motor vehicle theft.
Aboriginal people continue to be apprehended at a younger age thannon-Aboriginal offenders with over one fifth (21.4%) of Aboriginalapprehensions involving individuals aged 10 - 14 years, compared withone tenth (10.5%) of non-Aborigines (see Table 7.9). Tables 7.10 -7.12 show that Aboriginal offenders had a higher number of counts oflarceny or illegal use of a motor vehicle per individual and perapprehension and there were more apprehensions per individual thennon-Aboriginal offenders.
Nearly three quarters (73.9%) of alleged offenders had no priorconvictions for motor vehicle theft at the time of their apprehension,although 56.3% did have at least one prior conviction for some otheroffence. Apprehensions that involved offenders with more than fiveprior convictions for motor vehicle theft accounted for 6.5% of allapprehensions.
Analysis of convicted adult vehicle thieves who were re-apprehendedduring 1998 reveals that the average period since their previousconviction for larceny or illegal use of a motor vehicle was 3.9 years(1,415 days). Amongst juveniles the average was approximately 11months (333 days).
T

128 MOTOR VEHICLE THEFT IN SOUTH AUSTRALIA, 1998.
Table 7.1 Number of apprehensions, unique individuals and counts relating to larceny or illegal use of a motor vehicleduring 1998.
Number of apprehensions for larceny or illegal use of a motor vehicle during 1998: 1,386
Number of unique offenders apprehended for larceny or illegal use of a motor vehicle during 1998: 1,123
Number of counts of larceny or illegal use of a motor vehicle arising from individuals apprehended during 1998: 1,589
Average number of counts of illegal use or larceny per apprehension during 1998: 1.15
Average number of counts of illegal use or larceny per unique individual apprehended during 1998: 1.41
Table 7.2 Age and sex of alleged offenders apprehended during 1998 (based on apprehensions).
Age at Female Male Totalapprehension No. % No. % No. %10 0 0.0 4 0.3 4 0.311 0 0.0 3 0.2 3 0.212 8 5.4 20 1.6 28 2.013 7 4.7 41 3.3 48 3.514 24 16.1 68 5.5 92 6.615 23 15.4 93 7.5 116 8.416 16 10.7 151 12.2 167 12.017 6 4.0 145 11.7 151 10.918 11 7.4 115 9.3 126 9.119 5 3.4 73 5.9 78 5.620 - 24 24 16.1 217 17.5 241 17.425 - 29 16 10.7 150 12.1 166 12.030 - 39 7 4.7 130 10.5 137 9.940 + 2 1.3 27 2.2 29 2.1Unknown 0 0.0 0 0.0 0 0.0Total 149 100.0 1,237 100.0 1,386 100.0Mean age 18.9 20.9 20.7
Table 7.3 Age and sex of alleged offenders apprehended during 1998 (based on unique individuals).
Age at Female Male Totalapprehension No. % No. % No. %10 0 0.0 4 0.4 4 0.411 0 0.0 2 0.2 2 0.212 4 2.8 14 1.4 18 1.613 7 5.0 28 2.9 35 3.114 24 17.0 55 5.6 79 7.015 22 15.6 72 7.3 94 8.416 16 11.3 116 11.8 132 11.817 6 4.3 106 10.8 112 10.018 11 7.8 90 9.2 101 9.019 4 2.8 56 5.7 60 5.320 - 24 23 16.3 183 18.6 206 18.325 - 29 15 10.6 120 12.2 135 12.030 - 39 7 5.0 113 11.5 120 10.740 + 2 1.4 23 2.3 25 2.2Unknown 0 0.0 0 0.0 0 0.0Total 141 100.0 982 100.0 1,123 100.0Mean age 19.0 21.2 20.9
Age at time of first apprehension during 1998.
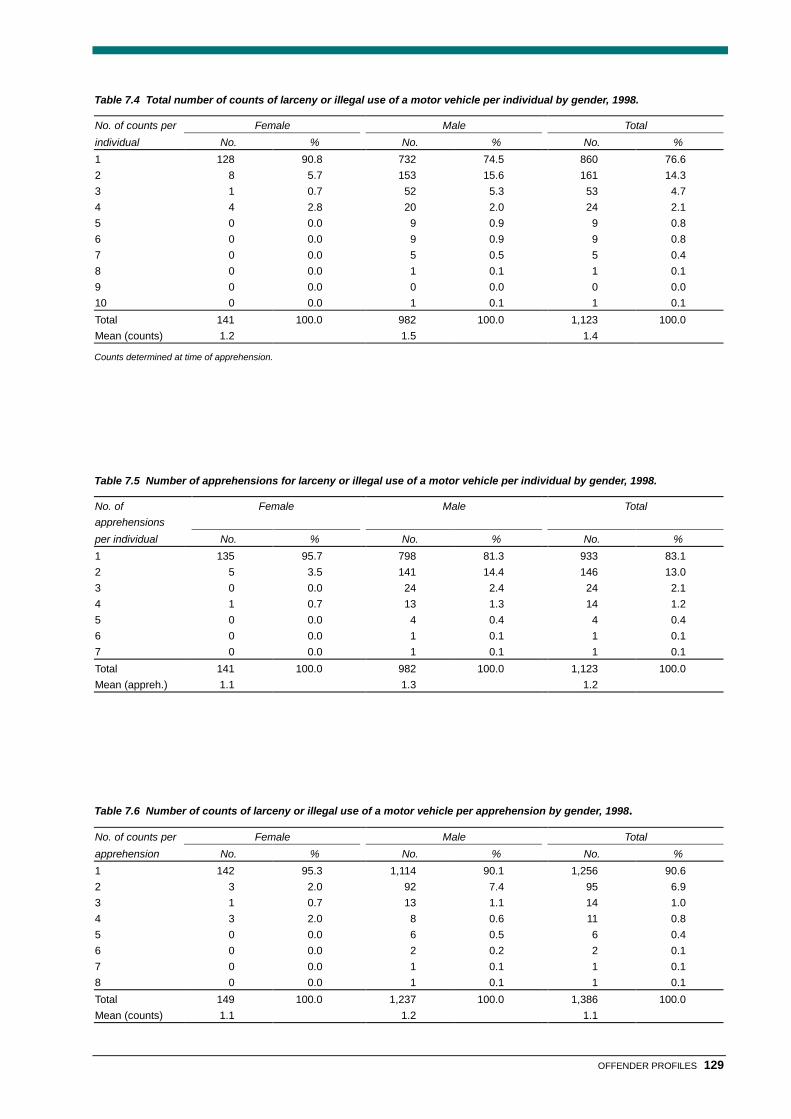
OFFENDER PROFILES 129
Table 7.4 Total number of counts of larceny or illegal use of a motor vehicle per individual by gender, 1998.
No. of counts per Female Male Totalindividual No. % No. % No. %1 128 90.8 732 74.5 860 76.62 8 5.7 153 15.6 161 14.33 1 0.7 52 5.3 53 4.74 4 2.8 20 2.0 24 2.15 0 0.0 9 0.9 9 0.86 0 0.0 9 0.9 9 0.87 0 0.0 5 0.5 5 0.48 0 0.0 1 0.1 1 0.19 0 0.0 0 0.0 0 0.010 0 0.0 1 0.1 1 0.1Total 141 100.0 982 100.0 1,123 100.0Mean (counts) 1.2 1.5 1.4
Counts determined at time of apprehension.
Table 7.5 Number of apprehensions for larceny or illegal use of a motor vehicle per individual by gender, 1998.
No. ofapprehensions
Female Male Total
per individual No. % No. % No. %1 135 95.7 798 81.3 933 83.12 5 3.5 141 14.4 146 13.03 0 0.0 24 2.4 24 2.14 1 0.7 13 1.3 14 1.25 0 0.0 4 0.4 4 0.46 0 0.0 1 0.1 1 0.17 0 0.0 1 0.1 1 0.1Total 141 100.0 982 100.0 1,123 100.0Mean (appreh.) 1.1 1.3 1.2
Table 7.6 Number of counts of larceny or illegal use of a motor vehicle per apprehension by gender, 1998.
No. of counts per Female Male Totalapprehension No. % No. % No. %1 142 95.3 1,114 90.1 1,256 90.62 3 2.0 92 7.4 95 6.93 1 0.7 13 1.1 14 1.04 3 2.0 8 0.6 11 0.85 0 0.0 6 0.5 6 0.46 0 0.0 2 0.2 2 0.17 0 0.0 1 0.1 1 0.18 0 0.0 1 0.1 1 0.1Total 149 100.0 1,237 100.0 1,386 100.0Mean (counts) 1.1 1.2 1.1

130 MOTOR VEHICLE THEFT IN SOUTH AUSTRALIA, 1998.
Table 7.7 Alleged offenders by country of birth, ethnic appearance and sex, 1998.
Country of birth/ Female Male Totalethnic appearance No. % No. % No. %Albania 0 0.0 1 0.1 1 0.1Australia 104 69.8 1,013 81.9 1,117 80.6 - Aboriginal 41 27.5 230 18.6 271 19.6 - Caucasian 63 42.3 757 61.2 820 59.2 - Other 0 0.0 25 2.0 25 1.8 - Unknown 0 0.0 1 0.1 1 0.1Austria 0 0.0 1 0.1 1 0.1Cambodia 1 0.7 3 0.2 4 0.3Fiji 0 0.0 1 0.1 1 0.1Great Britain 0 0.0 15 1.2 15 1.1Greece 1 0.7 2 0.2 3 0.2India 0 0.0 1 0.1 1 0.1Ireland 1 0.7 2 0.2 3 0.2Italy 0 0.0 3 0.2 3 0.2Malaysia 0 0.0 1 0.1 1 0.1New Zealand 0 0.0 6 0.5 6 0.4Poland 0 0.0 2 0.2 2 0.1Thailand 0 0.0 1 0.1 1 0.1United States 0 0.0 1 0.1 1 0.1Vietnam, North 0 0.0 9 0.7 9 0.6Yugoslavia 0 0.0 1 0.1 1 0.1Other 27 18.1 112 9.1 139 10.0Unknown 15 10.1 62 5.0 77 5.6Total 149 100.0 1,237 100.0 1,386 100.0
Based on apprehensions
Table 7.8 Age by ethnic appearance of alleged offenders, 1998 (based on unique individuals).
Age at ap- Aboriginal Caucasian Other Unknown Totalprehension
No. % No. % No. % No. % No. %
10 1 0.5 2 0.2 1 1.9 0 0.0 4 0.411 2 0.9 0 0.0 0 0.0 0 0.0 2 0.212 10 4.7 8 0.9 0 0.0 0 0.0 18 1.613 14 6.5 21 2.5 0 0.0 0 0.0 35 3.114 21 9.8 55 6.5 2 3.7 1 9.1 79 7.015 16 7.5 68 8.1 8 14.8 2 18.2 94 8.416 24 11.2 98 11.6 9 16.7 1 9.1 132 11.817 14 6.5 88 10.4 9 16.7 1 9.1 112 10.018 18 8.4 77 9.1 5 9.3 1 9.1 101 9.019 9 4.2 49 5.8 2 3.7 0 0.0 60 5.320 - 24 40 18.7 159 18.8 5 9.3 2 18.2 206 18.325 - 29 24 11.2 105 12.4 5 9.3 1 9.1 135 12.030 - 39 19 8.9 94 11.1 6 11.1 1 9.1 120 10.740 + 2 0.9 20 2.4 2 3.7 1 9.1 25 2.2Unknown 0 0.0 0 0.0 0 0.0 0 0.0 0 0.0Total 214 100.0 844 100.0 54 100.0 11 100.0 1,123 100.0Mean age(years)
19.7 21.3 20.6 21.8 20.9
Age based on first apprehension during 1998.

OFFENDER PROFILES 131
Table 7.9 Age by ethnic appearance of alleged offenders, 1998 (based on apprehensions).
Age at ap- Aboriginal Caucasian Other Unknown Totalprehension No. % No. % No. % No. % No. %10 1 0.4 2 0.2 1 1.6 0 0.0 4 0.311 3 1.1 0 0.0 0 0.0 0 0.0 3 0.212 14 5.2 14 1.3 0 0.0 0 0.0 28 2.013 18 6.6 27 2.6 3 4.9 0 0.0 48 3.514 22 8.1 67 6.4 2 3.3 1 9.1 92 6.615 24 8.9 81 7.8 9 14.8 2 18.2 116 8.416 32 11.8 124 11.9 10 16.4 1 9.1 167 12.017 24 8.9 116 11.1 10 16.4 1 9.1 151 10.918 21 7.7 99 9.5 5 8.2 1 9.1 126 9.119 14 5.2 62 5.9 2 3.3 0 0.0 78 5.620 - 24 47 17.3 187 17.9 5 8.2 2 18.2 241 17.425 - 29 28 10.3 132 12.7 5 8.2 1 9.1 166 12.030 - 39 21 7.7 108 10.4 7 11.5 1 9.1 137 9.940 + 2 0.7 24 2.3 2 3.3 1 9.1 29 2.1Unknown 0 0.0 0 0.0 0 0.0 0 0.0 0 0.0Total 271 100.0 1,043 100.0 61 100.0 11 100.0 1,386 100.0Mean age(years)
19.3 21.1 20.1 21.8 20.7
Table 7.10 Number of counts of larceny or illegal use of a motor vehicle per individual by ethnic appearance, 1998.
No. of counts/ Aboriginal Caucasian Other Unknown Totalindividual No. % No. % No. % No. % No. %1 155 72.4 648 76.8 46 85.2 11 100.0 860 76.62 36 16.8 119 14.1 6 11.1 0 0.0 161 14.33 11 5.1 42 5.0 0 0.0 0 0.0 53 4.74 4 1.9 18 2.1 2 3.7 0 0.0 24 2.15 2 0.9 7 0.8 0 0.0 0 0.0 9 0.86 4 1.9 5 0.6 0 0.0 0 0.0 9 0.87 1 0.5 4 0.5 0 0.0 0 0.0 5 0.48 1 0.5 0 0.0 0 0.0 0 0.0 1 0.19 0 0.0 0 0.0 0 0.0 0 0.0 0 0.010 0 0.0 1 0.1 0 0.0 0 0.0 1 0.1Total 214 100.0 844 100.0 54 100.0 11 100.0 1,123 100.0Mean 1.5 1.4 1.2 1.0 1.4
Table 7.11 Number of apprehensions for larceny or illegal use of a motor vehicle per individual by ethnic appearance, 1998.
No. of appre-hensions/
Aboriginal Caucasian Other Unknown Total
individual No. % No. % No. % No. % No. %1 170 79.4 703 83.3 49 90.7 11 100.0 933 83.12 36 16.8 106 12.6 4 7.4 0 0.0 146 13.03 5 2.3 19 2.3 0 0.0 0 0.0 24 2.14 2 0.9 11 1.3 1 1.9 0 0.0 14 1.25 0 0.0 4 0.5 0 0.0 0 0.0 4 0.46 1 0.5 0 0.0 0 0.0 0 0.0 1 0.17 0 0.0 1 0.1 0 0.0 0 0.0 1 0.1Total 214 100.0 844 100.0 54 100.0 11 100.0 1,123 100.0Mean 1.3 1.2 1.1 1.0 1.2

132 MOTOR VEHICLE THEFT IN SOUTH AUSTRALIA, 1998.
Table 7.12 Number of counts of larceny or illegal use of a motor vehicle per apprehension by ethnic appearance, 1998.
No. ofcounts/
Aboriginal Caucasian Other Unknown Total
apprehension No. % No. % No. % No. % No. %1 241 88.9 948 90.9 56 91.8 11 100.0 1,256 90.62 21 7.7 69 6.6 5 8.2 0 0.0 95 6.93 1 0.4 13 1.2 0 0.0 0 0.0 14 1.04 4 1.5 7 0.7 0 0.0 0 0.0 11 0.85 2 0.7 4 0.4 0 0.0 0 0.0 6 0.46 1 0.4 1 0.1 0 0.0 0 0.0 2 0.17 1 0.4 0 0.0 0 0.0 0 0.0 1 0.18 0 0.0 1 0.1 0 0.0 0 0.0 1 0.1Total 271 100.0 1,043 100.0 61 100.0 11 100.0 1,386 100.0Mean 1.2 1.1 1.1 1.0 1.1
Table 7.13 Marital status of alleged offenders, 1998.
Marital status Female Male Total No. % No. % No. % % of known
casesSingle 26 17.4 392 31.7 418 30.2 91.5Defacto 2 1.3 26 2.1 28 2.0 6.1Married 0 0.0 6 0.5 6 0.4 1.3Separated 0 0.0 4 0.3 4 0.3 0.9Widowed 1 0.7 0 0.0 1 0.1 0.2Divorced 0 0.0 0 0.0 0 0.0 0.0Unknown 120 80.5 809 65.4 929 67.0 -Total 149 100.0 1,237 100.0 1,386 100.0 100.0
Table 7.14 Employment status of alleged offenders, 1998.
Employment Female Male Totalstatus No. % No. % No. % % of known
casesUnemployed 51 34.2 657 53.1 708 51.1 65.3Student 43 28.9 252 20.4 295 21.3 27.2Employed 1 0.7 38 3.1 39 2.8 3.6Pensioner 8 5.4 32 2.6 40 2.9 3.7Home duties 1 0.7 0 0.0 1 0.1 0.1Other 0 0.0 2 0.2 2 0.1 0.2Unknown 45 30.2 256 20.7 301 21.7 -Total 149 100.0 1,237 100.0 1,386 100.0 100.0

OFFENDER PROFILES 133
Table 7.15 Number of prior convictions for any offence, at the time of apprehension by sex, 1998.
No. of prior Female Male Totalconvictions No. % No. % No. %None 97 65.1 508 41.1 605 43.71 4 2.7 61 4.9 65 4.72 - 5 15 10.1 140 11.3 155 11.26 - 10 10 6.7 125 10.1 135 9.711 - 25 14 9.4 163 13.2 177 12.826 - 50 8 5.4 140 11.3 148 10.751 - 100 1 0.7 88 7.1 89 6.4101 or more 0 0.0 12 1.0 12 0.9Total 149 100.0 1,237 100.0 1,386 100.0Mean (convictions) 4.5 13.6 12.7
Table 7.16 Prior convictions for any offence by age at time of apprehension, 1998. (Numbers)
Age Number of prior convictions for any offence(years) 0 1 2 - 5 6 - 10 11 - 25 26 - 50 51 - 100 101+ Total Average10 4 0 0 0 0 0 0 0 4 0.011 1 0 0 1 1 0 0 0 3 9.012 27 0 1 0 0 0 0 0 28 0.113 36 1 1 6 3 1 0 0 48 2.614 78 2 6 0 3 3 0 0 92 2.115 85 7 8 2 13 1 0 0 116 2.816 122 11 12 8 9 5 0 0 167 2.617 90 7 15 18 13 7 1 0 151 4.718 51 11 21 8 16 18 1 0 126 8.419 22 5 19 14 7 6 5 0 78 11.620 - 24 38 15 35 41 46 37 27 2 241 19.425 - 29 22 3 22 20 35 35 26 3 166 26.230 - 39 19 3 14 13 27 29 25 7 137 30.340 + 10 0 1 4 4 6 4 0 29 19.9Unknown 0 0 0 0 0 0 0 0 0 0.0Total 605 65 155 135 177 148 89 12 1,386 12.7
Table 7.17 Prior convictions for any offence by age at time of apprehension, 1998. (Percentages of each age group)
Age Number of prior convictions for any offence(years) 0 1 2 - 5 6 - 10 11 - 25 26 - 50 51 - 100 101+ Total Average10 100.0 0.0 0.0 0.0 0.0 0.0 0.0 0.0 100.0 0.011 33.3 0.0 0.0 33.3 33.3 0.0 0.0 0.0 100.0 9.012 96.4 0.0 3.6 0.0 0.0 0.0 0.0 0.0 100.0 0.113 75.0 2.1 2.1 12.5 6.3 2.1 0.0 0.0 100.0 2.614 84.8 2.2 6.5 0.0 3.3 3.3 0.0 0.0 100.0 2.115 73.3 6.0 6.9 1.7 11.2 0.9 0.0 0.0 100.0 2.816 73.1 6.6 7.2 4.8 5.4 3.0 0.0 0.0 100.0 2.617 59.6 4.6 9.9 11.9 8.6 4.6 0.7 0.0 100.0 4.718 40.5 8.7 16.7 6.3 12.7 14.3 0.8 0.0 100.0 8.419 28.2 6.4 24.4 17.9 9.0 7.7 6.4 0.0 100.0 11.620 - 24 15.8 6.2 14.5 17.0 19.1 15.4 11.2 0.8 100.0 19.425 - 29 13.3 1.8 13.3 12.0 21.1 21.1 15.7 1.8 100.0 26.230 - 39 13.9 2.2 10.2 9.5 19.7 21.2 18.2 5.1 100.0 30.340 + 34.5 0.0 3.4 13.8 13.8 20.7 13.8 0.0 100.0 19.9Unknown 0.0 0.0 0.0 0.0 0.0 0.0 0.0 0.0 100.0 0.0Total 43.7 4.7 11.2 9.7 12.8 10.7 6.4 0.9 100.0 12.7
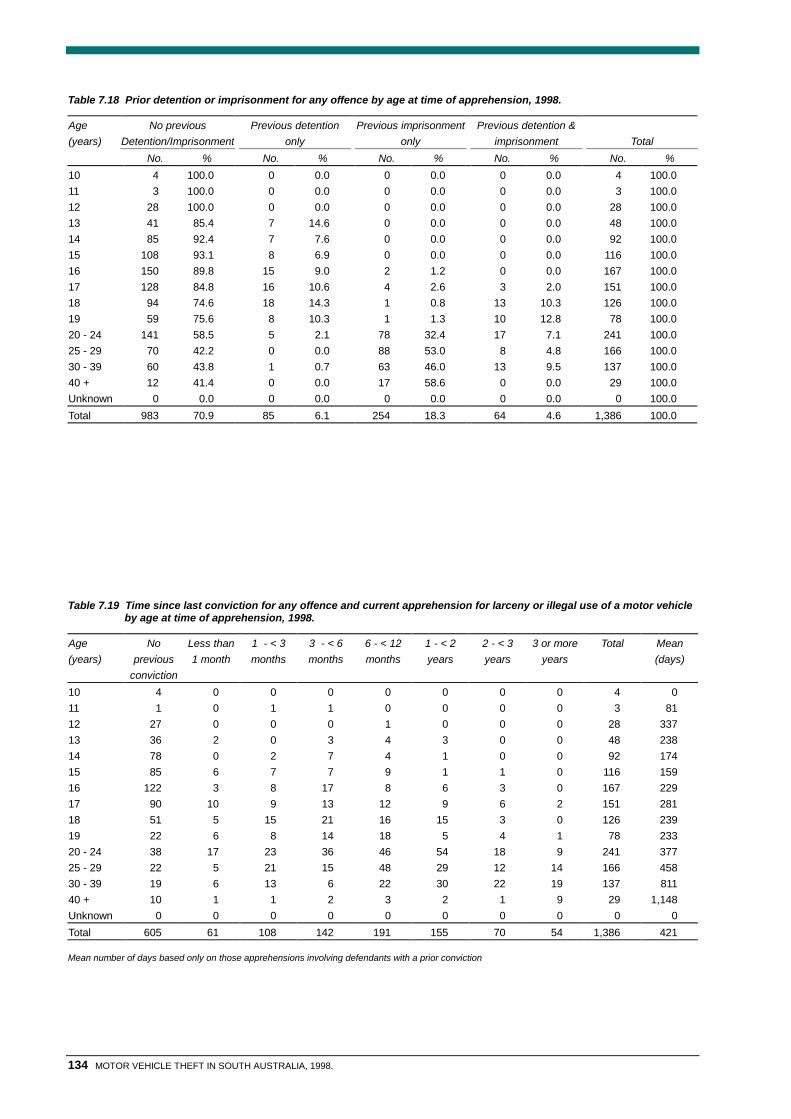
134 MOTOR VEHICLE THEFT IN SOUTH AUSTRALIA, 1998.
Table 7.18 Prior detention or imprisonment for any offence by age at time of apprehension, 1998.
Age(years)
No previousDetention/Imprisonment
Previous detentiononly
Previous imprisonmentonly
Previous detention &imprisonment Total
No. % No. % No. % No. % No. %10 4 100.0 0 0.0 0 0.0 0 0.0 4 100.011 3 100.0 0 0.0 0 0.0 0 0.0 3 100.012 28 100.0 0 0.0 0 0.0 0 0.0 28 100.013 41 85.4 7 14.6 0 0.0 0 0.0 48 100.014 85 92.4 7 7.6 0 0.0 0 0.0 92 100.015 108 93.1 8 6.9 0 0.0 0 0.0 116 100.016 150 89.8 15 9.0 2 1.2 0 0.0 167 100.017 128 84.8 16 10.6 4 2.6 3 2.0 151 100.018 94 74.6 18 14.3 1 0.8 13 10.3 126 100.019 59 75.6 8 10.3 1 1.3 10 12.8 78 100.020 - 24 141 58.5 5 2.1 78 32.4 17 7.1 241 100.025 - 29 70 42.2 0 0.0 88 53.0 8 4.8 166 100.030 - 39 60 43.8 1 0.7 63 46.0 13 9.5 137 100.040 + 12 41.4 0 0.0 17 58.6 0 0.0 29 100.0Unknown 0 0.0 0 0.0 0 0.0 0 0.0 0 100.0Total 983 70.9 85 6.1 254 18.3 64 4.6 1,386 100.0
Table 7.19 Time since last conviction for any offence and current apprehension for larceny or illegal use of a motor vehicleby age at time of apprehension, 1998.
Age(years)
Noprevious
conviction
Less than1 month
1 - < 3months
3 - < 6months
6 - < 12months
1 - < 2years
2 - < 3years
3 or moreyears
Total Mean(days)
10 4 0 0 0 0 0 0 0 4 011 1 0 1 1 0 0 0 0 3 8112 27 0 0 0 1 0 0 0 28 33713 36 2 0 3 4 3 0 0 48 23814 78 0 2 7 4 1 0 0 92 17415 85 6 7 7 9 1 1 0 116 15916 122 3 8 17 8 6 3 0 167 22917 90 10 9 13 12 9 6 2 151 28118 51 5 15 21 16 15 3 0 126 23919 22 6 8 14 18 5 4 1 78 23320 - 24 38 17 23 36 46 54 18 9 241 37725 - 29 22 5 21 15 48 29 12 14 166 45830 - 39 19 6 13 6 22 30 22 19 137 81140 + 10 1 1 2 3 2 1 9 29 1,148Unknown 0 0 0 0 0 0 0 0 0 0Total 605 61 108 142 191 155 70 54 1,386 421
Mean number of days based only on those apprehensions involving defendants with a prior conviction

OFFENDER PROFILES 135
Table 7.20 Number of prior convictions for larceny/illegal use of a motor vehicle, at the time of apprehension by sex, 1998.
No. of prior Female Male Totalconvictions No. % No. % No. %None 135 90.6 889 71.9 1,024 73.91 6 4.0 99 8.0 105 7.62 - 5 7 4.7 160 12.9 167 12.06 - 10 1 0.7 56 4.5 57 4.111 - 25 0 0.0 33 2.7 33 2.426 - 50 0 0.0 0 0.0 0 0.051 - 100 0 0.0 0 0.0 0 0.0Total 149 100.0 1,237 100.0 1,386 100.0Mean (convictions) 0.2 1.2 1.1
Table 7.21 Prior convictions for larceny/illegal use of a motor vehicle by age at time of apprehension, 1998. (Numbers)
Age Number of prior convictions for larceny or illegal use of a motor vehicle(years) 0 1 2 - 5 6 - 10 11 - 25 26 - 50 51+ Total Average10 4 0 0 0 0 0 0 4 0.011 2 1 0 0 0 0 0 3 0.312 28 0 0 0 0 0 0 28 0.013 41 1 6 0 0 0 0 48 0.414 85 3 4 0 0 0 0 92 0.215 97 7 12 0 0 0 0 116 0.316 149 4 12 2 0 0 0 167 0.317 121 13 16 1 0 0 0 151 0.518 94 9 17 6 0 0 0 126 0.819 60 5 3 10 0 0 0 78 1.220 - 24 162 20 30 18 11 0 0 241 1.725 - 29 86 21 32 11 16 0 0 166 2.630 - 39 77 20 27 7 6 0 0 137 1.840 + 18 1 8 2 0 0 0 29 1.2Unknown 0 0 0 0 0 0 0 0 0.0Total 1,024 105 167 57 33 0 0 1,386 1.1
Table 7.22 Prior convictions for larceny/illegal use of a motor vehicle by age at time of apprehension, 1998. (Percentage)
Age Number of prior convictions for larceny or illegal use of a motor vehicle (% of age group)(years) 0 1 2 - 5 6 - 10 11 - 25 26 - 50 51+ Total Average10 100.0 0.0 0.0 0.0 0.0 0.0 0.0 100.0 0.011 66.7 33.3 0.0 0.0 0.0 0.0 0.0 100.0 0.312 100.0 0.0 0.0 0.0 0.0 0.0 0.0 100.0 0.013 85.4 2.1 12.5 0.0 0.0 0.0 0.0 100.0 0.414 92.4 3.3 4.3 0.0 0.0 0.0 0.0 100.0 0.215 83.6 6.0 10.3 0.0 0.0 0.0 0.0 100.0 0.316 89.2 2.4 7.2 1.2 0.0 0.0 0.0 100.0 0.317 80.1 8.6 10.6 0.7 0.0 0.0 0.0 100.0 0.518 74.6 7.1 13.5 4.8 0.0 0.0 0.0 100.0 0.819 76.9 6.4 3.8 12.8 0.0 0.0 0.0 100.0 1.220 - 24 67.2 8.3 12.4 7.5 4.6 0.0 0.0 100.0 1.725 - 29 51.8 12.7 19.3 6.6 9.6 0.0 0.0 100.0 2.630 - 39 56.2 14.6 19.7 5.1 4.4 0.0 0.0 100.0 1.840 + 62.1 3.4 27.6 6.9 0.0 0.0 0.0 100.0 1.2Unknown 0.0 0.0 0.0 0.0 0.0 0.0 0.0 100.0 0.0Total 73.9 7.6 12.0 4.1 2.4 0.0 0.0 100.0 1.1

136 MOTOR VEHICLE THEFT IN SOUTH AUSTRALIA, 1998.
Table 7.23 Prior detention or imprisonment for larceny/illegal use of a motor vehicle by age, 1998.
Age(years)
No previousDetention/Imprisonment
Previous detentiononly
Previous imprisonmentonly
Previous detention &imprisonment
Total
No. % No. % No. % No. % No. %10 4 100.0 0 0.0 0 0.0 0 0.0 4 100.011 3 100.0 0 0.0 0 0.0 0 0.0 3 100.012 28 100.0 0 0.0 0 0.0 0 0.0 28 100.013 41 85.4 7 14.6 0 0.0 0 0.0 48 100.014 87 94.6 5 5.4 0 0.0 0 0.0 92 100.015 112 96.6 4 3.4 0 0.0 0 0.0 116 100.016 162 97.0 5 3.0 0 0.0 0 0.0 167 100.017 140 92.7 8 5.3 3 2.0 0 0.0 151 100.018 110 87.3 16 12.7 0 0.0 0 0.0 126 100.019 65 83.3 6 7.7 1 1.3 6 7.7 78 100.020 - 24 188 78.0 5 2.1 46 19.1 2 0.8 241 100.025 - 29 101 60.8 0 0.0 62 37.3 3 1.8 166 100.030 - 39 95 69.3 0 0.0 40 29.2 2 1.5 137 100.040 + 20 69.0 0 0.0 9 31.0 0 0.0 29 100.0Unknown 0 0.0 0 0.0 0 0.0 0 0.0 0 100.0Total 1,156 83.4 56 4.0 161 11.6 13 0.9 1,386 100.0
Table 7.24 Time since last conviction for larceny or illegal use of a motor vehicle and current apprehension for larceny orillegal use of a motor vehicle by age, 1998.
Age(years)
Noprevious
conviction
Less than1 month
1 - < 3months
3 - < 6months
6 - < 12months
1 - < 2years
2 - < 3years
3 or moreyears
Total Mean(days)
10 4 0 0 0 0 0 0 0 4 011 2 0 0 1 0 0 0 0 3 16712 28 0 0 0 0 0 0 0 28 013 41 1 0 0 4 2 0 0 48 25614 85 0 0 2 3 2 0 0 92 27515 97 2 4 3 5 5 0 0 116 22716 149 0 2 3 8 3 2 0 167 35217 121 3 2 5 7 9 1 3 151 42518 94 1 6 3 6 7 4 5 126 51219 60 0 3 7 2 4 1 1 78 36920 - 24 162 2 2 7 11 18 10 29 241 90325 - 29 86 1 3 2 9 21 12 32 166 1,29930 - 39 77 0 0 0 2 7 8 43 137 2,48040 + 18 1 0 0 0 0 0 10 29 4,471Unknown 0 0 0 0 0 0 0 0 0 0Total 1,024 11 22 33 57 78 38 123 1,386 1,170
Mean number of days based only on those apprehensions involving defendants with a prior conviction

137
R E S P O N S E S B Y T H E C R I M I N A L J U S T I C E S Y S T E M

138 MOTOR VEHICLE THEFT IN SOUTH AUSTRALIA, 1998

RESPONSES BY THE CRIMINAL JUSTICE SYSTEM
RESPONSES BY THE CRIMINAL JUSTICE SYSTEM 139
hapter 8 presents details of the responses by the criminal justicesystem to offenders apprehended by Police. The tables refer to casesfinalised during 1998 and are supplied by the Office of Crime Statistics.
Readers are referred to Appendix B for a brief overview of the currentjuvenile justice system and for advice on interpreting the statisticspresented in this chapter.
During 1998, police took 440 actions against 372 juveniles (aged 10-17years) for larceny or illegal use of a motor vehicle. This compares with362 actions against 307 individuals during 1997. Nearly half (49.5%) ofthe 440 actions during 1998 were against offenders aged between 16and 17 years old. The proportion of offenders transferred to a familyconference declined since 1997 (from 21.5% to 18.0%) while transfersto the Youth Court and formal cautions increased (from 59.4% to 60.7%and from 14.4% to 16.8% respectively). In 1998 nearly two thirds(65.3%) of male defendants were transferred to a Youth Court while16.0% were referred to a family conference. For female defendants36.6% were dealt with at the Youth Court, and 28.2% were referred to afamily conference.
Of those cases transferred to the Youth Court, 77.4% were ‘proven’including 35.3% who were found ‘guilty but had no conviction recorded’.Amongst those cases with charges proven, 13.5% received a period ofdetention as their major penalty (down from 25.8% in 1997) whileanother 20.0% received a suspended detention order. A further 11.8%were ordered to undertake community work with the average periodbeing 64 hours.
Throughout 1998 a total of 85 family conferences involving motorvehicle theft as the major offence were finalised. In all but 1 case(98.8%) the offender agreed to enter into an undertaking.
Aborigines, who were involved in 16.8% of police actions againstjuveniles, were more likely to have had the matter referred to the YouthCourt (71.6% of police actions against Aborigines) compared with non-Aborigines (58.4%).
For adult defendants all cases involving larceny or illegal use of a motorvehicle as the major charge were heard in the Magistrates Court. In53.6% of these cases the defendant was found guilty of their majorcharge, 25.6% had the charge withdrawn and in 13.0% of cases thecharge was dismissed. When sentenced, 30.4% of convicted offenderswere given a period of direct imprisonment (the average length being 28weeks), 42.9% received a suspended term of imprisonment and afurther 6.8% were ordered to undertake a period of community servicework.
C

140 MOTOR VEHICLE THEFT IN SOUTH AUSTRALIA, 1998.
Table 8.1 Juvenile Offenders - Actions by Police: number of actions by major offence charged, 1998.
Offence ActionsNumber %
Larceny of a motor vehicle 19 4.3Illegal use of a motor vehicle 421 95.7Total 440 100.0
Based on 372 individual young offenders who have had at least one contact with police during 1998.
Table 8.2 Juvenile Offenders - Actions by Police: age and sex of offender by major offence alleged, 1998.
Offence Total Total10 11 12 13 14 15 16 17 18+ Unknow
nNo. %
Larceny of a MV 0 0 1 0 3 2 8 5 0 0 19 4.3Illegal use of a MV 2 2 16 36 71 83 104 101 6 0 421 95.7Total 2 2 17 36 74 85 112 106 6 0 440Percentage 0.5 0.5 3.9 8.2 16.8 19.3 25.5 24.1 1.4 0.0 100.0
Females Total10 11 12 13 14 15 16 17 18+ Unknow
nNo. %
Larceny of a MV 0 0 1 0 0 0 1 0 0 0 2 2.8Illegal use of a MV 0 0 5 7 21 20 10 5 1 0 69 97.2Total 0 0 6 7 21 20 11 5 1 0 71Percentage 0.0 0.0 8.5 9.9 29.6 28.2 15.5 7.0 1.4 0.0 100.0
Males Total10 11 12 13 14 15 16 17 18+ Unknow
nNo. %
Larceny of a MV 0 0 0 0 3 2 7 5 0 0 17 4.6Illegal use of a MV 2 2 11 29 50 63 94 96 5 0 352 95.4Total 2 2 11 29 53 65 101 101 5 0 369Percentage 0.5 0.5 3.0 7.9 14.4 17.6 27.4 27.4 1.4 0.0 100.0
Table 8.3 Juvenile Offenders - Actions by police: race and major offence alleged, 1998.
Offence Aboriginal Non-Aboriginal Unknown TotalLarceny of a motor vehicle 0 16 3 19Illegal use of a motor vehicle 74 318 29 421Total 74 334 32 440Percentage 16.8 75.9 7.3 100.0
The classification ‘Aboriginal’ has been assigned by police, not by individuals themselves.

RESPONSES BY THE CRIMINAL JUSTICE SYSTEM 141
Table 8.4 Juvenile Offenders - Actions by Police: sex and type of action by major offence alleged, 1998.
TotalOffence Transferred to
Youth CourtTransferred to
FamilyConference
FormalCaution
Withdrawn Unknown Total Percentage
Larceny of a motor vehicle 13 3 2 0 1 19 4.3Illegal use of a motor vehicle 254 76 72 13 6 421 95.7Total 267 79 74 13 7 440Percentage 60.7 18.0 16.8 3.0 1.6 100.0
FemalesTransferred toYouth Court
Transferred toFamily
Conference
FormalCaution
Withdrawn Unknown Total Percentage
Larceny of a motor vehicle 2 0 0 0 0 2 2.8Illegal use of a motor vehicle 24 20 18 7 0 69 97.2Total 26 20 18 7 0 71Percentage 36.6 28.2 25.4 9.9 0.0 100.0
MalesTransferred toYouth Court
Transferred toFamily
Conference
FormalCaution
Withdrawn Unknown Total Percentage
Larceny of a motor vehicle 11 3 2 0 1 17 4.6Illegal use of a motor vehicle 230 56 54 6 6 352 95.4Total 241 59 56 6 7 369Percentage 65.3 16.0 15.2 1.6 1.9 100.0
Table 8.5 Juvenile Offenders - Actions by Police: age and sex of offender by type of action, 1998 (Larceny & illegal usecombined).
Action Total Total10 11 12 13 14 15 16 17 18+ Unknown No. %
Refer to Youth Court 1 2 10 22 44 49 61 76 2 0 267 60.7Refer to Family Conf. 0 0 0 6 14 16 24 17 2 0 79 18.0Formal Caution 1 0 5 5 14 17 23 9 0 0 74 16.8Withdrawn 0 0 1 3 2 2 3 0 2 0 13 3.0Unknown 0 0 1 0 0 1 1 4 0 0 7 1.6Total 2 2 17 36 74 85 112 106 6 0 440Percentage 0.5 0.5 3.9 8.2 16.8 19.3 25.5 24.1 1.4 0.0 100.0
Females Total10 11 12 13 14 15 16 17 18+ Unknown No. %
Refer to Youth Court 0 0 3 3 8 6 4 1 1 0 26 36.6Refer to Family Conf. 0 0 0 1 7 8 3 1 0 0 20 28.2Formal Caution 0 0 2 1 4 5 3 3 0 0 18 25.4Withdrawn 0 0 1 2 2 1 1 0 0 0 7 9.9Unknown 0 0 0 0 0 0 0 0 0 0 0 0.0Total 0 0 6 7 21 20 11 5 1 0 71Percentage 0.0 0.0 8.5 9.9 29.6 28.2 15.5 7.0 1.4 0.0 100.0
Males Total10 11 12 13 14 15 16 17 18+ Unknown No. %
Refer to Youth Court 1 2 7 19 36 43 57 75 1 0 241 65.3Refer to Family Conf. 0 0 0 5 7 8 21 16 2 0 59 16.0Formal Caution 1 0 3 4 10 12 20 6 0 0 56 15.2Withdrawn 0 0 0 1 0 1 2 0 2 0 6 1.6Unknown 0 0 1 0 0 1 1 4 0 0 7 1.9Total 2 2 11 29 53 65 101 101 5 0 369Percentage 0.5 0.5 3.0 7.9 14.4 17.6 27.4 27.4 1.4 0.0 100.0

142 MOTOR VEHICLE THEFT IN SOUTH AUSTRALIA, 1998.
Table 8.6 Juvenile Offenders - Actions by Police: race and type of action by major offence alleged, 1998.
AboriginalOffence Transferred to
Youth CourtTransferred to
FamilyConference
Formal Caution Withdrawn Unknown Total
Larceny of a motor vehicle 0 0 0 0 0 0Illegal use of a motor vehicle 53 8 9 1 3 74Total 53 8 9 1 3 74Percentage 71.6 10.8 12.2 1.4 4.1 100.0
Non-AboriginalTransferred toYouth Court
Transferred toFamily
Conference
Formal Caution Withdrawn Unknown Total
Larceny of a motor vehicle 11 3 2 0 0 16Illegal use of a motor vehicle 184 64 56 11 3 318Total 195 67 58 11 3 334Percentage 58.4 20.1 17.4 3.3 0.9 100.0
In addition there were 29 major charges of ‘illegal use of a motor vehicle’ and 3 major charges of ‘larceny of a motor vehicle’ where ethnicity was unknown.The classification ‘Aboriginal’ has been assigned by police, not by individuals themselves.
Table 8.7 Juvenile Offenders - Youth Court: cases finalised by major offence charged, 1998.
Offence CasesNumber %
Larceny of a motor vehicle 3 1.6Illegal use of a motor vehicle 187 98.4Total 190 100.0
Table 8.8 Juvenile Offenders - Youth Court: court outcome for the major offence charged, 1998.
Offence Proven Not Proven TotalConvicted Not Convicted Acquitted Dismissed Withdrawn, not
proceededwith,
no action takenLarceny of a motor vehicle 1 1 0 0 1 3Illegal use of a motor vehicle 79 66 1 6 35 187Total 80 67 1 6 36 190Percentage 42.1 35.3 0.5 3.2 18.9 100.0

RESPONSES BY THE CRIMINAL JUSTICE SYSTEM 143
Table 8.9 Juvenile Offenders - Youth Court: Appearances where major offence proved by major penalty imposed for majorcharge, 1998.
Offence Detention Detention
suspend.
Community
Service
Order
Obligation Licence
Disquali-
fication
Fine Compensati
on
Other
Order
Dismissed
without
penalty
Total
Larceny of a MV 0 0 0 1 0 1 0 0 1 3Illegal use of a MV 23 34 20 64 25 0 1 0 0 167Total 23 34 20 65 25 1 1 0 1 170Percentage 13.5 20.0 11.8 38.2 14.7 0.6 0.6 0.0 0.6 100.0
Major offence Fine ($) Community Service Order (Hours) Compensation ($)
charged No. Min. Average Max. No. Min. Average Max No. Min. Average Max.
Larceny of a MV 1 250 250 250 0 - - - 0 - - -Illegal use of a MV 0 - - - 20 20 64 160 1 220 220 220Total 1 250 250 250 20 20 64 160 1 220 220 220Percentage 0.6 11.8 0.6
Table 8.10 Juvenile Offenders - Youth Court: age and sex of defendant by major offence charged, 1998.
Offence Total Total10 11 12 13 14 15 16 17 18+ Unknow
nNo. %
Larceny of a MV 0 0 0 0 0 1 1 1 0 0 3 1.6Illegal use of a MV 0 3 2 16 26 38 45 56 0 1 187 98.4Total 0 3 2 16 26 39 46 57 0 1 190Percentage 0.0 1.6 1.1 8.4 13.7 20.5 24.2 30.0 0.0 0.5 100.0
Females Total10 11 12 13 14 15 16 17 18+ Unknow
nNo. %
Larceny of a MV 0 0 0 0 0 0 0 0 0 0 0 0.0Illegal use of a MV 0 0 0 5 4 4 4 3 0 1 21 100.0Total 0 0 0 5 4 4 4 3 0 1 21Percentage 0.0 0.0 0.0 23.8 19.0 19.0 19.0 14.3 0.0 4.8 100.0
Males Total10 11 12 13 14 15 16 17 18+ Unknow
nNo. %
Larceny of a MV 0 0 0 0 0 1 1 1 0 0 3 1.8Illegal use of a MV 0 3 2 11 21 34 41 53 0 0 165 98.2Total 0 3 2 11 21 35 42 54 0 0 168Percentage 0.0 1.8 1.2 6.5 12.5 20.8 25.0 32.1 0.0 0.0 100.0
In addition there was 1 major charge of ‘illegal use of a motor vehicle’ where sex was unknown. Age is at date of offence.

144 MOTOR VEHICLE THEFT IN SOUTH AUSTRALIA, 1998.
Table 8.11 Juvenile Offenders - Youth Court: age and sex by race of defendant, 1998 (larceny and illegal use of a motorvehicle combined).
Race Total Total10 11 12 13 14 15 16 17 18+ Unknow
nNo. %
Aboriginal 0 1 1 5 7 9 11 10 0 0 44 23.2Non-Aboriginal 0 2 1 11 18 30 34 47 0 1 144 75.8Unknown 0 0 0 0 1 0 1 0 0 0 2 1.1Total 0 3 2 16 26 39 46 57 0 1 190Percentage 0.0 1.6 1.1 8.4 13.7 20.5 24.2 30.0 0.0 0.5 100.0
Females Total10 11 12 13 14 15 16 17 18+ Unknow
nNo. %
Aboriginal 0 0 0 0 2 1 2 1 0 0 6 28.6Non-Aboriginal 0 0 0 5 2 3 1 2 0 1 14 66.7Unknown 0 0 0 0 0 0 1 0 0 0 1 4.8Total 0 0 0 5 4 4 4 3 0 1 21Percentage 0.0 0.0 0.0 23.8 19.0 19.0 19.0 14.3 0.0 4.8 100.0
Males Total10 11 12 13 14 15 16 17 18+ Unknow
nNo. %
Aboriginal 0 1 1 5 5 8 9 9 0 0 38 22.6Non-Aboriginal 0 2 1 6 16 27 33 45 0 0 130 77.4Unknown 0 0 0 0 0 0 0 0 0 0 0 0.0Total 0 3 2 11 21 35 42 54 0 0 168Percentage 0.0 1.8 1.2 6.5 12.5 20.8 25.0 32.1 0.0 0.0 100.0
In addition there was 1 major charge where sex was unknown. The classification ‘Aboriginal’ has been assigned by police, not by the individualsthemselves. Age is at date of offence.
Table 8.12 Juvenile Offenders - Family Conferences by major offence alleged, 1998.
Major offence alleged CasesNumber %
Larceny of a motor vehicle 4 4.7Illegal use of a motor vehicle 81 95.3Total 85 100.0

RESPONSES BY THE CRIMINAL JUSTICE SYSTEM 145
Table 8.13 Juvenile Offenders - Family Conferences: age and sex of defendant by major offence alleged, 1998.
Major offence Total Totalalleged 10 11 12 13 14 15 16 17 18+ Unknown No. %Larceny of a MV 0 0 0 0 1 0 3 0 0 0 4 4.7Illegal use of a MV 0 0 3 9 16 21 18 12 0 2 81 95.3Total 0 0 3 9 17 21 21 12 0 2 85Percentage 0.0 0.0 3.5 10.6 20.0 24.7 24.7 14.1 0.0 2.4 100.0
Females Total10 11 12 13 14 15 16 17 18+ Unknown No. %
Larceny of a MV 0 0 0 0 0 0 0 0 0 0 0 0.0Illegal use of a MV 0 0 0 0 7 7 3 2 0 0 19 100.0Total 0 0 0 0 7 7 3 2 0 0 19Percentage 0.0 0.0 0.0 0.0 36.8 36.8 15.8 10.5 0.0 0.0 100.0
Males Total10 11 12 13 14 15 16 17 18+ Unknown No. %
Larceny of a MV 0 0 0 0 1 0 2 0 0 0 3 4.6Illegal use of a MV 0 0 3 9 9 14 15 10 0 2 62 95.4Total 0 0 3 9 10 14 17 10 0 2 65Percentage 0.0 0.0 4.6 13.8 15.4 21.5 26.2 15.4 0.0 3.1 100.0
In addition there was 1 major offence alleged of ‘illegal use of a motor vehicle’ where sex was unknown. Age is at date of conference.
Table 8.14 Juvenile Offenders - Family Conferences: age and sex by race of defendant, 1998 (larceny and illegal use of amotor vehicle combined).
Race Total Total10 11 12 13 14 15 16 17 18+ Unknow
nNo. %
Aboriginal 0 0 2 4 2 2 0 1 0 0 11 12.9Non-Aboriginal 0 0 1 5 15 19 18 10 0 2 70 82.4Unknown 0 0 0 0 0 0 3 1 0 0 4 4.7Total 0 0 3 9 17 21 21 12 0 2 85Percentage 0.0 0.0 3.5 10.6 20.0 24.7 24.7 14.1 0.0 2.4 100.0
Females Total10 11 12 13 14 15 16 17 18+ Unknow
nNo. %
Aboriginal 0 0 0 0 0 1 0 1 0 0 2 10.5Non-Aboriginal 0 0 0 0 7 6 2 1 0 0 16 84.2Unknown 0 0 0 0 0 0 1 0 0 0 1 5.3Total 0 0 0 0 7 7 3 2 0 0 19Percentage 0.0 0.0 0.0 0.0 36.8 36.8 15.8 10.5 0.0 0.0 100.0
Males Total10 11 12 13 14 15 16 17 18+ Unknow
nNo. %
Aboriginal 0 0 2 4 2 1 0 0 0 0 9 13.8Non-Aboriginal 0 0 1 5 8 13 16 9 0 2 54 83.1Unknown 0 0 0 0 0 0 1 1 0 0 2 3.1Total 0 0 3 9 10 14 17 10 0 2 65Percentage 0.0 0.0 4.6 13.8 15.4 21.5 26.2 15.4 0.0 3.1 100.0
In addition there was 1 case where sex was unknown. The classification ‘Aboriginal’ has been assigned by police, not by the individuals themselves. Ageis at date of conference.

146 MOTOR VEHICLE THEFT IN SOUTH AUSTRALIA, 1998.
Table 8.15 Juvenile Offenders - Family Conferences: most serious outcome for the major offence charged, 1998.
OutcomeConference successful Conference not
successfulTotal
Major offence alleged Undertaking Formal caution Dismissed Youth elects courtLarceny of a motor vehicle 4 0 0 0 4Illegal use of a motor vehicle 79 1 0 1 81Total 83 1 0 1 85Percentage 97.6 1.2 0.0 1.2 100.0
Note: An undertaking can involve one or more conditions of apology, compensation, community service order and other sanction.
Table 8.16 Juvenile Offenders - Juvenile Cautions: number of formal cautions that resulted in sanctions, 1998.
SanctionsMajor offence admitted Yes No TotalLarceny of a motor vehicle 1 1 2Illegal use of a motor vehicle 43 29 72Total 44 30 74Percentage 59.5 40.5 100.0
Table 8.17 Juvenile Offenders - Juvenile Cautions: sanctions for major offence admitted, 1998.
Major offence Other Apology Compensation Community Serviceadmitted sanction No. Min. Average Max. No. Min. Average Max.Larceny of a M.V. 1 1 0 - - - 0 - - -Illegal use of a M.V. 23 23 11 10 41 200 8 3 7 10Total 24 24 11 10 41 200 8 3 7 10
Note: More than one sanction per caution is possible.
Table 8.18 Magistrates Court - Outcomes of cases involving larceny/illegal use of a motor vehicle as the major charge,1998.
Major Charge Committedfor trial orsentence
Convictedwith
penalty
Convictedwithoutpenalty
Guiltywithout
conviction
Guilty oflesser
offence
Acquittedon majorcharge
Majorcharge
withdrawn
Majorcharge
dismissed
Other (eg.defendant
died)
Total
Larceny of a MV 0 12 0 2 5 0 14 5 0 38Illegal use of a MV 0 138 1 12 19 0 65 35 0 270Total 0 150 1 14 24 0 79 40 0 308Percentage 0 48.7 0.3 4.5 7.8 0.0 25.6 13.0 0.0 100.0

RESPONSES BY THE CRIMINAL JUSTICE SYSTEM 147
Table 8.19 Magistrates Court - major penalty for cases where the major charge convicted was larceny/illegal use of amotor vehicle, 1998.
Major Charge No penalty Order Rising of Fine ($) Suspension Communitythe court No. Min. Average Max of drivers
licenceserviceorder
Larceny of a MV 0 0 0 2 75 138 200 0 2Illegal use of a MV 1 0 0 1 400 400 400 20 11Total 1 0 0 3 75 225 400 20 13Percentage 0.5 0.0 0.0 1.6 10.5 6.8
Major Charge Bond Suspended Imprisonment (weeks) Totalimprisonmen
tNo. Min. Average Max. No. Percentage
Larceny of a MV 0 7 6 4 43 104 17 8.9Illegal use of a MV 14 75 52 3 26 156 174 91.1Total 14 82 58 3 28 156 191Percentage 7.3 42.9 30.4 100.0
Table 8.20 District & Supreme Courts - outcomes of cases involving larceny/illegal use of a motor vehicle as the majorcharge, 1998.
Major Charge Guilty Plea Trial Nolle prosequi Total chargedGuilty ascharged
Guilty ofother
offence
Guilty ascharged
Guilty oflesser
offence
Guilty ofother
offence
Notguilty ongrounds
ofinsanity
Acquitted
Guilty ofother
offence
Accuseddis-
charged
Otheroutcome
No. %
Larceny of a MV 0 0 0 0 0 0 0 0 0 0 0 0.0Illegal use of a MV 0 0 0 0 0 0 0 0 0 0 0 0.0Total 0 0 0 0 0 0 0 0 0 0 0 0.0Percentage 0.0 0.0 0.0 0.0 0.0 0.0 0.0 0.0 0.0 0.0 0.0 0.0
Table 8.21 District & Supreme Courts - major penalty for cases where the major charge convicted was larceny/illegal use ofa motor vehicle, 1998.
Offence Other penalty Fine Suspension ofdrivers licence
Rising of thecourt
Bond withsupervision
Bond withoutsupervision
Communityservice order
Larceny of a motor vehicle 0 0 0 0 0 0 0Illegal use of a motor vehicle 0 0 0 0 0 0 0Total 0 0 0 0 0 0 0Percentage 0.0 0.0 0.0 0.0 0.0 0.0 0.0
Major Charge Suspended Imprisonment (weeks) Direct imprisonment (months) TotalNo. Min. Average Max. No. Min. Average Max. No. %
Larceny of a MV 0 0 0 0 0 0 0 0 0 0.0Illegal use of a MV 0 0 0 0 0 0 0 0 0 0.0
Total 0 0 0 0 0 0 0 0 0 0.0
Percentage 0.0 0.0 0.0 0.0 0.0 0.0 0.0 0.0 0.0 0.0

148 MOTOR VEHICLE THEFT IN SOUTH AUSTRALIA, 1998.
This page has intentionally been left blank

149
A P P E N D I X A : S T A T I S T I C A L L O C A L A R E A P R O F I L E S
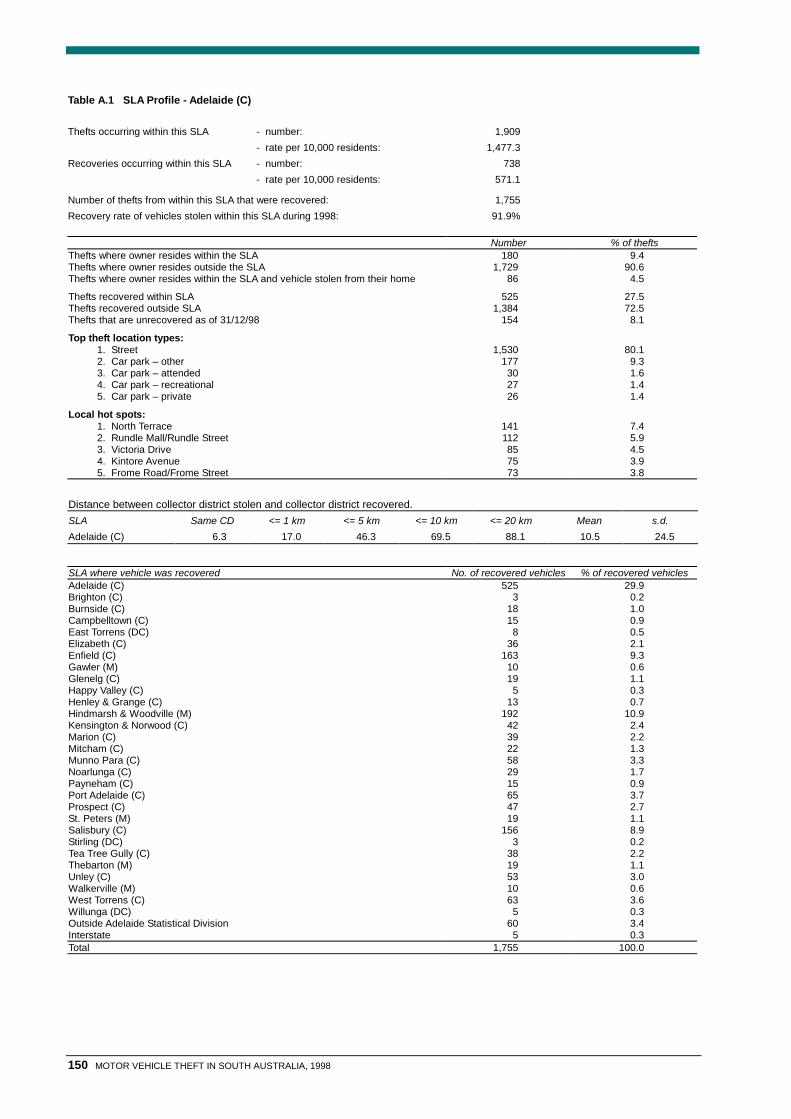
150 MOTOR VEHICLE THEFT IN SOUTH AUSTRALIA, 1998
Table A.1 SLA Profile - Adelaide (C)
Thefts occurring within this SLA - number: 1,909- rate per 10,000 residents: 1,477.3
Recoveries occurring within this SLA - number: 738- rate per 10,000 residents: 571.1
Number of thefts from within this SLA that were recovered: 1,755Recovery rate of vehicles stolen within this SLA during 1998: 91.9%
Number % of theftsThefts where owner resides within the SLA 180 9.4Thefts where owner resides outside the SLA 1,729 90.6Thefts where owner resides within the SLA and vehicle stolen from their home 86 4.5
Thefts recovered within SLA 525 27.5Thefts recovered outside SLA 1,384 72.5Thefts that are unrecovered as of 31/12/98 154 8.1
Top theft location types: 1. Street 1,530 80.1 2. Car park – other 177 9.3 3. Car park – attended 30 1.6 4. Car park – recreational 27 1.4 5. Car park – private 26 1.4
Local hot spots: 1. North Terrace 141 7.4 2. Rundle Mall/Rundle Street 112 5.9 3. Victoria Drive 85 4.5 4. Kintore Avenue 75 3.9 5. Frome Road/Frome Street 73 3.8
Distance between collector district stolen and collector district recovered.SLA Same CD <= 1 km <= 5 km <= 10 km <= 20 km Mean s.d.Adelaide (C) 6.3 17.0 46.3 69.5 88.1 10.5 24.5
SLA where vehicle was recovered No. of recovered vehicles % of recovered vehiclesAdelaide (C) 525 29.9Brighton (C) 3 0.2Burnside (C) 18 1.0Campbelltown (C) 15 0.9East Torrens (DC) 8 0.5Elizabeth (C) 36 2.1Enfield (C) 163 9.3Gawler (M) 10 0.6Glenelg (C) 19 1.1Happy Valley (C) 5 0.3Henley & Grange (C) 13 0.7Hindmarsh & Woodville (M) 192 10.9Kensington & Norwood (C) 42 2.4Marion (C) 39 2.2Mitcham (C) 22 1.3Munno Para (C) 58 3.3Noarlunga (C) 29 1.7Payneham (C) 15 0.9Port Adelaide (C) 65 3.7Prospect (C) 47 2.7St. Peters (M) 19 1.1Salisbury (C) 156 8.9Stirling (DC) 3 0.2Tea Tree Gully (C) 38 2.2Thebarton (M) 19 1.1Unley (C) 53 3.0Walkerville (M) 10 0.6West Torrens (C) 63 3.6Willunga (DC) 5 0.3Outside Adelaide Statistical Division 60 3.4Interstate 5 0.3Total 1,755 100.0

APPENDIX A: STATISTICAL LOCAL AREA PROFILES 151

152 MOTOR VEHICLE THEFT IN SOUTH AUSTRALIA, 1998
Table A.2 SLA Profile - Brighton (C)
Thefts occurring within this SLA - number: 113- rate per 10,000 residents: 58.1
Recoveries occurring within this SLA - number: 78- rate per 10,000 residents: 40.1
Number of thefts from within this SLA that were recovered: 104Recovery rate of vehicles stolen within this SLA during 1998: 92.0%
Number % of theftsThefts where owner resides within the SLA 67 59.3Thefts where owner resides outside the SLA 46 40.7Thefts where owner resides within the SLA and vehicle stolen from their home 47 41.6
Thefts recovered within SLA 23 20.4Thefts recovered outside SLA 90 79.6Thefts that are unrecovered as of 31/12/98 9 8.0
Top theft location types: 1. Street 58 51.3 2. House - driveway 17 15.0 3. Car park - railway station 15 13.3 4. Car park - other 8 7.1 5. Car park - units/flats 4 3.5
Local Hot spots: 1. Commercial Road 9 8.0 2. Esplanade 9 8.0 3. Brighton Road 8 7.1 4. Cedar Avenue 6 5.3 5. Scarborough Street 5 4.4
Distance between collector district stolen and collector district recovered.SLA Same CD <= 1 km <= 5 km <= 10 km <= 20 km Mean s.d.Brighton (C) 5.8 17.3 54.8 67.3 89.4 11.8 27.6
SLA where vehicle was recovered No. of recovered vehicles % of recovered vehiclesAdelaide (C) 3 2.9Brighton (C) 23 22.1Burnside (C) 0 -Campbelltown (C) 1 1.0East Torrens (DC) 0 -Elizabeth (C) 1 1.0Enfield (C) 1 1.0Gawler (M) 0 -Glenelg (C) 5 4.8Happy Valley (C) 2 1.9Henley & Grange (C) 1 1.0Hindmarsh & Woodville (M) 2 1.9Kensington & Norwood (C) 0 -Marion (C) 33 31.7Mitcham (C) 6 5.8Munno Para (C) 1 1.0Noarlunga (C) 8 7.7Payneham (C) 1 1.0Port Adelaide (C) 3 2.9Prospect (C) 0 -St. Peters (M) 2 1.9Salisbury (C) 1 1.0Stirling (DC) 0 -Tea Tree Gully (C) 1 1.0Thebarton (M) 0 -Unley (C) 1 1.0Walkerville (M) 0 -West Torrens (C) 3 2.9Willunga (DC) 0 -Outside Adelaide Statistical Division 5 4.8Interstate 0 -Total 104 100.0

APPENDIX A: STATISTICAL LOCAL AREA PROFILES 153

154 MOTOR VEHICLE THEFT IN SOUTH AUSTRALIA, 1998
Table A.3 SLA Profile - Burnside (C)
Thefts occurring within this SLA - number: 115- rate per 10,000 residents: 28.2
Recoveries occurring within this SLA - number: 105- rate per 10,000 residents: 25.8
Number of thefts from within this SLA that were recovered: 103Recovery rate of vehicles stolen within this SLA during 1998: 89.6%
Number % of theftsThefts where owner resides within the SLA 71 61.7Thefts where owner resides outside the SLA 44 38.3Thefts where owner resides within the SLA and vehicle stolen from their home 58 50.4
Thefts recovered within SLA 32 27.8Thefts recovered outside SLA 83 72.2Thefts that are unrecovered as of 31/12/98 12 10.4
Top theft location types: 1. Street 71 61.7 2. House - driveway 17 14.8 3. Car park - other 7 6.1 4. Car park - shopping centre 6 5.2
Local Hot spots: 1. Portrush Road 9 7.8 2. Greenhill Road 6 5.2 3. Glen Osmond Road 5 4.3 4. Fullarton Road 4 3.5
Distance between collector district stolen and collector district recovered.SLA Same CD <= 1 km <= 5 km <= 10 km <= 20 km Mean s.d.Burnside (C) 10.0 25.0 59.0 73.0 91.0 7.8 14.8
SLA where vehicle was recovered No. of recovered vehicles % of recovered vehiclesAdelaide (C) 2 1.9Brighton (C) 2 1.9Burnside (C) 32 31.1Campbelltown (C) 5 4.9East Torrens (DC) 2 1.9Elizabeth (C) 1 1.0Enfield (C) 7 6.8Gawler (M) 0 -Glenelg (C) 0 -Happy Valley (C) 0 -Henley & Grange (C) 0 -Hindmarsh & Woodville (M) 2 1.9Kensington & Norwood (C) 3 2.9Marion (C) 3 2.9Mitcham (C) 7 6.8Munno Para (C) 1 1.0Noarlunga (C) 3 2.9Payneham (C) 5 4.9Port Adelaide (C) 1 1.0Prospect (C) 1 1.0St. Peters (M) 3 2.9Salisbury (C) 6 5.8Stirling (DC) 0 -Tea Tree Gully (C) 0 -Thebarton (M) 0 -Unley (C) 7 6.8Walkerville (M) 1 1.0West Torrens (C) 3 2.9Willunga (DC) 0 -Outside Adelaide Statistical Division 3 2.9Interstate 3 2.9Total 103 100.0

APPENDIX A: STATISTICAL LOCAL AREA PROFILES 155

156 MOTOR VEHICLE THEFT IN SOUTH AUSTRALIA, 1998
Table A.4 SLA Profile - Campbelltown (C)
Thefts occurring within this SLA - number: 210- rate per 10,000 residents: 45.5
Recoveries occurring within this SLA - number: 185- rate per 10,000 residents: 40.1
Number of thefts from within this SLA that were recovered: 197Recovery rate of vehicles stolen within this SLA during 1998: 93.8%
Number % of theftsThefts where owner resides within the SLA 140 66.7Thefts where owner resides outside the SLA 70 33.3Thefts where owner resides within the SLA and vehicle stolen from their home 98 46.7
Thefts recovered within SLA 84 40.0Thefts recovered outside SLA 126 60.0Thefts that are unrecovered as of 31/12/98 13 6.2
Top theft location types: 1. Street 71 33.8 2. House - driveway 51 24.3 3. Car park - other 34 16.2 4. Car park - railway station 12 5.7 5. Car park - units/flats 11 5.2
Local Hot spots: 1. Darley Road 37 17.6 2. Lower North East Road 11 5.2 3. Gorge Road 8 3.8 4. Montacute Road 7 3.3 5. St. Bernard’s Road 5 2.4
Distance between collector district stolen and collector district recovered.SLA Same CD <= 1 km <= 5 km <= 10 km <= 20 km Mean s.d.Campbelltown (C) 13.7 26.4 65.0 86.3 93.4 5.8 8.5
SLA where vehicle was recovered No. of recovered vehicles % of recovered vehiclesAdelaide (C) 3 1.5Brighton (C) 0 -Burnside (C) 3 1.5Campbelltown (C) 84 42.6East Torrens (DC) 7 3.6Elizabeth (C) 0 -Enfield (C) 21 10.7Gawler (M) 0 -Glenelg (C) 0 -Happy Valley (C) 0 -Henley & Grange (C) 1 0.5Hindmarsh & Woodville (M) 3 1.5Kensington & Norwood (C) 4 2.0Marion (C) 1 0.5Mitcham (C) 2 1.0Munno Para (C) 3 1.5Noarlunga (C) 4 2.0Payneham (C) 14 7.1Port Adelaide (C) 1 0.5Prospect (C) 2 1.0St. Peters (M) 6 3.0Salisbury (C) 7 3.6Stirling (DC) 0 -Tea Tree Gully (C) 18 9.1Thebarton (M) 2 1.0Unley (C) 0 -Walkerville (M) 0 -West Torrens (C) 0 -Willunga (DC) 0 -Outside Adelaide Statistical Division 11 5.6Interstate 0 -Total 197 100.0

APPENDIX A: STATISTICAL LOCAL AREA PROFILES 157

158 MOTOR VEHICLE THEFT IN SOUTH AUSTRALIA, 1998
Table A.5 SLA Profile - East Torrens (DC)
Thefts occurring within this SLA - number: 9- rate per 10,000 residents: 13.1
Recoveries occurring within this SLA - number: 41- rate per 10,000 residents: 59.7
Number of thefts from within this SLA that were recovered: 6Recovery rate of vehicles stolen within this SLA during 1998: 66.7%
Number % of theftsThefts where owner resides within the SLA 5 55.6Thefts where owner resides outside the SLA 4 44.4Thefts where owner resides within the SLA and vehicle stolen from their home 4 44.4
Thefts recovered within SLA 4 44.4Thefts recovered outside SLA 5 55.6Thefts that are unrecovered as of 31/12/98 3 33.3
Top theft location types: 1. Street 3 33.3 2. Business premises 2 22.2 3. House - driveway 2 22.2 4. Car park - private 1 11.1
5. Shed 1 11.1
Local Hot spots: 1. Norton Summit Road 2 22.2 2. Greenhill Road 1 11.1 3. Coach Road 1 11.1 4. Lobethal Road 1 11.1 5. Teringie Drive 1 11.1
Distance between collector district stolen and collector district recovered.SLA Same CD <= 1 km <= 5 km <= 10 km <= 20 km Mean s.d.East Torrens (DC) 33.3 33.3 50.0 100.0 100.0 3.5 3.5
SLA where vehicle was recovered No. of recovered vehicles % of recovered vehiclesAdelaide (C) 0 -Brighton (C) 0 -Burnside (C) 0 -Campbelltown (C) 0 -East Torrens (DC) 4 66.7Elizabeth (C) 0 -Enfield (C) 0 -Gawler (M) 0 -Glenelg (C) 0 -Happy Valley (C) 0 -Henley & Grange (C) 0 -Hindmarsh & Woodville (M) 0 -Kensington & Norwood (C) 2 33.3Marion (C) 0 -Mitcham (C) 0 -Munno Para (C) 0 -Noarlunga (C) 0 -Payneham (C) 0 -Port Adelaide (C) 0 -Prospect (C) 0 -St. Peters (M) 0 -Salisbury (C) 0 -Stirling (DC) 0 -Tea Tree Gully (C) 0 -Thebarton (M) 0 -Unley (C) 0 -Walkerville (M) 0 -West Torrens (C) 0 -Willunga (DC) 0 -Outside Adelaide Statistical Division 0 -Interstate 0 -Total 6 100.0

APPENDIX A: STATISTICAL LOCAL AREA PROFILES 159

160 MOTOR VEHICLE THEFT IN SOUTH AUSTRALIA, 1998
Table A.6 SLA Profile - Elizabeth (C)
Thefts occurring within this SLA - number: 371- rate per 10,000 residents: 143.2
Recoveries occurring within this SLA - number: 300- rate per 10,000 residents: 115.8
Number of thefts from within this SLA that were recovered: 324Recovery rate of vehicles stolen within this SLA during 1998: 87.3%
Number % of theftsThefts where owner resides within the SLA 163 43.9Thefts where owner resides outside the SLA 208 56.1Thefts where owner resides within the SLA and vehicle stolen from their home 112 30.2
Thefts recovered within SLA 123 33.2Thefts recovered outside SLA 248 66.8Thefts that are unrecovered as of 31/12/98 47 12.7
Top theft location types: 1. Car park - Shopping Centre 91 24.5 2. House - driveway 83 22.4 3. Street 69 18.6 4. Car park - other 41 11.1 5. Car park – medical 16 4.3
Local Hot spots: 1. Elizabeth Way 82 22.1 2. Philip Highway 32 8.6 3. John Rice Avenue 16 4.3 4. Oxenham Drive 14 3.8 5. Frobisher Road 9 2.4
Distance between collector district stolen and collector district recovered.SLA Same CD <= 1 km <= 5 km <= 10 km <= 20 km Mean s.d.Elizabeth (C) 12.4 20.4 52.6 69.3 87.6 9.2 17.5
SLA where vehicle was recovered No. of recovered vehicles % of recovered vehiclesAdelaide (C) 12 3.7Brighton (C) 0 -Burnside (C) 0 -Campbelltown (C) 0 -East Torrens (DC) 0 -Elizabeth (C) 123 38.0Enfield (C) 10 3.1Gawler (M) 16 4.9Glenelg (C) 0 -Happy Valley (C) 0 -Henley & Grange (C) 0 -Hindmarsh & Woodville (M) 5 1.5Kensington & Norwood (C) 0 -Marion (C) 2 0.6Mitcham (C) 1 0.3Munno Para (C) 63 19.4Noarlunga (C) 1 0.3Payneham (C) 0 -Port Adelaide (C) 2 0.6Prospect (C) 5 1.5St. Peters (M) 0 -Salisbury (C) 46 14.2Stirling (DC) 0 -Tea Tree Gully (C) 10 3.1Thebarton (M) 1 0.3Unley (C) 0 -Walkerville (M) 0 -West Torrens (C) 1 0.3Willunga (DC) 0 -Outside Adelaide Statistical Division 25 7.7Interstate 1 0.3Total 324 100.0

APPENDIX A: STATISTICAL LOCAL AREA PROFILES 161

162 MOTOR VEHICLE THEFT IN SOUTH AUSTRALIA, 1998
Table A.7 SLA Profile - Enfield (C)
Thefts occurring within this SLA - number: 626- rate per 10,000 residents: 100.5
Recoveries occurring within this SLA - number: 839- rate per 10,000 residents: 134.8
Number of thefts from within this SLA that were recovered: 560Recovery rate of vehicles stolen within this SLA during 1998: 89.5%
Number % of theftsThefts where owner resides within the SLA 350 55.9Thefts where owner resides outside the SLA 276 44.1Thefts where owner resides within the SLA and vehicle stolen from their home 242 38.7
Thefts recovered within SLA 262 41.9Thefts recovered outside SLA 364 58.1Thefts that are unrecovered as of 31/12/98 66 10.5
Top theft location types: 1. Street 251 40.1 2. House - driveway 119 19.0 3. Business premises 58 9.3 4. Car park – other 51 8.1 5. Car park – shopping centre 28 4.5
Local Hot spots: 1. Main North Road 35 5.6 2. North East Road 24 3.8 3. Days Road 23 3.7 4. Grand Junction Road 19 3.0 5. Regency Road 17 2.7
Distance between collector district stolen and collector district recovered.SLA Same CD <= 1 km <= 5 km <= 10 km <= 20 km Mean s.d.Enfield (C) 10.6 24.8 62.3 81.1 93.5 7.6 24.3
SLA where vehicle was recovered No. of recovered vehicles % of recovered vehiclesAdelaide (C) 15 2.7Brighton (C) 0 -Burnside (C) 4 0.7Campbelltown (C) 17 3.0East Torrens (DC) 1 0.2Elizabeth (C) 11 2.0Enfield (C) 262 46.8Gawler (M) 1 0.2Glenelg (C) 0 -Happy Valley (C) 1 0.2Henley & Grange (C) 1 0.2Hindmarsh & Woodville (M) 48 8.6Kensington & Norwood (C) 3 0.5Marion (C) 2 0.4Mitcham (C) 6 1.1Munno Para (C) 9 1.6Noarlunga (C) 5 0.9Payneham (C) 11 2.0Port Adelaide (C) 19 3.4Prospect (C) 18 3.2St. Peters (M) 2 0.4Salisbury (C) 63 11.3Stirling (DC) 0 -Tea Tree Gully (C) 18 3.2Thebarton (M) 4 0.7Unley (C) 5 0.9Walkerville (M) 3 0.5West Torrens (C) 6 1.1Willunga (DC) 1 0.2Outside Adelaide Statistical Division 21 3.8Interstate 3 0.5Total 560 100.0

APPENDIX A: STATISTICAL LOCAL AREA PROFILES 163

164 MOTOR VEHICLE THEFT IN SOUTH AUSTRALIA, 1998
Table A.8 SLA Profile - Gawler (M)
Thefts occurring within this SLA - number: 111- rate per 10,000 residents: 63.0
Recoveries occurring within this SLA - number: 88- rate per 10,000 residents: 49.9
Number of thefts from within this SLA that were recovered: 100Recovery rate of vehicles stolen within this SLA during 1998: 90.1%
Number % of theftsThefts where owner resides within the SLA 58 52.3Thefts where owner resides outside the SLA 53 47.7Thefts where owner resides within the SLA and vehicle stolen from their home 35 31.5
Thefts recovered within SLA 28 25.2Thefts recovered outside SLA 83 74.8Thefts that are unrecovered as of 31/12/98 11 9.9
Top theft location types: 1. Street 44 39.6 2. House - driveway 19 17.1 3. Car park - railway station 14 12.6 4. Car park - other 7 6.3 5. Car park - shopping centre 6 5.4
Local Hot spots: 1. Bridge Street 9 8.1 2. Murray Street 8 7.2 3. Main North Road 5 4.5 4. Cowan Street 5 4.5
Distance between collector district stolen and collector district recovered.SLA Same CD <= 1 km <= 5 km <= 10 km <= 20 km Mean s.d.Gawler (M) 6.0 15.0 33.0 49.0 80.0 13.9 20.2
SLA where vehicle was recovered No. of recovered vehicles % of recovered vehiclesAdelaide (C) 2 2.0Brighton (C) 0 -Burnside (C) 0 -Campbelltown (C) 0 -East Torrens (DC) 1 1.0Elizabeth (C) 8 8.0Enfield (C) 1 1.0Gawler (M) 28 28.0Glenelg (C) 0 -Happy Valley (C) 0 -Henley & Grange (C) 1 1.0Hindmarsh & Woodville (M) 0 -Kensington & Norwood (C) 0 -Marion (C) 1 1.0Mitcham (C) 0 -Munno Para (C) 15 15.0Noarlunga (C) 0 -Payneham (C) 0 -Port Adelaide (C) 0 -Prospect (C) 1 1.0St. Peters (M) 0 -Salisbury (C) 5 5.0Stirling (DC) 0 -Tea Tree Gully (C) 1 1.0Thebarton (M) 0 -Unley (C) 0 -Walkerville (M) 0 -West Torrens (C) 0 -Willunga (DC) 0 -Outside Adelaide Statistical Division 36 36.0Interstate 0 -Total 100 100.0

APPENDIX A: STATISTICAL LOCAL AREA PROFILES 165

166 MOTOR VEHICLE THEFT IN SOUTH AUSTRALIA, 1998
Table A.9 SLA Profile - Glenelg (C)
Thefts occurring within this SLA - number: 180- rate per 10,000 residents: 136.2
Recoveries occurring within this SLA - number: 101- rate per 10,000 residents: 76.4
Number of thefts from within this SLA that were recovered: 158Recovery rate of vehicles stolen within this SLA during 1998: 87.8%
Number % of theftsThefts where owner resides within the SLA 60 33.3Thefts where owner resides outside the SLA 120 66.7Thefts where owner resides within the SLA and vehicle stolen from their home 44 24.4
Thefts recovered within SLA 40 22.2Thefts recovered outside SLA 140 77.8Thefts that are unrecovered as of 31/12/98 22 12.2
Top theft location types: 1. Street 107 59.4 2. Car park - other 16 8.9 3. Car park - shopping centre 16 8.9 4. House - driveway 12 6.7
Local Hot spots: 1. Brighton Road 15 8.3 2. Anzac Highway 11 6.1 3. Colley Terrace 10 5.6 4. Nile Street 8 4.4 5. High Street 8 4.4
Distance between collector district stolen and collector district recovered.SLA Same CD <= 1 km <= 5 km <= 10 km <= 20 km Mean s.d.Glenelg (C) 6.3 21.5 41.1 57.0 81.0 13.8 34.5
SLA where vehicle was recovered No. of recovered vehicles % of recovered vehiclesAdelaide (C) 4 2.5Brighton (C) 4 2.5Burnside (C) 2 1.3Campbelltown (C) 0 -East Torrens (DC) 1 0.6Elizabeth (C) 1 0.6Enfield (C) 4 2.5Gawler (M) 1 0.6Glenelg (C) 40 25.3Happy Valley (C) 2 1.3Henley & Grange (C) 4 2.5Hindmarsh & Woodville (M) 9 5.7Kensington & Norwood (C) 1 0.6Marion (C) 22 13.9Mitcham (C) 1 0.6Munno Para (C) 0 -Noarlunga (C) 9 5.7Payneham (C) 0 -Port Adelaide (C) 11 7.0Prospect (C) 2 1.3St. Peters (M) 0 -Salisbury (C) 7 4.4Stirling (DC) 0 -Tea Tree Gully (C) 2 1.3Thebarton (M) 1 0.6Unley (C) 2 1.3Walkerville (M) 1 0.6West Torrens (C) 16 10.1Willunga (DC) 0 -Outside Adelaide Statistical Division 11 7.0Interstate 0 -Total 158 100.0

APPENDIX A: STATISTICAL LOCAL AREA PROFILES 167

168 MOTOR VEHICLE THEFT IN SOUTH AUSTRALIA, 1998
Table A.10 SLA Profile - Happy Valley (C)
Thefts occurring within this SLA - number: 87- rate per 10,000 residents: 22.8
Recoveries occurring within this SLA - number: 84- rate per 10,000 residents: 22.1
Number of thefts from within this SLA that were recovered: 79Recovery rate of vehicles stolen within this SLA during 1998: 90.8%
Number % of theftsThefts where owner resides within the SLA 69 79.3Thefts where owner resides outside the SLA 18 20.7Thefts where owner resides within the SLA and vehicle stolen from their home 58 66.7
Thefts recovered within SLA 27 31.0Thefts recovered outside SLA 60 69.0Thefts that are unrecovered as of 31/12/98 8 9.2
Top theft location types: 1. Street 41 47.1 2. House - driveway 29 33.3 3. Car park - other 4 4.6 4. House - front yard 3 3.4 5. Car park - shopping centre 3 3.4
Local Hot spots: 1. Main South Road 7 8.0 2. Carrickalinga Boulevard 3 3.4 3. Hubb Drive 3 3.4 4. Bellaview Road 3 3.4 5. Kenihans Road 3 3.4
Distance between collector district stolen and collector district recovered.SLA Same CD <= 1 km <= 5 km <= 10 km <= 20 km Mean s.d.Happy Valley (C) 12.7 20.3 40.5 70.9 87.3 9.1 12.0
SLA where vehicle was recovered No. of recovered vehicles % of recovered vehiclesAdelaide (C) 0 -Brighton (C) 1 1.3Burnside (C) 0 -Campbelltown (C) 0 -East Torrens (DC) 0 -Elizabeth (C) 0 -Enfield (C) 0 -Gawler (M) 0 -Glenelg (C) 0 -Happy Valley (C) 27 34.2Henley & Grange (C) 1 1.3Hindmarsh & Woodville (M) 3 3.8Kensington & Norwood (C) 0 -Marion (C) 3 3.8Mitcham (C) 4 5.1Munno Para (C) 0 -Noarlunga (C) 33 41.8Payneham (C) 0 -Port Adelaide (C) 1 1.3Prospect (C) 0 -St. Peters (M) 0 -Salisbury (C) 1 1.3Stirling (DC) 1 1.3Tea Tree Gully (C) 1 1.3Thebarton (M) 0 -Unley (C) 0 -Walkerville (M) 0 -West Torrens (C) 0 -Willunga (DC) 0 -Outside Adelaide Statistical Division 3 3.8Interstate 0 -Total 79 100.0

APPENDIX A: STATISTICAL LOCAL AREA PROFILES 169
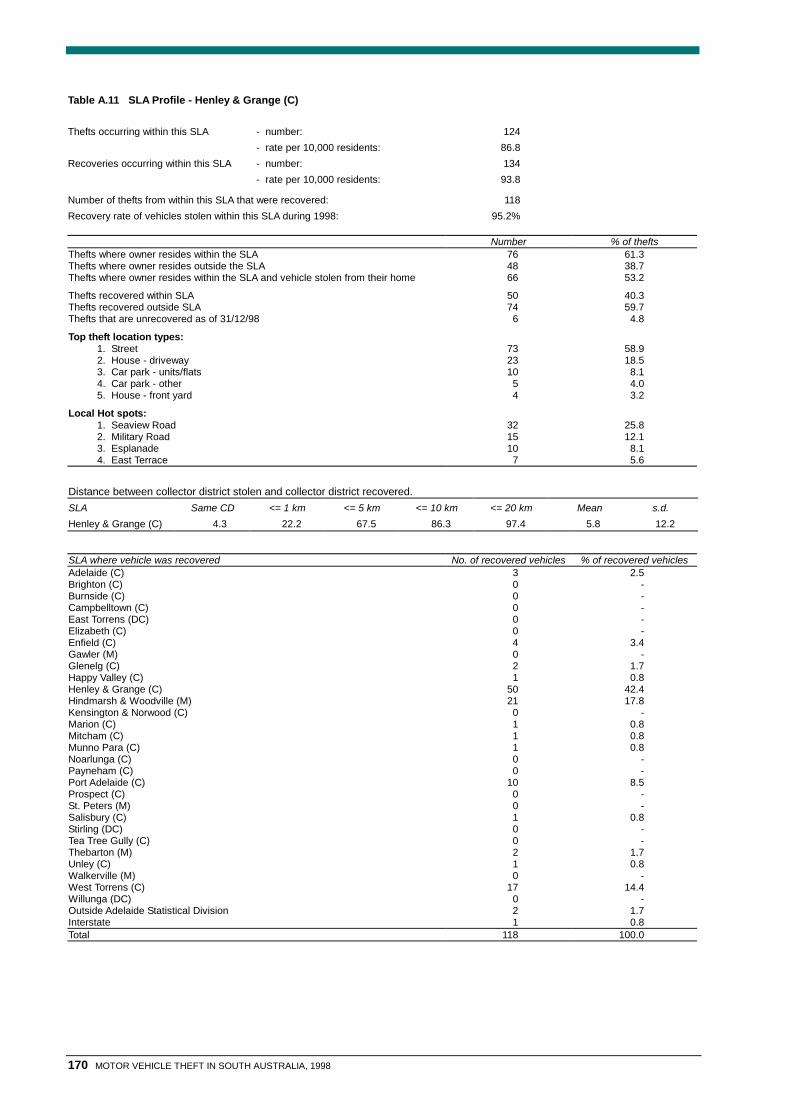
170 MOTOR VEHICLE THEFT IN SOUTH AUSTRALIA, 1998
Table A.11 SLA Profile - Henley & Grange (C)
Thefts occurring within this SLA - number: 124- rate per 10,000 residents: 86.8
Recoveries occurring within this SLA - number: 134- rate per 10,000 residents: 93.8
Number of thefts from within this SLA that were recovered: 118Recovery rate of vehicles stolen within this SLA during 1998: 95.2%
Number % of theftsThefts where owner resides within the SLA 76 61.3Thefts where owner resides outside the SLA 48 38.7Thefts where owner resides within the SLA and vehicle stolen from their home 66 53.2
Thefts recovered within SLA 50 40.3Thefts recovered outside SLA 74 59.7Thefts that are unrecovered as of 31/12/98 6 4.8
Top theft location types: 1. Street 73 58.9 2. House - driveway 23 18.5 3. Car park - units/flats 10 8.1 4. Car park - other 5 4.0 5. House - front yard 4 3.2
Local Hot spots: 1. Seaview Road 32 25.8 2. Military Road 15 12.1 3. Esplanade 10 8.1 4. East Terrace 7 5.6
Distance between collector district stolen and collector district recovered.SLA Same CD <= 1 km <= 5 km <= 10 km <= 20 km Mean s.d.Henley & Grange (C) 4.3 22.2 67.5 86.3 97.4 5.8 12.2
SLA where vehicle was recovered No. of recovered vehicles % of recovered vehiclesAdelaide (C) 3 2.5Brighton (C) 0 -Burnside (C) 0 -Campbelltown (C) 0 -East Torrens (DC) 0 -Elizabeth (C) 0 -Enfield (C) 4 3.4Gawler (M) 0 -Glenelg (C) 2 1.7Happy Valley (C) 1 0.8Henley & Grange (C) 50 42.4Hindmarsh & Woodville (M) 21 17.8Kensington & Norwood (C) 0 -Marion (C) 1 0.8Mitcham (C) 1 0.8Munno Para (C) 1 0.8Noarlunga (C) 0 -Payneham (C) 0 -Port Adelaide (C) 10 8.5Prospect (C) 0 -St. Peters (M) 0 -Salisbury (C) 1 0.8Stirling (DC) 0 -Tea Tree Gully (C) 0 -Thebarton (M) 2 1.7Unley (C) 1 0.8Walkerville (M) 0 -West Torrens (C) 17 14.4Willunga (DC) 0 -Outside Adelaide Statistical Division 2 1.7Interstate 1 0.8Total 118 100.0
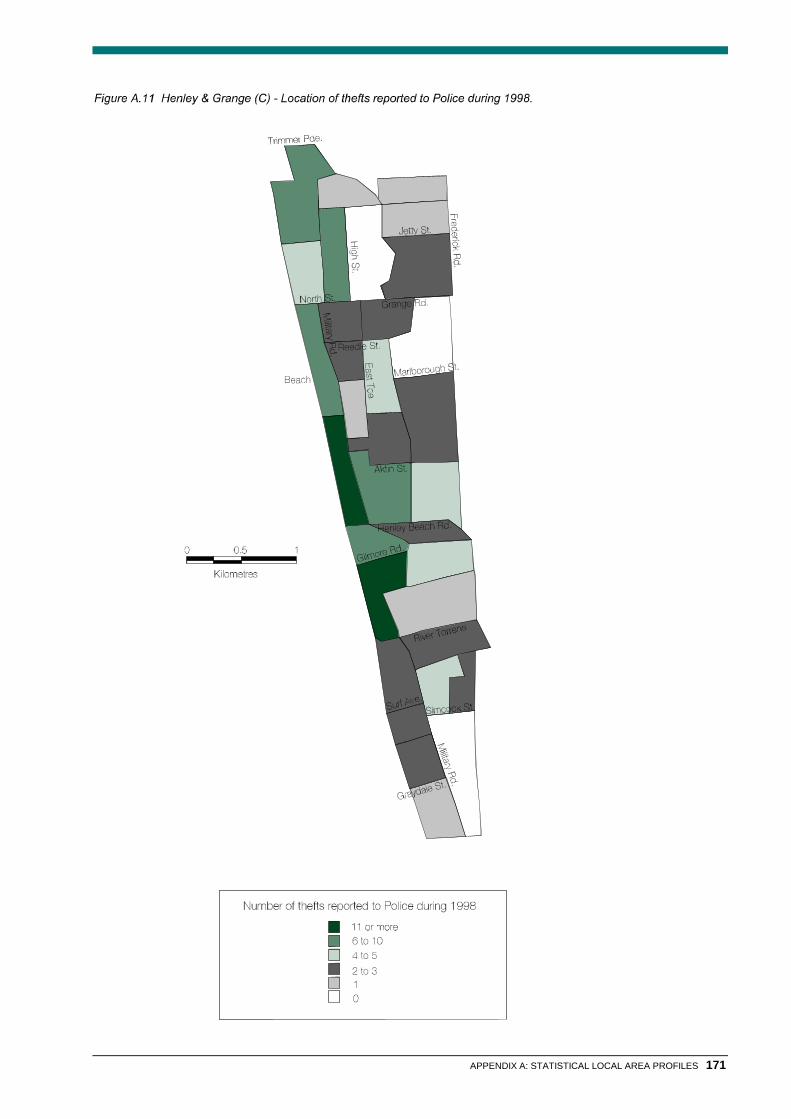
APPENDIX A: STATISTICAL LOCAL AREA PROFILES 171

172 MOTOR VEHICLE THEFT IN SOUTH AUSTRALIA, 1998
Table A.12 SLA Profile - Hindmarsh & Woodville (M)
Thefts occurring within this SLA - number: 853- rate per 10,000 residents: 96.1
Recoveries occurring within this SLA - number: 826- rate per 10,000 residents: 93.1
Number of thefts from within this SLA that were recovered: 757Recovery rate of vehicles stolen within this SLA during 1998: 88.7%
Number % of theftsThefts where owner resides within the SLA 486 57.0Thefts where owner resides outside the SLA 367 43.0Thefts where owner resides within the SLA and vehicle stolen from their home 275 32.2
Thefts recovered within SLA 360 42.2Thefts recovered outside SLA 493 57.8Thefts that are unrecovered as of 31/12/98 96 11.3
Top theft location types: 1. Street 297 34.8 2. House - driveway 144 16.9 3. Car park - shopping centre 127 14.9 4. Car park - other 72 8.4 5. Business premises 53 6.2
Local Hot spots: 1. Torrens Road 68 8.0 2. Port Road 61 7.2 3. Brebner Drive 55 6.4 4. Woodville Road 53 6.2 5. Tapleys Hill Road 26 3.0
Distance between collector district stolen and collector district recovered.SLA Same CD <= 1 km <= 5 km <= 10 km <= 20 km Mean s.d.Hindmarsh & Woodville (M) 7.5 21.3 62.4 83.3 94.2 6.7 14.4
SLA where vehicle was recovered No. of recovered vehicles % of recovered vehiclesAdelaide (C) 29 3.8Brighton (C) 0 -Burnside (C) 4 0.5Campbelltown (C) 2 0.3East Torrens (DC) 0 -Elizabeth (C) 7 0.9Enfield (C) 81 10.7Gawler (M) 1 0.1Glenelg (C) 2 0.3Happy Valley (C) 1 0.1Henley & Grange (C) 25 3.3Hindmarsh & Woodville (M) 360 47.6Kensington & Norwood (C) 1 0.1Marion (C) 14 1.8Mitcham (C) 5 0.7Munno Para (C) 9 1.2Noarlunga (C) 4 0.5Payneham (C) 2 0.3Port Adelaide (C) 83 11.0Prospect (C) 14 1.8St. Peters (M) 1 0.1Salisbury (C) 26 3.4Stirling (DC) 3 0.4Tea Tree Gully (C) 10 1.3Thebarton (M) 13 1.7Unley (C) 5 0.7Walkerville (M) 3 0.4West Torrens (C) 31 4.1Willunga (DC) 1 0.1Outside Adelaide Statistical Division 18 2.4Interstate 2 0.3Total 757 100.0
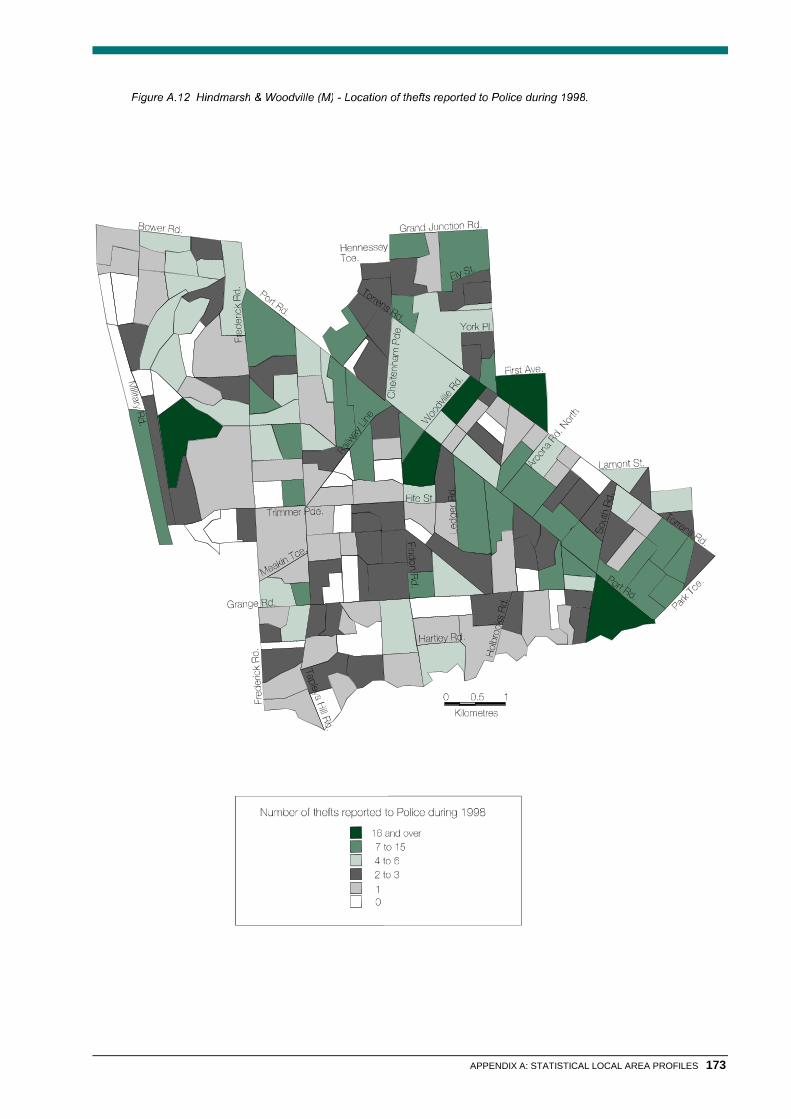
APPENDIX A: STATISTICAL LOCAL AREA PROFILES 173

174 MOTOR VEHICLE THEFT IN SOUTH AUSTRALIA, 1998
Table A.13 SLA Profile - Kensington & Norwood (C)
Thefts occurring within this SLA - number: 156- rate per 10,000 residents: 166.7
Recoveries occurring within this SLA - number: 96- rate per 10,000 residents: 102.6
Number of thefts from within this SLA that were recovered: 145Recovery rate of vehicles stolen within this SLA during 1998: 92.9%
Number % of theftsThefts where owner resides within the SLA 55 35.3Thefts where owner resides outside the SLA 101 64.7Thefts where owner resides within the SLA and vehicle stolen from their home 42 26.9
Thefts recovered within SLA 27 17.3Thefts recovered outside SLA 129 82.7Thefts that are unrecovered as of 31/12/98 11 7.1
Top theft location types: 1. Street 90 57.7 2. Car park - other 23 14.7 3. Car park - hotel/club 9 5.8 4. House - driveway 9 5.8
Local Hot spots: 1. The Parade 21 13.5 2. Webbe Street 15 9.6 3. George Street 9 5.8 4. Edward Street 8 5.1 5. Queen Street 7 4.5
Distance between collector district stolen and collector district recovered.SLA Same CD <= 1 km <= 5 km <= 10 km <= 20 km Mean s.d.Kensington & Norwood (C) 6.9 18.6 55.9 77.9 92.4 6.8 8.7
SLA where vehicle was recovered No. of recovered vehicles % of recovered vehiclesAdelaide (C) 13 9.0Brighton (C) 1 0.7Burnside (C) 17 11.7Campbelltown (C) 7 4.8East Torrens (DC) 3 2.1Elizabeth (C) 2 1.4Enfield (C) 14 9.7Gawler (M) 0 -Glenelg (C) 2 1.4Happy Valley (C) 0 -Henley & Grange (C) 0 -Hindmarsh & Woodville (M) 10 6.9Kensington & Norwood (C) 27 18.6Marion (C) 1 0.7Mitcham (C) 5 3.4Munno Para (C) 3 2.1Noarlunga (C) 1 0.7Payneham (C) 6 4.1Port Adelaide (C) 2 1.4Prospect (C) 2 1.4St. Peters (M) 9 6.2Salisbury (C) 4 2.8Stirling (DC) 0 -Tea Tree Gully (C) 4 2.8Thebarton (M) 2 1.4Unley (C) 1 0.7Walkerville (M) 1 0.7West Torrens (C) 4 2.8Willunga (DC) 0 -Outside Adelaide Statistical Division 4 2.8Interstate 0 -Total 145 100.0

APPENDIX A: STATISTICAL LOCAL AREA PROFILES 175

176 MOTOR VEHICLE THEFT IN SOUTH AUSTRALIA, 1998
Table A.14 SLA Profile - Marion (C)
Thefts occurring within this SLA - number: 548- rate per 10,000 residents: 70.7
Recoveries occurring within this SLA - number: 476- rate per 10,000 residents: 61.4
Number of thefts from within this SLA that were recovered: 482Recovery rate of vehicles stolen within this SLA during 1998: 88.0%
Number % of theftsThefts where owner resides within the SLA 314 57.3Thefts where owner resides outside the SLA 234 42.7Thefts where owner resides within the SLA and vehicle stolen from their home 202 36.9
Thefts recovered within SLA 225 41.1Thefts recovered outside SLA 323 58.9Thefts that are unrecovered as of 31/12/98 66 12.0
Top theft location types: 1. Street 196 35.8 2. Car park - shopping centre 114 20.8 3. House - driveway 78 14.2 4. Car park - other 38 6.9 5. Business premises 26 4.7
Local Hot spots: 1. Diagonal Road 104 19.0 2. South Road 38 6.9 3. Sturt Road 35 6.4 4. Morphett Road 24 4.4 5. Marion Road 17 3.1
Distance between collector district stolen and collector district recovered.SLA Same CD <= 1 km <= 5 km <= 10 km <= 20 km Mean s.d.Marion (C) 9.8 23.6 56.9 72.6 91.8 7.8 10.4
SLA where vehicle was recovered No. of recovered vehicles % of recovered vehiclesAdelaide (C) 17 3.5Brighton (C) 26 5.4Burnside (C) 4 0.8Campbelltown (C) 6 1.2East Torrens (DC) 2 0.4Elizabeth (C) 2 0.4Enfield (C) 9 1.9Gawler (M) 0 -Glenelg (C) 11 2.3Happy Valley (C) 6 1.2Henley & Grange (C) 1 0.2Hindmarsh & Woodville (M) 11 2.3Kensington & Norwood (C) 0 -Marion (C) 225 46.7Mitcham (C) 19 3.9Munno Para (C) 6 1.2Noarlunga (C) 53 11.0Payneham (C) 0 -Port Adelaide (C) 13 2.7Prospect (C) 2 0.4St. Peters (M) 1 0.2Salisbury (C) 8 1.7Stirling (DC) 2 0.4Tea Tree Gully (C) 2 0.4Thebarton (M) 9 1.9Unley (C) 6 1.2Walkerville (M) 0 -West Torrens (C) 22 4.6Willunga (DC) 4 0.8Outside Adelaide Statistical Division 11 2.3Interstate 4 0.8Total 482 100.0

APPENDIX A: STATISTICAL LOCAL AREA PROFILES 177

178 MOTOR VEHICLE THEFT IN SOUTH AUSTRALIA, 1998
Table A.15 SLA Profile - Mitcham (C)
Thefts occurring within this SLA - number: 243- rate per 10,000 residents: 39.5
Recoveries occurring within this SLA - number: 232- rate per 10,000 residents: 37.7
Number of thefts from within this SLA that were recovered: 226Recovery rate of vehicles stolen within this SLA during 1998: 93.0%
Number % of theftsThefts where owner resides within the SLA 154 63.4Thefts where owner resides outside the SLA 89 36.6Thefts where owner resides within the SLA and vehicle stolen from their home 115 47.3
Thefts recovered within SLA 108 44.4Thefts recovered outside SLA 135 55.6Thefts that are unrecovered as of 31/12/98 17 7.0
Top theft location types: 1. Street 132 54.3 2. House - driveway 39 16.0 3. Business premises 13 5.3 4. Car park - private 9 3.7 5. Car park - railway station 9 3.7
Local Hot spots: 1. South Road 16 6.6 2. Flinders Drive 11 4.5 3. Main Road 8 3.3 4. Belair Road 8 3.3
Distance between collector district stolen and collector district recovered.SLA Same CD <= 1 km <= 5 km <= 10 km <= 20 km Mean s.d.Mitcham (C) 10.7 28.6 57.1 76.3 90.6 7.3 10.8
SLA where vehicle was recovered No. of recovered vehicles % of recovered vehiclesAdelaide (C) 10 4.4Brighton (C) 4 1.8Burnside (C) 4 1.8Campbelltown (C) 0 -East Torrens (DC) 0 -Elizabeth (C) 1 0.4Enfield (C) 5 2.2Gawler (M) 1 0.4Glenelg (C) 2 0.9Happy Valley (C) 7 3.1Henley & Grange (C) 1 0.4Hindmarsh & Woodville (M) 3 1.3Kensington & Norwood (C) 1 0.4Marion (C) 31 13.7Mitcham (C) 108 47.8Munno Para (C) 4 1.8Noarlunga (C) 18 8.0Payneham (C) 0 -Port Adelaide (C) 3 1.3Prospect (C) 0 -St. Peters (M) 0 -Salisbury (C) 4 1.8Stirling (DC) 3 1.3Tea Tree Gully (C) 0 -Thebarton (M) 1 0.4Unley (C) 3 1.3Walkerville (M) 0 -West Torrens (C) 6 2.7Willunga (DC) 0 -Outside Adelaide Statistical Division 4 1.8Interstate 2 0.9Total 226 100.0

APPENDIX A: STATISTICAL LOCAL AREA PROFILES 179

180 MOTOR VEHICLE THEFT IN SOUTH AUSTRALIA, 1998
Table A.16 SLA Profile - Munno Para (C)
Thefts occurring within this SLA - number: 286- rate per 10,000 residents 70.5
Recoveries occurring within this SLA - number: 431- rate per 10,000 residents: 106.3
Number of thefts from within this SLA that were recovered: 252Recovery rate of vehicles stolen within this SLA during 1998: 88.1%
Number % of theftsThefts where owner resides within the SLA 207 72.4Thefts where owner resides outside the SLA 79 27.6Thefts where owner resides within the SLA and vehicle stolen from their home 141 49.3
Thefts recovered within SLA 153 53.5Thefts recovered outside SLA 133 46.5Thefts that are unrecovered as of 31/12/98 34 11.9
Top theft location types: 1. House - driveway 106 37.1 2. Street 104 36.4 3. Car park - railway station 16 5.6 4. Car park - other 12 4.2 5. Car park - shopping centre 12 4.2
Local Hot spots: 1. Main North Road 19 6.6 2. Anderson Walk 14 4.9 3. Peachey Road 8 2.8 4. Port Wakefield Road 7 2.4 5. Old Port Wakefield Road 6 2.1
Distance between collector district stolen and collector district recovered.SLA Same CD <= 1 km <= 5 km <= 10 km <= 20 km Mean s.d.Munno Para (C) 12.3 25.8 59.5 78.6 91.7 8.4 21.5
SLA where vehicle was recovered No. of recovered vehicles % of recovered vehiclesAdelaide (C) 1 0.4Brighton (C) 0 -Burnside (C) 1 0.4Campbelltown (C) 0 -East Torrens (DC) 0 -Elizabeth (C) 34 13.5Enfield (C) 1 0.4Gawler (M) 14 5.6Glenelg (C) 0 -Happy Valley (C) 0 -Henley & Grange (C) 0 -Hindmarsh & Woodville (M) 3 1.2Kensington & Norwood (C) 0 -Marion (C) 2 0.8Mitcham (C) 0 -Munno Para (C) 153 60.7Noarlunga (C) 0 -Payneham (C) 0 -Port Adelaide (C) 2 0.8Prospect (C) 0 -St. Peters (M) 0 -Salisbury (C) 15 6.0Stirling (DC) 0 -Tea Tree Gully (C) 4 1.6Thebarton (M) 0 -Unley (C) 0 -Walkerville (M) 0 -West Torrens (C) 0 -Willunga (DC) 0 -Outside Adelaide Statistical Division 22 8.7Interstate 0 -Total 252 100.0

APPENDIX A: STATISTICAL LOCAL AREA PROFILES 181

182 MOTOR VEHICLE THEFT IN SOUTH AUSTRALIA, 1998
Table A.17 SLA Profile - Noarlunga (C)
Thefts occurring within this SLA - number: 656- rate per 10,000 residents: 70.0
Recoveries occurring within this SLA - number: 638- rate per 10,000 residents: 68.1
Number of thefts from within this SLA that were recovered: 587Recovery rate of vehicles stolen within this SLA during 1998: 89.5%
Number % of theftsThefts where owner resides within the SLA 530 80.8Thefts where owner resides outside the SLA 126 19.2Thefts where owner resides within the SLA and vehicle stolen from their home 287 43.8
Thefts recovered within SLA 412 62.8Thefts recovered outside SLA 244 37.2Thefts that are unrecovered as of 31/12/98 69 10.5
Top theft location types: 1. Street 226 34.5 2. House - driveway 158 24.1 3. Car park - shopping centre 72 11.0 4. Car park - other 56 8.5 5. House - front yard 24 3.7
Local Hot spots: 1. Beach Road 63 9.6 2. Main South Road 38 5.8 3. David Witton Drive 32 4.9 4. Goldsmith Drive 14 2.1 5. Commercial Road 10 1.5
Distance between collector district stolen and collector district recovered.SLA Same CD <= 1 km <= 5 km <= 10 km <= 20 km Mean s.d.Noarlunga (C) 10.5 19.2 59.2 76.8 87.0 9.8 37.3
SLA where vehicle was recovered No. of recovered vehicles % of recovered vehiclesAdelaide (C) 7 1.2Brighton (C) 8 1.4Burnside (C) 1 0.2Campbelltown (C) 2 0.3East Torrens (DC) 0 -Elizabeth (C) 1 0.2Enfield (C) 4 0.7Gawler (M) 0 -Glenelg (C) 2 0.3Happy Valley (C) 19 3.2Henley & Grange (C) 0 -Hindmarsh & Woodville (M) 6 1.0Kensington & Norwood (C) 0 -Marion (C) 39 6.6Mitcham (C) 5 0.9Munno Para (C) 1 0.2Noarlunga (C) 412 70.2Payneham (C) 1 0.2Port Adelaide (C) 3 0.5Prospect (C) 0 -St. Peters (M) 2 0.3Salisbury (C) 2 0.3Stirling (DC) 3 0.5Tea Tree Gully (C) 3 0.5Thebarton (M) 2 0.3Unley (C) 2 0.3Walkerville (M) 0 -West Torrens (C) 2 0.3Willunga (DC) 31 5.3Outside Adelaide Statistical Division 25 4.3Interstate 4 0.7Total 587 100.0

APPENDIX A: STATISTICAL LOCAL AREA PROFILES 183

184 MOTOR VEHICLE THEFT IN SOUTH AUSTRALIA, 1998
Table A.18 SLA Profile - Payneham (C)
Thefts occurring within this SLA - number: 108- rate per 10,000 residents: 67.0
Recoveries occurring within this SLA - number: 116- rate per 10,000 residents: 71.9
Number of thefts from within this SLA that were recovered: 102Recovery rate of vehicles stolen within this SLA during 1998: 94.4%
Number % of theftsThefts where owner resides within the SLA 60 55.6Thefts where owner resides outside the SLA 48 44.4Thefts where owner resides within the SLA and vehicle stolen from their home 46 42.6
Thefts recovered within SLA 37 34.3Thefts recovered outside SLA 71 65.7Thefts that are unrecovered as of 31/12/98 6 5.6
Top theft location types: 1. Street 61 56.5 2. House - driveway 12 11.1 3. Car park - hotel/club 11 10.2 4. Car park - shopping centre 6 5.6 5. Car park - units/flats 5 4.6
Local Hot spots: 1. Payneham Road 14 13.0 2. Glynburn Road 9 8.3 3. Broad Street 5 4.6 4. Portrush Road 4 3.7 5. Lambert Road 4 3.7
Distance between collector district stolen and collector district recovered.SLA Same CD <= 1 km <= 5 km <= 10 km <= 20 km Mean s.d.Payneham (C) 11.8 28.4 64.7 81.4 92.2 6.3 8.7
SLA where vehicle was recovered No. of recovered vehicles % of recovered vehiclesAdelaide (C) 5 4.9Brighton (C) 0 -Burnside (C) 4 3.9Campbelltown (C) 13 12.7East Torrens (DC) 3 2.9Elizabeth (C) 2 2.0Enfield (C) 9 8.8Gawler (M) 1 1.0Glenelg (C) 0 -Happy Valley (C) 0 -Henley & Grange (C) 0 -Hindmarsh & Woodville (M) 5 4.9Kensington & Norwood (C) 0 -Marion (C) 1 1.0Mitcham (C) 1 1.0Munno Para (C) 3 2.9Noarlunga (C) 0 -Payneham (C) 37 36.3Port Adelaide (C) 1 1.0Prospect (C) 2 2.0St. Peters (M) 1 1.0Salisbury (C) 1 1.0Stirling (DC) 0 -Tea Tree Gully (C) 5 4.9Thebarton (M) 1 1.0Unley (C) 0 -Walkerville (M) 1 1.0West Torrens (C) 1 1.0Willunga (DC) 0 -Outside Adelaide Statistical Division 5 4.9Interstate 0 -Total 102 100.0

APPENDIX A: STATISTICAL LOCAL AREA PROFILES 185

186 MOTOR VEHICLE THEFT IN SOUTH AUSTRALIA, 1998
Table A.19 SLA Profile - Port Adelaide (C)
Thefts occurring within this SLA - number: 331- rate per 10,000 residents: 85.0
Recoveries occurring within this SLA - number: 443- rate per 10,000 residents: 113.7
Number of thefts from within this SLA that were recovered: 306Recovery rate of vehicles stolen within this SLA during 1998: 92.4%
Number % of theftsThefts where owner resides within the SLA 222 67.1Thefts where owner resides outside the SLA 109 32.9Thefts where owner resides within the SLA and vehicle stolen from their home 133 40.2
Thefts recovered within SLA 171 51.7Thefts recovered outside SLA 160 48.3Thefts that are unrecovered as of 31/12/98 25 7.6
Top theft location types: 1. Street 172 52.0 2. House - driveway 40 12.1 3. Car park - shopping centre 28 8.5 4. Car park - other 26 7.9 5. Business premises 15 4.5
Local Hot spots: 1. Commercial Road 12 3.6 2. Dale Street 12 3.6 3. Semaphore Road 11 3.3 4. Port Road 10 3.0
Distance between collector district stolen and collector district recovered.SLA Same CD <= 1 km <= 5 km <= 10 km <= 20 km Mean s.d.Port Adelaide (C) 12.8 29.8 63.6 78.7 92.5 8.1 25.2
SLA were vehicle was recovered No. of vehicles recovered % of recovered vehiclesAdelaide (C) 4 1.3Brighton (C) 0 -Burnside (C) 2 0.7Campbelltown (C) 0 -East Torrens (DC) 0 -Elizabeth (C) 4 1.3Enfield (C) 25 8.2Gawler (M) 1 0.3Glenelg (C) 0 -Happy Valley (C) 1 0.3Henley & Grange (C) 4 1.3Hindmarsh & Woodville (M) 43 14.1Kensington & Norwood (C) 0 -Marion (C) 6 2.0Mitcham (C) 1 0.3Munno Para (C) 1 0.3Noarlunga (C) 4 1.3Payneham (C) 0 -Port Adelaide (C) 171 55.9Prospect (C) 1 0.3St. Peters (M) 0 -Salisbury (C) 19 6.2Stirling (DC) 0 -Tea Tree Gully (C) 0 -Thebarton (M) 3 1.0Unley (C) 0 -Walkerville (M) 1 0.3West Torrens (C) 4 1.3Willunga (DC) 0 -Outside Adelaide Statistical Division 10 3.3Interstate 1 0.3Total 306 100.0

APPENDIX A: STATISTICAL LOCAL AREA PROFILES 187

188 MOTOR VEHICLE THEFT IN SOUTH AUSTRALIA, 1998
Table A.20 SLA Profile - Prospect (C)
Thefts occurring within this SLA - number: 185- rate per 10,000 residents: 96.7
Recoveries occurring within this SLA - number: 158- rate per 10,000 residents: 82.6
Number of thefts from within this SLA that were recovered: 165Recovery rate of vehicles stolen within this SLA during 1998: 89.2%
Number % of theftsThefts where owner resides within the SLA 84 45.4Thefts where owner resides outside the SLA 101 54.6Thefts where owner resides within the SLA and vehicle stolen from their home 67 36.2
Thefts recovered within SLA 35 18.9Thefts recovered outside SLA 150 81.1Thefts that are unrecovered as of 31/12/98 20 10.8
Top theft location types: 1. Street 91 49.2 2. Car park - shopping centre 31 16.8 3. House - driveway 26 14.1 4. Business premises 11 5.9 5. Car park - other 11 5.9
Local Hot spots: 1. Main North Road 54 29.2 2. Churchill Road 7 3.8 3. Prospect Road 5 2.7 4. Devonport Terrace 5 2.7 5. Howard Street 5 2.7
Distance between collector district stolen and collector district recovered.SLA Same CD <= 1 km <= 5 km <= 10 km <= 20 km Mean s.d.Prospect (C) 9.8 18.9 51.8 71.3 89.0 8.9 13.4
SLA where vehicle was recovered No. of recovered vehicles % of recovered vehiclesAdelaide (C) 11 6.7Brighton (C) 0 -Burnside (C) 0 -Campbelltown (C) 2 1.2East Torrens (DC) 0 -Elizabeth (C) 4 2.4Enfield (C) 40 24.2Gawler (M) 2 1.2Glenelg (C) 0 -Happy Valley (C) 0 -Henley & Grange (C) 1 0.6Hindmarsh & Woodville (M) 13 7.9Kensington & Norwood (C) 2 1.2Marion (C) 3 1.8Mitcham (C) 2 1.2Munno Para (C) 8 4.8Noarlunga (C) 0 -Payneham (C) 2 1.2Port Adelaide (C) 6 3.6Prospect (C) 35 21.2St. Peters (M) 1 0.6Salisbury (C) 14 8.5Stirling (DC) 1 0.6Tea Tree Gully (C) 5 3.0Thebarton (M) 2 1.2Unley (C) 0 -Walkerville (M) 1 0.6West Torrens (C) 2 1.2Willunga (DC) 0 -Outside Adelaide Statistical Division 7 4.2Interstate 1 0.6Total 165 100.0

APPENDIX A: STATISTICAL LOCAL AREA PROFILES 189

190 MOTOR VEHICLE THEFT IN SOUTH AUSTRALIA, 1998
Table A.21 SLA Profile - Salisbury (C)
Thefts occurring within this SLA - number: 901- rate per 10,000 residents: 80.2
Recoveries occurring within this SLA - number: 963- rate per 10,000 residents: 85.7
Number of thefts from within this SLA that were recovered: 804Recovery rate of vehicles stolen within this SLA during 1998: 89.2%
Number % of theftsThefts where owner resides within the SLA 694 77.0Thefts where owner resides outside the SLA 207 23.0Thefts where owner resides within the SLA and vehicle stolen from their home 434 48.2
Thefts recovered within SLA 487 54.1Thefts recovered outside SLA 414 45.9Thefts that are unrecovered as of 31/12/98 58 6.4
Top theft location types: 1. Street 276 30.6 2. House - driveway 265 29.4 3. Car park - shopping centre 73 8.1 4. Car park - other 62 6.9 5. Car park - hotel/club 43 4.8
Local Hot spots: 1. John Street 31 3.4 2. Montague Road 27 3.0 3. Port Wakefield Road 24 2.7 4. Park Terrace 23 2.6 5. Main North Road 20 2.2
Distance between collector district stolen and collector district recovered.SLA Same CD <= 1 km <= 5 km <= 10 km <= 20 km Mean s.d.Salisbury (C) 11.1 23.2 59.0 75.1 91.9 9.2 27.4
SLA where vehicle was recovered No. of recovered vehicles % of recovered vehiclesAdelaide (C) 17 2.1Brighton (C) 0 -Burnside (C) 1 0.1Campbelltown (C) 3 0.4East Torrens (DC) 1 0.1Elizabeth (C) 34 4.2Enfield (C) 58 7.2Gawler (M) 9 1.1Glenelg (C) 1 0.1Happy Valley (C) 0 -Henley & Grange (C) 1 0.1Hindmarsh & Woodville (M) 17 2.1Kensington & Norwood (C) 1 0.1Marion (C) 2 0.2Mitcham (C) 2 0.2Munno Para (C) 49 6.1Noarlunga (C) 2 0.2Payneham (C) 3 0.4Port Adelaide (C) 16 2.0Prospect (C) 6 0.7St. Peters (M) 3 0.4Salisbury (C) 487 60.6Stirling (DC) 2 0.2Tea Tree Gully (C) 26 3.2Thebarton (M) 0 -Unley (C) 1 0.1Walkerville (M) 1 0.1West Torrens (C) 3 0.4Willunga (DC) 0 -Outside Adelaide Statistical Division 56 7.0Interstate 2 0.2Total 804 100.0

APPENDIX A: STATISTICAL LOCAL AREA PROFILES 191

192 MOTOR VEHICLE THEFT IN SOUTH AUSTRALIA, 1998
Table A.22 SLA Profile - St. Peters (M)
Thefts occurring within this SLA - number: 77- rate per 10,000 residents: 90.1
Recoveries occurring within this SLA - number: 67- rate per 10,000 residents: 78.4
Number of thefts from within this SLA that were recovered: 68Recovery rate of vehicles stolen within this SLA during 1998: 88.3%
Number % of theftsThefts where owner resides within the SLA 38 49.4Thefts where owner resides outside the SLA 39 50.6Thefts where owner resides within the SLA and vehicle stolen from their home 35 45.5
Thefts recovered within SLA 11 14.3Thefts recovered outside SLA 66 85.7Thefts that are unrecovered as of 31/12/98 9 11.7
Top theft location types: 1. Street 54 70.1 2. Car park - other 8 10.4 3. Business premises 4 5.2 4. House - driveway 4 5.2 5. Car park - units/flats 3 3.9
Local Hot spots: 1. Hackney Road 6 7.8 2. Fifth Avenue 5 6.5 3. Harrow Road 5 6.5
Distance between collector district stolen and collector district recovered.SLA Same CD <= 1 km <= 5 km <= 10 km <= 20 km Mean s.d.St Peters (M) 5.9 19.1 57.4 83.8 91.2 9.1 26.2
SLA where vehicle was recovered No. of recovered vehicles % of recovered vehiclesAdelaide (C) 7 10.3Brighton (C) 0 -Burnside (C) 2 2.9Campbelltown (C) 6 8.8East Torrens (DC) 0 -Elizabeth (C) 0 -Enfield (C) 8 11.8Gawler (M) 0 -Glenelg (C) 1 1.5Happy Valley (C) 2 2.9Henley & Grange (C) 0 -Hindmarsh & Woodville (M) 5 7.4Kensington & Norwood (C) 4 5.9Marion (C) 0 -Mitcham (C) 1 1.5Munno Para (C) 1 1.5Noarlunga (C) 1 1.5Payneham (C) 6 8.8Port Adelaide (C) 1 1.5Prospect (C) 2 2.9St. Peters (M) 11 16.2Salisbury (C) 2 2.9Stirling (DC) 0 -Tea Tree Gully (C) 0 -Thebarton (M) 0 -Unley (C) 1 1.5Walkerville (M) 1 1.5West Torrens (C) 4 5.9Willunga (DC) 0 -Outside Adelaide Statistical Division 2 2.9Interstate 0 -Total 68 100.0

APPENDIX A: STATISTICAL LOCAL AREA PROFILES 193

194 MOTOR VEHICLE THEFT IN SOUTH AUSTRALIA, 1998
Table A.23 SLA Profile - Stirling (DC)
Thefts occurring within this SLA - number: 23- rate per 10,000 residents: 13.6
Recoveries occurring within this SLA - number: 36- rate per 10,000 residents: 21.3
Number of thefts from within this SLA that were recovered: 17Recovery rate of vehicles stolen within this SLA during 1998: 73.9%
Number % of theftsThefts where owner resides within the SLA 15 65.2Thefts where owner resides outside the SLA 8 34.8Thefts where owner resides within the SLA and vehicle stolen from their home 9 39.1
Thefts recovered within SLA 8 34.8Thefts recovered outside SLA 15 65.2Thefts that are unrecovered as of 31/12/98 6 26.1
Top theft location types: 1. Street 10 43.5 2. House - driveway 6 26.1 3. Business Premises 3 13.0
Local Hot spots: 1. Mount Barker Road 4 17.4 2. Summit Road 2 8.7
Distance between collector district stolen and collector district recovered.SLA Same CD <= 1 km <= 5 km <= 10 km <= 20 km Mean s.d.Stirling (DC) 29.4 35.3 47.1 58.8 76.5 10.1 10.2
SLA where vehicle was recovered No. of recovered vehicles % of recovered vehiclesAdelaide (C) 0 -Brighton (C) 0 -Burnside (C) 0 -Campbelltown (C) 0 -East Torrens (DC) 0 -Elizabeth (C) 0 -Enfield (C) 1 5.9Gawler (M) 0 -Glenelg (C) 0 -Happy Valley (C) 0 -Henley & Grange (C) 0 -Hindmarsh & Woodville (M) 1 5.9Kensington & Norwood (C) 0 -Marion (C) 0 -Mitcham (C) 0 -Munno Para (C) 0 -Noarlunga (C) 1 5.9Payneham (C) 0 -Port Adelaide (C) 1 5.9Prospect (C) 0 -St. Peters (M) 0 -Salisbury (C) 0 -Stirling (DC) 8 47.1Tea Tree Gully (C) 1 5.9Thebarton (M) 0 -Unley (C) 1 5.9Walkerville (M) 0 -West Torrens (C) 2 11.8Willunga (DC) 0 -Outside Adelaide Statistical Division 1 5.9Interstate 0 -Total 17 100.0
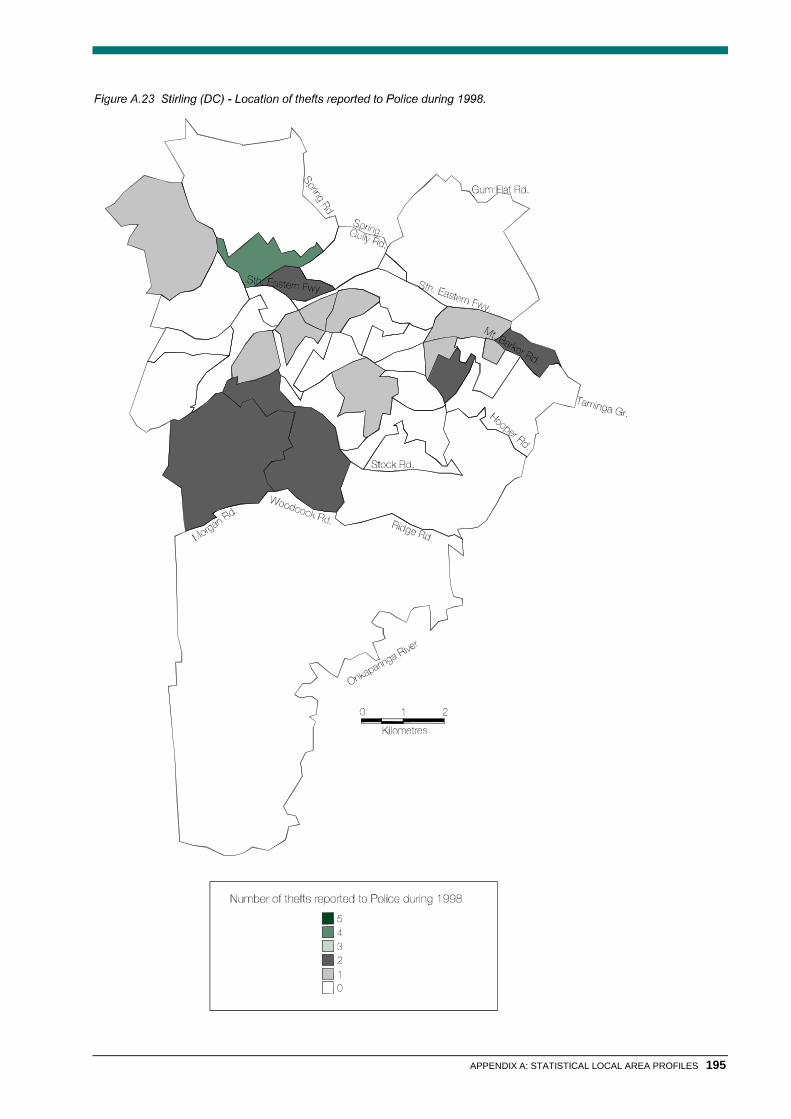
APPENDIX A: STATISTICAL LOCAL AREA PROFILES 195

196 MOTOR VEHICLE THEFT IN SOUTH AUSTRALIA, 1998
Table A.24 SLA Profile - Tea Tree Gully (C)
Thefts occurring within this SLA - number: 570- rate per 10,000 residents: 58.8
Recoveries occurring within this SLA - number: 383- rate per 10,000 residents: 39.5
Number of thefts from within this SLA that were recovered: 508Recovery rate of vehicles stolen within this SLA during 1998: 89.1%
Number % of theftsThefts where owner resides within the SLA 378 66.3Thefts where owner resides outside the SLA 192 33.7Thefts where owner resides within the SLA and vehicle stolen from their home 222 38.9
Thefts recovered within SLA 217 38.1Thefts recovered outside SLA 353 61.9Thefts that are unrecovered as of 31/12/98 62 10.9
Top theft location types: 1. Street 143 25.1 2. Car park - shopping centre 132 23.2 3. House - driveway 116 20.4 4. Car park - other 53 9.3 5. Car park - hotel/club 28 4.9
Local Hot spots: 1. North East Road 201 35.3 2. Smart Road 113 19.8 3. The Golden Way 17 3.0 4. Grand Junction Road 8 1.4 5. Reservoir Road 8 1.4
Distance between collector district stolen and collector district recovered.SLA Same CD <= 1 km <= 5 km <= 10 km <= 20 km Mean s.d.Tea Tree Gully (C) 10.3 20.8 52.3 70.9 90.3 9.2 15.8
SLA where vehicle was recovered No. of recovered vehicles % of recovered vehiclesAdelaide (C) 11 2.2Brighton (C) 2 0.4Burnside (C) 2 0.4Campbelltown (C) 18 3.5East Torrens (DC) 5 1.0Elizabeth (C) 13 2.6Enfield (C) 56 11.0Gawler (M) 2 0.4Glenelg (C) 1 0.2Happy Valley (C) 1 0.2Henley & Grange (C) 1 0.2Hindmarsh & Woodville (M) 7 1.4Kensington & Norwood (C) 0 -Marion (C) 1 0.2Mitcham (C) 2 0.4Munno Para (C) 24 4.7Noarlunga (C) 8 1.6Payneham (C) 5 1.0Port Adelaide (C) 3 0.6Prospect (C) 8 1.6St. Peters (M) 4 0.8Salisbury (C) 60 11.8Stirling (DC) 0 -Tea Tree Gully (C) 217 42.7Thebarton (M) 0 -Unley (C) 4 0.8Walkerville (M) 2 0.4West Torrens (C) 7 1.4Willunga (DC) 2 0.4Outside Adelaide Statistical Division 39 7.7Interstate 3 0.6Total 508 100.0

APPENDIX A: STATISTICAL LOCAL AREA PROFILES 197

198 MOTOR VEHICLE THEFT IN SOUTH AUSTRALIA, 1998
Table A.25 SLA Profile - Thebarton (M)
Thefts occurring within this SLA - number: 116- rate per 10,000 residents: 144.4
Recoveries occurring within this SLA - number: 108- rate per 10,000 residents: 134.4
Number of thefts from within this SLA that were recovered: 108Recovery rate of vehicles stolen within this SLA during 1998: 93.1%
Number % of theftsThefts where owner resides within the SLA 37 31.9Thefts where owner resides outside the SLA 79 68.1Thefts where owner resides within the SLA and vehicle stolen from their home 30 25.9
Thefts recovered within SLA 22 19.0Thefts recovered outside SLA 94 81.0Thefts that are unrecovered as of 31/12/98 8 6.9
Top theft location types: 1. Street 50 43.1 2. Car park - other 19 16.4 3. House - driveway 11 9.5 4. Business premises 10 8.6 5. Car park - hotel/club 8 6.9
Local Hot spots: 1. Henley Beach Road 21 18.1 2. South Road 9 7.8 3. East Terrace 6 5.2 4. Jervois Street 5 4.3 5. Port Road 5 4.3
Distance between collector district stolen and collector district recovered.SLA Same CD <= 1 km <= 5 km <= 10 km <= 20 km Mean s.d.Thebarton (M) 8.3 22.2 57.4 80.6 94.4 6.2 6.8
SLA where vehicle was recovered No. of recovered vehicles % of recovered vehiclesAdelaide (C) 6 5.6Brighton (C) 0 -Burnside (C) 0 -Campbelltown (C) 1 0.9East Torrens (DC) 2 1.9Elizabeth (C) 1 0.9Enfield (C) 9 8.3Gawler (M) 0 -Glenelg (C) 0 -Happy Valley (C) 0 -Henley & Grange (C) 5 4.6Hindmarsh & Woodville (M) 18 16.7Kensington & Norwood (C) 1 0.9Marion (C) 6 5.6Mitcham (C) 1 0.9Munno Para (C) 3 2.8Noarlunga (C) 2 1.9Payneham (C) 0 -Port Adelaide (C) 4 3.7Prospect (C) 3 2.8St. Peters (M) 0 -Salisbury (C) 4 3.7Stirling (DC) 0 -Tea Tree Gully (C) 3 2.8Thebarton (M) 22 20.4Unley (C) 1 0.9Walkerville (M) 0 -West Torrens (C) 16 14.8Willunga (DC) 0 -Outside Adelaide Statistical Division 0 -Interstate 0 -Total 108 100.0

APPENDIX A: STATISTICAL LOCAL AREA PROFILES 199

200 MOTOR VEHICLE THEFT IN SOUTH AUSTRALIA, 1998
Table A.26 SLA Profile - Unley (C)
Thefts occurring within this SLA - number: 220- rate per 10,000 residents: 59.5
Recoveries occurring within this SLA - number: 153- rate per 10,000 residents: 41.4
Number of thefts from within this SLA that were recovered: 196Recovery rate of vehicles stolen within this SLA during 1998: 89.1%
Number % of theftsThefts where owner resides within the SLA 107 48.6Thefts where owner resides outside the SLA 113 51.4Thefts where owner resides within the SLA and vehicle stolen from their home 78 35.5
Thefts recovered within SLA 47 21.4Thefts recovered outside SLA 173 78.6Thefts that are unrecovered as of 31/12/98 24 10.9
Top theft location types: 1. Street 128 58.2 2. Business premises 20 9.1 3. House - driveway 20 9.1 4. Car park - hotel/club 13 5.9 5. Car park - other 13 5.9
Local Hot spots: 1. Goodwood Road 17 7.7 2. Unley Road 15 6.8 3. Greenhill Road 11 5.0 4. Young Street 10 4.5 5. Glen Osmond Road 9 4.1
Distance between collector district stolen and collector district recovered.SLA Same CD <= 1 km <= 5 km <= 10 km <= 20 km Mean s.d.Unley (C) 4.6 18.4 48.5 68.9 89.8 14.1 79.1
SLA where vehicle was recovered No. of recovered vehicles % of recovered vehiclesAdelaide (C) 22 11.2Brighton (C) 2 1.0Burnside (C) 3 1.5Campbelltown (C) 2 1.0East Torrens (DC) 1 0.5Elizabeth (C) 3 1.5Enfield (C) 13 6.6Gawler (M) 2 1.0Glenelg (C) 6 3.1Happy Valley (C) 2 1.0Henley & Grange (C) 1 0.5Hindmarsh & Woodville (M) 12 6.1Kensington & Norwood (C) 1 0.5Marion (C) 12 6.1Mitcham (C) 18 9.2Munno Para (C) 2 1.0Noarlunga (C) 8 4.1Payneham (C) 1 0.5Port Adelaide (C) 2 1.0Prospect (C) 1 0.5St. Peters (M) 1 0.5Salisbury (C) 5 2.6Stirling (DC) 4 2.0Tea Tree Gully (C) 4 2.0Thebarton (M) 2 1.0Unley (C) 47 24.0Walkerville (M) 0 -West Torrens (C) 12 6.1Willunga (DC) 1 0.5Outside Adelaide Statistical Division 6 3.1Interstate 0 -Total 196 100.0

APPENDIX A: STATISTICAL LOCAL AREA PROFILES 201

202 MOTOR VEHICLE THEFT IN SOUTH AUSTRALIA, 1998
Table A.27 SLA Profile - Walkerville (M)
Thefts occurring within this SLA - number: 41- rate per 10,000 residents: 58.6
Recoveries occurring within this SLA - number: 32- rate per 10,000 residents: 45.7
Number of thefts from within this SLA that were recovered: 35Recovery rate of vehicles stolen within this SLA during 1998: 85.4%
Number % of theftsThefts where owner resides within the SLA 25 61.0Thefts where owner resides outside the SLA 16 39.0Thefts where owner resides within the SLA and vehicle stolen from their home 21 51.2
Thefts recovered within SLA 6 14.6Thefts recovered outside SLA 35 85.4Thefts that are unrecovered as of 31/12/98 6 14.6
Top theft location types: 1. Street 23 56.1 2. Car park - hotel/club 6 14.6 3. House - driveway 4 9.8 4. Business premises 4 9.8 5. Car park - recreational 2 4.9
Local Hot spots: 1. The Avenue 6 14.6 2. Walkerville Terrace 5 12.2 3. North East Road 4 9.8 4. Main North Road 3 7.3
Distance between collector district stolen and collector district recovered.SLA Same CD <= 1 km <= 5 km <= 10 km <= 20 km Mean s.d.Walkerville (M) 5.7 14.3 57.1 80.0 94.3 6.5 6.2
SLA where vehicle was recovered No. of recovered vehicles % of recovered vehiclesAdelaide (C) 1 2.9Brighton (C) 0 -Burnside (C) 1 2.9Campbelltown (C) 0 -East Torrens (DC) 0 -Elizabeth (C) 0 -Enfield (C) 6 17.1Gawler (M) 0 -Glenelg (C) 0 -Happy Valley (C) 0 -Henley & Grange (C) 0 -Hindmarsh & Woodville (M) 2 5.7Kensington & Norwood (C) 1 2.9Marion (C) 0 -Mitcham (C) 1 2.9Munno Para (C) 2 5.7Noarlunga (C) 0 -Payneham (C) 3 8.6Port Adelaide (C) 2 5.7Prospect (C) 0 -St. Peters (M) 1 2.9Salisbury (C) 4 11.4Stirling (DC) 0 -Tea Tree Gully (C) 2 5.7Thebarton (M) 1 2.9Unley (C) 0 -Walkerville (M) 6 17.1West Torrens (C) 1 2.9Willunga (DC) 0 -Outside Adelaide Statistical Division 1 2.9Interstate 0 -Total 35 100.0

APPENDIX A: STATISTICAL LOCAL AREA PROFILES 203

204 MOTOR VEHICLE THEFT IN SOUTH AUSTRALIA, 1998
Table A.28 SLA Profile - West Torrens (C)
Thefts occurring within this SLA - number: 291- rate per 10,000 residents: 66.4
Recoveries occurring within this SLA - number: 314- rate per 10,000 residents: 71.7
Number of thefts from within this SLA that were recovered: 265Recovery rate of vehicles stolen within this SLA during 1998: 91.1%
Number % of theftsThefts where owner resides within the SLA 162 55.7Thefts where owner resides outside the SLA 129 44.3Thefts where owner resides within the SLA and vehicle stolen from their home 102 35.1
Thefts recovered within SLA 81 27.8Thefts recovered outside SLA 210 72.2Thefts that are unrecovered as of 31/12/98 26 8.9
Top theft location types: 1. Street 121 41.6 2. Business premises 40 13.7 3. Car park - untis/flats 28 9.6 4. House - driveway 28 9.6 5. Car park - other 27 9.3
Local Hot spots: 1. Henley Beach Road 26 8.9 2. Anzac Highway 22 7.6 3. Richmond Road 22 7.6 4. Marion Road 11 3.8 5. Burbridge Road 10 3.4
Distance between collector district stolen and collector district recovered.SLA Same CD <= 1 km <= 5 km <= 10 km <= 20 km Mean s.d.West Torrens (C) 5.3 19.5 60.3 80.5 92.7 8.5 19.3
SLA where vehicle was recovered No. of recovered vehicles % of recovered vehiclesAdelaide (C) 20 7.5Brighton (C) 1 0.4Burnside (C) 1 0.4Campbelltown (C) 0 -East Torrens (DC) 1 0.4Elizabeth (C) 1 0.4Enfield (C) 10 3.8Gawler (M) 0 -Glenelg (C) 5 1.9Happy Valley (C) 3 1.1Henley & Grange (C) 22 8.3Hindmarsh & Woodville (M) 21 7.9Kensington & Norwood (C) 1 0.4Marion (C) 22 8.3Mitcham (C) 5 1.9Munno Para (C) 1 0.4Noarlunga (C) 3 1.1Payneham (C) 2 0.8Port Adelaide (C) 11 4.2Prospect (C) 1 0.4St. Peters (M) 0 -Salisbury (C) 7 2.6Stirling (DC) 3 1.1Tea Tree Gully (C) 1 0.4Thebarton (M) 19 7.2Unley (C) 9 3.4Walkerville (M) 0 -West Torrens (C) 81 30.6Willunga (DC) 1 0.4Outside Adelaide Statistical Division 10 3.8Interstate 3 1.1Total 265 100.0

APPENDIX A: STATISTICAL LOCAL AREA PROFILES 205

206 MOTOR VEHICLE THEFT IN SOUTH AUSTRALIA, 1998
Table A.29 SLA Profile - Willunga (DC)
Thefts occurring within this SLA - number: 43- rate per 10,000 residents: 28.1
Recoveries occurring within this SLA - number: 63- rate per 10,000 residents: 41.2
Number of thefts from within this SLA that were recovered: 36Recovery rate of vehicles stolen within this SLA during 1998: 83.7%
Number % of theftsThefts where owner resides within the SLA 32 74.4Thefts where owner resides outside the SLA 11 25.6Thefts where owner resides within the SLA and vehicle stolen from their home 19 44.2
Thefts recovered within SLA 12 27.9Thefts recovered outside SLA 31 72.1Thefts that are unrecovered as of 31/12/98 7 16.3
Top theft location types: 1. Street 14 32.6 2. House - driveway 10 23.3 3. Car park - hotel/club 6 14.0 4. Car park - shopping centre 4 9.3
Local Hot spots: 1. Main Road 9 20.9 2. Desoto Drive 2 4.7 3. Gulf Parade 2 4.7 4. Warrigal Road 2 4.7
Distance between collector district stolen and collector district recovered.SLA Same CD <= 1 km <= 5 km <= 10 km <= 20 km Mean s.d.Willunga (DC) 5.9 5.9 17.6 55.9 85.3 12.8 10.7
SLA where vehicle was recovered No. of recovered vehicles % of recovered vehiclesAdelaide (C) 0 -Brighton (C) 0 -Burnside (C) 0 -Campbelltown (C) 0 -East Torrens (DC) 0 -Elizabeth (C) 0 -Enfield (C) 0 -Gawler (M) 0 -Glenelg (C) 0 -Happy Valley (C) 1 2.8Henley & Grange (C) 0 -Hindmarsh & Woodville (M) 0 -Kensington & Norwood (C) 0 -Marion (C) 3 8.3Mitcham (C) 0 -Munno Para (C) 0 -Noarlunga (C) 15 41.7Payneham (C) 0 -Port Adelaide (C) 0 -Prospect (C) 0 -St. Peters (M) 0 -Salisbury (C) 0 -Stirling (DC) 0 -Tea Tree Gully (C) 1 2.8Thebarton (M) 0 -Unley (C) 1 2.8Walkerville (M) 0 -West Torrens (C) 0 -Willunga (DC) 12 27.9Outside Adelaide Statistical Division 1 2.8Interstate 2 5.6Total 36 100.0

APPENDIX A: STATISTICAL LOCAL AREA PROFILES 207

208 MOTOR VEHICLE THEFT IN SOUTH AUSTRALIA, 1998

209
A P P E N D I X B : E X P L A N T O R Y N O T E S A N D D E F I N I T I O N S

210 MOTOR VEHICLE THEFT IN SOUTH AUSTRALIA, 1998

APPENDIX B: EXPLANATORY NOTES & DEFINITIONS
211
The CARS Project. CARS, Comprehensive Auto-Theft Research System, was the initiativeof the South Australian Government Vehicle Theft ReductionCommittee, a joint private and public sector group served with advisinggovernment on strategies to reduce motor vehicle theft. It wasestablished in August 1994 with the aim of facilitating a coordinatedapproach to the development of theft reduction policies via the provisionof timely and reliable data, integrated from a wide variety of sources.Therefore, for the first time in Australia, police, crime preventionpractitioners, policy makers, researchers, vehicle manufacturers,motoring organisations, insurance companies etc. have access to acomprehensive source of information that will provide a detailedoverview of motor vehicle theft in this state.
A driving force behind the CARS database was the view that whilemany organisations collect their own data, only by sharing theinformation can the whole picture be analysed and effective countermeasures be implemented.The CARS database is supplied with data from three major sources:
• Police - monthly extracts of data relating to both thefts andrecoveries are obtained from the operational database (VOI) and thestatistical database (PIMS).
• TransportSA - for all stolen and recovered vehicles a monthly extract
is supplied by the Registration and Licensing Section providingvehicle details from the DRIVERS database.
• Insurance Companies - details relating to the type of policy, the costs
incurred, type of damaged sustained and salvage costs andexpenses, etc. are recorded by claims staff from all companiesoffering motor vehicle insurance in South Australia.
This information is supplemented with additional information including:• population data.• number of registrations by make/body type/age/colour.• details of vehicles participating in various prevention programmes
such as Stop Auto Theft and Marked for Life.• police apprehension data and prior conviction statistics.• juvenile offender data including statistics relating to formal cautions,
family conferences and Youth Court appearances.• adult court appearances (Magistrates, District and Supreme Courts).• Correctional Services statistics• interstate data
Collection of data for CARS commenced on January 1st 1995 and thisreport analyses data collected during the fourth year of its operation. Itis intended that this report will serve as a reference tool for researchersand policy advisers by providing accurate and reliable statistics fromwhich trends can be monitored and prevention initiatives accuratelyevaluated. It is also hoped that the project will encourage greaterinterest and attention to the issue of motor vehicle theft and stimulatefurther research.

212 MOTOR VEHICLE THEFT IN SOUTH AUSTRALIA, 1998
Motor vehicle The standard definition employed by the Australian Bureau of Statistics’National Crime Statistics Unit has been utilised throughout this project,namely: a motor vehicle is a self propelled vehicle that runs on landsurface (but not restricted by rails or tram lines) and is eligible forregistration for use on public roads. This includes but is not limited to:cars, motor cycles, campervans, trucks, lorries, buses, graders andtractors. It excludes trailers, caravans, bicycles and floats.
Motor vehicle theft Motor vehicle theft is defined as the taking of another person’s motorvehicle unlawfully or without permission. It includes the offences ofillegal use of a motor vehicle and larceny of a motor vehicle, andexcludes damaging, tampering or interfering with a motor vehicle.One offence is recorded per motor vehicle per incident.
Police statistics Theft statistics are based on offences that have been reported orbecome known to the South Australian Police. As such they do notrepresent the total number of thefts because a proportion of thefts willnot be reported. Data from the Australian Bureau of Statistics’ 1998Crime and Safety Survey suggests that 94.9% of South Australianvictims reported their vehicle theft to police.
Insurance Data Insurance data are manually collated by insurance company staff whocomplete two coding forms. The first form collects details relating to thedate of theft and date reported; the State in which the vehicle isregistered and where the vehicle is insured; the type of policy andextent of cover; inception and expiry date of the policy; the dateindemnity was accepted; the value of items stolen and/or damaged;costs incurred by the insurer; the presence of any fraud indicators; theage and sex of the last person to drive the vehicle; the use of thevehicle prior to the theft; the condition of any recovered vehicle; andwhether the vehicle will be returned to the owner or retained by theinsurer. The second form is completed only if the vehicle is recoveredby the insurer and subsequently salvaged. It records the date ofsalvage; the salvage value; the costs incurred in salvaging the vehicle;and the reason for salvage.
Reporting period Cases are included in this report if the reference date falls within theperiod 1 January to 31 December, inclusive, of the reporting year. ForPolice theft and recovery data the reference date is the date the theft orrecovery is reported or becomes known to police. As a consequence,recovery statistics do not necessarily relate to vehicles stolen during thecurrent period, but may refer to vehicles stolen in previous reportingperiods.
For insurance claim data the reference date is the date the forms arereceived by the Office of Crime Statistics. Forms received outside thereporting period will be included in future reports.

APPENDIX B: EXPLANATORY NOTES & DEFINITIONS 213
Rates Throughout this report three types of rates are referred to:
Rate per 100,000 population: these are based on the estimated residentpopulation as of 30 June each year and published by the AustralianBureau of Statistics (Catalogue No. 3101.0)
Rates per 10,000 registered vehicles: these rates are calculated bydividing the number of vehicles by the number of registered vehiclesand multiplying the result by 10,000. The denominator in thiscalculation is supplied by the South Australian Registrar of MotorVehicles and represents the number of vehicles on the register as at 30June each year. It is acknowledged that this source will not capturevehicles which have never been registered (eg. trail bikes for use onfarms), vehicles with lapsed registration or vehicles registeredinterstate. Vehicles such as trailers and caravans which fall outside theproject’s definition of a motor vehicle are not included in the calculation.
Non-Recovery rate: is the number of vehicles stolen and not recoveredper 10,000 registrations, i.e.
Non-recovery rate = (Number of thefts - Number of recoveries) x 10,000 Number of registered vehicles
Higher non-recovery rates indicate increased risk of the vehicle beingstolen and not recovered. In cases where the number of vehiclesrecovered exceeds the number stolen the non-recovery rate is 0.
Date and time of theft This is the earliest possible date and time of the theft. For example, ifan owner parked their vehicle at 6.00 pm January 1st and returned 8.00am the following morning to find the vehicle stolen. The databaserecords both the earliest possible time (ie. 6.00 pm) and the latestpossible time (ie. 8.00 am). However, unless otherwise stated theanalyses included in this report use the earliest possible time.
Alleged offender The term alleged offender describes persons allegedly involved inoffences cleared and apprehended by the police during the relevantperiod. Not all of these people will subsequently be found guilty of anoffence in court.
Details relating to the age, sex, marital status and employment statusare recorded at the time of apprehension. For analyses of uniqueindividuals who have been apprehended on more than one occasionthroughout the reporting period, the age refers to the time of the firstapprehension during the reporting period.
‘Number of prior convictions’ refers to the number of individual countsfor which the alleged offender has been convicted at the time ofapprehension. It excludes any subsequent convictions for thosecharges on which they were apprehended. It also excludes anycharges for which they were found guilty but had no convictionrecorded.
214 MOTOR VEHICLE THEFT IN SOUTH AUSTRALIA, 1998
Amount paid to policy holder This is the total amount of any payments made by an insurer directly tothe policyholder. It may include amounts for car rental etc. if suchamounts are refunded directly to the policyholder.
Insurer’s outgoing costs This is the cost incurred by the insurer to settle the claim. It includes allrepair costs, investigation costs, payments to the policy holder and carrental fees minus any excess paid by the policyholder. It excludes anycost relating to the salvage of the vehicle (see below) or any amountrecouped through the salvage of a recovered vehicle.
Salvage costs This is the total cost incurred by the insurer with respect to the processof salvaging any recovered vehicle and/or its parts. It includes feesincurred in towing the vehicle to the place of salvage and auctioneerfees.
Salvage revenue This refers to the amount the insurer was able to recoup through thesale of any recovered vehicle and/or its parts, prior to fees beingdeducted.
Suspicion of fraud Insurers were asked to record if the claim received any extra or specialscrutiny because of the suspicion of fraud (irrespective of whether thesuspicion was proven or not).
Home thefts Home thefts are defined as thefts where the location of the theft (streetand suburb name) match the owners address and the type of locationwas recorded as a house, flat, unit, driveway, front or back yard, shed,street or footpath.
S.A.’s Juvenile Justice System On 1 January 1994 a new juvenile justice system was introduced intoSouth Australia. Under this new system the police have a range ofoptions of dealing with juveniles. If the offence committed by a juvenileis trivial in nature it is within a police officer’s discretion to deliver aninformal police caution. These are given ‘on the spot’ and no officialrecord is kept. For non trivial matters in which the individual admits theoffence the police officer can take one of three actions: they canadminister a formal police caution and impose various sanctions suchas compensation or community service work; they can refer the case toa family conference where the offender, their parents, friends, policeand the victim agree upon the outcome; or they can charge the youngoffender and refer to case to the Youth Court. In instances where thealleged offender denies the offence the matter is referred to the YouthCourt. Family Conferences did not commence until February 1994and therefore the data presented for these cases in the 1995 CARSreport relate only to the 11 months ending December 1994.

APPENDIX B: EXPLANATORY NOTES & DEFINITIONS 215
Differences between CARS data and agency published data As stated in the introduction every efforthas been taken to ensure that the data presented in this report are asaccurate as possible. There does exist the possibility, however, thatminor differences may occur between the statistics published from theCARS database and those published by other agencies.
These differences can occur for a number of reasons including:
• Corrections made by the Office of Crime Statistics. In addition toquality controls conducted by the originating agencies, the Office ofCrime Statistics conducts a number of additional checks. Crossreferencing details from all data sources provides the Office with theability to detect additional errors or complete information which mayhave been missing in the original source files.
• Counting rules may differ between databases and organisations.Standard definitions and counting rules employed by the AustralianBureau of Statistics’ National Crime Statistics Unit are utilisedwherever possible, although where no such standards existdifferences in definitions and counting rules may arise betweenorganisations. For example, police ‘reported crime’ statistics countall offences alleged, whereas court statistics are based on individualdefendants appearing, possibly with a number of separate mattersconsolidated into the one case, and only the most serious chargebeing shown.
• Date of extraction of the data from the originating source. For
example, the Police Department’s Statistical Services Sectionconducts validity and quality controls checks on an ongoing basisand data may be corrected after the monthly CARS extract has beenproduced. Likewise information which may have been unavailableat the time of the extract may be added in at a later date and thusresult in slight differences between datasets.
These differences, while minor, will mean that readers should usecaution when comparing statistics from the CARS database with thosefrom other sources.