mott community college 2011 ccsse/ccfsse results september 27, 2011 general faculty meeting steve...
TRANSCRIPT
Mott Community College2011 CCSSE/CCFSSE Results
September 27, 2011General Faculty Meeting
Steve RobinsonPlanning, Research & Quality

Outline
• Overview of CCSSE/CCFSSE instrument• Response rates• General review of 2011 Results• 2009/2011 CCSSE Benchmarks
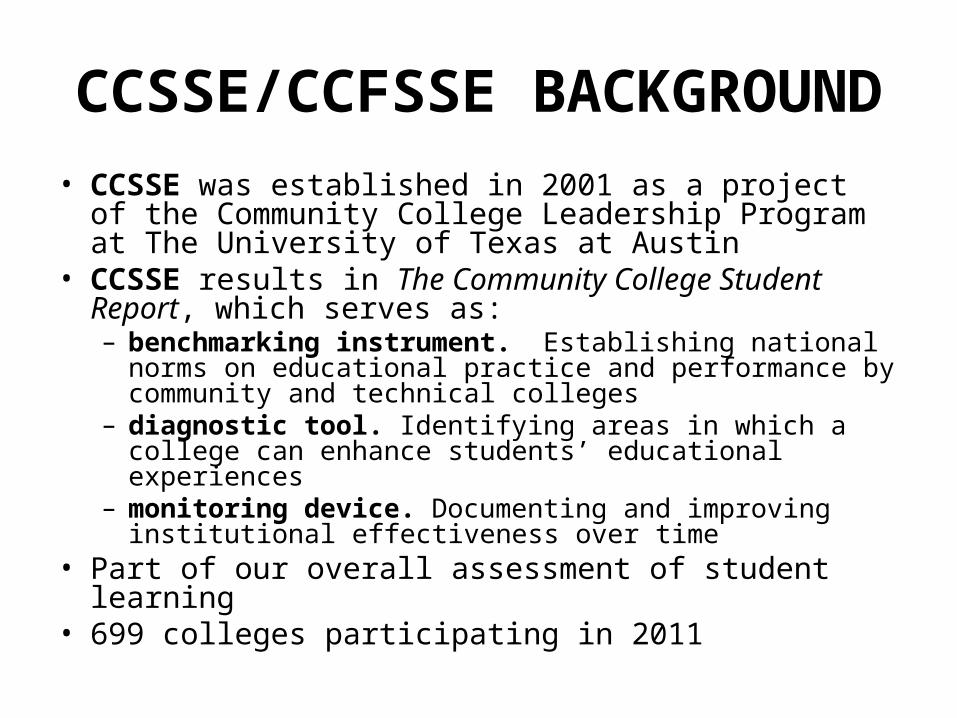
CCSSE/CCFSSE BACKGROUND• CCSSE was established in 2001 as a project of the
Community College Leadership Program at The University of Texas at Austin
• CCSSE results in The Community College Student Report, which serves as:– benchmarking instrument. Establishing national norms on
educational practice and performance by community and technical colleges
– diagnostic tool. Identifying areas in which a college can enhance students’ educational experiences
– monitoring device. Documenting and improving institutional effectiveness over time
• Part of our overall assessment of student learning• 699 colleges participating in 2011

CCSSE/CCFSSE BACKGROUND
• CCSSE/CCFSSE are two different surveys– In-class student survey– Online faculty survey
• Administered in Winter 2011• Both surveys are national measures of
perceptions of STUDENT ENGAGEMENT on a range of academic and support items

MCC Completion Rates
2009/2011 CCFSSE (Faculty Survey) Response
2009/2011 CCSSE (Student Survey) Responses
OverallCompletion Rate
Within Class Completion Rate
Percent of Sampled Classes Surveyed
2009 2011 2009 2011 2009 2011
All Large CCSSE Colleges 53% 54% 61% 62% 88% 88%
Mott Community College 60% 61% 63% 63% 97% 97%
Invitations Responses Non-Responses RATE2009 2011 2009 2011 2009 2011 2009 2011
Mott Community College 374 520 119 260 225 260 31.8% 50.0%
CCFSSE Average Institutional Response Rate 35.0% 44.0%

CCFSSE Responses Full-time/Part-time

CCFSSE Responses Full-time/Part-time(by group)

Above the Mean
• Made a class presentation• Prepared two or more drafts of a paper or
assignment before turning it in• Worked with other students on projects
during class• Preparing for class (studying, reading, writing,
rehearsing, doing homework, or other activities related to your program)

Below the Mean
• Used e-mail to communicate with an instructor
• Worked with instructors on activities other than coursework
• Helping you cope with your non-academic responsibilities (work, family, etc.)
• Providing the support you need to thrive socially

Active & Collaborative Learning Benchmark Item Comparison—All Students
Your College Mean
Other Large Colleges Mean
CCSSE Cohort Mean
CCSSE Cohort Mean
Active & Collaborative Learning 2009 2011 2009 2011 2009 2011
4a. Asked questions in class or contributed to class discussions 2.85 2.96 2.88 2.89 2.91 2.92
4b . Made a class presentation 2.06 2.17 2.04 2.09 2.05 2.08
4f. Worked with other students on projects during class 2.63 2.61 2.45 2.48 2.47 2.50
4g. Worked with classmates outside of class to prepare class assignments 1.76 1.80 1.84 1.90 1.87 1.90
4h. Tutored or taught other students (paid or voluntary) 1.30 1.29 1.37 1.38 1.37 1.38
4i. Participated in a community-based project as a part of a regular course 1.22 1.26 1.30 1.31 1.31 1.32
4r. Discussed ideas from your readings or classes with others outside of class (students, family members, co-workers, etc.) 2.65 2.63 2.55 2.56 2.56 2.57
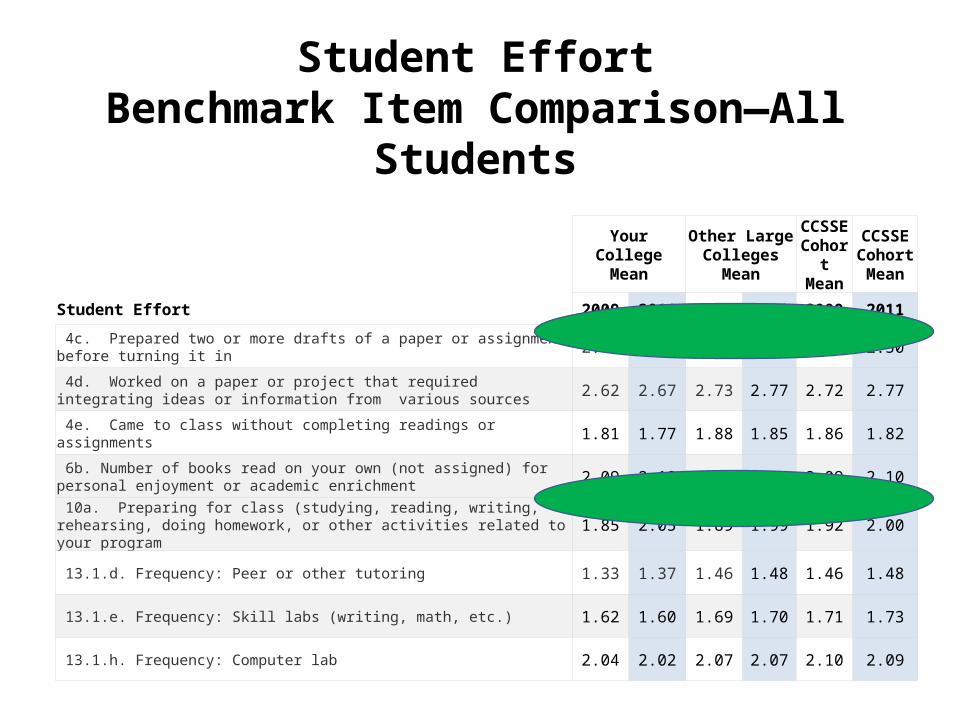
Student EffortBenchmark Item Comparison—All Students
Your College Mean
Other Large Colleges Mean
CCSSE Cohort Mean
CCSSE Cohort Mean
Student Effort 2009 2011 2009 2011 2009 2011
4c. Prepared two or more drafts of a paper or assignment before turning it in 2.49 2.59 2.47 2.50 2.47 2.50
4d. Worked on a paper or project that required integrating ideas or information from various sources 2.62 2.67 2.73 2.77 2.72 2.77
4e. Came to class without completing readings or assignments 1.81 1.77 1.88 1.85 1.86 1.82
6b. Number of books read on your own (not assigned) for personal enjoyment or academic enrichment 2.09 2.10 2.11 2.11 2.09 2.10
10a. Preparing for class (studying, reading, writing, rehearsing, doing homework, or other activities related to your program 1.85 2.05 1.89 1.99 1.92 2.00
13.1.d. Frequency: Peer or other tutoring 1.33 1.37 1.46 1.48 1.46 1.48
13.1.e. Frequency: Skill labs (writing, math, etc.) 1.62 1.60 1.69 1.70 1.71 1.73
13.1.h. Frequency: Computer lab 2.04 2.02 2.07 2.07 2.10 2.09

Academic ChallengeBenchmark Item Comparison—All Students
Your College Mean
Other Large Colleges Mean
CCSSE Cohort Mean
CCSSE Cohort Mean
Academic Challenge 2009 2011 2009 2011 2009 2011
4p. Worked harder than you thought you could to meet an instructor's standards or expectations 2.51 2.57 2.52 2.58 2.54 2.59
5b. Analyzing the basic elements of an idea, experience, or theory 2.85 2.79 2.87 2.90 2.85 2.89
5c. Synthesizing and organizing ideas, information, or experiences in new ways 2.65 2.67 2.72 2.76 2.72 2.76
5d. Making judgments about the value or soundness of information, arguments, or methods 2.48 2.43 2.56 2.59 2.56 2.59
5e. Applying theories or concepts to practical problems or in new situations 2.56 2.57 2.65 2.69 2.66 2.69
5f. Using information you have read or heard to perform a new skill 2.70 2.79 2.74 2.79 2.76 2.80
6a. Number of assigned textbooks, manuals, books, or book-length packs of course readings 2.79 2.89 2.85 2.88 2.86 2.90
6c. Number of written papers or reports of any length 2.58 2.90 2.83 2.89 2.83 2.89
7. Mark the box that best represents the extent to which your examinations during the current school year have challenged you to do your best work at this college
4.87 4.87 4.95 4.96 4.99 4.99
9a. Encouraging you to spend significant amounts of time studying 2.99 2.94 2.95 2.99 2.97 3.01

Student-Faculty InteractionBenchmark Item Comparison—All Students
Your College Mean
Other Large Colleges Mean
CCSSE Cohort Mean
CCSSE Cohort Mean
Student-Faculty Interaction 2009 2011 2009 2011 2009 2011
4k. Used email to communicate with an instructor 2.41 2.51 2.60 2.78 2.59 2.76
4l. Discussed grades or assignments with an instructor 2.43 2.54 2.50 2.54 2.52 2.56
4m. Talked about career plans with an instructor or advisor 2.07 2.07 1.99 2.01 2.03 2.05
4n. Discussed ideas from your readings or classes with instructors outside of class 1.69 1.63 1.71 1.74 1.74 1.75
4o. Received prompt feedback (written or oral) from instructors on your performance 2.57 2.55 2.65 2.67 2.66 2.68
4q. Worked with instructors on activities other than coursework 1.33 1.30 1.39 1.40 1.41 1.42

Support for LearnersBenchmark Item Comparison—All Students
Your College Mean
Other Large Colleges Mean
CCSSE Cohort Mean
CCSSE Cohort Mean
Support for Learners 2009 2011 2009 2011 2009 2011
9b. Providing the support you need to help you succeed at this college 2.92 2.77 2.96 2.96 2.97 2.99
9c. Encouraging contact among students from different economic, social, and racial or ethnic backgrounds 2.54 2.45 2.52 2.55 2.49 2.53
9d. Helping you cope with your non-academic responsibilities (work, family, etc.) 1.82 1.70 1.93 1.94 1.94 1.95
9e. Providing the support you need to thrive socially 2.08 1.97 2.13 2.15 2.14 2.17
9f. Providing the financial support you need to afford your education 2.45 2.56 2.36 2.47 2.43 2.54
13.1.a. Frequency: Academic advising/planning 1.84 1.83 1.74 1.74 1.76 1.78
13.1b. Frequency: Career counseling 1.51 1.40 1.43 1.42 1.43 1.43
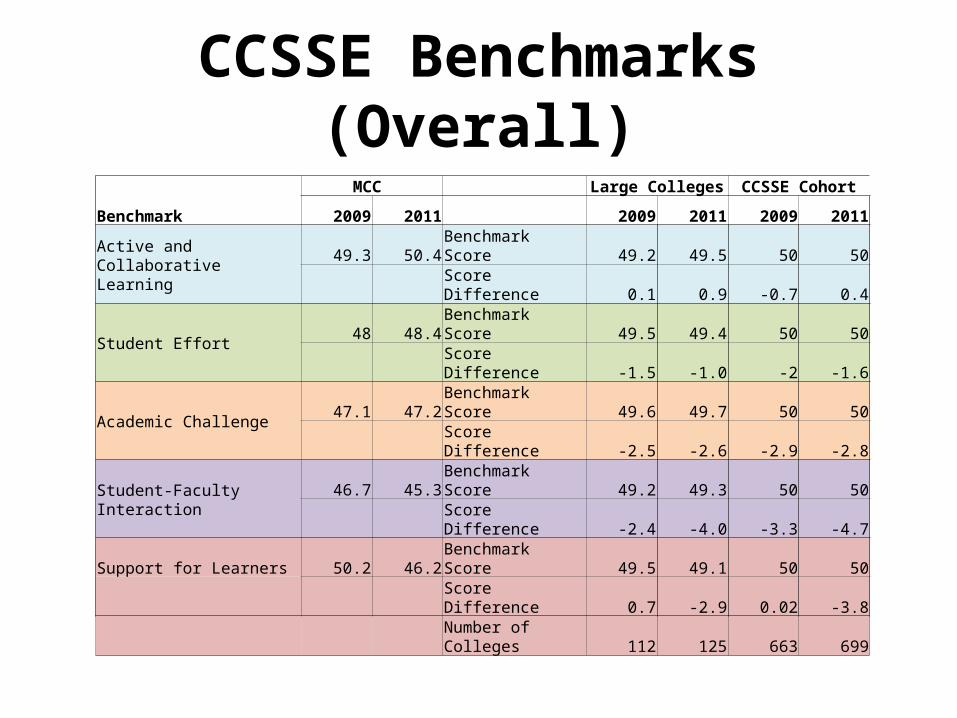
CCSSE Benchmarks (Overall)
Benchmark
MCC Large Colleges CCSSE Cohort
2009 2011 2009 2011 2009 2011
Active and Collaborative Learning
49.3 50.4Benchmark Score 49.2 49.5 50 50
Score Difference 0.1 0.9 -0.7 0.4
Student Effort 48 48.4Benchmark Score 49.5 49.4 50 50
Score Difference -1.5 -1.0 -2 -1.6
Academic Challenge 47.1 47.2Benchmark Score 49.6 49.7 50 50 Score Difference -2.5 -2.6 -2.9 -2.8
Student-Faculty Interaction46.7 45.3Benchmark Score 49.2 49.3 50 50
Score Difference -2.4 -4.0 -3.3 -4.7Support for Learners 50.2 46.2Benchmark Score 49.5 49.1 50 50
Score Difference 0.7 -2.9 0.02 -3.8
Number of Colleges 112 125 663 699

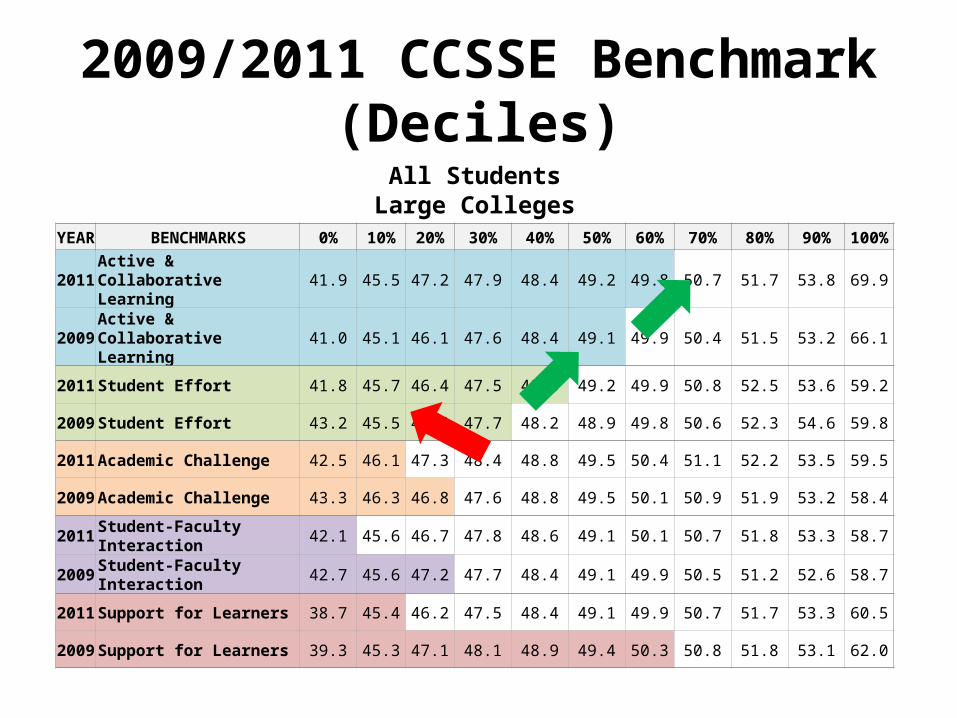
2009/2011 CCSSE Benchmark (Deciles)
All StudentsLarge Colleges
YEAR BENCHMARKS 0% 10% 20% 30% 40% 50% 60% 70% 80% 90% 100%
2011 Active & Collaborative Learning 41.9 45.5 47.2 47.9 48.4 49.2 49.8 50.7 51.7 53.8 69.9
2009 Active & Collaborative Learning 41.0 45.1 46.1 47.6 48.4 49.1 49.9 50.4 51.5 53.2 66.1
2011 Student Effort 41.8 45.7 46.4 47.5 48.3 49.2 49.9 50.8 52.5 53.6 59.2
2009 Student Effort 43.2 45.5 46.4 47.7 48.2 48.9 49.8 50.6 52.3 54.6 59.8
2011 Academic Challenge 42.5 46.1 47.3 48.4 48.8 49.5 50.4 51.1 52.2 53.5 59.5
2009 Academic Challenge 43.3 46.3 46.8 47.6 48.8 49.5 50.1 50.9 51.9 53.2 58.4
2011 Student-Faculty Interaction 42.1 45.6 46.7 47.8 48.6 49.1 50.1 50.7 51.8 53.3 58.7
2009 Student-Faculty Interaction 42.7 45.6 47.2 47.7 48.4 49.1 49.9 50.5 51.2 52.6 58.7
2011 Support for Learners 38.7 45.4 46.2 47.5 48.4 49.1 49.9 50.7 51.7 53.3 60.5
2009 Support for Learners 39.3 45.3 47.1 48.1 48.9 49.4 50.3 50.8 51.8 53.1 62.0