mousetrap simple machine - discovery press … by: terry speicher; document by: kathleen hauser and...
TRANSCRIPT

SIMPLE MACHINE PROJECT 1 of 21
Penn State University – Berks Campus, EDSGN 100 Project by: Terry Speicher; Document by: Kathleen Hauser and Elizabeth Wiggins
Submitted by: Andy Lau
[email protected] Elizabeth Wiggins-Lopez [email protected] Pennsylvania State University
Reverse Engineering of a Simple Machine
Project Purpose: This project provides an opportunity to recreate an existing mousetrap simple machine design. The goal is to redesign the machine and build a more efficient, cost effective, safer simple machine. In this project, the physical concepts of work done by a variable force and work done by gravity are used as the basis for analysis.
Figure 1: Baseline Simple Machine

SIMPLE MACHINE PROJECT 2 of 21
Penn State University – Berks Campus, EDSGN 100 Project by: Terry Speicher; Document by: Kathleen Hauser and Elizabeth Wiggins
Project Description: Figure 1 shows the baseline simple machine which uses a mousetrap to raise an object using fishing line. When the mousetrap is set, the presence of the loaded spring gives it elastic potential energy in the form of strain. At the moment the spring is released, the potential energy is converted to kinetic energy. Once the object is raised, it stores gravitational potential energy.
Loaded Spring → Released Spring → Raised Object
Potential Energy → Kinetic Energy → Potential Energy
The goals of this project are as follows: • to conceptually design a system to meet desired needs within realistic constraints. • to participate effectively in small teams. • to communicate effectively using written and graphical forms and oral presentations. • to use software tools relevant to engineering
To accomplish the above goals, students will:
• generate multiple concept solutions and choose the best by methodically evaluating them for a given set of design objectives.
• construct a physical prototype of a design concept.
• assess the success of the concept vis-à-vis the design objectives.
• contribute fairly to team project work.
• take responsibility as team members.
• develop and follow a timetable to complete a task.
• explain and defend a decision based on substantiated data, both verbally and in written form.
• utilize a wide variety of resources and tools to communicate their ideas.
• communicate their ideas and concepts using hand sketches such as pictorial and multi-views.
• summarize and communicate design activities from problem development through final conceptual using oral, graphical, and written communication.
• use modeling for conceptual development and design communication.
• use word processing, spreadsheets, and presentation software.
SIMPLE MACHINE PROJECT 3 of 21
Penn State University – Berks Campus, EDSGN 100 Project by: Terry Speicher; Document by: Kathleen Hauser and Elizabeth Wiggins
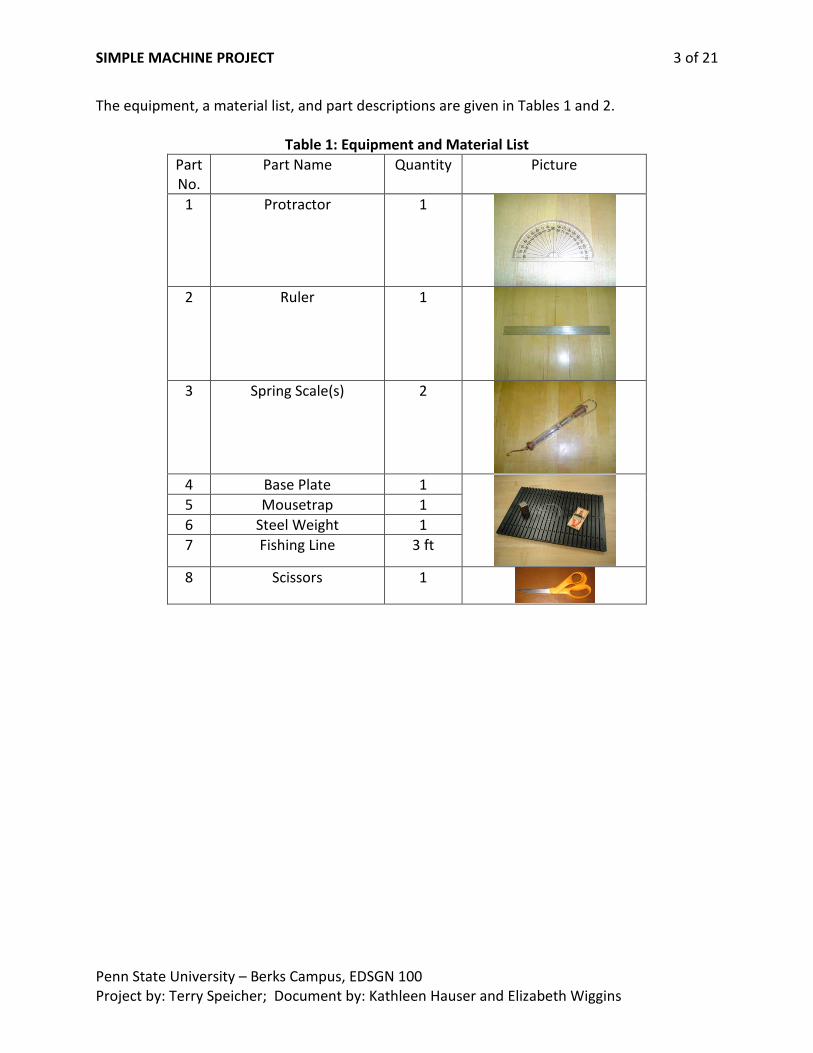
The equipment, a material list, and part descriptions are given in Tables 1 and 2.
Table 1: Equipment and Material List Part No.
Part Name Quantity Picture
1 Protractor 1
2 Ruler 1
3 Spring Scale(s) 2
4 Base Plate 1
5 Mousetrap 1 6 Steel Weight 1 7 Fishing Line 3 ft
8 Scissors 1
SIMPLE MACHINE PROJECT 4 of 21
Penn State University – Berks Campus, EDSGN 100 Project by: Terry Speicher; Document by: Kathleen Hauser and Elizabeth Wiggins
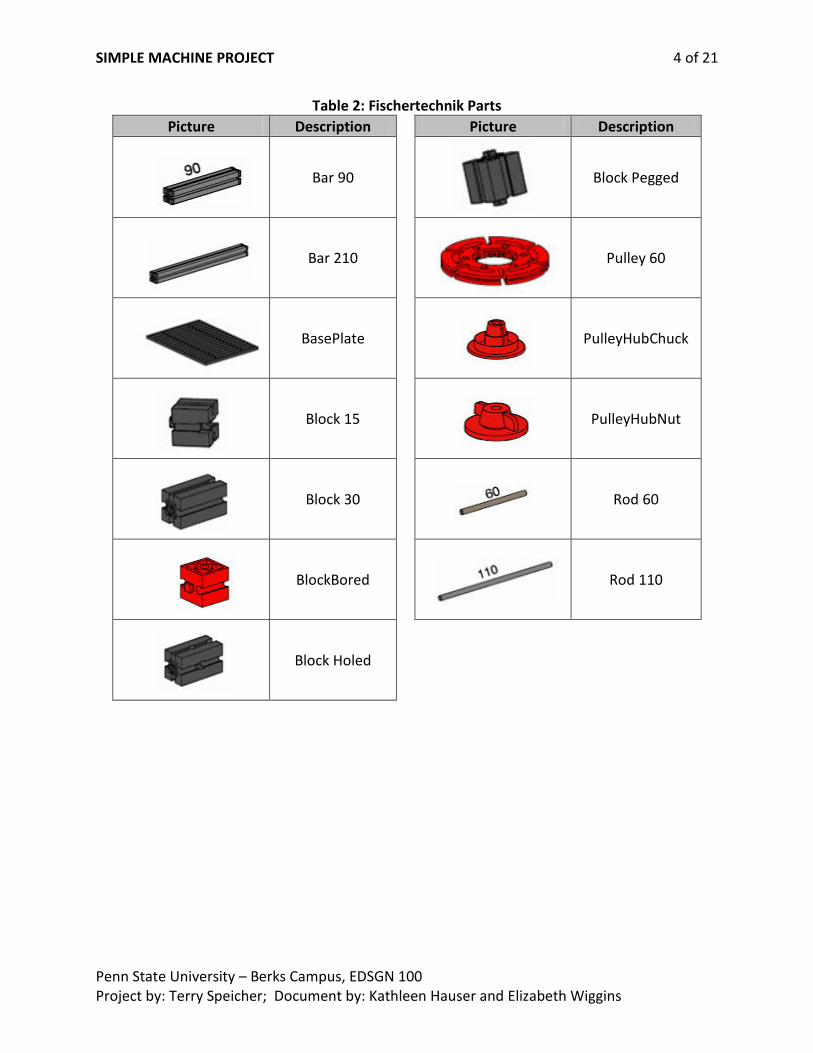
Table 2: Fischertechnik Parts Picture Description Picture Description
Bar 90
Block Pegged
Bar 210
Pulley 60
BasePlate
PulleyHubChuck
Block 15
PulleyHubNut
Block 30
Rod 60
BlockBored
Rod 110
Block Holed
SIMPLE MACHINE PROJECT 5 of 21
Penn State University – Berks Campus, EDSGN 100 Project by: Terry Speicher; Document by: Kathleen Hauser and Elizabeth Wiggins
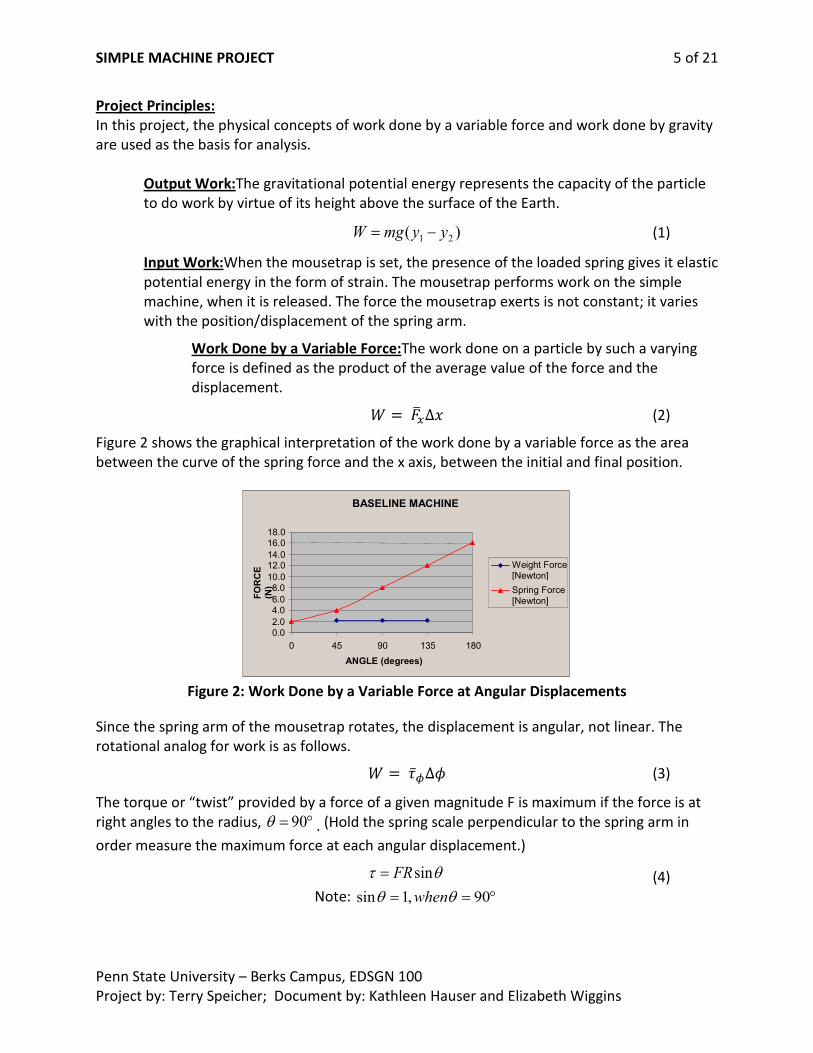
Project Principles: In this project, the physical concepts of work done by a variable force and work done by gravity are used as the basis for analysis.
Output Work:The gravitational potential energy represents the capacity of the particle to do work by virtue of its height above the surface of the Earth.
)( 21 yymgW −= (1)
Input Work:When the mousetrap is set, the presence of the loaded spring gives it elastic potential energy in the form of strain. The mousetrap performs work on the simple machine, when it is released. The force the mousetrap exerts is not constant; it varies with the position/displacement of the spring arm.
Work Done by a Variable Force:The work done on a particle by such a varying force is defined as the product of the average value of the force and the displacement.
(2)
Figure 2 shows the graphical interpretation of the work done by a variable force as the area between the curve of the spring force and the x axis, between the initial and final position.
Figure 2: Work Done by a Variable Force at Angular Displacements
Since the spring arm of the mousetrap rotates, the displacement is angular, not linear. The rotational analog for work is as follows.
(3)
The torque or “twist” provided by a force of a given magnitude F is maximum if the force is at right angles to the radius, °= 90θ . (Hold the spring scale perpendicular to the spring arm in
order measure the maximum force at each angular displacement.)
θτ sinFR= (4) Note: °== 90,1sin θθ when
BASELINE MACHINE
0.0 2.0 4.0 6.0 8.0
10.0 12.0 14.0 16.0 18.0
0 45 90 135 180 ANGLE (degrees)
FOR
CE
(N)
Weight Force [Newton] Spring Force [Newton]

SIMPLE MACHINE PROJECT 6 of 21
Penn State University – Berks Campus, EDSGN 100 Project by: Terry Speicher; Document by: Kathleen Hauser and Elizabeth Wiggins
To calculate the displacement of the spring arm, the spring angle must be converted from degrees to radians,φ .
Conversion Factor: π2360 =° (5)
The spring arc or magnitude of the displacement for the spring, s is calculated by the product of the spring radius, R, and the angular displacement, φ∆ .
φ∆= Rs (6)
Note the length s is the arc length the end of the mousetrap arm travels or half the circumference of a circle. Figure 3 shows the graphical interpretation of the work done by the mousetrap as the area between the curve of the spring force and the x axis, between the initial and final position.
Figure 3: Work Done by a Variable Force at Linear Displacements
(in this case the angular displacement has been converted to linear displacement)
Hence, to calculate the input work of the mousetrap simple machine, calculate the area under the spring force curve. Similarly, the output work can be determined by calculating the area under the weight force line.
Area of a triangle: (7)
Area of a rectangle: (8)
To measure the efficiency of the baseline mousetrap machine, the following equation may be used.
Efficiency (%)= (Woutput/ Winput)*100% (9)
To determine the cost of the mousetrap simple machine, the following equation may be used.
Cost ($)=$3.50 )*( TN (10)
where: Nis the Number of Parts T is the Number of Part Types $3.50 is the average cost of a Fischertechnik Part
BASELINE MACHINE
0.0 2.0 4.0 6.0 8.0
10.0 12.0 14.0 16.0 18.0
-79 -39 0 39 79 DISTANCE (mm)
FOR
CE
(N)
Weight Force [Newton] Spring Force [Newton]

SIMPLE MACHINE PROJECT 7 of 21
Penn State University – Berks Campus, EDSGN 100 Project by: Terry Speicher; Document by: Kathleen Hauser and Elizabeth Wiggins
Project Analysis: Decision Matrix/Pugh’sSelection Method:A decision matrix or Pugh’s selection method is a tool that can be used to determine which simple machine design is the best based on a set of criteria. There are several configurations for a decision matrix. For this project, the decision matrix shown in Table 3may be used. Instructions for Using the Following Pugh’s Selection Method:
a. Select the attributes of the simple machines to be used for comparison in selecting the best machine. List them in the requirement column.
b. Assign a weight to each attribute indicating the importance in the decision making process. • 1 indicates an attribute has low importance. • 2 indicates an attribute has medium importance. • 4 indicates an attribute has high importance.
c. Rate each attribute for each redesigned simple machine. • -1 to -4 indicates the redesigned machine does not rate better than the
baseline in that specific attribute. • 0 indicates the redesigned machine rates the same as the baseline in that
specific attribute. • +1 to +4 indicates the redesigned machine rates better than the baseline in
that specific attribute. d. Multiply the weight and rate for each attribute to calculate a score. e. Add the scores of each attribute to obtain a Total Score. f. Select the concept with the highest score as the best simple machine.

SIMPLE MACHINE PROJECT 8 of 21
Penn State University – Berks Campus, EDSGN 100 Project by: Terry Speicher; Document by: Kathleen Hauser and Elizabeth Wiggins
Table 3: Simple Machine Pugh’s Selection Method*
Requirement Weighting Baseline Concept
Redesign 1 Redesign 2 Redesign 3 Redesign 4
rating score rating score rating score rating score rating score [1, 2, or 4] [-1,0 or +1] [-1,0 or +1] [-1,0 or +1] [-1,0 or +1]
Cost 0 0
Efficiency 0 0
Safety 0 0
Repeatability 0 0
Manufacturability 0 0
Ease of Use 0 0
Functionality 0 0
0 0
Total 0
*Notes: 1. The attributes listed in Table 3 are samples. Cost, efficiency, safety and
repeatability must be used. Other attributes may be added as needed. 2. There are two types of attributes that can be used when comparing alternatives.
a. Quantitative – can be compared by calculated values (i.e. cost and efficiency) b. Qualitative – needs to be compared by observation or inspection (i.e. safety
and repeatability) 3. If two or more machines are tied for the highest score, more attributes for
comparison might need to be added.

SIMPLE MACHINE PROJECT 9 of 21
Penn State University – Berks Campus, EDSGN 100 Project by: Terry Speicher; Document by: Kathleen Hauser and Elizabeth Wiggins
The following Exercises will be completed through the duration of the Simple Machine Project.
Exercise1: Working Drawing
Your team will receive a set of Fischertechnik Parts.
• As a team, assign several parts to each team member. • Determine the orthographic views of your assigned parts. • Measure your assigned parts • Practice sketching your assigned parts (isometric and orthographic views) • Practice drawing the part to scale (isometric & orthographic views) • Create a detail drawing of your assigned parts, (reference Detail Drawing from the
Working Drawings Power Point presentation) • Save the set of working drawings to your shared team in Angel.
Notes:
• Detail Drawing must be in landscape page orientation • Title blocks must be consistent on every drawing • Units must be consistent on every drawing
Exercise2: CAD Modeling& Assembly Modeling-Baseline Machine
Each individual student models all the Fischertechnik parts used in the Baseline Simple Machine in SolidWorksusing the detail drawings created. Submit all parts in the associated Angel drop boxes. Each individual student models the baseline simple machine as an assembly in Solid Works using his/her own parts. Submit the assembly in the associated Angel drop box.

SIMPLE MACHINE PROJECT 10 of 21
Penn State University – Berks Campus, EDSGN 100 Project by: Terry Speicher; Document by: Kathleen Hauser and Elizabeth Wiggins
Activity1: Build and Test the Baseline Machine Step 1 – Create a Bill of Material for the Baseline Machine. (Table 4 may be used as a starting
point.)
Table 4: Baseline Simple Machine Bill of Material Item Name Description Quantity
1 Base Plate Mounting Platform 1 2 Mousetrap Spring Energy Supply 1 3 Steel Weight Work Extractor 1 4 Fishing Line Connecting Device 1 5 6 7 8 9
10 11 12 13 14 15
Step 2–Obtain the Input Work Data(Energy Provided/Potential Energy).
a. Measure the mousetrap torque arm and record the data in Table 5. b. Measure the force of spring from 0° to 180° in 45° increments and record them in
Table 6. (The spring scale must be held perpendicular to the torque arm for a correct value of force.)
• Clip the spring scale to the mousetrap torque arm. • Hold a protractor to the mousetrap so that the center point of the protractor
is in the middle of the spring. • To measure the force at 0°, apply force with the spring scale and record the
force exerted before lifting the torque arm. • Pull up the spring scale to 45°. Record the force required to maintain the
torque arm at 45°, 90°, 135°, and 180°.
Table 5: Spring/Torque Arm Measurements Data Collection Spring/Torque Arm Radius (in) Trial 1 Trial 2 Trial 3
R

SIMPLE MACHINE PROJECT 11 of 21
Penn State University – Berks Campus, EDSGN 100 Project by: Terry Speicher; Document by: Kathleen Hauser and Elizabeth Wiggins
Table 6: Input Work – Angular Displacement Data Collection Angular
Displacement FORCE Trial 1
(N) FORCE Trial 2
(N) FORCE Trial 3
(N) F0° F45° F90° F135° F180°
Step 3 – Obtain the Output Work Data (Useful Work).
a. Attach thesteel weight to the fishing line. b. Using the spring scale, weigh thesteel weight, and record the data in Table 7. c. Recreate the baseline mousetrap simple machine from the picture. d. Set the mousetrap and record the initial position of the steel weightrelative to the
baseplate (yinitial) in Table 8. e. Release the mousetrap and record the final position of the steel weightrelative to
the baseplate (yfinal) in Table 8.
Table 7: Weight of Steel Weight Data Collection Weight of Object (N) Trial 1 Trial 2 Trial 3 Fobject
Table 8: Baseline Machine Output Work – Displacement of Steel Weight Data Collection Displacement (in) Trial 1 Trial 2 Trial 3 yinitial yfinal

SIMPLE MACHINE PROJECT 12 of 21
Penn State University – Berks Campus, EDSGN 100 Project by: Terry Speicher; Document by: Kathleen Hauser and Elizabeth Wiggins
Step 4 – Analyzethe Baseline Simple Machine.
a. Determine the qualitative attributes of the simple machine to be used for the decision matrix and record them in Table 9.
b. Observe the baseline simple machine in use and create a list of advantages and disadvantages and record them in Table 9.
Table 9: Baseline Machine Analysis Attributes:
Advantages:
Disadvantages:
SIMPLE MACHINE PROJECT 13 of 21
Penn State University – Berks Campus, EDSGN 100 Project by: Terry Speicher; Document by: Kathleen Hauser and Elizabeth Wiggins
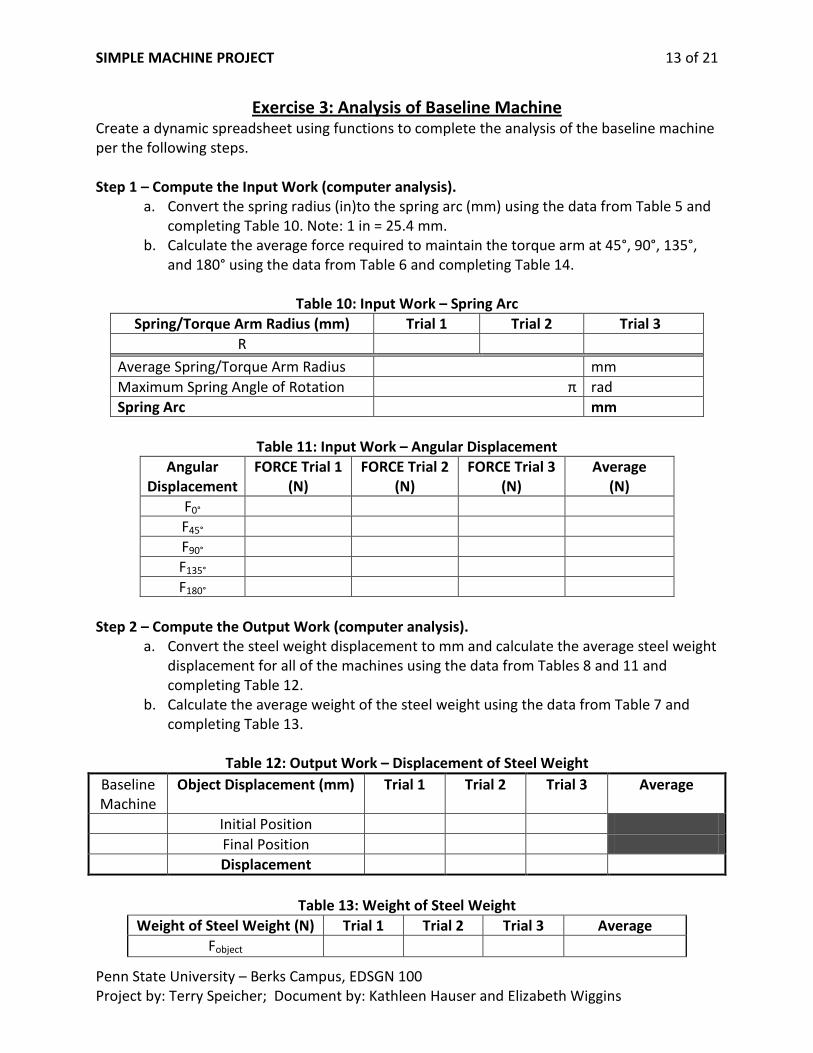
Exercise 3: Analysis of Baseline Machine Create a dynamic spreadsheet using functions to complete the analysis of the baseline machine per the following steps. Step 1 – Compute the Input Work (computer analysis).
a. Convert the spring radius (in)to the spring arc (mm) using the data from Table 5 and completing Table 10. Note: 1 in = 25.4 mm.
b. Calculate the average force required to maintain the torque arm at 45°, 90°, 135°, and 180° using the data from Table 6 and completing Table 14.
Table 10: Input Work – Spring Arc
Spring/Torque Arm Radius (mm) Trial 1 Trial 2 Trial 3 R
Average Spring/Torque Arm Radius mm Maximum Spring Angle of Rotation π rad Spring Arc mm
Table 11: Input Work – Angular Displacement
Angular Displacement
FORCE Trial 1 (N)
FORCE Trial 2 (N)
FORCE Trial 3 (N)
Average (N)
F0° F45° F90° F135° F180°
Step 2 – Compute the Output Work (computer analysis).
a. Convert the steel weight displacement to mm and calculate the average steel weight displacement for all of the machines using the data from Tables 8 and 11 and completing Table 12.
b. Calculate the average weight of the steel weight using the data from Table 7 and completing Table 13.
Table 12: Output Work – Displacement of Steel Weight Baseline Machine
Object Displacement (mm) Trial 1 Trial 2 Trial 3 Average
Initial Position Final Position Displacement
Table 13: Weight of Steel Weight
Weight of Steel Weight (N) Trial 1 Trial 2 Trial 3 Average Fobject

SIMPLE MACHINE PROJECT 14 of 21
Penn State University – Berks Campus, EDSGN 100 Project by: Terry Speicher; Document by: Kathleen Hauser and Elizabeth Wiggins
Step 3 –Calculate the Machine Performance (computer analysis). a. Convert the input work angular displacement to linear displacement and record in
Table 14.Reference Figures 2 and 3. b. Using the data from Tables 11 through 14, graph the output work versus the input
work using linear displacement for the baseline machine. c. Calculate the output work for the baseline machine and record the data in Table 15. d. Calculate the input workfor the baseline machine and record the data in Table 16. e. Calculate the efficiency of the baseline machine per equation 9 and record the data
in Table 17.
Table 14: Input Work Angular to Linear Displacement Angular
Displacement Linear Displacement
(mm) 0° 0
45° r π/4 = 90° r π/2 =
135° r 3π/4 = 180° r π =
Table 15: Output Work Analysis of Simple Machines
Simple Machine Output Work (mJ) (Area under Weight Force Curve)
Baseline
Table 16: Input Work Analysis of Simple Machines Simple Machine Input Work (mJ)
(Area under Spring Force Curve) Baseline
Table 17: Efficiency Analysis of the Simple Machines
Simple Machine Output Work (mJ) Input Work (mJ) Efficiency Baseline

SIMPLE MACHINE PROJECT 15 of 21
Penn State University – Berks Campus, EDSGN 100 Project by: Terry Speicher; Document by: Kathleen Hauser and Elizabeth Wiggins
Exercise 4: CAD Assembly Modeling-Redesigned Machines As a team, develop one redesigned simple machine per team member. Model eachredesigned simple machine per team member as a CAD assembly in Solid Works.
Activity 2: Build and Test Each Redesigned Machine Complete the Bill of Material foreach redesigned simple machine and record the data in Table 18.
Table 18: Redesigned Simple Machine Bill of Material
Rede
sign
1
Item Name Description Quantity 1 Base Plate Mounting Platform 1 2 Mousetrap Spring Energy Supply 1 3 Steel Weight Work Extractor 1 4 Fishing Line Connecting Device 1 5 6 7 8 9
10 11 12 13 14 15
Rede
sign
2
Item Name Description Quantity 1 Base Plate Mounting Platform 1 2 Mousetrap Spring Energy Supply 1 3 Steel Weight Work Extractor 1 4 Fishing Line Connecting Device 1 5 6 7 8 9
10 11 12 13 14 15

SIMPLE MACHINE PROJECT 16 of 21
Penn State University – Berks Campus, EDSGN 100 Project by: Terry Speicher; Document by: Kathleen Hauser and Elizabeth Wiggins
Table 18: Redesigned Simple Machine Bill of Material (continued) Re
desi
gn 3
Item Name Description Quantity
1 Base Plate Mounting Platform 1 2 Mousetrap Spring Energy Supply 1 3 Steel Weight Work Extractor 1 4 Fishing Line Connecting Device 1 5 6 7 8 9
10 11 12 13 14 15
Rede
sign
4
Item Name Description Quantity 1 Base Plate Mounting Platform 1 2 Mousetrap Spring Energy Supply 1 3 Steel Weight Work Extractor 1 4 Fishing Line Connecting Device 1 5 6 7 8 9
10 11 12 13 14 15
Build each redesigned simple machine.
SIMPLE MACHINE PROJECT 17 of 21
Penn State University – Berks Campus, EDSGN 100 Project by: Terry Speicher; Document by: Kathleen Hauser and Elizabeth Wiggins
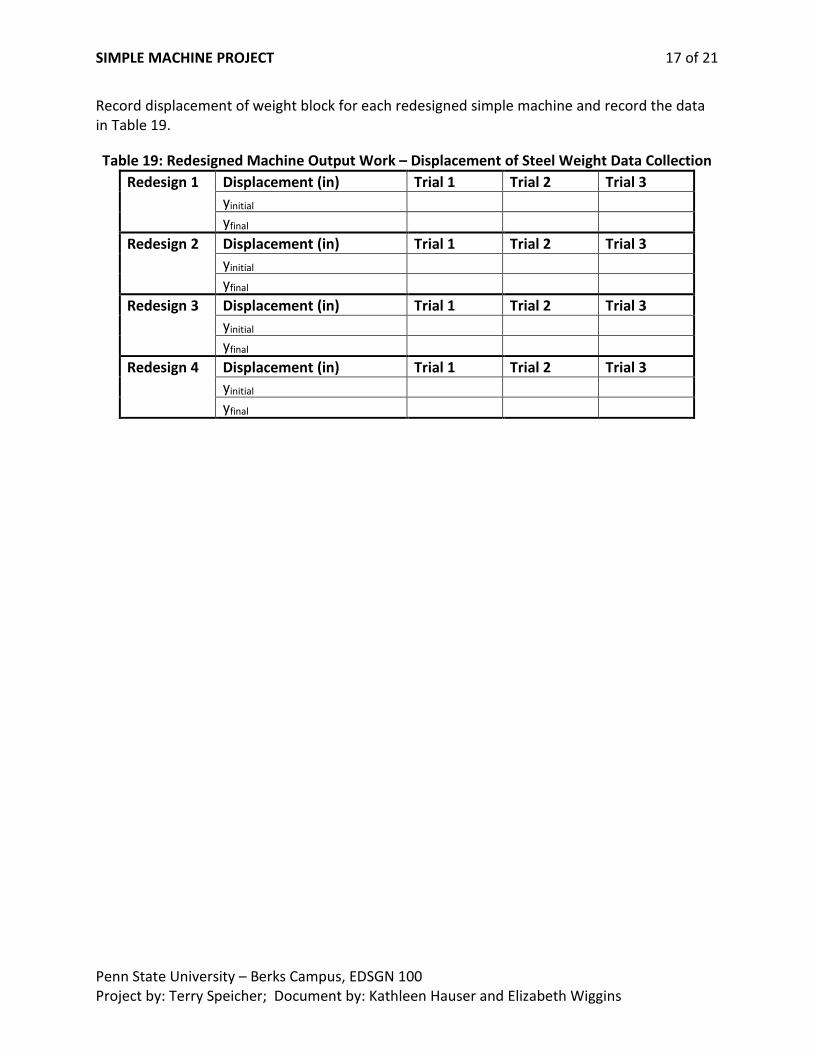
Record displacement of weight block for each redesigned simple machine and record the data in Table 19.
Table 19: Redesigned Machine Output Work – Displacement of Steel Weight Data Collection Redesign 1 Displacement (in) Trial 1 Trial 2 Trial 3
yinitial yfinal
Redesign 2 Displacement (in) Trial 1 Trial 2 Trial 3 yinitial yfinal
Redesign 3 Displacement (in) Trial 1 Trial 2 Trial 3 yinitial yfinal
Redesign 4 Displacement (in) Trial 1 Trial 2 Trial 3 yinitial yfinal

SIMPLE MACHINE PROJECT 18 of 21
Penn State University – Berks Campus, EDSGN 100 Project by: Terry Speicher; Document by: Kathleen Hauser and Elizabeth Wiggins
Record qualitative performance data for each redesigned simple machine.
Table 20: Redesigned Machine Analysis
Rede
sign
1
Attributes:
Advantages:
Disadvantages:
Rede
sign
2
Attributes:
Advantages:
Disadvantages:
Rede
sign
3
Attributes:
Advantages:
Disadvantages:
Rede
sign
4
Attributes:
Advantages:
Disadvantages:

SIMPLE MACHINE PROJECT 19 of 21
Penn State University – Berks Campus, EDSGN 100 Project by: Terry Speicher; Document by: Kathleen Hauser and Elizabeth Wiggins
Exercise 5: Comparative Analysis of All Machines Step 1: Using the data from tables 12 and 20, complete table 21.
Table 21: Output Work – Displacement of Steel Weight
Base
line
Mac
hine
Object Displacement (mm) Trial 1 Trial 2 Trial 3 Average Initial Position Final Position Displacement
Rede
sign
1
Object Displacement (mm) Trial 1 Trial 2 Trial 3 Average Initial Position Final Position Displacement
Rede
sign
2
Object Displacement (mm) Trial 1 Trial 2 Trial 3 Average Initial Position Final Position Displacement
Rede
sign
3
Object Displacement (mm) Trial 1 Trial 2 Trial 3 Average Initial Position Final Position Displacement
Rede
sign
4
Object Displacement (mm) Trial 1 Trial 2 Trial 3 Average Initial Position Final Position Displacement
Step 2: Complete table 22& show efficiency graphs for all designs, see figure 3.
Table 22: Efficiency Analysis of the Simple Machines Simple Machine Output Work (mJ) Input Work (mJ) Efficiency
Baseline Redesign 1 Redesign 2 Redesign 3 Redesign 4
Step 3 - Cost
a. Calculate the cost of the baseline machine and all of the redesigned machines based on the number of parts using equation 10 and record the data in Table 23.
Table 23: Cost Analysis of the Simple Machines
Simple Machine No. of Parts No. of Part Types Cost Baseline Redesign 1 Redesign 2 Redesign 3 Redesign 4

SIMPLE MACHINE PROJECT 20 of 21
Penn State University – Berks Campus, EDSGN 100 Project by: Terry Speicher; Document by: Kathleen Hauser and Elizabeth Wiggins
Step 4 – Compare qualitative attributes of the Baseline versus the Redesigned Simple Machines
Table 24: Redesigned Machine Analysis
Base
line
Attributes:
Advantages:
Disadvantages:
Rede
sign
1
Attributes:
Advantages:
Disadvantages:
Rede
sign
2
Attributes:
Advantages:
Disadvantages:
Rede
sign
3
Attributes:
Advantages:
Disadvantages:
Rede
sign
4
Attributes:
Advantages:
Disadvantages:

SIMPLE MACHINE PROJECT 21 of 21
Penn State University – Berks Campus, EDSGN 100 Project by: Terry Speicher; Document by: Kathleen Hauser and Elizabeth Wiggins
Step 5–Analysis of the Baseline versus the Redesigned Simple Machines a. Complete thedecision matrix or Pugh’s selection method to select the bestdesign option, see
Table 3.
Selected Design Option:Show Decision Matrix