movement characteristics of american beavers castor · pdf filebehaviour (2014)...
TRANSCRIPT

Behaviour (2014) DOI:10.1163/1568539X-00003183 brill.com/beh
Movement characteristics of American beavers(Castor canadensis)
Lance F. McClintic a, Guiming Wang a,∗, Jimmy D. Taylor b and
Jeanne C. Jones a
a Department of Wildlife, Fisheries and Aquaculture, Mail Stop 9690,Mississippi State University, Mississippi State, MS 39762, USA
b United States Department of Agriculture, Animal Plant Health Inspection Service,Wildlife Services, National Wildlife Research Center, Oregon Field Station,
321 Richardson Hall, Corvallis, OR 97333, USA*Corresponding author’s e-mail address: [email protected]
Accepted 1 February 2014; published online ???
AbstractPhysiological states and foraging behaviors may shape movement patterns of animals. Optimalforaging theory and what we term the deliberate movement hypothesis predict that, to reduce pre-dation risk, central place foragers should move faster with smaller turning angles the further theyare from their central place. The complementary bimodal foraging trip hypothesis predicts thatthe distribution of foraging distances exhibited by central place foragers should be bimodal dueto a trade-off between provisioning offspring and self-feeding. We used radio-telemetry to testthese hypotheses for American beavers (Castor canadensis) in northern Alabama, United States.American beavers moved faster with increasing distance from lodges in wetland land cover butnot in terrestrial land covers, partially supporting the deliberate movement hypothesis. Hourly dis-tances moved from lodges were distributed bimodally during the breeding season, which supportsthe bimodal foraging trip hypothesis. Therefore, central place foraging may be a determinant ofmovement characteristics of American beavers.
Keywordsbimodal foraging distance, central place foraging, movement distance, optimal foraging.
1. Introduction
Movement ecology has recently re-emerged as a central theme of animalecology although animal movements have been one of the oldest study top-ics (Pulido, 2007; Nathan, 2008). Animals move to search for and acquire
© 2014 Koninklijke Brill NV, Leiden DOI:10.1163/1568539X-00003183
2 Behaviour (2014) DOI:10.1163/1568539X-00003183
resources and mates as well as to escape predators. Animals may adjustthe distances and directions (i.e., turning angles) of their movements basedon temporal and spatial variation in resource availability and predation risk(Getz & Saltz, 2008; Mueller & Fagan, 2008; Nathan et al., 2008). Move-ment distances and turning angles may also be related to physiological andbehavioral (e.g., foraging, resting and travelling) states of moving animals(Franke et al., 2004). Behavioral states and patterns (such as central-placeforaging and patrolling foraging) may constrain movement characteristics(e.g., speed and turning angle) of animals and their responses to spatiotem-poral variation in resource availabilities (Getz & Saltz, 2008; Mueller &Fagan, 2008; Nathan et al., 2008). However, few studies have investigatedrelationships between behavioral patterns and movement ecology of semi-aquatic mammals (Di Stefano et al., 2011; Campbell et al., 2013).
Patterns of foraging behavior may have profound consequences on pat-terns of movement and use of space by animals (Owen-Smith et al., 2010;Buchmann et al., 2012). Central place foraging theory states that food search-ing and handling time, travel time between patches of resources, and ener-getic costs of resource acquisition influence foraging decisions of centralplace foragers (Orians & Pearson, 1979; Fryxell, 1992). To maximize ener-getic returns, central place foragers may reduce foraging time but increasefood item size with increasing distance from their central places such as dens,nests, or lodges (Fryxell, 1992). Predation risk can also influence foragingdistance (Andersson, 1978; Getty, 1981). Thus, tradeoffs between maximiz-ing energetic return and minimizing predation risk may lead to an inverserelationship between foraging time per unit area and distance travelled fromthe central place (Fryxell, 1992). What we term the deliberate movement hy-pothesis predicts that central place foragers should move more deliberately(i.e., at higher speed with smaller turning angles) the further they are fromtheir central place to reduce risk of predation. To our knowledge, no studieshave tested the deliberate movement hypothesis using fine-scale movementdata.
Patterns of parental care and the need to provision offspring can also in-fluence movement patterns of central place foragers. Foraging distances ofnesting seabirds are often bimodally distributed because individuals alternatebetween short, frequent foraging trips to provision young with long foragingtrips to obtain food for themselves (i.e., the bimodal foraging trip hypothe-sis; Weimerskirch et al., 1994; Ropert-Coudert et al., 2004; Ludynia et al.,

L.F. McClintic et al. / Behaviour (2014) 3
2013). Central place foragers may spend less time foraging on long trips thanon short trips because of predation risk (Fryxell, 1992). Ydenberg & Davies(2010) predicted that bimodal foraging trips are widespread among centralplace foragers. However, although this hypothesis has been tested repeatedlyfor seabirds, few studies have tested whether foraging distances of individu-als are bimodally distributed for mammals (Fryxell & Doucet, 1991; Fryxell,1992).
Intrinsic factors, such as physiological states and ages, and extrinsic fac-tors, such as seasonality and resource availability, may also affect animalmovements, partially by affecting foraging and movement decisions. Pat-terns of animal movement may vary between age groups due to differencesin dispersal propensity and reproductive activity (Mueller & Fagan, 2008;Owen-Smith et al., 2010). For instance, mammal dispersal is often skewedto juveniles, and juveniles may make exploratory movements before nataldispersal for reproduction (Greenwood, 1980; Wolff, 1993; Selonen & Han-ski, 2006; Debeffe et al., 2013). Animals may also increase movements andenlarge home ranges from spring and summer to winter as local food avail-ability declines (Schradin et al., 2010). Therefore, movement distances andhome-range sizes may differ between age groups and seasons.
American beavers (Castor canadensis, hereafter beavers) are semi-aquaticherbivores that build bank dens or lodges for shelter and nursing of young(Collen & Gibson, 2000). Beavers are central place foragers who make for-aging trips from a lodge or bank den (hereafter lodge) to a forage patchand back, in order to avoid predators, consume food, and care for young atthe lodge (Jenkins, 1980; Fryxell, 1992). Beavers are socially monogamousand live in social groups; consequently, adults and philopatric yearlings mayspend more time at or near lodges during the breeding season to nurse andprotect young than at locations further from the lodge (Baker & Hill, 2003).Like nesting sea birds, beavers may exhibit bimodal foraging trips duringthe breeding season, with a mode of short foraging trips near the lodgefor nursing and protecting newborns and a mode of long foraging trips forself-feeding to acquire sufficient amounts of food. Therefore, the Americanbeaver represents a useful model species for evaluating the effects of centralplace foraging on movement patterns of mammals.
Previous studies of central place foraging by beavers have focused on re-lationships between distance from lodges (Fryxell, 1992) or from shorelines(Jenkins, 1980) and selection of food items based on size (Brzyski & Schulte,

4 Behaviour (2014) DOI:10.1163/1568539X-00003183
2009). However, few studies have investigated fine-scale movement charac-teristics of beavers in the context of central place foraging theory. In thisstudy, we tested two hypotheses about foraging behavior in beavers. First,we tested the deliberate movement hypothesis which predicts that, to reducepredation risk, beavers should move faster with smaller turning angles thefurther they are from their central place (i.e., lodge). Second, we tested thebimodal foraging trip hypothesis which predicts that movement distances ofadult and subadult beavers from their lodges should be distributed bimodallywith frequent short trips for provisioning offspring combined with longerdistance movements for self-feeding. Dispersal of beavers is skewed towardsubadults (2 years old; Allen, 1983; Collen & Gibson, 2000) and subadultsmay make exploratory movements to sample settlement habitat before dis-persal (Havens, 2006). Therefore, we also tested the hypothesis that annualhome ranges and distances moved from lodges by subadult beavers would begreater than those of adults (�3 years old) and yearlings (1 year old).
2. Material and methods
2.1. Study area
We conducted the study at Redstone Arsenal (RSA), a 15 342-ha Depart-ment of Defense military installment located in Madison County, AL, USA(34°38′N, 86°39′W). The arsenal is bordered by the cities of Huntsville tothe north and east and Madison to the west, with the Tennessee River as thesouthern boundary. Average monthly temperatures ranged from 8°C in De-cember 2012 to 28°C in July 2011, with an average monthly temperatureof 18°C throughout the study. Total precipitation from May 2011 to April2012 was 125.5 cm, and monthly precipitation varied from 3.4 cm in Octo-ber to 19.8 cm in January (Huntsville-Decatur International Airport weatherstation, the National Oceanic and Atmospheric Administration station ID:014064; approximately 14 km from our study sites). The RSA landscapewas relatively flat with elevation ranging from 165 to 365 m. The landscapewas composed of agricultural fields, military test ranges, upland pine forests,mixed forests, and different types and quality of beaver habitat, such as bot-tomland hardwood forests, various water bodies, and many seasonal swampsand marshes that became inundated with water during the rainy season. Weused the National Land Cover Classification Database 2006 (available on-line at http://www.mrlc.gov/nlcd2006.php) to derive a land cover and land

L.F. McClintic et al. / Behaviour (2014) 5
use map at the 30-m resolution for the study area (Fry et al., 2011). The orig-inal four levels of developed class (classes 21–24) were combined into oneclass (i.e., developed area). The resulting land cover types included water,developed area, deciduous forest, evergreen forest, mixed forest, shrubland,grassland, cropland and wetland (Figure 1).
We studied beavers from 11 wetlands located predominantly in the south-ern half of RSA. The 11 wetlands varied in size, shape, and type and wereinitially selected due to presence of beaver activity. Average distance be-tween sites was 4942 m, with a minimum distance of 278 m and maximumdistance of 9806 m.
2.2. Capture, tagging and radio telemetry
From 21 January to 11 May 2011, we live captured beavers using Hancocklive traps, which weigh 15 kg and have dimensions of 71 × 91 × 10 cm(Hancock Trap, Custer, SD, USA). We placed Hancock traps next to dams,movement corridors and scent mounds of beavers in each of the 11 wet-lands. Commercial castor or food-based lures (Backbreaker or Woodchipper,Dobbins’ Products, Goldsboro, NC, USA) were used to attract beavers andincrease trapping success. We activated traps with lures daily before 15:00 hand checked traps the following morning by 09:00 h.
We weighed captured beavers to the nearest 0.1 kg in their traps using ahanging scale (Moultrie Feeders, Alabaster, AL, USA). We classified cap-tured beavers into four age classes according to body mass following Brecket al. (2001): <6.8 kg as 0–12 month old kits; 6.8–10.8 kg as 13–24 monthold yearlings; 10.9–16.0 kg as 25–36 month old subadults; and >16 kg as�37 month old adults.
We anesthetized beavers weighing >6.8 kg with an intramuscular in-jection of ketamine hydrochloride (10 mg/kg) and xylazine hydrochloride(1 mg/kg) before radio tagging live beavers (Havens, 2006; Arjo et al., 2008;Bloomquist & Nielsen, 2010). We then attached radio transmitters (Model3530, ATS, Isanti, MN, USA), weighing <0.05% of beaver body mass, totails of anesthetized beavers using methods first developed by Rothmeyer etal. (2002) and modified by Arjo et al. (2008). Transmitters had an estimatedbattery lifetime of 647 days. We monitored body temperatures, pulses, andrespiration rates of anesthetized beavers during radio transmitter attachment.
After secure transmitter attachment, we inserted a passive integratedtransponder (PIT tag; Avid Identification Systems, Norco, CA, USA) sub-cutaneously between the scapulae with a single use disposable syringe for

6 Behaviour (2014) DOI:10.1163/1568539X-00003183
permanent identification of beavers (Bond et al., 2001; Arjo et al., 2007).We released radio-tagged beavers at the location of capture once fully re-covered (i.e., alert and responsive). Sedation and handling time ranged from30–60 min/beaver. Trapping and handling of beavers was approved by the In-stitutional Animal Care and Use Committee of the United States Departmentof Agriculture, National Wildlife Research Center (Protocol No. QA-1626).
We monitored beaver movements throughout a 12-h period (18:00–06:00 h) on foot using an ATS hand-held 3-element Yagi antenna, an R-1000receiver (Communications Specialist, Orange, CA, USA) and a look-throughcompass (Model KB-20/360R, Suunto, Vantaa, Finland). We modified thecompass for nighttime radio telemetry using a clear straw and 3.81-cmminiature glowing sticks. We located radio-tagged beavers using triangu-lation methods with at least three position fixes per location by taking �3azimuths with an overall separation of 60–120° in �15 min (Cochran etal., 1963; White & Garrott, 1990). We recorded Universal Transverse Mer-cator (UTM) coordinates of observer positions using a handheld GlobalPositioning System (GPS) unit (Model GPSMap 76, Garmin, Olathe, KS,USA) with �3 m accuracy. Approximately 3° were subtracted from eachazimuth before estimating beaver locations to account for compass declina-tion throughout the study period (available online at http://www.ngdc.noaa.gov/geomagmodels/struts/calcDeclination). We estimated UTM coordinatesof radio-tagged beavers using program LOCATE III (Nams, 2006).
2.3. Hourly movement distances
We monitored hourly movements of beavers at Igloo Pond and Igloo Drain,approximately 1030 m apart (Figure 1), by locating all beavers in the twowetlands hourly throughout a 12-h period (18:00–06:00 h) via triangula-tion methods. We repeated hourly monitoring 12 times from 17 May 2011to 29 June 2011 in 2–5-day intervals for the dry season and once on 13March 2012 for the wet season. Dry season at our study site was from Aprilthrough August with seasonal total precipitation of 37.95 cm, and wet sea-son was from September through March with seasonal total precipitationof 87.60 cm. We calculated Euclidian distance (m) between two successivelocations and relative turning angles (θ ) using function as.ltraj in R pack-age adehabitatLT (Calenge, 2006), as well as distance from the departinglocation of an hourly trip to lodge (in m) using function spDistsN1 in Rpackage sp (available online at http://rspatial.r-forge.r-project.org) in the R

L.F. McClintic et al. / Behaviour (2014) 7
2.13.1 environment (R Development Core Team, 2011). We identified lodgesby searching for radio-tagged beavers during the middle of daylight hours.We calculated average hourly distance moved, average relative turning angle,and average hourly distance from the main lodge by season for all radio-tracked beavers. Hourly distances moved by beavers were used to model thedistribution of foraging trip distance. Locations were collected hourly so dis-tances moved between two consecutive locations were converted to hourlymovement speed (m/h).
2.4. Home range, core use area and distance moved from lodge
We monitored radio-tagged beavers at least two times per week from 9 May2011 to 27 July 2011 and bi-weekly from 19 August 2011 to 20 April 2012.We systematically varied the order in which we tracked beavers in each wet-land and the time of night of radio tracking for each beaver across all trackingoccasions to ensure that the temporal distribution of estimated locations wasunbiased over the beavers’ most active periods between 17:00 and 08:00 h(Mott et al., 2011). We only considered beavers having �20 locations withlocation estimates of 95% error ellipse < 0.5 ha throughout the study periodfor annual home-range estimation (N = 26 beavers). We estimated annualhome-range size (ha) for each radio-tagged beaver using the kernel densityestimation (KDE) method with a least squares cross validation smoothing pa-rameter (Worton, 1989). We estimated 50% and 95% KDE using ArcMap10(ESRI, Redlands, CA, USA) through the Geospatial Modelling Environment(GME version 0.7.1.0, Toronto, ON, Canada) and the R 2.13.1 environment.We used 50% KDE home ranges as core use areas of radio-tagged beavers. Ina preliminary analysis, we found that three beavers at Thiokol Wetland hadhome-range sizes 5–8-times larger than those of the remaining 23 beavers.Therefore, we calculated mean home-range sizes based on all 26 individualsas well as after excluding these three individuals from Thiokol Wetland.
We calculated mean distance and maximum distance moved from eachindividual’s lodge (m) by season using function spDistsN1 in the R packagesp. We then calculated seasonal mean distance and mean maximum distanceto lodges of beavers by age class and season.
2.5. Statistical analysis
We conducted linear regression to evaluate relationships between distanceof departing location from lodge and hourly movement speed during the dry

8 Behaviour (2014) DOI:10.1163/1568539X-00003183
and wet season, using generalized linear models in the SAS procedure GLM(SAS, version 9.2, SAS Institute, Cary, NC, USA). We excluded data pointsfrom the regression where distance to lodge values were equal to hourlymoving speed values. In a preliminary analysis, the slope of the regressionincluding all hourly movement data indicated a similar relationship as theone obtained from the subset of data. Thus, exclusion of the data pointsdid not change the relationship pattern between distance of departing lo-cation from lodge and hourly movement speed. We calculated correlationbetween relative turning angle and distance from lodge using circular linearcorrelation (Batschelet, 1981). Mean and standard deviation of relative turn-ing angles were computed with the R package circular (available online athttps://r-forge.r-project.org/projects/circular/).
We used the expectation-maximization method in the R package mixtools(Benaglia et al., 2009) to fit three different finite mixture models to data ondistance from lodge for the dry and wet seasons to determine if beaver move-ments away from the lodge fit a unimodal or bimodal movement distribution.The three models included a mixture of two normal distributions with differ-ent means and different variances, a mixture of two normal distributions withdifferent means and identical variances, and a single normal distribution. Weused the Akaike information criterion (Burnham & Anderson, 2002) to se-lect the best approximating model with the lowest AIC value and competingmodels with a �AIC < 2 for each season (Burnham & Anderson, 2002).The �AIC of a model is the difference in AIC between the model and bestapproximating model.
We used mixed-effects analysis of variance (ANOVA) in the SAS proce-dure MIXED with the Tukey–Kramer adjustment to compare mean home-range sizes and mean distances moved from the lodge between age groupswith individual beaver identification number (ID) as a random factor nestedwithin wetland ID to account for interdependence of movements betweenbeavers in the same wetland. We used natural logarithmic transformation tonormalize home-range data (Di Stefano et al., 2011; Bloomquist et al., 2012).All tests were conducted at α = 0.05 and all means were reported ±1 SD.
3. Results
We captured 50 beavers from 11 wetlands (Table 1). Twenty-four beaverswere not included in analyses due to transmitter loss or failure. We monitored26 beavers at nine wetlands for 12 months (Figure 1).

L.F. McClintic et al. / Behaviour (2014) 9
Table 1.Captures by age group of American beavers in Redstone Arsenal, Madison County, AL, USA.
Wetland name Total capture Adult Subadult Yearling
Blueberry 5 2(0)∗ 2(0) 1(0)Corkwood Road 1 0 1(1) 0Corkwood 4 2(2) 0 2(2)DDT Abatement 6 2(0) 2(1) 2(1)DDT Spring Branch 6 4(0) 2(0) 0Hudson Park Field 8 3(0) 5(2) 0Hudson Park 2 1(1) 1(1) 0Igloo Drain 4 2(1) 2(2) 0Igloo Pond 8 5(4) 2(2) 1(1)Patton Road 3 2(1) 0 1(1)Thiokol Pond 3 3(3) 0 0Total 50 26(12) 17(9) 7(5)
∗ Numbers in parentheses are the numbers of animal radio tracked during the study period.
We calculated mean hourly movement distances for seven beavers fromthe Igloo Pond (IPW) colony and three beavers from the Igloo Drain (IDW)colony during the dry season of 2011 and five for IPW and three beavers forIDW during the wet season of 2012. Mean hourly movement distances were138.44 ± 86.37 m during the dry season and 126.93 ± 119.97 m during thewet season for IPW, whereas mean hourly movement distances were 90.95 ±58.29 m during the dry season and 124.68 ± 91.55 m during the wet seasonfor IDW. Mean hourly turning angles were −3.06 ± 1.33 during the dryseason and −2.77 ± 2.30 during the wet season for IPW; meanwhile, meanhourly turning angles were −3.00 ± 1.47 for the dry season and −2.96 ±1.39 for the wet season for IDW.
Hourly moving speed of beavers was not related to distance from themain lodge for beavers in IDW (R2 = 0.001, F1,406 = 0.45, p = 0.505). InIPW, the p value was <0.05; however, the R2 of the linear model for IPWwas <0.1 (R2 = 0.02, F1,413 = 9.54, p = 0.002). Thus, we concluded thathourly moving speed of beavers was not related to distance from the mainlodge for beavers in IPW. Relative turning angles were not correlated withdistance from the lodge during the 2011 dry season (ρ = 0.11, p = 0.05),but were correlated with distance from the lodge during the 2012 wet season(ρ = 0.42, p = 0.03). Likewise, relative turning angles were not related to

10 Behaviour (2014) DOI:10.1163/1568539X-00003183
Figure 1. Landcover map and locations of nine wetlands where American beavers were radiotracked. Dots on the map represent telemetry relocations of beavers. Numbers on the map areindices for wetlands: (1) Corkwood Road, (2) Corkwood, (3) DDT Abatement, (4) HudsonPark, (5) Hudson Park Field, (6) Igloo Pond, (7) Igloo Drain, (8) Patton Road and (9) ThiokolPond. This figure is published in colour in the online edition of this journal, which can beaccessed via http://booksandjournals.brillonline.com/content/1568539x.
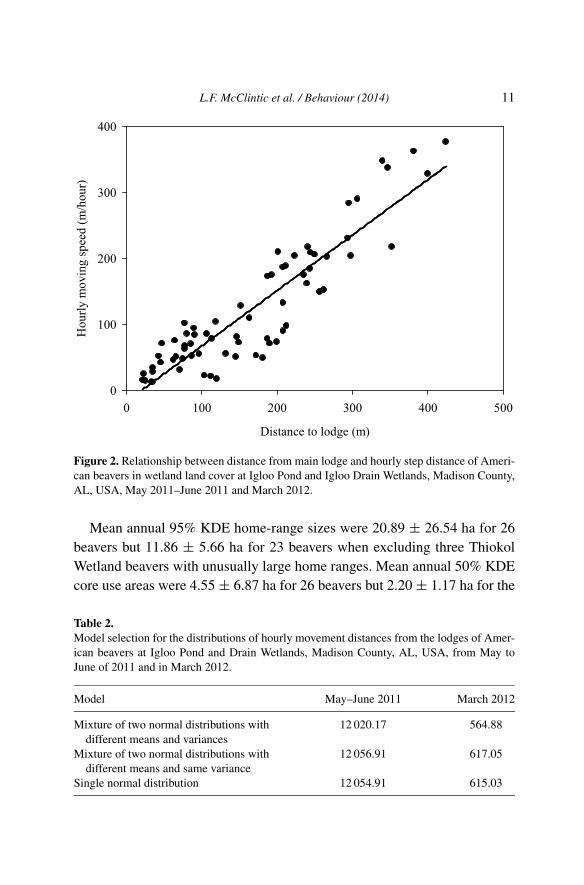
distance from lodge on wetland land cover, with the 2011 and 2012 datacombined (ρ = 0.1, p = 0.36). However, hourly moving speed was relatedpositively to distance from the lodge for the subset of beaver locations inwetland areas (R2 = 0.83, slope = 0.84, t = 17.68, df = 67, p < 0.001;Figure 2). The best model for the distribution of hourly movement distancesfrom the lodge was a bimodal-distribution model for the 2011 dry and 2012wet seasons (Table 2 and Figure 3).
L.F. McClintic et al. / Behaviour (2014) 11
Figure 2. Relationship between distance from main lodge and hourly step distance of Ameri-can beavers in wetland land cover at Igloo Pond and Igloo Drain Wetlands, Madison County,AL, USA, May 2011–June 2011 and March 2012.
Mean annual 95% KDE home-range sizes were 20.89 ± 26.54 ha for 26beavers but 11.86 ± 5.66 ha for 23 beavers when excluding three ThiokolWetland beavers with unusually large home ranges. Mean annual 50% KDEcore use areas were 4.55 ± 6.87 ha for 26 beavers but 2.20 ± 1.17 ha for the
Table 2.Model selection for the distributions of hourly movement distances from the lodges of Amer-ican beavers at Igloo Pond and Drain Wetlands, Madison County, AL, USA, from May toJune of 2011 and in March 2012.
Model May–June 2011 March 2012
Mixture of two normal distributions with 12 020.17 564.88different means and variances
Mixture of two normal distributions with 12 056.91 617.05different means and same variance
Single normal distribution 12 054.91 615.03

12 Behaviour (2014) DOI:10.1163/1568539X-00003183
Figure 3. Estimated density functions for distributions of hourly distances from lodges ofAmerican beavers at Igloo Pond and Igloo Drain Wetlands, Madison County, AL, USA during(a) March 2012 and (b) May–June 2011. This figure is published in colour in the onlineedition of this journal, which can be accessed via http://booksandjournals.brillonline.com/content/1568539x.
23 beavers. There was no difference in mean annual 95% KDE home-rangesizes or mean annual core use areas between age classes in the analysis of 26radio-tagged beavers (p > 0.05). After excluding three beavers with unusu-ally large home-ranges from Thiokol wetland from the analysis, 50% KDEhome ranges or core areas of subadults were larger than those of yearlings(t = 2.98, df = 13, adjusted p = 0.027). Neither age class nor season wassignificant in a mixed ANOVA of mean and maximum distances from themain lodge (p > 0.05).
4. Discussion
As predicted by the deliberate movement hypothesis, we found that beaversmoved faster with increasing distance from their lodge in wetlands, probablyto avoid predation risk (Figure 2). However, radio-tagged beavers did notappear to move faster in upland areas when further away from their lodges.The distribution of hourly distance from lodges was bimodal (Figure 3),consistent with the prediction of the bimodal foraging trip hypothesis forcentral place foragers (Weimerskirch et al., 1994). Furthermore, subadultbeavers had larger core use areas than yearlings, possibly due to pre-dispersalexploratory movements.
Predation risk is a selective pressure on movement patterns of animals,including central place foragers (Boyce, 1981; Fryxell, 1992). Beavers mayspend less time foraging as they move farther away from a central place to

L.F. McClintic et al. / Behaviour (2014) 13
reduce risk of predation risk (Jenkins, 1980; Novak, 1987; Fryxell, 1992)and Boyce (1981) suggested that beavers forage close to the shoreline toreduce predation risk. However, we found no evidence that beavers movedfaster with increasing distance from their lodges when travelling in uplandhabitat. Multiple factors may contribute to the lack of evidence support-ing the deliberate movement hypothesis in upland areas. First, beavers areknown to construct multiple bank dens and lodges throughout their homerange (Baker & Hill, 2003). Covich (1976) suggested that a multiple refugestrategy may allow burrowing herbivores access to more foraging areas witha decreased risk of predation. Beavers might have used different locationsthroughout the upland area of Igloo Wetlands as refuges, and this conditionmay have prevented us from detecting the predicted relationships betweenmovement speed or relative turning angle and distance from the main lodge.Second, beavers may have few effective terrestrial predators in the south-eastern United States (Bloomquist & Nielsen, 2010) and, therefore, be lesswary of terrestrial predation compared to smaller, more vulnerable centralplace foragers. Common mammalian predators found in the southeasternUS, such as bobcats (Lynx rufus), coyotes (Canis latrans) and river otters(Lontra canadensis), contribute little to the predation of beavers (reviewedby Baker & Hill, 2003). Alligators (Alligator mississippiensis) may also feedon beavers (Hill, 1976; Novak, 1987). Although we did not detect any signof alligators at wetlands where we radio tracked beavers, predation by al-ligators might act as selective pressure on beavers in the southeastern US.Aquatic predation as a selective pressure may explain the inverse relation-ship between movement speed and distance from the lodges in wetlands(Figure 1).
We found support for the bimodal foraging trip hypothesis for beavers,with a bimodal distribution of hourly movement distance during the breedingseasons (Figure 3). Radio-tagged beavers spend more time at or near lodgesto nurse and protect newborns in May-June, when birth or parturition peaks,than in March, when parturition just begins (Collen & Gibson, 2000). Thebimodal foraging trips may result from the tradeoff between provisioningyoung and self-feeding by adults (Weimerskirch et al., 1994; Ropert-Coudertet al., 2004), particularly when self-feeding locations differ from locationswhere provisioning occurs (Ydenberg & Davies, 2010). Future studies arewarranted to measure the duration of feeding trips and locate feeding habitatto test the bimodal foraging hypothesis in American beavers.
14 Behaviour (2014) DOI:10.1163/1568539X-00003183
Our results also support the hypothesis that subadult beavers have strongermovement propensity than yearlings as core home-range areas and 50%home KDE home ranges of subadults were larger than those of yearlings.McNew & Woolf (2005) found that proportions of dispersing subadultbeavers (2 years old) were greater than those of yearling beavers in Illinois.Pre- and post-dispersal exploratory movements within home ranges may in-crease the core use areas of subadult beavers, as seen with flying squirrels(Pteromys volans) (Selonen & Hanski, 2006). In summary, beavers movedfaster in wetland habitat (probably in water) as distance from their mainlodge increased, which is consistent with potential high predation risk byaquatic predators such as alligators in our site. The apparent lack of delib-erate movements in uplands was likely due to either existence of multiplerefuges within beaver home ranges and low predation risk by terrestrialpredators in the southeastern US. Beavers appeared to make bimodal for-aging trips during the breeding season probably due to tradeoffs betweentravelling farther to feed themselves and staying close to lodges to nurseand protect newborns. Taken together, our results support the overarchinghypothesis that patterns of foraging behavior and age-related physiologicalstates shape the movement ecology of beavers in our study system. Futurestudies of relationships between the movement patterns of American beaversand predation risks in different contexts of habitat, such as upland and wet-land habitats, are needed for better understanding of the movement ecologyof American beavers and other semi-aquatic mammals.
Acknowledgements
The authors are grateful to Amy Bleisch, Russell Singleton and DonivanSphar for trapping and handling American beavers. Two anonymous re-viewers made helpful comments on our manuscript. We thank Dr. CraigWillis for his comments on our manuscript. We would like to thank KyleMarable, Matthew McKinney, Cody Rainer and Trent Danley for their vol-unteer assistance with field work. We also thank the Redstone Arsenal En-vironmental Management Division, specifically Christine Easterwood andJustin Pflueger, for their logistical assistance. Eric Wengert provided assis-tance in making Figure 1. This study was financially supported by UnitedStates Department of Agriculture APHIS National Wildlife Research Center,Berryman Institute East, Forest and Wildlife Research Center and Depart-ment of Wildlife, Fisheries and Aquaculture at Mississippi State University.

L.F. McClintic et al. / Behaviour (2014) 15
References
Allen, A.W. (1983). Habitat suitability index models: beaver. — In: US Fish and WildlifeService US Fish and Wildlife Service, Washington, DC, p. 20.
Andersson, M. (1978). Optimal foraging area: size and allocation of search effort. — Theor.Popul. Biol. 13: 397-409.
Arjo, W.M., Huenefeld, R.E. & Nolte, D.L. (2007). Mountain beaver home ranges, habitatuse, and population dynamics in Washington. — Can. J. Zool. 85: 328-337.
Arjo, W.M., Joos, R.E., Kochanny, C.O., Harper, J.L., Nolte, D.L. & Bergman, D.L. (2008).Assessment of transmitter models to monitor beaver Castor canadensis and C. fiber pop-ulations. — Wildl. Biol. 14: 309-317.
Baker, B.W. & Hill, E.P. (2003). Beaver (Castor canadensis). — In: Wild mammals of NorthAmerica: biology, management, and conservation (Feldhamer, G.A., Thompson, B.C. &Chapman, J.A., eds). The Johns Hopkins University Press, Baltimore, MD, p. 288-310.
Batschelet, E. (1981). Circular statistics in biology. — Academic Press, New York, NY.Benaglia, T., Chauveau, D., Hunter, D.R. & Young, D.S. (2009). mixtools: an R package for
analyzing finite mixture models. — J. Stat. Softw. 32: 1-29.Bloomquist, C.K. & Nielsen, C.K. (2010). Demography of unexploited beavers in southern
Illinois. — J. Wildl. Manage. 74: 228-235.Bloomquist, C.K., Nielsen, C.K. & Shew, J.J. (2012). Spatial organization of unexploited
beavers (Castor canadensis) in southern Illinois. — Am. Midl. Nat. 167: 188-197.Bond, B.T., Leopold, B.D., Burger Jr., L.W. & Godwin, K.D. (2001). Movements and home
range dynamics of cottontail rabbits in Mississippi. — J. Wildl. Manage. 65: 1004-1013.Boyce, M.S. (1981). Habitat ecology of an unexploited population of beavers in interior
Alaska. — In: Proceedings of the worldwide furbearer conference (Chapman, J.A. &Pursley, D., eds), Frostburg, MD, p. 155-186.
Breck, S.W., Wilson, K.R. & Andersen, D.C. (2001). The demographic response of bank-dwelling beavers to flow regulation: a comparison on the Green and Yampa Rivers. —Can. J. Zool. 79: 1957-1964.
Brzyski, J.R. & Schulte, B.A. (2009). Beaver (Castor canadensis) impacts on herbaceous andwoody vegetation in southeastern Georgia. — Am. Midl. Nat. 162: 74-86.
Buchmann, C.M., Schurr, F.M., Nathan, R. & Jeltsch, F. (2012). Movement upscaled — theimportance of individual foraging movement for community response to habitat loss. —Ecography 35: 436-445.
Burnham, K.P. & Anderson, D.R. (2002). Model selection and multi-model inference: a prac-tical information-theoretic approach. — Springer, New York, NY.
Calenge, C. (2006). The package “adehabitat” for the R software: a tool for the analysis ofspace and habitat use by animals. — Ecol. Model. 197: 516-519.
Campbell, R.D., Newman, C., Macdonald, D.W. & Rosell, F. (2013). Proximate weatherpatterns and spring green-up phenology effect Eurasian beaver (Castor fiber) body massand reproductive success: the implications of climate change and topography. — Glob.Change Biol. 19: 1311-1324.
Cochran, W.W., Lord, R.D.J. & Lord Jr., R.D. (1963). A radio-tracking system for wildanimals. — J. Wildl. Manage. 27: 9-24.
16 Behaviour (2014) DOI:10.1163/1568539X-00003183
Collen, P. & Gibson, R.J. (2000). The general ecology of beavers (Castor spp.), as related totheir influence on stream ecosystems and riparian habitats, and the subsequent effects onfish: a review. — Rev. Fish Biol. Fish. 10: 439-461.
Covich, A.P. (1976). Analyzing shapes of foraging areas: some ecological and economictheories. — Annu. Rev. Ecol. Syst. 7: 235-257.
Debeffe, L., Morellet, N., Cargnelutti, B., Lourtet, B., Coulon, A., Gaillard, J.M., Bon, R. &Hewison, A.J.M. (2013). Exploration as a key component of natal dispersal: dispersersexplore more than philopatric individuals in roe deer. — Anim. Behav. 86: 143-151.
Di Stefano, J., Coulson, G., Greenfield, A. & Swan, M. (2011). Resource heterogeneityinfluences home range area in the swamp wallaby Wallabia bicolor. — Ecography 34:469-479.
Franke, A., Caelli, T. & Hudson, R.J. (2004). Analysis of movements and behavior of caribou(Rangifer tarandus) using hidden Markov models. — Ecol. Model. 173: 259-270.
Fry, J.A., Xian, G., Suming, J., Dewitz, J.A., Homer, C.G., Limin, Y., Barnes, C.A., Herold,N.D. & Wickham, J.D. (2011). Completion of the 2006 national land cover database forthe conterminous United States. — Photogr. Eng. Remote Sens. 77: 858-864.
Fryxell, J.M. (1992). Space use by beavers in relation to resource abundance. — Oikos 64:474-478.
Fryxell, J.M. & Doucet, C.M. (1991). Provisioning time and central-place foraging in beavers.— Can. J. Zool. 69: 1308-1313.
Getty, T. (1981). Analysis of central-place space-use patterns: the elastic disc revisited. —Ecology 62: 907-914.
Getz, W.M. & Saltz, D. (2008). A framework for generating and analyzing movement pathson ecological landscapes. — Proc. Natl. Acad. Sci. USA 105: 19066-19071.
Greenwood, P.J. (1980). Mating systems, philopatry, and dispersal in birds and mammals. —Anim. Behav. 28: 1140-1162.
Havens, R.P. (2006). Beaver home ranges and movement patterns on the Embarras RiverWatershed in east central Illinois. — Thesis, Eastern Illinois University, Charleston, IL.
Hill, E.P. (1976). Control methods for nuisance beaver in the southeastern United States. —Vertebrate Pest Conference Proceedings 44: 85-98.
Jenkins, S.H. (1980). A size–distance relation in food selection by beavers. — Ecology 61:740-746.
Ludynia, K., Dehnhard, N., Poisbleau, M., Demongin, L., Masello, J.F., Voigt, C.C. &Quillfeldt, P. (2013). Sexual segregation in rockhopper penguins during incubation. —Anim. Behav. 85: 255-267.
McNew Jr., L.B. & Woolf, A. (2005). Dispersal and survival of juvenile beavers (Castorcanadensis) in southern Illinois. — Am. Midl. Nat. 154: 217-228.
Mott, C.L., Bloomquist, C.K. & Nielsen, C.K. (2011). Seasonal, diel, and ontogenetic pat-terns of within-den behavior in beavers (Castor canadensis). — Mamm. Biol. 76: 436-444.
Mueller, T. & Fagan, W.F. (2008). Search and navigation in dynamic environments — fromindividual behaviors to population distributions. — Oikos 117: 654-664.

L.F. McClintic et al. / Behaviour (2014) 17
Nams, V.O. (2006). Locate III User’s Guide. — Pacer Computer Software, Tatamagouche,NS.
Nathan, R. (2008). An emerging movement ecology paradigm. — Proc. Natl. Acad. Sci. USA105: 19050-19051.
Nathan, R., Getz, W.M., Revilla, E., Holyoak, M., Kadmon, R., Saltz, D. & Smouse, P.E.(2008). A movement ecology paradigm for unifying organismal movement research. —Proc. Natl. Acad. Sci. USA 105: 19052-19059.
Novak, M. (1987). Beaver. — In: Wild furbearer management and conservation in NorthAmerica (Novak, M., Baker, J.A., Obbard, M.E. & Malloch, B., eds). Ashton-Potter,Concord, ON, p. 283-312.
Orians, G.H. & Pearson, N.E. (1979). On the theory of central place foraging. — Ohio StateUniversity Press, Columbus, OH.
Owen-Smith, N., Fryxell, J.M. & Merrill, E.H. (2010). Foraging theory upscaled: the be-havioural ecology of herbivore movement. — Phil. Trans. Roy. Soc. Lond. B: Biol. 365:2267-2278.
Pulido, F. (2007). The genetics and evolution of avian migration. — BioScience 57: 165-174.R Development Core Team (2011). R: a language and environment for statistical computing.
— R Foundation for Statistical Computing, Vienna.Ropert-Coudert, Y., Wilson, R.P., Daunt, F. & Kato, A. (2004). Patterns of energy acquisition
by a central place forager: benefits of alternating short and long foraging trips. — Behav.Ecol. 15: 824-830.
Rothmeyer, S.W., McKinstry, M.C. & Anderson, S.H. (2002). Tail attachment of modifiedear-tag radio transmitters on beavers. — Wildl. Soc. Bull. 30: 425-429.
Schradin, C., Schmohl, G., Rödel, H.G., Schoepf, I., Treffler, S.M., Brenner, J., Bleeker,M., Schubert, M., König, B. & Pillay, N. (2010). Female home range size is regulatedby resource distribution and intraspecific competition: a long-term field study. — Anim.Behav. 79: 195-203.
Selonen, V. & Hanski, I.K. (2006). Habitat exploration and use in dispersing juvenile flyingsquirrels. — J. Anim. Ecol. 75: 1440-1449.
Weimerskirch, H., Chastel, O., Ackermann, L. & Chaurand, T. (1994). Alternate long andshort foraging trips in pelagic seabird parents. — Anim. Behav. 47: 472-476.
White, G.C. & Garrott, R.A. (1990). Analysis of wildlife radio-tracking data. — AcademicPress, San Diego, CA.
Wolff, J.O. (1993). What is the role of adults in mammalian juvenile dispersal? — Oikos 68:173-176.
Worton, B.J. (1989). Kernel methods for estimating the utilization distribution in home-rangestudies. — Ecology 70: 164-168.
Ydenberg, R.C. & Davies, W.E. (2010). Resource geometry and provisioning routines. —Behav. Ecol. 21: 1170-1178.