mp-5: government transactions
TRANSCRIPT

Methodology Papers: U. S. National Income and
Product Accounts September 2005
GOVERNMENT TRANSACTIONS
Acknowledgements
U. S. Department of Commerce Carlos Gutierrez, Secretary
Bureau of Economic Analysis J. Steven Landefeld, Director
Rosemary D. Marcuss, Deputy Director
Brent R. Moulton, Associate Director for National Economic Accounts, provided overall supervision for the preparation of Government Transactions. Brooks B. Robinson, Chief of the Government Division supervised the preparation of this paper. Florence H. Campi provided overall coordination and design of this methodology paper. Part I, “Introduction,” was prepared by D. Timothy Dobbs and David F. Sullivan. Part II, “Federal Government Transactions,” was prepared by Jennifer A. Bennett and Gregory J. Kuczura, assisted by other members of the Federal Branch, under the direction of Pamela A. Kelly, Chief of the Federal Branch of the Government Division. Part III, “State and Local Government Transactions,” was prepared by Rebecca A. Rider and Alyssa E. Holdren, under the direction of Bruce E. Baker, Chief of the State and Local Branch of the Government Division. Part IV, “Government Consumption Expenditures and Gross Investment by Function,” was adapted from an article in the October 2004 Survey of Current Business by Florence H. Campi.
i

Table of Contents
PART 1 INTRODUCTION
PART II FEDERAL GOVERNMENT TRANSACTIONS
PART III STATE AND LOCAL GOVERNMENT TRANSACTIONS
PART IV REAL GOVERNMENT CONSUMPTION EXPENDITURES
AND GROSS INVESTMENT-BY-FUNCTION
ii

Preface
This paper is one of a series of papers designed to provide information on the methodologies that are used to prepare BEA’s National Income and Product Accounts (NIPAs). Part I of Government Transactions (MP–5) presents the conceptual basis and framework of government transactions. Part II describes the preparation of Federal government transactions. Part III describes the preparation of state and local government transactions. Part IV describes the preparation of estimates of government consumption expenditures and gross investment by function. The current MP-5 comes seventeen years after the previous Government Transactions methodology paper, which was published in November 1988. It reflects improved estimation methodologies and it provides descriptions of new and better source data that are used to prepare estimates of government transactions. Most revisions to the sources and methods used to prepare estimates of government transactions presented in this revised MP-5 were described initially in articles that discussed comprehensive and annual NIPA revisions in BEA’s monthly journal, the Survey of Current Business. Information on other methodologies and methodology papers are available on BEA’s Internet Web site at http://www.bea.gov/bea/mp.htm. General questions and comments concerning this methodology paper should be addressed to Brooks B. Robinson, Chief of the Government Division. For specific questions and comments on the “Introduction,” contact D. Timothy Dobbs, Government Division Senior Economist; on “Federal Government Transactions,” contact Pamela A. Kelly, Chief of the Federal Branch; on “State and Local Government Transactions,” contact Bruce E. Baker; Chief of the State and Local Branch; and on “Government Consumption Expenditures and Gross Investment by Function,” contact Brooks B. Robinson.
iii
EXECUTIVE SUMMARY Government Transactions (MP-5) is one in a series of Bureau of Economic Analysis (BEA) methodology papers. It is designed to provide information on concepts and methods that are used to prepare government sector estimates for the National Income and Product Accounts (NIPAs). Presented below are the important features of each part of MP-5. PART I: THE INTRODUCTION. Part I opens MP-5 with the conceptual basis, framework, and scope of government transactions in the NIPAs, and discusses the relationship between the NIPAs and the System of National Accounts, 1993 (SNA). It describes how government is treated in the NIPAs—as both a producer and as a purchaser and consumer of goods and services. The sources and methods that are used to prepare estimates of current-dollar government receipts and expenditures and estimates of real government consumption expenditures and gross investment are introduced. A brief explanation of the estimates of government spending by function is provided. Government Transactions primarily features receipt and expenditure flows, which are defined in Part I. Current receipts consists of current tax receipts, contributions for government social insurance, income receipts on assets, current transfer receipts, and the current surplus of government enterprises. Current expenditures consists of consumption expenditures, current transfer payments, interest payments, subsidies, and an adjustment for the difference between wage accruals and wage disbursements. Net government saving is defined as current receipts less current expenditures. Broader measures are also described: Total receipts consists of current receipts and capital transfer receipts; total expenditures consists of current expenditures, gross government investment, capital transfer payments, and net purchases of nonproduced assets, less consumption of fixed capital. Total receipts less total expenditures is net lending or net borrowing, an indicator of the financing requirement of the government sector. The chapter also includes an explanation of the relationship between NIPA current government receipts and expenditures and financial statements that serve as the underlying source data for estimates of government transactions. It includes a guide to locating NIPA tables, which appear in the Survey of Current Business (BEA’s monthly journal) and on BEA’s Internet Web site. Part I closes with a glossary of the statistical conventions commonly used at BEA to prepare the estimates: Seasonal adjustment, interpolation, and extrapolation. PART II: FEDERAL GOVERNMENT TRANSACTIONS. Federal Government transactions are derived primarily from The Budget of the United States Government. Part II begins with an extensive discussion of how BEA translates the budget into Federal Government receipts and expenditures. Federal Government current receipts includes current taxes, contributions to government social insurance, income receipts on assets, current transfer receipts, and the current surplus of government enterprises. Current expenditures includes defense and nondefense consumption expenditures (which is estimated as gross output of general government, less own-account investment and sales to other sectors), current transfer payments, interest payments, and
iv
subsidies. Net saving is current receipts less current expenditures. Total receipts consists of current receipts and capital transfer receipts. Total expenditures consists of current expenditures, capital transfer payments, gross investment (structures plus equipment and software), and net purchases of nonproduced assets, less consumption of fixed capital. Net lending and borrowing is total receipts less total expenditures. The chapter presents each receipt and expenditure type separately; it provides a definition, identifies source data, and describes estimation methodologies for annual, quarterly, and monthly estimates. Part II also provides an explanation of the special methods required to produce certain estimates of real Federal government consumption expenditures and gross investment. In addition, it contains tables and a list of sources that provide further insight into the sources and methods used to produce estimates of Federal Government receipts and expenditures. PART III: STATE AND LOCAL GOVERNMENT TRANSACTIONS Part III begins with an overview of source data and estimating procedures. The Census publications, Census of Governments (COG) and Government Finances (GF), are among the primary sources of state and local data. A thorough explanation of BEA’s reconciliation of COG-GF fiscal year data and NIPA estimates of current receipts and expenditures is provided. State and local government current receipts includes current taxes, contributions to government social insurance, income receipts on assets, current transfer receipts, and the current surplus of government enterprises. Current expenditures includes consumption expenditures (which is estimated as gross output of general government, less own-account investment and sales to other sectors), government social benefit payments to persons, interest payments, and subsidies. Total receipts consists of current receipts and capital transfer receipts. Total expenditures consists of current expenditures, capital transfer payments, gross investment (structures plus equipment and software), and net purchases of nonproduced assets, less consumption of fixed capital. Methods are described for producing annual, quarterly, and monthly estimates. The chapter concludes with a presentation of the methods used to derive real consumption expenditures and gross investment, and provides a comprehensive list of sources that underpin estimates of state and local government receipts and expenditures. PART IV: GOVERNMENT CONSUMPTION EXPENDITURES AND GROSS INVESTMENT BY FUNCTION Part IV provides a brief summary of the sources and methods that are used to prepare estimates of current-dollar and real consumption expenditures and gross investment by function, which are presented in NIPA table family 3.15. The functional classification system used for these estimates is the Classification of the Functions of Government (COFOG). The chapter also mentions additional estimates of government spending by function that are produced by BEA and presented in NIPA tables 3.16 and 3.17. Note: Government Transactions is only available in an electronic format on BEA’s Internet
Web site at www.bea.gov. BEA views Government Transactions as a “living document” that will be revised as BEA changes the sources and methods in response to the changing economy.
v

I—1
PART I
INTRODUCTION

I—2
Acronyms and common references BEA Bureau of Economic Analysis CFC Consumption of Fixed Capital GDP Gross Domestic Product NIPA National income and product account SNA System of National Accounts (1993), an international standard for
publication of economic accounts. See paragraph 5 Survey The Survey of Current Business, BEA’s monthly magazine. BEA’s web site: http://www.bea.gov BEA’s gross domestic product web page: http://www.bea.gov/bea/dn/home/gdp.htm. (This page may also be reached from http://www.bea.gov by selecting “Gross domestic product.”)

I—3
Table of Contents . 1. OVERVIEW..................................................................................................................................4
2. CONCEPTUAL BASIS AND FRAMEWORK............................................................................4
3. OVERVIEW OF GOVERNMENT AGGREGATES IN THE NIPAS ........................................5
4. GOVERNMENT: SCOPE AND COVERAGE...........................................................................8
5. GOVERNMENT AS A PRODUCER (GENERAL GOVERNMENT) .......................................9
6. GOVERNMENT RECEIPTS AND EXPENDITURES ACCOUNT.........................................11
7, GOVERNMENT ENTERPRISES ..............................................................................................15
8. REAL OUTPUT AND RELATED MEASURES.......................................................................16
9. GOVERNMENT EXPENDITURES BY FUNCTION ..............................................................19
10. OTHER ASPECTS OF GOVERNMENT ................................................................................19
11. RELATION OF NIPA GOVERNMENT CURRENT RECEIPTS AND EXPENDITURES
TO FINANCIAL STATEMENTS ...................................................................................................20
12. PRESENTATION OF THE ESTIMATES ...............................................................................21
13. STATISTICAL CONVENTIONS ............................................................................................23
TABLES...........................................................................................................................................25
APPENDIX ......................................................................................................................................35

I—4
1. INTRODUCTION This paper presents the conceptual basis and framework of government transactions in the National Income And Product Accounts (NIPAs); describes the presentation of the estimates; and describes the sources and methods used to prepare annual, quarterly, and monthly estimates of government transactions.1 Part I, the introduction, discusses the recording of government transactions in the NIPAs; the relation of the NIPA measures of government current receipts, current expenditures, and gross investment to analogous measures from government financial statements; and defines government transactions that are presented in NIPA tables. Parts II and III describe the sources and methods used to derive Federal Government transactions and state and local government transactions, respectively. Part IV discusses the sources and methods used to prepare estimates of government consumption expenditures and of government gross investment by function. 2. CONCEPTUAL BASIS AND FRAMEWORK The concepts supporting the government sector of the NIPAs are specifically designed to be consistent with NIPA measures of the rest of the economy; the major components of the NIPA government sector accounts are presented and defined below within the context of the Summary National Income and Product Accounts (see table A). The NIPAs may be viewed as aggregations of accounts belonging to the individual transactors in the economy. The NIPAs present consistent and comprehensive measures of the nation’s economic activity, beginning with production and the income that is derived from production. Products are classified as consumption, which satisfies the demands of consumers and the general public, or investment, which are goods such as structures, equipment, and software that are used for future production. Income from current production can fund consumption expenditures or can be saved. The accounts also record foreign trade in goods and services and income received from or paid to the rest of the world. The accounts are formulated in a comprehensive, double-entry system of accounts in which transactions between members of two sectors are recorded as payments by one sector and as receipts by the other. The NIPAs, like the national accounts of most countries, are guided by The System of National Accounts, 1993 (SNA),2 which is the international standard for national economic accounting. The SNA describes an integrated system of accounts for each of the major sectors of the economy. The accounts for each sector represent aggregations of accounts for individual institutional units and
1 For more information on the concepts underlying the accounts, see A Guide to the NIPAs on BEA’s web site at http://www.bea.gov/bea/an/nipaguid.htm. This document was published in June 2001, and does not reflect the comprehensive revision that was released beginning in December 2003. For changes arising from that revision, see Brent R. Moulton and Eugene P. Seskin, “Preview of the 2003 Comprehensive Revision of the National Income and Product Accounts,” Survey 83 (June 2003), 17–31; Nicole Mayerhauser, Shelly Smith, and David F. Sullivan, “Preview of the 2003 Comprehensive Revision of other National Income and Product Accounts,” Survey 83 (August 2003), 7–31; and Carol E. Moylan and Brooks B. Robinson, “Preview of the 2003 Comprehensive Revision of other National Income and Product Accounts, Statistical Changes,” Survey 83 (September 2003), 17–32. Additional BEA information may be found at http://www.bea.gov/bea/mp.htm. 2 Commission of the European Communities, International Monetary Fund, Organisation for Economic Co-operation and Development, United Nations, and World Bank. System of National Accounts, 1993. Brussels/Luxembourg, New York, Paris, Washington, D.C., 1993. A related system is described in International Monetary Fund, Government Finance Statistics Manual 2001, (International Monetary Fund Publication Services, Washington, D.C., December 19, 2001).
I—5
record the production, income, saving, investment, and financial flows for that sector. Those sector flow accounts are combined with information on changes in the value of assets and liabilities due to price changes or other flows that are not transactions. All together, the integrated accounts offer a means to track the sources of change in each sector’s net worth, beginning with an opening balance sheet at the beginning of a period and tracking all sources of change in net worth through the closing balance sheet at the end of the period. In the United States, the NIPAs present some of the information covered by the SNA, while other information is presented in the Federal Reserve Board’s flow of funds accounts. Although the NIPAs are largely consistent with the SNA, there are some gaps and inconsistencies relative to what would be needed for a complete set of integrated accounts.3 The BEA strategic plan identifies improving consistency and integration with other accounts and improving consistency with international standards as priorities for improvement.4 3. OVERVIEW OF GOVERNMENT AGGREGATES IN THE NIPAS Governments serve several roles in the economy—as producers of nonmarket services for consumption by the general public, as investors in capital assets providing infrastructure for themselves and for the society as a whole, as providers of social benefits and other transfer payments, and as contributors to the nation’s saving and investment.5 These roles are largely financed through taxation and contributions to social insurance funds. This section highlights the major government-sector aggregates in the NIPAs; they are discussed and defined in more detail later in this methodology. In the NIPAs, the framework for government consumption expenditures—both Federal and state and local—explicitly recognizes government as a producer of goods and services. The value of general government output is measured by the cost of inputs: Compensation, consumption of fixed capital (a partial measure of the services of general government fixed assets), and intermediate goods and services purchased (purchases of goods and services by general government). The conceptual framework for the services produced by government parallels the concepts of output and intermediate inputs of private business in BEA’s input-output (I-O) accounts and the GDP-by-industry accounts; however, because most government output is not sold in the market, government output is measured by the costs of inputs instead of by market prices. The NIPAs use two approaches to measure and present GDP: (1) GDP as the sum of value added by each economic sector; and (2) GDP as the sum of final demand. Table B shows the measures for both approaches for the general government sector. In the “value added” approach, GDP equals gross value added aggregated across all sectors of the domestic economy (business, “persons” [households and nonprofit institutions serving households], and general government); this approach is presented in NIPA table 1.3.5. In general, value added is the measure of the contribution to GDP made by a producer, industry, or sector, and 3 For a detailed comparison of the organization and major features of the NIPAs with those of the SNA, see Charles Ian Mead, Karin E. Moses, and Brent R. Moulton, “The NIPAs and the System of National Accounts,” Survey 84 (December 2004), 17-32. 4 See the Bureau of Economic Analysis Strategic Plan for FY 2005 – FY 2009; http://www.bea.gov/bea/about/Director.htm#Strategic . 5 The value of the services provided to the general public is treated as government consumption expenditures.
I—6
it is the source from which incomes are generated. For general government, value added (or production) is measured as the sum of compensation of employees and consumption of fixed capital.6 Gross output of general government consists of valued added plus the intermediate goods and services used in the production of goods and services by general government; table B also shows gross output of general government. Gross output of general government includes the value of all the goods and services produced by general government, whether they are sold to other sectors, treated as government investment, or provided as government services to the society. Gross output is also used in the calculation of government consumption expenditures, which is discussed below. In the “final demand” or “expenditure” approach, GDP is measured as the sum of final demand of the personal, business, foreign, and government sectors. In this approach, which is presented in NIPA table 1.1.5, GDP is the sum of personal consumption expenditures, gross private domestic investment, net exports of goods and services, and government consumption expenditures and gross investment. Government-sector final demand of goods and services is the sum of government consumption expenditures and gross investment. Table B shows the derivation of government consumption expenditures as gross output of general government (described above), less own-account investment (construction and software produced by government for use by government) and sales by general government to other sectors. The second component of government final demand, gross investment, consists of the structures, equipment, and software acquired by government from other sectors or produced by government for its own use; the structures, equipment, and software may be provided for use in government production (for example, defense equipment) or for the use of society as a whole (for example, highways). The NIPAs also show the government sector from the point of view of how it finances its activities, engages in consumption expenditures, provides income payments, and contributes saving to the economy. The current receipts and current expenditures account (table C) for the government sector provides information on these activities and is also useful for fiscal analysis of the government sector. Current receipts consists of current tax receipts, contributions for government social insurance, income receipts on assets, current transfer receipts, and current surplus of government enterprises. Current expenditures consists of consumption expenditures, current transfer payments, interest payments, and subsidies, less wage accruals less disbursements. The balance of current receipts less current expenditures is net government saving. The government receipts and expenditures table corresponds to Account 4 of the seven summary national income and product accounts, a set of accounts that show the composition of production and the distribution of incomes earned in production.7
6 The measurement of value added for general government differs from the measurement of value added for private business and government enterprises. For these enterprises, gross value added can be measured as the sum of compensation of employees, consumption of fixed capital, taxes on production and imports, less subsidies, plus a “net operating surplus.” “Net operating surplus” is a profits-like measure that shows business income after deducting the costs of compensation of employees and taxes on production and imports, less subsidies, from gross value added, but before deducting financing costs (such as net interest) or business current transfer payments. In contrast, general government is assumed to receive no subsidies, to pay no taxes on production and imports, and to have no net operating surplus (value added less compensation of employees and consumption of fixed capital equals zero). 7 The summary accounts are shown at Survey 83 (August 2005):10-26.

I—7
The sections of this paper that discuss methodologies for the Federal estimates and for the state and local estimates are primarily organized to follow the sequence of the current receipts and current expenditures account. However, the methodologies for the estimates of government gross investment (which are not current expenditures) are discussed in conjunction with the methodologies for consumption expenditures (which are current expenditures), because many of the data sources and estimation techniques for gross investment are similar to those for consumption expenditures. Table D shows the derivation of government net lending or net borrowing as total receipts less total expenditures. Total receipts consists of current receipts and capital transfer receipts. Total expenditures consists of current expenditures, gross government investment, capital transfer payments, and net purchases of nonproduced assets, less consumption of fixed capital. The balance of total receipts less total expenditures is net lending or net borrowing, an indicator of the financing requirement of the government sector. Alternatively, net lending or net borrowing may be viewed as current-account net government saving plus net capital transfers, gross government investment, and net purchases of nonproduced assets, less consumption of fixed capital. The capital account corresponds to the addenda of NIPA table 3.1. The NIPA summary accounts form a double-entry system in which a use (or expenditure) recorded in one account for one sector is also recorded as a source (or receipt) in an account of another sector or of the same sector. Thus, government transactions recorded in the government receipts and expenditures account may also be recorded in other summary accounts. In summary account 1, the domestic income and product account, the right-hand side includes government consumption expenditures and gross investment as a component of final demand that sums to GDP. The left-hand side includes government wages and salary accruals, supplements to wages and salaries paid on behalf of government employees, taxes on production and imports, current surplus of government enterprises, and consumption of government fixed capital as components of gross domestic income. In summary account 2, the private enterprise income account, the left-hand side (uses of private enterprise income) includes interest and miscellaneous payments from private enterprises to government, business current transfer payments to government, and taxes on corporate income paid to government. In summary account 3, the personal income and outlay account, the right-hand side (personal income) includes compensation received from government, interest paid to persons by government, and government social benefits paid to persons, less contributions for government social insurance. The left-hand side (personal taxes, outlays, and saving) includes personal current taxes and personal current transfers paid to government. Summary account 4, the government receipts and expenditures account, is discussed in detail in this methodology paper. As noted above, the sections of this paper that discuss methodologies for the Federal estimates and for state and local estimates are primarily organized to follow the sequence of the current receipts and current expenditures account.

I—8
In summary account 5, the foreign transactions current account, the right-hand side (current payments to the rest of the world and balance on current account) includes current taxes and transfer payments to the rest of the world from government, which consists of government social benefits to the rest of the world, other current transfer payments to the rest of the world, less taxes paid by the rest of the world. In summary account 6, the domestic capital account, the right-hand side (gross saving and statistical discrepancy) includes net government saving and consumption of fixed capital for general government and government enterprises. The left-hand side (gross investment, capital transfers, and net lending) includes government fixed investment and capital transfer payments to the rest of the world (net), which includes a government component. In summary account 7, the foreign transactions capital account, the right-hand side (capital account transactions (net) and net lending) includes capital transfer payments to the rest of the world (net), which includes a government component. 4. GOVERNMENT: SCOPE AND COVERAGE Government may be described as unique kinds of legal entities established by political processes which have legislative, judicial, or executive authority within a given area. The principal functions of government are to assume responsibility for the provision of goods and services to the community or to individual households and to finance their provision out of taxation or other incomes; to redistribute income and wealth by means of transfers; and to engage in non-market production.8 Federal Government. In general, BEA adopts the Federal Budget’s classification of institutional units when preparing national accounts statistics. However, there are selected cases where BEA deviates from the budget’s classifications; in these cases, BEA relies upon the SNA for guidance. The NIPA Federal sector includes the Postal Service and the social security trust funds, which are officially designated “off-budget” funds. The NIPA Federal sector also includes Guaranteed Loan Financing accounts and Direct Loan Financing accounts, which are excluded from the budget totals. The U.S. Federal Reserve System, the nation’s financial authority, is a unique case; the system’s Board of Governors is classified in the public or government sector, while the system of regional Federal Reserve Banks is classified in the private corporate sector. State and local governments. For state and local governments, BEA relies substantially on Census Bureau data to prepare national accounts statistics. The NIPA government sector includes Indian tribal governments, which are not included in the Census data. The Census state and local government data includes state and local government employee retirement systems, which are in the NIPA private sector, and state unemployment insurance (a joint Federal-state program), which is in the NIPA Federal Government sector.
8 Most of the definitions in this chapter are similar to definitions used in the SNA.

I—9
General government. General government consists of those publicly owned and controlled entities which, in addition to fulfilling their political responsibilities and their role of economic regulation, produce principally non-market services for the public and redistribute income and wealth. In effect, general government consists of all government entities except government enterprises. Government enterprises. Government enterprises are government agencies that sell their goods and services directly to the public for a price and recover part or all of their operating costs. They include agencies such at the U.S. Postal Service and local transit authorities. In the NIPAs, specific Federal agencies are classified as enterprises based on an analysis of the characteristics of the entities and on data from their financial statements. For state and local governments, specific functions of government (such as utilities) are classified as enterprises. The NIPA treatment of enterprises is discussed in the “Government Enterprises” section below; specific enterprises are discussed in Parts II (Federal) and III (state and local) of this methodology paper. 5. GOVERNMENT AS A PRODUCER (GENERAL GOVERNMENT) The NIPAs recognize that government is a producer. Government uses labor, capital, and intermediate inputs in order to produce services such as education and defense. Government is also treated as the final consumer of such services (government consumption expenditures). In this context, NIPA table family 3.10 presents government output and its relationship with government consumption expenditures (see table B). Gross output of general government (line 3 of Table B). Gross output of general government consists of all of the goods and services produced by general government, including those that are sold or that become part of government fixed investment (own-account investment). As stated earlier, gross output of general government is measured by the cost of the inputs used for production: Compensation of general government employees, consumption of fixed capital (CFC), and intermediate goods and services purchased. (CFC, or depreciation, is included in gross government output as a partial measure of the services of general government fixed assets; the use of depreciation alone implies a zero net return on these assets.) This framework of the services produced by government and of the goods and services purchased by government is parallel to the concepts of output and intermediate inputs of business in the input-output accounts and the GDP-by-industry accounts; however, business output is valued at market prices. Value added (line 4). Value added is the value of government’s output less the value of the goods and services purchased by government and used in production. For general government, this is equal to compensation of employees plus CFC. Estimates of CFC are derived from investment estimates, using a perpetual inventory method.9 For each type of fixed asset, current-dollar investment estimates for all years are converted to
9 See U.S. Department of Commerce, Bureau of Economic Analysis. Fixed Assets and Consumer Durable Goods in the United States, 1925-99. Washington, DC: U.S. Government Printing Office, September, 2003; page M-6.
I—10
constant-dollar estimates by deflation with an appropriate deflator.10 A rate of depreciation is estimated for each type of asset. Each year of constant dollar investment is depreciated over time, using geometric depreciation.11 The resulting constant-dollar CFC (depreciation) and year-end stocks estimates are converted back to current dollars with the investment deflator. Throughout the NIPAs, adjustments to this general procedure are made when assets are destroyed as a result of extraordinary disasters (such as Hurricane Katrina, the Loma Prieta earthquake of 1989, and the attack on the World Trade Center). For general government, disaster damage and war losses are directly subtracted from the stock of government assets and no further depreciation is recorded on these assets; CFC for the period of the disaster does not include anything extra for the assets destroyed. For government enterprises, the treatment of disaster damages follows the treatment in the business sector; CFC for the period including the extraordinary disaster includes the value of the assets destroyed.12 For all sectors, the value of such extraordinary destruction is shown as “other changes in volume of assets” in NIPA table 5.9, Changes in Net Stock of Produced Assets. Government consumption expenditures (line 2). Government consumption expenditures is the services produced by government and provided to the general public, exclusive of services sold. In summary, general government gross output is used in three ways:
• A small portion of the output is fixed assets that are to be used by government in the future production of services; this “own-account investment” is classified as part of government investment. Computer software developed by government employees is an example.
• A portion of the output is sold to the public; higher education and hospital services are examples. The sale of these services is recorded as personal consumption expenditures if purchased by persons and as intermediate inputs if purchased by business.
• All other output is classified as government consumption expenditures, representing services provided by government to the public at large.
Government investment (line 13) includes investment in structures, equipment, and software. Highways, schools, and military equipment are important categories. Government investment includes the investment of both general government and enterprises; CFC for general government assets is a component of government output and government consumption expenditures, while CFC for government enterprises is an expense in the calculation of the current surplus of government enterprises. Government consumption expenditures and gross investment is a measure of government’s final demand; that is, government’s portion of GDP in the “final demand” measure of GDP. It can also
10 Deflation is the process of dividing current-dollar estimates by price indexes. 11Missiles, which are depreciated using a straight–line pattern, are an exception.
12 See U.S. Department of Commerce, Bureau of Economic Analysis. Fixed Assets and Consumer Durable Goods in the United States, 1925-97. Washington, DC: U.S. Government Printing Office, September, 2003; page M-2.
I—11
be viewed as expenditures incurred by general government for goods and services – primarily services that are produced by labor and capital within the general government sector – that are provided without charge to the public, whether to individual members of society (such as education at public schools) or to society as a whole (such as national defense or law enforcement). 6. GOVERNMENT RECEIPTS AND EXPENDITURES ACCOUNT This section features definitions for key series and concepts that are reflected in the government receipts and expenditures account. The definitions are presented in the sequence used for NIPA tables 3.1, 3.2, and 3.3; gross investment and grants–in–aid to state and local governments are also defined. The NIPAs include both current account transactions and capital transactions. Current accounts record the production of goods and services, the generation of incomes by production, the subsequent distribution and redistribution of incomes among institutional units, and the use of incomes for purposes of consumption or saving. Investment and capital transfers are not current account transactions, but are capital transactions reflected in the NIPAs. Financial transactions and revaluations are not reflected in the NIPAs, but are recorded in the flow of funds accounts prepared by the Federal Reserve Board.. The classification of government investment as a capital-account rather than current-account transaction is easily understood, but the boundary between current- and capital-account transfers is more confusing. In general, transfers are payments in which the payer makes a payment without receiving any goods, service, or asset in return. Transfers may be current or capital; in order to distinguish between the two, it is useful to focus on the special characteristics of capital transfers. A transfer of cash is capital when it is linked to, or conditional on, the acquisition or disposal of an asset (other than inventories) by one or both parties to the transaction. Federal grants-in-aid to states for highway construction are, therefore, capital transfers. The transfer is classified as capital if it is regarded as a capital transaction by either participant. Estate and gift taxes are classified as capital transfers because they are a one-time levy on the disposition of assets built up over a lifetime by a decedent, regardless of the government’s view that such taxes are an ongoing source of revenue.13 Current receipts. Current receipts are the sum of current tax receipts, contributions for government social insurance, income receipts on assets, current transfer receipts, and current surplus of government enterprises.
13 The following government transactions are classified as capital transfers: (1) Federal Government investment grants to state and local governments for highways, transit, air and water transportation, and water treatment plants; (2) estate and gift taxes; (3) Federal government forgiveness of debt owed by foreign governments to the U.S. government and the December 1999 transfer to the Republic of Panama of the U.S. Government's assets in the Panama Canal Commission; (4) Federal government investment grants to business; and (5) payments to the Uniformed Services Retiree Health Care Fund to amortize its unfunded liability. NIPA table 5.10, Capital Transfers (Net), shows the annual estimates for these transactions.

I—12
Current tax receipts. Current tax receipts is the sum of personal current taxes, taxes on production and imports, taxes on corporate income, and taxes from the rest of the world. Taxes are compulsory, unrequited payments, in cash or in kind, received by government from other sectors. They are described as unrequited because the government provides nothing in return to the payer, except that government may use the money to provide goods, services and benefits to individuals and society at large. Personal current taxes. Personal current taxes is tax payments (net of refunds) by U.S. residents that are not chargeable to business expense. It includes taxes on income (including realized net capital gains), taxes on personal property, and personal license taxes. Personal taxes do not include residential real estate taxes, estate and gift taxes, or personal contributions for social insurance. Taxes on production and imports. Taxes on production and imports includes:
• Taxes payable on goods and services when they are produced, delivered, sold, transferred or otherwise disposed of (such as sales taxes and excise taxes);
• customs duties; and • other taxes on production, consisting mainly of taxes on the ownership or use by business
of land, buildings, or other assets. Employer contributions for social insurance and taxes on corporate income are included. Taxes on corporate income. Taxes on corporate income is income tax liabilities on all corporate earnings, including realized net capital gains. These taxes are measured on an accrual basis, net of applicable tax credits.14 They include payments of earnings by the Federal Reserve System to Federal government accounts. Taxes from the rest of the world. Taxes from the rest of the world is income taxes received by the Federal government from the rest of the world. The published estimates also include some taxes on production and some current transfers because the source data do not permit the reliable separation of the taxes on income. Contributions for government social insurance. Contributions for government social insurance consists of employer, employee, self-employed, and other individual contributions for social insurance. Employer contributions for social insurance consists of employer payments under the following government programs: Old-age, survivors, and disability insurance (social security); hospital insurance; unemployment insurance; railroad retirement; pension benefit guaranty; veterans life insurance; publicly administered workers' compensation; military medical insurance; and temporary disability insurance. Employee and self-employed contributions for social insurance consists of payments by employees, self-employed, and other individuals who participate in the following government programs: Old-age, survivors, and disability insurance (social security); hospital insurance; supplementary medical insurance; unemployment insurance; railroad retirement; veterans life insurance; and temporary disability insurance.
14 For more information, see Corporate Profits: Profits Before Tax, Profits Tax Liability, and Dividends, Methodology Paper No.1 (September 2002).

I—13
Income receipts on assets. Income receipts on assets consists of interest, dividends, and rents and royalties received by all governments. Interest receipts includes both the monetary and imputed interest received on loans and investments. Current transfer receipts. Current transfer receipts consists of current transfers received from business (net) and from persons; for state and local governments, it also includes current-account grants-in-aid from the Federal government. Current transfer receipts: Federal grants-in-aid. Current Federal grants-in-aid is current-account payments from the Federal government to state and local governments to help finance state and local government activities such as public assistance and education. It does not include grants that finance investment activities, such as highway or airport construction; such activities are instead classified as capital transfers. It is a receipt item only for the state and local government account. Current transfer receipts from business (net). Current transfer receipts from business consists of deposit insurance premiums, fines, fees such as regulatory and inspection fees, settlements received from tobacco companies, donations, and net insurance settlements paid to governments as policyholders.15 Current transfer receipts from persons. Current transfer receipts from persons includes fines, immigration and other fees, certain penalty taxes, donations, and unclaimed bank deposits. It also includes excise taxes on excess IRA contributions and excise taxes paid by nonprofit institutions serving households. Current surplus of government enterprises. The current surplus of government enterprises is current operating revenue and subsidies received less current operating expenses. In calculating the current surplus, expenses include consumption of fixed capital (CFC), but neither revenue nor expenses include interest. Current expenditures. Current expenditures is the sum of consumption expenditures, current transfer payments, interest payments, and subsidies, less wage accruals less disbursements. Consumption expenditures. Consumption expenditures is discussed above in the section “Government as a Producer.” Current transfer payments. Current transfer payments consists of government social benefit payments to persons and to the rest of the world, and other current transfer payments to the rest of the world (net). For the Federal Government only, it also includes current-account grants-in-aid to state and local governments.
15 Net insurance settlements are discussed in Baoline Chen and Dennis J. Fixler, “Measuring the Services of Property-Casualty Insurance in the NIPAs: Changes in Concepts and Methods,” Survey 83 (October 2003): 10-26.

I—14
Government social benefits to persons. Government social benefits to persons is the current transfers paid to persons to provide for the needs that arise from circumstances such as sickness, unemployment, retirement, and poverty. There are two kinds of social benefits to persons: benefits from social insurance funds and other social benefits. Social insurance funds include old-age, survivors, and disability insurance (social security); hospital insurance and supplementary medical insurance (Medicaid); unemployment insurance; and other Federal and state and local government programs. Other social benefits include the “refundable” portion of the earned income credit; workers' compensation; veterans benefits; food stamps; supplemental security income and other public assistance programs, and many other programs. Government payments to nonprofit institutions serving households, except payments for work under research and development contracts, are also included; these institutions are included in the NIPA personal sector. Government social benefits to the rest of the world. Government social benefits to the rest of the world is social benefits paid to individuals residing abroad; most such payments are old age and survivors insurance (social security) benefits paid to former U.S. residents. Current transfer payments: Grants-in-aid to state and local governments. Grants-in-aid to state and local governments is the net current payments from the Federal government to state and local governments to help finance state and local government activities such as public assistance and education. It does not include grants financing investment activities, such as highway or airport construction; such activities are instead classified as capital transfers (see page 11). Grants-in-aid is an expenditure item only for the Federal government account; it is identical to the receipts item recorded in the State and local government account. In combining levels of government to get the total government sector, it is netted out; it does not appear in either total government receipts or total government expenditures. Other transfer payments to the rest of the world (net). Other transfer payments to the rest of the world consists of net U.S. Government current-account grants (in cash and in kind) to governments in the rest of the world. Interest payments. Interest payments is interest paid by government to persons, to business, and to the rest of the world. It includes monetary interest paid on public debt and other financial obligations. Subsidies. Subsidies is the current unrequited payments made by government to businesses on the basis of their production activities or the quantities or values of the goods or services which they produce, sell, or import. Subsidies may be designed to influence levels of production, the prices at which outputs are sold, or the profits earned by the producers. Subsides may be paid to private business and to government enterprises at a different level of government. Wage accruals less disbursements. Wage accruals less disbursements is wages and salaries earned less wages and salaries paid. The earnings and payments are different when there are retroactive payments in wages and salaries. Government consumption expenditures include wages and salaries when earned; personal income and personal saving include wages and salaries on a when-paid basis. In order to make government saving consistent with personal saving, a wage accruals less disbursements adjustment is subtracted in deriving total government current
I—15
expenditures. (In the NIPAs, wage accruals is the measure used for gross domestic income, and wage disbursements is the measure used for personal income.) Net government saving. Net government saving is the sum of government current receipts less the sum of government current expenditures. Net government saving is shown separately for social insurance funds and all other funds. Additional clarification may be needed for some difficult-to-classify receipts. Most government receipts are compulsory payments by other sectors for which the payer does not directly receive a particular good or service; their classification as particular taxes or social insurance contributions is usually straight-forward. However, government also receives revenues from the public that represent payments for goods, services, or administrative or regulatory actions, and whose classification could be unclear. In the NIPAs, these revenues may be classified as transfers received by government, as government sales (which are deducted from government consumption expenditures or government investment), or as enterprise revenue (which is accounted for in the treatment of government enterprises that is described below). Such revenues are classified as a current transfer to government if no good, service, or financial asset is given to the payer in return; administrative and regulatory fees are classified as current transfers. Other examples include deposit insurance premiums, donations to government entities, and fines. Such revenues are classified as a sale by general government and deducted from government consumption expenditures if it is for a good or service that is not administrative or regulatory in nature, and if the government unit providing the good or service is not a government enterprise. Examples of government sales include payments received by public hospitals, tuition received by state institutions of higher education, charges for the services of U.S. Department of Agriculture meat graders, and fees received by the National Aeronautics and Space Administration for launching services. Such revenues are classified as enterprise revenue if it is received in exchange for a good or service that is not administrative or regulatory in nature, if providing the good or service is the primary function of the government unit, and if such payments cover a substantial part of the operating costs of the government unit providing the good or service. Examples of enterprise revenue include sales of electricity by public electric utilities and sales of postal services by the U.S. Postal Service. Government enterprises are discussed more thoroughly below. 7. GOVERNMENT ENTERPRISES This section discusses government enterprises, a set of institutional units that have many of the characteristics of private businesses, but are owned by government and are classified in the NIPA government sector. This section defines Government enterprises and discusses their NIPA treatment and their profit-like income (current surplus).

I—16
Government enterprises are government institutional units that are classified in the business sector because they sell their goods and services directly to the public for an economically significant price. A "mixed" treatment of government enterprises is used in the NIPAs, such that certain types of transactions are recorded as if they were part of the government sector and others as if they were part of the business sector. The production activities of government enterprises are presented along with private businesses as part of business sector value added. On the other hand, measures of the current surplus of government enterprises are shown as receipts of the government sector, resulting in measures of net saving and net lending or borrowing that reflect the consolidated accounts of general government and government enterprises.16 Government enterprises are treated like other businesses and included in the NIPA business sector in the following ways: (1) Their sales to final users are valued at market prices and recorded in the business production account; (2) their outlays for materials and business services are considered intermediate; and (3) their wages, salaries, and other compensation payments, their CFC, and their income, are all considered charges against business value added rather than as charges against government value added. Within the business sector, government enterprises are classified as noncorporate business. On the other hand, government enterprises are treated like other government institutional units and are included in the NIPA government sector in the following ways: (1) Their interest payments and receipts are presented with those of general government rather than those of business; (2) their investment in structures, equipment, and software is combined with general government gross investment rather than with business purchases in gross private domestic investment; and (3) their inventory change, where available, is combined with general government consumption expenditures. The current surplus of government enterprises is profit–type income that accrues to general government. It is calculated as the current operating revenue and subsidies received from other levels of government, less current expenses. Interest received and paid are ignored in the calculation of the current surplus of government enterprises. 8. REAL OUTPUT AND RELATED MEASURES In addition to estimates of current-dollar transactions, BEA prepares chain-type quantity and price indexes for government consumption expenditures and gross investment and for the other components of GDP. Chained (2000) dollar estimates also provide measures to calculate the percent changes for GDP and its components that are consistent with those calculated from the chain-type quantity indexes. For most components of GDP, these estimates also provide rough approximations of their relative importance and of their contributions to real GDP growth for the years close to 2000. However, for components for which relative prices are changing rapidly, such
16 In order to be consistent with international guidelines set forth in the SNA, BEA is researching the prospects for classifying government enterprises with the corporate sector of the NIPAs so that institutional units with similar operating procedures can be grouped uniformly.

I—17
as computers and peripheral equipment, calculations of contributions using chained-dollar estimates may be misleading, even very close to the reference year. For most analyses, the current-dollar, or “nominal,” estimates provide more appropriate measures of the relative importance of GDP components, and the tables showing contributions to percent change present the appropriate measures of contributions to real growth. Quantity and price indexes. Changes in current-dollar GDP measure changes in the market value of the goods and services produced in the economy in a particular period, usually one year. These changes can be decomposed into quantity and price components. Quantities and prices are expressed as index numbers with the reference year–at present, the year 2000–equal to 100. The annual changes in quantities and prices in the NIPAs are calculated using a Fisher formula that incorporates weights from two adjacent years. For example, the 2000 to 2001 change in real GDP uses prices for 2000 and 2001 as weights, and the 2000 to 2001 change in GDP prices uses quantities for 2000 and 2001 as weights.17 Because the Fisher formula allows for the effects of changes in relative prices and in the composition of output over time, the resulting quantity or price changes are not affected by the substitution bias associated with the fixed-weighted formula used to calculate changes in quantities and prices.18 The Fisher formula also produces percent changes in quantities and prices that are not affected by the choice of reference year. In addition, because the changes in quantities and prices produced in this way are symmetric, the product of a quantity index and the corresponding price index, in general, equals the current-dollar index.19
17 Because the source data available for most components of GDP are measured in dollars rather than in physical units, the volumes of most of the detailed components used to calculate percent changes are obtained by deflation. For deflation, quantities are approximated by real values (expressed with 2000 as the reference year) that are calculated by dividing the current–dollar value of the component by its price index, where the price index uses 2000 as the reference year. Two other methods, volume extrapolation and direct base-year valuation, are also used to calculate the real values for certain detailed GDP components. For volume extrapolation, real measures are obtained by extrapolating estimates of the reference-year’s current-dollars backwards and forwards using volume indicators; for example, estimates of real Federal civilian compensation are extrapolated using employment (by grade and step) and average hours worked. For direct reference-year valuation, the real measures are obtained by multiplying reference-year prices by quantity data for each period; for example, real spending for B-2 bombers is calculated using quantities and specification prices of flyaway airframes, engines, electronic, and an all-other flyaway pricing specifications. The technique of specification pricing consists of determining the relevant physical characteristics of a good and these characteristics are held constant over time. For further information about specification pricing, see Part II of this publication. 18 For a discussion of the advantages of the Fisher index, see Jack E. Triplett, "Economic Theory and BEA's Alternative Quantity and Price Indexes," Survey 72 (April 1992): 49–52; and J. Steven Landefeld and Robert P. Parker, "BEA's Chain Indexes, Time Series, and Measures of Long–Term Economic Growth," Survey 77 (May 1997): 58–68; J. Steven Landefeld, Brent R. Moulton, and Cindy M. Vojtech, “Chained-Dollar Indexes: Issues, Tips on Their Use, and Upcoming Changes,” Survey 83 (November 2003): 8-16.
19 For the annual estimates of NIPA aggregates that include the components "change in private inventories" and "Commodity Credit Corporation inventory change," this relationship does not hold exactly, because of the price–data conventions used to calculate those components. In addition, for the quarterly estimates, all quarterly chain–type quantities and prices are adjusted to average to the corresponding annual estimates. For details on quarterly
I—18
Chained-dollar measures. To address the needs of its data users, BEA also prepares measures of real GDP and its components in a dollar-denominated form, designated "chained (2000) dollar” estimates. For GDP and for most other series, these estimates are computed by multiplying the 2000-current-dollar values by a corresponding quantity index, then dividing by 100. For example, if a current-dollar GDP component equaled $100 in 2000 and if real output, as measured by a quantity index for this component, increased 10 percent in 2001, then the chained (2000) dollar value of this component would be $110 (($100 × 110)/100) in 2001.20 For analyses of changes over time in an aggregate or in a component, the percentage changes calculated from the chained-dollar estimates and from the chain-type quantity indexes are the same; any differences will be small and due to rounding. Thus, chained–dollar estimates are most appropriately interpreted as index numbers with a reference value other than 100. However, because the relative prices used as weights for any period other than the reference year differ from those used for the reference year, the chained-dollar values for the detailed GDP components will not necessarily sum to the chained-dollar estimate of GDP or of any intermediate aggregate. A measure of the extent of such differences is provided in most chained-dollar tables by a "residual" line, which indicates the difference between GDP (or another major aggregate) and the sum of the most detailed components in the table. For periods close to the reference year, when there usually has not been much change in the relative prices that are used as the weights for the chain-type index, the residuals tend to be small, and the chained (2000) dollar estimates can be used to approximate the contributions to growth and to aggregate the detailed estimates. As one moves further from the reference year, the residual tends to become larger, and the chained-dollar estimates become less useful for economic analyses. In general, the use of chained-dollar estimates to calculate component shares or component contributions to real growth may be misleading for periods away from the reference year. In particular, for components for which relative prices are changing rapidly, such as computers and peripheral equipment, calculations of contributions using chained–dollar estimates may be misleading even very close to the reference year (and the residuals in the corresponding chained–dollar tables may be large). Consequently, BEA’s chained-dollar estimates are generally not available prior to 1990; quantity indexes and contributions to percent change estimates are better tools for analysis of these years. Detailed quantity indexes, which are accurate for all periods, are presented in NIPA tables 3.9.3, Real Government Consumption Expenditures and Gross Investment, 3.10.3, Real Government Consumption Expenditures and General Government Gross Output, and 3.11.3, Real National Defense Consumption Expenditures and Gross Investment by Type. The corresponding annual calculations, see the box "Basic Formulas for Calculating Chain–Type Quantity and Price Indexes" in the National Income and Product Accounts of the United States, 1929–97, Volume 1 (September 2001); M16.
20 For a detailed mathematical description of chain indexes, see A Guide to the NIPAs Methodology, National Income and Product Accounts, 1929-97, June 2001, page 16 box, “Basic Formulas for Calculating Chain-Type Quantity and Price Indexes.”

I—19
growth rates for these quarterly indexes are presented in NIPA tables 3.9.1, 3.10.1, and 3.11.1. Contributions to percent change in real government consumption expenditures and gross investment are presented in NIPA table 3.9.2. 9. GOVERNMENT EXPENDITURES BY FUNCTION In government budgets, expenditures are classified according to their purpose—that is, their function—so that comparisons of major activities over time can be made even as underlying programs and agencies change. These functional presentations reveal trends, enable comparisons with the expenditures of other governments, and summarize significant expenditures of government in terms of continuing, common purposes. Although the basic NIPA presentations of government expenditures focus on the type of spending, such as consumption expenditures and subsidies, BEA also presents annual estimates of government expenditures classified by both type and function; this makes possible additional types of analyses of BEA’s estimates. The functional estimates are discussed in Part IV of this document. 10. OTHER ASPECTS OF GOVERNMENT Government social insurance funds.21 Funds administered by Federal and by state and local governments to provide old–age, survivors, and disability insurance (social security); hospital insurance; supplementary medical insurance; unemployment insurance; railroad retirement; pension benefit guaranty; veterans life insurance; workers compensation; military medical insurance; and temporary disability insurance. The main sources of these funds are compulsory payments—called contributions in the NIPAs—by other sectors and other governmental units. The benefits paid from these funds are generally related to the income of the individuals from employment and/or to the contributions made on their account, whether made by themselves or their employers. Because most social insurance funds are trust funds with resources that cannot be used for purposes other than those specified by statute or trust agreement, contributions to these funds are not classified as taxes in the NIPAs. Because individuals have no choice in the disposition of this part of their labor income, contributions for government social insurance, which includes both employer contributions and employee and self-employed contributions, is deducted in the calculation of personal income. (Employer contributions is included as a component of compensation received.) In addition, the excess of contributions to these funds and their investment earnings over the benefits and administrative expenses paid by them is part of the saving of general government, although the saving of social insurance funds is distinguished and recorded separately. (This treatment contrasts with that of retirement plans established by employers; the saving of these plans is part of personal saving.)
21 The SNA refers to these funds as “social security”, but the NIPAs use the term “government social insurance funds” because the term “social security” is commonly used in the United States to refer to the Federal government’s old-age, survivors, and disability insurance program.

I—20
Government employee retirement plans.22 The NIPAs treat the saving of government employee retirement plans as saving of the personal sector. Households are likely to base certain economic decisions, especially for the long term, on expected returns from these assets, so this treatment is more useful for certain types of analysis, and more consistent with factors influencing long–term personal economic decision–making. For government employee retirement plans, this treatment differs from that found in government financial statements; namely, Federal employee retirement plans are included in U.S. Budget aggregates that are prepared by the Office of Management and Budget (OMB), and state and local retirement plans are included in Government Finances aggregates that are prepared by the Census Bureau. Publicly administered government employee retirement plans are classified as employee pension and insurance funds, not as government social insurance programs. Transactions of government employee retirement plans are treated in the following manner: (1) Employer contributions are a component of “Employer contributions for employee pension and insurance funds”; (2) personal contributions are treated as transactions within the personal sector; (3) interest received by the retirement plans is included in personal interest income; (4) dividends received by the retirement plans are included in personal dividend income; (5) benefits paid by the plans are treated as transactions within the personal sector; (6) benefits paid to those beneficiaries living outside the United States are transfer payments to the rest of the world from persons; and (7) administrative expenses associated with the plans are treated as personal consumption expenditures. 11. RELATION OF NIPA GOVERNMENT CURRENT RECEIPTS AND EXPENDITURES TO FINANCIAL STATEMENTS The government receipts and expenditures account is derived primarily from financial statements for the Federal and the state and local governments; these statements record payments to and from government in a given time period. The focus of these statements is the summarization of individual government financial transactions -- taxing, spending, borrowing, and lending. These financial statements differ from those required for the NIPAs in several respects such as the coverage of transactors and transactions, the extent to which transactions are shown net or gross, the fiscal years used, and the timing with which transactions are recorded. Consequently, adjustments are necessary to conform these financial statements to the NIPA concepts. Also, for some state and local government transactions, data from other sources are substituted for those from the financial statements because they are consistent with estimates of similar transactions elsewhere in the NIPAs, they provide more detail on types of transactions, or they provide monthly or quarterly observations that permit a more precise assignment of transactions to a given time period. The Federal employee retirement program is an example of a difference in coverage in transactors; it is included in Federal budget data, but not in the NIPA government sector current receipts and expenditures. Estate taxes are an example of a difference in the coverage of transactions; they are
22 For further discussion of government employee retirement plans, see Brent R. Moulton, Robert P. Parker, and Eugene P. Seskin, “A Preview of the 1999 Comprehensive Revision of the National Income and Product Accounts: Definitional and Classificational Changes,” Survey of Current Business 79 (August 1999); 11.
I—21
included in government sector source data, but not in the NIPA government sector current account (they are classified as a capital transaction). Deposit insurance premiums are an example of a difference in netting and grossing; they are classified as negative expenditures in Federal budget data, but as positive receipts in the NIPAs. Taxes on corporate income are an example of timing differences; Federal budget data include them on a cash basis, but the NIPAs record them on an accrual basis. Parts II and III of this document discuss these differences in greater detail. NIPA Tables 3.18A and 3.18B show the relation of the Federal government NIPA estimates to Federal financial statements. NIPA table 3.19 shows the relation of State and local NIPA estimates to Census Bureau Government Finances data. 12. PRESENTATION OF THE ESTIMATES The estimates of government transactions are published in the NIPA tables, which appear in the Survey and on BEA’s web site. BEA’s gross domestic product web page is at (<www.bea.gov/ bea/dn/home/gdp.htm>). Tables whose numbers begin with “3.” are specifically government sector tables; government sector series also appear in many other NIPA tables. The keyword index http://www.bea.gov/bea/dn/nipaweb/NIPATableIndex.asp provides the location, by NIPA table number, of the various annual and quarterly estimates of government transactions, and, where applicable, of estimates in current dollars, chain–type quantity and price indexes, and chained dollars.23 Annual estimates generally cover 1929 to the present; quarterly estimates in current dollars generally cover the first quarter of 1947 to the present; and quarterly quantity and price indexes generally cover the first quarter of 1947 to the present. Quarterly and annual estimates of chained dollars generally cover 1990 to the present. To assist users in identifying the type of estimate in a table, a numbering system for NIPA tables was developed for groups of tables that display different types of estimates using similar formats. The table-numbering system highlights the type of estimate (such as current dollars, quantity indexes, and percent changes) in the table. The system is outlined below. Table numbers are in the format “X.Y.Z,” where “X” indicates the NIPA table section, “Y” indicates the table number in the section, and “Z” indicates the type of estimate presented. “X” is three for government section tables. Where only current-dollar estimates are presented, a table uses only the first two terms of the numbering system. For example, the NIPA table “Government Current Receipts and Expenditures,” which presents only current-dollar estimates, is numbered simply Table 3.1. Where quantity and price information is published, table families use a three-term numbering system. Table family 3.9, for example, presents information concerning government consumption expenditures and gross investment.
Table 3.9.1 presents percent change from preceding period in real estimates Table 3.9.2 presents contributions to percent change in real estimates
23 The index may be found in the gross domestic product web page by selecting “Interactive NIPA Tables,” and then selecting “Keyword Index.”
I—22
Table 3.9.3 presents real estimates, quantity indexes Table 3.9.4 presents price indexes Table 3.9.5 presents current dollars Table 3.9.6 presents real estimates, chained dollars
Additional NIPA underlying detail and key source data tables are also available on BEA’s Web site under the heading “Supplemental estimates.” These tables include detailed estimates that support the regularly published NIPA series; they are not included in the published tables because their quality is less than that of the higher level aggregates in which they are included. Compared to these aggregates, the more detailed estimates are more likely to be either based on judgmental trends, on trends in the higher-level aggregate, or on less reliable source data. In addition to these tables, additional detail on government transactions within the NIPA framework is presented in articles in the Survey. "Federal Budget Estimates" generally appears in the February or March Survey; it presents estimates in a NIPA framework which are consistent with the Budget of the United States Government. Release schedule. For GDP and most other NIPA series, quarterly estimates are released on the following schedule: "Advance" estimates are released near the end of the first month after the end of the quarter; as more detailed and more comprehensive data become available, "preliminary" and "final" estimates are released near the end of the second and third months of the quarter, respectively. Taxes on corporate income, total receipts, and net government saving are not prepared for advance estimates because of lags in the availability of source data. Except for the fourth-quarter estimates, the initial estimates for these series are released with the preliminary GDP estimates, and the final estimates are released with the final GDP estimates. For the fourth quarter, these estimates are released only with the final GDP estimates. Annual revisions of the NIPAs are usually carried out each summer and cover the months and quarters of the most recent calendar year and of the two preceding years. These revisions are timed to incorporate newly available major annual source data. Most government tables are made available on BEA’s website soon after the July release. The government expenditures by function tables (NIPA tables 3.15, 3.16, and 3.17), the reconciliation tables (NIPA tables 3.18A, 3.18B, and 3.19), and the not-seasonally-adjusted tables (NIPA tables 8.3 And 8.4) are usually published in October. Comprehensive revisions have been conducted approximately every five years and incorporate three major types of improvements: (1) Changes in definitions and classifications that update the accounts to portray more accurately the evolving U.S. economy; (2) statistical changes that update the accounts to reflect the introduction of new and improved methodologies and the incorporation of newly available and revised source data; and (3) presentational changes that update the NIPA tables to reflect the definitional and statistical changes and make the tables more informative.
I—23
13. STATISTICAL CONVENTIONS Seasonal adjustment. Quarterly and monthly NIPA estimates are seasonally adjusted at the detailed series level when the series demonstrate statistically significant seasonal patterns. For most of the series that are seasonally adjusted by the source agency, BEA adopts the corresponding seasonal adjustment factors. Seasonal adjustment removes from the time series the average effect of variations that normally occur about the same time and in about the same magnitude each year—for example, weather and holidays. After seasonal adjustment, cyclical and other short-term changes in the economy stand out more clearly. Interpolation. Interpolation refers to techniques of developing high frequency estimates (for example, quarterly or monthly estimates) from lower frequency estimates (for example, annual or quarterly estimates). In many cases, more complete or more detailed source data are available on a less frequent basis than is needed to compile a complete, timely, and consistent set of NIPA estimates. In such cases, BEA develops higher frequency estimates using interpolation techniques that provide higher frequency estimates of the lower frequency source data. Interpolation techniques can be performed with or without an indicator, as discussed below. Extrapolation. Extrapolation refers to techniques of developing estimates for which the final source data (regardless of frequency) are not yet available. Many source data series that BEA uses in developing the NIPAs are not available when the NIPA estimates are made, so BEA develops estimates using extrapolation techniques. Extrapolation techniques (like interpolation techniques) can be performed with or without an indicator, as discussed below. Interpolation (and extrapolation) techniques with an indicator series are used when a there is a higher frequency series that provides a good indication of the changes in the lower frequency source data. The purpose of interpolation (and extrapolation) with an indicator is to combine the relative strengths of the low- and high-frequency data. Typically, the low-frequency (for example, annual) data provide the most reliable information on the overall level and long-term movements in the series, while the higher-frequency (for example, quarterly) data provide the only available explicit information about the short-term movements in the series. For example, data on wage-based social security and medicare contributions are available annually; these data provide information on the level and on annual movements. Because the contributions are based on wages and salaries, the movements in monthly estimates of wages and salaries are the best source of information about the pattern of monthly contributions. Using interpolation techniques, a series of monthly estimates of unemployment contributions is developed that uses the monthly changes in the indicator series (wages and salaries) and that is consistent with the annual source data on contributions. Using extrapolation techniques and information about the impact of tax rate changes, monthly estimates of contributions are developed that use the monthly changes in the indicator series (wages and salaries) to estimate periods later than the most recent annual source data. Interpolation (and extrapolation) techniques without an indicator series are used when higher frequency estimates are needed for the completeness of the NIPA estimates, but BEA does not have reliable indicators for higher frequency estimates. In these cases, BEA develops higher

I—24
frequency estimates (for example, quarterly or monthly estimates) that are consistent with the lower frequency source data (for example annual or quarterly data). For example, federal current transfer receipts from persons are interpolated without indicator, because the source data are annual, but BEA does not have indicators of quarterly or monthly changes in this series. Using interpolation techniques, a series of quarterly estimates of current transfer receipts from persons is created, even though source data are available only annually. Using extrapolation techniques, quarterly estimates of current transfer receipts from persons are developed to estimate periods later than the most recent annual source data. Extrapolation without an indicator series may be performed using a variety of techniques: A statistical model, a trend or moving average method, or judgment. The use of interpolation and extrapolation techniques allows BEA to complete the NIPA estimates on a higher frequency basis than the low-frequency source data allow. (For example, without the monthly and quarterly estimates of unemployment insurance contributions and the quarterly estimates of current transfer receipts from persons, BEA would not have a complete set of quarterly government current receipts and expenditures.) BEA recognizes that interpolation (and extrapolation) without an indicator series results in synthetic estimates and is always on the lookout for source data that can be used to improve estimate quality. Legislative changes. In some circumstances, changes in economic conditions are caused by changes in legislation, policy, or other events which may not be reflected in source data until after the event. In certain circumstances, BEA prepares estimates that reflect the changes when the legislative change is known, but before the source data are available. For example, a legislature may change a tax rate effective at a certain time, but the data on tax collections for that period may not become available until much later. In such cases, BEA uses information about the expected change in tax revenue from the government that collects the tax, or in some cases, from publicly available sources (for example, media reports) to estimate the tax in question and reflect the change in the tax rate when it actually occurs. Certain estimates for government program administrative changes that occur regularly are treated in the NIPAs as legislative changes. For example, pay raises for Federal employees and cost of living adjustments to social security payments are treated as legislative changes when they take effect. In the case of Federal wages and salaries, this treatment has the effect of treating the pay raises as increases in prices paid by the Federal Government for services of employees.

I—25
TABLES
Table A. Summary National Income and Product Accounts Calendar Year 2000 (Billions of Dollars)
Account 1. Domestic Income and Product Account
1 Compensation of employees, paid 5,787.3 15 Personal consumption expenditures (3-3) 6,739.42 Wage and salary accruals 4,833.8 16 Durable goods 863.33 Disbursements (3-12 and 5-11) 4,833.8 17 Nondurable goods 1,947.2
4 Wage accruals less disbursements (4-9 and 6-11) 0.0 18 Services 3,928.8
5 Supplements to wages and salaries (3-14) 953.4 19 Gross private domestic investment 1,735.5
6 Taxes on production and imports (4-16) 708.9 20 Fixed investment (6-2) 1,679.07 Less: Subsidies (4-8) 44.3 21 Nonresidential 1,232.18 Net operating surplus 2,304.5 22 Structures 313.29 Private enterprises (2-19) 2,299.1 23 Equipment and software 918.9
10 Current surplus of government enterprises (4-26) 5.3 24 Residential 446.9
11 Consumption of fixed capital (6-13) 1,187.8 25 Change in private inventories (6-4) 56.5 26 Net exports of goods and services -379.5
12 Gross domestic income 9,944.1 27 Exports (5-1) 1,096.3 28 Imports (5-9) 1,475.8
13 Statistical discrepancy (6-19) -127.2 29Government consumption expenditures and gross investment (4-1 plus 6-3) 1,721.6
30 Federal 578.8 31 National defense 370.3 32 Nondefense 208.5 33 State and local 1,142.8
14 GROSS DOMESTIC PRODUCT 9,817.0 34 GROSS DOMESTIC PRODUCT 9,817.0
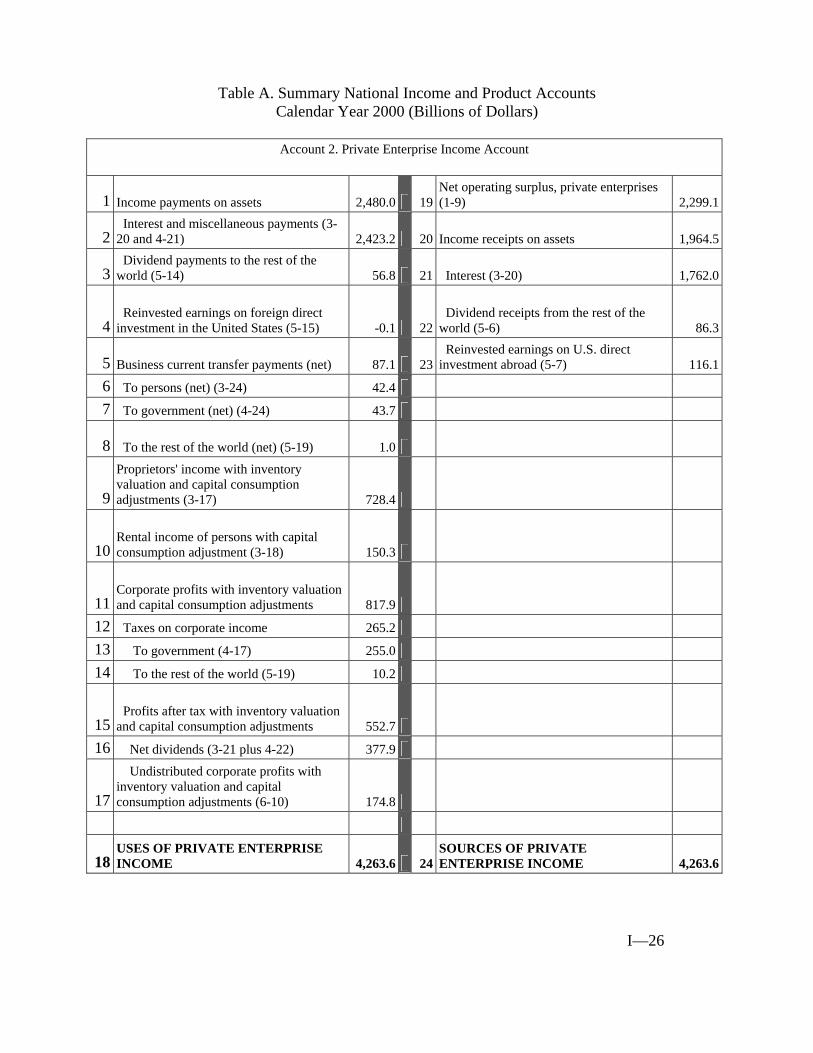
I—26
Table A. Summary National Income and Product Accounts Calendar Year 2000 (Billions of Dollars)
Account 2. Private Enterprise Income Account
1 Income payments on assets 2,480.0 19Net operating surplus, private enterprises (1-9) 2,299.1
2 Interest and miscellaneous payments (3-20 and 4-21) 2,423.2 20 Income receipts on assets 1,964.5
3 Dividend payments to the rest of the world (5-14) 56.8 21 Interest (3-20) 1,762.0
4 Reinvested earnings on foreign direct investment in the United States (5-15) -0.1 22
Dividend receipts from the rest of the world (5-6) 86.3
5 Business current transfer payments (net) 87.1 23 Reinvested earnings on U.S. direct investment abroad (5-7) 116.1
6 To persons (net) (3-24) 42.4
7 To government (net) (4-24) 43.7
8 To the rest of the world (net) (5-19) 1.0
9
Proprietors' income with inventory valuation and capital consumption adjustments (3-17) 728.4
10 Rental income of persons with capital consumption adjustment (3-18) 150.3
11 Corporate profits with inventory valuation and capital consumption adjustments 817.9
12 Taxes on corporate income 265.2
13 To government (4-17) 255.0
14 To the rest of the world (5-19) 10.2
15 Profits after tax with inventory valuation and capital consumption adjustments 552.7
16 Net dividends (3-21 plus 4-22) 377.9
17
Undistributed corporate profits with inventory valuation and capital consumption adjustments (6-10) 174.8
18 USES OF PRIVATE ENTERPRISE INCOME 4,263.6 24
SOURCES OF PRIVATE ENTERPRISE INCOME 4,263.6
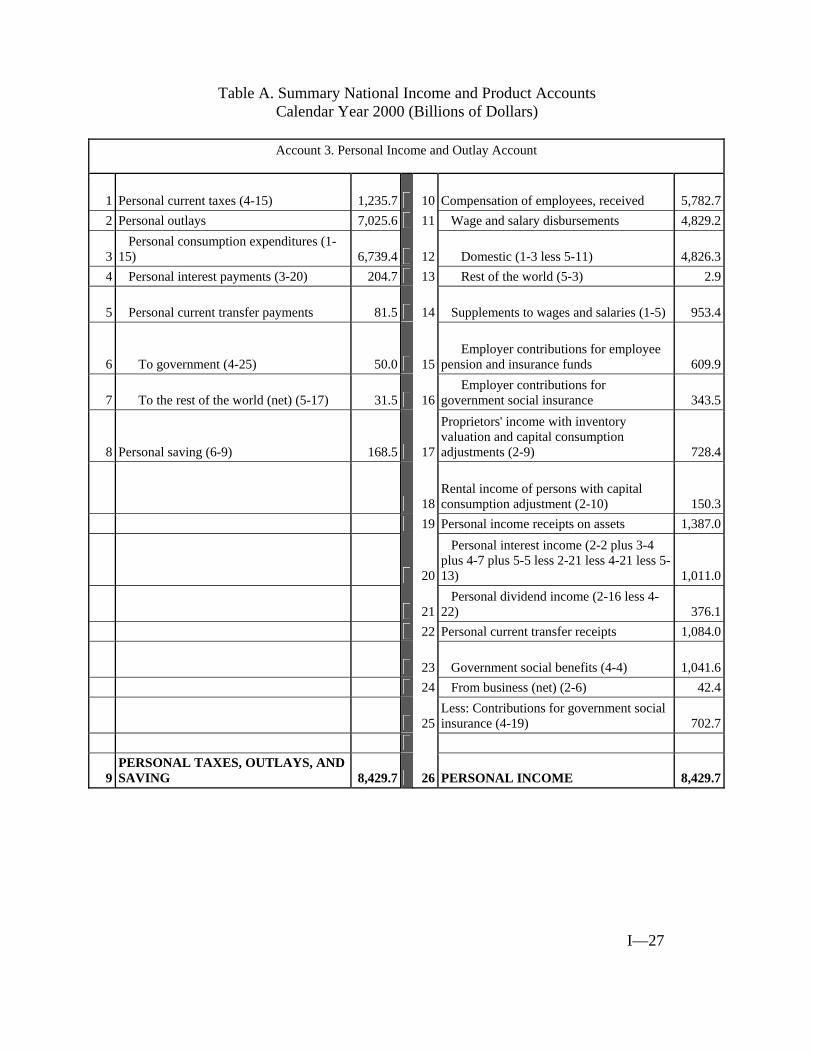
I—27
Table A. Summary National Income and Product Accounts Calendar Year 2000 (Billions of Dollars)
Account 3. Personal Income and Outlay Account
1 Personal current taxes (4-15) 1,235.7 10 Compensation of employees, received 5,782.72 Personal outlays 7,025.6 11 Wage and salary disbursements 4,829.2
3 Personal consumption expenditures (1-15) 6,739.4 12 Domestic (1-3 less 5-11) 4,826.3
4 Personal interest payments (3-20) 204.7 13 Rest of the world (5-3) 2.9
5 Personal current transfer payments 81.5 14 Supplements to wages and salaries (1-5) 953.4
6 To government (4-25) 50.0 15 Employer contributions for employee pension and insurance funds 609.9
7 To the rest of the world (net) (5-17) 31.5 16 Employer contributions for government social insurance 343.5
8 Personal saving (6-9) 168.5 17
Proprietors' income with inventory valuation and capital consumption adjustments (2-9) 728.4
18Rental income of persons with capital consumption adjustment (2-10) 150.3
19 Personal income receipts on assets 1,387.0
20
Personal interest income (2-2 plus 3-4 plus 4-7 plus 5-5 less 2-21 less 4-21 less 5-13) 1,011.0
21 Personal dividend income (2-16 less 4-22) 376.1
22 Personal current transfer receipts 1,084.0
23 Government social benefits (4-4) 1,041.6 24 From business (net) (2-6) 42.4
25Less: Contributions for government social insurance (4-19) 702.7
9 PERSONAL TAXES, OUTLAYS, AND SAVING 8,429.7 26 PERSONAL INCOME 8,429.7

I—28
Table A. Summary National Income and Product Accounts Calendar Year 2000 (Billions of Dollars)
Account 4. Government Receipts and Expenditures Account
1 Consumption expenditures (1-29) 1,417.1 14 Current tax receipts 2,206.82 Current transfer payments 1,062.4 15 Personal current taxes (3-1) 1,235.7
3 Government social benefits 1,044.1 16 Taxes on production and imports (1-6) 708.9
4 To persons (3-23) 1,041.6 17 Taxes on corporate income (2-13) 255.0
5 To the rest of the world (5-18) 2.5 18 Taxes from the rest of the world (5-18) 7.3
6 Other current transfer payments to the rest of the world (net) (5-18) 18.3 19
Contributions for government social insurance (3-25) 702.7
7 Interest payments (3-20) 362.8 20 Income receipts on assets 117.4
8 Subsidies (1-7) 44.3 21 Interest and miscellaneous receipts (2-2 and 3-20) 115.6
9 Less: Wage accruals less disbursements (1-4) 0.0 22 Dividends (3-21) 1.9
10 Net government saving (6-12) 239.4 23 Current transfer receipts 93.711 Federal 189.5 24 From business (net) (2-7) 43.712 State and local 50.0 25 From persons (3-6) 50.0
26Current surplus of government enterprises (1-10) 5.3
13 GOVERNMENT CURRENT EXPENDITURES AND NET SAVING 3,125.9 27
GOVERNMENT CURRENT RECEIPTS 3,125.9
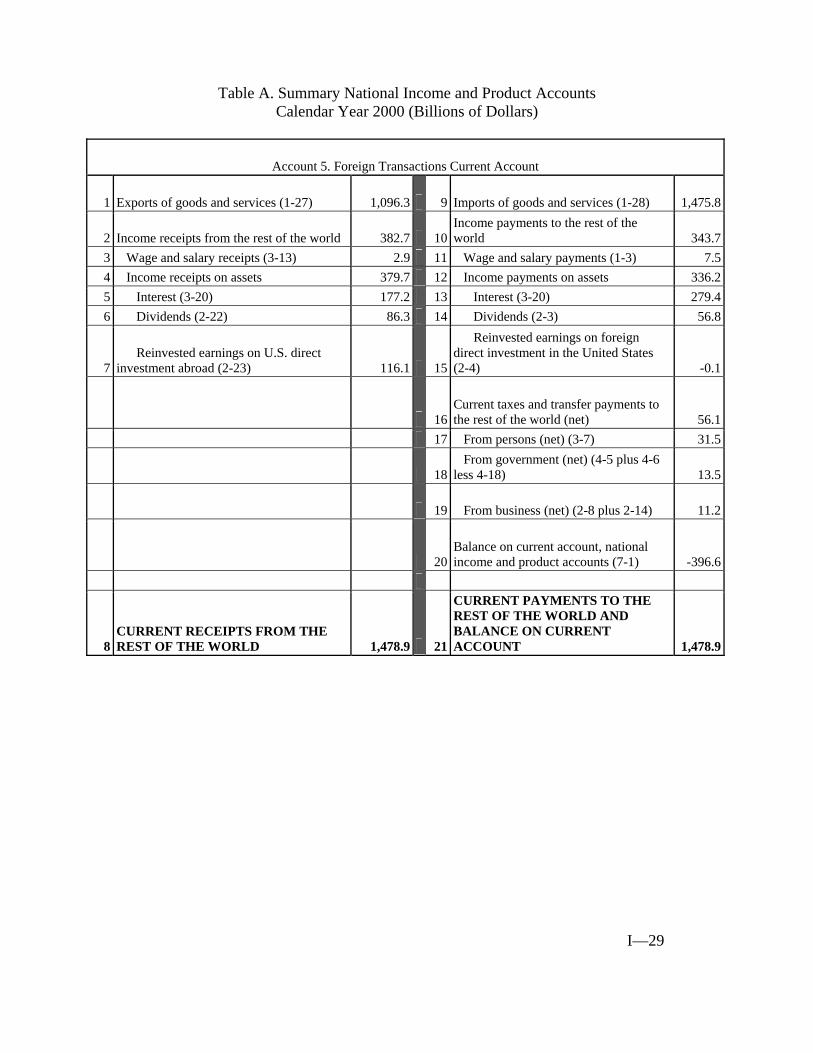
I—29
Table A. Summary National Income and Product Accounts Calendar Year 2000 (Billions of Dollars)
Account 5. Foreign Transactions Current Account
1 Exports of goods and services (1-27) 1,096.3 9 Imports of goods and services (1-28) 1,475.8
2 Income receipts from the rest of the world 382.7 10Income payments to the rest of the world 343.7
3 Wage and salary receipts (3-13) 2.9 11 Wage and salary payments (1-3) 7.54 Income receipts on assets 379.7 12 Income payments on assets 336.25 Interest (3-20) 177.2 13 Interest (3-20) 279.46 Dividends (2-22) 86.3 14 Dividends (2-3) 56.8
7 Reinvested earnings on U.S. direct investment abroad (2-23) 116.1 15
Reinvested earnings on foreign direct investment in the United States (2-4) -0.1
16Current taxes and transfer payments to the rest of the world (net) 56.1
17 From persons (net) (3-7) 31.5
18 From government (net) (4-5 plus 4-6 less 4-18) 13.5
19 From business (net) (2-8 plus 2-14) 11.2
20Balance on current account, national income and product accounts (7-1) -396.6
8 CURRENT RECEIPTS FROM THE REST OF THE WORLD 1,478.9 21
CURRENT PAYMENTS TO THE REST OF THE WORLD AND BALANCE ON CURRENT ACCOUNT 1,478.9

I—30
Table A. Summary National Income and Product Accounts Calendar Year 2000 (Billions of Dollars)
Account 6. Domestic Capital Account
1 Gross domestic investment 8 Net saving 2 Private fixed investment (1-20) 1,679.0 9 Personal saving (3-8) 168.5
3 Government fixed investment (1-29) 304.5 10
Undistributed corporate profits with inventory valuation and capital consumption adjustments (2-17) 174.8
4 Change in private inventories (1-25) 56.5 11 Wage accruals less disbursements (private) (1-4) 0.0
5 Capital account transactions (net) (7-2) 0.8 12 Net government saving (4-10) 239.4
6 Net lending or net borrowing (-), national income and product accounts (7-3) -397.4 13 Plus: Consumption of fixed capital (1-11) 1,187.8
14 Private 990.8 15 Government 197.0 16 General government 166.4 17 Government enterprises 30.6 18 Equals: Gross saving 1,770.5 19 Statistical discrepancy (1-13) -127.2
7
GROSS INVESTMENT, CAPITAL ACCOUNT TRANSACTIONS, AND NET LENDING 1,643.3 20
GROSS SAVING AND STATISTICAL DISCREPANCY 1,643.3

I—31
Table A. Summary National Income and Product Accounts Calendar Year 2000 (Billions of Dollars)
Account 7. Foreign Transactions Capital Account
2Capital account transactions (net) (6-5) 0.8
3
Net lending or net borrowing (-), national income and product accounts (6-6) -397.4
1
BALANCE ON CURRENT ACCOUNT, NATIONAL INCOME AND PRODUCT ACCOUNTS (5-20) -396.6 4
CAPITAL ACCOUNT TRANSACTIONS (NET) AND NET LENDING, NATIONAL INCOME AND PRODUCT ACCOUNTS -396.6
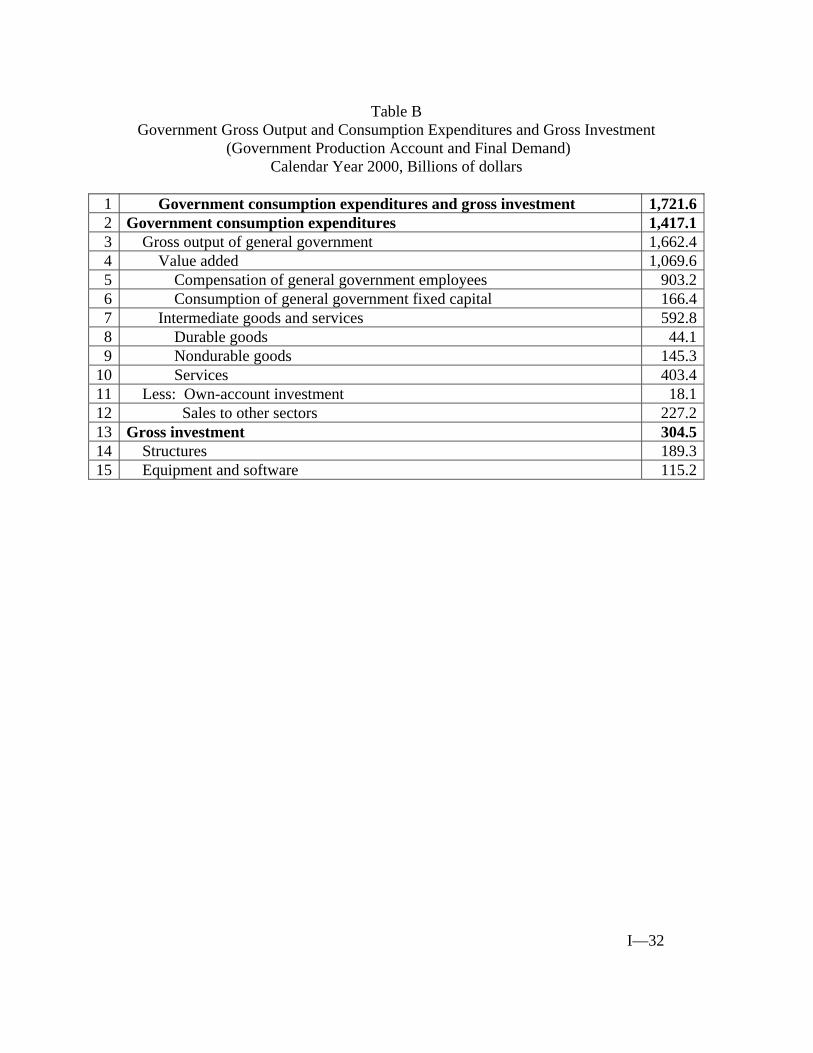
I—32
Table B
Government Gross Output and Consumption Expenditures and Gross Investment (Government Production Account and Final Demand)
Calendar Year 2000, Billions of dollars 1 Government consumption expenditures and gross investment 1,721.62 Government consumption expenditures 1,417.13 Gross output of general government 1,662.44 Value added 1,069.65 Compensation of general government employees 903.26 Consumption of general government fixed capital 166.47 Intermediate goods and services 592.88 Durable goods 44.19 Nondurable goods 145.3
10 Services 403.411 Less: Own-account investment 18.112 Sales to other sectors 227.213 Gross investment 304.514 Structures 189.315 Equipment and software 115.2
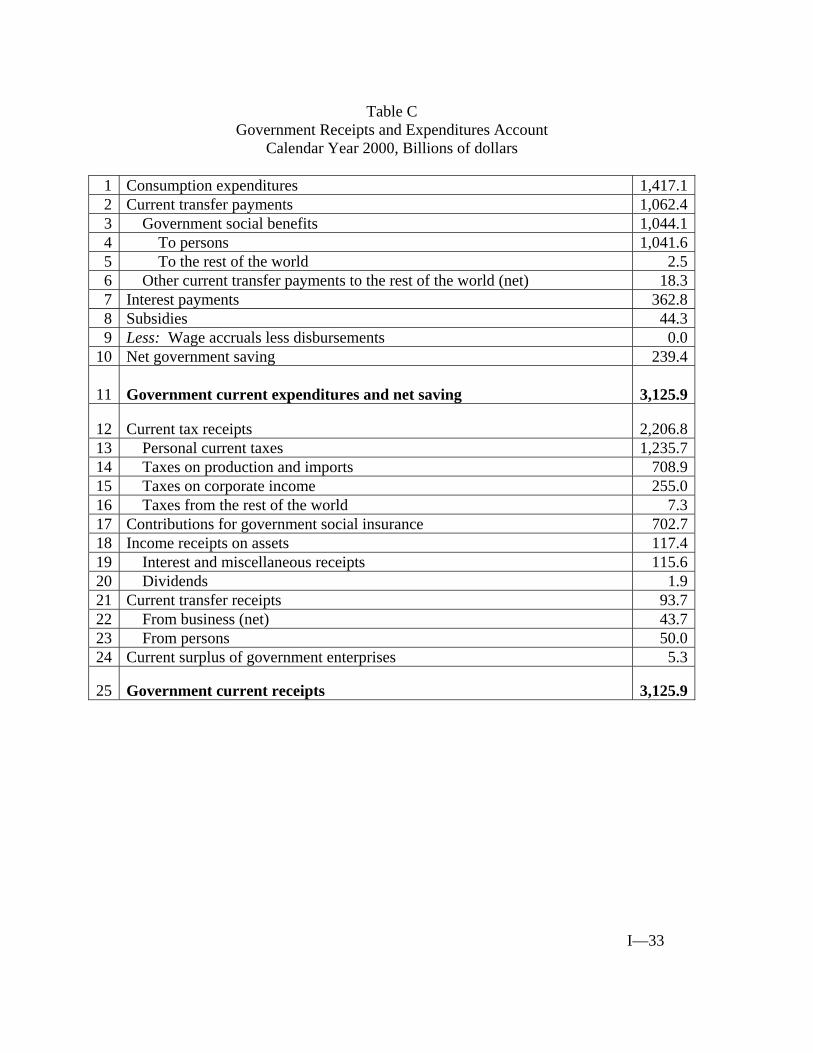
I—33
Table C
Government Receipts and Expenditures Account Calendar Year 2000, Billions of dollars
1 Consumption expenditures 1,417.12 Current transfer payments 1,062.43 Government social benefits 1,044.14 To persons 1,041.65 To the rest of the world 2.56 Other current transfer payments to the rest of the world (net) 18.37 Interest payments 362.88 Subsidies 44.39 Less: Wage accruals less disbursements 0.0
10 Net government saving 239.4
11 Government current expenditures and net saving 3,125.9
12 Current tax receipts 2,206.813 Personal current taxes 1,235.714 Taxes on production and imports 708.915 Taxes on corporate income 255.016 Taxes from the rest of the world 7.317 Contributions for government social insurance 702.718 Income receipts on assets 117.419 Interest and miscellaneous receipts 115.620 Dividends 1.921 Current transfer receipts 93.722 From business (net) 43.723 From persons 50.024 Current surplus of government enterprises 5.3
25 Government current receipts 3,125.9
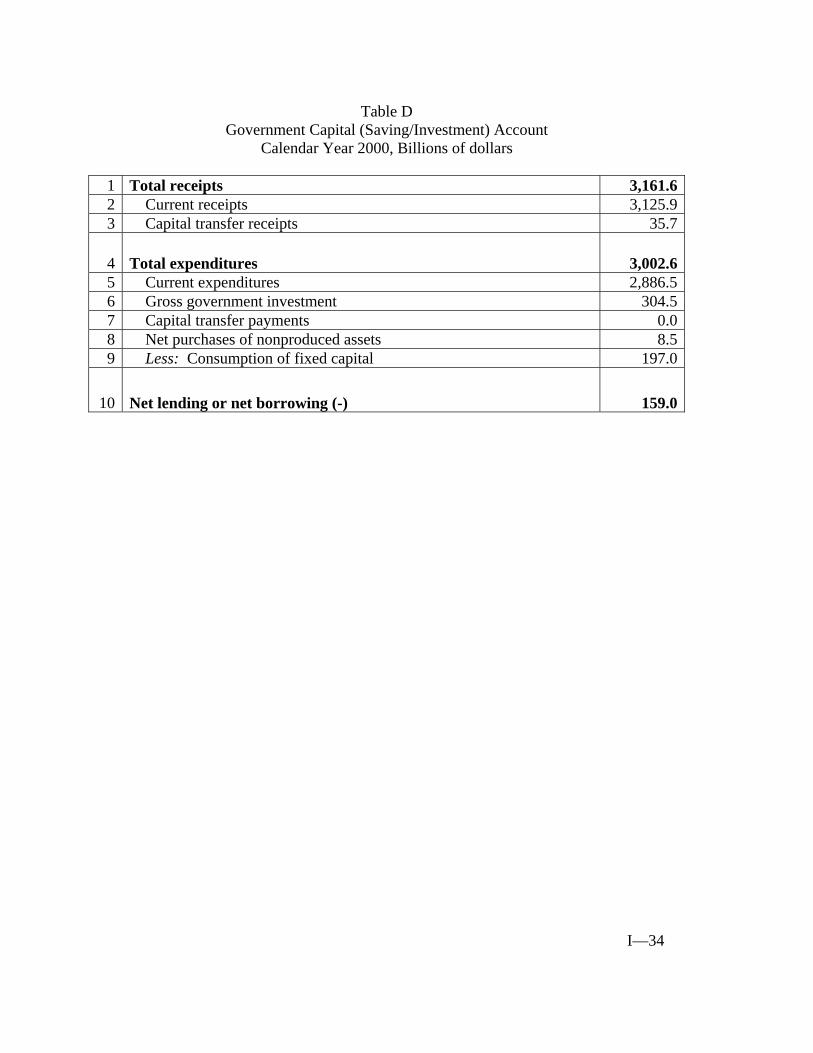
I—34
Table D
Government Capital (Saving/Investment) Account Calendar Year 2000, Billions of dollars
1 Total receipts 3,161.62 Current receipts 3,125.93 Capital transfer receipts 35.7
4 Total expenditures 3,002.65 Current expenditures 2,886.56 Gross government investment 304.57 Capital transfer payments 0.08 Net purchases of nonproduced assets 8.59 Less: Consumption of fixed capital 197.0
10 Net lending or net borrowing (-) 159.0

I—35
APPENDIX
Articles Related to Government Transactions The following Survey of Current Business articles and methodology papers contain important information related to government transactions. (Articles are also available on BEA’s web site http://www.bea.gov)
• Michelle Robinson and Benjamin Mandel. “Federal Budget Estimates for Fiscal Year 2006,” (March 2005).
• Karl Galbraith. “Government Spending by Function: A New Presentation,” (June 2000). • Bruce E. Baker, Pamela A. Kelly, and Brooks B. Robinson. “Estimates of Real
Government Consumption Expenditures and Gross Investment by Function for 1959-2003,” (October 2004).
• Bruce E. Baker. “Receipts and Expenditures of State Governments and of Local
Governments, 1959-2001,” (June 2003). Current Quarterly Estimates
• The "Business Situation" which appears monthly, especially the "Government Sector" section which appears once each quarter.
Comprehensive and Annual Revisions As part of each comprehensive and annual revision of the NIPAs, BEA publishes a summary description of the principal source data and methods used to prepare the current–dollar and real estimates of gross domestic product. The most recent "Updated Summary NIPA Methodologies" was published in the November 2004 issue of the Survey of Current Business. Information on the most recent annual revisions is published in the following Survey articles.
• Eugene P. Seskin, Shelly Smith, and Teresa L. Weadock. “Annual Revision of the
National Income and Product Accounts: Annual Estimates, 2002-2004, and Quarterly Estimates, 2002: I-2005:I,” (August 2005).
• Eugene P. Seskin and Shelly Smith. “Annual Revision of the National Income and
Product Accounts: Annual Estimates, 2001-2003, and Quarterly Estimates, 2001:I-2004:I,” (August 2004).
• “National Income and Product Accounts Tables” and “GDP and Other Major NIPA
Series, 1929-2004:II,” tables from the 2004 Annual Revision. (August 2004)
I—36
• ”Annual NIPA Revision: Newly Available Table” (September-November 2004) Information on the most recent comprehensive revision is published in the following Survey articles.
• Brent R. Moulton and Eugene P. Seskin. “Preview of the 2003 Comprehensive Revision of the National Income and Product Accounts: Changes in Definitions and Classifications,” (June 2003).
• Nicole Mayerhauser, Shelly Smith, and David F. Sullivan. “Preview of the 2003
Comprehensive Revision of the National Income and Product Accounts: New and Redesigned Tables” (August 2003).
• Carol E. Moylan and Brooks B. Robinson. “Preview of the 2003 Comprehensive
Revision of the National Income and Product Accounts: Statistical Changes,” (September 2003).
• “Preview of Selected Tables From the 2003 Comprehensive Revision of the National
Income and Product Accounts” (January 2004). • Eugene P. Seskin and Daniel Larkins. “Improved Estimates of the National Income and
Product Accounts for 1929-2002: Results of the Comprehensive Revision,” (February 2004).
• “Comprehensive NIPA Revision: Newly Available Tables” (March-July 2004).
Input-Output Accounts
• George M. Smith, Matthew J. Gruenberg, Tameka R. L. Harris, and Erich H. Strassner. “Annual Industry Accounts, Revised Estimates for 2001-2003,” (January 2005).
• Brian C. Moyer, Mark A. Planting, Mahnaz Fahim-Nader, and Sherlene K. S. Lum. “Preview of the Comprehensive Revision of the Annual Industry Accounts: Integrating the Annual Input-Output Accounts and the Gross-Domestic-Product-by-Industry Accounts,” (March 2004).
• Brian C. Moyer, Mark A. Planting, Paul V. Kern, and Abigail M. Kish. “Improved Annual Industry Accounts: Integrated Annual Input-Output Accounts and Gross-Domestic-Product-by-Industry Accounts,” (June 2004).
Fixed assets
• Paul Lally. “Fixed Assets and Consumer Durable Goods for 1993-2003,” (September 2004).

I—37
• Paul Lally. “Fixed Assets and Consumer Durable Goods: Preliminary Estimates for 2002 and Revised Estimates for 1925-2001,” (May 2004) .
• Barbara M. Fraumeni. "The Measurement of Depreciation in the U.S. National Income and Product Accounts," (July 1997 Survey).
Web sites
• The BEA web site at http:\\www.bea.gov) presents NIPA estimates, complete articles and tables from the Survey of Current Business beginning in 1998, selected articles from earlier years, and the monthly news releases for gross domestic product (GDP) and for personal income and outlays.
• The BEA government sector Internet release is located at
http://www.bea.gov/bea/dn/nipaweb/GovView.asp and provides current and historical data on “Government Current Receipts and Expenditures.”
• The Web site of the Department of Commerce’s STAT–USA provides the monthly news
releases on GDP and on personal income and the underlying detail NIPA tables; to subscribe, go to the Web site at www.stat–usa.gov. This information is also available on STAT–USA’s Economic Bulletin Board; to subscribe, call 202–482–1986.
• The Whitehouse Economic Statistics Briefing Room at the White House Web site at
www.whitehouse.gov/fsbr/esbr.html provides summary estimates of GDP and of a few other major NIPA aggregates.
• The Web site, www.fedstats.gov, is a gateway to all Federal statistics.
I—38
Other media The NIPA estimates for recent quarters are published monthly in the Survey; to subscribe, call the Superintendent of Documents of the U.S. Government Printing Office at 202–512–1800. Summary information on the estimates of GDP and of personal income is available in a recorded telephone message at the time of release. For the GDP estimates, call 202–606–5306; for the estimates of personal income and outlays, call 202–606–5301.

II—1 .
PART II.
FEDERAL GOVERNMENT TRANSACTIONS

II—2 .
Acronyms and common references AHE Average Hourly Earnings ASCS Agricultural Stabilization and Conservation Service BEA Bureau of Economic Analysis BLS Bureau of Labor Statistics BPD Bureau of Public Debt CCC Commodity Credit Corporation CFC Consumption Of Fixed Capital CMS Centers for Medicare and Medicaid Services COLA cost-of-living adjustments CPI consumer price index DOD Department of Defense DOE Department of Energye DOL Department of Labor DOT Department of Transportation ECI Employment Cost Index ESA Employment Standards Administration FEMA Federal Emergency Management Agency FHA Federal Housing Administration FHWA Federal Highway Administration FNS Food and Nutrition Service FRB Federal Reserve Board FSA Farm Service Agency GDP Gross Domestic Product GSA General Services Administration HI Hospital Insurance HSMI Hospital aAnd Supplementary Medical Insurance I-O Input-Output Accounts IRA Individual Retirement Account IRS Internal Revenue Service ITAs International Transactions Accounts MTS Monthly Treasury Statement NIPA National Income and Product Accounts NSF National Science Foundation OASDI Old-Age, Survivors, And and Disability Insurance OMB Office of Management and Budget OPM Office of Personnel Management OWS Office of Workforce Security PBGC Pension Benefit Guaranty Corporation PCE Personal Consumption Expenditures PPI Producer Price Index R&D Research And and Development RRB Railroad Retirement Board ROW Rest of World SCB Survey of Current Business SEC Securities and Exchange Commission SECA Self-Employment Contribution Act SES Senior Executive Service SMI Supplementary Medical Insurance SPR Strategic Petroleum Reserve SSA Social Security Administration TTB Alcohol and Tobacco Tax and Trade Bureau TVA Tennessee Valley Authority UI Unemployment Insurance USDA U.S. Department of Agriculture USEC U.S. Enrichment Corporation VA Department of Veterans Affairs VPIP Value Put-Inin-Place
II—3 .
Table Of Contents
1. INTRODUCTION ...................................................................................................................... 6
2. OVERVIEW OF THE BUDGET TRANSLATION ................................................................. 7
FEDERAL BUDGET TRANSLATION AND FISCAL-YEAR ANALYSIS............................... 7
DIFFERENCES BETWEEN BUDGET AND NIPA RECEIPTS ................................................. 8 COVERAGE DIFFERENCES ............................................................................................................. 8 NETTING AND GROSSING DIFFERENCES ........................................................................................ 9 TIMING DIFFERENCES................................................................................................................... 9
DIFFERENCES BETWEEN BUDGET OUTLAYS AND NIPA CURRENT EXPENDITURES....................................................................................................................................................... 10
COVERAGE DIFFERENCES ........................................................................................................... 10 NETTING AND GROSSING DIFFERENCES ...................................................................................... 11 TIMING DIFFERENCES................................................................................................................. 11 INTRAGOVERNMENTAL TRANSACTIONS ..................................................................................... 11
DERIVATION OF NIPA CURRENT RECEIPTS ...................................................................... 11
DERIVATION OF CURRENT EXPENDITURES AND GROSS INVESTMENT ................... 12
(FISCAL-YEAR ANALYSIS) ..................................................................................................... 12
3. DERIVATION OF RECEIPTS ................................................................................................ 13
CURRENT RECEIPTS ................................................................................................................ 13 CURRENT TAX RECEIPTS ............................................................................................................ 14 CONTRIBUTIONS FOR GOVERNMENT SOCIAL INSURANCE ........................................................... 19 INCOME RECEIPTS ON ASSETS..................................................................................................... 27 CURRENT TRANSFER RECEIPTS................................................................................................... 29 CURRENT SURPLUS OF GOVERNMENT ENTERPRISES ................................................................... 30
CAPITAL TRANSFER RECEIPTS............................................................................................. 31
4. DERIVATION OF EXPENDITURES..................................................................................... 32
CONSUMPTION EXPENDITURES........................................................................................... 32
NATIONAL DEFENSE CONSUMPTION EXPENDITURES AND GROSS INVESTMENT. 33 CONSUMPTION EXPENDITURES................................................................................................... 35 GROSS INVESTMENT................................................................................................................... 41
II—4 .
NONDEFENSE CONSUMPTION EXPENDITURES AND GROSS INVESTMENT.............. 45 CONSUMPTION EXPENDITURES................................................................................................... 46 GROSS INVESTMENT................................................................................................................... 50
OTHER CURRENT EXPENDITURES....................................................................................... 51 CURRENT TRANSFER PAYMENTS ................................................................................................ 51 INTEREST PAYMENTS ................................................................................................................. 60 SUBSIDIES .................................................................................................................................. 61 WAGE ACCRUALS LESS DISBURSEMENTS.................................................................................... 61
NET FEDERAL GOVERNMENT SAVING............................................................................... 62
OTHER CAPITAL EXPENDITURES......................................................................................... 62 NET PURCHASES OF NON-PRODUCED ASSETS.............................................................................. 63
NET FEDERAL LENDING OR BORROWING (-).................................................................... 63
5. REAL CONSUMPTION EXPENDITURES AND GROSS INVESTMENT ......................... 63
NATIONAL DEFENSE CONSUMPTION EXPENDITURES AND GROSS INVESTMENT. 66 CONSUMPTION EXPENDITURES................................................................................................... 66 GROSS INVESTMENT................................................................................................................... 70
NONDEFENSE CONSUMPTION EXPENDITURES AND GROSS INVESTMENT.............. 72 CONSUMPTION EXPENDITURES .................................................................................................. 73
SOURCES..................................................................................................................................... 77
APPENDIX I ................................................................................................................................ 89
APPENDIX II ............................................................................................................................... 90
TABLES ....................................................................................................................................... 94
TABLE II-1. TIMING BASIS OF CURRENT RECEIPTS......................................................... 94
TABLE II-2. TIMING BASIS OF CURRENT EXPENDITURES AND GROSS INVESTMENT....................................................................................................................................................... 94
TABLE II-3. FEDERAL GOVERNMENT CURRENT RECEIPTS: SOURCES OF ESTIMATES................................................................................................................................. 95
TABLE II-4. FEDERAL GOVERNMENT CURRENT EXPENDITURES: SOURCES OF ESTIMATES................................................................................................................................. 98
TABLE II-5. FEDERAL GOVERNMENT NATIONAL DEFENSE CONSUMPTION
II—5 .
EXPENDITURES AND GROSS INVESTMENT: SOURCES OF ESTIMATES ................... 101
TABLE II-6. FEDERAL GOVERNMENT NONDEFENSE CONSUMPTION EXPENDITURES AND GROSS INVESTMENT: SOURCES OF ESTIMATES ................... 105
TABLE II-7. REAL FEDERAL GOVERNMENT NATIONAL DEFENSE CONSUMPTION EXPENDITURES AND GROSS INVESTMENT: SOURCES OF ESTIMATES ................... 107
TABLE II-8. REAL FEDERAL GOVERNMENT NONDEFENSE CONSUMPTION EXPENDITURES AND GROSS INVESTMENT: SOURCES OF ESTIMATES ................... 110
TABLE II-9. SOURCES OF ESTIMATES................................................................................ 111
II—6 .
1. INTRODUCTION
This part describes Federal Government transactions, which are presented as (1) Federal Government current receipts and expenditures (National Income and Product Accounts (NIPA) table 3.2);1 (2) Federal Government consumption expenditures and gross investment (NIPA table 3.9.x); and (3) Federal Government consumption expenditures and general government gross output (NIPA table 3.10.x). These transactions are presented here as an integrated line-by-line set of accounts that follow the structure of the NIPA tables and describes the estimation procedures for calculating current-dollar and chained-dollar estimates.
The first section is an “Overview of the Budget Translation,” which describes the methodology for transforming budget receipts and outlays into NIPA receipts, current expenditures, and gross investment using coverage, netting and grossing, and timing adjustments.
The second section provides the methodology for the “Derivation of Receipts.” The sources and methods used to estimate current tax receipts, contributions for government social insurance, income receipts on assets, current transfer receipts, and the current surplus of government enterprises are discussed.
The third section of this part provides the sources and methods used to estimate current expenditures and gross investment. First, for defense and nondefense, the section covers compensation of general government employees, general government consumption of fixed capital, and expenditures on intermediate durable goods, nondurable goods, and services purchased. Second, gross investment in structures, and in equipment and software are covered. Third, this section provides the methodology for estimating other current expenditures such as current transfer payments, interest payments, subsidies, and wage accruals less disbursements. Fourth, this section provides the methodology for estimating other capital expenditures such as capital transfer payments, and net purchases of non-produced assets.
The final section of this part, “Real Consumption Expenditures and Gross Investment,” describes the real-type quantity and price indexes, which measure changes in real output and prices. This section is also divided into national defense and nondefense consumption expenditures and gross investment, and it provides details on the methodologies and price indexes used to estimate real expenditures of the categories mentioned in the earlier sections.
1 Total government receipts and expenditures——both Federal and State and local government—can also be found in the Survey of Current Business, NIPA Table A. Summary National Income and Product Accounts, Account 4. Government Receipts and Expenditures Account.

II—7 .
2. OVERVIEW OF THE BUDGET TRANSLATION
NIPA estimates of Federal Government current receipts, of current expenditures, and of gross investment are based on the Federal budget from the Office of Management and Budget (OMB), on financial reports from the Department of the Treasury, and on reports from other Federal Government agencies.
The Federal budget is published as multi-volume publications, including the Budget of the United States Government (Budget) [3.1], the Budget of the United States Government: Appendix (Budget: Appendix) [3.2], and the Budget of the United States Government: Special Analyses (Special Analyses) [3.4]. The Treasury also prepares a set of documents, including the Monthly Treasury Statement of Receipts and Outlays of the United States Government (MTS) [31.3], the Treasury Bulletin [31.4] and the Combined Statement of Receipts, Outlays, and Balances of the United States Government [31.1]. The Treasury's annual report and the appendices to the budget provide the most detailed and complete fiscal-year data on receipts, outlays, balances, and other cash-basis information covering all Federal Government entities.2 The documents are keyed to the Federal fiscal-year, which begins on October 1, ends the following September 30, and is designated by the calendar-year in which it ends.3
NIPA table 3.18 shows the relationship of receipts and outlays in the Federal budget to NIPA estimates of current receipts, current expenditures, and gross investment. The first section of this table shows total Budget receipts followed by the coverage, netting and grossing, and timing differences, that are used to convert budget data to NIPA Federal Government current receipts. Likewise, the second section shows budget outlays and coverage, netting and grossing, and timing differences that are used to convert these budget data to NIPA Federal Government current expenditures. The final section reconciles the budget surplus or deficit with NIPA net Federal Government saving by adding net investment and subtracting capital transfers received, Federal Government employee retirement plans, other coverage differences, and timing differences.
FEDERAL BUDGET TRANSLATION AND FISCAL-YEAR ANALYSIS
Each year the Bureau of Economic Analysis (BEA) prepares a translation of the transactions presented in The Budget of the United States Government to a NIPA basis. The translation originally appears in the Budget.4 Additional detail and analysis appear later in an article on "Federal Budget
2 Data from Office of Management and Budget and Treasury documents will be referred to collectively as "budget data.”
3 Prior to fiscal-year 1977, the fiscal-year began on July 1, ended the following June 30, and was also designated by the calendar-year in which it ended. The transition quarter between the change in fiscal-years 1976 and 1977 is designated 7T.
4 "National Income and Product Accounts," Budget of the United States Government, Analytical Perspectives,

II—8 .
Estimates" in the Survey of Current Business usually in March of each year.5
The budget translation reconciles budget values to the NIPAs and affects quarterly current NIPA and annual revisions estimates. It impacts most Federal current receipts, current expenditures, and gross investment categories as a result of updating fiscal-year control totals for the preceding, current, and forthcoming fiscal years. Many series are only available as fiscal-year totals, e.g. grants-in-aid to state and local governments, certain transfer payments, subsidies, and the current surplus or deficit of government enterprises. These fiscal-year control totals are used to establish relationships (i.e. ratios), which are applied to the outlays available from the MTS [31.3] in subsequent current estimates, or to interpolate fiscal-years to quarters. The budget translation also provides valuable information on the quarterly timing of changes in current receipts and current expenditures associated with law changes.
DIFFERENCES BETWEEN BUDGET AND NIPA RECEIPTS
NIPA table 3.18 shows that NIPA current receipts differ from budget receipts because of coverage, netting and grossing, and timing.
COVERAGE DIFFERENCES
The budget includes receipts from persons in the U.S. territories (including American Samoa, Guam, and the Virgin Islands) and the Commonwealth of Puerto Rico. In the NIPAs, residents of the U.S. territories and Puerto Rico are considered residents of the rest of the world sector, rather than U.S. residents. The receipts associated with the geographic coverage difference, largely contributions for government social insurance, are not treated as receipts from the rest of the world; instead, they are excluded from the NIPAs.
In addition, the budget does not include receipts of certain entities that are part of the NIPA government sector, such as those of the Tennessee Valley Authority (TVA) retirement fund, the Federal Reserve Board (FRB) retirement fund, and several deposit funds held by the Treasury. TVA and FRB together with the other government employee retirement plans were reclassified as part of the household (personal) sector during the 1999 Benchmark.
The budget does not include transactions for NIPA imputations. NIPA current receipts include imputations that are made for the Federal Government's contributions as an employer to the following programs: Workers' compensation, military medical insurance, unemployment insurance (UI) for former Federal employees, and reimbursable UI benefits for former employees of state and local governments and private nonprofit institutions. In each case, the imputed contributions are made to equal the benefits which are recorded in current expenditures;
the current surplus or deficit is not affected.6
Fiscal-year 2004, U.S. Government Printing Office, Superintendent of Documents, Washington, D.C., February 2003, pp.383-387.
5 The Survey is BEA’s monthly journal.
6 In NIPA table 3.18B, these imputations are included as a netting and grossing difference where the premiums are netted against outlays in the budget. The budget's netting reflects the view that the proceeds are income from a
II—9 .
In addition, the budget includes transactions that are excluded from the current account NIPA estimates. For example, estate and gift taxes are excluded from NIPA current receipts and instead, are counted as a capital transfer received. Likewise, certain transactions associated with government employee pension plans are also excluded.
NETTING AND GROSSING DIFFERENCES
The "netting and grossing differences" in NIPA table 3.18 reflect three types of differences in the way a transaction is recorded. For all three, the surplus or deficit is not affected because equal adjustments are made in current receipts and in current expenditures.
First, the budget nets certain receipts against outlays whereas the NIPAs record a receipt. This difference occurs, for example, in the case of supplementary medical insurance premiums; the premiums are recorded in the budget as an offset to outlays, and the NIPAs record the premiums as a receipt. The netting adjustment increases NIPA current receipts and current expenditures relative to their budget counterparts.
Second, in some cases the budget records a receipt while the NIPAs record an offset against current expenditures.
Third, for some transactions between agencies, the budget does not record a receipt; instead, it records an outlay and an offset against outlays. The NIPAs record both a current expenditure and a current receipt. For example, rents and royalties on the outer continental shelf lands are recorded in the budget as "undistributed offsetting receipts" and are netted against outlays. In the NIPAs, these rents and royalties are classified as receipts and are included in "income receipts on assets."
TIMING DIFFERENCES
Receipts are recorded in the budget on a cash basis—that is, when-received. NIPA current receipts are recorded on either a payments basis (i.e. when-paid) or on an accrual basis. In general, the NIPAs record current receipts from the personal sector on a payments basis and from the business sector on an accrual basis.7 Consequently, personal current nonwithheld income taxes and current transfer receipts from persons are recorded on a payments basis. Taxes on corporate income, interest, miscellaneous receipts, excise taxes, customs duties, and current transfer receipts from business (net) are recorded on an accrual basis. Because of lags between when a liability is incurred or a payment is made and when the payment is received, receipts recorded in the budget for one period may reflect a later period than the one required for the NIPAs. Table II-1 lists current receipts and how they are recorded in the NIPAs.
business-type transaction and are thus not included in receipts. The NIPAs record a contribution for social insurance. The grossing adjustments raise NIPA receipts and current expenditures. 7 Currently, BEA is conducting research to consider converting cash-accounting based estimates to an accrual basis to conform to international guidelines.
II—10 .
DIFFERENCES BETWEEN BUDGET OUTLAYS AND NIPA CURRENT EXPENDITURES
NIPA table 3.18 also shows that NIPA current expenditures differ from budget outlays because of coverage, netting and grossing, and timing.
COVERAGE DIFFERENCES
COVERAGE OF TRANSACTORS
A geographic difference of the same type discussed for current receipts exists for current expenditures. Current expenditures, largely current government social benefits to persons, grants-in-aid, and subsidies to U.S. territories and Puerto Rico, are excluded from the NIPAs because the NIPAs only cover the 50 states and the District of Columbia.
In addition, coverage differences associated with a number of other transactors, which existed prior to 1986, are also excluded. For example, the Federal Financing Bank, the Synthetic Fuels Corporation, and the lending activities of the Rural Electrification Administration were off-budget until their status changed in 1986. Since then, their transactions that are primarily financial in nature, have been excluded from the NIPAs.
COVERAGE OF TRANSACTIONS
The budget includes net lending (new loans less repayments), deposit insurance, net purchases of foreign currency, and net purchases of nonproduced assets as outlays. Net purchases of nonproduced assets consist of transactions in land (purchases less sales), bonuses paid from drilling rights on the Outer Continental Shelf, and FCC proceeds from the auctions of the radio spectrum. NIPA current expenditures do not include these transactions because they are an exchange of existing assets rather than current income or production but these capital transactions are represented in the NIPA Domestic Capital Account. In addition, the budget includes certain other financial transactions such as loans which are not included in the NIPA, but are covered by the flow of funds account.
As explained in the description of the differences between budget and NIPA current receipts, the budget refers to actual transactions and does not generally include imputations. However, NIPA current expenditures include imputations for services furnished without payment by depository institutions (that is, the services of financial intermediaries except life insurance carriers and private noninsured pension funds), food furnished to employees, and standard clothing issued to military personnel.
The budget outlays do not include the estimates made for Federal Government consumption of fixed capital (CFC) (a partial measure of the services rendered by government-owned capital) in the NIPAs. In addition, the NIPAs exclude investment from current expenditures. The difference between investment and CFC is shown as net investment under coverage adjustments.
The budget also includes other transactions that are not included in government receipts and current expenditures. For example, Federal Government investment grants to state and local governments appear in capital transactions but not in government receipts and current expenditures. Certain transactions associated with government employee pension plans are also excluded from government receipts and expenditures.

II—11 .
NETTING AND GROSSING DIFFERENCES
These differences were discussed under the section on receipts.
TIMING DIFFERENCES
The budget records outlays, except interest on the public debt, on a cash basis, that is, when-paid. The NIPAs record current expenditures to the personal sector and other domestic governments on a payments basis, with the exception of Medicare transfer payments, which are recorded on an accrual basis. The NIPAs record current expenditures to the business sector on an accrual basis. The largest timing difference is for national defense gross investment for relatively long-term production items, such as aircraft and missiles, for which the work in progress is considered as part of business inventories until the item is completed and delivered to the Government. Structures and ships are included on a value-put-in-place (VPIP) basis. Quarterly timing differences may arise between budget outlays and NIPA current expenditures. Table II-2 lists current expenditures and gross investment and how they are recorded in the NIPAs.
INTRAGOVERNMENTAL TRANSACTIONS
The budget records certain transactions as an outlay of one agency and as a receipt deducted from the outlays of the receiving agency. For example, agencies pay interest to the Department of the Treasury as the result of their borrowing from the Treasury. This is not a difference between NIPA current expenditures and the budget. Although the NIPAs assume that these receipts and outlays are recorded in the same time periods, this is not always the case. A timing difference may result unless BEA is aware of the difference in reporting by the agencies and makes an adjustment to account for all intragovernmental transactions that have been made in its agency-by-agency derivation of NIPA current expenditures.
Where monthly source data are used to prepare estimates, we generally sum months to obtain quarters, and quarters to obtain annuals. Where quarterly source data are used to prepare estimates we generally interpolate quarters to get months, but sum quarters to annuals. Where only annual source data are used we generally interpolate to obtain months and quarters with or without indicator series, see table II-1 through II-9. In addition unless specified otherwise all series are prepared using the Census Bureau’s X-12 ARIMA seasonally-adjusted program. If no seasonality is detected then the not-seasonally-adjusted months and quarters are set equal to the seasonally-adjusted months and quarters.
DERIVATION OF NIPA CURRENT RECEIPTS Estimates of NIPA current receipts are prepared by receipt category as shown in the budget. For most categories, the estimates are not based directly on budget data; instead, to achieve the required timing basis, receipts estimates are based largely on information from a variety of Federal agencies. The most widely used source of information is from tabulations of tax returns prepared by the Internal Revenue Service (IRS) and other administering agencies. For example, tabulations of corporate income tax returns are used in the derivation of estimates of taxes on corporate income; tabulations of excise tax returns are used in the derivation of estimates of excise taxes; and
II—12 .
tabulations of returns filed by employers for many social insurance programs, such as social security, are used in the derivation of estimates of contributions for government social insurance. MTS data are used for personal current taxes and for current transfer receipts from business, customs duties, and smaller social insurance programs, such as supplementary medical insurance. In addition, imputed NIPA current receipts, such as contributions for military medical insurance, are prepared in conjunction with the expenditure estimates.
Budget receipts are available monthly, usually in the MTS [31.3]; tax return data are available quarterly for certain taxes, such as excise taxes, and for the calendar-year for other taxes, such as corporate taxes. These data, which are available in time for the second annual revision, are used to prepare quarterly, and for some receipts, monthly-not-seasonally-adjusted estimates. For taxes where only annual data are available, the quarterly and monthly not-seasonally-adjusted estimates are derived by interpolation. When statistical seasonality is detected the series is adjusted using the Census Bureau’s seasonal adjustment program.
Current quarterly and monthly estimates for most receipts are extrapolations using NIPA income estimates and other relevant statistical series as indicators. For the remainder, such as personal current taxes that are not withheld-declarations and final settlements less refunds-and current transfer receipts from persons, the estimates are extrapolations based on calendar-year projections.
DERIVATION OF CURRENT EXPENDITURES AND GROSS INVESTMENT (FISCAL-YEAR ANALYSIS)
Government current expenditures and gross investment estimates are prepared by program—that is, by activity for which there is a line item in the budget, of which about 570 are analyzed separately for the NIPA estimates. These analyses draw on data from the budget and related documents supplemented by data from Treasury financial reports and reports of the agencies administering the programs. For most programs, the fiscal-year analysis begins by adjusting budget outlays for coverage and for netting and grossing differences between these outlays and NIPA current expenditures. The expenditures total (as adjusted) for a program is then classified by type of NIPA expenditure.
When a fiscal-year analysis is completed, a detailed array of NIPA expenditures by program and by type of expenditure serves as a set of control totals for the quarterly estimates. The method most frequently used to derive quarterly estimates by type of expenditure for a program is to prorate the quarterly MTS outlays by the fiscal-year relationships developed for that program. Proration is not used when outlays are dominated by a fluctuating element, such as lending, that is not included in the NIPAs or when information that is a significant improvement over proration, such as for the Commodity Credit Corporation (CCC), is available from the operating agency. In the first case, the NIPA expenditure estimates are judgmental extrapolations.8 In the second case, quarterly estimates may be derived directly from quarterly source data or a detailed analysis is performed using agency data to derive an indicator series, which can be used to interpolate the fiscal-year control.
8 In judgmental extrapolation, analysts review available information and may base estimates on moving averages, a trend growth rate, a statistical model, recent legislation, court rulings, and other published and unpublished information that may be available.
II—13 .
With few exceptions, the data for fiscal-year analysis are available in time for the first annual revision. Quarterly estimates that show seasonality are prepared using the Census Bureau’s seasonal adjustment program.
For the current quarterly estimates, advance estimates of nondefense consumption expenditures and gross investment, except the CCC, are based on Federal agency data in conjunction with extrapolations based on the fiscal-year analysis. Advance estimates of defense consumption expenditures and gross investment for some series are extrapolations using MTS outlays, other indicators, or judgment; for other defense series, estimates are prepared using underlying budget and agency data. For the preliminary estimate, most defense consumption expenditures and gross investment series, except for compensation, are based on agency data. Also, estimates of CCC inventory change are based on agency data. For current transfer payments, most advance estimates are judgmental extrapolations; partial source data become available by the time of the preliminary and final estimates. For estimates of grants-in-aid, MTS outlays are used as the source. Estimates of interest paid, except for estimates of interest on the public debt, and of subsidies are largely judgmental extrapolations.
3. DERIVATION OF RECEIPTS
CURRENT RECEIPTS
As indicated earlier, the NIPA categories of Federal receipts are derived from budget data and other information from Federal agencies as part of the fiscal-year analysis. These data are adjusted for coverage and for netting and grossing differences, as shown in NIPA table 3.18, to place them on a basis consistent with NIPA concepts. The sources and methods used to derive NIPA receipts yield the required timing basis; the timing difference shown in table 3.18 is calculated as the difference between budget receipts and NIPA receipts.
Within the control totals derived from the fiscal-year analysis, estimates of receipts are prepared using the sources shown in table II-3. For detailed receipts categories, the table shows the source data for the first annual revision and for the current estimates. The column for the first annual revision describes calendar-year and quarterly estimates. The column for current estimates describes quarterly estimates for all the receipts categories and monthly estimates for those receipts that are included in the personal income and outlay account. Also, when the source data are listed as annual (either calendar or fiscal-year), the method used to obtain quarterly (or monthly) estimates is listed.
The seasonally-adjusted estimates of receipts are prepared using one of four procedures. For each, the initial effects of tax law changes, when significant, are estimated separately and added to the seasonally-adjusted baseline estimates. The four procedures are as follows:
(1) For taxes and contributions for social insurance for which the quarterly (or monthly) pattern of payments or liabilities reflects fluctuations in the tax or contributions base, the seasonally-adjusted estimates are prepared by interpolating and extrapolating the annual estimates using an indicator series. An example of this approach is personal withheld income taxes, which is interpolated and extrapolated using the monthly
II—14 .
seasonally-adjusted estimates of NIPA wages and salaries less the wages of farm and private household workers as the indicator;
(2) For taxes and contributions for social insurance for which the quarterly (or monthly) pattern reflects less specific sources of variation or for which the choice of an indicator series is less straightforward, the seasonally-adjusted estimates are prepared using the Census Bureau’s seasonal adjustment program to adjust the quarterly (or monthly) data directly. An example of this approach is customs duties;
(3) For taxes for which quarterly (or monthly) observations show no seasonality and for receipts for which there are no quarterly (or monthly) data, the seasonally-adjusted quarterly and monthly estimates are prepared by interpolating the annual estimates without an indicator and extrapolating the current quarterly estimates judgmentally. An example of this approach is some personal income taxes that are not withheld, specifically quarterly declarations and fiduciary taxes
(4) For taxes for which quarterly (or monthly) observations are not related to current economic activity, the seasonally-adjusted estimates are prepared by holding the annual estimates constant over the quarters (or months) of the year. Examples of this approach are some personal income taxes that are not withheld—specifically, final settlements, back taxes, and tax refunds.
Some series are not-seasonally-adjusted. This occurs for various reasons, including the inability of a series to pass the seasonal test of the Census Bureau’s seasonal adjustment program or the undesirability of losing the seasonal impact of the estimate due to legislative changes, such as cost-of-living adjustments (COLAs). For a detailed description of seasonal adjustment, see Part I, "Statistical Conventions" on page I-13.
CURRENT TAX RECEIPTS
PERSONAL CURRENT TAXES
Table II-3, lists personal current taxes for the different types of income taxes, as shown in NIPA table 3.4.
Income taxes Income taxes are estimated in two parts: Withheld taxes and “declarations and final settlements less refunds.” Withheld income taxes are directly withheld at the source, largely by employers, from wages and salaries. Declarations—that is, estimated tax payments—are paid quarterly, largely on income not subject to withholding. Final settlements are any additional taxes paid with the filing of tax returns and in response to audits. Refunds are the return to the taxpayer of excess taxes paid.
WITHHELD INCOME TAXES
Calendar-year withheld income taxes are derived in conjunction with estimates of social security
II—15 .
contributions. Withheld taxes are from the MTS [31.3] and are the sum of three parts: Withheld individual income taxes, withheld social security contributions (including employer taxes), and the employer social security contributions for Federal employees. Monthly data are summed to derive a quarterly estimate of cash-basis withheld social security contributions and income taxes, including taxes received from the rest of the world and interest on late tax payments. The purpose of this step is to undo the estimated split between income taxes and employment Federal Insurance Contribution Act (FICA) taxes reported in the MTS that are derived using an economic model that allocates total withholding between income taxes and employment taxes.
An estimate of combined social security contributions and income tax payments (including interest on late taxes and payments from the rest of the world) is derived by lagging approximately nine percent of each quarter's cash-basis receipts to the prior quarter. This adjustment is made to convert the collections from a “when recorded by Treasury” basis to a “paid on payday” basis. Most of this conversion is to account for taxes that are paid at the end of a quarter but which do not reach Treasury until the next quarter. The percentage to be lagged is adjusted when legislation changes the payment schedule required of employers.
Estimates of withheld social security contributions, income taxes paid by the rest of the world, and interest on late taxes are subtracted from the combined estimate to obtain an estimate of NIPA withheld income taxes. The estimate of withheld social security contributions (including those for Federal employees) is from Social Security Administration (SSA) tabulations of tax returns filed by employers [16.2]. (Until 1987, MTS data did not include social security contributions from state and local governments. The data from SSA for years prior to 1987 are adjusted to provide an estimate of contributions conforming to coverage of the MTS.) The estimate of withheld income taxes paid by the rest of the world is from BEA's International Transaction Accounts (ITA) accounts [22.8]. The estimate of interest on late taxes is derived from IRS tabulations of assessment certificates issued [32.3]; fiscal-year estimates from this tabulation are interpolated without an indicator to obtain quarters. Not-seasonally-adjusted quarterly estimates are then summed to obtain the calendar-year estimates.
Monthly and quarterly seasonally-adjusted estimates of withheld income taxes are prepared by interpolating the calendar-year estimates using NIPA seasonally-adjusted wages and salaries less the wages and salaries of farm and private household workers as the indicator. Allowance is made for changes in the withholding rate schedule and for tax law changes. Judgmental consideration is also given to budget projections. Current estimates are extrapolations using the indicator described above, guided by budget projections, with allowance for tax law changes.
DECLARATIONS AND FINAL SETTLEMENTS LESS REFUNDS
Calendar-year estimates of declarations and final settlements less refunds are derived in conjunction with social security contributions under the Self-Employment Contributions Act (SECA). On a combined basis, declarations and final settlements are often referred to as nonwithheld income taxes. Monthly nonwithheld taxes (including taxes paid by the rest of the world and interest on late taxes) are from the MTS [31.3] and are comprised of three parts: Other income taxes, presidential election campaign fund collections, and SECA taxes. Monthly estimates are summed to obtain quarterly estimates. Estimates of SECA taxes, of penalty taxes related to retirement plans, of predetermined estimated penalty taxes, of taxes paid by the rest of the world, and of interest on late taxes are subtracted from this combined estimate to obtain an initial estimate of NIPA nonwithheld income taxes. Estimates of SECA taxes are based on tax return tabulations from SSA [16.2]; estimates for
II—16 .
both penalty taxes are based on individual tax return data from the IRS, reported in the Statistics of Income [32.2]; estimates of income tax paid by the rest of the world are based on data from BEA's ITAs [22.8]; and quinquennial IRS data collected on Form 2555 [32.2]. Estimates of interest on late taxes are derived from IRS tabulations of assessment certificates issued [32.3]. Not-seasonally-adjusted quarterly estimates are then summed to obtain calendar-year estimates.
Monthly refunds of income taxes are from the MTS [31.3]. Monthly data are summed to obtain quarterly not-seasonally-adjusted estimates, and the latter are summed to obtain calendar-year estimates.
For monthly and quarterly seasonally-adjusted estimates up to 1987, the combined estimate of declarations and settlements less refunds are interpolated without an indicator, with allowance for tax law changes.
The methodology implemented post-1987 provides a better pattern for declarations and settlements (estimated income tax payments and final settlements) less refunds, which grew sharply through the mid 1990's.
The new methodology separates estimated income tax payments and final settlements into estimated taxes, final settlements, back taxes, and fiduciary taxes, i.e. taxes paid by estates and trust on earned income. Estimated and fiduciary taxes, which are primarily based on tax liabilities for the current year, are interpolated without an indicator. Final settlements, back taxes, and tax refunds, which are based on tax liabilities for previous years, are held constant for all quarters and months during the year in which the taxes are collected (or the refunds are paid). The monthly and quarterly pattern for these taxes records the full amount of annual change in the first quarter (in January) of each year. Although monthly Department of Treasury collections data are available for nonwithheld taxes, both the monthly and quarterly totals are very volatile and do not have an identifiable seasonal pattern. However, these monthly data are used in the current year to revise the budget projections, usually when data for April become available.
TAXES ON PRODUCTION AND IMPORTS
Table II-3, lists taxes on production and imports, separately for excise taxes and for customs duties, as they are shown in NIPA table 3.5.
Excise taxes GASOLINE
Calendar-year estimates of gasoline excise taxes are from unpublished Treasury data.9 The quarterly
9Prior to 1983, calendar-year estimates were derived from IRS data.
II—17 .
not-seasonally-adjusted gasoline estimate is interpolated using gasoline production data from the Energy Information Administration, Department of Energy (DOE) [25.1], as the indicator. Quarterly seasonally-adjusted estimates are derived by interpolating the calendar-year estimate with seasonally-adjusted gasoline production data as an indicator; these data are seasonally-adjusted using the Census Bureau’s seasonal adjustment program. Current quarterly estimates for gasoline excise taxes are extrapolations using DOE gasoline production as the indicator.
ALCOHOLIC BEVERAGES
The Alcohol and Tobacco Tax and Trade Bureau (TTB) tabulates alcohol excise tax receipts for fiscal-years [29.3]; these data are used as the NIPA fiscal-year estimate. Estimates are prepared separately for domestic beer, for domestic distilled spirits, and for all other categories of alcohol. Quarterly not-seasonally-adjusted estimates for domestic beer are prepared by interpolating the fiscal-year data using taxable withdrawals from warehouses –beer as the indicator. The withdrawal data are from the TTB [29.1]. Quarterly not-seasonally-adjusted estimates for distilled spirits are prepared by interpolating the fiscal-year data using the same indicator as domestic beer. Quarterly not-seasonally-adjusted estimates for all other categories of alcohol are prepared by interpolating the fiscal-year without indicator.
Quarterly seasonally-adjusted estimates for domestic beer are prepared by interpolating the fiscal-year data using seasonally-adjusted withdrawals data as the indicator; these data are seasonally adjusted using the Census Bureau’s seasonal adjustment program. Quarterly seasonally-adjusted estimates for distilled spirits are prepared by interpolating the fiscal-year data using the same seasonally-adjusted indicator as for beer beginning in 1996; prior to 1996, taxable withdrawals of distilled spirits from bonded warehouses serve as the indicator series. Quarterly seasonally-adjusted estimates for all other categories of alcohol equal the quarterly not-seasonally-adjusted estimates. For all three estimates, calendar-year estimates are summed from the seasonally-adjusted quarters. Current quarterly estimates are judgmental extrapolations, guided by budget projections.10
TOBACCO
The TTB tabulates tobacco excise tax receipts for fiscal-years [29.3]; these data are used as the NIPA fiscal-year estimate. Quarterly not-seasonally-adjusted estimates are prepared by interpolating the fiscal-year data using taxable withdrawals of small cigarettes from bonded warehouses as the indicator. The withdrawal data are from the TTB [29.2]. Quarterly seasonally-adjusted estimates are derived by interpolating the fiscal-year estimate with seasonally-adjusted withdrawal data; these data are seasonally adjusted using the Census Bureau’s seasonal adjustment program. Quarterly seasonally-adjusted estimates are summed to obtain calendar-year estimates. Current quarterly estimates are judgmental extrapolations, guided by budget projections.
10 Data on taxable withdrawals are available for the second annual revision.
II—18 .
DIESEL FUEL
Calendar-year estimates of diesel fuel excise taxes are drawn from unpublished Treasury data. Quarterly seasonally-adjusted estimates are derived by interpolating the calendar-year without an indicator.11 Current quarterly estimates are judgmental extrapolations, guided by budget projections. AIR TRANSPORT Calendar-year estimates of air transport excise taxes are from unpublished Treasury data. Since 2001, estimates are prepared separately for the Passenger Civil Aviation Security Service Fees and for all other categories of air transport. Quarterly not-seasonally-adjusted estimates for the September 11th fees are from the SF133 reports [4.16]; quarters are then summed to calendar-year estimates. Quarterly seasonally-adjusted estimates are equal to the not-seasonally-adjusted estimates. Calendar-year estimates for the September 11th fees are added to the other air transport taxes to obtain the calendar-year estimates for total air transport excise taxes. Quarterly seasonally-adjusted estimates for all other categories of air transport are derived by interpolating the calendar-year without an indicator.12 Current quarterly estimates for all other categories of air transport are judgmental extrapolations, guided by budget projections.
CRUDE OIL WINDFALL PROFITS TAX
The windfall profit tax, in effect from 1980 to 1988, was a per-barrel tax on petroleum production. The Federal Government also "taxed" the royalties it received on the production of oil on the Outer Continental Shelf and on sales from the Naval petroleum reserve.
The IRS tabulates the windfall profits tax liability from quarterly tax returns filed by producers [32.2]. These data, less Federal liability, are used as the NIPA quarterly liability estimate and are not seasonally adjusted. Quarterly estimates are summed to obtain calendar-year estimates. No windfall profits taxes are paid currently.
OTHER
The IRS tabulates quarterly liabilities for all other types of excise taxes [32.2] on a current liability basis.[13 ] With two exceptions, quarterly not-seasonally-adjusted estimates are summed to obtain calendar-year estimates.[14] Refunds, on a cash basis, are from the IRS [32.1]; they are subtracted 11Prior to 1983, quarterly not-seasonally-adjusted data from the IRS were used as the seasonally-adjusted estimates.
12Prior to 1983, quarterly not-seasonally-adjusted data from the IRS were used as the seasonally-adjusted estimates.
13 Prior to 1994, these liabilities from tax returns were filed in the quarter following the liability. 14 Prior to 1983, for most of the other types of excise taxes, quarterly not-seasonally-adjusted data from the IRS were used as the seasonally-adjusted estimates.
II—19 .
from the "other" excise tax category. Quarterly estimates are summed to obtain calendar-year estimates. The two exceptions to this procedure are for the excise taxes on nuclear fuel and on telephone and telegraph services. The excise tax on nuclear fuel is from unpublished detail, which underlies the MTS [31.3]. Quarterly not-seasonally-adjusted estimates of excise taxes on nuclear fuel are used as the seasonally-adjusted estimates. Calendar-year estimates of the telephone and telegraph excise tax are from unpublished Treasury data.[15] Quarterly seasonally-adjusted estimates of the telephone and telegraph excise tax are interpolated from the calendar-year estimate using personal consumption expenditures (PCE) for telephone services as the indicator. Current quarterly telephone and telegraph excise taxes are extrapolations using PCE for telephone services as the indicator. Estimates of most of the other types of excise taxes are prepared by interpolation of calendar-year data without an indicator.
Customs duties MTS data on gross customs duties less refunds [31.3] are used as the NIPA liability estimate of custom duties. Quarterly not-seasonally-adjusted estimates are summed to obtain calendar-year estimates. Quarterly seasonally-adjusted estimates of gross receipts and refunds are prepared using the Census Bureau’s seasonal adjustment program.
Current quarterly estimates are based on three months of MTS data.
TAXES ON CORPORATE INCOME
See Corporate Profits: Profits Before Tax, Profits Tax Liability, and Dividends, BEA Methodology Paper Series MP-2, pages 13 and 23-26 [22.1], for a discussion of the sources and methods used to derive estimates of corporate profits tax accruals.
TAXES FROM THE REST OF THE WORLD
The estimate of withheld income taxes paid by the rest of the world is from BEA's ITAs [22.8].
CONTRIBUTIONS FOR GOVERNMENT SOCIAL INSURANCE
Table II-3, lists employer contributions and contributions from employees and the self-employed by program for the various federal social insurance programs as shown in NIPA table 3.6. The descriptions of the methodologies that follow are by program only, because the methodology is the same for employer and employee contributions for programs that have both.
EMPLOYER AND EMPLOYEE CONTRIBUTIONS
Old-age, survivors, disability, and hospital insurance The old-age and survivors insurance (OASI) trust fund makes benefit payments to eligible retired
15 Prior to 1991, the calendar-year estimate was derived from IRS data.

II—20 .
workers and to their survivors. The disability insurance (DI) trust fund makes benefit payments to eligible disabled workers. These funds, which are better known collectively as social security, are financed by contributions based on taxable wages and salaries and on the taxable earnings of the self-employed.16 Workers covered by OASDI are subject to taxes on all wages and salaries until they reach "maximum taxable earnings" for the year. Maximum taxable earnings have increased each year since 1972, and in 2004, the annual maximum taxable earnings for OASDI was $87,900. In most cases, the employer and the employee make identical OASDI payments into the trust funds. Employees who work for more than one employer may overpay into the OASDI trust fund. If the combined earnings from all employers exceed the maximum taxable for the year, the employee is entitled to a refund, which is claimed on the individual income tax return. The NIPAs record these refunds as offsets to the employee portion of OASDI contributions.
Calendar-year data on wages and salaries subject to OASDI taxes are from SSA tabulations of tax returns filed by employers and published in the Social Security Bulletin: Annual Statistical Supplement [16.2]. These data are adjusted to exclude U.S. territories and Puerto Rico, based on data from the same source. The remaining taxable wages and salaries are multiplied by the tax rate (including that for hospital insurance, which is discussed later), separately for the employee and employer, to derive calendar-year estimates of OASDI contributions.
Total contributions are split into contributions for employees of different sectors based on SSA unpublished calendar-year estimates of taxable wages and salaries for private, military, Federal civilian, and state and local government employees. The employer and employee contributions are derived by multiplying these wages and salaries by the employer tax rate (including that for hospital insurance). The splits of contributions are needed for the seasonal adjustment process and for estimates of the total compensation of government employees.
The SSA develops unpublished quarterly, not-seasonally-adjusted taxable wages and salaries, mostly using corresponding annual data. BEA multiplies the quarterly data by the OASDI tax rate to derive quarterly not-seasonally-adjusted OASDI contributions. The calendar-year estimate of contributions from the territories and Puerto Rico is prorated using the quarterly not-seasonally-adjusted taxable wages and salaries. The resulting estimate is subtracted from total OASDI contributions to derive quarterly not-seasonally-adjusted NIPA contributions (including those for hospital insurance).
Monthly and quarterly seasonally-adjusted estimates are interpolations of the calendar-year estimates using components of seasonally-adjusted NIPA wages and salaries as indicators. Separate interpolations are prepared for contributions for state and local government employees (using state and local government wages and salaries), Federal military employees (using military wages and salaries), Federal civilian employees (using Federal civilian wages and salaries), and private sector employees (using a variant of private sector wages and salaries). The variant of wages and salaries used to develop contributions from the private sector is total private wages and salaries excluding wages and salaries from the railroad industry, which is not covered by the OASDI program. Railroad employees are covered by a separate retirement system, which will be discussed below. In each case, the effects of changes in the tax rate and the maximum taxable earnings, which historically have gone into effect in January, are estimated separately and added to the seasonally-adjusted estimates.
Current quarterly and monthly estimates are extrapolations using the appropriate NIPA wage and salary series as indicators, with allowances for changes in the tax rate or the maximum taxable 16 A description of the contributions by the self-employed follows.

II—21 .
earnings.
Employer contributions paid by government are available separately through the procedures described above. Employer contributions for military employees are allocated to general government; contributions for Federal civilian employees are allocated to civilian general government and enterprises by the relationship of wages and salaries in Federal civilian general government to wages and salaries in Federal enterprises. Employer contributions for state and local employees are allocated to general government and enterprises in the same manner using the relationship of state and local general government wages and salaries to those in state and local government enterprise.
As mentioned above, OASDI refunds are separately estimated and subtracted from the corresponding contributions by employees to arrive at net employee OASDI contributions. The calendar-year and not-seasonally-adjusted quarterly estimates of refunds are from the MTS [31.3]. The seasonally-adjusted monthly estimates are derived by dividing the calendar-year by 12. Current monthly and quarterly estimates are extrapolations, guided by budget projections.
Hospital and supplementary medical insurance
The hospital insurance and the supplementary medical insurance trust funds provide benefit payments that are better known as Medicare.
A. Hospital Insurance (HI) covers care provided by hospitals, skilled nursing facilities, home health agencies, and hospices and is primarily financed by contributions based on taxable wages and salaries. HI is mandatory for all workers covered by OASDI and for certain groups of workers not covered by OASDI—railroad employees, some Federal civilian employees, and some State and local employees hired after March 1986. In addition, persons age 65 or older who are not automatically entitled to HI may obtain coverage voluntarily by paying monthly premiums. HI from payroll taxes is discussed first; a description of the estimation of voluntary premiums and refunds from excess HI taxes paid is discussed second.
Calendar-year and quarterly data on wages and salaries subject to the HI tax are also from the SSA. Calendar-year and quarterly not-seasonally-adjusted HI contributions are derived using the HI tax rate in the same manner as described for the OASDI estimates. Of the groups of workers not covered by OASDI, the SSA provides unpublished calendar-year and quarterly not-seasonally-adjusted estimates of taxable wages and salaries for Federal and for State and local government employees. The quarterly taxable wages and salaries are multiplied by the HI tax rate to obtain quarterly not-seasonally-adjusted estimates of employer and employee contributions. The Railroad Retirement Board (RRB) provides unpublished calendar-year estimates for railroad wages and salaries taxable for HI; the calendar-year estimate is divided by four to obtain quarterly not-seasonally-adjusted estimates.
Quarterly and monthly seasonally-adjusted HI contributions for persons subject to OASDI taxes are derived in combination with the OASDI estimates described earlier. Quarterly and monthly seasonally-adjusted HI contributions for the other groups are prepared by interpolating the calendar-year estimates without an indicator and by extrapolating judgmentally. Prior to 1994, the initial effects of changes in the tax rate or the maximum taxable earnings to HI are estimated separately and added to the seasonally-adjusted estimates. In January 1994, maximum earnings for HI taxable

II—22 .
wages were lifted permanently. Therefore, all wages and salaries are now subject to the HI tax.
Employer HI contributions paid by government on wages and salaries subject to OASDI taxes are estimated using the same methods as the corresponding OASDI contributions discussed earlier. Employer HI contributions for Federal employees not subject to OASDI are allocated to civilian general government and enterprises according to the relationship between wages and salaries in Federal civilian general government and in enterprises. Employer HI contributions for state and local employees not subject to OASDI are allocated in the same manner using the relationship of state and local general government wages and salaries to those in state and local enterprises.
Voluntary HI: The premiums are separately estimated and added to the employee HI contributions. Quarterly not-seasonally-adjusted and calendar-year premiums are from the MTS [31.3]. Quarterly and monthly seasonally-adjusted estimates are interpolations of the calendar-year estimate without an indicator. Current quarterly and monthly estimates are judgmental extrapolations, guided by budget projections.
HI refunds: Since 1994, HI refunds no longer exist because all wages are subject to the HI tax. However, prior to 1994, refunds from excess HI taxes paid are separately estimated and subtracted from the employee portion of HI taxes—the source and estimating procedures are the same as for the OASDI refunds discussed previously.
B. Supplementary Medical Insurance (SMI) is an optional program that covers physician services, hospital outpatient and laboratory services, treatment for chronic kidney disease, and approved durable medical equipment. The SMI fund is financed by a quarterly premium and by general revenues. SMI premiums are from the MTS [31.3]. The Centers for Medicare and Medicaid Services (CMS) provides an estimate of the calendar-year premiums from U.S. territories and Puerto Rico; these premiums are interpolated to produce quarterly estimates using total premiums as the indicator. The monthly premiums from U.S. territories and Puerto Rico are subtracted from total premiums to yield NIPA quarterly not-seasonally-adjusted estimates. The quarterly not-seasonally-adjusted estimates are then summed to calendar-year estimates.
Quarterly and monthly seasonally-adjusted estimates are interpolations of the calendar-year estimate without an indicator, allowing for increases in the monthly premium at the beginning of each year. Current estimates are judgmental extrapolations, guided by budget projections and allowing for changes in the premium.
Unemployment insurance The Unemployment Insurance Program provides benefits to eligible workers involuntarily separated from covered employment. The program was created by a Federal Law, “the Social Security Act of 1935” which established the basic framework of a joint Federal-state unemployment insurance system. The Federal Government sets the standard requirements for state unemployment programs while states develop and administer their individual programs. They determine contributions rates, annual maximum taxable wage levels, duration and amount of benefits and eligibility criteria. The states are required to collect and deposit contributions generated from a state tax, mostly imposed on private employers and in some states from employees, in their individual accounts in the
II—23 .
Unemployment Insurance Trust Fund which is maintained by the U.S. Treasury. States are allowed to withdraw funds for benefit payments from their accounts. Federal tax is also imposed on private employers, which finances the administrative expenses of the state programs and half of the extended benefits. In the NIPAs, the unemployment trust fund is classified in the Federal sector.
Contributions to the trust fund include proceeds from a separate Federal tax imposed on employers in the railroad industry. Unemployed former Federal civilian and military employees also draw benefits from the trust fund. The Federal Government pays for these benefits from general revenues not from a social insurance tax. In the NIPAs, an employer contribution is imputed for unemployed former Federal military and civilian employees in order to recognize the payments of the benefits as government compensation and thereby lending comparability to private compensation. Most employees in state and local government and nonprofits are also covered by unemployment insurance.
State unemployment insurance The state UI tax is comprised of:
(1) Taxes paid by most private employers and a few state and local governments on wages and salaries up to a maximum amount;
(2) taxes paid by employees in some states; and
(3) a reimbursement of benefits by certain employers—some state and local governments and some nonprofit organizations—in lieu of paying the regular tax.
The maximum taxable earnings varies from state to state, but cannot be lower than the maximum taxable earnings for Federal tax purposes.
The Bureau of Labor Statistics (BLS) prepares tabulations of UI taxes from the Quarterly Census of Employment and Wages and provides published data to the Bureau of Economic Analysis.17 These taxes do not include the reimbursable amounts. Because these contributions are made approximately one quarter after the liability period, the contributions are shifted back one quarter to approximate the timing of the liability and are summed to the calendar-year estimate. Estimates of taxes paid by employers in the U.S. territories and Puerto Rico, also based on data from BLS [27.2], are subtracted from estimates of contributions to derive the NIPA estimates of UI taxes. A portion of the estimate is allocated to employee contributions using information from the states that tax employees; the remainder is allocated to employers. An estimate of reimbursable UI benefits will be discussed in the section on current expenditures, which is presented below.
Quarterly and monthly seasonally-adjusted estimates of employer contributions are interpolations of the calendar-year estimates using seasonally-adjusted total private wages and salaries less those of railroad, farm, and private household workers as the indicator. Wages and salaries from railroad employment are not subject to the state unemployment insurance tax. Seasonally adjusted reimbursable amounts are based on the estimate of the seasonally-adjusted reimbursable benefits. The monthly and quarterly seasonally-adjusted estimates of employee contributions are
17 Although each state is responsible for collecting unemployment insurance taxes that are due on wages and salaries paid, BLS is responsible for summarizing these data on a national basis.

II—24 .
interpolations of the calendar-year using the modified estimates of total wages and salaries indicator just mentioned.
Current monthly and quarterly estimates of employer and employee contributions are extrapolations using modified private wages and salaries as the indicator, with allowances for tax law changes. Changes in the tax rate or the maximum taxable earnings, which occur regularly in January, are estimated separately and added to the seasonally-adjusted estimates. Current estimates of reimbursable amounts are based on estimates of seasonally-adjusted reimbursable benefits. The regular employer contributions paid by state and local governments are based on a BEA tabulation of data from BLS and are allocated between general government and government enterprises using the relationship of state and local wages and salaries in general government and in government enterprises. Most of the reimbursable amounts paid by state and local governments are allocated to general government.
FEDERAL UNEMPLOYMENT TAX
The Federal unemployment tax has two parts: A national tax at a uniform rate and a state-specific surtax at varying rates. All covered employers are subject to the uniform tax rate. In addition, in some states that have borrowed funds from the Federal Government to finance unemployment benefits, covered employers are subject to a surtax that depends on the amount and duration of the state's indebtedness.
Calendar-year estimates are based on unpublished taxable wages and salaries, by state, compiled by the Office of Workforce Security (OWS) from annual tax returns filed by employers [28.1]. The taxable wages and salaries are multiplied by the uniform tax rate. For states with a surtax, either the taxable wages and salaries from that state are multiplied by the surtax rate, or the amount of the surtax is obtained directly from the respective states. Information on the individual state surtaxes, if available, is from OWS [28.1]. Quarterly not-seasonally-adjusted estimates are interpolations using not-seasonally-adjusted wages and salaries taxable for state UI as the indicator.
Quarterly seasonally-adjusted estimates are interpolations of the calendar-year estimates using seasonally-adjusted private wages and salaries less those of railroad, farm, and private household workers as the indicator. Wages and salaries from railroad employment are not subject to the Federal Unemployment Tax Act (FUTA) tax. Current estimates are extrapolations using the same indicator. Changes in the tax rate or the maximum taxable earnings are estimated separately and added to the seasonally-adjusted estimates.
RAILROAD EMPLOYEES UNEMPLOYMENT INSURANCE
Prior to 1991, calendar-year estimates of railroad employees’ UI were based on taxable wages and salaries compiled by the RRB [37] on an accrual basis. The taxable wages and salaries were multiplied by a uniform rate—the Federal railroad unemployment tax rate—to derive employer contributions for railroad employees. Since 1991, however, there has been no single uniform Federal railroad unemployment tax rate levied upon all employers; instead, there are employer specific,

II—25 .
experience-based, tax rates that vary from employer to employer.18 For 1991 and later years, calendar-year and quarterly not-seasonally-adjusted estimates are from the MTS [31.3]. Quarterly seasonally-adjusted estimates are interpolations and, for the current estimates, extrapolations using seasonally-adjusted NIPA railroad wages and salaries as the indicator. Changes in the tax rate or the maximum taxable earnings are estimated separately and added to the seasonally-adjusted estimates.
FEDERAL EMPLOYEES UNEMPLOYMENT INSURANCE
Because Federal employees are not covered by the previously described UI programs, UI contributions by Federal employers are imputed to equal unemployment benefits paid to former Federal employees. This imputed value is recorded as an employer contribution and is allocated to civilian general government and government enterprises in proportion to the respective wage and salaries.
Railroad retirement Railroad retirement contributions consist of employer and employee taxes paid on monthly maximum taxable earnings and a separate "supplemental" employer contribution based on hours worked. Railroad retirement contributions include contributions for HI. The RRB calculates the required annual HI contribution and transfers it to the HI trust fund.
Calendar-year estimates of the combined retirement and HI contributions are based on wages and salaries subject to railroad retirement and HI taxes from the RRB [37]. Taxable wages and salaries are multiplied by tax rates to derive employer and employee contributions for combined retirement and HI. The HI taxable wages are multiplied by the HI tax rate, and this estimate is subtracted from the combined estimates to obtain the annual estimates for national retirement contributions. Calendar-year estimates of the supplemental employer contribution are derived by dividing fiscal-year estimates from the Budget Appendix [3.2] by four and summing the appropriate quarterly estimates.
Monthly and quarterly not-seasonally-adjusted estimates of total railroad retirement contributions are interpolations of the calendar-year estimates using the MTS [31.3] railroad retirement contributions data as the indicator. The quarterly not-seasonally-adjusted HI estimates are prepared by dividing the calendar-year estimate by four; this series is subtracted from the not-seasonally-adjusted railroad retirement contributions and added to HI contributions.
Monthly and quarterly seasonally-adjusted estimates of total railroad retirement contributions are interpolations and, for the current estimates, extrapolations using seasonally-adjusted NIPA railroad wages and salaries as the indicator. Changes in the tax rate or the maximum taxable earnings are estimated separately and added to the seasonally-adjusted estimates.
18 In 2002, there were only 7 U.S. class 1 railroad companies in the United States. See “Class 1 Railroad Statistics,” Association of American Railroads, Policy & Economics Department, page 1.

II—26 .
Pension benefit guaranty Pension benefit guaranty contributions are the premiums paid by employers to the Pension Benefit Guaranty Corporation. Fiscal-year totals are available from the Budget Appendix [3.2]; these totals are interpolated without indicator to derive quarterly not-seasonally-adjusted estimates. In order to appropriately reflect the implementation of premium increases, such increases are removed before interpolation, and then added back to the interpolated series. Quarterly seasonally-adjusted estimates are equal to the not-seasonally-adjusted estimates. Current estimates are judgmental extrapolations, guided by budget projections.
Veterans life insurance There are five veterans life insurance programs: (1) National Service Life Insurance; (2) United States Government Life Insurance; (3) the service-disabled insurance fund; (4) the veterans special life insurance fund; and (5) the veterans reopened insurance fund. The programs are funded by premiums paid by veterans and by Federal Government payments, and are described as employer contributions.
The Department of Veterans Affairs (VA) provides data for monthly insurance premiums paid by veterans for all programs [34], which are treated as employee contributions for social insurance. Monthly and quarterly seasonally-adjusted estimates are prepared by dividing the calendar-year equally.
Government payments to life insurance funds on behalf of servicemen are treated as employer contributions. Currently, these payments are small, but were large in the period just after World War II. Employer contributions are from the VA financial reports [33]. Monthly seasonally-adjusted estimates are interpolations without indicator and, for the current estimates, judgmental extrapolations.
Workers' compensation The Federal Government pays workers' compensation benefits to Federal employees injured on the job. All estimates of workers' compensation contributions are imputations based on estimates of benefits discussed in the derivation of current expenditures. For further information, please see the section on (see p.57).Consumption Expenditures The contributions are employer contributions and are allocated judgmentally to general government and government enterprises; current allocations are extrapolations.
Military medical insurance The TRICARE Standard health care program (formerly known as CHAMPUS) provides medical treatment for dependents of active duty military personnel and for military retirees and their dependents. Benefits for dependents of active duty military personnel are comparable to health benefits provided for civilian employees and their families in the NIPAs and are, therefore, part of Federal employee compensation. In order to make the measure of military compensation comparable to that of civilian compensation, a social insurance contribution is imputed for the portion of this program that provides benefits for dependents of active duty personnel. Estimates of these

II—27 .
contributions are imputations based on estimates of benefits which are discussed in the derivation of current expenditures.
SELF-EMPLOYED CONTRIBUTIONS
Old-age, survivors, disability, and hospital insurance The SSA provides calendar-year estimates of taxable earnings from self-employment [16.2], and these estimates are multiplied by the OASDI & HI tax rates. The resulting estimates of contributions are allocated to the quarter of payment based on the following method. Beginning with 1966, the liability for each year is assumed to be paid as follows: Thirty percent in quarterly declarations, with equal payments made in April, June, and September of the tax year and in January of the following year; and 70 percent in final settlements in the following year, with 25 percent of the final settlements in the first quarter and 75 percent in the second quarter. Prior to 1966, when the form for estimated income tax payments did not include self-employed contributions, it was assumed that these liabilities were paid when income tax returns were filed in the year following the liability year.
Monthly seasonally-adjusted estimates are interpolations of calendar-year estimates without an indicator. The effects of changes in the tax rate and the maximum taxable earnings are estimated separately and added to the seasonally-adjusted estimates. Current monthly estimates are judgmental extrapolations, guided by budget projections.
INCOME RECEIPTS ON ASSETS
Income receipts on assets consist of interest receipts and of royalties from petroleum production on the Outer Continental Shelf; see table II-3.
INTEREST RECEIPTS
Interest receipts are composed of monetary and imputed interest received. Monetary interest received consists largely of interest on direct loans made by a large number of Federal agencies. Additionally, monetary interest receipts include proprietary interest received by various agencies and interest received on late income tax payments.
Monetary interest received from persons and business
Monetary interest received from persons and business consists of: Interest receipts on loans made by various Federal agencies to the public, such as the Department of Education student loans, the Department of Agriculture rural development loans, and the Department of Housing and Urban Development FHA loans; proprietary interest receipts by various agencies; and interest received on late taxes, mainly from corporations and individuals. Proprietary receipts are payments from the public derived from market-oriented or business-like activities. They include for example, interest, rents and royalties, sales of products, miscellaneous receipts, recoveries and refunds, and other.
Monetary interest received on loans and proprietary interest receipts are mainly derived from budget data as part of the fiscal- year analysis. The fiscal-year estimates are interpolated without an indicator to derive not-seasonally-adjusted quarters; quarterly estimates are summed to calendar-year estimates. Seasonally adjusted estimates are set equal to the not-seasonally-adjusted estimates.

II—28 .
Current quarterly estimates are judgmental extrapolations, guided by budget projections.
Fiscal-year estimates of monetary interest received on late taxes are obtained from the IRS [32.1]. The fiscal-year data are interpolated without an indicator to derive seasonally-adjusted quarters; quarterly estimates are summed to calendar-year estimates. Not seasonally-adjusted quarters are set equal to the seasonally-adjusted quarters. Current quarterly estimates are extrapolations guided by budget projections from the fiscal-year analysis.
Monetary interest received from Rest of World Monetary interest received from the rest of the world is estimated using data from ITA table 2, line 5, “Foreign Direct Investment in the United States: Reconciliation with International Transactions Accounts” [22.8]. These data consist of interest received by the U.S. Government and the Federal Reserve banks (FRB). Unpublished data on the Federal Reserve banks' portion is subtracted from the published total to derive the NIPA Federal Government estimates, because Regional Federal Reserve banks are classified as private corporations in the NIPAs. Not-seasonally-adjusted estimates are set equal to the seasonally-adjusted estimates.
For the current quarterly estimates, the advance and preliminary estimates are based on projections; ITA and FRB data are available for the final estimate.
Imputed interest received Imputed interest paid by financial intermediaries is received by persons from depository institutions, that is, from commercial banks, mutual savings banks, savings and loan associations, credit unions, and regulated investment companies. It is an estimate of the value of services (such as checking and record keeping) that these institutions provide to persons without an explicit charge. Estimates of imputed interest paid to the Federal Government are prepared as part of the estimates of imputed interest and associated service charges for the remaining sectors of the NIPAs. For the methodology used to prepare NIPA estimates of imputed interest received, see “Measuring the Services of Commercial Banks in the NIPAs: Changes in Concepts and Methods,” SCB, September 2003, pages 33-44 [22.5].
RENTS AND ROYALTIES
Outer Continental Shelf rents and royalties Data for Outer Continental Shelf royalties come from the Budget Appendix [3.2] and for royalties-in-kind from the Department of Energy, Strategic Petroleum Reserve (SPR)[25.3]. Fiscal-year totals from the budget are interpolated without indicator to derive quarterly not-seasonally-adjusted estimates. Quarterly not-seasonally-adjusted and calendar-year NIPA estimates for royalties-in-kind are the sum of the monthly estimates from the SPR. Quarterly seasonally-adjusted estimates are equal to the not-seasonally-adjusted estimates. Current quarterly estimates for royalties are judgmental extrapolations, guided by budget projections, and for quarterly royalties-in-kind are from the SPR.

II—29 .
CURRENT TRANSFER RECEIPTS
Table II-3, lists current transfer receipts from business and from persons as shown in NIPA table 3.7.
FROM BUSINESS
Deposit Insurance Premiums Fiscal-year estimates for deposit insurance are from the budget. Not-seasonally-adjusted quarters are prepared by dividing the fiscal-year estimate by four; calendar-years are then summed from the appropriate quarters. Seasonally adjusted quarterly estimates are set equal to the not-seasonally-adjusted estimates. Current quarterly estimates are extrapolated judgmentally, guided by budget projections.
Other Estimates of other current transfer receipts from business are from budget data, largely data on proprietary receipts (which, in the Budget, are offsets to outlays). Fiscal-year estimates based on budget proprietary receipts are derived from unpublished detail supporting the MTS [31.3]. Quarterly not-seasonally-adjusted estimates are summed to obtain calendar-year estimates. Quarterly seasonally-adjusted estimates are interpolations without an indicator; current quarterly estimates are judgmental extrapolations, guided by budget projections.
FROM PERSONS
Through 1982, current transfer receipts from persons consist of a wide variety of small payments from individuals to the Federal Government including passport and immigration fees, fines paid by persons, and migratory bird-hunting stamps. Estimates of other current transfer receipts from persons are from budget data, largely data on proprietary receipts. Fiscal-year estimates based on budget proprietary receipts are derived from unpublished detail supporting the MTS [31.3]. Quarterly not-seasonally-adjusted estimates are summed to obtain calendar-year estimates. Quarterly seasonally-adjusted estimates are interpolations without an indicator; current quarterly estimates are judgmental extrapolations, guided by budget projections.
Beginning with 1983 the definition of current transfer receipts from persons was expanded to include certain penalty tax receipts and certain excise tax receipts formally included in estimates of nonwithheld income taxes. These penalty tax receipts include collections from “Penalty Taxes on Qualified Retirement Plans” and from “Predetermined Estimated Tax Penalty” receipts as reported in IRS individual income tax data and in SOI [32.2]. Excise taxes paid on excess Individual Retirement Account (IRA) contributions and excise taxes paid by nonprofit institutions serving individuals—a tax on the income of such institutions—are also included in estimates of current transfer receipts from persons. Estimates for these excise taxes are based on collections reported in IRS excise tax data [32.2].

II—30 .
CURRENT SURPLUS OF GOVERNMENT ENTERPRISES
The current surplus of government enterprises is equal to current operating revenues and subsidies received from other levels of government less current operating expenses. Current operating expenses include consumption of fixed capital (CFC), but neither revenue nor expenses include interest. Table II-3, shows the level of detail at which current surpluses are estimated quarterly; annual data at this level of detail are shown in NIPA table 3.8.
For the Postal Service, and several electric utility enterprises, including the TVA, fiscal-year estimates are derived using agency financial reports [36, 17 respectively] as part of the fiscal-year analysis. For all other enterprises, fiscal-year estimates are derived from budget data as part of the fiscal-year analysis. For all enterprises, CFC is derived using BEA’s perpetual-inventory methodology.19
Current surpluses(+)/deficits(-) are seasonally adjusted at the level of detail shown in table II-1. For the Postal Service, the calendar-year estimate—except pay raises, postal rate increases and CFC—is interpolated into quarters without indicator; pay raises and postal rate increases are added to the seasonally-adjusted estimates, while CFC is subtracted. The current surplus/deficit of all other government enterprises—excluding CFC—is also interpolated without indicator. Current quarterly estimates of all current surpluses or deficits are judgmental extrapolations, guided by budget projections.
The list of current Federal enterprises below has changed over time for various reasons. For example, The United States Enrichment Corporation (USEC) is classified as an enterprise from the third quarter of 1993, when the Department of Energy’s (DOE) uranium enrichment activities were transferred to the USEC, until the third quarter of 1998, when ownership was transferred to the private sector by means of an initial public offering.20
Currently, there are 15 Federal Government enterprises.
• U.S. Postal Service
Electric power enterprises:
• Bonneville Power
• Department of Energy Colorado River Basin
• Department of Interior Colorado River Basin
• Southeastern Power
19 For more on BEA’s perpetual inventory method and CFC, see Paul R. Lally, “Fixed Assets and Consumer Durable Goods for 1993-2003,” Survey of Current Business 84 (September 2004); 23-37; Paul R. Lally, “Fixed Assets and Consumer Durable Goods for 1925-2001,” Survey Of Current Business 82 (September 2002); 23-37; Shelby W. Herman, "Fixed Assets and Consumer Durable Goods," Survey of Current Business 80 (April 2000); 17-30; Barbara M. Fraumeni, “The Measurement of Depreciation in the U.S. National Income and Product Accounts,” Survey of Current Business 77 (July 1997); 7-23; Arnold J. Katz and Shelby W. Herman, “Improved Estimates of Fixed Reproducible Tangible Wealth, 1929-95,” Survey of Current Business 77 (May 1997); 69-92.
20 For more information see “Business Situation,” Survey of Current Business 78 (November 1998); 1-5.
II—31 .
• Southwestern Power
• Tennessee Valley Authority
• Upper Colorado River Storage
Insurance enterprises:
• Federal Crop Insurance Company
• Federal Housing Administration
• National Flood Insurance
• Overseas Private Investment Corporation
All other enterprises:
• Government Printing Office Sales
• Military Post Exchanges and Restaurants
• Veterans Canteen Service
CAPITAL TRANSFER RECEIPTS As mentioned in Part I of this publication, certain government transactions are classified as capital transfers and are excluded from current receipts and current expenditures. However, these transactions are estimated within the government sector. This section provides the methodology for estimating Federal capital transfers receipts.
ESTATE AND GIFT TAXES
Gross estate and gift taxes (including interest on late taxes) are from the MTS [31.3]. An estimate of interest on late taxes is derived from IRS tabulations of assessment certificates issued [32.3]; fiscal-year estimates from these tabulations are interpolated without an indicator to obtain quarters. These interest estimates are subtracted from the MTS data to derive quarterly not-seasonally-adjusted estimates of NIPA gross estate and gift taxes, which are summed to obtain calendar-years. Estate and gift tax refunds are from the MTS [31.3].
The gross receipts and refunds are seasonally adjusted separately using the Census Bureau’s seasonal adjustment program. The effects of tax law changes are reflected outside of the seasonal-adjustment process.
For current quarterly estimates, advance estimates are usually based on three months of data from the MTS [31.3]
II—32 .
4. DERIVATION OF EXPENDITURES
The NIPA Federal current expenditures and gross investment categories are derived from budget data supplemented by information from Federal agencies. These data are adjusted for coverage and for netting and grossing differences, as shown in NIPA table 3.18, to place them on a basis consistent with NIPA concepts. The sources and methods used to derive NIPA estimates of current expenditures and gross investment yield the required timing basis; the timing difference shown in table 3.18 is calculated as budget outlays less NIPA current expenditures and gross investment. Table II-4, shows the sources of Federal Government estimates of current expenditures. In general, the level of detail shown is that at which the estimates are prepared; where footnoted, the level of detail has been aggregated to an "other" or "all other" category because the methodology is the same for the detailed underlying series.
CONSUMPTION EXPENDITURES
Federal Government consumption expenditures are comprised of compensation, CFC, and intermediate goods and services purchased. These components are measured by the cost of their inputs. The government provides non-market services to the general public that are recorded as government consumption expenditures.
Government consumption expenditures are equal to general government gross output less own-account investment and sales to other sectors. The conceptual framework of the services produced by government and of the goods and services purchased by government parallels the concepts of output and intermediate inputs of private business in BEA’s I-O accounts and the GDP-by-industry accounts.
The change in inventories for a few government categories for which data are available, specifically the Commodity Credit Corporation (CCC) and the Strategic Petroleum Reserve (SPR), is also treated as government consumption expenditures.
Estimates for consumption expenditures are derived in conjunction with the estimates for gross investment. Federal Government consumption expenditures and gross investment are estimated for two major categories: National defense and nondefense. The national defense category consists of the consumption expenditures and gross investment for the activities covered by the national defense function in the budget—military activities of the Department of Defense (DOD), defense-related atomic energy activities of the Department of Energy, and defense-related activities of other agencies. Nondefense consists of the consumption expenditures and gross investment for all other activities in the budget. Consumption expenditures and gross investment for each category are also estimated by type of purchase: compensation of general government employees, general government consumption of fixed capital, durable goods, nondurable goods, services, and gross investment of structures and equipment and software.
Seasonally adjusted estimates are sometimes set equal to not- seasonally-adjusted estimates. This occurs for various reasons, including the inability of an estimate to pass the seasonal test of the Census Bureau’s seasonal adjustment program or the undesirability of losing the seasonal impact of the estimate due to legislative changes, such as pay raises.

II—33 .
This section provides a detailed analysis of the sources and methods used to estimate consumption expenditures and gross investment, following the outline of NIPA tables 3.11.x for defense and 3.10.x for nondefense.
NATIONAL DEFENSE CONSUMPTION EXPENDITURES AND GROSS INVESTMENT
Total estimates of national defense consumption expenditures and gross investment are derived from budget outlays as part of the fiscal-year analysis. Outlays are adjusted for timing, coverage, and other differences, as shown in NIPA table 3.18, to put them on a basis that is consistent with the NIPA definition of consumption expenditures and gross investment. (Table II-5 lists the sources and methods for deriving national defense consumption expenditures and gross investment.)
Within the budget-based control total, estimates of national defense consumption expenditures and gross investment by type, except compensation of employees, are prepared using one of three methods and summed to the level of detail that is published in NIPA tables 3.11.x (Appendix II provides definitions of the components at this level of detail).21 The three methods are the direct-pricing method, the ratio method, and the directly-estimated method using budget outlays.
DIRECT-PRICING METHOD
When data are available, the estimates are prepared as the product of a delivered quantity and a price paid. This method, referred to in table II-5 as the "direct-pricing" method, is preferred because it allows the development of corresponding chained-dollar measures using the delivered quantity—the same as used with current-dollar estimates—with the reference-year price. Data to implement the method for a variety of goods and for some services are available from the DOD. Two sources of price and quantity data are widely used:
• Committee Staff Procurement Backup Books (CSPBB) or “budget exhibits”, or, when available, contract control documentation reports: Data on prices paid by DOD for components of major weapons systems are available in “budget exhibits” [4]. For example, CSPBB, Aircraft Procurement, Air Force [4.1] provides prices for aircraft procurement by the Air Force.
• Production Control Reports, commonly referred to as delivery reports: Data on the quantities of major components delivered to DOD are available for weapons systems from program offices [15]. These data are reported by month and are generally available for the final quarterly estimate.
An example of the direct-pricing method is the derivation of the F-15 aircraft estimates. The F-15 aircraft is usually purchased by DOD as component parts. The components—such as engines, airframes, guns, and various electronic subsystems—are supplied as government-furnished equipment to the airframe contractor who performs the final integration and assembly. Quarterly estimates of the value of component parts are obtained by multiplying the quantity delivered to DOD 21 Prior to 1972, a breakdown of national defense consumption expenditures and gross investment by type was not available. Many of the source data for the breakdown were identified in a major project undertaken by BEA with DOD [45].

II—34 .
by the price paid by DOD. The estimates for each component, including integration and assembly, are summed. For most components of major weapons systems, data on quantities delivered to DOD are available in production control reports [15], and data on prices paid by DOD are available in “budget exhibits” and contract control documentation reports [4].
RATIO METHOD
When data on prices and quantities are not available, current-dollar estimates of consumption expenditures and gross investment of most components are derived from DOD financial reports (see below), using the "ratio" method.
• Financial Reports : Detailed data on disbursements (and in some cases, obligations) are available as part of the DOD financial report series [6]. The disbursements data are reported monthly by each DOD agency (DD COMP (M) 1002): For example, the Air Force reports final transactions in Appropriation Status by Fiscal-year Program and Subaccounts [6.2]; these reports are generally available by the time of the final quarterly estimate.
Continuing with the derivation of the F-15 aircraft estimate, an example of the ratio method is as follows: Delivery schedules or prices are not available for some of the aircraft components, parts, equipment, and associated items. Estimates of current-dollar consumption expenditures and gross investment for these items are derived indirectly using the ratio method. The ratio method creates an indirect factor by calculating the ratio of the funds for a major weapons system that are not directly priced to total funds available to be spent for that weapons system. The ratio is derived using data from financial reports [6.2, 6.9, 6.11]. The indirect factor is applied to quarterly disbursements from financial reports [6.2, 6.3, 6.5, 6.6, 6.11, 6.12] to derive estimates of consumption expenditures and gross investment for aircraft components, parts, equipment and associated items.
DIRECTLY-ESTIMATED METHOD
For other consumption expenditures and gross investment, the directly-estimated method is used to estimate quarters and calendar-years. In addition to budget outlays [3.2], two sets of DOD reports are used widely in implementing this method:
• Financial Reports: See earlier discussion under the Ratio method Financial Reports: See earlier discussion under the Ratio method. See section on Aircraft consumption expenditures and gross investment estimated by ratio method under the section on Equipment and Software.
• .
• Contract Awards : Data on contract awards by four-digit Federal Supply Classification are available in several reports [5]. For example, Department of Defense Prime Contract Awards [5.2] contains data on type-of-service purchases for some service subcategories, such as education services. Contract awards are published on a fiscal-year basis and are generally available by the first annual revision following the end of the fiscal-year.
The directly-estimated method is based on a work put-in-place basis rather than on a delivery basis.
II—35 .
Specifically, disbursements correspond closely to work done in a given quarter. Quarterly data on disbursements are available from financial reports. When quarterly data are not available, annual contract awards are used. Quarterly not-seasonally-adjusted data are used as the seasonally-adjusted estimates and are summed to the calendar-year estimates.
The advance quarterly estimate is an extrapolation using two months of MTS outlays as the indicator. Financial report disbursements data are used as they become available, generally by the final estimate.
CONSUMPTION EXPENDITURES
GROSS OUTPUT OF GENERAL GOVERNMENT
Value added COMPENSATION OF GENERAL GOVERNMENT EMPLOYEES
MILITARY
Compensation for active duty military personnel and for reserve personnel is estimated as the sum of two components: Wages and salaries, and supplements to wages and salaries. Coast Guard compensation is estimated as part of military compensation and is then removed from national defense and added to nondefense. Reimbursable military compensation—primarily military officers providing training to foreign air forces and armies—is estimated as part of military compensation and is then offset in sales to other sectors.
Wages and salaries
Fiscal-year estimates of wages and salaries for active duty and reserve personnel are derived from budget data [3.2, 4.15, and 7.2, 7.3, 7.5, 7.7, 7.8], generally by the time of the first annual revision. They include cash wages and salaries plus in-kind compensation, including uniform allowances, housing allowances, and rations-in-kind. Monthly estimates for cash wages and salaries and for in-kind compensation are interpolations of the fiscal-year estimates using monthly not-seasonally-adjusted estimates on the number of personnel [7.6] as the indicator for active duty personnel and using judgmental estimates of reserve wages and salaries as the indicator for reserve personnel. The estimates are then adjusted for pay raises.
Supplements to wages and salaries
Supplements to military wages and salaries consists of the following employer contributions for government social insurance: Old-age, survivors, hospital, and disability insurance; veterans life insurance; workers' compensation; and military medical insurance for dependents of active duty military personnel. A description of the methodology used to estimate these employer contributions is discussed in the “Contributions for government social insurance” (p.19) section of the derivation of receipts.
Employer contributions for employee pension and insurance funds for military personnel consists of military retirement and, beginning in 2002, the Thrift Savings Plan. Annual estimates are based largely on data from the Thrift Savings Oversight Board [18]. Monthly seasonally-adjusted estimates are interpolations using the number of military personnel as an indicator [7.6], with an allowance for
II—36 .
rate changes or other special factors.
CIVILIAN
Compensation for general government civilian employees is estimated as the sum of two components: Wages and salaries, and supplements to wages and salaries.
Wages and salaries
Calendar-year estimates of civilian wages and salaries are primarily from the Office of Personnel Management (OPM) [7.19]; generally these data are available by the time of the first annual revision. They include cash wages and salaries plus in-kind compensation, specifically mass transit benefits, beginning in 1998. Monthly seasonally-adjusted estimates for cash wages and salaries are interpolations using BLS employment as an indicator; the effect of pay raises is added after the interpolation process. Calendar-year estimates for mass transit benefits are based on Department of Transportation (DOT) data. Monthly estimates for mass transit benefits are interpolations of the CY estimates using employment as the indicator.
Current monthly estimates of Federal civilian wages and salaries are interpolations using BLS employment as an indicator, adjusted for pay raises. Quarterly estimates are allocated to national defense and nondefense consumption expenditures using estimates of full- and part-time employment from OPM [7.17, 7.18] as the interpolators combined with unemployment insurance data.
Supplements to wages and salaries
Supplements to civilian wages and salaries consist of employer contributions for government social insurance and employer contributions for employee pension and insurance funds. Employer contributions for government social insurance consist of the following: Old-age, survivors, disability, and hospital insurance; UI; and workers' compensation. A description of the methodology used to estimate these employer contributions is discussed in the “Contributions for social insurance” (p.19) section of the derivation of receipts. Employer contributions are allocated to national defense and nondefense consumption expenditures in proportion to wages and salaries.
Employer contributions for employee pension and insurance funds consist of the following: Health insurance, life insurance, retirement, and the Thrift Savings Plan. Annual estimates are based largely on data from the Thrift Savings Oversight Board [18]. Monthly seasonally-adjusted estimates are interpolations using employment as an indicator, with allowance for rate changes or other special factors. Other civilian supplements are allocated to national defense and nondefense purchases in direct proportion to wages and salaries.
General government consumption of fixed capital
Estimates of current-dollar general government CFC are derived by multiplying the constant-dollar estimates by the appropriate price indexes. The CFC current-dollar estimates are prepared using this procedure for over 50 types of structures and equipment. Please see the section on Consumption of
II—37 .
Fixed Capital (CFC) in Part I of the Methodology Paper for additional information.
Intermediate goods and services purchased Federal defense intermediate goods and services purchased comprise the durable goods, nondurable goods, and services purchased and consumed in order to produce national defense services—that is, defense output. The following section provides the sources and methods used to estimate the constituent parts of Federal defense intermediate goods.
DURABLE GOODS
Intermediate durable goods are primarily parts for aircraft, missiles, ships, vehicles, electronics, and software. The methodology for these intermediate durable goods is explained along with the systems, which are classified as investment, in the section on “Gross Investment” below.
OTHER DURABLE GOODS
Estimates of intermediate purchases for other durable goods—primarily parts, pumps, hand tools and other miscellaneous goods are directly estimated. Generally, quarterly data on disbursements for most other durable goods are available in financial reports [6.3, 6.6, 6.4, 6.7, 6.10, 6.12]. Quarterly not-seasonally-adjusted data are used as the seasonally-adjusted estimates. Quarterly estimates are summed to calendar-year estimates. The advance quarterly estimates are judgmental extrapolations; financial report disbursements data are incorporated as they become available, generally by the final estimate.
NONDURABLE GOODS
PETROLEUM PRODUCTS
Most quarterly not-seasonally-adjusted estimates of intermediate purchases for petroleum are based on the direct-pricing method, using the number of gallons delivered and prices paid per gallon from invoices summarized in monthly petroleum product reports [14]; the remaining estimates of consumption expenditures on petroleum products are prepared judgmentally using the difference between the previous fiscal-year’s annual petroleum product reports and the sum of estimates derived from the previous fiscal-year’s monthly reports. Quarterly not-seasonally-adjusted estimates are summed to calendar-year estimates. Quarterly seasonally-adjusted estimates are prepared using the Census Bureau’s seasonal adjustment program.
For advance quarterly estimates, monthly reports for all three months are usually available. When the reports are not available, quantities delivered and prices paid are judgmental extrapolations. For the preliminary and final estimates, all monthly reports are available.
AMMUNITION
Estimates of ammunition are directly estimated using financial report quarterly disbursements data [6.2, 6.3, 6.5, 6.6, 6.11, 6.12]. Quarterly not-seasonally-adjusted estimates are used as the seasonally-

II—38 .
adjusted estimates. Quarterly estimates are summed to calendar-year totals. Disbursements data from financial reports are usually available for the advance quarterly estimate.
OTHER NONDURABLE GOODS
Estimates of intermediate purchases for other nondurable goods—such as food, drugs, and clothing—are directly estimated. Except for printing, quarterly data on disbursements for other nondurable goods are in financial reports [6.3, 6.6, 6.12]. Quarterly estimates are summed to calendar-year estimates. The quarterly estimates are seasonally adjusted using the Census Bureau’s seasonal adjustment program. Advance quarterly estimates are judgmental extrapolations.. financial report disbursements data are incorporated as they become available, generally by the final estimate. Calendar-year estimates of printing intermediate purchases are based on annual contract awards data [5.2], which are available by the first annual revision. Quarterly seasonally-adjusted estimates of printing purchases are interpolations without an indicator and, for the current estimates, judgmental extrapolations.
SERVICES
RESEARCH AND DEVELOPMENT
Formerly, price and quantity data for contractual research and development (R&D) were obtained from a sample of R&D companies and were based on the direct-pricing method. Since 1995, annual and quarterly estimates are directly estimated using MTS outlays [31.3]. The data are adjusted to exclude grants-in-aid for research, which are not defined to be government consumption expenditures in the NIPAs. BEA-derived current expenditures on R&D performed by DOD is already reported in the NIPAs as consumption expenditures for employee compensation, equipment, materials, etc.; it is excluded from MTS outlays based on data from the National Science Foundation [10, 11]. Quarterly data are summed to create annual estimates.
Current quarterly estimate are based on three months of detailed MTS outlays.
INSTALLATION SUPPORT
Estimates of consumption expenditures for installation support services are directly estimated and are prepared for 12 subcategories including electricity, natural gas, telephone, postage, housekeeping, water, sewage and steam, communication, rent of property, contractor-operated facilities, and maintenance of real property and equipment. Quarterly current expenditures for postage are available from the U.S. Postal Service [36.2] and for communications services from DOD's Communication Services Industrial Fund. Fiscal-year data on Department of Defense energy consumption and costs are received from McNeil Technologies, which provides data on electricity, natural gas, steam, water, and sewage by agency and for total government. McNeil Technologies distributes data produced by the Department of Energy's Federal Energy Management Program . Each governmental agency is required by Congress to submit energy-use data to the energy management program; these data are compiled into the Annual Report on Federal Energy Management and Conservation Programs [8].
Fiscal-year CAs data [5.2] are available for property maintenance, equipment maintenance,
II—39 .
housekeeping services, and other types of support services. Not-seasonally-adjusted quarterly estimates are summed to the calendar-year estimates. Seasonally adjusted estimates for other installation support consumption expenditures are interpolations without an indicator. Current quarterly estimates are judgmental extrapolations.
WEAPONS SUPPORT
Estimates of consumption expenditures for weapons support services are directly estimated and are prepared for 12 subcategories of depot service and maintenance for new weapons systems. Not-seasonally-adjusted quarterly estimates of services for new weapons systems are derived as a percentage of disbursements for each major weapons system from financial report data [6.2, 6.3, 6.5, 6.6, 6.11, 6.12].22 Quarterly estimates are summed to the calendar-year estimates and are seasonally adjusted using the Census Bureau’s seasonal adjustment program. Fiscal-year estimates for depot maintenance services are based on contract awards data [5.2] and financial report disbursements data [6.7]; quarterly seasonally-adjusted estimates are interpolations without an indicator.
Advance and preliminary quarterly estimates are judgmental extrapolations. Financial report disbursements data are incorporated as they become available, generally by the final estimate.
PERSONNEL SUPPORT
Estimates of consumption expenditures for personnel support services are directly estimated and are prepared for three subcategories—direct hire of foreign nationals, training and education, and consulting. Not-seasonally-adjusted quarterly estimates for direct hire of foreign nationals are available from a survey conducted by DOD for BEA's ITAs; quarterly estimates are summed to calendar-year estimates and quarterly seasonally-adjusted estimates are set equal to the not-seasonally-adjusted estimates. Estimates of consumption expenditures for training and education services and for consulting are based on fiscal-year contract awards data [5.2]; quarterly seasonally-adjusted estimates are interpolations without an indicator.
Advance quarterly estimates are generally judgmental extrapolations. ITA data on the hiring of foreign nationals outside of the United States are incorporated as they become available, generally by the final estimate.
TRANSPORTATION OF MATERIAL
Since 1994, fiscal-year estimates of consumption expenditures for transportation of material are derived from budget data. Seasonally-adjusted quarterly estimates are interpolations of fiscal-year estimates without an indicator; calendar-year estimates are prepared by summing the quarters. Not-seasonally-adjusted quarters are set equal to the seasonally-adjusted quarterly estimates.
Prior to 1994, fiscal-year estimates of consumption expenditures for transportation of material are directly estimated. Quarterly data on disbursements are available in various reports from the Military Sealift Command [19.6], the Military Surface Deployment and Distribution Command [19.4, 19.2, 19.3, 19.5] the Air Mobility Command [19.1], and the Navy Material Transportation Office [19.7]. 22 The disbursement percentages are derived during the annual revision.

II—40 .
Quarterly obligations, which are assumed to equal disbursements, incurred by other DOD agencies with responsibility for the transportation of material, are available in financial reports [6]. Not-seasonally-adjusted quarterly estimates are summed to the calendar-year estimates and are seasonally adjusted using the Census Bureau’s program.
Current quarterly estimates are judgmental extrapolations, guided by budget obligations.
TRAVEL OF PERSONS
Since 1994, fiscal-year estimates of consumption expenditures for travel of persons are derived from budget data. Seasonally-adjusted quarterly estimates are interpolations of fiscal-year estimates without an indicator; calendar-years are summed from the quarters. Not seasonally-adjusted quarters are set equal to the seasonally-adjusted quarterly estimates.
Prior to 1994, estimates of consumption expenditures for travel of persons are directly estimated. Quarterly data on disbursements are available in various reports from the Military Surface Deployment and Distribution Command [19.4, 19.2, 19.3, 19.5] and the Air Mobility Command [19.1]. Quarterly obligations, which are assumed to equal disbursements, incurred by other DOD agencies with responsibilities for the travel of persons, are available in financial reports [6]. Not-seasonally-adjusted estimates are used as the seasonally-adjusted estimates, and quarterly estimates are summed to calendar-year totals.
Current quarterly estimates are judgmental extrapolations, guided by budget obligations.
OWN-ACCOUNT INVESTMENT
Own-account investment is investment in structures and in software produced by Federal government employees. Estimates of own-account investment are included in general government gross output, but they are subtracted from gross output to derive estimates of general government consumption expenditures. Own-account investment is measured as the sum of compensation for employees engaged in construction and in the development of new software, together with the value of expenditures for the related goods and services required to produce the structures and software. Estimates of Federal defense and nondefense own-account investment are included in Federal gross investment (structures and equipment and software).
Estimates of own-account spending on goods and services are identified for construction and are based on Census Bureau monthly VPIP data. The data are judgmentally allocated between defense and nondefense and are then split into durable goods , nondurable goods, and services , based on BEA’s I-O commodity breakdowns. The defense portion of Federal own-account investment in structures is assigned to investment in “Military facilities,” while the nondefense portion is assigned to investment in “Conservation and development” (see NIPA table 5.8.x).
Federal Government own-account software investment is measured as the sum of production costs, which include employee compensation–both wage and nonwage–and the costs of intermediate inputs. These estimates are based on the numbers of programmers and computer systems analysts employed by the Federal Government and engaged in the production of non-embedded software or software produced for sale. The estimates are multiplied by a factor of 0.5 to account for the share of programmers' and computer systems analysts' time that is estimated to be spent performing tasks associated with new investment rather than such activities as minor revisions and upgrades and maintenance. The adjusted number of programmers and computer systems analysts are multiplied by

II—41 .
mean wage rates for these occupations as well as by factors that transform wages into full production costs – wages and intermediate inputs such as supplies, depreciation of physical capital, and management and support costs–to obtain own-account software investment for Federal Government. A portion of Federal own-account investment in software is allocated to the defense subsector based on the ratio of computer programmers and systems analysts in DOD to those in total Federal Government. Quarterly estimates are extrapolations using a lagged three-quarter moving average of Federal Government investment in computers and peripheral equipment as the indicator. Current quarterly estimates are judgmental extrapolations.
SALES TO OTHER SECTORS Defense sales of goods and services to other sectors include sales of training services and sales of defense goods and services to foreign governments under the foreign military sales program. Defense sales to other sectors are excluded from government consumption expenditures. Separate estimates of sales by type are not available.
Estimates of sales to other sectors are directly estimated using MTS outlays [31.3]. Not-seasonally-adjusted estimates are used as the seasonally-adjusted estimates, and quarterly estimates are summed to calendar-year totals. Advance quarterly estimates are extrapolations using two months of MTS outlays [31.3] as the indicator. MTS outlays are supplemented with data from defense financial reports [6]. GROSS INVESTMENT
In the NIPAs, gross government investment is defined as the total investment in government fixed assets—that is, the structures, equipment, and software that are used to facilitate the production of defense services. The NIPA estimates of investment in structures reflect the Census Bureau classification of the value of construction put in place. Beginning with 1997, structures are classified by their function instead of by their type.
The following sections describe the sources and methods used to prepare these estimates and are consistent with the outlines of NIPA table family 3.11.x.
STRUCTURES
Military facilities
Estimates of gross investment for military facilities, such as troop housing and aircraft hangars, are recorded in the NIPAs on a value-put-in-place basis using direct estimation methods.23 A value for own-account construction is added to military facilities to account for construction work performed by DOD personnel based on judgmental allocation. Data on quarterly disbursements for gross investment are available in financial reports [6.2, 6.3, 6.5, 6.6, 6.11, 6.12]. Not-seasonally-adjusted estimates are used as the seasonally-adjusted estimates, and quarterly estimates are summed to calendar-year estimates.
23 For pre-1993 estimates, some military facilities were estimated using the direct-pricing method. For the directly-priced gross investment, data on the number of square feet and cost per square foot of construction projects (as well as length of construction period) were available from construction project reports (CPRs) [5] submitted by contractors at the beginning and end of each contract.
II—42 .
Advance quarterly estimates are extrapolations using two months of MTS outlays [31.3] as the indicator. Disbursements data from financial report are incorporated as they become available, generally by the final estimate.
Other structures Estimates of gross investment for other structures, which include family housing and nuclear weapon factories, are recorded in the NIPAs on a value put-in-place basis using the directly- estimated method. Quarterly disbursements for family housing are available from financial reports [6], and VPIP data for other structures are available from the Census Bureau Current Construction Reports [21.1]. Not-seasonally-adjusted quarterly estimates are summed to calendar-year estimates and are seasonally adjusted using the Census Bureau’s seasonal adjustment program.
Advance quarterly estimates for family housing are extrapolations using two months of MTS outlays as the indicator [31.3]; financial report disbursements data are incorporated as they become available, generally by the final estimate. Advance estimates for other structures are extrapolations using two months of VPIP data as the indicator; three months of VPIP data are available for the preliminary and final estimates.
EQUIPMENT AND SOFTWARE
Aircraft Most of the estimates of gross investment in aircraft are prepared using the direct-pricing method; however, a portion of the estimates for aircraft are also derived using the ratio method. The difference between the quarterly BEA-derived estimates of consumption expenditures and gross investment based on the two methods and total MTS outlays [31.3] for aircraft is a timing adjustment.
Aircraft gross investment and intermediate purchases estimated by direct-pricing method. An aircraft system, such as the F-15, is usually purchased by DOD as component parts. The components—such as engines, airframes, guns, and various electronic subsystems—are supplied as government-furnished equipment to the airframe contractor who performs the final integration and assembly. Quarterly estimates of the value of component parts are obtained by multiplying the quantity delivered to DOD by the price paid by DOD. The estimates for each component, including integration and assembly, are summed. For most components of major weapons systems, data on quantities delivered to DOD are available in production control reports [15.1, 15.2], and data on prices paid by DOD are available in “budget exhibits” or contract control documentation reports [4.1, 4.4, 4.8]. Quarterly not-seasonally-adjusted estimates are used as the seasonally-adjusted estimates. Quarterly estimates are summed to calendar-year estimates.
For advance quarterly estimates, quantities delivered and prices paid are based largely on scheduled deliveries and prices from unpublished “budget exhibit” data. Price data from production control reports and contract control documentation reports are incorporated into the estimates as they become available. If production control reports or contract control documentation reports are not available, the appropriate DOD offices are contacted to determine if there are known changes to scheduled deliveries or prices.
Aircraft consumption expenditures and gross investment estimated by ratio method. Delivery schedules or prices are not available for some aircraft components, parts, equipment, and associated

II—43 .
items. Estimates of current-dollar consumption expenditures and gross investment for these items are derived indirectly using the ratio method. The ratio method creates an indirect factor by calculating the ratio of the funds within a major weapons system that are not based on the direct-pricing method to the total funds available to be spent for that weapons system. The ratio is derived using data from financial reports [6.2, 6.5, 6.11] for major aircraft systems, such as for Air Force combat aircraft. The indirect factor is applied to quarterly disbursements from financial reports [6.2, 6.3, 6.5, 6.6, 6.11, 6.12] to derive estimates of consumption expenditures and gross investment for aircraft components, parts, equipment and associated items. Quarterly not-seasonally-adjusted estimates are used as the seasonally-adjusted estimates. Quarterly estimates are summed to calendar-year estimates.
For advance quarterly estimates, the indirect factors are judgmental and are applied to quarterly estimates based on three months of outlays from the MTS [31.3]; for the final estimates, the indirect factors are applied to quarterly disbursements from financial reports. More refined estimates of the indirect factors are made as data on the directly-priced gross investment and intermediate purchases and total obligated funds become established.
Missiles Some portions of estimates of gross investment and intermediate purchases for missiles are derived using the direct-pricing method, using quantity data from production control reports [15.4] and price data from “budget exhibits” or contract control documentation reports [4.2, 4.5, 4.13, 4.14, 4.12], and using the ratio method based on disbursements from financial reports [6.2, 6.3, 6.5, 6.6, 6.11, 6.12]. Quarterly not-seasonally-adjusted estimates are used as the seasonally-adjusted estimates. Quarterly estimates are summed to calendar-year estimates. The difference between the BEA-derived estimates of gross investment and intermediate purchases for missiles and total MTS outlays [31.3] for missiles in the quarter is the timing adjustment.
Current quarterly estimates of missiles are prepared in the same manner as for aircraft using scheduled deliveries and prices from unpublished “budget exhibit” data or contract control documentation reports.
Ships The estimates for gross investment and intermediate purchases are directly estimated and are prepared for a number of ship categories, and then further divided into components, based on unpublished data underlying the budget. The value of exported ships is subtracted from the estimates of total ship gross investment and intermediate purchases; estimates for exported ships are based on BEA’s ITA data [22.8].
Estimates of gross investment and intermediate purchases for ships are derived from MTS outlays data [31.3]. Current quarterly estimates are based on three months of MTS outlays [31.3].
Vehicles A portion of the estimates of gross investment and intermediate purchases for vehicles are derived using the direct-pricing method, based on quantity data from production control reports [15.3, 15.5]
II—44 .
and price data from “budget exhibits” or contract control documentation reports [4.3, 4.6, 4.7, 4.9, 4.10, 4.11]; and a portion of the estimate is derived using the ratio method based on disbursements data from financial reports [6.2, 6.3, 6.5, 6.6, 6.11, 6.12]. For noncombat vehicles, the estimates are directly estimated from financial reports. Quarterly not-seasonally-adjusted estimates are used as the seasonally-adjusted estimates. Quarterly estimates are summed to calendar-year estimates. The difference between the BEA derived estimates of gross investment and intermediate purchases and total MTS outlays [31.3] for vehicles in the quarter is the timing adjustment.
Current quarterly estimates of vehicles are prepared in the same manner as for aircraft, using scheduled deliveries and prices from unpublished “budget exhibit” data or contract control documentation reports.
Electronics and software Estimates of gross investment and intermediate purchases of electronic equipment and software, such as radio sets and radar systems that are not initially installed as components of a major weapons system, are directly estimated. Quarterly disbursements data are available from financial reports [6.2, 6.3, 6.5, 6.6, 6.11, 6.12]. Quarterly not-seasonally-adjusted estimates are used as the seasonally-adjusted estimates. Quarterly estimates are summed to calendar-year estimates. Advance quarterly estimates are extrapolations using two months of MTS outlays [31.3] as the indicator; financial reports disbursements data are incorporated as they become available, generally by the final estimate.
Annual data for defense computers are from the DOD Prime Contracts Awards [5.2]. Quarterly estimates are derived by allocating a portion of quarterly Federal purchases of computers, also available from the GSA, using a ratio developed from the annual relationship between defense and total Federal purchases of computers. The not-seasonally-adjusted quarterly data for defense computers are seasonally adjusted using the Census Bureau’s seasonal adjustment program. Current quarterly estimates are extrapolated from quarterly GSA data on purchases of computers by allocating a portion to defense using a ratio extrapolated from the annual revision.
Annual estimates of prepackaged and custom software for 1985 forward are derived from the Census Bureau’s Services Annual Survey, BEA’s I-O accounts, and other sources.24 A portion of the total Federal purchases of prepackaged and custom software is allocated to defense by the relationship between unpublished fiscal-year contract award data for DOD to total purchases by the Federal Government. Quarterly seasonally-adjusted estimates for prepackaged software are interpolated and extrapolated using receipts data from company reports to the Securities and Exchange Commission (SEC) and data on monthly sales of business software from a trade source. The estimates of custom software are interpolated and extrapolated using the SEC data.
24 Sources other than the Census Service Annual Survey were used in developing the annual estimates of purchases prior to 1985. For more on BEA’s sources and methods for estimating software, see Bruce Grimm and Robert Parker, “Recognition of Business and Government Expenditures for Software Investment: Methodology and Quantitative Impacts, 1959-1998,” www.bea.gov/bea/mp.htm (May 2000).

II—45 .
Other equipment Most of the estimates of gross investment of other equipment, such as portable pontoon bridges and other military-specific items that are not initially installed as components of a weapons system, are directly estimated from financial reports. Quarterly data on disbursements are available from financial reports [6.2, 6.3, 6.5, 6.6, 6.11, 6.12]. Quarterly not-seasonally-adjusted estimates are used as the seasonally-adjusted estimates. Quarterly estimates are summed to calendar-year estimates. Advance quarterly estimates are extrapolations using two months of MTS outlays [31.3] as the indicator. Financial report disbursements data are incorporated as they become available, generally by the final estimate.
NONDEFENSE CONSUMPTION EXPENDITURES AND GROSS INVESTMENT
Estimates of nondefense consumption expenditures and gross investment are derived by program from budget outlays as a part of the fiscal-year analysis described earlier. For most programs, estimates of nondefense consumption expenditures and gross investment are derived as a residual after identifying all other types of current expenditures. Quarterly not-seasonally-adjusted estimates are then derived on the basis of the fiscal-year analysis; i.e., the fiscal-year relationship between types of expenditures and total expenditures for a program is used to prorate quarterly budget outlays for that program as published in the MTS [31.3]. The sum of the residual expenditures by program accounts for the majority of nondefense consumption expenditures and gross investment; a description of the procedure for the inventory change of the CCC, an exception to this method, follows. Quarterly not-seasonally-adjusted estimates of nondefense consumption expenditures and gross investment are summed to produce calendar-year estimates.
Estimates of nondefense consumption expenditures and gross investment, other than for CCC inventory change, are seasonally adjusted. Estimates of consumption expenditures and gross investment for the SPR and a few other programs show no seasonality; for these estimates, not-seasonally-adjusted estimates are used as the seasonally-adjusted estimates. For estimates that show seasonality, the Census Bureau’s seasonal adjustment program is used.
Current quarterly estimates of nondefense consumption expenditures and gross investment, other than CCC inventory change, are based on agency data and on extrapolations based on the fiscal-year analysis.
Annual and quarterly seasonally-adjusted estimates of nondefense consumption expenditures and gross investment, other than for CCC inventory change, are allocated to types of expenditures—compensation of general government employees, durable goods, nondurable goods, services, structures, and equipment and software based on actual source data or on residual allocations. An estimate is made for general government consumption of fixed capital and is added to those estimates derived from the MTS [31.3]. Allocations to durable goods, nondurable goods, services, and equipment are made after estimates that are based on actual source data are removed. This allocation is an essential step in the preparation of real estimates of nondefense consumption expenditures and gross investment, which will be discussed later. (Table II-6 lists the sources and methods for deriving nondefense consumption expenditures and gross investment.)

II—46 .
CONSUMPTION EXPENDITURES
GROSS OUTPUT OF GENERAL GOVERNMENT
Value added
COMPENSATION OF GENERAL GOVERNMENT EMPLOYEES
Compensation for general government employees, except own-account construction, is estimated as the sum of two components: Wages and salaries, and supplements to wages and salaries.
WAGES AND SALARIES
Calendar-year estimates of civilian wages and salaries are primarily from the Office of Personnel Management (OPM) [7.19]; generally, these data are available by the time of the first annual revision. These data are supplemented by data from other agencies, such as the Department of Agriculture for county agricultural agents. They include cash wages and salaries plus in-kind compensation, specifically mass transit benefits, beginning in 1998. Monthly seasonally-adjusted estimates for cash wages and salaries are interpolations using employment as an indicator; the effect of pay raises is added after the interpolation process. Calendar-year estimates for mass transit benefits are based on DOT data; monthly estimates for mass transit benefits are interpolations of the calendar-year estimates using employment as the indicator.
Current monthly estimates of Federal wages and salaries are judgmental extrapolations, adjusted for pay raises. Quarterly estimates are allocated to national defense and nondefense consumption expenditures using estimates of full- and part-time employment from OPM [7.17, 7.18] and unemployment insurance data.
SUPPLEMENTS TO WAGES AND SALARIES
Supplements to wages and salaries consists of employer contributions for government social insurance and employer contributions for employee pension and insurance funds. Employer contributions for government social insurance consist of the following: Old-age, survivors, disability, and hospital insurance; UI; and workers' compensation. A description of the methodology used to estimate these employer contributions is discussed under “Contributions for social insurance” (p.19) in the section on the derivation of receipts. Employer contributions are allocated to national defense and nondefense consumption expenditures in proportion to wages and salaries.
Employer contributions for employee pension and insurance funds consists of the following: Health insurance, life insurance, retirement, and the Thrift Savings Plan. Annual estimates are largely based on data from the Thrift Savings Oversight Board [18]. Monthly seasonally-adjusted estimates are interpolations using employment as the indicator and judgmental extrapolations, with an allowance for rate changes or other special factors. Other civilian supplements are allocated to national defense and nondefense purchases in direct proportion to wages and salaries.

II—47 .
GENERAL GOVERNMENT CONSUMPTION OF FIXED CAPITAL
Please see Consumption of Fixed Capital (CFC) in Part I of Methodology Paper.
Intermediate goods and services purchased
Federal nondefense intermediate goods and services purchased is comprised of durable goods, nondurable goods, and services purchased and consumed in order to produce nondefense services—that is, nondefense output. The following section provides the sources and methods used to estimate the constituent parts of Federal nondefense intermediate goods and services.
DURABLE AND NONDURABLE GOODS
DURABLE GOODS
Estimates of nondefense durable goods are based on MTS outlays [31.3]. Not-seasonally-adjusted estimates are used as the seasonally-adjusted estimates, and quarterly estimates are summed to calendar-year totals. Current quarterly estimates are based on three months of MTS outlays [31.3].
COMMODITY CREDIT CORPORATION (CCC) INVENTORY CHANGE
The Commodity Credit Corporation (CCC) is owned and operated by the USDA. The CCC conducts programs to support farm income and prices and to stabilize the market for agricultural commodities. The change in CCC inventories is a volatile part of nondefense consumption expenditures.25
Inventory change is measured as the difference between acquisitions and dispositions of agricultural commodities. There are two types of acquisitions: (1) direct purchases of commodities and (2) forfeitures to the CCC of commodities that are used as collateral by farmers to obtain loans. A forfeiture occurs when farmers default on commodity loans. Dispositions include sales of commodities and domestic and foreign donations of commodities. Separate estimates are made for direct purchases, for forfeitures, and for dispositions. Estimates are based on cumulative fiscal-year data received monthly directly from the CCC offices in Kansas City [20.2], and on prices from the National Agricultural Stabilization Service [20.5] and from the Dairy Market News [20.1].
For each of 10 commodities that are directly priced, the quarterly fiscal-year cumulative quantities for direct purchases, forfeitures, and total ending inventories are obtained from CCC data. Dispositions are calculated by subtracting the sum of direct purchases and forfeitures from the total ending inventory. Quarter-to-quarter changes are calculated and multiplied by seasonally-adjusted market prices (using the Census Bureau’s seasonal adjustment program) for direct purchases and dispositions, and by book prices for forfeitures. The sum of the current dollars for direct purchases, dispositions, and forfeitures is the inventory change by commodity. 25 Ideally, estimates of CCC inventory change should appear in an inventory account. Currently, the NIPAs do not include an inventory account for government. However, research is underway at BEA to assess the feasibility of producing a government inventory account.

II—48 .
The “all other” category is calculated by subtracting the value of the 10 commodities from the respective totals for direct purchases, dispositions, and forfeitures. The sum of these values is used for the current-dollar inventory change for the “all other” category. The total CCC inventory change is calculated as the sum of the inventory change for each commodity and the inventory change for the “all other” category.
PETROLEUM PRODUCTS
Fiscal-year estimates of nondefense petroleum products are based on McNeil technologies reports [8]. Quarterly seasonally-adjusted estimates are interpolations of the fiscal-years; the quarters are then summed to calendar-years. Quarterly not-seasonally-adjusted estimates are set equal to the seasonally-adjusted estimates. Current quarterly estimates are judgmentally extrapolated.
SERVICES
SERVICES FURNISHED WITHOUT PAYMENT BY FINANCIAL INTERMEDIARIES EXCEPT LIFE INSURANCE CARRIERS
Estimates of nondefense imputed interest are prepared as part of the estimate. The annual estimate of real imputed financial services of commercial banks received by the Federal Government is prepared as part of the overall estimates of total real imputed interest and associated service charge for all sectors. Total real (priced and unpriced) banking services are extrapolated using the BLS index for banking output; priced commercial bank output is then subtracted from the extrapolated total (priced and unpriced) and total real implicit output is estimated as the residual. The Federal Government sector consumption of total real implicit services of commercial banks is estimated by applying the same percentage share of the nominal consumption to the real imputed total. For current quarterly estimates, the estimates are straight line interpolations from a judgemental projected annual estimate until the same data become available each annual revision.26
RESEARCH AND DEVELOPMENT
Research and development (R&D) is estimated in two parts –- 1) health, energy, and other R&D; and 2) NASA R&D. Annual estimates for health, energy, and other R&D are based on the NSF’s Federal Funds for Research and Development report [10, 11]. Calendar-year annual estimates are interpolated without indicator to derive quarters. Quarterly not-seasonally-adjusted estimates are set equal to the seasonally-adjusted estimates. Current quarterly estimates are judgmental extrapolations.
Estimates of NASA R&D are based on quarterly NASA disbursements data [9]. Quarterly not-seasonally-adjusted estimates are summed to obtain calendar-year estimates. Quarterly seasonally-adjusted estimates are set equal to the not-seasonally-adjusted estimates.
26 For the sources and methods used to estimate services furnished without payment, see “Measuring the Services of Commercial Banks in the NIPAs: Changes in Concepts and Methods”, Services of Commercial Banks, September 2003, pages 33-44 [22.5].

II—49 .
RENT, COMMUNICATIONS, AND UTILITIES
Data for rent, communications, and utilities (combined) come from the Budget Appendix [3.2]. Fiscal-year totals are interpolated without indicator to derive quarterly not-seasonally-adjusted estimates. Quarterly seasonally-adjusted estimates are set equal to the not-seasonally-adjusted estimates. Current quarterly estimates are judgmental extrapolations, guided by budget projections.
TRAVEL AND TRANSPORTATION
Data for travel and transportation are based on the Budget Appendix [3.2]. Fiscal-year totals are interpolated without indicator to derive quarterly not-seasonally-adjusted estimates. Quarterly seasonally-adjusted estimates are set equal to the not-seasonally-adjusted estimates. Current quarterly estimates are judgmental extrapolations, guided by budget projections.
OWN-ACCOUNT INVESTMENT
Own-account investment is investment in structures and in software that is produced by Federal Government employees. Estimates of own-account investment are included in general government gross output, but they are subtracted from gross output to derive estimates of general government consumption expenditures. Own-account investment is measured as the sum of compensation for employees engaged in construction and in the development of new software, together with the value of expenditures for the related goods and services required to produce the structures and software. Estimates of Federal defense and nondefense own-account investment are included in Federal gross investment (structures and equipment and software). Nondefense own-account investment for structures is based on Census Bureau VPIP data. Own-account goods and services for structures are split into durable goods 19.4 percent, nondurable goods 43.3 percent and services 37.3 percent based on BEA’s I-O commodity distributions. The nondefense portion of own-account investment is assigned to “Conservation and development.” (See NIPA table 5.8.xB)
A description of the methodology used to estimate own-account software is discussed in the “Own-account investment” (p.40) section of the defense consumption expenditures and gross investment derivation.
SALES TO OTHER SECTORS
Nondefense sales to other sectors include timber sales, sales from the SPR, sales by VA hospitals, and other sales of goods and services.
Not-seasonally-adjusted quarterly estimates of timber sales are based on USDA Forest Service data [20.4]. Quarterly estimates are summed to calendar-year estimates. Seasonally-adjusted quarters are set equal to the not-seasonally-adjusted estimates. Monthly estimates of SPR sales are based on data from the Department of Energy [25.3]. Seasonally-adjusted quarters are set equal to the not-seasonally-adjusted quarters. Current quarterly estimates are usually available by the advance estimate.
Data for other sales are directly estimated using MTS outlays [31.3].
II—50 .
GROSS INVESTMENT
In the NIPAs, gross government investment is defined as the total investment in government fixed assets—that is, the structures, equipment, and software that are used to facilitate the production of nondefense services. The NIPA estimates of investment in structures reflect the Census Bureau classification of the value of construction put in place. Beginning with 1997, structures are classified by their function instead of by their type.
The following sections describe the sources and methods used to prepare estimates of gross investment, and is consistent with the outlines of NIPA tables 3.11.x.
STRUCTURES
New structures Annual and quarterly estimates of gross investment in new structures are available from Census Bureau VPIP data [21.1]. Advance quarterly estimates for new structures are extrapolations using two months of VPIP data as the indicator; three months of VPIP data are available for the preliminary and final estimates.
Net purchases of used structures Fiscal-year estimates of net purchases of used structures are based on FHA, VA, and GSA data. Seasonally-adjusted quarters are interpolated without indicator; quarters are then summed to calendar-years. Current quarterly estimates are held constant from the last quarter of the annual revision period.
EQUIPMENT AND SOFTWARE
Computers Quarterly estimates are derived by allocating a portion of the quarterly estimates of Federal purchases of computers, available from the GSA [5.4] and using a ratio developed from the annual relationship between nondefense and total Federal purchases of computers. The not-seasonally-adjusted quarterly data for nondefense computers are summed to annuals and are seasonally adjusted using the Census Bureau’s seasonal adjustment program. Current quarterly estimates are extrapolated from quarterly GSA data on the purchases of computers by allocating a portion to nondefense using a ratio developed during the annual revision.
Software Annual estimates of prepackaged and custom software for 1985 forward are derived from the Census Bureau’s Services Annual Survey, BEA’s I-O accounts, and other sources.27 For information on the derivation of own-account software, please see the section on Own Account Investment, p. II-77. A portion of the total Federal purchases of prepackaged and custom software is allocated to nondefense
27 See footnote 24.
II—51 .
using the fiscal-year ratio of DOD contract award data [5.2] to total purchases by the Federal Government. Quarterly seasonally-adjusted estimates for prepackaged software are interpolated and extrapolated using receipts data from company reports to the Securities and Exchange Commission (SEC) and data on monthly sales of business software from a trade source. The estimates of custom software are interpolated and extrapolated using the SEC data.
Aerospace equipment Estimates of aerospace equipment are based on data from the Budget Appendix [3.2]. Fiscal-year totals are interpolated without indicator to derive quarterly seasonally-adjusted estimates; quarterly estimates are summed to calendar-year estimates. Quarterly not-seasonally-adjusted estimates are set equal to the seasonally-adjusted estimates. Current quarterly estimates are judgmental extrapolations, guided by budget projections.
Vehicles Quarterly not-seasonally-adjusted estimates of nondefense vehicles are derived from contract awards from GSA [35], which are lagged one quarter to account for the timing differences between ordering and the delivery of the vehicles. Quarters are summed to calendar-years. Quarterly seasonally-adjusted estimates are set equal to quarterly not-seasonally-adjusted estimates. Current quarterly estimates from GSA are available for the advance estimate.
Enterprise equipment Estimates of enterprise equipment are based on data from the Budget Appendix [3.2]. Fiscal-year totals are interpolated without indicator to derive quarterly seasonally-adjusted estimates; quarterly estimates are summed to calendar-year estimates. Quarterly not-seasonally-adjusted estimates are set equal to the seasonally-adjusted estimates. Current quarterly estimates are judgmental extrapolations, guided by budget projections.
OTHER CURRENT EXPENDITURES CURRENT TRANSFER PAYMENTS
GOVERNMENT SOCIAL BENEFIT PAYMENTS TO PERSONS AND TO REST OF WORLD
Among the categories of current expenditures, government social benefits to persons is the only category for which monthly as well as quarterly estimates are prepared. The reason is that social benefits are included in estimates of personal income and outlays, which are released on a monthly basis. Social benefits are the only government expenditure included in personal income. Two recurring features of the methodology for government social benefits to persons are worth noting. First, source data generally include payments to all eligible recipients, regardless of their residency. Thus, adjustments are generally required to identify social benefits to persons living outside the United States. Payments to eligible individuals living in the rest of the world are included in social benefits, and payments to residents of U.S. territories and the Commonwealth of Puerto Rico, as noted earlier, are excluded from the NIPAs. Quarterly data for the adjustment for social benefits to
II—52 .
eligible individuals living in the rest of the world are from BEA's ITAs; data for the adjustment of social benefits to residents of territories and Puerto Rico are from a variety of sources. For these adjustments, data that are not available on a monthly basis are allocated to the months by total benefit payments of that type.
Second, many of the social benefit programs are adjusted each year to reflect changes in the cost of living, otherwise known as COLAs. Typically, these COLAs are linked to a specified change in the consumer price index (CPI) and mandated to be paid at the beginning of the calendar-year, although some COLAs are paid in different months. The effect of COLAs is excluded from the source data before seasonal adjustment and added to the seasonally-adjusted estimates in the period in which the COLA is first paid.
Table II-4, lists government social benefits to persons and to the rest of the world as they are shown in NIPA table 3.12.
To Persons BENEFITS FROM SOCIAL INSURANCE FUNDS
OLD-AGE, SURVIVORS, AND DISABILITY INSURANCE (OASDI)
Estimates of total monthly OASDI benefits are from the SSA [16.1]. These benefits include regular and retroactive payments (that is, payments resulting from the recalculation of the earnings base underlying benefits for recent retirees). Estimates of benefits to eligible individuals residing in the rest of the world and to residents of U.S. territories and Puerto Rico are subtracted to derive an estimate of OASDI benefits to U.S. residents. Ratios for the benefits paid to residents of U.S. territories are developed during the annual revision and are based on annual data from the Social Security Bulletin: Annual Statistical Supplement [16.2]. Quarterly estimates of benefits to the rest of the world are from BEA's ITAs [22.8]. Monthly estimates—except COLAs and retroactive payments—are seasonally adjusted using the Census Bureau’s seasonal adjustment program.
Estimate of benefit payments for the most recent month in the advance estimate is based on monthly payments data from the MTS [31.3]; for preliminary and final estimates, estimates are based on data from the SSA [16.1].
SSA data are used to calculate the split between retroactive benefits and regular benefits for all estimates. Nothing specifically happens to the retroactive benefits once they are separately identified. The distinction is used mostly for internal review purposes. Regular benefits are the residual of total benefits paid less SSA data for the two retroactive programs: The Automatic Earnings Reappraisal Operations program; and the “other” retroactive programs.
HOSPITAL AND SUPPLEMENTARY MEDICAL INSURANCE (HSMI)
Estimates of hospital and supplementary medical insurance (HSMI) benefits are estimated on an accrual-accounting basis, using annual incurred benefits data for both programs from the Center for Medicare and Medicaid Services (CMS)[26]. Estimates of benefits to residents of U.S. territories and Puerto Rico are subtracted; ratios for these benefits are developed during the annual revision and are based on data from the Census Bureau [21.2]. During the annual revision, the annual incurred benefits from CMS are prorated over the months using MTS data [31.3] as an indicator, for all years
II—53 .
except the two most recent years. For the two most recent years, the growth rate in benefit outlays from the MTS for both programs is applied to the CMS latest annual control to develop calendar-year estimates. For example, benefits for year t-1 and year t-2 are extrapolations from year t-3 data. Monthly seasonally-adjusted estimates are interpolations of the calendar-year estimates without an indicator. Current monthly estimates are judgmental extrapolations, guided by budget projections and MTS outlays data [31.3].
UNEMPLOYMENT INSURANCE
State unemployment insurance
State UI programs provide three types of benefits—regular, extended, and reimbursable.28 In most states, regular benefits cover the first 26 weeks of unemployment. Extended benefits provide continued coverage—in most cases, for an additional 13 weeks—for qualified individuals who have exhausted regular benefits. Extended benefits are available only when a "triggering" formula activates the program for the particular state or when a national formula activates the program for the entire country. Regular and extended benefits are paid to eligible former employees of employers that make UI contributions. Reimbursable benefits are paid under an alternative program available to state and local governments and to private nonprofit organizations. Instead of paying UI taxes, these employers may choose to reimburse the UI trust fund for benefits paid to former employees. For additional information please see the Unemployment section under Contributions for Government Social Insurance .section p. 23.
Calendar-year data on the three types of benefits are available from the Department of Labor’s Office of Workforce Security (OWS), Employment and Training Administration [28.1]. Benefits to residents of U.S. territories and Puerto Rico, also from OWS, are subtracted from each type of benefit before the three are combined. Unpublished monthly data on benefits paid are provided by the OWS for both regular and extended benefits; however, these data include checks never cashed and double count some benefits funded from more than one state. These data are used as an indicator to interpolate the calendar-year estimate (which excludes checks never cashed and double counting) for regular and extended benefits. Reliable monthly data on reimbursable benefits are not available; the calendar-year reimbursable estimates are interpolated to months using regular unemployment benefits as an indicator.
The not-seasonally-adjusted source data are affected by the weekly schedule of processing unemployment benefit checks and the occurrence of a holiday at the end of a month, when the processing of some checks is postponed until the next month. Adjustments are made to standardize the number of working days and to place benefits paid following an end-of-the-month holiday back into the preceding month. After these adjustments are made, seasonally-adjusted estimates are prepared using the Census Bureau’s seasonal adjustment program. This approach is applied for estimates of regular and for reimbursable benefits; for extended benefits, not-seasonally-adjusted estimates are used as the seasonally-adjusted estimates.
Current monthly estimates of regular and extended benefits are judgmental extrapolations, guided by cash withdrawals by states from the UI trust fund (published in the MTS [31.3]) and by the 28 Although each state is responsible for unemployment insurance, BLS is responsible for summarizing these data on a national basis.
II—54 .
unemployment rate, which is published by BLS’ Employment and Training Administration [28.3]. Reimbursable benefits are extrapolated using seasonally-adjusted regular benefits as the indicator.
Railroad employees unemployment insurance
Estimates of not-seasonally-adjusted monthly outlays of railroad UI benefits are from the MTS [31.3]. The estimates are seasonally adjusted using the Census Bureau’s seasonal adjustment program. For the current monthly estimates, the advance estimate is a preview of the MTS data provided by the RRB, and the preliminary and final estimates are based on actual MTS outlays [31.3].
Federal employees unemployment insurance
Federal employees unemployment compensation includes benefits for unemployed former civilian employees and for unemployed, newly discharged servicemen. Each program has benefits comparable to the regular and extended state UI benefits. Estimates are prepared separately for the two programs using the same procedures and sources.
Estimates of total benefits that are paid during the fiscal-year are provided by OMB from details supporting the Budget Appendix [3.2] and unpublished monthly benefit data that are available from OWS. Estimates of benefit payments to residents of U.S. territories and Puerto Rico are subtracted based on unpublished monthly data from the OWS received during the annual revision. The estimates are seasonally adjusted using the Census Bureau’s seasonal adjustment program. Current monthly estimates are judgmental extrapolations.
Special unemployment benefits
Special unemployment benefits reflect temporary benefits, authorized by legislation during periods of high unemployment (e.g. during the mid-to-late 1970s and the early 1980s) or due to extenuating economic circumstances (e.g. the aftermath of the September 11, 2001 terrorist attacks), to aid workers in specific sectors of the economy who have exhausted both their regular and extended benefits.
Unpublished monthly data for total benefit payments and for benefit payments to residents of U.S. territories and Puerto Rico are from the OWS. The latter are subtracted from total benefit payments to derive estimates of special unemployment benefits to U.S. residents. Quarterly not-seasonally-adjusted estimates are used as the seasonally-adjusted estimates.
RAILROAD RETIREMENT
Estimates of monthly total outlays for railroad retirement benefits are from the MTS [31.3]. Estimates of benefits paid to eligible individuals living in the rest of the world and to residents of U.S. territories are subtracted. Quarterly estimates of railroad retirement benefits paid to the rest of the world are from BEA's ITAs [22.8]. Estimates of benefit payments to residents of U.S. territories and Puerto Rico are developed during the annual revision and are based on data from the Census Bureau [21.2]. Not seasonally-adjusted estimates are used as the seasonally-adjusted estimates.

II—55 .
For current monthly estimates, the advance estimate is a preview of the MTS value provided by the RRB, and the preliminary and final estimates are based on actual MTS outlays data [31.3].
PENSION BENEFIT GUARANTY
Pension benefit guaranty benefits are those paid and financed by the Pension Benefit Guaranty Corporation (PBGC). During the annual revision, monthly benefit data for the latest fiscal-years are provided by the PBGC [13]. Fiscal-year estimates from the budget are used for years for which PBGC data are unavailable. These estimates are interpolated without indicator to derive quarterly not-seasonally-adjusted estimates. Quarterly seasonally-adjusted estimates are set equal to the not-seasonally-adjusted estimates. Current quarterly estimates are judgmental extrapolations of prior year budget data.
VETERANS LIFE INSURANCE
Estimates of veterans life insurance social benefits are based on unpublished monthly and calendar-year payments data provided by the VA’s Office of Budget and Finance [34] for each of the following five programs: National Service Life Insurance, U.S. Government Life Insurance, service-disabled Veterans Life Insurance, Veterans Special Life Insurance, and Veterans Reopened Insurance. Social benefit payments include claims paid by the funds and dividend payments to policyholders. Estimates of benefits going to eligible individuals living in the rest of the world and to residents of U.S. territories and Puerto Rico are subtracted. Quarterly estimates of payments to the rest of the world are from BEA's ITAs [22.8]. Ratios of total benefits paid to benefits paid to residents of U.S. territories are developed during the annual revision and are based on data from the Census Bureau [21.2].
In most years, dividends are paid to policyholders in the month of their policy’s anniversary date. In certain years, however, all dividends due in a calendar-year will have been paid early in the calendar-year. When dividends are paid throughout the year, the Census Bureau’s seasonal adjustment program prepares the seasonally-adjusted estimates of the total of claims and dividend payments. When dividend payments are accelerated, not-seasonally-adjusted estimates are used as the seasonally-adjusted estimates. Current monthly estimates are based on benefits and dividends data from the “Statement of Ledger Assets” [34], which is received monthly from the VA.
WORKERS' COMPENSATION
Estimates of workers’ compensation benefits are based on unpublished monthly data from the Employment Standards Administration (ESA), U. S. Department of Labor (DOL). Seasonally-adjusted estimates are prepared by interpolation of the calendar-year estimate—except benefit increases—without indicator; benefit increases are added to the appropriate month. Current monthly estimates are judgmental extrapolations, guided by budget projections.

II—56 .
MILITARY MEDICAL INSURANCE
The TRICARE Standard health care program (formerly known as CHAMPUS) pays for medical care provided at nonmilitary facilities to retired military personnel and to dependents of active duty and retired military personnel. For 2001 and 2002, this program also includes payments for TRICARE senior pharmacy benefits and for TRICARE for life benefits, which were created by the Uniformed Services Retiree Health Care Fund. Benefits to dependents of active duty personnel are treated as benefits from social insurance funds; benefits to retired military personnel and their dependents are included in other government social benefits to persons, but are discussed in the following paragraph.
The value of benefits received by dependents of active duty personnel are treated as being paid by a social insurance in order to make the compensation of military personnel comparable to the compensation of other government and private sector employees. Fiscal-year estimates for this program come from the annual TRICARE report [0], with a one-year lag. Seasonally-adjusted months and quarters are interpolations of the fiscal-years using military manpower levels as the indicator. Not-seasonally-adjusted months and quarters are set equal to the seasonally-adjusted months and quarters.
Current monthly and quarterly estimates are judgmental extrapolations, guided by budget projections.
VETERANS BENEFITS
PENSION AND DISABILITY
Estimates of monthly total outlays for pension and disability benefits are from the MTS [31.3]. Benefits are usually paid on the first of the month, but when the first of the month is a weekend day or holiday, the checks are paid on the previous working day. A timing adjustment is made to treat these early checks as if they had been paid in the following month. Unpublished data for the timing adjustment are provided by the VA Office of Budget and Finance [34]. Estimates of benefits for wives, widows, and children of veterans, which are included in readjustment benefits in the budget data, are added to pension and disability benefits. Estimates of benefits to eligible individuals living in the rest of the world and to residents of U.S. territories and Puerto Rico are subtracted. Quarterly estimates of benefits to the rest of the world are from BEA's ITAs [22.8]. Ratios of total benefits paid to benefits paid to residents of U.S. territories are developed during the annual revision and are based on data from the Census Bureau [21.2]. Estimates—except COLAs—are seasonally adjusted using the Census Bureau’s seasonal adjustment program. COLAs are reflected in the period in which they are first paid, and thereafter.
Current monthly estimates are based on MTS outlays data [31.3].
READJUSTMENT
Readjustment benefits are payments for readjustment and rehabilitation to, or on behalf of, veterans. These benefits include work study programs and education and training for children and spouses. The benefits also include special assistance to disabled veterans in the form of vocational

II—57 .
rehabilitation; housing grants; automobiles, adaptive equipment, and their related maintenance and repair.
Estimates of monthly total outlays for veterans readjustment benefits are from the MTS [31.3]. Benefits are usually paid on the first of the month, but when the first of the month is a weekend day or holiday, the checks are paid on the previous working day. A timing adjustment is made to treat these early checks as if they had been paid in the following month. Unpublished data provided by the VA [34] is the source of the timing adjustment. Estimates of benefits to eligible individuals living in the rest of the world and to residents of U.S. territories and Puerto Rico are subtracted. Quarterly estimates of benefits paid to the rest of the world are from BEA's ITAs [22.8]. Ratios of total benefits paid to benefits paid to residents of U.S. are developed during the annual revision and are based on data from the Census Bureau [21.2].
Current monthly estimates are judgmental extrapolations, guided by budget projections.
OTHER
Other veterans benefits consist of mustering out pay, terminal leave pay, and adjusted compensation benefits.
FOOD STAMP BENEFITS
Estimates of food stamp benefits are based on unpublished monthly total food stamp benefits and fiscal-year benefits paid to residents of U.S. territories from the Food and Nutrition Service (FNS), USDA [20.3]. The fiscal-year data on benefits paid to residents of U.S. territories are prorated over the months using total food stamp benefits, then subtracted from the total. Estimates—except COLAs—are seasonally adjusted using the Census Bureau’s seasonal adjustment program. COLAs are reflected in the period in which they are first paid, usually in October, and thereafter.
For current monthly estimates, the advance and preliminary estimates are judgmental extrapolations, guided by budget projections; the final estimate is based on actual USDA total benefits data [20.3].
BLACK LUNG BENEFITS
Estimates of black lung benefits consists of payments from the SSA to persons who began receiving benefits before July 1, 1973, and payments made by the DOL to persons who qualified after that date. For the SSA component, unpublished monthly benefits are provided by the Office of the Actuary, SSA; monthly data are summed to fiscal-year totals. The total is compared with more accurate totals from the Budget Appendix [3.2], and the months are adjusted accordingly. The same procedure is followed for the DOL payments using unpublished monthly benefits [28.5]. Quarterly not-seasonally-adjusted estimates are used as the seasonally-adjusted estimates. For current monthly estimates, the advance estimate is based on the monthly benefits data, when available; otherwise, the estimate is a judgmental extrapolation guided by budget projections. Preliminary and final estimates are based on monthly benefits data [28.5].
II—58 .
SUPPLEMENTAL SECURITY INCOME
Estimates of supplemental security income (SSI) are based on fiscal-year benefits data from the Budget Appendix [3.2] and monthly benefits data from SSA [16.3]. The fiscal-year total is prorated over months by the SSA monthly benefits. Not-seasonally-adjusted estimates are used as the seasonally-adjusted estimates. Current monthly estimates are based on benefits data from SSA.
EARNED INCOME AND CHILD CARE CREDITS
Estimates of not-seasonally-adjusted monthly outlays for the earned income credit are from the MTS [31.3] and are summed to calendar-year estimates. The Taxpayer Relief Act of 1997 authorized a child tax credit that, in the NIPAs, has been added to the earned income credit. Estimates of not-seasonally-adjusted monthly outlays for the child tax credit are also from the MTS [31.3] and are summed to calendar-year estimates. Calendar-year estimates of the earned income and child tax credit are combined. Monthly seasonally-adjusted estimates of the earned income and child tax credit are prepared by dividing the calendar-year total by 12. Current monthly estimates are judgmental extrapolations, guided by budget projections.
OTHER
Estimates of “Other” social benefit payments include payments under many programs, such as to nonprofit institutions (exclusive of payments for research and development carried out by these institutions), for trade adjustment assistance, payments to Alaska natives, payments for natural disasters, payments for other social benefits, and payments for medical services for retired military personnel and their dependents at nonmilitary facilities. Trade adjustment assistance benefits are administered by the Department of Labor and assist individuals who have become unemployed as a result of increased imports from, or shifts in production to, foreign countries. These benefits are imbedded in the “other” federal social benefits to persons series. A description of the methodology used to estimate the payments for medical services for retired military personnel and their dependents at nonmilitary facilities is discussed in the “Military medical insurance” (p.56) section of the expenditures derivation.
For estimates of payments to nonprofit institutions, the fiscal-year payments are derived from budget data as part of the fiscal-year analysis; quarterly estimates are derived from MTS data [31.3] using fiscal-year relationships. Not-seasonally-adjusted quarterly estimates are summed to calendar-year estimates. Seasonally-adjusted estimates are interpolations of the calendar-year estimates without an indicator. Current monthly estimates are judgmental extrapolations, guided by budget projections. For estimates of trade adjustment assistance, a fiscal-year total is taken from the Budget Appendix [3.2]. The fiscal-year total is prorated over months using unpublished monthly benefit data from the Employment and Training Administration.
For Alaska native claims, fiscal-year payments are derived from budget data as part of the fiscal-year analysis. Quarterly estimates are derived from MTS data [31.3] using fiscal-year relationships. Not-seasonally-adjusted quarterly estimates are summed to calendar-year estimates. Monthly seasonally-

II—59 .
adjusted estimates are derived by dividing the calendar-year total by 12. Current monthly estimates are judgmental extrapolations, guided by budget projections.
In cases of severe natural disasters, in which a state becomes a Presidentially-declared disaster area and receives Federal funds in response to the disaster, residents may be eligible for temporary rental assistance from funds provided through the Federal Emergency Management Agency (FEMA). The value of these benefits, based on data from FEMA, is added to the “Other” social benefits series, as applicable. Not-seasonally-adjusted estimates are used as the seasonally-adjusted estimates. For estimates of other small social benefits not elsewhere classified, fiscal-year payments are derived from budget data as part of the fiscal-year analysis. Estimates of monthly benefits for these programs are prepared by interpolating fiscal-year estimates without an indicator. Not-seasonally-adjusted estimates are used as the seasonally-adjusted estimates. Current monthly estimates are judgmental extrapolations, guided by budget projections.
To the Rest of the World Federal Government social benefit payments to the rest of the world are discussed in Foreign Transactions, BEA Methodology Paper Series MP-3 [22.2], page 24.
OTHER CURRENT TRANSFER PAYMENTS
Table II-4 lists other current transfer payments, including grants-in-aid to state and local governments and other current transfer payments to the rest of the world. These payments are discussed in detail below.
Grants-in-aid to state and local governments Quarterly estimates of grants-in-aid to state and local governments are prepared for about 300 grant programs: Most estimates are prepared using MTS outlays [31.3] in conjunction with relationships derived from fiscal-year analysis. Grants-in-aid to U.S. territories and Puerto Rico are subtracted, using information from the Census Bureau [21.2], and administering agencies. Not-seasonally-adjusted quarterly estimates are summed to calendar-year estimates. Seasonally-adjusted quarterly estimates for most groups of programs are prepared using the Census Bureau’s seasonal adjustment program or by using not-seasonally-adjusted estimates as the seasonally-adjusted estimates. For a few programs with sporadic payment patterns, seasonally-adjusted estimates are prepared by interpolating the calendar-year totals over quarters without an indicator. This procedure is used, for example, for the Federal payment to the District of Columbia; the payment is usually made in one or two installments, but the timing varies from year to year.
For current quarterly estimates, the advance estimates are based on two or three months of MTS outlays for all appropriations [31.3]. If the third month is not yet available, an estimate is prepared for the department-level outlays for the third month using relationships derived in the fiscal-year analysis. Three months of data are available for the preliminary and final estimates for all grants-in-aid programs.

II—60 .
Grants for highways, for airports, for mass transit, and for water and sewage are classified as capital transfers.
Other current transfer payments to the Rest of the World Other current transfer payments to the rest of the world are U.S. Government military and nonmilitary grants-in-cash and grants-in-kind to foreign governments. Military grants-in-kind are military goods or services that are delivered to foreign governments. Nonmilitary grants include Federal Government cash and donations of commodities such as crop donations from the CCC.to foreign governments,
CCC dispositions include Federal Government donations of agricultural commodities to foreigncgovernments. Estimates of dispositions are based on fiscal-year and monthly quantity and price data from the Agricultural Stabilization and Conservation Service (ASCS), USDA [20.1, 20.2, 20.5].
Data on U.S. unilateral current transfers to foreign governments, also known in the International transactions accounts as U.S. Government grants, are released each March, June, September, and December and appear in the January, April, July, and October issues of the Survey of Current Business in articles on the International Transactions Accounts [22.8]. Specifically, data on grants to rest of the world programs appear in Table 1, “U.S. International Transactions” line 36 and in Table 5, “Selected U.S. Government Transactions.” Other current transfer payments also include payments to international organizations, such as the United Nations. Those estimates are also from the International transactions accounts.
INTEREST PAYMENTS
Table II-4 lists interest payments, including interest payments to persons and business and interest payments to the rest of the world.
TO PERSONS AND BUSINESS
Interest paid to persons and business consists of: Interest paid to Federal Government employee pension plans; interest paid on refunds; and other interest paid to persons and business. Estimates of interest paid to Federal Government employee pension plans are derived from monthly MTS data [31.3]. The calendar-years are then interpolated without an indicator to generate seasonally-adjusted quarters. Current quarterly estimates are judgmental extrapolations, guided by budget projections.
Estimates of interest paid on refunds are obtained from the IRS [32.1], which are summed to calendar-years. These calendar-years are then interpolated without an indicator to generate seasonally-adjusted quarterly estimates. Current quarterly estimates are judgmental extrapolations.
Other interest paid to persons and business is interest paid on the public debt less interest paid to the rest of the world and to government funds. Estimates of interest paid on the public debt are from the Bureau of Public Debt (BPD)[30], which are confirmed by estimates in the MTS [31.3]. Estimates of interest paid to government funds are from the Budget Appendix [3.2] and estimates of interest paid

II—61 .
to the rest of the world are from BEA’s ITA [22.8]. Calendar-year estimates of interest paid on the public debt less interest to the rest of the world are seasonally adjusted using the Census Bureau’s seasonal adjustment program; estimates of interest paid to government funds are subtracted. For current quarterly estimates, the advance estimate of interest paid to persons and business is based on two months of MTS data for public issues interest and the third month of BPD data. For public issues interest, the third month of MTS data is available for the preliminary and final estimate.
TO THE REST OF THE WORLD
The estimates of interest paid to the rest of the world are from BEA's ITAs, tables 1 and 2, line 28, “Foreign Direct Investment in the United States: Reconciliation with International Transactions Accounts” [22.8]. The methodology for preparing these estimates is discussed in Foreign Transactions, a BEA Methodology Paper MP-3 [22.2], page 25. For current quarterly estimates, advance and preliminary estimates of interest paid to the rest of the world are based on projections; rest of the world interest paid data are available for the final estimate.
SUBSIDIES
Federal Government subsidy payments are in support of agriculture, housing, maritime activities, railroads, air carriers, mass transit, and community development; see table II-4. For all, except agricultural subsidies, fiscal-year estimates are derived from budget data as part of the fiscal-year analysis. Not-seasonally-adjusted quarterly estimates are prorations of these fiscal-year estimates using MTS outlays [31.3] as an indicator; these not-seasonally-adjusted quarterly estimates are summed to calendar-year estimates. Quarterly seasonally-adjusted estimates are prepared by interpolating calendar-year estimates without indicator and extrapolating judgmentally.
Most agricultural subsidies are paid by the CCC and the Farm Service Agency (FSA). Fiscal-year CCC subsidies are from subsidy detail in the Report of Financial Condition and Operations of the Commodity Credit Corporation [20.2]; quarterly estimates are from unpublished data from FSA, which administers the CCC programs. Not-seasonally-adjusted quarterly estimates are summed to calendar-years. The remaining quarterly agricultural subsidies are based on USDA data. Annual USDA estimates are interpolated using a quarterly index of weighted USDA estimates as the indicator.
The current quarterly estimates of agricultural subsidies are based on payments data from the FSA. Current estimates of all other subsidy payments are judgmental extrapolations, guided by budget projections.
WAGE ACCRUALS LESS DISBURSEMENTS
Estimates of wage accruals less disbursements convert wages and salaries from the accrual basis, used in government consumption expenditures and in the current surplus of government enterprises, to a disbursements or payments basis that is consistent with the measures used in NIPA personal income and personal saving. Differences between accruals and disbursements arise because of retroactive pay raises—especially during the 1980's for Postal Service employees and in 2003-2004 for all Federal civilian employees. Estimates of information on the amount of retroactive pay raises are from affected agencies and from OMB pay raise estimates.

II—62 .
NET FEDERAL GOVERNMENT SAVING
The NIPA net Federal Government saving measure is divided into two parts; the net saving generated by the excess of social insurance systems’ receipts over the outlays of the systems, and the net saving resulting from all other government transactions.
The social insurance fund saving is calculated as the sum of contributions and interest received by social insurance systems (the latter from the MTS [31.3]), less the sum of social insurance benefits and administrative expenses. Data for administrative expenses of social insurance funds are from the MTS [31.3] using relationships from fiscal-year analysis. These data are summed to quarters and calendar-years. Quarterly seasonally-adjusted estimates are interpolations of the annual estimates without an indicator; current quarterly estimates are judgmental extrapolations, guided by budget projections. The saving for “other funds” equals the total NIPA net saving minus the social insurance fund saving.
OTHER CAPITAL EXPENDITURES CAPITAL TRANSFER PAYMENTS
Capital transfer payments consist primarily of capital grants-in-aid to state and local governments, capital transfers paid to the rest of the world, capital investment grants to business (subsidies), and capital transfers to persons.
CAPITAL GRANTS-IN-AID TO STATE AND LOCAL GOVERNMENTS
Grants for highways, for airports, for mass transit, and for water and sewage are classified as capital transfers. See the section on grants-in-aid to State and local government for an overview of the estimation of grants. (page II-60).
CAPITAL TRANSFERS PAID TO THE REST OF THE WORLD
Capital transfers to the rest of the world consists of forgiveness of debts owed by foreign governments to the U.S. Government and the December 1999 transfer of U.S. Government assets in the Panama Canal Commission to the Republic of Panama. The estimate of capital transfers to the rest of the world is from BEA's ITAs [22.8].
CAPITAL GRANTS TO BUSINESS (SUBSIDIES)
Subsidies to private companies for capital expenditures are removed from the current account and are included in the capital account as transfers. Prior to 1990, subsidies were paid for maritime construction, specifically shipbuilding. More recently, these subsidies are from the Department of Homeland Security for capital expenditures. Not-seasonally-adjusted quarterly data from the MTS [31.3] are summed to obtain calendar-year estimates. Seasonally-adjusted quarters are set equal to
II—63 .
the not-seasonally-adjusted estimates.
CAPITAL TRANSFERS TO PERSONS
Capital transfers to persons consists of payments to the Uniformed Services Retiree Health Care Fund to amortize the cost of the unfunded liability. Not seasonally-adjusted quarterly data are from the MTS [31.3]; payments are made generally once a year. Calendar-year estimates are summed from the quarterly data. Seasonally-adjusted quarters are interpolations of annual data. Current quarterly estimates are judgmental extrapolations based on budget projections.
NET PURCHASES OF NON-PRODUCED ASSETS
Net purchases of nonproduced assets consists of transactions in land (purchases less sales), bonuses paid from drilling rights on the Outer Continental Shelf, and FCC proceeds from the auctions of the radio spectrum.
CONSUMPTION OF FIXED CAPITAL
See sections on general government defense expenditures of fixed capital under the section on Defense Expenditures and Gross Investment and conondefense consumption of fixed capital under the section on Nondefense Expenditures and Gross Investment. (page II-73).
NET FEDERAL LENDING OR BORROWING (-)
Total receipts less total expenditures.
5. REAL CONSUMPTION EXPENDITURES AND GROSS INVESTMENT
Estimates of real government output are generally based on measures of real inputs; estimates of real consumption expenditures, in turn, are derived from estimates of real government output. Estimates of real inputs and of gross investment are prepared either by deflation, by extrapolation of reference-year values using volume indicators, or by direct pricing.29 The data used for deflation include prices paid by the Federal Government, producer and consumer price indexes (PPIs and CPIs) published by the BLS [27.1, 27.5], construction cost indexes compiled by the Census Bureau [21.1] and BEA, agricultural prices from the USDA [20.1, 20.5], BLS employment cost indices (ECIs)[27.4], and average hourly earnings (AHEs) from BLS [27.2]. As an example of volume extrapolation, employment data are used to extrapolate reference-year compensation, and the value of services furnished without payment by depository institutions is extrapolated using the number of
29 The direct pricing method involves multiplying the delivered quantity of a specific good or service in a period by the unit price for that good or service in the period to arrive at total expenditures.
II—64 .
transactions. Quantities of agricultural commodities, certain petroleum transactions, and a variety of military goods and some services are prepared using the direct-pricing method.
NIPA table 3.9.1 shows percent change from preceding period for real government consumption expenditures and gross investment; table 3.9.2 shows contributions to percent change; table 3.9.3 shows quantity indexes; table 3.9.4 shows price indexes; table 3.9.5 shows current dollars; and table 3.9.6 shows chained dollars. NIPA tables 3.10.x show similar information for government consumption expenditures and general government gross output; and NIPA tables 3.11.x show this information for national defense consumption expenditures and gross investment by type.
For compensation of general government employees, except own-account investment, and for imputed financial services, reference-year values are extrapolated by quantity indicators. For certain components of national defense consumption expenditures and gross investment, for CCC purchases of farm commodities, and for certain purchases and sales of petroleum, quantities are prepared as part of the direct-pricing method and are used to extrapolate reference-year estimates to produce real estimates. For certain components of consumption expenditures and gross investment, current-dollar estimates are deflated (that is, divided by) using price indexes. For a substantial portion of national defense consumption expenditures and gross investment, price indexes are prepared by BEA using information on prices paid by the DOD; these price indexes are used to deflate current-dollar estimates.30 For other consumption expenditures and gross investment, the price indexes are derived using construction price indexes, CPIs, and PPIs [21.1, 27.1, 27.5], or are constructed from ECIs [27.4] and from AHEs [27.2].31 The prices and quantities implicit in the current-dollar and real estimates are used to produce chain-type measures.
Tables II-7 and II-8 indicate which of the three methods is used to prepare estimates of real Federal consumption expenditures by input-cost component and of gross investment by component. They provide an overview of the source data used for annual and quarterly estimates, as well as for current quarterly estimates—the latter are often less complete and less detailed. Tests are conducted for seasonality and, in cases where seasonality is present, the Census Bureau’s seasonal adjustment program is used to remove seasonality from the series.
30As noted, for current-dollar national defense consumption expenditures and gross investment, many of the data sources were identified in a major project undertaken by BEA with DOD [33] in 1975. For years before 1972, real consumption expenditures and gross investment was estimated at the total Federal Government level only; no distinction was made between national defense and nondefense consumption expenditures and gross investment. At the total level, 15 types of inputs and gross investment—including military compensation, Commodity Credit Corporation inventory change, and structures—were extrapolated or deflated. Beginning with 1972, consumption expenditures and gross investment are split between national defense and nondefense, and further grouped into the detailed estimates of value added, intermediate goods and services purchased, and gross investment. 31For estimates prior to 1993, the estimates of real investment in military facilities are derived using the direct-pricing method. For directly-priced estimates of gross investment, data on the number of square feet and cost per square foot (as well as length of construction period) were available from construction project reports (CPRs) [5] that were submitted by contractors at the beginning and end of each Federal Government construction contract. These reports are no longer available.
II—65 .
As noted earlier, the "direct-pricing" method for preparing current-dollar estimates is preferred because it captures actual prices paid by the Federal Government. For estimates of real consumption expenditures and gross investment that are prepared using the direct-pricing method, the beginning price and quantity data are the same as those used for current-dollar estimates. Calculation of real estimates for directly-priced items is performed at the specification level in order to remove the effect of quality change from the calculated price ratio (current price/reference-year price). The base price for each specification is adjusted to account for quality changes over time. The “quality-adjusted reference-year price” is multiplied by current period quantities to calculate real estimates for each specification. When real estimates at specification level are aggregated, the value of the changes in quality appear in the associated chain-type quantity index, instead of in the chain-type price index.
The technique of specification pricing, as implemented for defense goods and services, consists of determining the relevant physical characteristics of a good and then holding these characteristics constant over time. As long as these characteristics are unchanged, any change in the amount paid for a good is a price change. When the characteristics change, the change is evaluated to determine the performance and cost effects. If the performance is enhanced, the associated quality increase is measured by the cost change.32 Specification pricing permits linking established time series to modified or replacement specifications, as well as to new products.
The following procedures are used to calculate estimates of quality-change, which are used to adjust the reported reference-year price over the time span of each specification. The procedures are described in the context of the direct-pricing method, but comparable procedures are also used to construct indexes of DOD prices. The adjustment of reference-year prices for quality changes begins with the determination of the “quality factor” for each specification in each time period. The quality factor is calculated as the ratio of the new price, including the value of any quality change, to the new price less the value of any quality change. The “direct-comparison” procedure is used when the characteristics of a specification change, but there is no impact on performance. In this case, the quality factor is defined to be 1.0, and the entire difference in price is reflected as a true price change. The “direct-link” procedure is used when the entire difference in price level between the old and new product, at the time of the introduction of the new product, is due to a difference in quality—in other words, performance. This procedure makes the value of the quality change in reference-year prices directly proportional to the value of the quality change in current-period prices.
In many instances, a price change represents a combination of quality change and true price change. The “producer cost” procedure is used to place a value on a characteristic change that is determined to be a quality change. The value of the quality change is defined as the cost to the producer of making the change in the current period. Any difference in the price of a good, other than the cost of producing a quality change, is defined as a true price change. Under the producer cost procedure a true price change may include changes arising from fiscal-year buy size, production rate, position on a learning curve, or the selection of a producer. The producer cost procedure is used to isolate the true price change when an indirect link between price and quality exists.
After a quality change has been valued by the producer cost procedure, the quality factor is determined. Quality factors are cumulative over time for a specification. In any current time period, the quality-adjusted reference-year price is the appropriate reference-year price divided by the ratio
32For a more detailed discussion, see Price Changes of Defense Purchases of the United States [33].
II—66 .
of the cumulative quality factor in the base year to that in the current year. As stated earlier, the price index in any time period is represented by the ratio of the current price of the specification to its quality-adjusted reference-year price; a measure of real expenditures for the new product is calculated as the current-period quantity times the quality-adjusted reference-year price.
The “overlap pricing” procedure is a linking procedure that is used when a “learning curve” causes overstated prices at the beginning of production for a new specification or weapons system. The learning curve may show steeply falling prices in the beginning years of production because of low initial labor productivity and the subsequent rapid price decline as productivity increases. The overlap pricing procedure uses the price of new components at a point on the learning curve when price change due to learning does not influence the difference in relative prices; in other words, at the bottom of the learning curve. For a fighter aircraft, for example, this point might be with the production of the 100th unit. From this lowest point on the learning curve, the current price of a new component is extrapolated backwards using an appropriate proxy to estimate the current price of an efficiently produced new component in the same time period as when an old component was efficiently produced; that is, before production costs or shutdown costs became a major influence on the price of the old component. The difference at this overlap point between the current price for an old component and the estimated current price for the new component is treated as a quality change. The quality factor in this overlap period, where no pure price change exists, is calculated as a ratio of the price of an old component plus the value of the quality change to the price of an old component alone. This quality factor is accumulated with the previous cumulative quality factor of the old component, and the link over time of a new component with an old component is thus complete.
For estimates that are prepared using the direct-pricing method, the two principal sources of data for constructing quality-adjusted reference-year prices and price indexes are contract control documentation reports—as described in the section on current dollars—and supporting detail behind DOD budget materials, also referred to as “budget exhibit” data. Data on the average price paid for a specification delivered during the base year (2000) are from “budget exhibit” data or contract control documentation reports [4]. This price is adjusted to reflect the cost (in 2000 dollars) of all configuration changes deemed to be quality changes. The values of the quality changes, following the producer cost procedure, draw on information in the contract control documentation reports on the cost of implementing an engineering change order, which is required for any configuration change to a weapons system.
NATIONAL DEFENSE CONSUMPTION EXPENDITURES AND GROSS INVESTMENT
CONSUMPTION EXPENDITURES
GROSS OUTPUT OF GENERAL GOVERNMENT
Value added COMPENSATION OF GENERAL GOVERNMENT EMPLOYEES
Except for one type of pay, estimates of real compensation of general government employees are prepared by extrapolating reference-year compensation by an index of employment. The extrapolators are adjusted, to the extent possible, for changes in experience and education—that is, in the composition of the workforce. Adjustments are made during benchmarks and annual revisions, and are based on the OPM publication, "The Structure of the Federal Civilian Workforce" [7.19].

II—67 .
General Schedule, Wage Board, senior executive service (SES), and other pay plans are also analyzed to adjust estimates of real compensation to reflect the composition of the workforce. This procedure is designed to approximate specification pricing for labor inputs by general government employees.
MILITARY
Estimates of real military compensation are derived using extrapolation and deflation methods. Extrapolation is used for the types of compensation that are based on rank or length of service, such as basic pay, or that are based on a percentage of pay, such as reenlistment bonuses. Deflation is used for special pay, such as pay for flights and for dentists, that are paid to military personnel who meet special requirements and training.
As mentioned earlier in the discussion of the extrapolation method, the quality of a unit of labor purchased is defined in terms of education and experience. Changes in these characteristics are treated as quality changes; all other changes are price changes. For the military pay system, rank and length of service are assumed to represent the education and experience criteria. Twenty-three ranks—ten for officers, four for warrant officers, and nine for enlisted personnel—plus a cadet rank, are identified [7.2, 7.3, 7.7, 7.8]. The 2000 compensation (excluding the special pays) per employee for a given rank and length of service is the reference-year price. Employment by rank and length of service for all other periods is multiplied by this reference-year price to obtain real military compensation excluding special pay. The difference between the average real salary in a given period and the reference-year average salary represents the shift in the composition of employment with respect to educational attainment and experience.
Special pay represents a higher level of educational attainment and experience; therefore, any change in the special pay rate is a price change. Information on changes in special pays is available from the military compensation report [7.1, 7.5]. A price index is constructed for each of the special pays and is used to deflate the current-period expenditures for special pay.
For advance quarterly estimates, two months of employment data are available from DOD manpower reports [7.6] for the extrapolation method; the third month is estimated judgmentally. The third month is available for the preliminary and final estimates.
CIVILIAN
Estimates of real civilian compensation of general government employees are derived by extrapolation and then allocated to national defense and nondefense consumption expenditures in proportion to employment. The basic unit of purchase—and the extrapolator—is an hour worked; an hour paid is not used because it would reflect changes in holidays and annual leave usage as well as hours worked—the former are considered to be price changes. The hours measures are adjusted for changes in composition of the workforce for skill level and experience; all other changes in wages per hour are recorded as price changes.
There are several Federal civilian pay plans—for example, General Schedule and the Wage Grade. All are based on skill level (grade) and length of service (step). Average 2000 compensation per hour worked (within a pay plan) for each grade is the reference-year price.
Employment data by grade and step for each pay plan for civilian personnel are available monthly from BLS [27.2] and are adjusted to reflect changes in the index of average hours worked. These

II—68 .
data are multiplied by the reference-year price to derive real civilian compensation. For advance quarterly estimates, the change in total civilian employment is used to estimate the change in real defense civilian compensation.
GENERAL GOVERNMENT CONSUMPTION OF FIXED CAPITAL
Estimates of real general government CFC are estimated by deflating current-dollar investment flows and using BEA’s perpetual inventory method. Price indexes for corresponding categories of structures and equipment and software are used to deflate investment flows.33
Intermediate goods and services purchased DURABLE GOODS
Most categories of durable goods are described in the section on equipment and software, page II-71.
OTHER DURABLE GOODS
Expenditures for all annual and quarterly estimates of real other durable goods are prepared by deflation using PPIs [27.5].
NONDURABLE GOODS
PETROLEUM PRODUCTS
Real intermediate purchases for petroleum are prepared using two methods. Almost all are prepared by direct pricing, using prices from monthly petroleum product reports (PPRs) [14]; the remaining estimates are prepared by deflation using indexes constructed from DOD prices, specifically the indexes derived from the directly-priced estimates.
For advance quarterly estimates, quantities and prices are usually available from the PPRs. When the reports are not available, quantities delivered and prices paid are judgmental extrapolations. For the preliminary and final estimates, all monthly reports are available.
AMMUNITION
All annual and quarterly estimates of real ammunition expenditures are prepared by deflation using PPIs [27.5].
OTHER NONDURABLE GOODS
Expenditures for all annual and quarterly estimates of real other nondurable goods are prepared by deflation using PPIs [27.5]. 33 For further information on the perpetual inventory method, see U.S. Department of Commerce, Bureau of Economic Analysis, Fixed Assets and Consumer Durable Goods in the United States, 1925-97, Washington, DC: U.S. Government Printing Office, September 2003; http://www.bea.gov/bea/mp.htm .

II—69 .
SERVICES
RESEARCH AND DEVELOPMENT
Estimates of real intermediate purchases for contractual research and development (R&D) are prepared by deflation using PPIs [27.5]. These indexes are available for current quarterly estimates.
INSTALLATION SUPPORT
Estimates of real intermediate purchases for installation support services are prepared by deflation. Certain expenditures are deflated using composite indexes constructed from PPIs or CPIs [27.1, 27.5] and from ECIs [27.4]. For services purchased abroad, exchange-rate adjustments are made [2] where substantial intermediate purchases occur (usually Germany, Japan, and South Korea). For utility categories, postage, and local telephone service, PPIs and CPIs [27.5, 27.1, respectively] are used for deflation.
WEAPONS SUPPORT
Estimates of real intermediate purchases for weapons support services are prepared by deflation using AHEs [27.2] and ECIs [27.4].
PERSONNEL SUPPORT
Estimates of real intermediate purchases for personnel support services are prepared by deflation. For 1993 forward, services such as training and education are deflated using CPIs from BLS [27.1]; consulting services is deflated using CPIs and an ECI [27.4]. Prior to 1993, these services were primarily deflated by AHEs [27.2]. The services of foreign nationals are deflated using wage rates paid by DOD [12] in various countries–-the wage rates are exchange-rate adjusted [2]. Most of the wage rate data are not available until the second annual revision; they are estimated judgmentally until they become available.
Current quarterly estimates are primarily judgmental extrapolations; price data and projections for education, training, and consulting are available from BLS. Price data for foreign nationals’ services are based on judgmental projections for wage rates and are exchange-rate adjusted.
TRANSPORTATION OF MATERIAL
Estimates of real intermediate purchases for the transportation of material are prepared by deflation using indexes constructed from DOD prices available in reports from the Military Sealift Command [19.6], Navy Material Transportation Office [19.7], Surface Deployment and Distribution Command [19.4, 19.5], and Air Mobility Command [19.1].34 Samples of trips from each of three categories—air, sea, and truck personal property—and of terminal services are priced each quarter to construct price indexes for each category. Price indexes for rail and truck transportation are calculated from 34 Data from the Navy Material Transportation Office are unavailable after 1983.
II—70 .
actual transactions. For the current estimate, real intermediate purchases for each of the categories are prepared by deflation using indexes constructed from PPIs [27.5].
For the current estimate, real intermediate purchases for each of the categories are prepared by deflation using indexes constructed from PPIs [27.5].
TRAVEL OF PERSONS
Estimates of real intermediate purchases for the travel of persons are prepared by deflation. Indexes constructed from DOD prices available in reports from the Surface Deployment and Distribution Command, the Air Mobility Command, and a trade source are used to deflate air travel and travel by bus and rail [19.1, 19.2, 19.3]. Bus and rail travel indexes are constructed using a sample of trips from these two categories. Indexes constructed from GSA information on reimbursement rates for per diem, for dislocation allowances, and for mileage for privately owned vehicles [35] and from CPIs for taxi fares and car rental fees [27.1] are used to deflate reimbursable travel expenses.
For current estimates, real intermediate purchases for each of the categories are prepared by deflation using composite indexes constructed from PPIs [27.5].
OWN-ACCOUNT INVESTMENT
Own-account investment in structures is judgmentally allocated between defense and nondefense. The defense portion of Federal own-account investment in structures is assigned to “Military facilities” (See NIPA table 5.8.xB, line 13). Own-account goods and services for construction are then allocated to durable goods (0.194), nondurable goods (0.433) and services (0.373). Existing price indexes for construction parts, other nondurable goods and architectural and engineering services are used to deflate own-account goods and services for defense construction.
Federal own-account investment in software is deflated using a combination of the price indexes for BEA own-account software intermediate inputs index and the Federal Government nondefense compensation price index.
SALES TO OTHER SECTORS
Real estimates of sales of training services are prepared by deflation using the implicit price deflator developed by BEA for military officers’ compensation.
GROSS INVESTMENT
STRUCTURES
New structures and net purchases of used structures, other than military facilities Estimates of real gross investment for family housing (residential) and industrial facilities are prepared by deflation. Family housing is deflated using the Census Bureau price index for single-family houses under construction [21.1]. DOE construction of industrial facilities is deflated using a

II—71 .
composite index consisting of the Turner Construction Company’s building-cost index (Turner index), the Federal Highway Administration (FHWA) highway structures construction index (a component of the composite), and the Census Bureau price index for single-family houses under construction.
Net purchases of used structures are deflated using a composite of the Census Bureau price index for single-family houses under construction, the Turner index, Bureau of Reclamation index, FHWA structures, and the FHWA composite index.
For current quarterly estimates, all indexes related to new structures and net purchases of used structures are available for the advance estimate.
Military facilities Estimates of real consumption expenditures of military facilities are prepared by deflation, using price indexes from a variety of sources. These indexes include the FHWA composite index, the Census Bureau price index for single-family houses under construction, the Turner index, and the Bureau of Reclamation index.35 An estimate for domestic site preparation is prepared by deflation using PPIs and AHEs [27.5, 27.2]. For site preparation and facilities that are constructed abroad, adjustments are made for the exchange rate [2] between the U.S. dollar and currencies of countries where substantial construction occurs (usually Germany, South Korea, and Japan).
EQUIPMENT AND SOFTWARE
Aircraft Estimates of real aircraft expenditures are prepared using two methods: Most are prepared by direct pricing using DOD prices; the remainder are prepared by deflation, using a combination of the directly-calculated price indexes and PPIs [27.5].
For advance quarterly estimates, quantities and prices are based largely on scheduled deliveries and prices from unpublished “budget exhibit” data [4.1, 4.4, 4.8]. Data from production control reports and contract control documentation reports are incorporated into the estimates as they become available.
Missiles Estimates of real missiles expenditures are prepared using two methods: Most are prepared by direct pricing using DOD prices; the remainder are prepared by deflation using a combination of the directly-calculated price indexes and PPIs [27.5]. 35 Prior to 1992, the estimate of domestic new construction was prepared by direct pricing. The estimates that were prepared using the direct-pricing method used the number of square feet constructed (or other physical unit measure) and the reference-year cost per square foot, by detailed DOD construction category, derived from information contained in construction project reports (CPRs) [5]. The categories were arranged on the basis of end-use and other characteristics that serve as pricing specifications. The cost per square foot was adjusted to reflect the cost (in 2000 dollars) of any changes in the specification of the construction category. (For more detail, see "Implicit Price Deflators for Military Construction" [31].)

II—72 .
For advance quarterly estimates, quantities and prices are based largely on scheduled deliveries and prices from unpublished “budget exhibit” data [4.2, 4.5, 4.13, 4.14]. Data from production control reports and contract control documentation reports are incorporated as they become available.
Ships Estimates of real ships expenditures are prepared by deflation using PPIs [27.5].
Vehicles Estimates of real vehicles expenditures are prepared using two methods: Most are prepared by direct pricing using DOD prices; the remainder, mostly cars and trucks, are prepared by deflation using a combination of the directly-calculated price indexes and PPIs [27.5].
For advance quarterly estimates, quantities and prices are based largely on scheduled deliveries and prices from unpublished “budget exhibit” data [4.6, 4.7, 4.9, 4.10, 4.11]. Data from production control reports and contract control documentation reports are incorporated as they become available.
Electronics and software Estimates of real electronics and software expenditures are prepared by deflation. For electronics, estimates are deflated using PPIs [27.5]. Estimates of real computers are prepared by deflating current-dollar estimates using BEA’s implicit price deflators for computer equipment.
For software, prepackaged software is deflated using the PPI for prepackaged software [27.5], with a downward bias adjustment to account for the likely understatement of quality-adjusted price declines. For 1994 through 1997, prepackaged software is deflated using BEA’s matched-model index with the bias adjustment. Prior to 1994, an unweighted average of the BEA hedonic index for spreadsheets and word processors and a matched-model index is used. Custom software is deflated using the percentage change in a weighted index of prepackaged software price changes (25 percent) and own-account software price changes (75 percent).
Other equipment Expenditures for all annual and quarterly estimates of real other equipment expenditures, such as training equipment, are prepared by deflation using PPIs [27.5].
NONDEFENSE CONSUMPTION EXPENDITURES AND GROSS INVESTMENT Current-dollar nondefense consumption expenditures and gross investment are derived in two parts: CCC inventory change and all other consumption expenditures and gross investment. All other consumption expenditures and gross investment are then classified by type: Durable goods, nondurable goods, compensation, services, structures, and equipment and software. Compensation is
II—73 .
derived from total Federal civilian compensation as described in the section on national defense. Gross investment in structures is from the Census Bureau Current Construction Reports [21.1]. The remaining consumption expenditures and gross investment are allocated to durable goods, to equipment and software, to nondurable goods except CCC, and to services based on annual estimates of expenditures by object class from the Treasury Bulletin [31.4], the MTS [31.3], the Budget Appendix [3.2], contract awards [5.5], and other agency reports [9, 20.4, 25.2, 25.3]. Quarterly current-dollar estimates of this group are interpolations without an indicator and, for the current estimates, judgmental extrapolations. For additional information on outputs and inputs of consumption expenditures please see Government Receipts and Expenditures Account in Part I.
Table II-8 indicates which of the three methods for preparing real estimates—deflation, extrapolation, or direct pricing—is used for the components of nondefense consumption expenditures and gross investment, and provides an overview of the source data. Table II-8 also shows, in detail, the price indexes or extrapolators that are used to derive estimates of real nondefense consumption expenditures and of gross investment.
CONSUMPTION EXPENDITURES
GROSS OUTPUT OF GENERAL GOVERNMENT
Value added COMPENSATION OF GENERAL GOVERNMENT EMPLOYEES
Estimates of real Federal civilian compensation are derived by quantity extrapolation using hours worked and reference-year compensation. This procedure is described in the earlier section on estimates of real national defense civilian compensation, page II-67. Estimates of real compensation of Coast Guard personnel are derived in the same manner as for military personnel and are added to the estimate for civilian nondefense personnel to yield total real nondefense compensation.
GENERAL GOVERNMENT CONSUMPTION OF FIXED CAPITAL
Estimates of real general government consumption of fixed capital are prepared by deflation as part of BEA’s perpetual inventory method. Price indexes for corresponding categories of structures and equipment and software are used to deflate investment flows that are inputs to the perpetual inventory estimation process.
Intermediate goods and services purchased DURABLE GOODS
Estimates of real consumption expenditures for durable goods are derived by deflation. A BEA price index for computers is used to deflate computer parts. PPIs are used for all other durable goods [27.5].

II—74 .
NONDURABLE GOODS
Estimates of real CCC inventory change are derived for each of 10 commodities (barley, butter, cheese, corn, upland cotton, grain sorghum, dried milk, rough rice, soybeans, wheat) plus an “all other” commodity category. Estimates of real direct purchases and forfeitures by farmers are obtained by multiplying the related quantities by the ASCS market prices in the base year. Estimates of real dispositions are derived by multiplying data for quantity sold and donated by related average reference-year prices from ASCS [20.1, 20.5]. For all other commodities, real estimates are prepared by deflating the current-dollar value of ASCS direct purchases, forfeitures, and dispositions using a price index of average prices received by farmers [20.5]. Each series is seasonally adjusted using the Census Bureau’s seasonal adjustment program. Estimates of real net inventory change are derived by subtracting the seasonally-adjusted real dispositions from the sum of the seasonally-adjusted real direct purchases and real forfeitures. Estimates of real consumption expenditures for other nondurable goods are derived using direct pricing and deflation. Direct-pricing is used to estimate real purchases of petroleum for the SPR [25.3] and for sales from the Naval Petroleum Reserve [25.2], using prices and quantities from DOE. Other petroleum products and most other nondurable goods are deflated using PPIs [27.5].
SERVICES
SERVICES FURNISHED WITHOUT PAYMENT BY FINANCIAL INTERMEDIARIES EXCEPT LIFE INSURANCE CARRIERS
Real estimates of the imputed financial services (or services rendered without payment to the Federal Government by commercial banks) are projected at the time of the annual revision using a judgmental trend. For current quarterly estimates, the estimates of imputed financial services are judgmental extrapolations.
RESEARCH AND DEVELOPMENT
Estimates of real research and development (R&D) are prepared by deflation using PPIs [27.5].
RENT, COMMUNICATIONS, AND UTILITIES
Estimates of real rent, communications, and utilities (combined) are prepared by deflation using CPIs [27.1].
TRAVEL AND TRANSPORTATION
Estimates of real travel and transportation are prepared by deflation using PPIs [27.5].
OWN-ACCOUNT INVESTMENT
Own-account investment in structures is judgmentally allocated between defense and nondefense. The nondefense portion of Federal own-account investment in structures is assigned to “Conservation and development.” (See NIPA table 5.8.xB, line 26). Own-account goods and
II—75 .
services for construction are then split into durable goods (0.194), nondurable goods (0.433) and services (0.373). Existing price indexes for other durable goods, other nondurable goods, and architectural and engineering services are used to deflate own-account goods and services for nondefense construction.
Estimates of real own-account investment in software are prepared by deflation using a combination of the price indexes for BEA own-account software intermediate inputs index and the Federal Government nondefense compensation price index.
SALES TO OTHER SECTORS
All annual and quarterly estimates of real sales are prepared by deflation using PPIs [27.5].
Gross Investment
STRUCTURES
Real estimates of structures are derived by deflating 11 subcategories of new construction and net purchases of used structures using the price indexes identified in table II-6 and that are described below.
New construction The 11 subcategories of new construction put in place are prepared by deflation using the implicit price deflator developed by BEA for office, factories, and education buildings, the FHWA composite index, the Census Bureau price index for single-family houses under construction, the Turner index, the Bureau of Reclamation index, and the Handy Whitman index. These indexes are smoothed by a three-quarter moving average or are using the Census Bureau’s seasonal adjustment program. The FHWA highway composite price index is smoothed by a 12-quarter moving average, which is seasonally adjusted using the Census Bureau’s seasonal adjustment program.
Net purchases of used structures Estimates of real net purchases of new residential and nonresidential structures are prepared by deflating current-dollar estimates using BEA’s implicit price deflators for new private nonfarm residential structures, for new private farm residential structures, and for new private nonresidential structures.
EQUIPMENT AND SOFTWARE
Computers Estimates of real computers are prepared by deflating current-dollar estimates using BEA’s implicit price deflators for computer equipment.

II—76 .
Software Beginning with 1998, prepackaged software is deflated using the PPI for prepackaged software [27.5], with a downward bias adjustment to account for the likely understatement of quality-adjusted price declines. For 1994 through 1997, prepackaged software is deflated using BEA’s matched-model index with the bias adjustment. Prior to 1994, an unweighted average of the BEA hedonic index for spreadsheets and word processors and a matched-model index is used. Custom software is deflated using the percentage change in a weighted index of prepackaged software price changes (25 percent) and own-account software price changes (75 percent).
Aerospace equipment All annual and quarterly real estimates for aerospace equipment are prepared by deflation using PPIs [27.5].
Vehicles All annual and quarterly estimates of real vehicles are prepared by deflation using PPIs [27.5].
Enterprise equipment All annual and quarterly real estimates for enterprise equipment are prepared by deflation using PPIs [27.5].

II—77 .
SOURCES This is a list of information sources used in preparing current- and chained-dollar estimates of Federal Government transactions in the national income and product accounts. Many of the sources shown are unpublished internal record keeping documents and files. In some cases, the information used is more detailed than that available in the listed source, which is the publication most accessible to the public. 1. Board of Governors of the Federal Reserve System. Annual Report. Washington, DC: Board of
Governors, annually. 2. Board of Governors of the Federal Reserve System. Sector Tables. Flow of Funds Accounts.
(Statistical Release Z.1.) Washington, DC: Board of Governors, quarterly. 3. Budget documents – Basic
3.1. U.S. Executive Office of the President. Office of Management and Budget. Budget of the United States Government. Washington, DC: U.S. Government Printing Office, annually.
3.2. U.S. Executive Office of the President. Office of Management and Budget. Budget of the
United States Government: Appendix. Washington, DC: U.S. Government Printing Office, annually.
3.3. U.S. Executive Office of the President. Office of Management and Budget. Budget of the
United States Government: Midsession Review. Washington, DC: U.S. Government Printing Office, annually.
3.4. U.S. Executive Office of the President. Office of Management and Budget. Budget of the
United States Government: Special Analyses. Washington, DC: U.S. Government Printing Office, annually.
4. Budget documents – Supporting
4.1. U.S. Department of the Air Force. "Committee Staff Procurement Backup Book, Aircraft Procurement, Air Force." Washington, DC, annually, unpublished.
4.2. U.S. Department of the Air Force. "Committee Staff Procurement Backup Book, Missile
Procurement, Air Force." Washington, DC, annually, unpublished.
4.3. U.S. Department of the Air Force. "Committee Staff Procurement Backup Book, Other Procurement, Air Force.” Washington, DC, annually, unpublished.
4.4. U.S. Department of the Army. "Procurement Programs, Committee Staff Procurement

II—78 .
Backup Book, Aircraft Procurement, Army.” (DD-COMP (AR) 1092.) Washington, DC, annually, unpublished.
4.5. U.S. Department of the Army. "Procurement Programs, Committee Staff Procurement
Backup Book, Missile Procurement, Army." (DD-COMP (AR) 1092.) Washington, DC, annually, unpublished.
4.6. U.S. Department of the Army. "Procurement Programs, Committee Staff Procurement
Backup Book, Other Procurement, Army." (DD-COMP (AR) 1092.) Washington, DC, annually, unpublished.
4.7. U.S. Department of the Army. "Procurement Programs, Committee Staff Procurement
Backup Book, Weapons and Tracked Combat Vehicle Procurement, Army.” (DD-COMP (AR) 1092.) Washington, DC, annually, unpublished.
4.8. U.S. Department of the Navy. Naval Air Systems Command. "Fiscal-year Budget
Estimates, Justification of Estimates, Aircraft Procurement, Navy.” Washington, DC, annually, unpublished.
4.9. U.S. Department of the Navy. "Other Procurement, Navy, Budget Activity 5, Civil
Engineering Support Equipment, Committee Staff Procurement Backup Book.” Washington, DC, annually, unpublished.
4.10. U.S. Department of the Navy. "Procurement, Marine Corps, Budget Activity 5, Support Vehicles, Committee Staff Procurement Backup Book.” Washington, DC, annually, unpublished.
4.11. U.S. Department of the Navy. "Procurement, Marine Corps, Budget Activity 2,
Weapons and Tracked Combat Vehicles, Committee Staff Procurement Backup Book.” Washington, DC, annually, unpublished.
4.12. U.S. Department of the Navy. "Weapons Procurement, Navy, Budget Activity 4,
Other Weapons, Committee Staff Procurement Backup Book.” Washington, DC, annually, unpublished.
4.13. U.S. Department of the Navy. "Weapons Procurement, Navy, Budget Activity 1,
Ballistic Missiles, Committee Staff Procurement Backup Book.” Washington, DC, annually, unpublished.
4.14. U.S. Department of the Navy. "Weapons Procurement, Navy, Budget Activity 2,
Other Missiles, Committee Staff Procurement Backup Book.” Washington, DC, annually, unpublished.
4.15. U.S. Executive Office of the President. Office of Management and Budget. "Pay
Raise Impacts.” Washington, DC, annually, unpublished.

II—79 .
4.16. U.S. Executive Office of the President. Office of Management and Budget. SF133
Report on Budget Execution and Budgetary Resources. Washington, DC, quarterly.
5. Contract awards
5.1. U.S. Department of Defense. Directorate for Information Operations and Reports. Prime
Contract Awards by Service Category and Federal Supply Classification. Washington, DC: Directorate for Information Operations and Reports, annually.
5.2. U.S. Department of Defense. Office of the Secretary of Defense (Comptroller). Department of Defense Prime Contract Awards. Washington, DC: National Technical Information Service, annually.
5.3. U.S. Department of Defense. Office of the Secretary of Defense (Comptroller). 500
Contractors Receiving the Largest Dollar Volume of Prime Contract Awards for RDT&E. Washington, DC: National Technical Information Service, annually.
5.4. U.S. General Services Administration. Federal Procurement Data System. Federal
Contract Actions Over $25,000 for Supplies and Equipment-Detail by F.C. Arlington, VA: U.S. Government Printing Office, quarterly, unpublished.
5.5. U.S. General Services Administration. Federal Procurement Data Center. Federal
Procurement Data System, Special Analysis II. Arlington, VA: GSA, quarterly.
5.6. U.S. General Services Administration. Federal Procurement Data Center. Federal Procurement Data System, Standard Report. Arlington, VA: U.S. Government Printing Office, annually.
6. Financial reports
6.1. U.S. Department of the Air Force. Defense Finance and Accounting Service. "Defense Business Operating Fund.” (DD-COMP (SA) 1303.) Denver, CO, annually, unpublished.
6.2. U.S. Department of the Air Force. Headquarters, Air Force Accounting and Finance
Center. "Appropriation Status by Fiscal-year Program and Subaccounts.” (DD-COMP (M) 1002.) Denver, CO, monthly, unpublished.
6.3. U.S. Department of the Air Force. Headquarters, Air Force Accounting and Finance
Center. "Report on Budget Execution." (DD-COMP (M) 133.) Denver, CO, monthly, unpublished.
6.4. U.S. Department of the Army. Defense Business Operating Fund. "Army Stock Fund.”

II—80 .
(DD-COMP (M) 1303.) Indianapolis, IN, annually, unpublished.
6.5. U.S. Department of the Army. Defense Finance and Accounting Service. "Appropriation Status by Fiscal-year Program and Subaccounts.” (DD-COMP (M) 1002.) Indianapolis, IN, monthly, unpublished.
6.6. U.S. Department of the Army. Defense Finance and Accounting Service. "Report on
Budget Execution, Obligation Basis." (DD-COMP (M) 1125.) Indianapolis, IN, monthly, unpublished.
6.7. U.S. Department of the Army. Finance and Accounting Center. "Army Industrial Fund,
Annual Report to the Department of Defense." (DD-COMP (AR) 1307.) Indianapolis, IN, annually, unpublished.
6.8. U.S. Department of Defense. Defense Business Operations Fund. "Air Force Consolidated
Supply Management, Reimbursable Issues.” Indianapolis, IN, monthly, unpublished.
6.9. U.S. Department of Defense. Washington Headquarters Service. "Appropriation Status by Fiscal-year Program and Subaccounts.” (DD-COMP (M) 1002.) Washington, DC, monthly, unpublished.
6.10. U.S. Department of Defense. Washington Headquarters Service. "Defense Logistic
Agency Stock Funds.” (DD-COMP (M) 1303.) Alexandria, VA, monthly, unpublished.
6.11. U.S. Department of the Navy. Defense Finance and Accounting Service. “Appropriation Status by Fiscal-year Program and Subaccounts.” (DD-COMP (M) 1002.) Cleveland, OH, monthly, unpublished.
6.12. U.S. Department of the Navy. Defense Finance and Accounting Service. "Report on
Budget Execution, Obligation Basis." (DD-COMP (M) 1125.) Cleveland, OH, monthly, unpublished.
7. Manpower reports
7.1. Army Times Publishing Company. At Your Service Report. Washington, DC: Army Times Publishing Company, periodically.
7.2. U.S. Department of the Air Force. "Justification of Estimates for Military Personnel, Air
Force.” Washington, DC, annually, unpublished.
7.3. U.S. Department of the Army. "Justification of Estimates for Military Personnel, Army.” Washington, DC, annually, unpublished.
7.4. U.S. Department of Defense. Office of the Actuary. "DOD Statistical Report on the
Military Retirement System." (RCS DDM(A) 1375.) Washington, DC, annually, unpublished.

II—81 .
7.5. U.S. Department of Defense. Office of the Secretary of Defense. Military Compensation
Background Papers, Compensation Elements and Related Manpower Cost Items, Their Purposes and Legislative Backgrounds. Washington, DC: U.S. Government Printing Office, quadrennially.
7.6. U.S. Department of Defense. Washington Headquarters Services. Military Manpower
Statistics. Washington, DC: U.S. Government Printing Office, quarterly.
7.7. U.S. Department of the Navy. "Justification of Estimates for Military Personnel, Marine Corps.” Washington, DC, annually, unpublished.
7.8. U.S. Department of the Navy. "Justification of Estimates for Military Personnel, Navy.”
Washington, DC, annually, unpublished.
7.9. U.S. Executive Office of the President. Schedule One. "General Wage Rates.” Washington, DC, annually, unpublished.
7.10. U.S. Executive Office of the President. Schedule Two. "Foreign Service
Compensation.” Washington, DC, annually, unpublished. 7.11. U.S. Executive Office of the President. Schedule Three. “Department of Veteran's
Affairs Compensation.” Washington, DC, annually, unpublished.
7.12. U.S. Executive Office of the President. Schedule Four. "Senior Executive Service Compensation.” Washington, DC, annually, unpublished.
7.13. U.S. Executive Office of the President. Schedule Five. "Executive Service
Compensation." Washington, DC, annually, unpublished.
7.14. U.S. Executive Office of the President. Schedule Six. "Vice President and Members of Congress Compensation." Washington, DC, annually, unpublished.
7.15. U.S. Executive Office of the President. Schedule Seven. "Judicial Salaries.”
Washington, DC, annually, unpublished.
7.16. U.S. Executive Office of the President. Schedule Nine. "Interim Geographic Adjustments for Certain Employees in Specified Areas Compensation.” Washington, DC, annually, unpublished.
7.17. U.S. Office of Personnel Management. Office of Workforce Information. "Current
Status Report.” Washington, DC, quarterly, unpublished.
7.18. U.S. Office of Personnel Management. Office of Workforce Information. Federal Civilian Workforce Statistics, Employment and Trends. Washington, DC: U.S. Government Printing Office, bimonthly.

II—82 .
7.19. U.S. Office of Personnel Management. Office of Workforce Information. Federal Civilian Workforce Statistics, Pay Structure of the Federal Civil Service. Washington, DC: U.S. Government Printing Office, annually.
8. McNeil Technologies. “Total Energy Use and Cost by Federal Agencies.” Washington, DC,
annually. 9. National Aeronautics and Space Administration. Financial Management Division. "NASA
Contractual Research and Development Expenditures Report.” Washington, DC, quarterly, unpublished.
10. National Science Foundation. Division of Science Resources Statistics. Federal Funds for
Research and Development, Detailed Historical Tables. Arlington, VA: National Science Foundation, annually.
11. National Science Foundation. Division of Science Resources Statistics. Federal Research and
Development Funding by Budget Function. Arlington, VA: National Science Foundation, annually.
12. Organization for Economic Cooperation and Development. Department of Economics and
Statistics. Main Economic Indicators. Paris, France: Organization for Economic Cooperation and Development, monthly.
13. Pension Benefit Guaranty Corporation. Pension Insurance Data Book: PBGC – Single and Multi-employer Benefits Payments. Washington, DC: Pension Benefit Guaranty Corporation, annually.
14. Petroleum product reports
14.1. U.S. Department of Defense. Defense Finance and Accounting Service, “Financial Status Report for Bulk and Bunker Products,” Columbus, OH, monthly, unpublished.
14.2. U.S. Department of Defense. Defense Finance and Accounting Service, “Financial
Status Report for Into-Plane Products,” Columbus, OH, monthly, unpublished.
14.3. U.S. Department of Defense. Defense Finance and Accounting Service, “Purchase Journal of Posts, Camps, and Stations – Direct Delivery,” Columbus, OH, monthly, unpublished.
14.4. U.S. Department of Defense. Defense Logistics Agency. "Defense Energy Support
Center Fact Book.” Ft. Belvoir, VA, annually. 15. Production control reports
15.1. U.S. Department of the Air Force. F/A-22 System Program Office, Aeronautical
Systems Center. “Monthly Delivery Report – F/A-22.” Wright-Patterson Air Force Base,

II—83 .
Fairborn, OH, quarterly, unpublished.
15.2. U.S. Department of the Air Force. Plan and Program Directorate, Air Mobility Command. “Monthly Delivery Report-C-17.” Scott Air Force Base, Belleville, IL, quarterly, unpublished.
15.3. U.S. Department of the Army. Program Executive Office, Armored Systems
Modernization. "Monthly Delivery Report.” Warren, MI, quarterly, unpublished.
15.4. U.S. Department of the Army. Redstone Arsenal, Missiles. “Monthly Delivery Report.” Huntsville, AL, quarterly, unpublished.
15.5. U.S. Department of the Army. Tank Automotive Command, Vehicles. “Monthly
Delivery Report.” Rock Island, IL, quarterly, unpublished. 16. Social Security Administration reports
16.1. Social Security Administration. “Social Security Benefit Data: Benefit Composition Report,” Washington, DC, monthly.
16.2. Social Security Administration. Social Security Bulletin: Annual Statistical
Supplement. Washington, DC: U.S. Government Printing Office, monthly.
16.3. Social Security Administration. “SSI Report,” Washington, DC, monthly, unpublished.
17. Tennessee Valley Authority. TVA Retirement System Board of Directors. TVA Retirement
System Annual Report. Knoxville, TN: TVA, annually. 18. Thrift Savings Oversight Board. “Financial Status of the
TSP Fund.” Washington, DC: monthly, unpublished. 19. Travel and transportation reports
19.1. U.S. Department of the Air Force. Air Mobility Command. "Commercial Augmentation Expenses.” Scott Air Force Base, Belleville, IL, quarterly, unpublished.
19.2. U.S. Department of the Army. Surface Deployment and Distribution Command.
"Defense Price Index Report: Passenger Traffic Report of Air Passenger Fares.” Alexandria, VA, quarterly, unpublished.
19.3. U.S. Department of the Army. Surface Deployment and Distribution Command.
"Defense Price Index Report: Passenger Traffic Report of Bus Passenger Fares.” Alexandria, VA, quarterly, unpublished.
19.4. U.S. Department of the Army. Surface Deployment and Distribution Command.
"Logistics Longshoreman Rate’s Report." Alexandria, VA, annually, unpublished.
II—84 .
19.5. U.S. Department of the Army. Surface Deployment and Distribution Command.
"Personal Property Transportation Costs.” Alexandria, VA, annually, unpublished.
19.6. U.S. Department of the Navy. Military Sealift Command. "Summary of Time Chartered and Contract Operated Ships.” Washington, DC, quarterly, unpublished.
19.7. U.S. Department of the Navy. Navy Material Transportation Office. “QuickTrans
Cost Data.” Norfolk, VA, quarterly, unpublished. 20. U.S. Department of Agriculture reports
20.1. U.S. Department of Agriculture. Agricultural Marketing Service. Dairy Market Statistics: Annual Summary. Washington, DC: U.S. Government Printing Office, annually.
20.2. U.S. Department of Agriculture. Commodity Credit Corporation. ANNXC1 Report:
Net Gain or Loss on Commodity Operations by Commodity. Kansas City, MO: U.S. Government Printing Office, monthly.
20.3. U.S. Department of Agriculture. Food and Nutrition Service. "Food stamp benefits report,” Washington, DC, quarterly, unpublished.
20.4. U.S. Department of Agriculture. Forest Service. "Timber Harvested Under Sales and
Land Exchanges by Regions." Washington, DC, quarterly, unpublished.
20.5. U.S. Department of Agriculture. National Agricultural Statistics Service. "Agricultural Prices." Washington, DC, Agricultural Statistics Board of Publications, monthly.
21. U.S. Department of Commerce, Bureau of the Census reports
21.1. U.S. Department of Commerce. Bureau of the Census. Current Construction Reports: Value of New Construction Put In Place (C-30). Washington, DC: U.S. Government Printing Office, monthly.
21.2. U.S. Department of Commerce. Bureau of the Census. Federal Expenditures by State
for Fiscal-years. Washington, DC: U.S. Government Printing Office, annually. 22. U.S. Department of Commerce, BEA publications and articles
22.1. U.S. Department of Commerce. Bureau of Economic Analysis. Corporate Profits: Profits Before Tax, Profits Tax Liability, and Dividends. (BEA Methodology Paper Series MP-2.) Washington, DC: U.S. Government Printing Office, September 2002.
II—85 .
22.2. U.S. Department of Commerce. Bureau of Economic Analysis. Foreign Transactions. (BEA Methodology Paper Series MP-3.) Washington, DC: U.S. Government Printing Office, May 1987.
22.3. U.S. Department of Commerce. Bureau of Economic Analysis. "Implicit Price
Deflators for Military Construction.” Survey of Current Business 63 (November 1983): 14-18.
22.4. U.S. Department of Commerce. Bureau of Economic Analysis. "Improved Deflation
of Purchases of Computers.” Survey of Current Business 66 (March 1986): 7-10.
22.5. U.S. Department of Commerce. Bureau of Economic Analysis. "Measuring the Services of Commercial Banks in the NIPAs: Changes in Concepts and Methods.” Survey of Current Business 83 (September 2003): 33-44.
22.6. U.S. Department of Commerce. Bureau of Economic Analysis. Price Changes of
Defense Purchases of the United States. Washington, DC: U.S. Government Printing Office, March 1979.
22.7. U.S. Department of Commerce. Bureau of Economic Analysis. "Quality-Adjusted
Price Indexes for Computer Processors and Selected Peripheral Equipment.” Survey of Current Business 66 (January 1986): 41-50.
22.8. U.S. Department of Commerce. Bureau of Economic Analysis. "U.S. International
Transactions." Quarterly in March, June, September, and December issues of Survey of Current Business. Washington, DC: U.S. Government Printing Office, monthly.
23. U.S. Department of Defense. Defense Communications Agency. “Communication Services
Industrial Fund.” (H670.) Washington, DC, quarterly, unpublished. 24. U.S. Department of Defense. Defense Communications Agency. “Communication Services
Industrial Fund.” Scott Air Force Base, Belleville, IL, quarterly, unpublished. 25. U.S. Department of Defense. Office of Civilian Health and Medical Programs of the
Uniformed Services. "TRICARE annual report.” (OHM-065.) Aurora, CO, monthly, unpublished.
25. U.S. Department of Energy reports
25.1. U.S. Department of Energy. Energy Information Administration. Petroleum Monthly Supply. Washington, DC, monthly.
25.2. U.S. Department of Energy. Office of Naval Petroleum and Oil Shale Reserves. "Monthly Sales Distribution of NPR Production.” Washington, DC, monthly, unpublished.

II—86 .
25.3. U.S. Department of Energy. Office of the Strategic Petroleum Reserve. "SPR Report.” Washington, DC, as relevant, formerly monthly, unpublished.
26. U.S. Department of Health and Human Services. Centers for Medicaid and Medicare. “Incurred
HSMI benefits,” Baltimore, MD, annual, unpublished. 27. U.S. Department of Labor, Bureau of Labor Statistics reports
27.1. U.S. Department of Labor. Bureau of Labor Statistics. CPI Detailed Report. Washington, DC: U.S. Government Printing Office, monthly.
27.2. U.S. Department of Labor. Bureau of Labor Statistics. Employment and Earnings.
Washington, DC: U.S. Government Printing Office, monthly.
27.3. U.S. Department of Labor. Bureau of Labor Statistics. Employment and Wages. Washington, DC: U.S. Government Printing Office, annually.
27.4. U.S. Department of Labor. Bureau of Labor Statistics. Employment Cost Index.
Washington, DC: U.S. Government Printing Office, quarterly.
27.5. U.S. Department of Labor. Bureau of Labor Statistics. Producer Prices and Price Indexes. Washington, DC: U.S. Government Printing Office, monthly.
28. U.S. Department of Labor, other reports
28.1. U.S. Department of Labor. Employment and Training Administration. Office of
Workforce Security. "FUTA taxable wages.” Washington, DC, annually, unpublished.
28.2. U.S. Department of Labor. Employment and Training Administration. Unemployment Insurance Financial Data. (ETA Handbook 394.) Washington, DC: U.S. Department of Labor, 1984.
28.3. U.S. Department of Labor. Employment and Training Administration.
"Unemployment Insurance Weekly Claim Report." Washington, DC, weekly.
28.4. U.S. Department of Labor. Employment and Training Administration. "Update to ETA Handbook 394.” Washington, DC, annually, unpublished.
28.5. U.S. Department of Labor. Office of Management and Planning. “Classification of
Benefits report, Black Lung disability trust fund,” Washington, DC, monthly, unpublished.
29. U.S. Department of Treasury, Alcohol and Tobacco Tax and Trade Bureau reports
II—87 .
29.1. U.S. Department of the Treasury. Alcohol and Tobacco Tax and Trade Bureau. Monthly Statistical Release: Beer. Washington, DC: U.S. Department of the Treasury, monthly.
29.2. U.S. Department of the Treasury. Alcohol and Tobacco Tax and Trade Bureau.
Monthly Statistical Release: Tobacco Products. Washington, DC: U.S. Department of the Treasury, monthly.
29.3. U.S. Department of the Treasury. Alcohol and Tobacco Tax and Trade Bureau. “Tax
Collections, Cumulative Summary,” Washington, DC: U.S. Department of the Treasury, annually.
30. U.S. Department of Treasury. Bureau of Public Debt. “Monthly Interest Expense Report,”
Washington, DC, monthly. 31. U.S. Department of Treasury, Financial Management Service (FMS) reports
31.1. U.S. Department of the Treasury. Financial Management Service. Combined Statement of Receipts, Outlays, and Balances of the United States Government. Washington, DC: U.S. Government Printing Office, annually. (For fiscal-years after 1983.)
31.2. U.S. Department of the Treasury. Financial Management Service. Daily Treasury
Statement. Washington, DC: U.S. Government Printing Office, daily.
31.3. U.S. Department of the Treasury. Financial Management Service. Monthly Treasury Statement of Receipts and Outlays of the United States Government (and unpublished detail). Washington, DC: U.S. Government Printing Office, monthly.
31.4. U.S. Department of the Treasury. Financial Management Service. Treasury Bulletin.
Washington, DC: U.S. Government Printing Office, quarterly.
31.5. U.S. Department of the Treasury. Financial Management Service. Treasury Combined Statement of Receipts, Expenditures, and Balances of the United States. Washington, DC: U.S. Government Printing Office, annually. (For fiscal-years prior to 1984.)
32. U.S. Department of Treasury, Internal Revenue Service (IRS) reports
32.1. U.S. Department of Treasury. Internal Revenue Service. "Net Tax Refund Report: Nationwide Consolidated Report.” Washington, DC, monthly, unpublished.
32.2. U.S. Department of Treasury. Internal Revenue Service. Statistics of Income Bulletin.

II—88 .
Washington, DC: U.S. Government Printing Office, quarterly.
32.3. U.S. Department of Treasury. Internal Revenue Service. "Summary of Assessment Certificates Issued.” Washington, DC, monthly, unpublished.
33. U.S. Department of Veterans Affairs. Administrator of Veterans Affairs. Annual Report.
Washington, DC: U.S. Government Printing Office, annually. 34. U.S. Department of Veterans Affairs. Office of Budget and Finance. "Statement of Ledger
Assets, Income, and Disbursements, Veterans Life Insurance.” Washington, DC, monthly, unpublished.
35. U.S. General Services Administration. “Vehicle acquisition report: Customer Agency Report,”
Washington, DC, quarterly, unpublished. 36. U.S. Postal Service reports
36.1. U.S. Postal Service. Department of the Controller. Summary Financial and Operating Statements. Washington, DC: U.S. Postal Service, every four weeks.
36.2. U.S. Postal Service. Postal Data Center. "Invoice and Statement.” (PS Form
1903-DZ.) Washington, DC, quarterly, unpublished.
36.3. U.S. Postal Service. Postmaster General. Annual Report of the Postmaster General. Washington, DC: U.S. Postal Service, annually.
37. U.S. Railroad Retirement Board. Annual Report. Chicago, IL: U.S. Railroad Retirement Board,
annually.

II—89 .
APPENDIX I Information Related to Federal Government Transactions The following list of selected articles and papers on Federal Government transactions have appeared in the Survey of Current Business. Recurring Articles 1. “Federal Budget Estimates, Fiscal-year 2005,” (March 2004) by Benyam Tsehaye and Michelle Robinson presents the annual translation of the administrations’ budget receipts and outlays on a basis that is consistent with the framework of the national income and product account. Similar articles appeared in the most years, including the following issues: March 2003, March 2002, and May 2001. 2. “Comparison of BEA Estimates of Personal Income and IRS Estimates of Adjusted Gross Income: New Estimates for 2002, Revised Estimates for 1959-2001," (November 2004) by Mark A. Ledbetter presents the reconciliation of personal income and adjusted gross income. Similar articles appeared in the most years, including the following issues: April 2004, November 2002), and November 2001. 3. “Federal Personal Income Tax Liabilities and Payments: Preliminary Estimates for 2002, Revised Estimates for 1959-2001" (December 2004) by Mark A. Ledbetter presents a comparison of BEA’s estimates of Federal personal current taxes and Internal Revenue Service estimates of personal income tax liabilities. Similar articles appeared in the most years, including the following issues: June 2004, November 2002, and December 2001. Nonrecurring Articles and Papers 1. “Improved Estimates of the National Income and Product Accounts for 1929-2002: Results of the Comprehensive Revision,” (February 2004) by Eugene P. Seskin and Daniel Larkins. 2. “Recognition of Business and Government Expenditures for Software as Investment: Methodology and Quantitative Impacts, 1959-98,” by Robert P. Parker and Bruce T. Grimm. Full paper http://www.bea.gov/bea/papers/software.pdf. Revised PDF versions of Tables 1 and 11, with explanatory note, updated September 3. 2002. Revised spreadsheet version of Tables 1 and 11, with explanatory note, Updated May 19, 2003. 12. “The Deflation of Military Aircraft,” by Richard C. Ziemer and Pamela A. Kelly in Price Measurements and Their Uses, Studies in Income and Wealth, Volume 57, National Bureau of Economic Research in Income and Wealth, 1990, University of Chicago Press, Chicago.

II—90 .
APPENDIX II Definitions of the Major Types of National Defense Consumption Expenditures and Gross Investment Following are brief definitions of the BEA categories of national defense consumption expenditures and gross investment. These categories fall uniquely into one of the four major product types of final demand: Durable goods (including equipment), nondurable goods, services, and structures. These categories differ from the similarly named appropriation categories because the latter may include more than one of the major product types. For example, the Department of Defense (DOD) appropriation for aircraft contains some purchases of engineering services that BEA classifies as services rather than as durable goods. Government consumption expenditures consists of gross output of general government less own-account investment and sales to other sectors. Gross output of general government consists of value added and intermediate goods and services purchased. Value added consists of compensation of general government employees and consumption of general government fixed capital. Compensation of general government employees consists of military compensation and civilian compensation. Military compensation consists of wages and salaries and supplements to wages and salaries paid to military employees of DOD. This category also includes pay of the military reserve but does not include the Coast Guard and the National Oceanic and Atmospheric Administration except in wartime. Civilian compensation consists of wages and salaries and supplements to wages and salaries paid to civilian employees of DOD. This category also includes employees in defense activities of non-DOD agencies; it excludes employees of DOD civil functions such as the Corps of Engineers. The direct and indirect hire of foreign nationals are excluded from this category and are included in the personnel support category. Consumption of general government fixed capital consists of the depreciation of national defense structures, equipment, and software. Intermediate goods and services purchased consists of durable goods (primarily parts and hand tools) , nondurable goods, and services involving research and development, installation support, weapon support, personnel support, travel of persons, transportation of material, and general government intermediate inputs for production sold to other sectors and for own-account investment. Durable goods consumption expenditures consists primarily of parts and hand tools for aircraft, missiles, ships, vehicles, electronic equipment, and other durable goods.
II—91 .
Aircraft consumption expenditures consists of spare and repair parts, modification kits, support equipment, and hand tools. Missiles consumption expenditures consists of spare and repair parts, modification kits, and support equipment for missiles, launching devices, guidance radars, and shelters, as well as parts for torpedoes, space devices such as satellites and boosters. Ships consumption expenditures consists of spare and repair parts for new ship construction, conversions, and overhauls. Vehicles consumption expenditures consists of spare and repair parts, and modification kits for combat and noncombat vehicles. Electronics consumption expenditures consists of spare and repair parts and modification kits for nonairborne communication and electronic equipment, encryption equipment, hand held radios, radar systems, satellite ground stations, tactical communications equipment, sonars, reconnaissance equipment, base communications, and general purpose computer parts and related equipment parts, such as for printers. Other durable goods consumption expenditures consists of spare and repair parts. Nondurable goods consists of petroleum products, ammunition, and other nondurable goods. Petroleum products consists of refined petroleum products such as jet fuels, heating oil, diesel fuel, and gasoline. Ammunition consists of bombs, cartridges, torpedoes, mines, demolition materials, and other nonnuclear explosive products. Also included are the various load, assembly, and pack services performed on purchased components. Other nondurable goods consists of food, clothing, printing, medical supplies, cleaning supplies, and other nondurable goods. Services consists of contractual research and development, installation support services, weapon support services, personnel support service, travel of persons, and transportation of materials. Research and development (R&D) consists of contractual research, development, and test and evaluation performed by the private sector under contract to DOD. Also included are atomic energy R&D for defense funded by the Department of Energy (DOE) and Federal research centers operated by the private sector, such as the Jet Propulsion Laboratory. R&D performed by DOD and DOE atomic energy activity employees are excluded. Installation support consists of contractual services related to the operation and maintenance of military installations. Among these services are communications, postage, utilities, equipment maintenance and rental, property maintenance, housekeeping services, and contractor-operated installations.

II—92 .
Weapons support consists of contractual services related to depot maintenance, weapons modification services, engineering support, system management, and production base support. Spare parts and modification kits are included in purchases of goods; only purchases of services are included in this category. Personnel support consists of contractual services for consulting, training, education, and direct and indirect hire of foreign nationals. Transportation of material consists of contractual care and movement of goods by water, rail, truck, and air. Also included are the rental of trucks and other transportation equipment and warehousing fees. Travel of persons consists of the care and movement of DOD military and civilian employees. Included are tickets for all modes of travel, per diem, taxi fares, automobile rental, and mileage allowances for privately owned vehicles. Own-account investment consists of structures and software produced by government for its own use. It includes the intermediate purchases of goods and services, including compensation of general government employees. Sales to other sectors consists of sales of training services and sales of defense goods and services to foreign governments under the foreign military sales program. Gross investment consists of structures including intermediate purchases of goods and services, including compensation of general government employees. Structures consists of military facilities, family housing, atomic energy structures, and the intermediate purchases of goods and services, including compensation of general government employees. Military facilities consists of new construction of facilities built to assist, enhance, or house, the activities of the military services. It includes office buildings, industrial facilities, warehouses, hospitals, highways, airfields, water and sewer systems. Other structures consists of family housing construction, net purchases of existing structures, and atomic energy defense construction funded by the Department of Energy, and intermediate purchases of goods and services, including compensation of general government employees. Equipment consists of aircraft, missiles, ships, vehicles, electronic equipment, software, and other equipment. Aircraft gross investment consists of flyaway new aircraft, both fixed-wing and rotary wing. Missiles gross investment consists of flyaway new missiles, launching devices, guidance radars, and shelters, as well as space devices such as satellites and boosters.

II—93 .
Ships gross investment consists of new ship construction and conversions. This category also includes foreign military sales of ships during their period of construction. This category does not include ship overhauls. Vehicles gross investment consists of new combat and noncombat vehicles. Electronics equipment gross investment consists of nonairborne communication and electronic equipment. Items include general purpose computers and related equipment such as printers, encryption equipment, hand held radios, radar systems, satellite ground stations, tactical communications equipment, sonars, reconnaissance equipment, and base communication and electronic equipment. Software consists of prepackaged, custom, and own-account software. Other equipment gross investment consists of equipment not elsewhere classified. Among the items included are airfield lights, photographic equipment, electronic test equipment, biological and chemical defense equipment, night vision goggles, sonobuoys, and small arms.

II—94 .
TABLES
TABLE II-1. TIMING BASIS OF CURRENT RECEIPTS Category Timing basis Current Receipts: Current tax receipts Personal current taxes Withheld Accrual Nonwithheld Payments Taxes on production and imports Excise taxes Accrual Customs duties Accrual Taxes on corporate income Accrual Taxes from rest of the world Payments Contributions for government social insurance Employee contributions Payments Employer contributions Accrual Income receipts on assets Accrual Current transfer receipts From business Accrual From persons Payments Current surplus of government enterprises Accrual
TABLE II-2. TIMING BASIS OF CURRENT EXPENDITURES AND GROSS INVESTMENT Category Timing basis Current expenditures: Consumption expenditures Compensation Accrual Other Delivery Current transfer payments Government social benefits Medicare Accrual Other Payments Other current transfer payments Payments Interest payments Accrual Subsidies Agricultural Payments Other Accrual Gross investment: Structures Value-put-in-place Equipment and software Ships Value-put-in-place Other Delivery
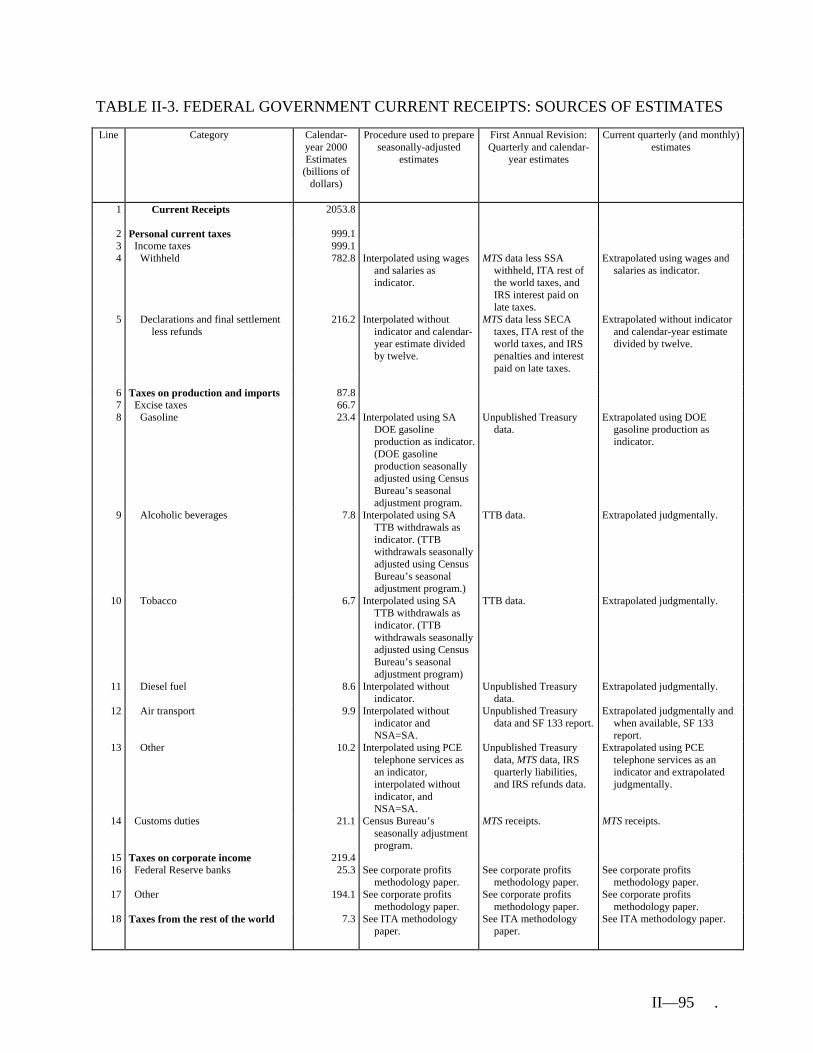
II—95 .
TABLE II-3. FEDERAL GOVERNMENT CURRENT RECEIPTS: SOURCES OF ESTIMATES
Line Category Calendar-year 2000 Estimates
(billions of dollars)
Procedure used to prepare seasonally-adjusted
estimates
First Annual Revision: Quarterly and calendar-
year estimates
Current quarterly (and monthly) estimates
1 Current Receipts 2053.8
2 Personal current taxes 999.1 3 Income taxes 999.1 4 Withheld 782.8 Interpolated using wages
and salaries as indicator.
MTS data less SSA withheld, ITA rest of the world taxes, and IRS interest paid on late taxes.
Extrapolated using wages and salaries as indicator.
5 Declarations and final settlement less refunds
216.2 Interpolated without indicator and calendar-year estimate divided by twelve.
MTS data less SECA taxes, ITA rest of the world taxes, and IRS penalties and interest paid on late taxes.
Extrapolated without indicator and calendar-year estimate divided by twelve.
6 Taxes on production and imports 87.8 7 Excise taxes 66.7 8 Gasoline 23.4 Interpolated using SA
DOE gasoline production as indicator. (DOE gasoline production seasonally adjusted using Census Bureau’s seasonal adjustment program.
Unpublished Treasury data.
Extrapolated using DOE gasoline production as indicator.
9 Alcoholic beverages 7.8 Interpolated using SA TTB withdrawals as indicator. (TTB withdrawals seasonally adjusted using Census Bureau’s seasonal adjustment program.)
TTB data. Extrapolated judgmentally.
10 Tobacco 6.7 Interpolated using SA TTB withdrawals as indicator. (TTB withdrawals seasonally adjusted using Census Bureau’s seasonal adjustment program)
TTB data. Extrapolated judgmentally.
11 Diesel fuel 8.6 Interpolated without indicator.
Unpublished Treasury data.
Extrapolated judgmentally.
12 Air transport
9.9 Interpolated without indicator and NSA=SA.
Unpublished Treasury data and SF 133 report.
Extrapolated judgmentally and when available, SF 133 report.
13 Other 10.2 Interpolated using PCE telephone services as an indicator, interpolated without indicator, and NSA=SA.
Unpublished Treasury data, MTS data, IRS quarterly liabilities, and IRS refunds data.
Extrapolated using PCE telephone services as an indicator and extrapolated judgmentally.
14 Customs duties 21.1 Census Bureau’s seasonally adjustment program.
MTS receipts. MTS receipts.
15 Taxes on corporate income 219.4 16 Federal Reserve banks 25.3 See corporate profits
methodology paper. See corporate profits
methodology paper. See corporate profits
methodology paper. 17 Other 194.1 See corporate profits
methodology paper. See corporate profits
methodology paper. See corporate profits
methodology paper. 18 Taxes from the rest of the world
7.3 See ITA methodology paper.
See ITA methodology paper.
See ITA methodology paper.

II—96 .
TABLE II-3. FEDERAL GOVERNMENT CURRENT RECEIPTS: SOURCES OF ESTIMATES
Line Category Calendar-year 2000 Estimates
(billions of dollars)
Procedure used to prepare seasonally-adjusted
estimates
First Annual Revision: Quarterly and calendar-
year estimates
Current quarterly (and monthly) estimates
19 Contributions for government social insurance
691.7
20 Employer contributions 335.4 21 Old-age, survivors, disability, and
hospital insurance 300.3
22 Old-age, survivors, and disability insurance
233.3 Interpolated using wages and salaries as indicator.
SSA quarterly taxable wages and salaries multiplied by the OASDI tax rate.
Extrapolated using wages and salaries as indicator.
23 Hospital insurance 67.0 Interpolated using wages and salaries as indicator and interpolated without indicator.
SSA quarterly taxable wages and salaries multiplied by the HI tax rate and MTS.
Extrapolated using wages and salaries as indicator and extrapolated judgmentally.
24 Unemployment insurance 28.0 25 State unemployment insurance 20.5 Interpolated using wages
and salaries as indicator.
Unpublished BLS data. Extrapolated using wages and salaries as indicator.
26 Federal unemployment tax 7.1 Interpolated using wages and salaries as indicator.
Unpublished OWS taxable wages and salaries multiplied by tax rates.
Extrapolated using wages and salaries as indicator.
27 Railroad employees unemployment insurance
0.1 Interpolated using railroad wages and salaries as indicator.
MTS data. Extrapolated using railroad wages and salaries as indicator.
28 Federal employees unemployment insurance
0.4 Imputations using benefits, see table II-4.
Imputations using benefits, see table II-4.
Imputations using benefits, see table II-4.
29 Railroad retirement 2.9 Interpolated using railroad wages and salaries as indicator.
Regular: RRB annual taxable wages and salaries multiplied by tax rate.
Supplemental: Budget data.
Extrapolated using railroad wages and salaries as indicator.
30 Pension benefit guaranty 0.8 NSA = SA. Budget data. Extrapolated judgmentally. 31 Veterans life insurance 0.0 Interpolated without
indicator. VA financial reports. Extrapolated judgmentally.
32 Workers' compensation 2.2 Imputation using benefits, see table II-4.
Imputation using benefits, see table II-4.
Imputation using benefits, see table II-4.
33 Military medical insurance 1.2 Imputation using benefits, see table II-4.
Imputation using benefits, see table II-4.
Imputation using benefits, see table II-4.
34 Employee and self- employed contributions
356.3
35 Old-age, survivors, disability, and hospital insurance
333.7
36 Employees 299.7 37 Old-age, survivors, and
disability insurance 231.3 Interpolated using wages
and salaries as indicator.
SSA quarterly taxable wages and salaries multiplied by the OASDI tax rate.
Extrapolated using wages and salaries as indicator.
38 Hospital insurance 68.4 Interpolated using wages and salaries as indicator.
SSA quarterly taxable wages and salaries multiplied by the HI tax rate.
Extrapolated using wages and salaries as indicator.
39 Self-employed 34.0 Interpolated without indicator.
SSA quarterly taxable wages and salaries multiplied by the OASDI and HI tax rate.
Extrapolated judgmentally.
40 Supplementary medical insurance
20.4 Interpolated without indicator.
MTS and CMS data. Extrapolated judgmentally.
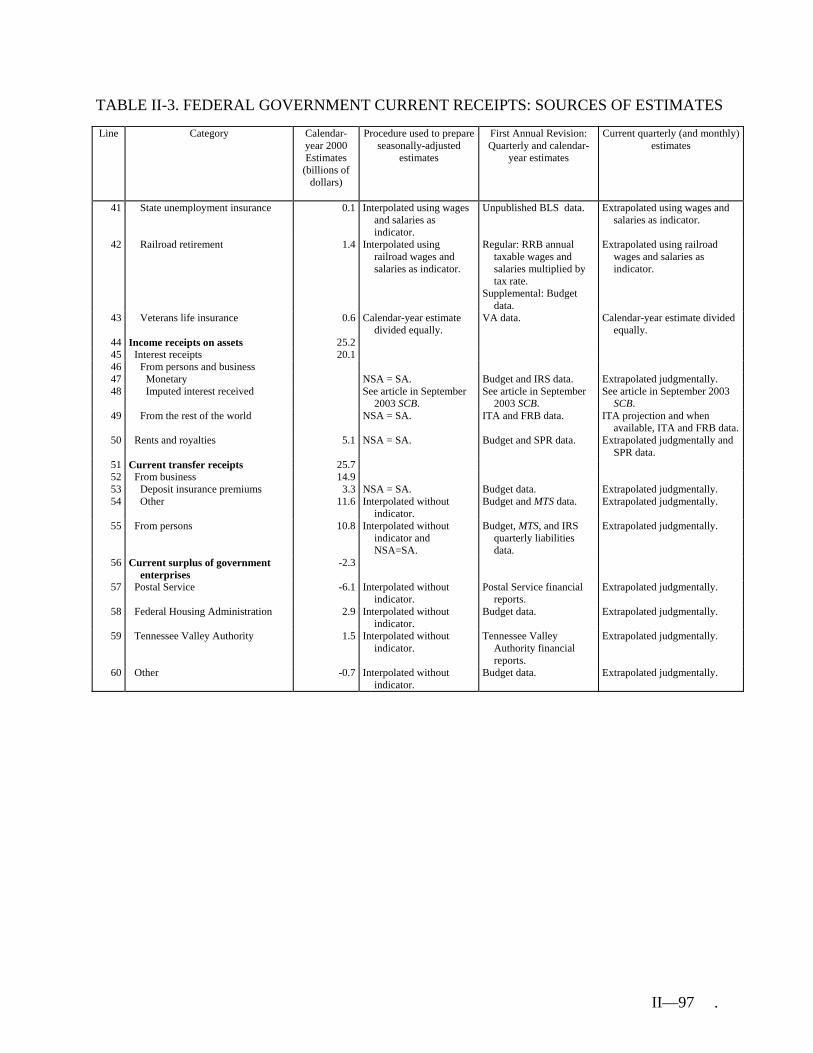
II—97 .
TABLE II-3. FEDERAL GOVERNMENT CURRENT RECEIPTS: SOURCES OF ESTIMATES
Line Category Calendar-year 2000 Estimates
(billions of dollars)
Procedure used to prepare seasonally-adjusted
estimates
First Annual Revision: Quarterly and calendar-
year estimates
Current quarterly (and monthly) estimates
41 State unemployment insurance 0.1 Interpolated using wages and salaries as indicator.
Unpublished BLS data. Extrapolated using wages and salaries as indicator.
42 Railroad retirement 1.4 Interpolated using railroad wages and salaries as indicator.
Regular: RRB annual taxable wages and salaries multiplied by tax rate.
Supplemental: Budget data.
Extrapolated using railroad wages and salaries as indicator.
43 Veterans life insurance 0.6 Calendar-year estimate divided equally.
VA data. Calendar-year estimate divided equally.
44 Income receipts on assets 25.2 45 Interest receipts 20.1 46 From persons and business 47 Monetary NSA = SA. Budget and IRS data. Extrapolated judgmentally. 48 Imputed interest received See article in September
2003 SCB. See article in September
2003 SCB. See article in September 2003
SCB. 49 From the rest of the world NSA = SA. ITA and FRB data. ITA projection and when
available, ITA and FRB data.50 Rents and royalties 5.1 NSA = SA. Budget and SPR data. Extrapolated judgmentally and
SPR data. 51 Current transfer receipts 25.7 52 From business 14.9 53 Deposit insurance premiums 3.3 NSA = SA. Budget data. Extrapolated judgmentally. 54 Other 11.6 Interpolated without
indicator. Budget and MTS data. Extrapolated judgmentally.
55 From persons 10.8 Interpolated without indicator and NSA=SA.
Budget, MTS, and IRS quarterly liabilities data.
Extrapolated judgmentally.
56 Current surplus of government enterprises
-2.3
57 Postal Service -6.1 Interpolated without indicator.
Postal Service financial reports.
Extrapolated judgmentally.
58 Federal Housing Administration 2.9 Interpolated without indicator.
Budget data. Extrapolated judgmentally.
59 Tennessee Valley Authority 1.5 Interpolated without indicator.
Tennessee Valley Authority financial reports.
Extrapolated judgmentally.
60 Other -0.7 Interpolated without indicator.
Budget data. Extrapolated judgmentally.
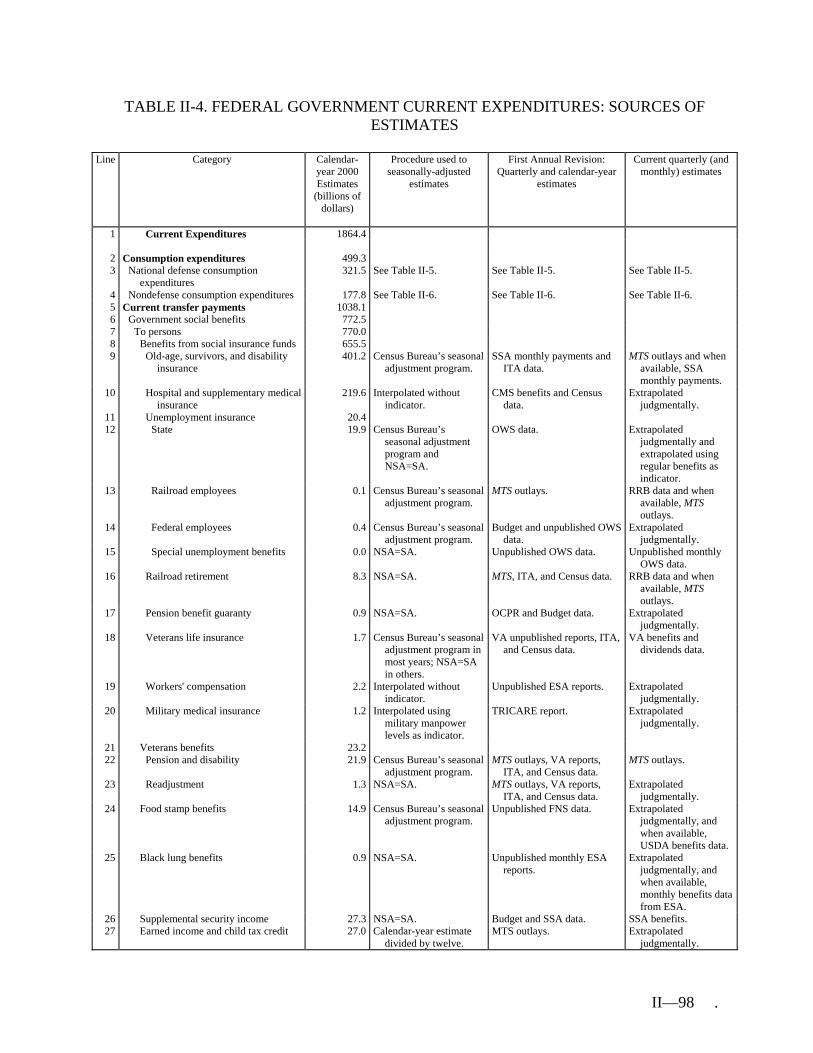
II—98 .
TABLE II-4. FEDERAL GOVERNMENT CURRENT EXPENDITURES: SOURCES OF ESTIMATES
Line Category Calendar-
year 2000 Estimates
(billions of dollars)
Procedure used to seasonally-adjusted
estimates
First Annual Revision: Quarterly and calendar-year
estimates
Current quarterly (and monthly) estimates
1 Current Expenditures 1864.4
2 Consumption expenditures 499.3 3 National defense consumption
expenditures 321.5 See Table II-5. See Table II-5. See Table II-5.
4 Nondefense consumption expenditures 177.8 See Table II-6. See Table II-6. See Table II-6. 5 Current transfer payments 1038.1 6 Government social benefits 772.5 7 To persons 770.0 8 Benefits from social insurance funds 655.5 9 Old-age, survivors, and disability
insurance 401.2 Census Bureau’s seasonal
adjustment program. SSA monthly payments and
ITA data. MTS outlays and when
available, SSA monthly payments.
10 Hospital and supplementary medical insurance
219.6 Interpolated without indicator.
CMS benefits and Census data.
Extrapolated judgmentally.
11 Unemployment insurance 20.4 12 State 19.9 Census Bureau’s
seasonal adjustment program and NSA=SA.
OWS data. Extrapolated judgmentally and extrapolated using regular benefits as indicator.
13 Railroad employees 0.1 Census Bureau’s seasonal adjustment program.
MTS outlays. RRB data and when available, MTS outlays.
14 Federal employees 0.4 Census Bureau’s seasonal adjustment program.
Budget and unpublished OWS data.
Extrapolated judgmentally.
15 Special unemployment benefits 0.0 NSA=SA. Unpublished OWS data. Unpublished monthly OWS data.
16 Railroad retirement 8.3 NSA=SA. MTS, ITA, and Census data. RRB data and when available, MTS outlays.
17 Pension benefit guaranty 0.9 NSA=SA. OCPR and Budget data. Extrapolated judgmentally.
18 Veterans life insurance 1.7 Census Bureau’s seasonal adjustment program in most years; NSA=SA in others.
VA unpublished reports, ITA, and Census data.
VA benefits and dividends data.
19 Workers' compensation 2.2 Interpolated without indicator.
Unpublished ESA reports. Extrapolated judgmentally.
20 Military medical insurance 1.2 Interpolated using military manpower levels as indicator.
TRICARE report. Extrapolated judgmentally.
21 Veterans benefits 23.2 22 Pension and disability 21.9 Census Bureau’s seasonal
adjustment program. MTS outlays, VA reports,
ITA, and Census data. MTS outlays.
23 Readjustment 1.3 NSA=SA. MTS outlays, VA reports, ITA, and Census data.
Extrapolated judgmentally.
24 Food stamp benefits 14.9 Census Bureau’s seasonal adjustment program.
Unpublished FNS data. Extrapolated judgmentally, and when available, USDA benefits data.
25 Black lung benefits 0.9 NSA=SA. Unpublished monthly ESA reports.
Extrapolated judgmentally, and when available, monthly benefits data from ESA.
26 Supplemental security income 27.3 NSA=SA. Budget and SSA data. SSA benefits. 27 Earned income and child tax credit 27.0 Calendar-year estimate
divided by twelve. MTS outlays. Extrapolated
judgmentally.
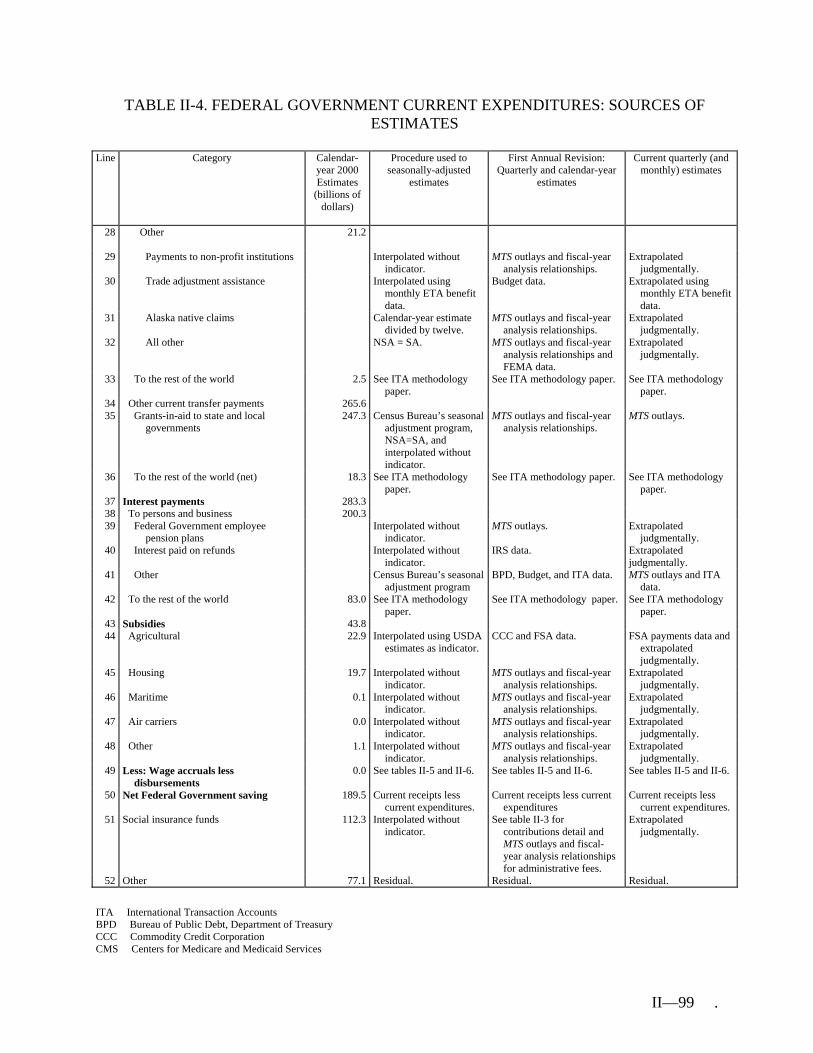
II—99 .
TABLE II-4. FEDERAL GOVERNMENT CURRENT EXPENDITURES: SOURCES OF ESTIMATES
Line Category Calendar-
year 2000 Estimates
(billions of dollars)
Procedure used to seasonally-adjusted
estimates
First Annual Revision: Quarterly and calendar-year
estimates
Current quarterly (and monthly) estimates
28 Other
21.2
29 Payments to non-profit institutions Interpolated without indicator.
MTS outlays and fiscal-year analysis relationships.
Extrapolated judgmentally.
30 Trade adjustment assistance Interpolated using monthly ETA benefit data.
Budget data. Extrapolated using monthly ETA benefit data.
31 Alaska native claims Calendar-year estimate divided by twelve.
MTS outlays and fiscal-year analysis relationships.
Extrapolated judgmentally.
32 All other NSA = SA. MTS outlays and fiscal-year analysis relationships and FEMA data.
Extrapolated judgmentally.
33 To the rest of the world 2.5 See ITA methodology paper.
See ITA methodology paper. See ITA methodology paper.
34 Other current transfer payments 265.6 35 Grants-in-aid to state and local
governments 247.3 Census Bureau’s seasonal
adjustment program, NSA=SA, and interpolated without indicator.
MTS outlays and fiscal-year analysis relationships.
MTS outlays.
36 To the rest of the world (net) 18.3 See ITA methodology paper.
See ITA methodology paper. See ITA methodology paper.
37 Interest payments 283.3 38 To persons and business 200.3 39 Federal Government employee
pension plans Interpolated without
indicator. MTS outlays. Extrapolated
judgmentally. 40 Interest paid on refunds Interpolated without
indicator. IRS data. Extrapolated
judgmentally. 41 Other Census Bureau’s seasonal
adjustment program BPD, Budget, and ITA data. MTS outlays and ITA
data. 42 To the rest of the world 83.0 See ITA methodology
paper. See ITA methodology paper. See ITA methodology
paper. 43 Subsidies 43.8 44 Agricultural 22.9 Interpolated using USDA
estimates as indicator. CCC and FSA data. FSA payments data and
extrapolated judgmentally.
45 Housing 19.7 Interpolated without indicator.
MTS outlays and fiscal-year analysis relationships.
Extrapolated judgmentally.
46 Maritime 0.1 Interpolated without indicator.
MTS outlays and fiscal-year analysis relationships.
Extrapolated judgmentally.
47 Air carriers 0.0 Interpolated without indicator.
MTS outlays and fiscal-year analysis relationships.
Extrapolated judgmentally.
48 Other 1.1 Interpolated without indicator.
MTS outlays and fiscal-year analysis relationships.
Extrapolated judgmentally.
49 Less: Wage accruals less disbursements
0.0 See tables II-5 and II-6. See tables II-5 and II-6. See tables II-5 and II-6.
50 Net Federal Government saving 189.5 Current receipts less current expenditures.
Current receipts less current expenditures
Current receipts less current expenditures.
51 Social insurance funds 112.3 Interpolated without indicator.
See table II-3 for contributions detail and MTS outlays and fiscal-year analysis relationships for administrative fees.
Extrapolated judgmentally.
52 Other 77.1 Residual. Residual. Residual.
ITA International Transaction Accounts BPD Bureau of Public Debt, Department of Treasury CCC Commodity Credit Corporation CMS Centers for Medicare and Medicaid Services

II—100 .
ESA Employment Standards Administration, Department of Labor ETA Employment and Training Administration FNS Food and Nutrition Service, Department of Agriculture FSA Farm Service Agency, Department of Agriculture IRS Internal Revenue Service, Department of Treasury MTS Monthly Treasury Statement OCPR Office of Corporate Policy and Research, Pension Benefit Guaranty Corporation OWS Office of Workforce Security, Department of Labor RRB Railroad Retirement Board SSA Social Security Administration USDA U.S. Department of Agriculture VA Veterans Administration

II—101 .
TABLE II-5. FEDERAL GOVERNMENT NATIONAL DEFENSE CONSUMPTION EXPENDITURES AND GROSS INVESTMENT: SOURCES OF ESTIMATES
Line Category Calendar-
year 2000 Estimates
(billions of dollars)
Procedure used to prepare seasonally-adjusted estimates
First Annual Revision: Quarterly and calendar-
year estimates
Current quarterly estimates
1 National Defense Consumption Expenditures and Gross Investment
370.3
2 Consumption expenditures 321.5
3 Gross output of general government 324.6 4 Value added 199.2 5 Compensation of general
government employees 138.9
6 Military 89.4 7 Wages and salaries Interpolated using
military employment as indicator.
Budget wages and salaries.
Extrapolated using military employment as indicator.
8 Supplements to wages and salaries:
9 Employer contributions for government social insurance
See table II-3 for sources of estimates.
See table II-3 for sources of estimates.
See table II-3 for sources of estimates.
10 Employer contributions for employee pension and insurance funds
Interpolated using military personnel as indicator.
OPM data. Extrapolated using military personnel as indicator.
11 Civilian 49.5 12 Wages and salaries Interpolated using
BLS employment a indicator.
OPM wages and salaries and DOT data.
Extrapolated using BLS employment as indicator.
13 Supplements to wages and salaries:
14 Employer contributions for government social insurance
See table II-3 for sources of estimates.
See table II-3 for source of estimates.
See table II-3 for sources of estimates.
15 Employer contributions for employee pension and insurance funds
Interpolated using BLS employment as indicator.
OPM data. Extrapolated using BLS employment as indicator.
16 General government consumption of fixed capital
60.2 See table II-7 for sources of estimates.
See table II-7 for sources of estimates.
See table II-7 for sources of estimates.
17 Intermediate goods and services purchased
125.4
18 Durable goods
22.3
19 Aircraft 9.8 NSA=SA. Financial report quarterly disbursements.
Extrapolated using MTS outlays and, when available, financial report quarterly disbursements.
20 Missiles 2.5 NSA=SA. Financial report quarterly disbursements.
Extrapolated using MTS outlays and, when available, financial report quarterly disbursements.
21 Ships
1.3 Census Bureau’s seasonal adjustment program.
MTS outlays. MTS outlays.
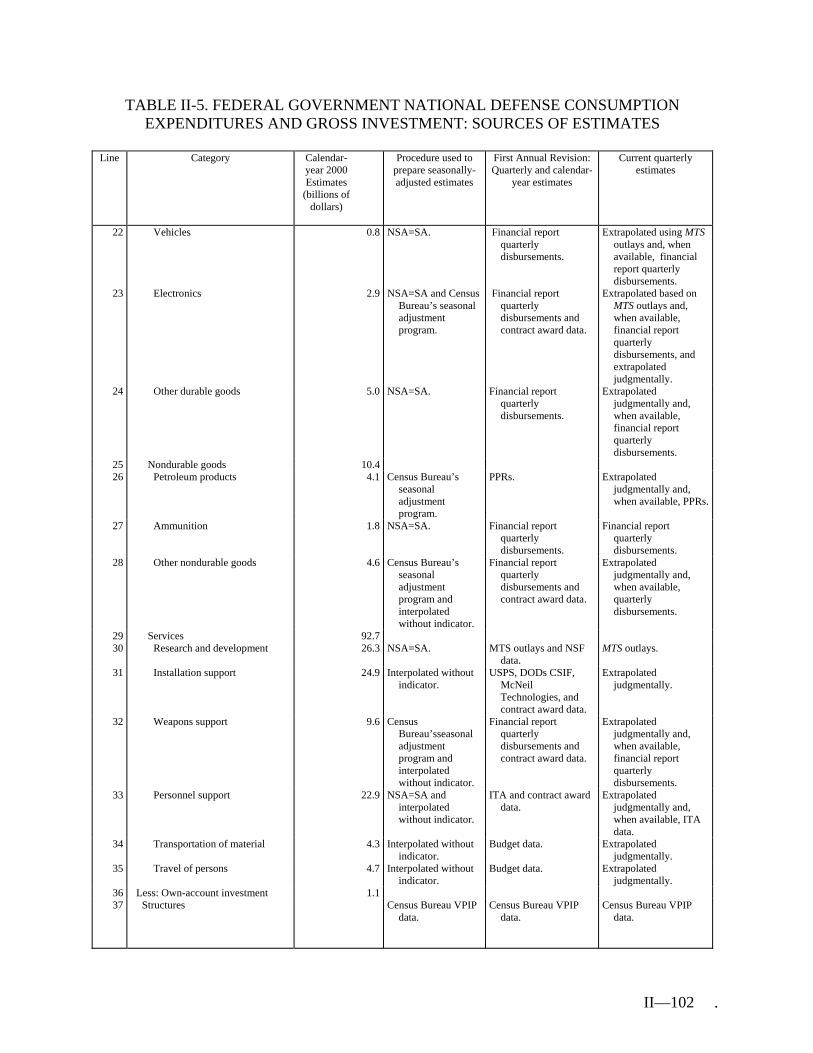
II—102 .
TABLE II-5. FEDERAL GOVERNMENT NATIONAL DEFENSE CONSUMPTION EXPENDITURES AND GROSS INVESTMENT: SOURCES OF ESTIMATES
Line Category Calendar-
year 2000 Estimates
(billions of dollars)
Procedure used to prepare seasonally-adjusted estimates
First Annual Revision: Quarterly and calendar-
year estimates
Current quarterly estimates
22 Vehicles 0.8 NSA=SA. Financial report quarterly disbursements.
Extrapolated using MTS outlays and, when available, financial report quarterly disbursements.
23 Electronics 2.9 NSA=SA and Census Bureau’s seasonal adjustment program.
Financial report quarterly disbursements and contract award data.
Extrapolated based on MTS outlays and, when available, financial report quarterly disbursements, and extrapolated judgmentally.
24 Other durable goods 5.0 NSA=SA. Financial report quarterly disbursements.
Extrapolated judgmentally and, when available, financial report quarterly disbursements.
25 Nondurable goods 10.4 26 Petroleum products 4.1 Census Bureau’s
seasonal adjustment program.
PPRs. Extrapolated judgmentally and, when available, PPRs.
27 Ammunition 1.8 NSA=SA. Financial report quarterly disbursements.
Financial report quarterly disbursements.
28 Other nondurable goods 4.6 Census Bureau’s seasonal adjustment program and interpolated without indicator.
Financial report quarterly disbursements and contract award data.
Extrapolated judgmentally and, when available, quarterly disbursements.
29 Services 92.7 30 Research and development 26.3 NSA=SA. MTS outlays and NSF
data. MTS outlays.
31 Installation support 24.9 Interpolated without indicator.
USPS, DODs CSIF, McNeil Technologies, and contract award data.
Extrapolated judgmentally.
32 Weapons support 9.6 Census Bureau’sseasonal adjustment program and interpolated without indicator.
Financial report quarterly disbursements and contract award data.
Extrapolated judgmentally and, when available, financial report quarterly disbursements.
33 Personnel support 22.9 NSA=SA and interpolated without indicator.
ITA and contract award data.
Extrapolated judgmentally and, when available, ITA data.
34 Transportation of material 4.3 Interpolated without indicator.
Budget data. Extrapolated judgmentally.
35 Travel of persons 4.7 Interpolated without indicator.
Budget data. Extrapolated judgmentally.
36 Less: Own-account investment 1.1 37 Structures
Census Bureau VPIP data.
Census Bureau VPIP data.
Census Bureau VPIP data.

II—103 .
TABLE II-5. FEDERAL GOVERNMENT NATIONAL DEFENSE CONSUMPTION EXPENDITURES AND GROSS INVESTMENT: SOURCES OF ESTIMATES
Line Category Calendar-
year 2000 Estimates
(billions of dollars)
Procedure used to prepare seasonally-adjusted estimates
First Annual Revision: Quarterly and calendar-
year estimates
Current quarterly estimates
38 Software Interpolated using investment in computers as indicator.
Portion of national total for own-account software.
Extrapolated judgmentally.
39 Less: Sales to other sectors 1.9 NSA=SA MTS outlays. MTS outlays and, when available, financial report quarterly disbursements.
40 Gross Investment 48.8 41 Structures 5.0 42 New 5.0 43 Buildings 1.6 44 Residential 1.3 Census Bureau’s
seasonal adjustment program .
Financial report quarterly disbursements.
Extrapolated using MTS outlays and, when available, financial report quarterly disbursements.
45 Other, including industrial 0.3 Census Bureau’s seasonal adjustment program. .
Census Bureau VPIP data.
Census Bureau VPIP data.
46 Military facilities 3.4 NSA=SA. Financial report quarterly disbursements.
Extrapolated using MTS outlays and, when available, financial report quarterly disbursements.
47 Net purchases of used structures 0.0 48 Equipment and software 43.8 49 Aircraft 7.8
Directly priced: NSA=SA. Production control reports and “budget exhibit” data.
Unpublished DOD data and, when available, production control reports and contract control documentation reports.
Ratio: NSA=SA. Financial report quarterly disbursements.
Extrapolated using MTS outlays and, when available, financial report quarterly disbursements.
50 Missiles 2.7 Directly priced: NSA=SA. Production control
reports and “budget exhibit” data.
Unpublished DOD data and, when available, production control reports and contract control documentation reports.
Ratio:
NSA=SA. Financial report quarterly disbursements.
Extrapolated using MTS outlays and, when available, financial report quarterly disbursements.

II—104 .
TABLE II-5. FEDERAL GOVERNMENT NATIONAL DEFENSE CONSUMPTION EXPENDITURES AND GROSS INVESTMENT: SOURCES OF ESTIMATES
Line Category Calendar-
year 2000 Estimates
(billions of dollars)
Procedure used to prepare seasonally-adjusted estimates
First Annual Revision: Quarterly and calendar-
year estimates
Current quarterly estimates
51 Ships 6.6 Census Bureau’s seasonal adjustment program.
MTS outlays. MTS outlays.
52 Vehicles 1.8 Directly priced: NSA=SA. Production control
reports and “budget exhibit” data.
Unpublished DOD data and, when available, production control reports and contract control documentation reports.
Ratio: NSA=SA. Financial report quarterly disbursements.
Extrapolated using MTS outlays and, when available, financial report quarterly disbursements.
53 Electronics and software 10.1 54 Electronics and computers NSA=SA and Census
Bureau’s seasonal adjustment program.
Financial reports quarterly disbursements and contract award data.
Extrapolated using MTS outlays and, when available, financial report quarterly disbursements and extrapolated judgmentally.
55 Software Interpolated using SEC data receipts and trade source sales as indicator.
Census Bureau Service Annual Survey, BEA’s I-O accounts, and other sources.
Extrapolated using SEC data receipts and trade source sales as indicator.
56 Other equipment 14.9 NSA=SA. financial report quarterly disbursements.
Extrapolated based on MTS outlays and, when available, financial report quarterly disbursements.
BLS Bureau of Labor Statistics CCDR Contract Control Documentation Report CCR Current Construction Reports CFC Consumption of fixed capital CSIF Communication Services Industrial Fund DOD U.S. Department of Defense DOT U.S. Department of Transportation I-O BEA’s Input-Output accounts NSF National Science Foundation OPM Office of Personnel Management PCR Production control report PCR Production control report PPR Petroleum products report SEC Securities and Exchange Commission USPS United States Postal Service VPIP Value-Put-in-Place

II—105 .
TABLE II-6. FEDERAL GOVERNMENT NONDEFENSE CONSUMPTION EXPENDITURES AND GROSS INVESTMENT: SOURCES OF ESTIMATES
Line Category Calendar-year
2000 Estimates (billions of
dollars)
Procedure used to prepare seasonally-adjusted estimate
First Annual Revision: Quarterly and calendar-year
estimates
Current quarterly estimates
1 Nondefense Consumption Expenditures and Gross Investment
208.5
2 Consumption expenditures 177.8
3 Gross output of general government 184.6 4 Value added 116.2 5 Compensation of general
government employees 94.8
6 Wages and salaries Interpolated using employment as indicator.
OPM wages and salaries and DOT data.
Extrapolated judgmentally.
7 Supplements to wages and salaries:
8 Employer contributions for government social insurance
See table II-3 for sources of estimates.
See table II-3 for sources of estimates.
See table II-1 for sources of estimates.
9 Employer contributions for employee pension and insurance funds
Interpolated using employment as indicator.
OPM data. Extrapolated judgmentally.
10 General government consumption of fixed capital
21.4 See table II-8 for sources of estimates.
See table II-8 for sources of estimates.
See table II-8 for sources of estimates.
11 Intermediate goods and services purchased
68.4
12 Durable goods 1.8 NSA=SA. MTS outlays. MTS outlays. 13 Nondurable goods 8.5 14 Commodity Credit Corporation
inventory change 0.8 Census Bureau’s
seasonal adjustment program.
CCC Headquarter offices, NASS and Dairy Market News.
CCC Headquarter offices, NASS and Dairy Market News.
15 Petroleum products 7.7 Interpolated without indicator.
McNeil technologies data. Extrapolated judgmentally.
16 Services 58.1 17 Imputed interest See article in September
2003 SCB. See article in September
2003 SCB. See article in September
2003 SCB. 18 Research and development Interpolated without
indicator and NSA=SA.
NSF and NASA disbursements data.
Extrapolated judgmentally.
19 Rent, communications, and utilities
Interpolated without indicator.
Budget data. Extrapolated judgmentally.
20 Travel and transportation Interpolated without indicator.
Budget data. Extrapolated judgmentally.
21 Less: Own-account investment 2.1 22 Structures Census Bureau VPIP
data. Census Bureau VPIP data. Census Bureau VPIP data.
23 Software Interpolated using investment in computers as indicator.
Portion of national total for own-account software.
Extrapolated judgmentally.
24 Less: Sales to other sectors 4.7 NSA=SA. USDA, SPR, and MTS outlays.
Extrapolated judgmentally and when available, USDA, SPR, and MTS outlays.
25 Gross Investment 30.7 26 Structures 8.3 27 New 9.5 Census Bureau VPIP
data. Census Bureau VPIP data. Census Bureau VPIP data.
28 Net purchases of used structures -1.2 Interpolated without indicator.
FHA, VA, and GSA data. Last quarter of annual revision.
29 Equipment and software 22.3
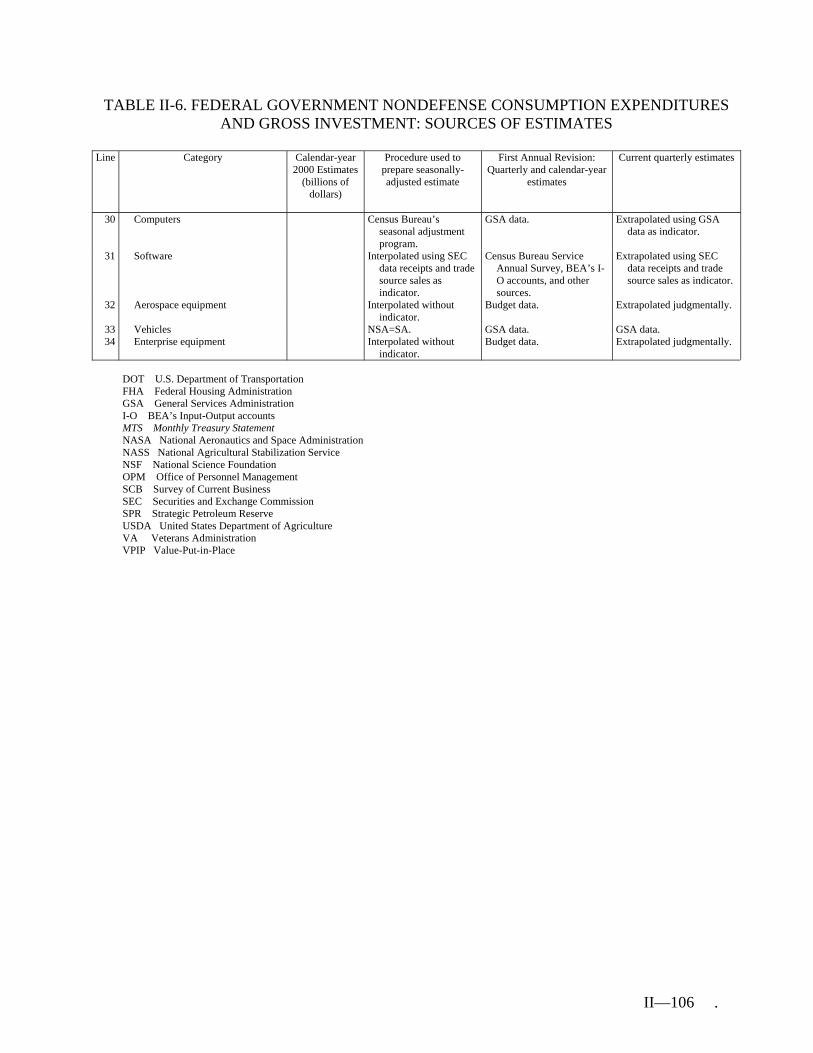
II—106 .
TABLE II-6. FEDERAL GOVERNMENT NONDEFENSE CONSUMPTION EXPENDITURES AND GROSS INVESTMENT: SOURCES OF ESTIMATES
Line Category Calendar-year
2000 Estimates (billions of
dollars)
Procedure used to prepare seasonally-adjusted estimate
First Annual Revision: Quarterly and calendar-year
estimates
Current quarterly estimates
30 Computers Census Bureau’s seasonal adjustment program.
GSA data. Extrapolated using GSA data as indicator.
31 Software Interpolated using SEC data receipts and trade source sales as indicator.
Census Bureau Service Annual Survey, BEA’s I-O accounts, and other sources.
Extrapolated using SEC data receipts and trade source sales as indicator.
32 Aerospace equipment Interpolated without indicator.
Budget data. Extrapolated judgmentally.
33 Vehicles NSA=SA. GSA data. GSA data. 34 Enterprise equipment Interpolated without
indicator. Budget data. Extrapolated judgmentally.
DOT U.S. Department of Transportation FHA Federal Housing Administration GSA General Services Administration I-O BEA’s Input-Output accounts MTS Monthly Treasury Statement NASA National Aeronautics and Space Administration NASS National Agricultural Stabilization Service NSF National Science Foundation OPM Office of Personnel Management SCB Survey of Current Business SEC Securities and Exchange Commission SPR Strategic Petroleum Reserve USDA United States Department of Agriculture VA Veterans Administration VPIP Value-Put-in-Place
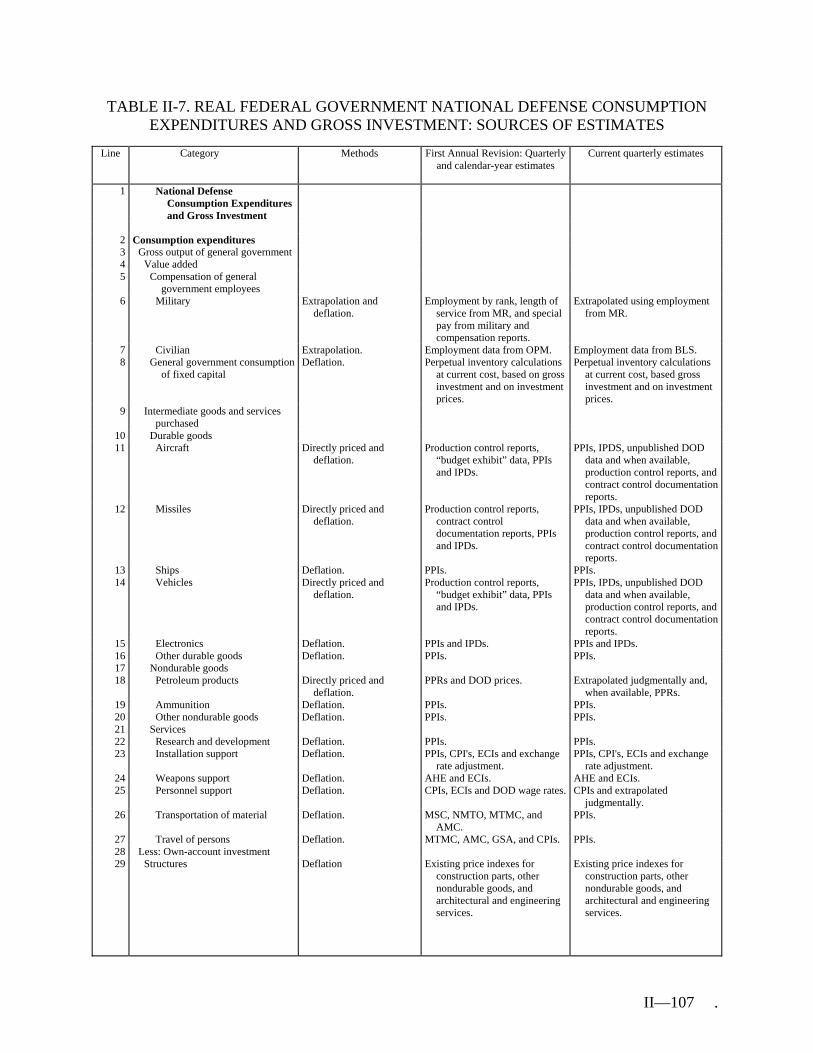
II—107 .
TABLE II-7. REAL FEDERAL GOVERNMENT NATIONAL DEFENSE CONSUMPTION EXPENDITURES AND GROSS INVESTMENT: SOURCES OF ESTIMATES
Line Category Methods First Annual Revision: Quarterly
and calendar-year estimates
Current quarterly estimates
1 National Defense Consumption Expenditures and Gross Investment
2 Consumption expenditures 3 Gross output of general government 4 Value added 5 Compensation of general
government employees
6 Military Extrapolation and deflation.
Employment by rank, length of service from MR, and special pay from military and compensation reports.
Extrapolated using employment from MR.
7 Civilian Extrapolation. Employment data from OPM. Employment data from BLS. 8 General government consumption
of fixed capital Deflation. Perpetual inventory calculations
at current cost, based on gross investment and on investment prices.
Perpetual inventory calculations at current cost, based gross investment and on investment prices.
9 Intermediate goods and services purchased
10 Durable goods 11 Aircraft Directly priced and
deflation. Production control reports,
“budget exhibit” data, PPIs and IPDs.
PPIs, IPDS, unpublished DOD data and when available, production control reports, and contract control documentation reports.
12 Missiles Directly priced and deflation.
Production control reports, contract control documentation reports, PPIs and IPDs.
PPIs, IPDs, unpublished DOD data and when available, production control reports, and contract control documentation reports.
13 Ships Deflation. PPIs. PPIs. 14 Vehicles Directly priced and
deflation. Production control reports,
“budget exhibit” data, PPIs and IPDs.
PPIs, IPDs, unpublished DOD data and when available, production control reports, and contract control documentation reports.
15 Electronics Deflation. PPIs and IPDs. PPIs and IPDs. 16 Other durable goods Deflation. PPIs. PPIs. 17 Nondurable goods 18 Petroleum products Directly priced and
deflation. PPRs and DOD prices. Extrapolated judgmentally and,
when available, PPRs. 19 Ammunition Deflation. PPIs. PPIs. 20 Other nondurable goods Deflation. PPIs. PPIs. 21 Services 22 Research and development Deflation. PPIs. PPIs. 23 Installation support Deflation. PPIs, CPI's, ECIs and exchange
rate adjustment. PPIs, CPI's, ECIs and exchange
rate adjustment. 24 Weapons support Deflation. AHE and ECIs. AHE and ECIs. 25 Personnel support Deflation. CPIs, ECIs and DOD wage rates. CPIs and extrapolated
judgmentally. 26 Transportation of material Deflation. MSC, NMTO, MTMC, and
AMC. PPIs.
27 Travel of persons Deflation. MTMC, AMC, GSA, and CPIs. PPIs. 28 Less: Own-account investment 29 Structures
Deflation Existing price indexes for construction parts, other nondurable goods, and architectural and engineering services.
Existing price indexes for construction parts, other nondurable goods, and architectural and engineering services.

II—108 .
TABLE II-7. REAL FEDERAL GOVERNMENT NATIONAL DEFENSE CONSUMPTION EXPENDITURES AND GROSS INVESTMENT: SOURCES OF ESTIMATES
Line Category Methods First Annual Revision: Quarterly
and calendar-year estimates
Current quarterly estimates
30 Software Deflated BEA own-account software intermediate inputs index and the nondefense compensation price index.
BEA own-account software intermediate inputs index and the nondefense compensation price index.
31 Less: Sales to other sectors Deflation. IPD for military officers’ compensation.
IPD for military officers’ compensation.
32 Gross Investment 33 Structures 34 New 35 Buildings 36 Residential Deflation. Census Bureau price index for
single-family houses under construction.
Census Bureau price index for single-family houses under construction.
37 Industrial Deflation. Turner Construction Co. building cost index, FHWA highway structures construction index, and the Census Bureau price index for single-family houses under construction.
Turner Construction Co. building cost index, FHWA highway structures construction index, and the Census Bureau price index for single-family houses under construction
38 Military facilities Deflation. FHWA composite index, the Census Bureau price index for single-family houses under construction, the Turner Construction Co. building cost index, and the Bureau of Reclamation index.
FHWA composite index, the Census Bureau price index for single-family houses under construction, the Turner Construction Co. building cost index, and the Bureau of Reclamation index.
39 Net Purchases Deflation. Census Bureau price index for single-family houses under construction, the Turner Construction Co. building cost index, the Bureau of Reclamation index, FHWA structures index, and the FHWA composite index.
Census Bureau price index for single-family houses under construction, the Turner Construction Co. building cost index, the Bureau of Reclamation index, FHWA structures index, and the FHWA composite index.
40 Equipment and software 41 Aircraft Directly priced and
deflation. Production control reports,
“budget exhibit” data, PPIs, and IPDs.
PPIs, IPDs, unpublished DOD data and, when available, production control reports, and contract control documentation reports.
42 Missiles Directly priced and deflation.
Production control reports, “budget exhibit” data, PPIs, and IPDs.
PPIs, IPDs, unpublished DOD data and, when available, production control reports, and contract control documentation reports.
43 Ships Deflation. PPIs. PPIs. 44 Vehicles Directly priced and
deflation. Production control reports,
“budget exhibit” data, PPIs, and IPDs.
PPIs, IPDs, unpublished DOD data and, when available, production control reports and contract control documentation reports.
45 Electronics and software Deflation. PPIs, IPDs, and weighted index for custom software.
PPIs, IPDs, and weighted index for custom software.
46 Other equipment Deflation. PPIs. PPIs.
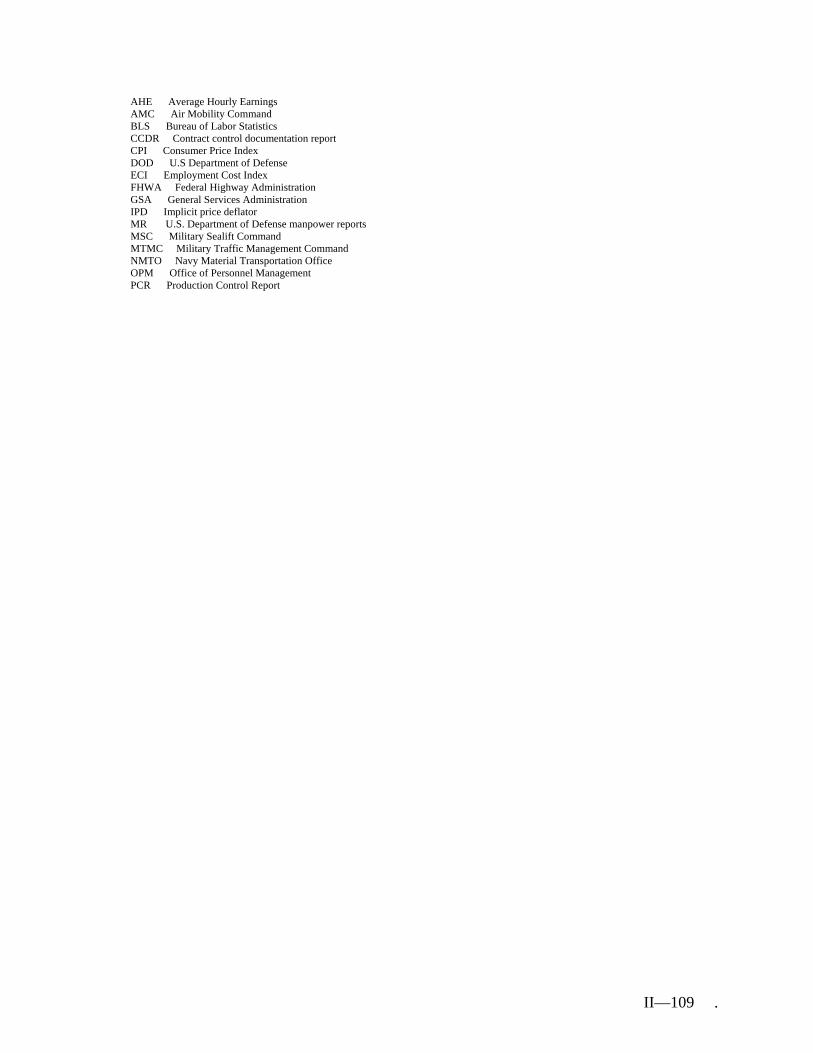
II—109 .
AHE Average Hourly Earnings AMC Air Mobility Command BLS Bureau of Labor Statistics CCDR Contract control documentation report CPI Consumer Price Index DOD U.S Department of Defense ECI Employment Cost Index FHWA Federal Highway Administration GSA General Services Administration IPD Implicit price deflator MR U.S. Department of Defense manpower reports MSC Military Sealift Command MTMC Military Traffic Management Command NMTO Navy Material Transportation Office OPM Office of Personnel Management PCR Production Control Report

II—110 .
TABLE II-8. REAL FEDERAL GOVERNMENT NONDEFENSE CONSUMPTION EXPENDITURES AND GROSS INVESTMENT: SOURCES OF ESTIMATES
Line Category Method First Annual Revision: Quarterly
and calendar-year estimates
Current quarterly estimates
1 Nondefense Consumption Expenditures and Gross Investment
2 Consumption expenditures 3 Gross output of general government 4 Value added 5 Compensation of general
government employees Extrapolation. Employment data from OPM. Employment data from BLS.
6 Consumption of general government fixed capital
Deflation. Perpetual-inventory calculations at current-cost, based on gross investment and on investment prices.
Perpetual-inventory calculations at current-cost, based on gross investment and on investment prices.
7 Intermediate goods and services purchased
8 Durable goods Deflation. PPIs and IPDs. PPIs and IPDs. 9 Nondurable goods
10 Commodity Credit Corporation inventory change
Directly priced and deflation.
ASCS and PRF. ASCS and PRF.
11 Other nondurable goods Directly priced and deflation.
DOE prices and quantities and PPIs.
DOE prices and quantities and PPIs.
12 Services 13 Imputed interest Extrapolation. Judgmental. Judgmental. 14 Research and development Deflation. PPIs. PPIs. 15 Rent, communications, and
utilities Deflation. CPIs. CPIs.
16 Travel and transportation Deflation. PPIs. PPIs. 17 Less: Own-account investment See Table II-7 for sources
of estimate. See Table II-7 for sources of
estimate. See Table II-7 for sources of
estimate. 18 Less: Sales to other sectors Deflation. PPIs. PPIs.
19 Gross Investment 20 Structures 21 New
Deflation. IPDs, FHWA composite index, Census Bureau price index for single-family houses under construction, the Turner Construction Cost index, Bureau of Reclamation index, and Handy Whitman index.
IPDs, FHWA composite index, Census Bureau price index for single-family houses under construction, the Turner Construction Cost index, Bureau of Reclamation index, and Handy Whitman index.
22 Net purchases of used structures Deflation. New private nonfarm residential structures index, new private farm residential structures index, and new private nonresidential structures index.
New private nonfarm residential structures index, new private farm residential structures index, and new private nonresidential structures index.
23 Equipment and software 24 Computers Deflation. IPDs. IPDs. 25 Software Deflation. PPIs and weighted index for
customs software. PPIs and weighted index for
customs software. 26 Aerospace equipment Deflation. PPIs. PPIs. 27 Vehicles Deflation. PPIs. PPIs. 28 Enterprise equipment Deflation. PPIs. PPIs.
ASCS Agricultural Stabilization and Conservation Service PRF Index of Prices Received by Farmers for Crops BLS Bureau of Labor Statistics CPI Consumer Price Index DOE U.S. Department of Energy FHWA Federal Highway Administration IPD Implicit Price Deflator OPM Office of Personnel Management PPI Producer Price Index
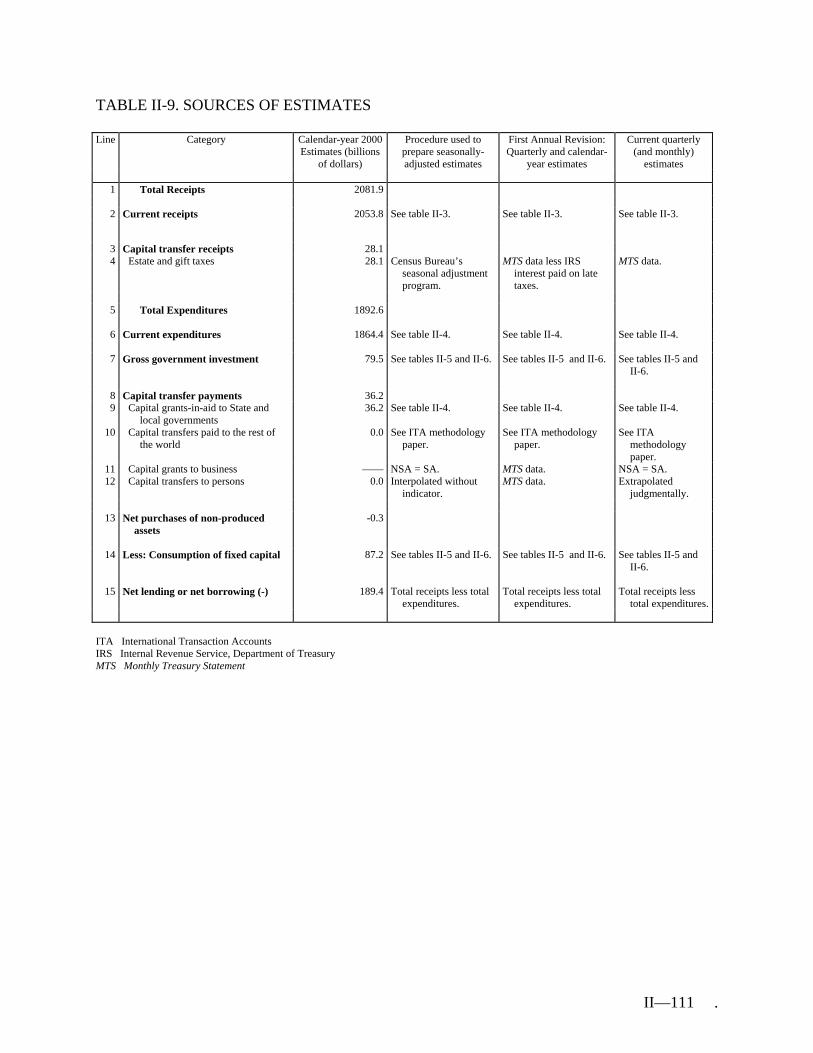
II—111 .
TABLE II-9. SOURCES OF ESTIMATES Line Category Calendar-year 2000
Estimates (billions of dollars)
Procedure used to prepare seasonally-adjusted estimates
First Annual Revision: Quarterly and calendar-
year estimates
Current quarterly (and monthly)
estimates
1 Total Receipts 2081.9
2 Current receipts 2053.8 See table II-3. See table II-3. See table II-3.
3 Capital transfer receipts 28.1 4 Estate and gift taxes 28.1 Census Bureau’s
seasonal adjustment program.
MTS data less IRS interest paid on late taxes.
MTS data.
5 Total Expenditures 1892.6
6 Current expenditures 1864.4 See table II-4. See table II-4. See table II-4.
7 Gross government investment 79.5 See tables II-5 and II-6. See tables II-5 and II-6. See tables II-5 and
II-6.
8 Capital transfer payments 36.2 9 Capital grants-in-aid to State and
local governments 36.2 See table II-4. See table II-4. See table II-4.
10 Capital transfers paid to the rest of the world
0.0 See ITA methodology paper.
See ITA methodology paper.
See ITA methodology paper.
11 Capital grants to business —— NSA = SA. MTS data. NSA = SA. 12 Capital transfers to persons 0.0 Interpolated without
indicator. MTS data. Extrapolated
judgmentally.
13 Net purchases of non-produced assets
-0.3
14 Less: Consumption of fixed capital 87.2 See tables II-5 and II-6. See tables II-5 and II-6. See tables II-5 and
II-6.
15 Net lending or net borrowing (-) 189.4 Total receipts less total expenditures.
Total receipts less total expenditures.
Total receipts less total expenditures.
ITA International Transaction Accounts IRS Internal Revenue Service, Department of Treasury MTS Monthly Treasury Statement

III– 1
PART III
STATE AND LOCAL GOVERNMENT TRANSACTIONS
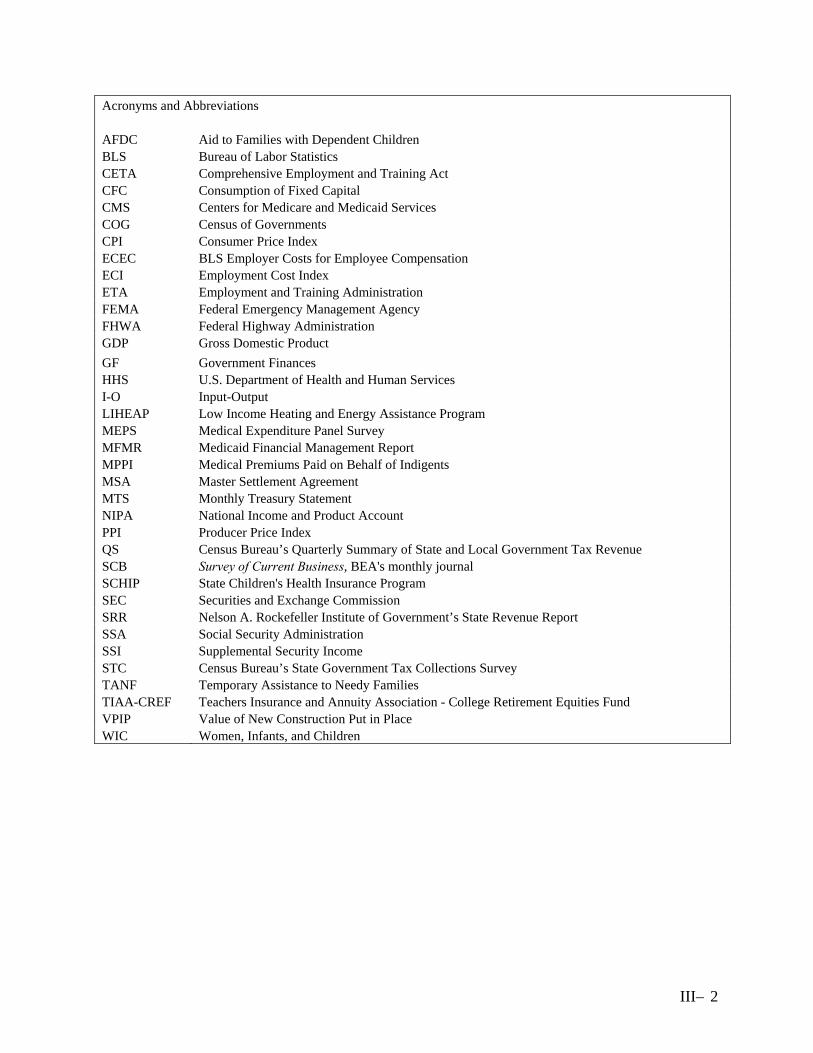
III– 2
Acronyms and Abbreviations AFDC Aid to Families with Dependent Children BLS Bureau of Labor Statistics CETA Comprehensive Employment and Training Act CFC Consumption of Fixed Capital CMS Centers for Medicare and Medicaid Services COG Census of Governments CPI Consumer Price Index ECEC BLS Employer Costs for Employee Compensation ECI Employment Cost Index ETA Employment and Training Administration FEMA Federal Emergency Management Agency FHWA Federal Highway Administration GDP Gross Domestic Product GF Government Finances HHS U.S. Department of Health and Human Services I-O Input-Output LIHEAP Low Income Heating and Energy Assistance Program MEPS Medical Expenditure Panel Survey MFMR Medicaid Financial Management Report MPPI Medical Premiums Paid on Behalf of Indigents MSA Master Settlement Agreement MTS Monthly Treasury Statement NIPA National Income and Product Account PPI Producer Price Index QS Census Bureau’s Quarterly Summary of State and Local Government Tax Revenue SCB Survey of Current Business, BEA's monthly journal SCHIP State Children's Health Insurance Program SEC Securities and Exchange Commission SRR Nelson A. Rockefeller Institute of Government’s State Revenue Report SSA Social Security Administration SSI Supplemental Security Income STC Census Bureau’s State Government Tax Collections Survey TANF Temporary Assistance to Needy Families TIAA-CREF Teachers Insurance and Annuity Association - College Retirement Equities Fund VPIP Value of New Construction Put in Place WIC Women, Infants, and Children

III– 3
Table of Contents
1. INTRODUCTION ...................................................................................................................... 6 2. OVERVIEW OF SOURCE DATA AND ESTIMATING PROCEDURES .............................. 7 ANNUAL ESTIMATES............................................................................................................... 7 DIFFERENCES BETWEEN COG/GF AND NIPA RECEIPTS................................................. 9
COVERAGE DIFFERENCES ............................................................................................................. 9 NETTING AND GROSSING DIFFERENCES ........................................................................................ 9 TIMING AND OTHER DIFFERENCES.............................................................................................. 10
DIFFERENCES BETWEEN COG/GF AND NIPA CURRENT EXPENDITURES................ 10
COVERAGE DIFFERENCES ........................................................................................................... 10 NETTING AND GROSSING DIFFERENCES ...................................................................................... 11 TIMING AND OTHER DIFFERENCES.............................................................................................. 11
QUARTERLY ESTIMATES ..................................................................................................... 11 ESTIMATES OF REAL CONSUMPTION EXPENDITURES AND GROSS INVESTMENT..................................................................................................................................................... 12
3. DERIVATION OF RECEIPTS ................................................................................................ 12 CURRENT RECEIPTS .............................................................................................................. 12 CURRENT TAX RECEIPTS ........................................................................................................... 13 CONTRIBUTIONS FOR GOVERNMENT SOCIAL INSURANCE ........................................................... 17 INCOME RECEIPTS ON ASSETS..................................................................................................... 18 CURRENT TRANSFER RECEIPTS................................................................................................... 20 CURRENT SURPLUS OF GOVERNMENT ENTERPRISES ................................................................... 21
CAPITAL TRANSFER RECEIPTS........................................................................................... 23 ESTATE AND GIFT TAXES............................................................................................................ 23 CAPITAL GRANTS ....................................................................................................................... 23
4. DERIVATION OF EXPENDITURES..................................................................................... 23 CONSUMPTION EXPENDITURES......................................................................................... 25 GROSS OUTPUT OF GENERAL GOVERNMENT ............................................................................... 25 OWN-ACCOUNT INVESTMENT..................................................................................................... 29 SALES TO OTHER SECTORS ......................................................................................................... 30
GROSS INVESTMENT ............................................................................................................. 30 STRUCTURES.............................................................................................................................. 31 EQUIPMENT AND SOFTWARE...................................................................................................... 32
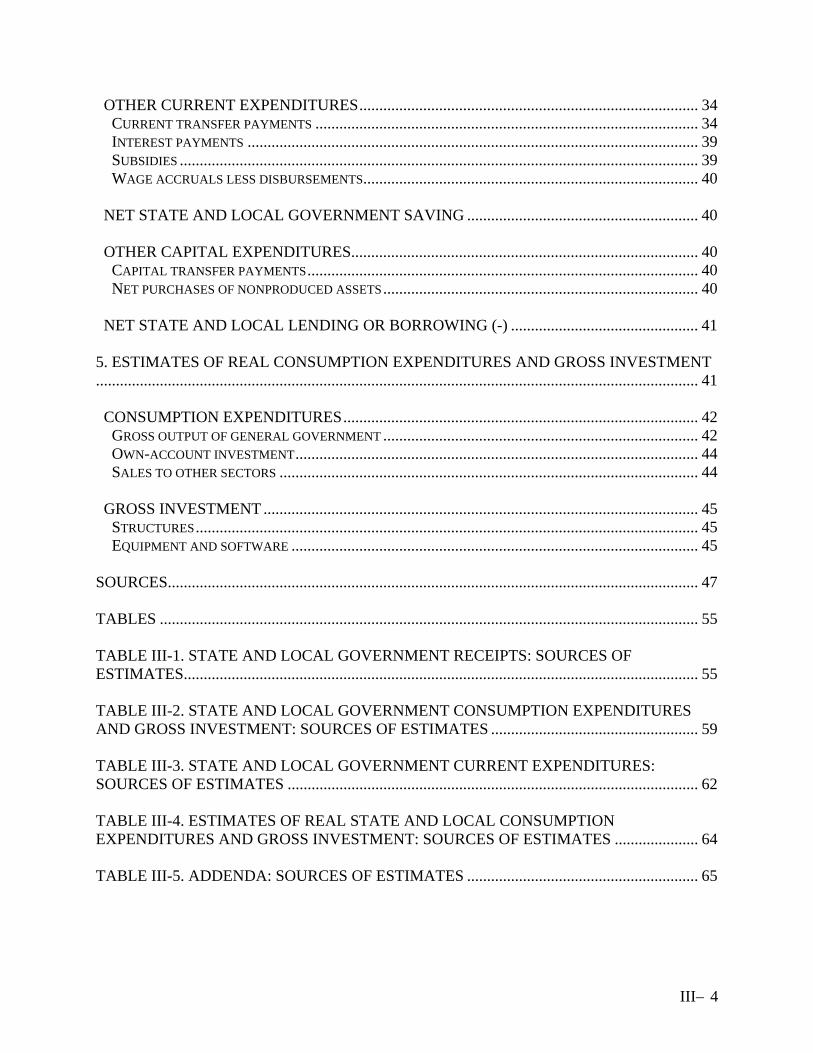
III– 4
OTHER CURRENT EXPENDITURES..................................................................................... 34 CURRENT TRANSFER PAYMENTS ................................................................................................ 34 INTEREST PAYMENTS ................................................................................................................. 39 SUBSIDIES .................................................................................................................................. 39 WAGE ACCRUALS LESS DISBURSEMENTS.................................................................................... 40
NET STATE AND LOCAL GOVERNMENT SAVING .......................................................... 40 OTHER CAPITAL EXPENDITURES....................................................................................... 40 CAPITAL TRANSFER PAYMENTS.................................................................................................. 40 NET PURCHASES OF NONPRODUCED ASSETS............................................................................... 40
NET STATE AND LOCAL LENDING OR BORROWING (-) ............................................... 41
5. ESTIMATES OF REAL CONSUMPTION EXPENDITURES AND GROSS INVESTMENT....................................................................................................................................................... 41 CONSUMPTION EXPENDITURES......................................................................................... 42 GROSS OUTPUT OF GENERAL GOVERNMENT ............................................................................... 42 OWN-ACCOUNT INVESTMENT..................................................................................................... 44 SALES TO OTHER SECTORS ......................................................................................................... 44
GROSS INVESTMENT ............................................................................................................. 45 STRUCTURES.............................................................................................................................. 45 EQUIPMENT AND SOFTWARE ...................................................................................................... 45
SOURCES..................................................................................................................................... 47 TABLES ....................................................................................................................................... 55 TABLE III-1. STATE AND LOCAL GOVERNMENT RECEIPTS: SOURCES OF ESTIMATES................................................................................................................................. 55 TABLE III-2. STATE AND LOCAL GOVERNMENT CONSUMPTION EXPENDITURES AND GROSS INVESTMENT: SOURCES OF ESTIMATES .................................................... 59 TABLE III-3. STATE AND LOCAL GOVERNMENT CURRENT EXPENDITURES: SOURCES OF ESTIMATES ....................................................................................................... 62 TABLE III-4. ESTIMATES OF REAL STATE AND LOCAL CONSUMPTION EXPENDITURES AND GROSS INVESTMENT: SOURCES OF ESTIMATES ..................... 64 TABLE III-5. ADDENDA: SOURCES OF ESTIMATES .......................................................... 65

III– 5
APPENDIX III-A.......................................................................................................................... 66 APPENDIX III-B.......................................................................................................................... 67
III– 6
1. INTRODUCTION This part describes state and local government transactions. State and local government transactions are presented as (1) state and local government current receipts and expenditures (National Income and Product Accounts (NIPA) table 3.3);1 (2) state and local government consumption expenditures and gross investment (NIPA table 3.9.x); and (3) state and local government consumption expenditures and general government gross output (NIPA table family 3.10.x). These transactions are presented here as an integrated, line-by-line set of accounts that follow the structure of the NIPA tables. A description of the estimation procedures for calculating nominal and real estimates is provided. The first section, “Overview of Source Data and Estimating Procedures,” shows how NIPA current receipts, current expenditures, and gross investment estimates can be reconciled to Census estimates using coverage, netting and grossing, and timing adjustments. The second section provides the sources and methods used to estimate current receipts and capital transfer receipts. Current receipts includes current tax receipts, contributions for government social insurance, income receipts on assets, current transfer receipts, and the current surplus of government enterprises. Capital transfer receipts include estate and gift taxes and capital grants. The third section presents the sources and methods used to estimate current expenditures, gross investment, and other capital expenditures. Current expenditures includes consumption expenditures, which is comprised of compensation of general government employees, consumption of general government fixed capital, and expenditures on intermediate goods and services purchased; social benefit payments; interest payments; subsidies; and a small adjustment item, wage accruals less disbursements. Gross investment includes investment in structures and in equipment and software. Other capital expenditures include capital transfer payments and net purchases of nonproduced assets. The final section, “Estimates of Real Consumption Expenditures and Gross Investment,” describes the chain-type quantity and price indexes, which measure changes in real output and prices. It provides details on the methodologies and price indexes used to estimate real consumption expenditures and gross investment, which is included in gross domestic product (GDP).
1 Total Government receipts and expenditures⎯both Federal and state and local government⎯can also be found in NIPA Table A. Summary National Income and Product Accounts, Account 4. Government Receipts and Expenditures Account.
III– 7
2. OVERVIEW OF SOURCE DATA AND ESTIMATING PROCEDURES In considering the estimation methodology for state and local governments, it is useful to draw a distinction between annual estimates, which are prepared for annual or benchmark revisions and current quarterly estimates, which are prepared each quarter. Annual estimates incorporate detailed fiscal-year data from the U.S. Census Bureau and many other sources. Annual estimates are interpolated into quarters.2 In contrast, current quarterly estimates are prepared from a mix of available monthly and quarterly data in a process that might be compared to putting together a puzzle with missing pieces. Many of the larger pieces such as compensation, construction, taxes, Medicaid, and other social benefit payments are based on current source data. Many of the smaller pieces are estimated with a variety of methods including judgmental extrapolation.3 ANNUAL ESTIMATES Annual NIPA estimates of state and local government current receipts, current expenditures, and gross investment are based primarily on compilations of data on the finances of state and local governments. The major sources of these data are Government Finances (GF) [43], which is based on an annual survey, and the Census of Governments (COG) [38], which is based on a quinquennial census that is conducted in years ending in 2 and 7. The U.S. Census Bureau prepares both of these sources. Other sources include construction statistics compiled by the Census Bureau (i.e., Current Construction Reports: Value of New Construction Put in Place (VPIP)) [40], data from the Medical Expenditures Panel Survey (MEPS) [69], data on social benefit payments from various agencies of the U.S. Department of Health and Human Services (HHS), and employment and wage and salary statistics prepared by the Bureau of Labor Statistics (BLS). The derivation of the annual estimates of state and local government current receipts, current expenditures, and gross investment in the NIPAs starts with the financial data collected in GF or the COG [43,38].4 GF comprises several component surveys, which collect data on tax collections, public employee retirement systems, state government finances, local government finances, and public education finances. The financial data collected through each of these surveys contain information on the revenues, expenditures, debt, and assets of the reporting governmental unit [47]. The availability of the COG/GF data has varied over the years. Recently, the final data from COG/GF have been available with a 2-year lag, and have been incorporated in the third annual revision of the NIPA estimates.5 Estimates for the second annual revision incorporate both 2 For a detailed description of interpolation, see Part I, “Statistical Conventions.” 3 For a detailed description of extrapolation, see Part I, “Statistical Conventions.” 4 The Census of Governments (COG) is conducted every five years and collects data in three areas: government organization, public employment, and government finances. In years when a census is conducted, the data collected through GF form a major component of the data reported in the COG [37]. Hereafter, these sources are cited as COG/GF when the context is a general description of methodology and as COG or GF when information specific to only one of the sources is referenced. 5 For example, FY 2002 data, which in combination with FY 2001 data comprise CY 2001 data, were incorporated in 2004—the third revision of 2001.
III– 8
preliminary tabulations of unpublished COG/GF data and BEA extrapolations of the COG/GF components used. Estimates for the first annual revision incorporate BEA extrapolations of the COG/GF components used. In all instances, the procedure for using the COG/GF data is the same. Data from the COG/GF are reported to the Census Bureau based on the reporting government’s fiscal year. As a result, the data included in the COG/GF report for a given year are for fiscal years ending at various dates during the 12 months ending June 30 of the year specified.6 The NIPA estimates of current receipts, current expenditures, and gross investment cover calendar years. Thus, the COG/GF data are converted to a calendar-year basis so that they can be used to calculate NIPA estimates. The steps in converting COG/GF data from fiscal years to calendar years are outlined below.
(1) Most state governments and state and local government enterprises have fiscal years ending on June 30. Fiscal-year data for these entities is converted to a calendar-year basis through a two-year average.
(2) Local governments have fiscal years ending at various dates during the year. The COG/GF data for these entities are converted to a calendar-year basis using the following formula based on periodic Census Bureau tabulations by ending month of the fiscal year. The formula can be implemented by denoting the fiscal year running from July 1 of calendar year t-1 to June 30 of calendar year t as FY(t) and the calendar year t as CY(t), then
CY(t) = .33FY(t) + .67FY(t+1). (Equation 1)
For 1962 and earlier years, the COG/GF data on local governments cover fiscal years ending throughout the calendar year and are assumed to be on a calendar-year basis, except for school districts, which are lagged six months. NIPA table 3.19 shows the relationship of total revenue and total expenditures in the COG/GF to NIPA estimates of current receipts, current expenditures, and gross investment. The first section of this table shows Census total revenue followed by the coverage, netting and grossing, and timing and other differences that are used to convert COG/GF to NIPA state and local government current receipts. The second section of the table shows Census total expenditures followed by the coverage, netting and grossing, and timing and other differences, which are used to translate COG/GF to NIPA state and local government current expenditures. The last section of the table reconciles the difference between Census revenues and Census expenditures with NIPA net state and local government saving. This reconciliation is performed by adding net investment to and subtracting net capital transfers received, net transactions from state and local employee retirement plans, other coverage differences, and timing and other differences from net state and local government saving. In all cases, the Census data are reconciled to NIPA not-seasonally-adjusted data that have been converted into fiscal years. 6 Alabama, Michigan, New York, and Texas are the only states whose fiscal years do not begin on July 1st and end on June 30th.

III– 9
DIFFERENCES BETWEEN COG/GF AND NIPA RECEIPTS NIPA table 3.19 shows that NIPA current receipts differ from COG/GF source data receipts because of coverage, netting and grossing, and timing and other differences. COVERAGE DIFFERENCES Coverage adjustments arise because the NIPAs have a different definition of state and local government transactions than does COG/GF. These differences include transactions associated with state and local government employee retirement plans, which the NIPAs account for in the household, not government, sector; transactions of the unemployment insurance system, which is a state program in COG/GF, but it is a Federal program in the NIPAs; transactions for capital transfers received (estate and gift taxes and Federal grants for capital expenditures are treated as capital in the NIPAs, and thus are not included in current receipts); and transactions in financial assets and in the sale of land (including oil bonuses), which is netted against purchases of land and other nonproduced assets in net purchases of nonproduced assets. COG/GF does not include NIPA imputations. NIPA current receipts include imputations for certain dividends and for certain interest received for services provided without cash payments by commercial banks. An additional coverage adjustment is made for certain grant programs. COG/GF intergovernmental revenues are replaced by an estimate of Federal grants derived from Federal budget documents (see Part II, “Grants-in-aid to state and local Governments.”) These NIPA grants-in-aid estimates are consistent with estimates of similar transactions elsewhere in the NIPAs. A further coverage adjustment is made to account for the current surplus of Indian tribal government enterprises. Indian tribal governments are included in the NIPA government sector; however, they do not fall within the COG/GF definition of government. NETTING AND GROSSING DIFFERENCES NIPA table 3.19 includes three netting differences and one grossing difference. For all four, the government surplus or deficit is not affected because equal adjustments are made to current receipts and to current expenditures. In the NIPAs, expenditures are generally shown net of related sales revenue. For the first two netting entries, sales are subtracted for government enterprises and for general governments, respectively. For the third netting entry, insurance claims revenue is subtracted from receipts and expenditures because expenditures for insurance services are recorded as premiums plus premium supplements less normal losses (see “From business (net)” for a full explanation).
III– 10
For the grossing entry, an imputation is made to reflect employer contributions to own social insurance funds. This requires the addition of an expense item and a corresponding receipt item to COG/GF. TIMING AND OTHER DIFFERENCES Timing adjustments are used to account for differences in timing between the NIPAs and COG/GF. Historically, NIPA current receipts are recorded on either a payments basis, i.e. when-paid, or on an accrual basis. Corporate profits taxes are adjusted from a cash to an accrual accounting basis. Timing differences also occur because quarterly interpolation is performed for calendar-year totals in the actual preparation of the NIPA estimates. The four fiscal-year quarters may not sum to the COG/GF fiscal year. Other timing differences result from the out-of-court tobacco settlement payments that are made to states. COG/GF records these payments when they are received by the states. In the NIPAs, these payments are included when the payments are deposited in the state’s escrow account. DIFFERENCES BETWEEN COG/GF AND NIPA CURRENT EXPENDITURES NIPA table 3.19 shows that NIPA current expenditures differ from COG/GF expenditures because of coverage, netting and grossing, and timing and other differences. COVERAGE DIFFERENCES Coverage adjustments arise because COG/GF includes, but the NIPAs exclude, certain transactions associated with state and local government employee retirement plans (which the NIPAs assign to the household sector), benefits paid by unemployment insurance system (a state program in COG/GF, but a Federal program in the NIPAs), and purchases of land. In addition, COG/GF expenditure estimates include actual transactions, but not imputations. NIPA current expenditures include imputations that are made for services provided without payment by domestic securities brokers, by commercial banks, and by property and casualty insurance carriers. (See “Current transfer receipts.”) COG/GF expenditures do not include the value of consumption of fixed capital (CFC) (a partial measure of services rendered by government-owned capital) in the NIPAs. In addition, the NIPAs exclude investment from current expenditures, while these expenditures are reflected in COG/GF. The difference between investment and CFC is shown as net investment under coverage adjustments.
III– 11
COG/GF includes net purchases of nonproduced assets as expenditures. These transactions consist of the purchase of land and oil bonus revenues. The NIPAs classify these transactions as capital expenditures because they are an exchange of existing assets. The NIPAs also include an estimate of expenditures by Indian tribal governments. Indian tribes do not fall within the COG/GF definition of government. NETTING AND GROSSING DIFFERENCES These differences are discussed under “Differences Between COG/GF and NIPA Receipts.” TIMING AND OTHER DIFFERENCES Timing differences occur because quarterly interpolation is performed for calendar-year totals in the actual preparation of the NIPA estimates. The four fiscal-year quarters may not sum to the COG/GF fiscal year. Other differences occur because COG/GF source data are replaced by estimates that are more consistent with estimates of similar transactions elsewhere in the NIPAs; e.g., wages and salaries and certain government social benefit payments to persons, including Medicaid payments. QUARTERLY ESTIMATES For annual revisions, quarterly source data are available and are used for the following NIPA components: Compensation, construction, certain social benefit payments, and tax receipts. For those series where not seasonally-adjusted source data are available, they are seasonally-adjusted using the Census Bureau’s X-12 ARIMA seasonal adjustment program. For the other components, there are no quarterly source data, and the quarterly estimates are prepared by interpolating annual estimates. When current quarterly estimates are prepared, many components are estimated using judgmental extrapolations.7 The major exceptions are the wages and salaries component of compensation of state and local government employees, new construction put in place, certain social benefit payments, and selected tax receipts. Generally, for these components, two months of source data are available for the advance estimate, and three months of source data are available for the preliminary and final estimates.8 Unless otherwise noted, the same methodology is used to prepare the advance, preliminary, and final current quarterly estimates. In those cases where the methodology differs, the procedure used for each type of estimate is explained in the sections below. 7 In judgmental extrapolation, analysts consider all available information and may base an estimate on any combination of a moving average, a trend growth rate, a statistical model, newspaper stories, and other published and unpublished information available to them. The trend estimate may also be adjusted for unusual events including, recent legislation, court rulings, or weather-related events. 8 The advance, preliminary, and final estimates are generally released 30, 60, and 90 days, respectively, after the end of the quarter.
III– 12
ESTIMATES OF REAL CONSUMPTION EXPENDITURES AND GROSS INVESTMENT Estimates of real consumption expenditures and gross investment are prepared for both annual and quarterly NIPA estimates. These estimates are prepared either through deflation using price indexes or through quantity extrapolation. 3. DERIVATION OF RECEIPTS CURRENT RECEIPTS The primary data sources for the estimates of receipts are COG/GF [38,43] from the Census Bureau. Additional tax data are provided by the Census Bureau’s Quarterly Summary of State and Local Government Tax Revenue (QS) [45], the Census Bureau’s State Government Tax Collections Survey (STC) [48], and the Nelson A. Rockefeller Institute of Government’s State Revenue Report (SRR) [25]. Other receipts data come from various sources. Several state reports are used to calculate contributions to social insurance funds. The Federal Reserve Board’s Flow of Funds [9] report is used to estimate dividends. Before 1952, for state governments, Census’s State Government Finances [46] and its predecessors provided the basic data for receipts for all years, except 1933–36, when these reports were suspended. Estimates for these years are based on Tax Yields [34] from the Tax Policy League, a publication based on data compiled mainly from questionnaires sent to state tax officials. For local governments, estimates of receipts for 1942 to 1952 are prepared from annual Census Bureau estimates of city and county revenues. Estimates for years before 1942 are prepared by extrapolation, using estimates prepared by the National Industrial Conference Board from fragmentary Census Bureau information [23], reports of tax commissions or similar agencies, correspondence with public officials, information obtained from sample surveys, and a variety of other sources. Table III-1 presents the current derivation of the estimates for the receipts categories shown in the NIPA tables at the level of detail presented annually. Because the sources of information for states and localities differ, states are distinguished from local governments in table III-1, although this detail is not presented in the NIPA tables for all estimates. The data from the COG/GF are available according to the timeline presented in the section “Overview Of Source Data And Estimating Procedures.” State taxes are an exception to this rule in that annual source data from the STC [48] are available with a one-year lag, rather than with a two-year lag. Unless otherwise noted, the COG/GF data are converted to a calendar-year basis using the procedure outlined in the section “Annual Estimates.” For years for which Census data are unavailable, BEA prepares calendar-year estimates by extrapolating the COG/GF data. Table III-1 lists the sources of the estimates of the major types of receipts and indicates the procedures by which the quarterly estimates are derived. Quarterly seasonally-adjusted estimates of taxes, contributions for government social insurance, income receipts of assets, current

III– 13
transfer receipts, and the current surplus of government enterprises are prepared in one of the following methods:
(1) For those types of taxes that are reported quarterly in either the QS [45] or the SRR [25] and that demonstrate stable seasonality, the seasonally-adjusted tax collections data are used as an indicator series in the interpolation of the annual data into quarterly estimates. An example of the use of this approach is state personal income taxes, which is interpolated and extrapolated using the seasonally-adjusted collections data from the SRR [25] as an indicator series.
(2) For taxes for which the quarterly observations fail to demonstrate stable seasonality, and for all other receipts for which no quarterly data are available, the quarterly seasonally-adjusted estimates are prepared by interpolating annual estimates into quarters without an indicator and extrapolating the current quarterly estimates judgmentally. Examples of the use of this approach are property taxes, interest receipts, rents and royalties, and many other series for which annual source data are from COG/GF.
(3) For series for which a suitable indicator series exists, the indicator series serves as the pattern of quarterly changes in the series. An example of this approach is state and local government dividend receipts, which is based partly on asset holdings data from the Federal Reserve Board’s Flow of Funds [9] report and average dividend yield data from Standard & Poor’s [26].
(4) For certain other categories of receipts, COG/GF data are supplemented with other sources. Federal grants, for example, are based on seasonally-adjusted grants data from the Department of Treasury [94]. (See Part II, “Grants-in-aid to state and local governments.”)
Unless otherwise indicated, the current estimate methodology presented in each section applies to the advance, preliminary, and final estimates. In addition to the annual and quarterly estimates, monthly estimates are prepared for personal current taxes and for personal contributions for social insurance because they are components of the personal income and outlay account, which is prepared on a monthly basis. Although monthly estimates are presented in the NIPA tables, they are not covered in table III-1. However, the methodologies used to prepare these estimates are provided below. CURRENT TAX RECEIPTS Beginning with 1988, all state and local annual tax estimates are based on COG/GF fiscal-year data, except for estimates of taxes on corporate profits, which are based on the QS [45]. In order to convert COG/GF fiscal-year data to a calendar-year basis, COG/GF fiscal-years are interpolated using available seasonally unadjusted quarterly tax collections data and then re-summed on a calendar-year basis. The main source of quarterly collections data is the QS [45], which provides detailed tax collections data for states and for a sample of local governments. NIPA estimates of state personal income taxes and state general sales taxes use collections data from the SRR [25]. For tax types for which no quarterly collections data are available, COG/GF
III– 14
fiscal-year data are interpolated without an indicator series to produce quarterly estimates that are summed to prepare calendar-year estimates. During advance estimates, tax estimates are prepared using judgmental extrapolation. QS [45] data and final data from the SRR [25] are available during the final estimate of each quarter. Preliminary data from the SRR [25] on general sales taxes and state income taxes are available for preliminary quarterly estimates. Between 1962 and 1987, estimates for most taxes are prepared using data from the QS [45] and underlying unpublished detail. For these taxes, the annual estimates represent the sum of four quarters of collections data, except for state general sales and state gasoline taxes where timing adjustments are necessary. Estimates for the remaining taxes, all levied by local governments, are not well covered in the QS [45] and thus are prepared using COG/GF data. Before 1963, estimates of taxes consist of annual data on local taxes (with school district property taxes lagged 6 months) and the State Government Finances [46] fiscal-year state tax data converted to a calendar-year basis by simple averaging. PERSONAL CURRENT TAXES Table III-1 lists personal current taxes for the different types of income taxes, as shown in NIPA table 3.4. Income Taxes Annual estimates of personal income taxes are derived by interpolating COG/GF fiscal-year data using quarterly collections data as the indicator series. The interpolated quarters are then summed to calendar years. The quarterly indicator series for state income tax estimates is based on collections data from the SRR [25]. The indicator series for local income tax estimates is based on collections data from the QS [45]. These collections data are seasonally adjusted and are used as the indicator series for interpolating the NIPA annual estimates into quarterly estimates. Monthly estimates of income taxes are derived by interpolating the quarterly estimates without indicator series. Current quarterly estimates of income taxes are extrapolated using seasonally-adjusted collections data as indicator series. Monthly values are estimated by fitting the quarterly value over the relevant months. Other Taxes This category is composed of taxes for motor vehicle licenses; personal property; and other personal licenses, such as hunting and fishing licenses. Census Bureau data do not distinguish whether certain tax types are paid by business or by persons. As a result, estimates of personal taxes for motor vehicle licenses, property taxes, and hunting and fishing licenses are estimated by BEA using information from other sources to split the Census data between business and personal taxes.

III– 15
Census Bureau data contain a category “property tax,” with no distinction made with respect to the tax base⎯residential real property; other realty; business inventory or equipment; or personal property; such as furniture, personal autos, or pleasure boats. Using data from quinquennial COG [38] reports on types of property subject to tax, the NIPAs distinguish between property taxes paid by persons and those paid by business. (The latter include all taxes paid on real property, including residential property, because owner-occupied dwellings are treated as businesses in the NIPAs.) Census Bureau data for motor vehicle license taxes do not distinguish between those paid on business-owned vehicles and those paid on personal vehicles. The NIPA split is based on motor vehicle registrations data from the Federal Highway Administration (FHWA) [92]. Census Bureau data on hunting and fishing licenses are allocated 90 percent to persons and 10 percent to business on the premise that businesses purchase licenses for the purpose of entertaining clients. Annual estimates for these “other taxes” are produced by first interpolating COG/GF fiscal-year data to quarters, using available unadjusted collections data from the QS [45] as an indicator series when possible, and then re-summing the quarters on a calendar-year basis. For those series for which no quarterly collections data are available (i.e. most local license taxes), COG/GF fiscal-year data are interpolated without indicator series and then re-summed to calculate calendar-year estimates. The quarterly estimates for state motor vehicle licenses and state hunting and fishing licenses are interpolated and extrapolated using seasonally-adjusted collections data from the QS [45] as indicator series. Quarterly estimates for property taxes are interpolated without an indicator series. This is because property taxes are shown on a liability basis and liability on property is accrued smoothly throughout the year. Monthly estimates for these series are interpolated without indicator and extrapolated judgmentally. TAXES ON PRODUCTION AND IMPORTS Table III-1 lists taxes on production and imports for sales taxes, property taxes, motor vehicle licenses, severance taxes, special assessments, and other taxes, as they are shown in NIPA table 3.5. The “other taxes” category published in NIPA table 3.5 is composed primarily of business license taxes and documentary and stamp taxes. Sales Taxes State and local sales taxes include taxes imposed on general sales, gasoline, alcoholic beverages, tobacco, public utilities, insurance receipts, and other selective sales. Annual estimates for all state and local government sales taxes are derived through the interpolation of COG/GF fiscal-year data. The quarterly collections data that are used in the estimation of state general sales tax are from the SRR [25]. All other quarterly collections data are from the QS [45]. Quarterly estimates of state taxes on general sales, gasoline, alcoholic beverages, public utilities, insurance receipts, and several other minor categories are interpolated and extrapolated using seasonally-adjusted collections data as indicator series. Quarterly estimates for all other sales taxes are interpolated without an indicator series and extrapolated judgmentally.

III– 16
For 1963 through 1987, state and local government annual tax estimates are based on the summation of quarterly collections data from the QS [45]. During this period, for estimates of state general sales taxes and state gasoline taxes, the quarterly collections data are lagged one month in proportion to retail sales and fuel consumption, respectively, to derive the appropriate NIPA liability measure. Property Taxes Annual NIPA estimates of property taxes are prepared in the same way as for other tax types; i.e., with COG/GF fiscal-year data being interpolated into quarters then re-summing the quarters into calendar years. Quarterly tax estimates are prepared by interpolating the annual estimates without indicator series to show the tax on a liability basis (property tax liability is accrued smoothly throughout the year). Current quarterly estimates are extrapolated judgmentally taking into consideration trends in the quarterly collections data. As stated above in the “Income Taxes” section, COG/GF does not provide a breakdown of property taxes between those paid by persons and those paid by businesses. (Refer to the section “Other Taxes” for a discussion of how this breakdown is computed.) Other taxes on production and imports Estimates of motor vehicle license taxes, severance taxes, special assessments, and other taxes shown in NIPA table 3.5 are prepared using the methods described in the following paragraphs. Annual estimates for all of these tax types, except for special assessments, are prepared by interpolating fiscal-year data without indicator series and re-summing quarterly estimates to form calendar years. Annual estimates for special assessments are prepared by using the procedure described in “Annual Estimates.” Quarterly estimates for state motor vehicle licenses, severance taxes, and various license taxes within “other taxes” are interpolated and extrapolated using seasonally-adjusted collections data from QS [45] as indicator series. For all other tax types in this category, quarterly estimates are interpolated and extrapolated without indicator series. TAXES ON CORPORATE INCOME The primary source of annual data on state taxes on corporate income is state detail on collections data underlying the Census Bureau’s QS [25]. To relate collections to calendar-year liabilities, the quarterly data are lagged on the basis of a 1977–78 BEA study of certain features of state corporate laws—when estimated taxes were due, settlements made, etc. This study, based on the Commerce Clearing House State Tax Guide [13], provides information on the relationship between tax collection and tax liability.
III– 17
Annual data on local taxes on corporate income are primarily from the QS [45]. For 1965 and earlier years, the estimates are based on Tax Foundation [33] data. Quarterly estimates of total state and local taxes on corporate income, seasonally adjusted and unadjusted, are prepared from the annual liability totals by interpolation and extrapolation using NIPA estimates of domestic corporate profits before tax (less Federal Reserve profits) as an indicator series.9 Taxes on corporate income are not published during the advance estimate. CONTRIBUTIONS FOR GOVERNMENT SOCIAL INSURANCE Table III-1 lists employer contributions and contributions from employees by program as shown in NIPA table 3.6. EMPLOYER CONTRIBUTIONS Temporary disability insurance Employer and employee contributions for temporary disability insurance are reported together in COG/GF. Estimates for employer contributions are calculated as a percentage of the total contributions for New Jersey and California, which are the only states where employers are required to make contributions. Monthly seasonally-adjusted estimates for employee and employer contributions are interpolated from annual estimates without an indicator series, and the current monthly estimates are extrapolated judgmentally. Quarterly estimates are prepared by summing the monthly estimates. Workers’ compensation Fiscal-year data for employer contributions (there are no employee contributions) to state-administered workers' compensation funds are from COG/GF. These data include state government, local government, and private employer contributions. Contributions to temporary disability funds for the State of Colorado are added to COG/GF employer contributions to workers’ compensation funds to ensure definitional consistency. State government contributions are taken directly from COG/GF. Local government contributions are based on state government contributions multiplied by a ratio of local government full-time equivalent employees to state government full-time equivalent employees. State and local combined contributions are subtracted from total contributions to estimate private contributions. Calendar-year estimates are prepared by averaging fiscal-year data. Monthly seasonally-adjusted estimates are interpolated from the annual estimates without indicator. Quarterly estimates are prepared by summing the monthly estimates. 9 For further information see, U.S. Department of Commerce, Bureau of Economic Analysis, Corporate Profits: Profits Before Tax, Profits Tax Liability, and Dividends, Methodology Paper Series MP-2, September 2002.

III– 18
For current estimates, a premium per employee is determined separately for state and local government employees and for private employees. These premiums are multiplied by current employment, state and local government and private, respectively, to estimate contributions. Estimates of employment are obtained monthly from The Employment Situation [89], which is published by BLS. Quarterly estimates are prepared by summing the monthly estimates. EMPLOYEE CONTRIBUTIONS Temporary disability insurance Data for employee contributions to temporary disability insurance funds are from COG/GF for New Jersey and Rhode Island and from the California Employment Development Department [31]. Calendar-year estimates for New Jersey and Rhode Island are prepared by averaging fiscal-year data. These calendar-year estimates are added to the calendar-year data received from the State of California. Monthly seasonally-adjusted estimates for employee and employer contributions are interpolated from the annual estimates without indicator, and the current monthly estimates are extrapolated judgmentally. Quarterly estimates are prepared by summing the monthly estimates. INCOME RECEIPTS ON ASSETS Income receipts on assets consist of interest receipts, dividends, and rents and royalties that are received by state and local governments. INTEREST RECEIPTS Interest receipts include both monetary interest and imputed interest. Monetary interest received is the monetary return that financial institutions credit to depositors’ accounts. Imputed interest received is an imputed income flow that includes the value of the services furnished without payment by commercial banks and by property and casualty insurance carriers to state and local governments for their deposits. It also includes the investment income earned from insurance technical reserves.
MONETARY INTEREST RECEIVED Calendar-year estimates of monetary interest received by state and local governments, including that received by temporary disability insurance and workers’ compensation funds, are prepared by adjusting COG/GF fiscal-year data to a calendar-year basis using the procedure outlined in “Annual Estimates.” The quarterly estimates are interpolated without indicator from the annual
III– 19
estimates. Current estimates are extrapolated judgmentally. For workers' compensation and temporary disability systems, all investment earnings are assumed to be interest.10
IMPUTED INTEREST RECEIVED In the NIPAs, a number of imputations are made to account for transactions that are implicit rather than explicit. Two such imputations are for the value of services received from banks and insurance companies. It is common for banks to provide "free" services, that is services furnished without payment to depositors in lieu of paying interest on deposits. Of course, these services are not really “free”—the depositor forgoes some of the interest that could have been earned on these funds, which instead are retained by the bank. In order to estimate the total value of services provided by banks, it is necessary to estimate the monetary value of the services furnished without payment and to add this value to the value of services for which payment is made. Balancing this transaction is another transaction in which the value of the services furnished without payment is added to interest. This imputation is the estimate of interest foregone in order to obtain the services furnished without payment.11 A similar pair of transactions is used to reflect the fact that in setting their premiums, property and casualty insurance companies take into account the expected income that may be earned from the investment of reserves. Estimates are made of the implicit component of the insurance services, which is referred to as a “premium supplement,” and is balanced by an imputed interest flow.12 DIVIDENDS Most governments do not routinely invest in equities, because safety and liquidity are most often the primary concern of government financial managers. However, state universities are known to have large equity holdings, and these holdings are reflected in the Federal Reserve Board’s Flow of Funds [9] accounts. Beginning in 1990, dividends are calculated by multiplying the dividend yield of the Standard & Poor’s 500 [26] by the equity investments held by state and local governments as reported in the Flow of Funds. Quarterly estimates are interpolated without an indicator from these annual estimates. Advance and preliminary current quarterly estimates are extrapolated judgmentally. Revised Flow of Funds data [9] are available for the final estimate. 10 The primary data source of interest received for temporary disability insurance is the calendar year report from the State of California. This is the same source used for contributions and benefit payments for temporary disability insurance. 11 For the methodology used to prepare NIPA estimates of imputed interest received, see Dennis J. Fixler, Marshall B. Reinsdorf, and George M. Smith, “Measuring the Services of Commercial Banks in the NIPAs: Changes in Concepts and Methods,” Survey of Current Business 83 (September 2003): 33-44. 12 For a full discussion of these issues, see Brent R. Moulton and Eugene P. Seskin, “Preview of the 2003 Comprehensive Annual Revision of the National Income and Product Accounts: Changes in Definitions and Classifications,” Survey of Current Business 83 (June 2003): 17-34.
III– 20
RENTS AND ROYALTIES Beginning with 1959, calendar-year estimates are prepared by adjusting COG/GF fiscal-year data to a calendar-year basis through the procedure described in “Annual Estimates.” The annual estimates are prepared from unpublished data underlying COG/GF current charges and miscellaneous general revenue. Oil bonus data are collected from certain states. Appendix III-A provides more details on these data. Quarterly seasonally-adjusted estimates are interpolated without an indicator series from the annual estimates. Current quarterly estimates are extrapolated judgmentally. CURRENT TRANSFER RECEIPTS Table III-1 lists current transfer receipts from business and from persons as shown in NIPA table 3-7. Beginning with 1959 (the first year estimates are available), all state and local government annual current transfer estimates are based on COG/GF fiscal-year data. Both current transfers to persons and to business are derived from COG/GF current charges and miscellaneous revenue. The details of the derivation are shown in Appendix III-A. COG/GF does not delineate whether certain fines and donations are paid by business or by persons. Although current transfer estimates are taken primarily from the Census Bureau sources, they are distributed among several NIPA categories on the basis of supplemental information. Using data from various sources, the NIPAs delineate fines and donations paid by persons and those paid by business. Beginning with 1993, 60 percent of fines are determined to be from persons and 40 percent from business. Prior to 1993, fines are allocated 50/50 to persons and business. Beginning with 1959, donations are allocated 90 percent from persons and 10 percent from business. Because the sources of information for states and localities differ, states are distinguished from local government in preparing the estimates, although this detail is not generally presented in the NIPA tables. Several of the components of current receipts incorporate timing and other adjustments.13 FEDERAL GRANTS-IN-AID See Part II, “Grants-in-aid to state and local governments.” FROM BUSINESS (NET) Current transfer receipts from business consist of fines; net insurance settlements; and “other,” a category that includes donations and payments from tobacco companies to states. 13 Refer to the “Difference Between COG/GF and NIPA Receipts” for a discussion of these adjustments.
III– 21
Data on fines and donations are included in COG/GF. Calendar-year estimates are prepared by adjusting fiscal-year data using the procedure described in “Annual Estimates.” Quarterly seasonally-adjusted estimates are interpolated from the annual estimates without an indicator series, and current estimates are extrapolated judgmentally. Net insurance settlements consist of actual insurance claims, or losses, less “normal” (expected) insurance claims, or losses.14 Calendar-year estimates are prepared from A.M. Best insurance data [1,2]. Quarterly seasonally-adjusted estimates are interpolated without an indicator series from the annual estimates. Current quarterly estimates are extrapolated judgmentally. In 1997, the first states reached out-of-court settlements with the tobacco companies, and during 1998 two additional states reached out-of-court settlements and the Master Settlement Agreement (MSA) was accepted.15 In implementing this agreement, the National Association of Attorneys General [19] established a general escrow account for the distributions to each state based on formulas established in the agreement. In the NIPAs, these payments are classified as current receipts from business, which include awards to state and local governments from the settlement of civil lawsuits. Expected payments are published in the MSA through 2025. The distributed funds are placed in the appropriate quarters. FROM PERSONS Current transfer receipts from persons consist of a wide variety of payments from individuals to state and local governments. From 1959 forward, calendar-year estimates are prepared by adjusting COG/GF fiscal-year data using the procedure described in “Annual Estimates.” These receipts are classified as fines, including penalties imposed for violations of the law and certain court fees; and “other,” including donations from individuals, unclaimed monies, charges for court and recording fees, and license fees. The annual estimates are prepared from unpublished data underlying COG/GF current charges and miscellaneous general revenue. Quarterly seasonally-adjusted estimates are interpolations without an indicator series from the annual estimates. Current quarterly estimates are extrapolated judgmentally. Monthly estimates are interpolated without an indicator from the quarterly seasonally-adjusted series and extrapolated judgmentally. CURRENT SURPLUS OF GOVERNMENT ENTERPRISES Government enterprises are governmental units that sell products to households and businesses and cover most or all of their expenses from revenue. An expedient way to identify government enterprises out of the tens of thousands of state and local governmental units is to classify enterprises by functions. The following functions are deemed to be enterprise functions: Water; 14 For a full discussion of these issues, see Moulton, Seskin, 17-34 and Boaline Chen and Dennis J. Fixler, “Measuring the Services of Property-Casualty Insurance in the NIPAs,” Survey of Current Business 83 (October 2003): 10-26. 15 For more information, see Janet H. Kmitch and Bruce E. Baker, “State and Local Government Fiscal Position in 1998,” Survey of Current Business 79 (April 1999): 11-17.

III– 22
sewerage; gas; electricity; toll facilities; liquor stores; air terminals; water terminals; housing and urban renewal; public transit; and a residual category that includes state lotteries, gaming administered by Indian tribal governments, off-track betting, local parking, and miscellaneous commercial activities. To estimate current operating receipts, BEA supplements revenue data reported in COG/GF with an estimate of “other enterprise revenue,” which is drawn from COG/GF current charges and miscellaneous general revenue, as shown in table III-1. An estimate of non-operating receipts included in the COG/GF data for electric utilities [64] is removed, as described above in the “Differences Between COG/GF and NIPA Receipts.” Quarterly seasonally-adjusted estimates of current operating receipts are interpolated from the annual estimates without an indicator series and extrapolated judgmentally. Estimates of subsidies paid by the Federal government to state and local government housing enterprises are also added, because COG/GF records these as intergovernmental receipts. Federal subsidy payments to these enterprises are derived from analyses of the Monthly Treasury Statement (MTS) [94].16 Estimates of current operating outlays are prepared by function, based on COG/GF current operating expenditures. Outlays include employer contributions plus a number of additional items, one of which is an imputation for employer contributions to social insurance funds on behalf of enterprise employees. Also, estimates of the CFC for government enterprises are included as an outlay in the NIPA enterprise surplus calculation. Quarterly seasonally-adjusted estimates of current operating outlays are interpolated from the annual estimates without an indicator series and extrapolated judgmentally. For specific types of enterprises, additional source data augment COG/GF. Data on local toll facilities are from Highway Statistics [92], which are prepared by the FHWA. Reports from local governments in New York are used to assemble information on off-track betting. Data from Gaming and Wagering Business [11] are used to estimate surpluses generated by lotteries. Annual data on lottery receipts and expenditures, with a one-year lag, and current quarterly data on gross lottery sales supplement the receipts and expenditures data from COG/GF. Indian tribes are local governments in the NIPAs, but they are excluded from the COG/GF; therefore, it is necessary to obtain data from an alternate source and include them in the NIPA enterprise estimates. Receipts data on gaming administered by Indian tribal governments are obtained from the National Indian Gaming Commission [22]. Estimates of expenditures by tribal gaming enterprises are estimated using information on typical profit margins for privately run casinos. Therefore, the surplus of Indian gaming enterprises is prepared by subtracting the estimated expenditures of these enterprises from their estimated receipts. For liquor stores, the surplus is calculated by subtracting expenditures, adjusted to remove inventory change from the current operating outlays, from liquor store receipts. The inventory change is derived from State Government Finances [46] and is included in purchases of goods and services. 16 See Part II, “Subsidies.”

III– 23
CAPITAL TRANSFER RECEIPTS As mentioned in Part I of this publication, certain government transactions are classified as capital transfers. For state and local governments, capital transfers include estate and gift taxes and Federal government capital grants for highways, transit, air transportation, and water treatment plants. This section provides the methodology for estimating these capital transfers. ESTATE AND GIFT TAXES Beginning with 1988, these taxes are based on COG/GF data. Annual estimates for state estate and gift taxes are prepared by interpolating COG/GF fiscal-year data using data from the QS [45] as an indicator series. The interpolated quarters are then summed to calendar years. The annual estimates for local estate and gift taxes are prepared by interpolating fiscal-year data without indicator and re-summing quarters to calendar years. Quarterly estimates for both state and local estate and gift taxes are prepared by interpolating annual estimates without an indicator series. Current quarterly estimates are extrapolated judgmentally. For 1963 through 1987, annual estimates of state estate and gift taxes are prepared as the sum of four quarters of tax collections data from the QS and its underlying unpublished detail. Before 1963, estimates of estate and gift taxes are prepared using annual data on local taxes (with school district property taxes lagged 6 months) and the State Government Finances [46] fiscal-year state tax data converted to a calendar-year basis by simple averaging. CAPITAL GRANTS See Part II, “Capital Grants-in-aid to State and Local Governments.” 4. DERIVATION OF EXPENDITURES The primary data source for estimates of state and local government current expenditures and gross investment is COG/GF [38,43] from the Census Bureau. Other sources include construction statistics that are prepared by the Census Bureau [40], data on government social benefit payments from HHS [66,67,68,70,73,74,75,77,78,79], and employment and wage and salary statistics prepared by BLS [86,87]. Estimates of current expenditures and gross investment for years before 1952 are based on State Government Finances [46] and the available Census Bureau estimates of local expenditures, Census Bureau construction statistics, information on government social benefit payments from HHS, and BLS employment and earnings statistics. For the years before 1942 for which the data are fragmentary, estimates of consumption expenditures and gross investment, other than construction and compensation, are prepared by extrapolation, using state and local government compensation as an indicator series. Data from the COG/GF are available according to the timeline presented in the above section “Overview Of Source Data And Estimating Procedures.” Unless otherwise noted, the COG/GF data are converted to a calendar-year basis using the procedure described in “Annual Estimates.”
III– 24
For years for which Census data are unavailable, BEA extrapolations of the COG/GF data are used to prepare calendar-year estimates. This section provides a detailed analysis of the sources and methods used to estimate consumption expenditures and gross investment, following the outline of the NIPA table family 3.10.x. Table III-2 presents the derivation of the estimates for the consumption expenditures and gross investment categories. Table III-3 presents the derivation of the estimates for the current expenditures categories. Although the sources of information for states and localities differ, states are not distinguished from local governments in table III-2, table III-3, or in the NIPA tables. Periodically BEA prepares and publishes separate estimates of state and local government transactions.17 Tables III-2 and III-3 list the sources of the estimates and indicate the procedure by which the quarterly estimates of the major types of expenditures are derived. Quarterly (and, where necessary, monthly) seasonally-adjusted estimates of expenditures are prepared using one of four methods: (1) For those expenditure categories for which seasonally-adjusted quarterly data are available, they are used directly; (2) for those expenditure categories for which unadjusted quarterly data are available, quarterly seasonally-adjusted estimates are prepared by using the Census Bureau X-12 ARIMA seasonal adjustment program to adjust the quarterly data directly; (3) for those expenditure categories for which only annual data are available but for which the quarterly pattern of outlays may be assumed to reflect fluctuations in another expenditure component or in some related series, the quarterly seasonally-adjusted estimates are prepared by interpolating the annual estimates using a seasonally-adjusted measure of the expenditure component or related series as an indicator; (4) for those expenditure categories for which annual data are available but no quarterly data nor relevant indicator are available, the quarterly seasonally-adjusted estimates are prepared by interpolating the annual estimates into quarterly estimates without an indicator. Current quarterly estimates are prepared under each of these methods by extrapolation using the indicator series (Methods (1), (2), and (3)), or by extrapolating judgmentally. Unless otherwise indicated, the advance, preliminary, and final current estimates of each component of consumption expenditures and gross investment are prepared using the same methodology. In those cases where the methodology differs, the procedure is explained in the sections detailing each estimate contained below. Quarterly unadjusted estimates are prepared using one of three methods: (1) Where unadjusted quarterly data are available, they are used directly; (2) annual-only data are interpolated using a related quarterly unadjusted series as an indicator; (3) where a quarterly indicator series is unavailable, the quarterly unadjusted estimates are the same as the quarterly seasonally-adjusted estimates described above. 17 For the most recent presentation of the data, see Bruce E. Baker, “Receipts and Expenditures of State Governments and of Local Governments, 1959-2001”, Survey of Current Business 83 (June 2003): 36-53. A new presentation of these estimates is anticipated in October 2005.
III– 25
CONSUMPTION EXPENDITURES State and local government consumption expenditures is measured as compensation; CFC; intermediate goods and services purchased, less sales to other sectors; and own-account investment.18 Additionally, government expenditures in COG/GF are classified by function, or purpose, of the expenditure. (The functions are listed in appendix III-B.) Therefore, an indirect procedure is used to estimate consumption expenditures, by commodity, from the annual COG/GF functional data on current operations, capital outlay, and general government sales. The procedure uses information, by function, on the commodity composition of state and local government purchases from BEA’s input-output (I-O) tables [49]. Table III-2 shows the sources used for the estimates of consumption expenditures. GROSS OUTPUT OF GENERAL GOVERNMENT VALUE ADDED Compensation of general government employees Compensation is estimated as the sum of two components: Wages and salaries and supplements to wages and salaries. The source data for compensation cover all state and local government employees, including employees of government enterprises. Enterprise current account expenditures, including compensation, are not included in government consumption expenditures.19 Wages and salaries are distributed among the functions of government using data on wages and salaries from the Census Bureau’s report, Public Employment [44]. Certain functions are deemed to be “enterprise functions,” and compensation for these functions is used in calculating the enterprise current account expenditures. Other functions are considered to be general government functions. Estimates of compensation for general government own-account investment are subtracted from compensation within consumption expenditures, because own-account investment is included in estimates of gross investment in new structures and software.
WAGES AND SALARIES Wages and salaries include cash wages and salaries paid to government employees plus compensation paid to prison inmates, fees paid to jurors and witnesses, and marriage fees paid to justices of the peace. Calendar-year estimates are primarily from BLS tabulations of employment and wages reported by employers covered by state unemployment insurance programs [86,87] and of estimates of wages and salaries of state and local employees not covered by 18 Own-account investment is output of the sector deemed to be investment, not compensation. 19 See “Current Surplus of Government Enterprises” for more details.
III– 26
unemployment insurance, including students who work for public educational institutions. Annual estimates of marriage fees, jury and witness fees, and compensation of prison inmates are based on state and local government budgets and COG/GF data on current judicial expenditures. During comprehensive revisions, annual estimates of jury and witness fees are based on state budget data for jury and witness fees. Annual estimates of compensation of prison inmates are based on annual data on average compensation and number of state prison inmates [16,81]. Beginning with 1990, Indian tribal governments and tribal government-owned enterprises, including casinos, are included in BLS tabulations of employment and wages reported by employers covered by state unemployment insurance programs for local governments [86,87]. Quarterly seasonally-adjusted estimates of wages and salaries are prepared by summing the BLS monthly series. For monthly series, BEA develops a monthly indicator series using changes in BLS monthly seasonally-adjusted employment estimates [89] and changes in the BLS employment cost index (ECI) [88]. Monthly wages and salaries are then prepared by interpolating annual estimates using the indicator series. Estimates of the quarterly change in the ECI are judgmentally extrapolated for the next quarter during the current quarter preliminary estimate. ECI data are received from BLS during the advance estimate for the current quarter and are fully incorporated during the preliminary estimate.
SUPPLEMENTS TO WAGES AND SALARIES Supplements to wages and salaries include employer contributions for employee pension funds, insurance funds, and government social insurance. Employer contributions for state and local employee pension and insurance funds consist of the following: State and local employee pension funds, group health insurance, group life insurance, private pension funds for state and local government education workers (TIAA/CREF), and private workers’ compensation insurance funds for state and local employees. Employer contributions for social insurance consist of the following: Old-age, survivors, disability, and hospital insurance, unemployment insurance, and state-administered workers compensation insurance. Monthly estimates of employer contributions for state and local employee pension and insurance funds are prepared because they are components of, and are published with, the monthly personal income and outlay account. As a general rule, monthly estimates for these components of compensation are interpolated without indicator from annual estimates, and quarterly estimates are prepared by summing monthly estimates. Current quarterly and monthly estimates are prepared using judgmental extrapolation. Exceptions to this rule are explained in the sections below. For employer contributions to state and local employee pension and insurance funds, the annual estimates are based on various sources. Employer contributions to state and local government employee retirement funds [42] are based on the Census Bureau’s Annual Retirement System Survey; estimates of group health insurance are based on the MEPS for group health [69]; and

III– 27
estimates of private pension funds for certain state and local education workers are based on unpublished data from TIAA/CREF [35]. Employer contributions to group life insurance and workers’ compensation insurance are based on annual reports of private insurance carriers [3,18]. Certain supplements, chiefly pension fund contributions that are dedicated to education employees, are assigned to these employees. The remainder is allocated between employees of government enterprises and general government in proportion to wages and salaries for the two groups. Within general government, supplements are further allocated between education and noneducation employees in proportion to wages and salaries for these two groups. Quarterly seasonally-adjusted estimates of employer contributions to group health insurance are prepared by interpolating annual estimates using total state and local wages and salaries as an indicator series. Quarterly estimates are extrapolated using BLS Employer Costs for Employee Compensation (ECEC) [85] and total state and local wages and salaries [86]. Monthly estimates are prepared by interpolating the quarterly seasonally-adjusted series. Monthly estimates are extrapolated using the product of ECEC and wages and salaries. Current monthly estimates of other employer contributions for employee pension and insurance funds, except for employer contributions to group health insurance and state and local employee retirement funds, are extrapolated using changes in BLS employment data. The methods used to prepare annual and quarterly estimates of employer contributions for social insurance are described above in the section “Contributions for Government Social Insurance” (See also Part II, “Contributions for Government Social Insurance.”). A description of the methodology used to prepare annual and quarterly estimates of state-administered workers’ compensation funds is discussed in the above section, “Contributions for Government Social Insurance.” Consumption of general government fixed capital Estimates of current-dollar general government CFC are derived by multiplying the constant-dollar estimates by the appropriate price indexes. The CFC current-dollar estimates are prepared using this procedure for over 50 types of structures and equipment, (see “Consumption of general government fixed capital” for a discussion of constant-dollar CFC). INTERMEDIATE GOODS AND SERVICES PURCHASED State and local government intermediate goods and services include all the durable goods, nondurable goods, and services consumed in order to produce state and local government gross output. NIPA Table 3.10.5 shows the derivation of state and local government consumption expenditures starting from “gross output of general government.”20 20 See the stub of NIPA Table 3.10.5.

III– 28
BEA prepares annual estimates of current operating expenditures separately for states and for localities, for each of the functions shown Appendix III-B, using COG/GF data. Estimates of intermediate goods and services purchased are prepared by subtracting items that are not included in the NIPA definition of intermediate goods and services from COG/GF data on current operating expenditures by function. The residual amount is then distributed among durable goods, nondurable goods, and services. The first item that is subtracted is wages and salaries (except for 1978–81, when the COG/GF data classified them separately). The second item that is subtracted is “other current operating expenditures,” which are not included in NIPA purchases of intermediate goods and services. These purchases include pay-related outlays that are included in NIPA compensation (as supplements), payments that are included in NIPA transfer payments, enterprise expenditures for operations, and subsidies paid to railroads. The third item that is subtracted is software purchases. Software purchases are removed because these purchases are treated as investment rather than consumption expenditures in the NIPAs. The methods used to prepare estimates of state and local software investment are discussed below in the section on “Gross Investment.” Finally, estimates of own-account investment must be subtracted because they are classified in the NIPAs as investment. Once these items are subtracted from the COG/GF current operating expenditures data by function, the residual is distributed among durable goods, nondurable goods, and other services. First, data on libraries from the Association of American Publishers [5] and from Bowker’s [10] are used to estimate purchases of books and audiovisual materials by four functions—elementary and secondary education, higher education, public libraries, and general control. For each of these functions, the estimates of books and audiovisual equipment are classified as gross purchases of durable goods and are subtracted from the remainder of other current operating expenditures. The remainder of other expenditures on current operations is distributed, by function, among gross purchases of durable goods, nondurable goods, and services using benchmark information on the commodity composition of purchases, also classified by function, from BEA’s benchmark I-O tables [49]. Because the I-O table is only available about every five years, the fixed-weighted constant-dollar commodity distribution is wedged between I-O years and then multiplied by the appropriate price index to obtain current-dollar commodity distribution weights, which are applied to the Census Bureau estimates that are discussed above. Quarterly seasonally-adjusted estimates for intermediate goods and services purchased are prepared by interpolating without an indicator series annual estimates of each of the major categories of intermediate goods and services. Current quarterly estimates are prepared by extrapolating the constant-dollar estimates judgmentally and then converting them to current dollars by multiplying the constant-dollar estimates by the appropriate price indexes.21 21 For more information, refer to “Estimates of Real Consumption Expenditures and Gross Investment.”
III– 29
Services
IMPUTED BANK SERVICES Government consumption expenditures include the value of an imputation for bank services that are supplied without payment. For the methodology used to prepare NIPA estimates of services furnished without payment by financial intermediaries, see the section above, “Imputed Interest Received.”
SERVICES FURNISHED WITHOUT PAYMENT BY DOMESTIC SECURITY BROKERS Government consumption expenditures include an imputation for the estimated value of services rendered without payment to state and local governments by domestic security brokers. This series is an implicit charge equal to the “bid-ask” price spread on the transactions carried out by securities dealers on behalf of governments. Dealers who make markets in securities do not charge commissions; instead, as income they retain the revenue resulting from acquiring securities at a price lower than the price at which the securities subsequently are sold to their customers. Omitting this imputation would reduce business income because the trading gains would be classified as capital gains income, which is omitted in the NIPAs. For Federal Government and agency securities owned by state and local governments, commissions are estimated using the dollar volume of trading as reported by the Federal Reserve Bank of New York, bid and ask prices as published in the Wall Street Journal, and sectoral allocation based on the Federal Reserve Board’s Flow of Funds [9] data. For equities, commissions are estimated based primarily on cents per share spread and volume data from the National Association of Securities Dealers and on total specialist sales and average spreads data from the New York Stock Exchange. OWN-ACCOUNT INVESTMENT Own-account investment is investment in structures and software produced by state and local government employees. Estimates of own-account investment are included in general government gross output, but they are subtracted from gross output to derive estimates of general government consumption expenditures. Own-account investment is measured as the sum of compensation of employees engaged in construction and in the development of new software, along with the overhead costs for the related goods and services required to produce the structures and software. Estimates of state and local government own-account investment are included in state and local government gross investment in structures and in equipment and software. Annual estimates of general government own-account compensation are prepared using data from BEA’s I-O tables, which include estimates of this investment by type of expenditure, by function. Ratios of own-account construction compensation to the value of new construction, by function, are extrapolated and interpolated without an indicator series between I-O years. Annual estimates of own-account construction compensation are the product of these ratios and annual

III– 30
data on new construction put in place, by function. The own-account overhead expenditures for construction are set equal to the amount of the own-account compensation value and then distributed to specific commodities within intermediate goods and services based on detailed information from BEA’s I-O tables [49]. Quarterly seasonally-adjusted estimates of education and all other own-account construction investment are prepared by interpolating the seasonal estimates, using seasonally-adjusted Census Bureau education and all other construction series as indicators. Current quarterly estimates are extrapolated using the same indicator. Similar to own-account compensation for construction, own-account investment for software development is based on detailed I-O information. Annual estimates of own-account software investment are based on information from BEA’s I-O tables and are extrapolated between I-O years using changes in estimates of private own-account investment. Quarterly estimates of own-account software investment are extrapolated using private own-account investment estimates. Current quarterly estimates are extrapolated using the same indicator. SALES TO OTHER SECTORS State and local government sales to other sectors include tuition and related educational charges, health and hospital charges, and other sales of goods and services. Estimates of state and local government sales to other sectors are based on COG/GF data. Annual estimates are prepared from unpublished data underlying COG/GF current charges and miscellaneous general revenue. Appendix III-A provides more details on these data. COG/GF fiscal-year data are converted into calendar-year data using the procedure that is described in “Annual Estimates.” Once annual estimates are derived by function from the Census data, total sales estimates are disaggregated into specific commodities based on the commodity distribution that is provided in the detailed I-O table (which has the breakdown by function). Quarterly seasonally-adjusted estimates are prepared by interpolating annual estimates without an indicator series. Current quarterly estimates are derived by extrapolating the constant-dollar estimates judgmentally and converting them to current dollars by multiplying the constant-dollar estimates by the appropriate price indexes. GROSS INVESTMENT Gross investment comprises investment in structures, equipment, and software. The following sections describe the sources and methods used to prepare these estimates and are consistent with the outlines of NIPA table family 3.9.x.22 22 See the stub of NIPA table family 3.9.x.
III– 31
STRUCTURES Gross investment in structures consists of new construction put in place and net purchases of existing structures. Compensation paid to state and local general government employees engaged in own-account investment is included in the VPIP [40], and is subtracted from general government compensation to avoid double-counting. NEW CONSTRUCTION For 1975 and later years, the Census Bureau data from VPIP [40] are used to estimate the value of new structures. Since 1975, the Census Bureau has conducted a direct survey of construction projects in which information is gathered about the value of construction completed each month on a sample of projects. This survey is benchmarked to COG/GF for six categories of construction: Housing, education, highway, electric, sewer and water supply, and all other construction. Beginning with July 2003, the Census Bureau’s Manufacturing and Construction Division began publishing VPIP [40] data using a new classification system. Census provided BEA with a bridge that permits comparisons between the old and new types of construction for 1997. As a result of the new classification system, the categories used to benchmark the VPIP data to COG/GF are different beginning with 1997. The new VPIP structures types are benchmarked to Census COG/GF in the following categories: Residential, educational, highway and street, power, sewage and waste disposal and water, and all other construction. BEA uses construction by function from COG/GF and unpublished detail from the VPIP survey to estimate additional detail used in the NIPAs. For years prior to 1975, estimates of new construction put in place are obtained from the Census Bureau, which collects monthly data on construction expenditures. These data are lagged one month to approximate the put in place timing. In one case, BEA departs from the Census Bureau construction data because of evident under-reporting. For the years 1972−75, as funds from the Federal Clean Water Act became available, BEA modifies the Census Bureau sewer construction data because the sample design for the VPIP survey was not totally successful in capturing a representative component of the new special districts created to build and operate new systems. During annual revisions, BEA extrapolates the most recent, complete construction survey data—both the VPIP data and unpublished, preliminary tabulations of COG/GF data. Quarterly seasonally adjusted and unadjusted estimates are prepared by interpolating the annual estimates using the VPIP data as the indicator series. Advance quarterly estimates for new structures are extrapolations using two months of VPIP data as the indicator series. Typically, two months of data are averaged to obtain an estimate for the third month. Three months of VPIP data are available for the preliminary and final estimates.
III– 32
NET PURCHASES OF EXISTING STRUCTURES Estimates of net purchases of existing structures are based on data from COG/GF. The Census Bureau reports data, by function, on purchases of equipment, land, and existing structures. Sales of land and existing structures are also reported for both states and localities combined, not separately nor by function.23 Because land transactions are classified as net purchases of nonproduced assets, a separate category from NIPA government gross investment, BEA prepares estimates of the value of purchases of existing structures, excluding land. Ratios, calculated by function from BEA’s I-O tables [49], are used to separate purchases of structures from those of land. Sales of structures and land are separated using the overall ratio of purchases of structures to those of land. State sales of property are from State Government Finances [46], and local sales are from a BEA analysis of COG/GF miscellaneous general revenues. Sales are netted against purchases to derive net purchases of existing structures. Quarterly seasonally-adjusted estimates are prepared by interpolating annual estimates without an indicator series, and current quarterly estimates are judgmental extrapolations. EQUIPMENT AND SOFTWARE NIPA estimates of equipment investment are based on COG/GF data from the Census Bureau. For state governments from 1979 forward, total equipment purchases are reported separately from other purchases of capital, including land and existing structures. For all local government data and state data prior to 1979, the Census Bureau reports combined purchases of equipment, land, and existing structures and sales of property; i.e., land and existing structures, by function. For periods when Census reports the purchases on a combined basis, BEA estimates equipment purchases using pre-1978 information on the relationships between functions and equipment, land, and existing structures purchases. Once estimates of total equipment purchases are prepared, the estimates are distributed by function into detailed equipment estimates using information on the commodity composition of purchases, also classified by function, from BEA’s benchmark I-O tables. In non-benchmark years, annual estimates of computer purchases (based on the I-O table) are interpolations and extrapolations using Census-based computer shipments data as an indicator series. The following sections describe the methods used to prepare quarterly estimates of computers. EQUIPMENT EXCLUDING COMPUTERS Quarterly seasonally-adjusted estimates of equipment excluding computers are interpolations of annual totals of each of the major categories without an indicator series. The current quarterly estimates of all non-computer equipment series are prepared by extrapolating constant-dollar estimates judgmentally and then converting them to current dollar estimates by multiplying the constant-dollar estimates by the appropriate price indexes. 23 For years after 1978, the Census Bureau separates purchases of equipment from those of land and existing structures only for states. BEA estimates equipment purchases of local governments, using pre-1978 information on the relationships, by function, among equipment, land, and existing structures.

III– 33
COMPUTER HARDWARE Quarterly estimates of computer hardware are prepared by extrapolation, using Census Bureau computer shipments as an indicator series. COMPUTER SOFTWARE Purchases of software are classified as investment in the NIPAs. As discussed in the section on intermediate goods and services purchased, estimates of software are removed from COG/GF-based intermediate goods purchased so that they can then be added to NIPA investment along with equipment. The three categories of software investment that are identified in the NIPAs are purchases of prepackaged software, custom software, and own-account software investment. In benchmark years, these estimates are based on detailed expenditure information, by function, from BEA’s I-O tables.24 Non-benchmark year’s annual and quarterly estimates are interpolations and extrapolations using the indicators described below. Pre-packaged software Estimates of prepackaged software are extrapolations and interpolations using as an indicator software company receipts from Securities and Exchange Commission (SEC) reports and data on monthly software sales from trade sources. Current quarterly estimates are extrapolations using the same indicator series. Custom software Annual and quarterly estimates of custom software are interpolations and extrapolations using as an indicator company receipts and monthly retail sales data. Current quarterly estimates are extrapolations using the same indicator series. Own-account software Annual and quarterly estimates of own-account software investment are interpolations and extrapolations using as an indicator series a percent change in a 3-quarter moving average trend of private fixed investment in computers and peripheral equipment. Current quarterly estimates are extrapolations using the same indicator series. 24 For more on BEA’s sources and methods of estimating software, see Bruce Grimm and Robert Parker, “Recognition of Business and Government Expenditures for Software Investment: Methodology and Quantitative Impacts, 1959-1998,” www.bea.gov/bea/mp.htm (May 2000).
III– 34
OTHER CURRENT EXPENDITURES CURRENT TRANSFER PAYMENTS GOVERNMENT SOCIAL BENEFIT PAYMENTS TO PERSONS State and local government social benefit payments to persons consist of benefits from social insurance funds, public assistance, and payments for education, employment and training, and other assistance. Estimates are prepared monthly, as well as quarterly and annually, because they are a component of the monthly personal income and outlay account. As a general rule, monthly estimates are interpolated without indicator from annual estimates, and quarterly estimates are prepared by summing monthly estimates. Further, monthly and quarterly current estimates are prepared through judgmental extrapolation. Exceptions to this rule include estimates for Medicaid, medical premiums paid on behalf of indigents (MPPI), Federally administered state supplementation, disaster assistance, and Special Supplemental Nutrition Program for Women, Infants, and Children (WIC). The methodologies used to derive these estimates are provided in table III-3. Benefits from social insurance funds Benefits from social insurance funds consist of temporary disability insurance benefits and workers' compensation benefits. Annual estimates are prepared by the methods discussed below.
TEMPORARY DISABILITY INSURANCE Estimates of benefits from temporary disability insurance funds are prepared using data from COG/GF for New Jersey and Rhode Island and from the California Employment Development Department [31]. Calendar-year estimates for New Jersey and Rhode Island are prepared by averaging fiscal-year data. These calendar-year estimates are added to calendar-year data received from the State of California.
WORKERS’ COMPENSATION Fiscal-year data for benefits from state-administered workers' compensation funds are available from COG/GF. Benefits from temporary disability funds for the State of Colorado, which are compiled in COG/GF, are added to workers’ compensation benefits. Calendar-year estimates are prepared by averaging fiscal-year data.
III– 35
Public assistance Public assistance consists of social benefit payments for medical care, family assistance, supplemental security income (SSI), general assistance, energy assistance, WIC, foster care, adoption assistance, and payments to nonprofit welfare institutions.
MEDICAL CARE Medical care is comprised entirely of medical vendor payments, which are government payments on behalf of indigents for medical services, drugs, and other medical supplies. Most of these payments are for the federally assisted Medicaid program and for the State Children’s Health Insurance Program (SCHIP). The remaining payments are for state general medical assistance. Beginning with 1991, quarterly Medicaid data are from the Medicaid Financial Management Report (MFMR) from the Centers for Medicare and Medicaid Services (CMS) (formerly the Health Care Financing Administration). Quarterly values are prepared by seasonally adjusting quarterly data from the MFMR. Monthly estimates are prepared by interpolating the seasonally-adjusted quarterly estimates without an indicator series. Current quarterly estimates are prepared by judgmental extrapolation, taking into account such items as “Federal Grants to States for Medicaid” from the MTS [94] and the average annual national Federal Medical Assistance Percentage, weighted by state Medicaid expenditures. Monthly estimates are prepared by fitting the quarterly value over the relevant months. The SCHIP was first implemented by Congress in late 1998. Since then, data on expenditures from separate state programs and from Medicaid extension programs are available from CMS. The estimates for separate state programs are added to general medical assistance expenditures to prepare estimates of “other medical vendor payments.” Estimates for Medicaid extension programs are added to “Medicaid” to ensure definitional consistency. Monthly estimates for MPPI are from CMS [75]. Quarterly and annual estimates are prepared by summing the monthly estimates. These estimates are subtracted from Medicaid expenditures to calculate “Medicaid, excluding MPPI.” Since 1988, the annual value of “general medical assistance” is obtained from the states by CMS [74]. Prior to 1983, monthly data provided by HHS for Medicaid included payments for “general medical assistance.” For 1983 through 1987, the estimates are interpolations between the pre-1983 and post-1987 data sources. From 1983 to 1990, calendar-year estimates of medical vendor payments are based on quarterly data from the CMS [72]; data for 1983 and earlier are available monthly from CMS and predecessor organizations. The monthly and quarterly seasonally-adjusted estimates for “Medicaid, excluding MPPI” and “general medical assistance,” are interpolated and extrapolated without indicator for 1984 to 1990. Before 1984, when these series exhibited measurable
III– 36
seasonality, the monthly data are seasonally adjusted and are converted into quarterly and annual estimates by summing the monthly estimates.
FAMILY ASSISTANCE Family assistance consists of payments for Aid to Families with Dependent Children (AFDC), emergency assistance, and, beginning with 1996, assistance programs operating under the Personal Responsibility and Work Opportunity Reconciliation Act of 1996, known as Temporary Assistance to Needy Families (TANF). For 1997 and later, annual estimates of TANF are prepared using Federal fiscal-year financial data from the Administration for Children and Families [66]. TANF data are presented on a Federal fiscal-year basis. Calendar-year totals are derived by adding 75 percent of the total expenditures from fiscal year(t) to 25 percent of the total expenditures for fiscal year(t+1). For 1996 and earlier, monthly data for AFDC and for emergency assistance are from the Office of Family Assistance, [71]; the AFDC data are supplemented by information from the Administration for Children, Youth, and Families [65]. The monthly data are seasonally adjusted. Annual and quarterly estimates are prepared by summing the monthly estimates.
SUPPLEMENTAL SECURITY INCOME In January 1974, the Federal SSI program replaced aid to the blind, old age assistance, and aid to the permanently and totally disabled. Certain state governments chose to continue their own SSI program in one of two ways. Certain states make direct payments to individuals, and some deposit the payments with the Federal Government, which then makes the supplemental payments to the individuals. Monthly data for Federally administered state supplementation are from the Social Security Administration (SSA) [79]. The monthly data reflect no identifiable seasonality. Annual and quarterly estimates are prepared by summing the monthly estimates. Data for payments made directly from the states to individuals are available annually from the SSA.
GENERAL ASSISTANCE Since 1981, annual estimates for “general assistance” are from COG/GF data for "other cash assistance programs" and "vendor payments for other purposes,” excluding social benefit payments to persons for energy assistance. In addition, since 1988, general assistance includes disaster assistance payments to individuals. Monthly disaster assistance data are obtained from the Federal Emergency Management Agency (FEMA) [80]. Monthly seasonally-adjusted estimates of general assistance, excluding disaster payments, are interpolated from annual estimates and extrapolated judgmentally. Annual and quarterly estimates are prepared by summing the monthly estimates. For periods prior to 1981, monthly general assistance data are available from HHS.
III– 37
ENERGY ASSISTANCE Social benefit payments for energy assistance to low-income individuals are recorded for 1977 and later. Energy assistance includes both cash payments to low-income individuals and vendor payments to suppliers. The estimates for energy assistance include benefits from the Federal Low Income Heating and Energy Assistance Program (LIHEAP) and benefits from separate state programs. Annual estimates of Federal LIHEAP benefits are derived from Federal grants-in-aid, excluding administrative costs. Beginning with 1988, annual social benefits from separate state programs are based on the percentage change in the annual Federal LIHEAP benefit estimate. Information on independent state programs is from a study by the Maryland Energy Assistance Program [70].
OTHER PUBLIC ASSISTANCE The remainder of public assistance consists of expenditures for WIC, foster care, adoption assistance, and payments to nonprofit welfare institutions. For current estimates, monthly WIC food expenditure data are available from the WIC program State Agency Participation and Expenditure Report [36], provided by Food and Nutrition Services of the United States Department of Agriculture. Annual estimates are prepared by summing monthly data. During annual and comprehensive revisions, monthly estimates are interpolated from annual estimates without indicator. Foster care payments are estimated using expenditures by the Federal Government under Section IV-E of Title XX of the Social Security Act [67], state payments under Section IV-E that are derived using average state matching rates, and state-only payments that are based on a 1983 study by the American Public Welfare Association [4]. Estimates of adoption assistance are prepared using expenditures by the Federal Government under Section IV-E of Title XX of the Social Security Act, state payments under Section IV-E that are derived using the average state matching rates, and state-only payments that are based on 1994 study by the American Public Welfare Association [68]. Calendar-year estimates for foster care and adoption assistance programs are prepared using Federal data through the procedure described in the “Family Assistance.” Annual data for welfare payments to nonprofit organizations come from COG/GF. Calendar-year estimates are prepared by averaging fiscal years. Education Education social benefit payments are identified in COG/GF as "assistance and subsidies.” These payments include scholarships, stipends, fellowships, and similar payments to individuals, plus

III– 38
state support for nonprofit educational institutions. Calendar-year estimates are prepared by averaging fiscal-year data. Employment and training Beginning with 1982, employment and training consists of payments to nonprofit institutions for training programs under the Job Training Partnership Act of 1982. Annual data are from NIPA Federal grants-in-aid to state and local governments (see Part II, “Grants-in-aid to state and local Governments”) and from the Office of Management and Budget’s analysis of the Department of Labor’s Employment and Training Administration (ETA). For years prior to 1982, employment and training includes payments under the Comprehensive Employment and Training Act (CETA) and its predecessor, the Public Employment Program, which provided funds from 1971 until 1982 for employment in state and local governments, for employment in nonprofit organizations, and for job training programs operated by nonprofit institutions. Expenditures for employment in state and local governments are classified as wages, a component of consumption expenditures. The remaining expenditures are included in social benefit payments to persons. For employment in nonprofit institutions, estimates are based on occasional informal estimates of CETA employment in nonprofit institutions made by the ETA and on staff studies performed by the Urban Institute [97]. ETA estimates of average pay per CETA participant are multiplied by monthly estimates of nonprofit employment to derive a value for these social benefit payments. For job training programs operated by nonprofit institutions, the value of training grants is available quarterly from the ETA [91]. Other “Other” social benefits consist of payments for crime victims’ compensation, Alaska social benefit programs, veterans benefits, and corrections and health. Social benefits that compensate victims of crimes are paid in all 50 states and the District of Columbia. Beginning with 1986, annual data are available with a 1-year lag from the Department of Justice, Office for Victims of Crime [82]. Estimates for 1979-85 are based on a compilation of data on state benefits by the New York Crime Victims Board [24]. Between 1968 and 1978, data are based on BEA’s informal collection of information from individual states. Social benefit payments from the State of Alaska include annual payments from the Alaska Permanent Fund to residents and bonus payments given to residents 65 years of age or older, who meet specific state requirements. Beginning with 1982, annual payments are made from the earnings of a fund that receives payments from companies extracting oil from the North Slope oil fields. Annual data are available from the Alaska Department of Revenue [27,29]. Monthly unadjusted estimates are calculated by placing the majority of the annual estimate in the fourth quarter, with the rest in progressively smaller increments into the first, second, and third quarters. The method for preparing the monthly unadjusted estimates is based on historical monthly data from the Alaska Department of Revenue.

III– 39
From 1985 to 2003, annual data for the Alaska longevity bonus program, obtained from the State of Alaska, are included as government social benefit payments to persons. The Commonwealth of Massachusetts provides cash benefits to veterans based solely on their veteran status. Fiscal-year data are available from the Massachusetts Department of Veterans Services. Calendar-year estimates are prepared by averaging fiscal-year data. Social benefit payments from state and local governments for health are comprised of assistance payments to non-publicly funded hospitals. Social benefit payments for corrections represent payments provided to former incarcerated persons when they are released for the purpose of travel, clothing, and a small amount of spending money. Calendar-year estimates of social benefit payments for corrections and health are prepared from COG/GF by averaging fiscal-year data. INTEREST PAYMENTS Interest payments include actual payments and imputed payments. ACTUAL INTEREST PAID Calendar-year estimates of interest paid by state and local governments are prepared by adjusting COG/GF fiscal-year data using the procedure described in “Annual Estimates.” The interest data are available according to the timeline presented in the section “Overview Of Source Data And Estimating Procedures.” Current quarterly estimates are extrapolated judgmentally. The seasonally-adjusted estimates equal unadjusted estimates. IMPUTED INTEREST PAID Estimates of imputed interest are prepared as part of the estimates of imputed interest and associated service charges for the remaining sectors of the NIPAs [54]. SUBSIDIES State and local subsidies are largely payments to railroads. For 1988 and later, annual estimates are based on COG/GF data. For 1983 to 1987, annual estimates are prepared judgmentally. In all cases, quarterly estimates are interpolations without an indicator series of annual estimates. Before 1983, annual data are provided by the Association of American Railroads [6]. Current estimates are extrapolated judgmentally. In 2001, California experienced electricity shortages and price spikes. The State of California made payments, which are classified as subsidies in the NIPAs, to electricity suppliers in 2001, 2002, and 2003 to ease the crisis. Partly offsetting these subsidies are payments by individuals and businesses to the state. Estimates of these subsidies and offsets are provided by the California Department of Finance.
III– 40
WAGE ACCRUALS LESS DISBURSEMENTS Wage accruals less disbursements, as the name implies, is the difference between wages paid on an accrual basis and wages paid on cash basis. Normally, wages are paid with a short lag after they are earned. Wages in both periods are nearly equal, so "wage accruals less disbursements" is estimated as zero in most periods. Differences arise primarily because of strikes and workforce disruptions, and estimates are prepared from reports from jurisdictions affected by strikes on a case-by-case basis [86,87]. NET STATE AND LOCAL GOVERNMENT SAVING The NIPA net state and local government saving measure has two parts: (1) The net saving generated by the excess of social insurance system receipts over the outlays of social insurance systems; and (2) the net saving resulting from all other government transactions. Social insurance fund saving is calculated as the sum of contributions and interest received by social insurance funds, less the sum of social insurance benefits and administrative expenses. Data for administrative expenses of social insurance funds are available in COG/GF for workers' compensation and temporary disability systems. These fiscal-year data are averaged to calendar years, and quarterly seasonally-adjusted estimates are interpolated from annual estimates without an indicator series; current quarterly estimates are extrapolated judgmentally. The other funds saving equals the NIPA total net saving minus the social insurance fund saving. OTHER CAPITAL EXPENDITURES CAPITAL TRANSFER PAYMENTS There are no capital transfer payments for state and local governments. NET PURCHASES OF NONPRODUCED ASSETS Net purchases of non-produced assets are composed of net purchases of land less oil bonuses. Oil bonuses are payments to states for the long-term rights to extract oil, and they are subtracted from land expenditures, to be consistent with the NIPA treatment of sales revenue. Annual estimates of land are based on COG/GF data. COG/GF data for purchases of land, structures and equipment, and sales of land and equipment are split by BEA into separate functional estimates of land, structures, and equipment using ratios. The functional values of purchases and sales of land are then netted to produce estimates of net purchases of land. Oil bonuses are estimated from the charges and miscellaneous general revenue data provided in the COG/GF data.

III– 41
Quarterly estimates are interpolated without indicator, and current quarterly estimates are extrapolated judgmentally. NET STATE AND LOCAL LENDING OR BORROWING (-) Total receipts less total expenditures. 5. ESTIMATES OF REAL CONSUMPTION EXPENDITURES AND GROSS INVESTMENT Most of the time series that are used in computing estimates of real consumption expenditures and gross investment are prepared by deflating current-dollar estimates by suitable price indexes.25 The principal exceptions are compensation and imputed bank services, both of which are estimated by extrapolating base-year values by quantity indicators, and CFC, which is estimated initially in real terms as described below in the section, “Consumption of General Government Fixed Capital.” Major aggregates, such as real consumption expenditures and real gross investment, are prepared by using Fisher chain-type indexes.26 The price indexes used for deflation are taken primarily from the Census Bureau’s Current Construction Reports [40] and from BLS’ Producer Prices and Price Indexes (PPI) [90] and Consumer Price Index Detailed Report (CPI) [84]. Table III-4 indicates the methods that are used to prepare estimates of real state and local consumption expenditures and gross investment by component as well as an overview of the source data used for annual, quarterly, and current quarterly estimates. Current quarterly advance estimates reflect preliminary BEA estimates of the construction price indexes; three months of PPIs; and three months of CPIs. The price data are complete by the final estimate. Unless otherwise stated, the advance, preliminary, and final estimates are prepared using the same methodology. Estimates for other types of consumption expenditures (e.g., social benefits payments, grants-in-aid, interest payments, and subsidies) are not prepared on a real basis because no price indexes or other suitable measures exist for transforming the current-dollar estimates into real measures. NIPA table 3.9.1 shows percent change from preceding period for government consumption expenditures and gross investment; table 3.9.2 shows contributions to percent change; table 3.9.3 shows quantity indexes; table 3.9.4 shows price indexes; table 3.9.5 shows current dollars; and table 3.9.6 shows chained dollars. NIPA table family 3.10.x shows similar information for government consumption expenditures and general government gross output. 25 For a detailed description of deflation, see Part I, “Real Output and Related Measures.” 26 For more information on chain-type indexes, see J. Steven Landefeld and Robert P. Parker, "Preview of the Comprehensive Revision of the National Income and Product Accounts: BEA’s New Featured Measures of Output and Prices," Survey of Current Business 75 (July 1995): 31-38; J. Steven Landefeld and Robert P. Parker, "BEA’s Chain Indexes, Time Series, and Measures of Long-Term Economic Growth,” Survey of Current Business 77 (May 1997): 58-68; and J. Steven Landefeld, Brent R. Moulton, and Cindy M. Vojtech, “Chained-Dollar Indexes: Issues, Tips on Their Use, and Upcoming Changes,” Survey of Current Business 83 (November 2003): 8-16.
III– 42
CONSUMPTION EXPENDITURES GROSS OUTPUT OF GENERAL GOVERNMENT VALUE ADDED Compensation of general government employees (including own-account compensation) The estimates of real compensation are obtained by extrapolating base-year compensation by an index of employee hours that is adjusted for changes in the composition of the workforce in terms of experience and education. This procedure is designed to approximate specification pricing for output produced by general government. It assumes that, for a given type of employee, output per hour worked does not change over time and that productivity changes occur for the workforce only because of changes in the mix of employees with respect to their level of experience, their education, and the functions in which they are employed. The mix is defined, by function, by level of experience, and by education. For each type of employee for which BEA has data, real compensation in a given year is the product of average base-year (2000) compensation and an index of employee hours that is the product of employment measured in full-time equivalent units and the average weekly hours worked. Quarterly and annual measures of full- and part-time employment and hours worked are derived for education and for noneducation employees based on BLS tabulations of employment and wages reported by employers covered by state unemployment insurance programs [86,87]. Data from the annual Census Bureau report, Public Employment [44], are used to convert full- and part-time measures of employment to full-time equivalents. Before 1979, the unemployment insurance data did not cover state and local government employment. Estimates for the pre-1979 period are based on the annual Public Employment [44] report and on monthly data from BLS establishment surveys. For estimates of real education compensation, eight employee types are identified, six from Public Employment and two from a 1973 study from the Office of Education, Department of Health, Education, and Welfare [62]. For primary-secondary teachers, the largest category, independent data are available to adjust for changes in the composition of employment. Demographic and salary data collected in surveys of teachers [21,63] are distributed into groups defined by teacher characteristics—years of teaching experience and level of educational attainment.27 For each group, reported average base-year salary is multiplied by employment. The results are summed and a measure of average salary (valued in base-year prices) for primary-secondary teachers in the current period is derived. This index is the index of teaching staff composition. It is used to adjust wage changes for changes in the composition of the teaching staff. The difference between this measure and base-year average salary represents the shift in the composition of employment with respect to experience and educational attainment. Average base-year compensation is then multiplied by the product of this composition shift and the index of employee hours. 27 For 1959-86, the survey is conducted by the National Education Association (NEA). Since 1987, the survey is conducted by the National Center for Education Statistics (NCES).
III– 43
For the remaining seven categories of education employment, average base-year compensation for each category is multiplied by the index of employee hours. The results are summed over all eight categories to produce estimates of constant-dollar education compensation. For 1982 forward, noneducation real compensation is estimated as the product of average base-year compensation and the index of employee hours. Between 1972 and 1981, BLS noneducation data are disaggregated into two categories: Federally-funded public service employment and other. Measures of public service employment and an estimate of average compensation for these employees are derived from internal documents of the Employment and Training Administration [91]. The remaining segment of noneducation real compensation for this period is estimated as the product of average base-year compensation and the index of employee hours. The results are summed over both categories to produce estimates of real noneducation compensation. For the years 1950-70, a factor designed to reflect rising educational and technical attainments in the Federal workforce was applied to state and local noneducation employment. Consumption of general government fixed capital Estimates of real general government CFC are derived by deflating current-dollar investment flows using BEA’s perpetual inventory method. Price indexes for corresponding categories of structures and equipment and software are used to deflate investment flows.28 Also, see the explanation for current-dollar consumption of general government fixed capital. INTERMEDIATE GOODS AND SERVICES PURCHASED Annual estimates of real intermediate purchases of durable goods; nondurable goods; and services, excluding imputed bank services and services furnished without payment by domestic security brokers, are derived by deflation. Deflation is accomplished through a three-step process. First, consumption expenditures and gross investment is allocated to deflation level commodity detail. Most details are derived based on data from I-O tables as discussed above in “Intermediate goods and services purchased.” Second, commodities are matched with relevant price indexes and deflated to produce values in base-year terms. Third, real values for higher level aggregates are prepared using Fisher chain-type measures [50,51,58]. Current quarterly estimates are prepared using current and constant dollars estimates, which are prepared using the methodology for current dollars described in “Intermediate goods and services purchased” and for constant dollars described above, and price indexes to calculate Fisher-chain type measures. 28 For further information, see U.S. Department of Commerce, Bureau of Economic Analysis, Fixed Assets and Consumer Durable Goods in the United States, 1925-97, September 2003. Current CFC data are online at BEA National Economic Accounts under “Fixed Assets” (www.bea.gov).

III– 44
Services
SERVICES FURNISHED WITHOUT PAYMENT BY FINANCIAL INTERMEDIARIES Estimates of real services furnished without payment are calculated for commercial banks and for regulated investment companies. For commercial banks, real measures are derived as the remainder of quantity extrapolation using the BLS banking output index, which is then reduced by real estimates of explicitly charged services. The remainder is allocated to state and local governments in proportion to total bank deposits held by those governments, based on Flow of Funds data [9]. For regulated investment companies, real measures are prepared by taking the gross output other than charges by security brokers and deflating with a composite index prepared from several related PPIs. For charges by security brokers, real measures are prepared by extrapolating base-year estimates by the number of orders placed by regulated investment companies [15].
SERVICES FURNISHED WITHOUT PAYMENT BY DOMESTIC SECURITY BROKERS Beginning with 2001, annual estimates are deflated with PPIs. Historically, estimates of the real services rendered without payment to state and local governments by domestic security brokers are obtained by extrapolating the base-year value by the number of orders derived from volume data from the New York Stock Exchange, the SEC, and the National Association of Securities Dealers. OWN-ACCOUNT INVESTMENT Annual estimates of real own-account investment are derived using the following steps. First, deflation level detail for own-account investment is determined. For a discussion of how current-dollar deflator-level detail for own-account investment is prepared, refer to “Own-account investment.” Second, estimates are deflated using appropriate price indexes. Estimates of real own-account overhead for structures are prepared by deflation using the same price indexes for each commodity as are used to deflate the intermediate goods and services purchased. Estimates of real own-account overhead for software are prepared by deflation using a price index based primarily on weighted average of various PPIs. Estimates of real own-account compensation for structures and for software are prepared by deflation using the BEA implicit price deflators for state and local compensation. Third, real values for higher level aggregates are prepared using Fisher chain-type measures [50,51,58]. Current quarterly estimates are prepared using the same process described above. SALES TO OTHER SECTORS State and local government sales to other sectors include tuition and related educational charges, health and hospital charges, and other sales of goods and services. Annual and quarterly estimates of real sales are prepared by deflation using detailed price indexes.

III– 45
GROSS INVESTMENT STRUCTURES Estimates of real investment in structures are derived by deflating 16 types of new construction and 3 types of existing structures. NEW CONSTRUCTION The 16 types of new construction put in place are prepared by deflation using price indexes developed by BEA for office buildings, factories, and education buildings; FHWA Composite index; the Census Bureau price index for single-family houses under construction; the Turner Construction Company index; the Bureau of Reclamation Composite index; and the Handy-Whitman Electric Building index. These indexes are smoothed by a three-quarter moving average or are seasonally adjusted. The FHWA highway composite price index is smoothed by a 12-quarter moving average and then seasonally adjusted. NET PURCHASES OF EXISTING STRUCTURES Estimates of real net purchases of residential, nonresidential, and farm structures are prepared by deflating current-dollar estimates using BEA’s price index for new private nonfarm residential structures, BEA’s implicit price deflator for new private nonresidential structures, and BEA’s price index for new private farm residential structures. EQUIPMENT AND SOFTWARE Estimates of real investment in equipment and software are prepared by deflating separately estimates of equipment excluding computers, computers, and computer software. EQUIPMENT EXCLUDING COMPUTERS Annual estimates of real investment in equipment excluding computers are prepared by deflation. Price indexes, primarily PPIs, are used to deflate the current-dollar commodity estimates for equipment excluding computers. Current quarterly estimates are prepared by judgmental extrapolation. COMPUTER HARDWARE Estimates of real investment in computers are prepared by deflating current-dollar estimates using a BEA price index for computer and peripheral equipment.

III– 46
COMPUTER SOFTWARE Estimates of real investment in software are prepared by deflating the three types of software separately. Prepackaged software is deflated by the PPI for prepackaged software with a downward bias adjustment to account for the likely understatement of quality-adjusted price declines. For 1994 through 1997, prepackaged software is deflated using BEA’s matched-model index with the bias adjustment. Prior to 1994, an unweighted average of BEA’s hedonic index for spreadsheets and word processors and a matched-model index is used. Custom software is deflated by the weighted index of the PPI for non-suite applications. Prior to 1998, the weighted index of prepackaged software price changes (25 percent) and own-account software price changes (75 percent) are used to deflate custom software.

III– 47
SOURCES
This is a list of information sources used in preparing current-dollar and real estimates of state and local government transactions in the national income and product accounts. When possible, a specific portion of a larger publication is cited—a chapter, a series, or table number/title. In some cases, the information used is more detailed than that available in the listed source, which is the publication most accessible to the public. 1. AM Best Company. Best Aggregates and Averages: Health and Life Insurance. Oldwick, NJ:
AM Best, annually. 2. AM Best Company. Best Aggregates and Averages: Property-Casualty Insurance. Oldwick,
NJ: AM Best, annually. 3. American Council of Life Insurance. “Annual Statement of the Condition and Affairs of the
U.S. Legal Reserve Life Insurance Companies.” Washington, DC: ACLI, annually. 4. American Public Welfare Association. A Statistical Summary of the VCIS Social Services
Block Grant (SSBG) Data for FY 83. Washington, DC: APWA, October 1985. 5. Association of American Publishers. Annual Report. New York, NY: Association of
American Publishers, annually. 6. Association of American Railroads. Economics and Finance Department. Analysis of Class I
Railroads. Washington, DC: AAR, annually. (Data on railroad subsidies no longer identifiable after 1982.)
7. Blue Cross and Blue Shield Associations. The Blue Cross and Blue Shield Plan Fact Book.
Chicago, IL: Blue Cross and Blue Shield Associations, annually. 8. Board of Governors of the Federal Reserve System. Annual Report. Washington, DC: Board
of Governors, annually. 9. Board of Governors of the Federal Reserve System. Sector Tables. Flow of Funds Accounts.
(Statistical Release Z.1.) Washington, DC: Board of Governors, quarterly. 10. Bowker, R. R. The Bowker Annual of Library and Book Trade Information. New York, NY:
Bowker, annually. 11. BMT Publications, Inc. Gaming and Wagering Business. New York, NY: BMT Publications,
Inc., monthly. 12. The City of New York. Comprehensive Annual Financial Report of the Comptroller. New
York, NY: City of New York, annually.

III– 48
13. Commerce Clearing House, Inc. State Tax Guide. Chicago, IL: Commerce Clearing House, biweekly.
14. Desonia, Randolph, and King, Kathleen M. State Programs of Assistance for the Medically
Indigent. Washington, DC: Intergovernmental Health Policy Project, The George Washington University, November 1985.
15. Federal Financial Institutions Examination Council. Call Reports. Washington, DC: FFIEC,
quarterly. 16. Federal Prison Industries, Inc. Annual Report. Marion, IL: Federal Penitentiary, annually. 17. Health Insurance Association of America. Group Health Insurance Coverages in the United
States. New York, NY: HIAA, annually. 18. National Academy of Social Insurance. “Workers’ Compensation.” Washington, DC:
periodically, unpublished. 19. National Association of Attorneys General. “Payments to States.” Washington, DC: annually,
unpublished. 20. National Conference of State Legislatures. “State Foster Care Payments to Individuals,
1984.” Denver, CO, 1986, unpublished. 21. National Education Association. Survey of NEA K-12 Teacher Members. Appendix B.
Washington, DC: National Education Association, annually. 22. National Indian Gaming Commission. “Annual Report.” Washington, DC: annually. 23. National Industrial Conference Board. “Estimates of Local Revenues Before 1942.” New
York, NY: c. 1945, unpublished. 24. New York Crime Victims Board. “State Benefits for Compensation for Victims of Crime,
1979–84.” Albany, NY: 1985, unpublished. 25. The Nelson A. Rockefeller Institute of Government. State Revenue Report. Albany, NY:
Fiscal Studies Program, State University of New York, quarterly. 26. Standard & Poor’s Corporation. “Yield on the Composite 500 Stock Index.” Statistical
Service: Current Statistics. New York, NY: Standard & Poor’s Corporation, monthly. 27. The State of Alaska. “Annual Report.” Juneau, AK: Permanent Fund Dividend Division,
annually. 28. The State of Alaska. “Comprehensive Annual Financial Report.” Juneau, AK: Division of
Finance, annually.
III– 49
29. The State of Alaska. “Financial Projections.” Juneau, AK: Permanent Fund Corporation,
monthly. 30. The State of Alaska. “Five Year Oil and Gas Leasing Program.” Anchorage, AK: Division of
Oil and Gas, quinquenially. 31. The State of California. “Disability Insurance Fund Forecast.” Sacramento, CA: Employment
and Development Department, semi-annually. 32. The State of New York. “Annual Report.” Albany, NY: New York State Racing and
Wagering Board, annually. 33. Tax Foundation, Inc. “Local Corporate Profits Tax Revenues.” Washington, DC: c. 1965,
unpublished. 34. Tax Policy League. Tax Yields. New York, NY: Tax Policy League, various years before
1942. 35. Teachers Insurance and Annuity Association of America/College Retirement Equities Fund.
“Employer Contributions to TIAA/CREF.” New York, NY: annually, unpublished. 36. U.S. Department of Agriculture. Food and Nutrition Services. “WIC Program State
Participation and Expenditure Report.” Washington, DC: monthly. 37. U.S. Department of Commerce. Bureau of the Census. 2002 Census of Governments.
Washington, DC: U.S. Government Printing Office, May 2004. 38. U.S. Department of Commerce. Bureau of the Census. Census of Governments. Washington,
DC: U.S. Government Printing Office, quinquennially. 39. U.S. Department of Commerce. Bureau of the Census. Current Business Reports, Monthly
Retail Trade. (Series BR). Washington, DC: U.S. Government Printing Office, monthly. 40. U.S. Department of Commerce. Bureau of the Census. Current Construction Reports: Value
of New Construction Put in Place (C-30). Washington, DC: U.S. Government Printing Office, monthly.
41. U.S. Department of Commerce. Bureau of the Census. Finances of Employee-Retirement
Systems of State and Local Governments. (GF No. 2). Washington, DC: U.S. Government Printing Office, annually.
42. U.S. Department of Commerce. Bureau of the Census. Finances of Selected Public
Employee-Retirement Systems. (GR Nos. 1–4). Washington, DC: U.S. Government Printing Office, quarterly.

III– 50
43. U.S. Department of Commerce. Bureau of the Census. Government Finances. (GF No. 5). Washington, DC: U.S. Government Printing Office, annually.
44. U.S. Department of Commerce. Bureau of the Census. Public Employment. (GE No. 1).
Washington, DC: U.S. Government Printing Office, annually. 45. U.S. Department of Commerce. Bureau of the Census. Quarterly Summary of State and
Local Tax Revenue. (GT Nos. 1–4). Washington, DC: U.S. Government Printing Office, quarterly.
46. U.S. Department of Commerce. Bureau of the Census. State Government Finances. (GF No.
3). Washington, DC: U.S. Government Printing Office, annually. 47. U.S. Department of Commerce. Bureau of the Census. “State and Local Government Finance
Data.” <www.census.gov/govs/www/financegen.html>. 48. U.S. Department of Commerce. Bureau of the Census. State Government Tax Collections.
Washington, DC: U.S. Government Printing Office, annually. 49. U.S. Department of Commerce. Bureau of Economic Analysis. “Benchmark Input-Output
Accounts of the United States, 1997.” Survey of Current Business 82 (December 2002): 19-109.
50. U.S. Department of Commerce. Bureau of Economic Analysis. “BEA’s Chain Indexes, Time
Series, and Measures of Long Term Economic Growth.” Survey of Current Business 77 (May 1997): 58-68.
51. U.S. Department of Commerce. Bureau of Economic Analysis. “Chained-Dollar Indexes:
Issues, Tips on Their Use, and Upcoming Changes.” Survey of Current Business 83 (November 2003): 8-16.
52. U.S. Department of Commerce. Bureau of Economic Analysis. Corporate Profits: Profits
Before Tax, Profits Tax Liability, and Dividends. (BEA Methodology Paper Series MP-2.) Washington, DC: U.S. Government Printing Office, September 2002.
53. U.S. Department of Commerce. Bureau of Economic Analysis. Fixed Assets and Consumer
Durable Goods in the United States, 1925-97. Washington, DC: U.S. Government Printing Office, September 2003.
54. U.S. Department of Commerce. Bureau of Economic Analysis. "Measuring the Services of
Commercial Banks in the NIPAs: Changes in Concepts and Methods.” Survey of Current Business 83 (September 2003): 33-44.
55. U.S. Department of Commerce. Bureau of Economic Analysis. "Measuring the Services of
Property-Casualty Insurance in the NIPAs.” Survey of Current Business 83 (October 2003): 10-26.
III– 51
56. U.S. Department of Commerce. Bureau of Economic Analysis. “Preview of the 2003
Comprehensive Annual Revision of the National Income and Product Accounts: Changes in Definitions and Classifications.” Survey of Current Business 83 (June 2003): 17-34.
57. U.S. Department of Commerce. Bureau of Economic Analysis. “Preview of the 1999
Comprehensive Revision of the National Income and Product Accounts: New and Redesigned Tables.” Survey of Current Business 79 (September 1999): 15-28.
58. U.S. Department of Commerce. Bureau of Economic Analysis. “Preview of the
Comprehensive Annual Revision of the National Income and Product Accounts: BEA’s New Featured Measures of Output and Prices.” Survey of Current Business 75 (July 1995): 31-38.
59. U.S. Department of Commerce. Bureau of Economic Analysis. “Receipts and Expenditures
of State Governments and of Local Governments, 1959-2001.” Survey of Current Business 83 (June 2003): 36-53.
60. U.S. Department of Commerce. Bureau of Economic Analysis. “Recognition of Business and
Government Expenditures for Software Investment: Methodology and Quantitative Impacts, 1959-1998,” May 2000, <www.bea.gov/bea/mp.htm>.
61. U.S. Department of Commerce. Bureau of Economic Analysis. “State and Local Government
Fiscal Position in 1998.” Survey of Current Business 79 (April 1999): 11-17. 62. U.S. Department of Education. “Education Employment and Hours.” Washington, DC: 1973,
unpublished. 63. U.S. Department of Education. National Center for Education Statistics. “Schools and
Staffing in the United States: A Statistical Profile” Washington, DC, unpublished, periodically.
64. U.S. Department of Energy. Energy Information Administration. Financial Statistics of
Selected Electric Utilities. Washington, DC: U.S. Government Printing Office, annually. 65. U.S. Department of Health and Human Services. Administration for Children, Youth, and
Families. “Aid to Families with Dependent Children (AFDC) Payments.” Washington, DC: annually, unpublished.
66. U.S. Department of Health and Human Services. Administration for Children and Families.
“TANF Financial Data.” Washington, DC: annually. 67. U.S. Department of Health and Human Services. Administration for Children and Families.
“Title IV-E Foster Care: Expenditures as Reported by States.” Washington, DC, annually, unpublished.

III– 52
68. U.S. Department of Health and Human Services. Administration for Children and Families. “Title IV-E State Claims for Expenditure: Adoptive Assistance.” Washington, DC, annually, unpublished.
69. U.S. Department of Health and Human Services. Agency for Healthcare Research and
Quality. Medical Expenditures Panel Survey. Washington, DC: annually. 70. U.S. Department of Health and Human Services. Office of Energy Assistance. Low Income
Home Energy Assistance: Report to Congress for Fiscal Year 1986. Washington, DC: U.S. Government Printing Office, 1986.
71. U.S. Department of Health and Human Services. Office of Family Assistance. AFDC Flash
Report. Washington, DC: Office of Family Assistance, monthly. 72. U.S. Department of Health and Human Services. Health Care Financing Administration.
“Medical Vendor Payments.” Baltimore, MD: quarterly (monthly before 1983), unpublished. 73. U.S. Department of Health and Human Services. Centers for Medicare and Medicaid
Services. “Medicaid Financial Management Report.” Baltimore, MD: quarterly. 74. U.S. Department of Health and Human Services. Centers for Medicare and Medicaid
Services. “National Health Accounts.” Baltimore, MD: annually. 75. U.S. Department of Health and Human Services. Centers for Medicare and Medicaid
Services. “Medicaid buy-ins to Medicare Parts A and B.” Baltimore, MD: monthly, unpublished.
76. U.S. Department of Health and Human Services. Health Care Financing Administration.
“Private Health Insurance Plans: Coverage, Enrollment, and Financial Experience.” Health Care Financing Review. Washington, DC: U.S. Government Printing Office, annually.
77. U.S. Department of Health and Human Services. Social Security Administration. “Federally
Funded Foster Care Payments to Individuals.” Washington, DC: annually, unpublished. 78. U.S. Department of Health and Human Services. Social Security Administration. Social
Security Bulletin. Washington, DC: U.S. Government Printing Office, monthly with annual statistical supplement.
79. U.S. Department of Health and Human Services. Social Security Administration.
“Supplemental Security Income Payments.” Washington, DC: monthly, unpublished. 80. U.S Department of Homeland Security. Federal Emergency Management Agency.
“Individual and Family Grant Program: FEMA Obligations.” Washington, DC: monthly, unpublished.

III– 53
81. U.S. Department of Justice. Bureau of Justice Statistics. Prisoners in State and Federal Institutions on December 31. Washington, DC: Bureau of Justice Statistics, annually.
82. U.S. Department of Justice. Office for Victims of Crime. “Total Victim Assistance
Allocations.” Washington, DC: annually, unpublished. 83. U.S. Department of Justice. Office for Victims of Crime. Victims of Crime Act of 1984:
Report to Congress by the Attorney General, December 31, 1987. Washington, DC: U.S. Government Printing Office, 1988.
84. U.S. Department of Labor. Bureau of Labor Statistics. CPI Detailed Report. Washington,
DC: U.S. Government Printing Office, monthly. 85. U.S. Department of Labor. Bureau of Labor Statistics. Employer Costs for Employee
Compensation. Washington, DC: U.S. Government Printing Office, monthly. 86. U.S. Department of Labor. Bureau of Labor Statistics. Employment and Earnings.
Washington, DC: U.S. Government Printing Office, monthly. 87. U.S. Department of Labor. Bureau of Labor Statistics. Employment and Wages: Annual
Averages. Washington, DC: U.S. Government Printing Office, annually. 88. U.S. Department of Labor. Bureau of Labor Statistics. Employment Cost Index. Washington,
DC: U.S. Government Printing Office, annually. 89. U.S. Department of Labor. Bureau of Labor Statistics. Employment Situation. Washington,
DC: U.S. Government Printing Office, monthly. 90. U.S. Department of Labor. Bureau of Labor Statistics. Producer Prices and Price Indexes.
Washington, DC: U.S. Government Printing Office, monthly. 91. U.S. Department of Labor. Employment and Training Administration. “Comprehensive
Employment and Training Act (CETA) Payments.” Washington, DC: quarterly until 1982, unpublished.
92. U.S. Department of Transportation. Federal Highway Administration. Highway Statistics.
Washington, DC: U.S. Government Printing Office, annually. 93. U.S. Department of Transportation. Federal Highway Administration. Price Trends for
Federal-Aid Highway Construction. Washington, DC: FHWA, quarterly. 94. U.S. Department of Treasury. Financial Management Service. Monthly Treasury Statement of
Receipts and Outlays of the United States Government. Washington, DC: U.S. Government Printing Office, monthly.
III– 54
95. U.S. Executive Office of the President. Office of Management and Budget. The Budget of the United States Government. Washington, DC: U.S. Government Printing Office, annually.
96. U.S. Executive Office of the President. Office of Management and Budget. Employment and
Training Administration. “Training and Employment Services.” Washington, DC: annually, unpublished.
97. Urban Institute. “Staff Studies on Comprehensive Employment and Training Act (CETA).”
Washington, DC: c. 1976–78, unpublished.

III– 55
TABLES TABLE III-1. STATE AND LOCAL GOVERNMENT RECEIPTS: SOURCES OF ESTIMATES
Line Category Calendar Year
2000 Estimates (billions of
dollars)
Annual1 and quarterly unadjusted2
Quarterly seasonally adjusted
1 Current Receipts 1319.5
2 Current tax receipts 893.2 3 Personal current taxes 236.6 4 Income taxes 217.3 5 State COG/GF.3 Interpolated and extrapolated using SRR
data, seasonally adjusted, as indicator.
6 Local COG/GF.3 Interpolated and extrapolated using QS data, seasonally adjusted, as indicator.
7 Other taxes 8 Motor vehicle licenses 11.4 9 State COG/GF.3 Allocation between
personal and business based on registration data from FHA.
Interpolated and extrapolated using QS data, seasonally adjusted, as indicator.
10 Local COG/GF.4 Allocation between personal and business based on registration data from FHA.
Historical: Interpolated without indicator.
Current: Extrapolated judgmentally and interpolated without indicator.
11 Property taxes 4.8 12 State COG/GF.3 Historical: Interpolated without
indicator. Current: Extrapolated judgmentally and
interpolated without indicator. 13 Local COG/GF.3 Historical: Interpolated without
indicator. Current: Extrapolated judgmentally and
interpolated without indicator. 14 Other taxes 3.1 15 State COG/GF.3 90 percent of hunting and
fishing licenses allocated to personal, 10 percent allocated to business.
Interpolated and extrapolated using QS data, seasonally adjusted, as indicator.
16 Local COG/GF.4 Historical: Interpolated without indicator
Current: Extrapolated judgmentally and interpolated without indicator.
17 Taxes on production and imports 621.1 18 Sales taxes 316.6 19 State 255.5 20 General 177.8 COG/GF.3 Interpolated and extrapolated using SRR
data, seasonally adjusted, as indicator.
21 Gasoline
30.4 COG/GF.3 Interpolated and extrapolated using QS data, seasonally adjusted, as indicator.
22 Alcoholic beverages
4.1 COG/GF.3 Interpolated and extrapolated using QS data, seasonally adjusted, as indicator.
23 Tobacco 8.5 COG/GF.4 Historical: Interpolated without indicator.
Current: Extrapolated judgmentally and interpolated without indicator.
24 Public utilities
8.8 COG/GF.3 Interpolated and extrapolated using QS data, seasonally adjusted, as indicator.
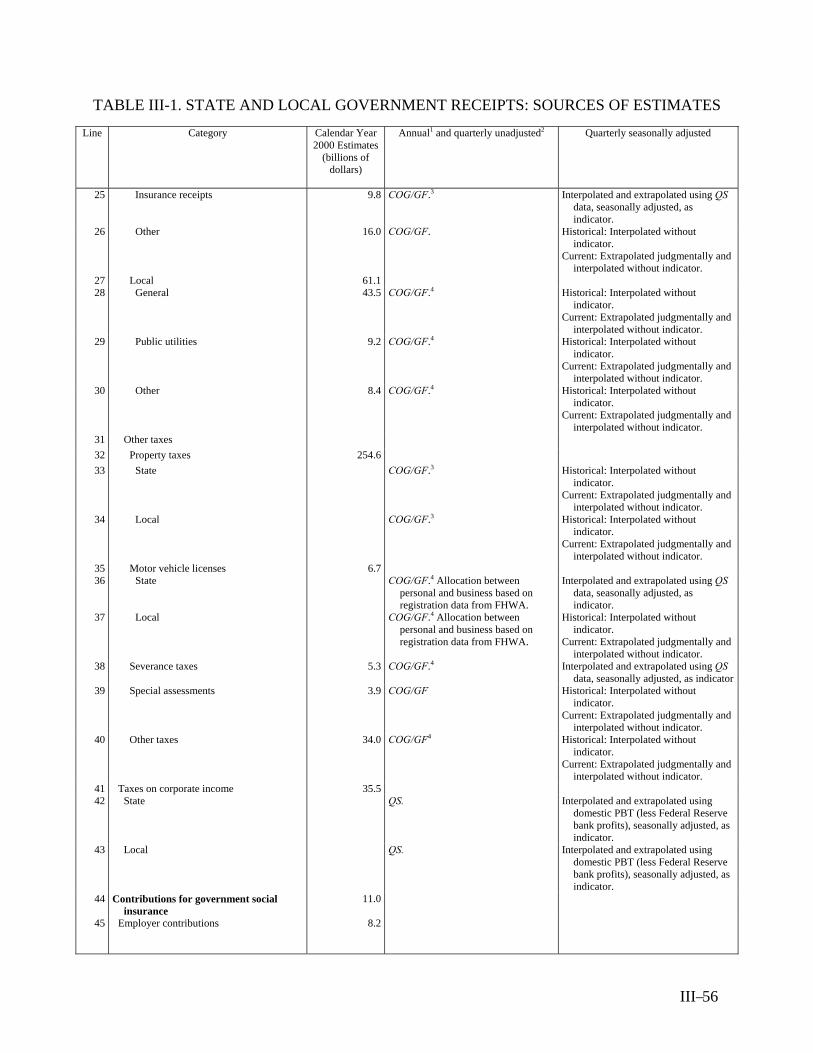
III– 56
TABLE III-1. STATE AND LOCAL GOVERNMENT RECEIPTS: SOURCES OF ESTIMATES Line Category Calendar Year
2000 Estimates (billions of
dollars)
Annual1 and quarterly unadjusted2
Quarterly seasonally adjusted
25 Insurance receipts 9.8 COG/GF.3 Interpolated and extrapolated using QS data, seasonally adjusted, as indicator.
26 Other 16.0 COG/GF. Historical: Interpolated without indicator.
Current: Extrapolated judgmentally and interpolated without indicator.
27 Local 61.1 28 General 43.5 COG/GF.4 Historical: Interpolated without
indicator. Current: Extrapolated judgmentally and
interpolated without indicator. 29 Public utilities 9.2 COG/GF.4 Historical: Interpolated without
indicator. Current: Extrapolated judgmentally and
interpolated without indicator. 30 Other 8.4 COG/GF.4 Historical: Interpolated without
indicator. Current: Extrapolated judgmentally and
interpolated without indicator. 31 Other taxes 32 Property taxes 254.6 33 State
COG/GF.3 Historical: Interpolated without indicator.
Current: Extrapolated judgmentally and interpolated without indicator.
34 Local COG/GF.3 Historical: Interpolated without indicator.
Current: Extrapolated judgmentally and interpolated without indicator.
35 Motor vehicle licenses 6.7 36 State COG/GF.4 Allocation between
personal and business based on registration data from FHWA.
Interpolated and extrapolated using QS data, seasonally adjusted, as indicator.
37 Local COG/GF.4 Allocation between personal and business based on registration data from FHWA.
Historical: Interpolated without indicator.
Current: Extrapolated judgmentally and interpolated without indicator.
38 Severance taxes 5.3 COG/GF.4 Interpolated and extrapolated using QS data, seasonally adjusted, as indicator
39 Special assessments 3.9 COG/GF Historical: Interpolated without indicator.
Current: Extrapolated judgmentally and interpolated without indicator.
40 Other taxes
34.0 COG/GF4 Historical: Interpolated without indicator.
Current: Extrapolated judgmentally and interpolated without indicator.
41 Taxes on corporate income 35.5 42 State QS. Interpolated and extrapolated using
domestic PBT (less Federal Reserve bank profits), seasonally adjusted, as indicator.
43 Local QS. Interpolated and extrapolated using domestic PBT (less Federal Reserve bank profits), seasonally adjusted, as indicator.
44 Contributions for government social insurance
11.0
45 Employer contributions
8.2

III– 57
TABLE III-1. STATE AND LOCAL GOVERNMENT RECEIPTS: SOURCES OF ESTIMATES Line Category Calendar Year
2000 Estimates (billions of
dollars)
Annual1 and quarterly unadjusted2
Quarterly seasonally adjusted
46 Temporary disability insurance 0.0 California EDD, COG/GF: percent of employee contributions for CA and NJ.5
Historical: Interpolated without indicator.
Current: Extrapolated judgmentally and interpolated without indicator.
47 Workers’ compensation
8.1 COG/GF.5 6 Historical: Interpolated without indicator.
Current: Premium per employee ratio multiplied by current BLS employment data.
48 Employee and self-employed contributions 2.8 California EDD, COG/GF. 5 Historical: Interpolated without indicator.
Current: Extrapolated judgmentally and interpolated without indicator.
49 Income receipts on assets 92.2 50 Interest receipts 84.0 51 Imputed interest received See article in September 2003 SCB. 7 See article in September 2003 SCB. 52 Monetary interest received COG/GF. 5 Historical: Interpolated without
indicator. Current: Extrapolated judgmentally and
interpolated without indicator. 53 Dividends 1.9 S&P 500 dividend yield, Flow of
Funds Table L.105. 5 S&P 500 dividend yield, Flow of Funds
Table L.105. 54 Rents and royalties 6.3 COG/GF─ CCMGR. Historical: Interpolated without
indicator. Current: Extrapolated judgmentally and
interpolated without indicator. 55 Current transfer receipts 315.4 56 Federal grants-in-aid 247.3 Budget of the U.S. Government. MTS. 57 From business 28.8 58 Fines
7.9 COG/GF─CCMGR. 40 percent of fines.
Historical: Interpolated without indicator.
Current: Extrapolated judgmentally and interpolated without indicator.
59 Net insurance settlements
0.0 A.M. Best insurance data prepared by NIWD.
Historical: Interpolated without indicator.
Current: Extrapolated judgmentally and interpolated without indicator.
60 Other 20.9 COG/GF─CCMGR. Historical: Interpolated without indicator.
Current: Extrapolated judgmentally and interpolated without indicator.
61 From persons 39.2 62 Fines
11.9 COG/GF─CCMGR. 60 percent of fines.
Historical: Interpolated without indicator.
Current: Extrapolated judgmentally and interpolated without indicator.
63 Other 27.4 COG/GF─CCMGR. Historical: Interpolated without indicator.
Current: Extrapolated judgmentally and interpolated without indicator.
64 Current surplus of government enterprises
7.7
65 Water and sewerage
6.1 COG/GF. Historical: Interpolated without indicator.
Current: Extrapolated judgmentally and interpolated without indicator.
66 Gas and electricity
8.5 COG/GF. Historical: Interpolated without indicator.
Current: Extrapolated judgmentally and interpolated without indicator.
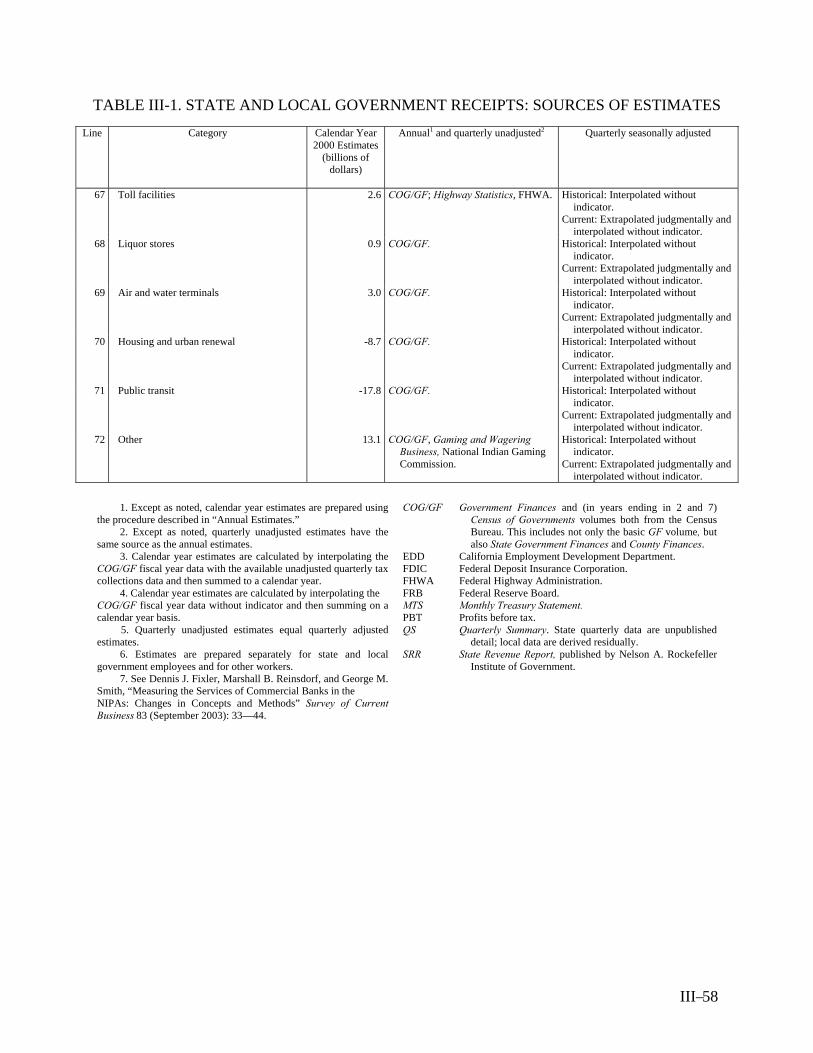
III– 58
TABLE III-1. STATE AND LOCAL GOVERNMENT RECEIPTS: SOURCES OF ESTIMATES Line Category Calendar Year
2000 Estimates (billions of
dollars)
Annual1 and quarterly unadjusted2
Quarterly seasonally adjusted
67 Toll facilities 2.6 COG/GF; Highway Statistics, FHWA. Historical: Interpolated without indicator.
Current: Extrapolated judgmentally and interpolated without indicator.
68 Liquor stores 0.9 COG/GF. Historical: Interpolated without indicator.
Current: Extrapolated judgmentally and interpolated without indicator.
69 Air and water terminals 3.0 COG/GF. Historical: Interpolated without indicator.
Current: Extrapolated judgmentally and interpolated without indicator.
70 Housing and urban renewal -8.7 COG/GF. Historical: Interpolated without indicator.
Current: Extrapolated judgmentally and interpolated without indicator.
71 Public transit -17.8 COG/GF. Historical: Interpolated without indicator.
Current: Extrapolated judgmentally and interpolated without indicator.
72 Other 13.1 COG/GF, Gaming and Wagering Business, National Indian Gaming Commission.
Historical: Interpolated without indicator.
Current: Extrapolated judgmentally and interpolated without indicator.
1. Except as noted, calendar year estimates are prepared using
the procedure described in “Annual Estimates.” 2. Except as noted, quarterly unadjusted estimates have the
same source as the annual estimates. 3. Calendar year estimates are calculated by interpolating the
COG/GF fiscal year data with the available unadjusted quarterly tax collections data and then summed to a calendar year.
4. Calendar year estimates are calculated by interpolating the COG/GF fiscal year data without indicator and then summing on a calendar year basis.
5. Quarterly unadjusted estimates equal quarterly adjusted estimates.
6. Estimates are prepared separately for state and local government employees and for other workers.
7. See Dennis J. Fixler, Marshall B. Reinsdorf, and George M. Smith, “Measuring the Services of Commercial Banks in the NIPAs: Changes in Concepts and Methods” Survey of Current Business 83 (September 2003): 33—44.
COG/GF EDD FDIC FHWA FRB MTS PBT QS SRR
Government Finances and (in years ending in 2 and 7) Census of Governments volumes both from the Census Bureau. This includes not only the basic GF volume, but also State Government Finances and County Finances.
California Employment Development Department. Federal Deposit Insurance Corporation. Federal Highway Administration. Federal Reserve Board. Monthly Treasury Statement. Profits before tax. Quarterly Summary. State quarterly data are unpublished
detail; local data are derived residually. State Revenue Report, published by Nelson A. Rockefeller
Institute of Government.
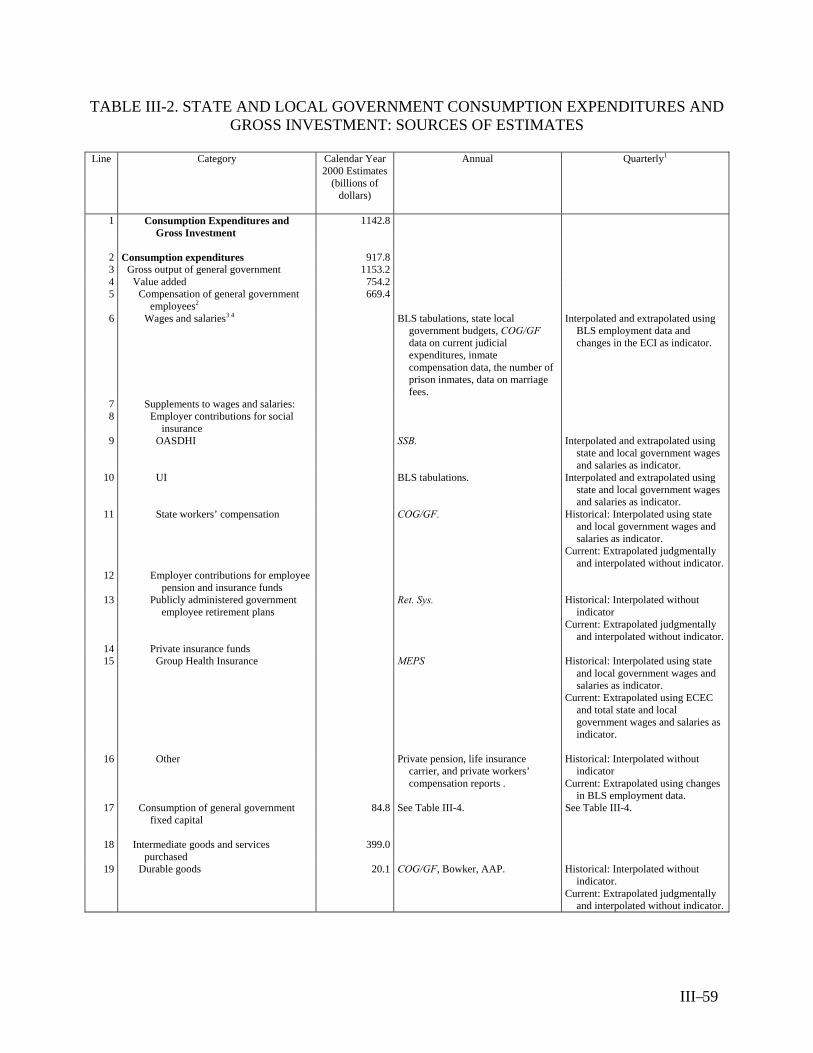
III– 59
TABLE III-2. STATE AND LOCAL GOVERNMENT CONSUMPTION EXPENDITURES AND GROSS INVESTMENT: SOURCES OF ESTIMATES
Line Category Calendar Year
2000 Estimates (billions of
dollars)
Annual
Quarterly1
1 Consumption Expenditures and Gross Investment
1142.8
2 Consumption expenditures 917.8 3 Gross output of general government 1153.2 4 Value added 754.2 5 Compensation of general government
employees2 669.4
6 Wages and salaries3 4 BLS tabulations, state local government budgets, COG/GF data on current judicial expenditures, inmate compensation data, the number of prison inmates, data on marriage fees.
Interpolated and extrapolated using BLS employment data and changes in the ECI as indicator.
7 Supplements to wages and salaries: 8 Employer contributions for social
insurance
9 OASDHI SSB. Interpolated and extrapolated using state and local government wages and salaries as indicator.
10 UI BLS tabulations. Interpolated and extrapolated using state and local government wages and salaries as indicator.
11 State workers’ compensation COG/GF. Historical: Interpolated using state and local government wages and salaries as indicator.
Current: Extrapolated judgmentally and interpolated without indicator.
12 Employer contributions for employee pension and insurance funds
13 Publicly administered government employee retirement plans
Ret. Sys. Historical: Interpolated without indicator
Current: Extrapolated judgmentally and interpolated without indicator.
14 Private insurance funds 15 Group Health Insurance MEPS Historical: Interpolated using state
and local government wages and salaries as indicator.
Current: Extrapolated using ECEC and total state and local government wages and salaries as indicator.
16 Other Private pension, life insurance
carrier, and private workers’ compensation reports .
Historical: Interpolated without indicator
Current: Extrapolated using changes in BLS employment data.
17 Consumption of general government fixed capital
84.8 See Table III-4. See Table III-4.
18 Intermediate goods and services purchased
399.0
19 Durable goods 20.1 COG/GF, Bowker, AAP. Historical: Interpolated without indicator.
Current: Extrapolated judgmentally and interpolated without indicator.

III– 60
TABLE III-2. STATE AND LOCAL GOVERNMENT CONSUMPTION EXPENDITURES AND GROSS INVESTMENT: SOURCES OF ESTIMATES
Line Category Calendar Year
2000 Estimates (billions of
dollars)
Annual
Quarterly1
20 Nondurable goods 126.4 COG/GF. Historical: Interpolated without indicator.
Current: Extrapolated judgmentally and interpolated without indicator.
21 Services 252.5
22 Imputed bank services See article in September 2003 SCB.5 See article in September 2003 SCB. 5 23 Services furnished without payment by
domestic security brokers Federal Reserve Bank of New York
volume of trading data, Wall Street Journal bid and ask prices, NASD stock volume data, transactions data and bid and ask prices from various stock exchanges, Flow of Funds data.
Federal Reserve Bank of New York volume of trading data, Wall Street Journal bid and ask prices, NASD stock volume data, transactions data and bid and ask prices from various stock exchanges, Flow of Funds data.
24 Other COG/GF. Historical: Interpolated without indicator.
Current: Extrapolated judgmentally and interpolated without indicator.
25 Less: Own-account investment 14.9 I-O benchmarks interpolated and extrapolated using education and all other new construction, private own-account software investment as indicators.
Interpolated and extrapolated using education and all other new construction, own-account software investment as indicators.
26 Less: Sales to other sectors 220.6 27 Tuition and related educational charges 44.3 COG/GF─CCMGR. Historical: Interpolated without
indicator. Current: Extrapolated judgmentally
and interpolated without indicator.28 Health and hospital charges
105.5 COG/GF─CCMGR. Historical: Interpolated without indicator.
Current: Extrapolated judgmentally and interpolated without indicator.
29 Other sales 70.7 COG/GF─CCMGR. Historical: Interpolated without indicator.
Current: Extrapolated judgmentally and interpolated without indicator.
30 Gross Investment 225.0 31 Structures 176.0 32 New
172.0 Census C-30. Census C-30.
33 Net purchases of used structures 4.1 COG/GF. Historical: Interpolated without indicator
Current: Extrapolated judgmentally and interpolated without indicator.
34 Equipment and software 49.0 35 Equipment excluding computers
COG/GF. Historical: Interpolated without
indicator Current: Extrapolated judgmentally
and interpolated without indicator.36 Computers Benchmark I-O relationships,
extrapolated using changes in computer shipments as indicator for non-benchmark years.
Interpolated and extrapolated using changes in computer shipments as indicator.
37 Software 38 Pre-packaged
Benchmark I-O relationships, extrapolated using an indicator based on prepackaged software company earnings and trade source data on sales for non-benchmark years.
Interpolated and extrapolated using an indicator based on prepackaged software company earnings and trade source data on sales.

III– 61
TABLE III-2. STATE AND LOCAL GOVERNMENT CONSUMPTION EXPENDITURES AND GROSS INVESTMENT: SOURCES OF ESTIMATES
Line Category Calendar Year
2000 Estimates (billions of
dollars)
Annual
Quarterly1
39 Custom Benchmark I-O relationships, extrapolated using indicator based on trended custom software company earnings for non-benchmark years.
Interpolated and extrapolated using indicator based on trended custom software company earnings.
1. Except as noted, quarterly seasonally adjusted and
unadjusted estimates are the same. 2. Allocations between general government and
government enterprises based on Public Employment, published by the Census Bureau.
3. Cash wages and salaries plus compensation paid to prison inmates, fees paid to jurors and witnesses, and marriage fees.
4. Beginning in 1990, Indian tribal governments and tribal government-owned enterprises are in BLS tabulations.
5. See Dennis J. Fixler, Marshall B. Reinsdorf, and George M. Smith, “Measuring the Services of Commercial Banks in the NIPAs: Changes in Concepts and Methods” Survey of Current Business 83 (September 2003): 33—44.
AAP BLS tabulations CCMGR Census C-30 COG/GF ECEC ECI MEPS NASD OASDHI Ret. Sys. SCB SSB UI
Association of American Publishers. BLS tabulations of average weekly hours of
employment and wages reported by employers covered by State unemployment insurance programs.
Current charges and miscellaneous general revenue. These, in COG/GF, are a set of receipts data. Here, CCMGR includes both data published by Census and the results of BEA analysis underlying unpublished data. See Appendix III-A.
Current Construction Reports: Value of New Construction Put in Place.
Government Finances and (in years ending in 2 and 7) Census of Governments volumes, both from the Census Bureau. This includes not only the basic GF volume, but also State Government Finances and County Finances.
Employer Costs for Employee Compensation, published by BLS.
Employer Cost Index, published by BLS. Medical Expenditure Panel Survey. National Association of Securities Dealers. Old-age, survivors, disability, and hospital insurance. Finances of Employee-Retirement Systems of State and
Local Governments, a specialized publication in the COG/GF series.
Survey of Current Business, published monthly by the BEA.
Social Security Bulletin, published by the Social Security Administration.
Unemployment insurance.

III– 62
TABLE III-3. STATE AND LOCAL GOVERNMENT CURRENT EXPENDITURES: SOURCES OF ESTIMATES
Line Category Calendar Year
2000 Estimates (billions
of dollars)
Annual1
Quarterly2
1 Current Expenditures 1269.5
2 Consumption expenditures 917.8 See Table III-2. See Table III-2. 3 Government social benefit payments to
persons 271.7
4 Benefits from social insurance funds 11.5 5 Temporary disability insurance 2.8 California EDD; COG/GF. Historical: Interpolated without
indicator. Current: Extrapolated judgmentally
and interpolated without indicator. 6 Workers’ compensation 8.7 COG/GF. Historical: Interpolated without
indicator. Current: Extrapolated judgmentally
and interpolated without indicator. 7 Public assistance 245.4 8 Medical care3 205.0 9 Medicaid 199.5 MFMR. Historical: MFMR, seasonally
adjusted.4 Current: MTS, national average
FMAP. 10 Other medical care5 5.5 CMS. Historical: Interpolated without
indicator. Current: Extrapolated judgmentally
and interpolated without indicator. 11 Family assistance6 18.4 ACF.7 Historical: Interpolated without
indicator. Current: Extrapolated judgmentally
and interpolated without indicator. 12 Supplemental security income8 4.4 SSA. Historical: Interpolated without
indicator; SSA. Current: Extrapolated judgmentally
and interpolated without indicator; SSA.
13 General assistance9 3.6 COG/GF, FEMA—IFG. Historical: Interpolated without indicator, FEMA—IFG.
Current: Extrapolated judgmentally and interpolated without indicator, FEMA—IFG.
14 Energy assistance
1.7 Federal grants. Historical: Interpolated without indicator.
Current: Extrapolated judgmentally and interpolated without indicator.
15 Other10 12.3 FNS, ACF, 7 COG/GF. Historical: Interpolated without indicator, FNS.
Current: Interpolated without indicator, FNS.
16 Education11 11.6 COG/GF. Historical: Interpolated without indicator.
Current: Extrapolated judgmentally and interpolated without indicator.
17 Employment and training12 1.0 Federal grants. Historical: Interpolated without indicator.
Current: Extrapolated judgmentally and interpolated without indicator.
18 Other13
2.1 State of Alaska, 14 State of Massachusetts, DOJ,15 COG/GF.
Historical: Interpolated without indicator.
Current: Extrapolated judgmentally and interpolated without indicator.

III– 63
TABLE III-3. STATE AND LOCAL GOVERNMENT CURRENT EXPENDITURES: SOURCES OF ESTIMATES
Line Category Calendar Year
2000 Estimates (billions
of dollars)
Annual1
Quarterly2
19 Interest payments 79.5 20 Interest paid COG/GF. Historical: Interpolated without
indicator. Current: Extrapolated judgmentally
and interpolated without indicator. 21 Imputed interest paid See article in September 2003 SCB.16 See article in September 2003 SCB. 16 22 Subsidies 0.5 COG/GF. Historical: Interpolated without
indicator. Current: Extrapolated judgmentally
and interpolated without indicator. 23 Less: Wage accruals less disbursements 0.0 Reports from jurisdictions affected by
strikes. Reports from jurisdictions affected by
strikes. 24 Net state and local government saving 50.0 Current receipts less current
expenditures. Current receipts less current
expenditures. 25 Social insurance funds 2.0 Net sum of social insurance fund
components. Net sum of social insurance fund
components. 26 Other 47.9 Residual. Residual.
15. Calendar year estimates are calculated by averaging the data from
the two adjacent fiscal years. 16. Dennis J. Fixler, Marshall B. Reinsdorf, and George M. Smith,
“Measuring the Services of Commercial Banks in the NIPAs: Changes in Concepts and Methods” Survey of Current Business 83 (September 2003): 33—44.
1. Except as noted, calendar year estimates are prepared using the procedure described in “Annual Estimates.”
2. Except as noted, quarterly seasonally-adjusted and unadjusted estimates are the same.
3. Medical vendor payments, mostly Medicaid. 4. Unadjusted quarterly estimates are from the same
source as the annual. 5. General medical assistance and state child health care
programs. 6. Aid to families with dependent children, and beginning
in 1996, assistance programs operating under the Personal Responsibility and Work Opportunity Reconciliation Act of 1996.
7. Annual estimates are created by converting Federal fiscal year data to a calendar year basis, as described in “Family Assistance.”
8. Prior to 1974, consists of old-age assistance, aid to the blind, and aid to permanently and totally disabled, when the programs were federally funded.
9. Prior to 1981, general assistance data are available from HHS.
10. Expenditures for food under the supplemental program for women, infants, and children; foster care; adoption assistance; and payments to nonprofit welfare institutions.
11. Scholarship funds for state universities and colleges; state grants to private educational institutions.
12. Since 1982, payments to nonprofit institutions administering training programs.
13. Consists largely of veterans benefits, Alaska dividends, and crime victim payments.
14. Not-seasonally-adjusted estimates of dividend payments from the Alaska Permanent Fund are calculated by placing the majority of the annual estimates in the fourth quarter, with the rest in progressively smaller increments into the first, second, and third quarters.
ACF CMS COG/GF DOJ EDD Federal grants FEMA FMAP FNS IFG MFMR MTS SSA
Administration for Children and Families, U.S. Department of Health and Human Services.
Center for Medicaid and Medicare Services, U.S. Department of Health and Human Services.
Governmental Finances and (in years ending in 2 and 7) Census of Government volumes, both from the Census Bureau. This includes not only the basic GF volume, but also State Government Finances and County Finances.
U.S. Department of Justice. California Employment Development Department. See Part II, “Federal Grants-in-aid to State and Local
Governments.” Federal Emergency Management Agency, U.S. Department
of Homeland Security. Federal Medical Assistance Percentage, represents the
portion of Medicaid expenditures for which the Federal government is responsible
Food and Nutrition Service, U.S. Department of Agriculture.
Individual and Family Grant Program: FEMA Obligations by State.
Medicaid Financial Management Report, a quarterly report published by CMS detailing state Medicaid expenditures.
Monthly Treasury Statement. Social Security Administration.
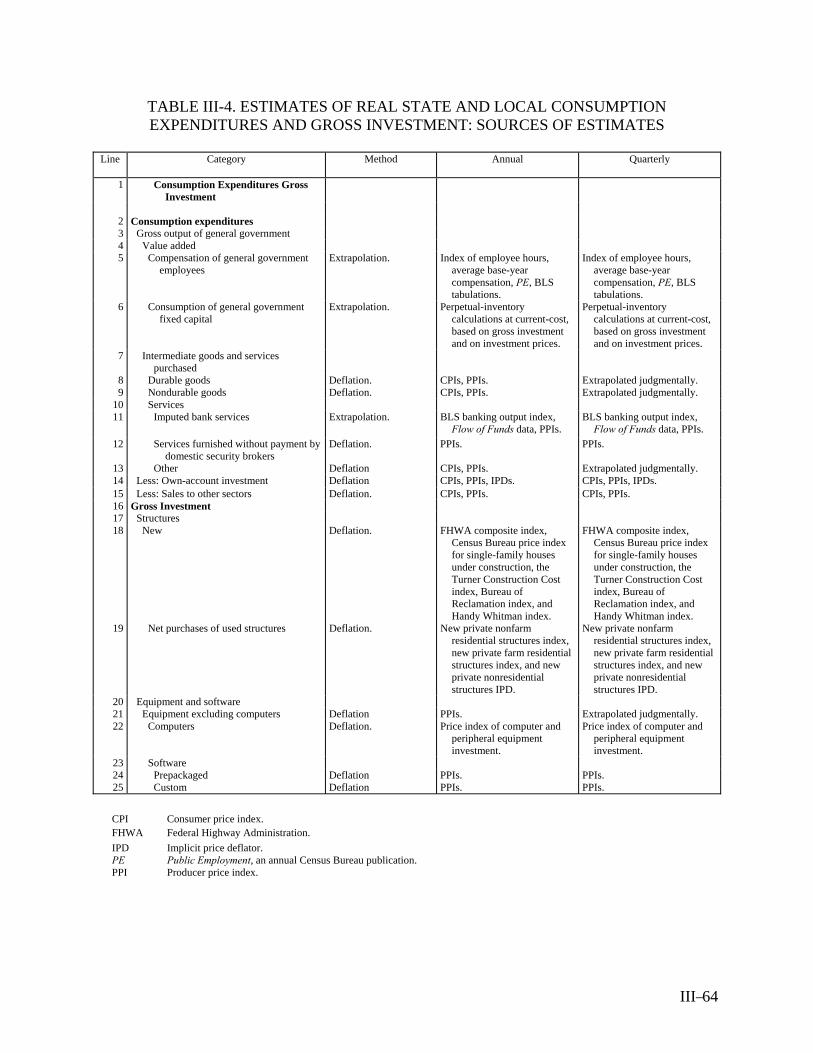
III– 64
TABLE III-4. ESTIMATES OF REAL STATE AND LOCAL CONSUMPTION EXPENDITURES AND GROSS INVESTMENT: SOURCES OF ESTIMATES
Line Category Method Annual
Quarterly
1 Consumption Expenditures Gross
Investment
2 Consumption expenditures 3 Gross output of general government 4 Value added 5 Compensation of general government
employees Extrapolation. Index of employee hours,
average base-year compensation, PE, BLS tabulations.
Index of employee hours, average base-year compensation, PE, BLS tabulations.
6 Consumption of general government fixed capital
Extrapolation. Perpetual-inventory calculations at current-cost, based on gross investment and on investment prices.
Perpetual-inventory calculations at current-cost, based on gross investment and on investment prices.
7 Intermediate goods and services purchased
8 Durable goods Deflation. CPIs, PPIs. Extrapolated judgmentally. 9 Nondurable goods Deflation. CPIs, PPIs. Extrapolated judgmentally.
10 Services 11 Imputed bank services Extrapolation. BLS banking output index,
Flow of Funds data, PPIs. BLS banking output index,
Flow of Funds data, PPIs. 12 Services furnished without payment by
domestic security brokers Deflation. PPIs. PPIs.
13 Other Deflation CPIs, PPIs. Extrapolated judgmentally. 14 Less: Own-account investment Deflation CPIs, PPIs, IPDs. CPIs, PPIs, IPDs. 15 Less: Sales to other sectors Deflation. CPIs, PPIs. CPIs, PPIs. 16 Gross Investment 17 Structures 18 New Deflation. FHWA composite index,
Census Bureau price index for single-family houses under construction, the Turner Construction Cost index, Bureau of Reclamation index, and Handy Whitman index.
FHWA composite index, Census Bureau price index for single-family houses under construction, the Turner Construction Cost index, Bureau of Reclamation index, and Handy Whitman index.
19 Net purchases of used structures Deflation. New private nonfarm residential structures index, new private farm residential structures index, and new private nonresidential structures IPD.
New private nonfarm residential structures index, new private farm residential structures index, and new private nonresidential structures IPD.
20 Equipment and software 21 Equipment excluding computers Deflation PPIs. Extrapolated judgmentally. 22 Computers Deflation. Price index of computer and
peripheral equipment investment.
Price index of computer and peripheral equipment investment.
23 Software 24 Prepackaged Deflation PPIs. PPIs. 25 Custom Deflation PPIs. PPIs.
CPI Consumer price index. FHWA Federal Highway Administration. IPD Implicit price deflator. PE Public Employment, an annual Census Bureau publication. PPI Producer price index.

III– 65
TABLE III-5. ADDENDA: SOURCES OF ESTIMATES
Line Category Calendar Year 2000 Estimates
(billions of dollars)
Annual
Quarterly
1 Total Receipts 1363.2
2 Current receipts 1319.5 See Table III-1. See Table III-1.
3 Capital transfer receipts 43.7 4 Estate and gift taxes
State COG/GF.1 Historical: Interpolated without indicator.
Current: Extrapolated judgmentally and interpolated without indicator.
Local COG/GF. 2 Historical: Interpolated without indicator.
Current: Extrapolated judgmentally and interpolated without indicator.
5 Capital grants See Part II, “Capital Grants-in-aid to State and Local Governments.”
See Part II, “Capital Grants-in-aid to State and Local Governments.”
6 Total Expenditures 1393.5
7 Current expenditures 1269.5 See Table III-3. See Table III-3.
8 Gross government investment 225.0 See Table III-2. See Table III-2.
9 Capital transfer payments ---
10 Net purchases of non-produced assets 8.8 COG/GF, COG/GF—CCMGR. Historical: Interpolated without
indicator. Current: Extrapolated judgmentally
and interpolated without indicator.
11 Less: Consumption of fixed capital 109.8 See Table III-4. See Table III-4. 12 Net lending or net borrowing (-) -30.4 Total receipts less total expenditures Total Receipts less total expenditures
COG/GF CCMGR
Government Finances and (in years ending in 2 and 7) Census of Governments volumes both from the Census Bureau. This includes not only the basic GF volume, but also State Government Finances and County Finances.
Current charges and miscellaneous general revenue. These, in COG/GF, are a set of receipts data. Here, CCMGR includes both data published by Census and the results of BEA analysis underlying unpublished data. See Appendix III-A.
1. Calendar year estimates are calculated by interpolating the COG/GF fiscal year data with available not-seasonally-adjusted quarterly tax collections data from the Quarterly Summary and then summing on a calendar year basis.
2. Calendar year estimates are calculated by interpolating the COG/GF fiscal year data without indicator and then summing on a calendar year basis.

III– 66
APPENDIX III-A Analysis of Changes and Miscellaneous General Revenue, GF, 2000
Table III-A-1. Distribution of Current Charges and Miscellaneous General Revenue Among Categories of Current Receipts, FY 2000
(Billions of dollars) FY2000 Enterprise Interest Dividends Curr Trans Curr Trans Taxes Rent & Royal- Coverage GF Sales Exclusions Revenue earnings received Persons Business ties /1/ /2/ adjustment Current charges and miscellaneous revenue, GF 377.0 Current charges 223.5 Education: 65.6 School lunch sales 5.5 5.5 Institutions of higher education: 55.3 Tuition /1/ 40.4 40.4 Other /1/ 14.9 14.9 Other education /3/ 4.8 4.8 Hospitals 54.6 54.6 Highways /4/ 7.4 0.8 6.6 Air transportation & airports 11.1 11.1 Parking facilities 1.4 1.4 Sea and inland port facilities 2.5 2.5 Natural resources 3.0 3.0 Housing and community development 4.2 4.2 Sewerage 24.3 24.3 Solid Waste management 10.2 10.2 Other charges /5/ 33.0 19.0 0.2 0.7 9.8 8.3 1.3 Miscellaneous general revenue: 153.5 Interest earnings 70.5 70.5 Special assessments 3.8 3.8 Sale of property /1/ /6/ 2.2 2.0 Other general revenue 77.2 Fines and forfeits /1/ 11.7 10.5 1.2 Donations /1/ 18.0 11.0 7.0 Other miscellaneous revenue 47.5 9.1 4.5 15.8 724.0 6.8 6.1 4.5 1. Published in GF for States; estimated by BEA for local (from underlying unpublished detail). 2. Data on oil bonuses are from direct contact with States. Such payments are included in GF rents and royalties, but are excluded, from NIPA transactions. 3. Available is summary detail underlying Government Finances. 4. Data on current charges for local highways are available in underlying unpublished detail. The distribution between toll facilities revenue (enterprise revenue) and other charges (government sales) is based on data from Highway Statistics, Federal Highway Administration. 5. Distribution of "other" from BEA analysis of data from Census records for individual large governments. 6. This represents sales of land and existing structures. The total is distributions between land and structures, as the purchase of land and existing structures. The sales of existing structures is a negative addition to gross purchases of structures. Note.—Except where noted, these data can be found in Government Finances, 2000. GF Government Finances
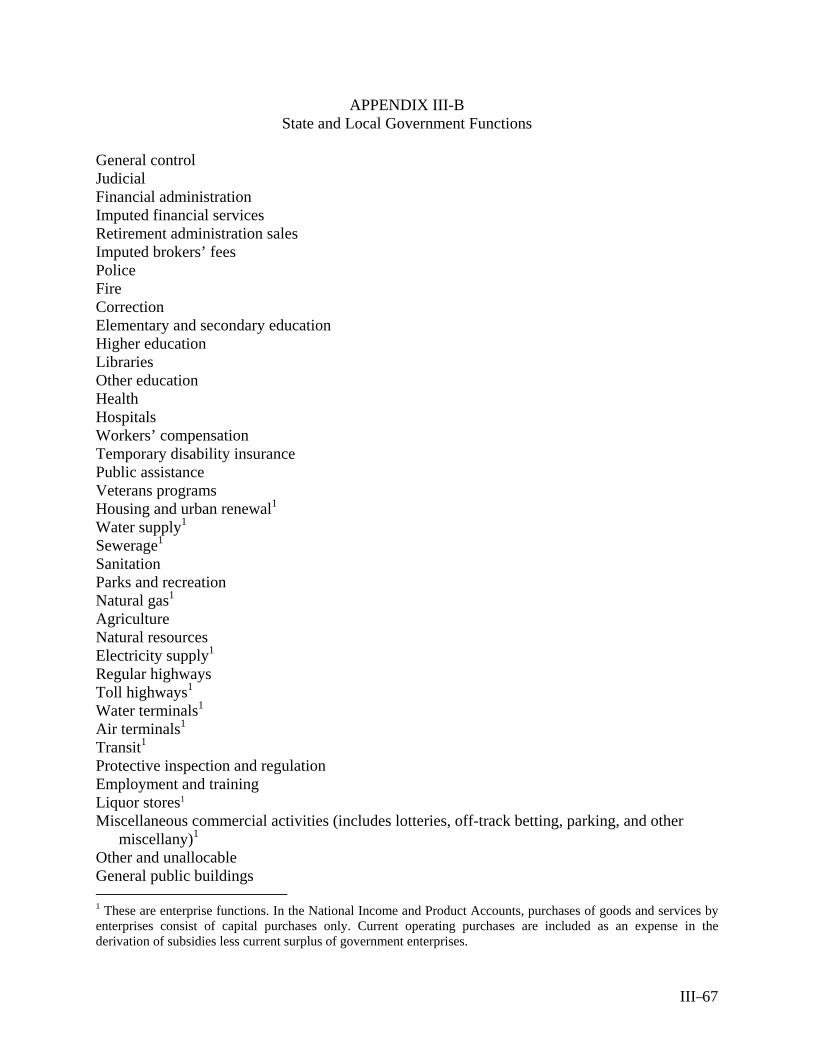
III– 67
APPENDIX III-B State and Local Government Functions
General control Judicial Financial administration Imputed financial services Retirement administration sales Imputed brokers’ fees Police Fire Correction Elementary and secondary education Higher education Libraries Other education Health Hospitals Workers’ compensation Temporary disability insurance Public assistance Veterans programs Housing and urban renewal1 Water supply1 Sewerage1 Sanitation Parks and recreation Natural gas1 Agriculture Natural resources Electricity supply1 Regular highways Toll highways1 Water terminals1 Air terminals1 Transit1 Protective inspection and regulation Employment and training Liquor stores1 Miscellaneous commercial activities (includes lotteries, off-track betting, parking, and other
miscellany)1 Other and unallocable General public buildings 1 These are enterprise functions. In the National Income and Product Accounts, purchases of goods and services by enterprises consist of capital purchases only. Current operating purchases are included as an expense in the derivation of subsidies less current surplus of government enterprises.

. IV—1
PART IV
GOVERNMENT CONSUMPTION EXPENDITURES AND GROSS INVESTMENT-BY-FUNCTION
. IV—2
Table of Contents
1. INTRODUCTION .......................................................................................................... 3
2. METHODOLOGIES ...................................................................................................... 5
3. FEDERAL GOVERNMENT SPENDING..................................................................... 5
4. STATE AND LOCAL GOVERNMENT SPENDING .................................................. 6
APPENDIX I ...................................................................................................................... 7
. IV—3
1. INTRODUCTION The classification of functions of government provides a detailed array of the functions, or socioeconomic objectives of general government. Ideally, this functional classification serves several purposes: (1) To provide statistics which are of general interest for a wide variety of analytic uses; (2) to provide users with the means to recast key aggregates of government spending for particular kinds of analysis; (3) to permit trends in government outlays on particular functions or purposes to be examined over time; (4) to enable international comparisons of government involvement in economic and social functions. BEA has historically produced estimates of government spending by function on a current-dollar basis. These estimates appear in NIPA tables 3.15, 3.16, and 3.17 NIPA estimates of government spending are mainly derived from data that are consistent with Federal, state, and local government budgets.1 These budgets usually reflect expenditures by function or by program, such as defense, health, and education.2 As a result, BEA’s estimates of government spending by function provide information on how governments allocate their funds that is useful to policymakers, business decisionmakers, and other data users. The estimates of current-dollar government spending show the relative size of each function, and the estimates of real government spending remove the effects of price changes over time and show the relative growth of each function. Government spending is distributed among the following functions: general public service, public order and safety, economic affairs, housing and community services, health, recreation and culture, education and income security. These functional classifications are reported, as applicable, within each of the following categories of expenditures: consumption expenditures, government social benefits, grants-in-aid, subsidies, gross investment, and capital transfers paid.
1 In this part, the phrase, “government spending” refers to three configurations of outlays by government. When referring to NIPA table family 3.15, government spending means “consumption expenditures and gross investment.” When referring to NIPA table 3.16, government spending means current expenditures (consumption expenditures, government current transfers, grants-in-aid, interest payments, and subsidies, less wage accruals less disbursements). When referring to NIPA table 3.17, government spending refers to current and capital expenditures. 2BEA’s classification of government spending by function is based on the “Classification of the Functions of Government” (COFOG); COFOG is the international classification standard, which is cited in the System of National Accounts, 1993 and the Government Finance Statistics Manual, 2001. BEA’s classifications of functions differ from COFOG because they do not include an environmental category and because they include “space” in economic affairs. An environmental category is not shown because environmental activities in the relevant subfunctions (such as waste management, housing, and community services) cannot be identified in BEA’s source data. Including “space” in economic affairs groups all the nondefense space-related activities—mostly National Aeronautical and Space Administration programs. Under the COFOG standard, spending on space-related activities may be classified as part of research and development (R&D) within all the relevant COFOG functions.
. IV—4
Beginning in 2004, BEA began producing estimates of real consumption expenditures and gross investment by function.3 Just as estimates of real government spending to produce services that are included in estimates of real gross domestic product (GDP), estimates of real government spending by function represent a measure of the changes over time in the real resources or inputs that contribute to the production of these services. Government services are difficult to measure because most of the services are not sold in the marketplace; however, the inputs to the provision of government services are relatively easy to measure, so these input-derived measures are used as proxies for the output of government services. This technique implicitly assumes that the ratio of inputs to outputs is fixed, and it ignores the possibility that output per unit of inputs may increase. Consequently, these estimates of real spending by function are not suitable for preparing productivity measures. Estimates of real spending by function refer to real government consumption expenditures and gross investment by function, which appear in NIPA table family 3.15 and which constitute a portion of GDP. These estimates exclude other types of government expenditures—such as social benefit payments, grants-in-aid, interest payments, and subsidies—that do not directly contribute to GDP; for example, the health function excludes payments for Medicare and Medicaid, both of which are classified in the NIPAs as government social benefit payments.4 They also exclude the services produced by government enterprises, but they include the investment spending of these enterprises.5 In addition, government consumption expenditures by function are on a net basis, that is, gross output less sales and own-account investment; for example, the consumption expenditures for health represent the gross output of providing health care services less the revenues received as hospital charges and other health charges. Estimates of real government spending by function expand the information available in the NIPAs for broad categories of services such as health care and education.6 A description of the methodologies that are used to prepare estimates of government spending by function are presented in the next section, along with a discussion of BEA’s plans to improve the estimates. Appendix I provides definitions of the functions of government.
3 See Bruce E. Baker, Pamela A. Kelly, and Brooks B. Robinson, “Estimates of Real Government Consumption Expenditures and Gross Investment by Function for 1959-2003,” SURVEY OF CURRENT BUSINESS 84 (October 2004) : 5-10. 4Current expenditures for health and other functions in current dollars are presented in NIPA table 3.16. Measures of real expenditures are not prepared for this table because no price indexes or other suitable methods exist for transforming all of the expenditures, such as social benefit payments, into real expenditures. 5 For more information about the treatment of government enterprises in the NIPAs, see A Guide to the NIPAs, M-20 at www.bea.gov/bea/an/nipaguid.htm. For estimates of real output, value added, and intermediate inputs for Federal and state and local government enterprises see Erich H. Strassner and Thomas F. Howells III, “Annual Industry Accounts Advance Estimates for 2004,” SURVEY OF CURRENT BUSINESS 85 (May 2005) : 7-19. 6 Estimates of real personal consumption expenditures for medical care and education are presented in the NIPA tables 2.4.3–2.4.6.

. IV—5
2. METHODOLOGIES The methodologies used to prepare the estimates of Federal Government and state and local government spending by function are based on the integration of estimates of current-dollar government budget data by function with estimates of current-dollar intermediate goods and services purchased by government to produce services. The following sections elaborate on the specific methodologies for the Federal Government and for the state and local estimates. For real estimates of Federal and state and local government spending by function, the deflated compensation of employees, consumption of fixed capital (CFC), and intermediate goods and services purchased for each function are aggregated to the functional and total (Federal, state and local, and total) levels using Fisher index formulas; the indexes are chained together to produce a time series of real quantity and price measures.7 3. FEDERAL GOVERNMENT SPENDING Estimates of Federal consumption expenditures and gross investment by function in current dollars are prepared on the basis of functional classifications for each appropriation in the Federal Budget. The portions of spending for all appropriations that are estimated by BEA to be consumption expenditures and gross investment are summed by budget function and then aggregated into the COFOG functions.8 Sales by appropriation are also assigned to budget functions and are subtracted from gross expenditures. In addition, BEA estimates and adds CFC to each function. Estimates of real Federal consumption expenditures and gross investment by type of expenditure (consumption or investment) and for investment, by type of asset, are discussed in Parts II and III of this publication.9 Estimates of real defense consumption expenditures and gross investment represent a single function; as a result, estimates of real spending for the defense function require no additional estimation. To derive estimates of real nondefense spending by function, first, estimates of current-dollar spending on nondefense compensation of employees, CFC, and intermediate goods and services purchased and sales by type of good and by type of service are allocated to current-dollar nondefense spending by function in the three steps that are described below. Then, the price indexes for compensation of employees, CFC, and intermediate goods, services, and sales are used to deflate the corresponding estimates of current-dollar nondefense spending by function.10 The estimates of nondefense compensation of employees, CFC, intermediate goods and services purchased, and sales are allocated in three steps. First, certain goods, services, 7 See J. Steven Landefeld and Robert P. Parker, “BEA’s Chain Indexes, Time Series, and Measures of Long-Term Economic Growth.” Survey 77 (May 1997): 58-68; www.bea.gov. 8NIPA current receipts differ from Federal budget receipts because of coverage, netting and grossing, and timing. BEA makes these adjustments to adjust to NIPA spending levels. See NIPA table 3.18 and Part II. 9Estimates by type of expenditure and, for investment, by type of asset are in NIPA tables 3.9.1–3.9.6, 3.10.1, 3.10.3–3.10.6, 3.11.1, and 3.11.3–3.11.6. 10Deflation is the process of dividing current-dollar estimates by price indexes.
. IV—6
and sales within nondefense spending are allocated to a single function; for example, the inventory change of the Commodity Credit Corporation (CCC) is allocated to agriculture, which is included in “other economic affairs.” Thus, the price indexes for CCC inventory change are used to estimate the real measures for “other economic affairs,” but they are not used to estimate any other functions. Second, because the Federal budget contains data for each appropriation that BEA classifies as compensation of employees, these data are allocated to a budget function and then to a COFOG function. These data are compiled from Federal budgets for selected years. Ratios of compensation by function are developed for selected years, and the ratios for intervening years are derived by interpolation. These ratios are then used to allocate current-dollar compensation to functions. In the derivation of the measures of real compensation, the same price index for compensation is used to deflate all nondefense functions. Third, the remaining estimates of current-dollar CFC, intermediate goods and services purchased, and sales are allocated to the nondefense functions proportionally. 4. STATE AND LOCAL GOVERNMENT SPENDING Estimates of current-dollar state and local government consumption expenditures, sales, and gross investment are derived from the Census Bureau’s Government Finances data. The Census Bureau data are collected in surveys by function, and these functions form the basis for the NIPA estimates by function. In preparing the NIPA estimates, the Census Bureau data are adjusted to conform to NIPA accounting concepts of coverage, netting, and timing, and the data are sorted into COFOG-based functions.11 The Census Bureau data are also supplemented with data from other sources—particularly the data for computers and software. In addition, BEA estimates and adds CFC to each function. Estimates of current-dollar consumption expenditures, sales, and gross investment are allocated to commodities, using detailed data from BEA’s input-output accounts. These commodities are allocated to functions and to types of intermediate goods (that is, durable goods and nondurable goods) and services purchased, and to gross investment (structures and equipment and software). These commodities are matched with price indexes and are deflated to produce estimates of real government consumption expenditures and gross investment and of government spending by function.
11 See NIPA table 3.19., “Relation of State and Local Government Current Receipts and Expenditures in the National Income and Product Accounts to Bureau of Census Government Finances Data.” See also Part III of this publication.
. IV—7
APPENDIX I
DEFINITIONS OF THE FUNCTIONS OF GOVERNMENT The functions of government presented in the NIPA tables are based on the international “Classification of the Functions of Government” (COFOG). They reflect the Federal and state and local government consumption expenditures and gross investment to produce the following services: General public services; national defense services; public order and safety services; economic affairs services, including transportation, space, and other services; housing and community services; health services; recreation and culture services; education services; and income security services. The estimates in NIPA tables 3.15.1 (percent change), 3.15.2 (contribution to percent change), 3.15.3 (quantity index), 3.15.4 (price indexes), and 3.15.6 (chained 2000 dollars) reflect these functions. Table 3.15.5 presents additional detailed services by function in current dollars. Table 3.16 presents government current expenditures by function, and table 3.17 presents selected government current and capital expenditures by function. In the detailed NIPA table 3.15.5 and tables 3.16 and 3.17, general public service consists of detailed spending for executive and legislative services, tax collection and financial management services, and other services. Public order and safety consists of police, fire, law courts, and prisons services. Economic affairs consists of transportation, space, and “other economic affairs.” Transportation consists of highways, air, water, and transit and railroad. “Other economic affairs” consists of general economic and labor affairs, agriculture, energy, natural resources, postal services, and other services. Housing and community services for State and local governments consists of water, sewerage, sanitation, and housing and other services. Education consists of elementary and secondary education, higher education, and libraries and other services. For state and local governments, libraries and other services are shown separately. Income security consists of disability, retirement, welfare and social services, unemployment, and other services.