mpbep 2011 04 prsnttn effectssimulatedmpbhydrologypostattckveg
DESCRIPTION
https://foothillsri.ca/sites/default/files/null/MPBEP_2011_04_Prsnttn_EffectsSimulatedMPBHydrologyPostAttckVeg.pdfTRANSCRIPT

Effects of Simulated MPB on Hydrology and
Post-attack Vegetation & Below-ground
Dynamics
Principal investigators: Uldis Silins and Ellen Macdonald Ph.D. projects: Anne McIntosh and Pablo Piña Lead field technician: Pete Presant

?
Time
Re
lative
im
pa
ct

Broad research questions
• How much extra water is produced after different levels of “red attack” ? (Pablo Piña) • What are the early trajectories of vegetation and below-ground responses after different levels of “red attack” ? (Anne McIntosh)

Approach & treatments
• Simulate MPB attack - issue of “control” (B.C. experience) - variable density herbicide treatment
• [1] Control (untreated)
• Simulated MPB attack ([2] 50% & [3] 100% overstory kill)
• [4] Clearcut - harvested to simulate “salvage logging”
4

Study area & design
Treatment
Control
After Before
Jul Aug Sep Oct Nov Dec Jan Feb Mar Apr May Jun Jul Aug Sep Oct Nov Dec Jan Feb Mar Apr May Jun Jul Aug Sep Oct Nov Dec Jan Feb Mar Apr May Jun Jul Aug Sep Oct Nov Dec Jan Feb Mar Apr May Jun Jul Aug Sep Oct Nov Dec Jan Feb Mar
2007 2008 2009 2010
Post-Treatment Year 2
2011 2012
Analysis, write-upSurveying-layout, set up - instrumentation Pre-Treatment year Post-Treatment Year 1
• Process study
Control
Tre
atm
ent
• Pre-treatment (1 year)
• Post-treatment (2 years)
• 2.2 ha treatments (water balance)
• + 2 x 1.2 ha replicates (vegetation)

50 % MPB ATTACK
CLEARCUT
100 % MPB ATTACK
CONTROL

Post-attack hydrology responses Pablo Piña, PhD Candidate
How much extra water is produced after different levels of “red attack” ?
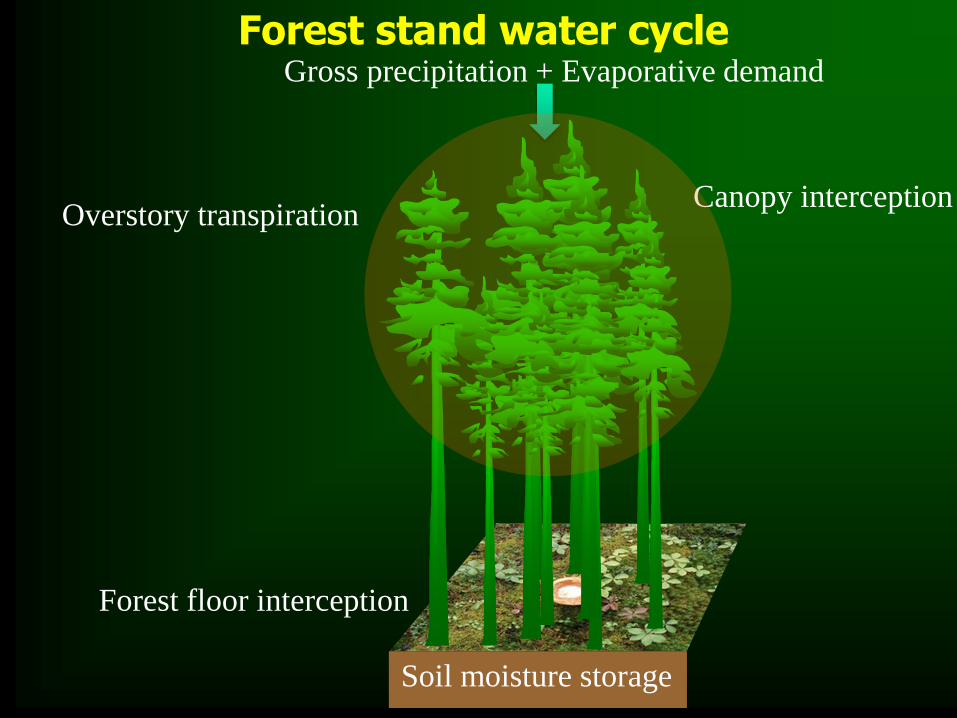
Overstory transpiration Canopy interception
Forest stand water cycle Gross precipitation + Evaporative demand
Forest floor interception
Soil moisture storage

Forest stand water cycle
Net precipitation
Canopy interception
Overstory transpiration
Forest floor interception
Soil moisture recharge

Transpiration instrumentation
Thermal Dissipation Probe

0.0 0.5 1.0 1.5 2.0
0.0
0.5
1.0
1.5
2.0
50K
Control (m S-1)
(m S
-1)
Canopy
100Kill
0.0 0.5 1.0 1.5 2.0
Clearcut
0.0 0.5 1.0 1.5 2.0
Before
After
Control (m S-1)
(m S
-1)
Understory
0.0 0.5 1.0 1.5 2.0
0.0
0.5
1.0
1.5
2.0
0.0 0.5 1.0 1.5 2.0 0.0 0.5 1.0 1.5 2.0
CANOPY
UNDERSTORY
50 % Kill 100 % Kill Clearcut
Before
After
WIND SPEED
CONTROL CONTROL CONTROL

May Jun Jul Aug Sept
0.0
0.5
1.0
1.5
2.0
mm
d-1
Evaporative demand
Control
50% Kill
100% Kill
STAND-LEVEL
TRANSPIRATION m
m d
-1

0.0 0.5 1.0 1.5
0.0
0.5
1.0
1.5
Control (mm/d)
Tre
atm
ent (m
m/d
)
0.0 0.5 1.0 1.5
0.0
0.5
1.0
1.5
100% Kill
50% Kill
Before
0.0 0.5 1.0 1.50.0 0.5 1.0 1.5
Control (mm/d)
Tre
atm
ent (m
m/d
)
AfterBEFORE AFTER
CONTROL (mm d-1) CONTROL (mm d-1)
TR
EA
TM
EN
T (
mm
d-1
)
&
TREE TRANSPIRATION

36 mm
65 mm
11 mm
225 mm
Ppt
OVERSTORY TRANSPIRATION
DURING 2010 SEASON:
• CONTROL 65 mm (29% of precipitation)
• 50 % KILL 36 mm (16% of precipitation)
• 100 % KILL 11 mm (5% of precipitation)

Post-attack vegetation & below-ground responses
Anne McIntosh, PhD Candidate
What are the early trajectories of vegetation and below-ground responses after different
levels of “red attack” ?

Overstory
Understory
Below-ground
? MPB

Post-attack vegetation & below-ground response objectives
1. Overstory forest structure
2. Understory plant community composition (shrubs, seedlings, plants (herbs, grasses, bryophytes)
3. Future regeneration potential of these stands
4. Recruitment of downed woody debris (DWD)
5. Changes in below-ground processes
(nutrient availability, microbial community, decomposition)
What are the early trajectories of vegetation and below-ground responses after different
levels of “red attack” ?

Pre Trt Post Pre Trt Post Pre Trt Post Pre Trt Post
Control 50%Kill 100%Kill Salvage
Treatment by Interval
Co
ve
r (%
)
0
20
40
60
80
100
120
140
160
180
BRYOPHYTECLUB-MOSS
FORB
SHRUB
ALDERGRASS
Understory cover

Germination study (2010)
What is the regeneration potential of these stands after
MPB?
Quadrats on 5 substrates sowed w/ seed:
• LFH < 2.5 cm • LFH > 2.5 cm • Mineral soil • Moss • Dead wood (decay class 4-5)
Monitored germination weekly


Treatment
Control 50%kill 100%kill SalvageMea
n n
um
be
r o
f g
erm
ina
nts
co
un
ted
0
1
2
3
4
5
Deep litter
Shallow litter
Moss
Mineral
Dead wood
Germinants
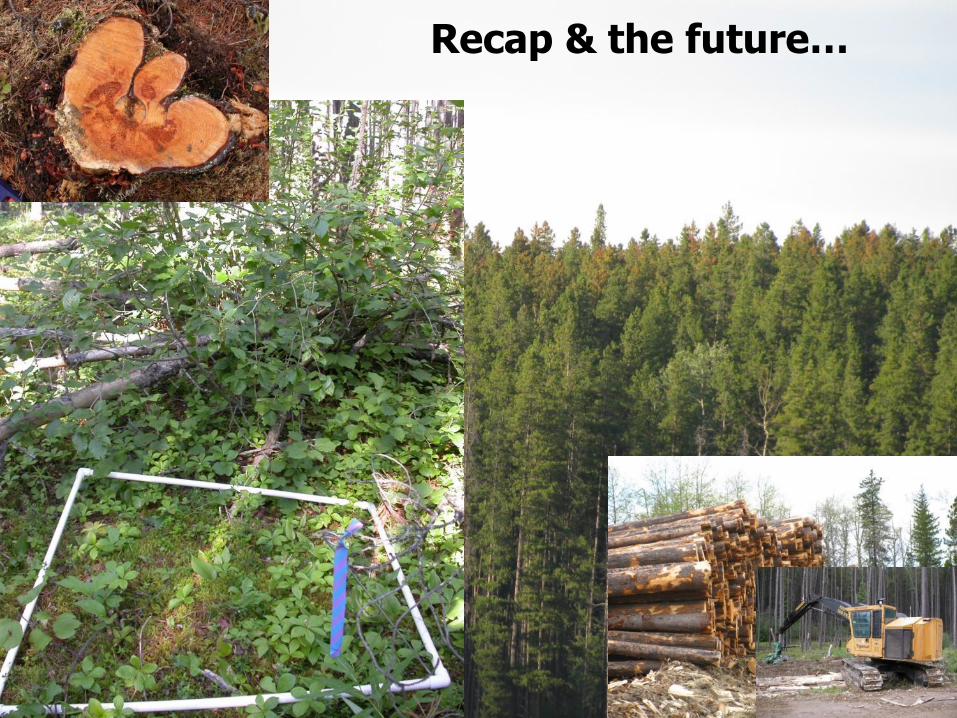
Recap & the future…

Forest stand water cycle
Net precipitation
Canopy interception
Overstory transpiration
Forest floor interception
Soil moisture recharge
X
X
X
✓
✓
?

Treatments: represent a gradient of MPB attack Stand evapo-transpiration reduced by treatments
• Less transpiration: red (dead) and treated green trees • Untreated trees aren’t transpiring more
Soil moisture increased
• Surface 20 cm clear treatment effect • Surface 5 cm clear gradient with treatment
Main findings (mid-way 2nd post-treatment yr)

Overstory
Understory
Below-ground
Trees are dying
No change …yet?
*not all data
*No change… yet?
Regeneration?
Potential
MPB

As we move to grey attack…
Transpiration
Interception
Soil water
Soil nutrients
Understory cover
Species-specific
responses
Understory community change
Recover water balance?
Future forest development
Below-ground communities
Below-ground processes
Light?

Support for the work
• Foothills Research Institute
• FRIAA / AB SRD
• West Fraser Timber Co. Ltd.
• NSERC
• CONACYT
• Milo Mihajlovich
• Field Assistants
…Thank you for listening
For further information:
uldis.silins “at” ales.ualberta.ca ellen.macdonald “at” ales.ualberta.ca
ppina “at” ualberta.ca amcintos “at” ualberta.ca

Co
ntr
ol
50%
Kill
100
% K
ill
0.0 0.2 0.4 0.6 0.8
Stand (mm day-1)
Before
After
0.55 mm
d-1
0.38 mm
d-1
0.13 mm
d-1