mpd nicampd.jinr.ru/wp-content/uploads/2017/05/tdr_tof_20_04_2017.pdf · mpd nica technical design...
TRANSCRIPT
TOF/MPD Collaboration JINR
Dubna,January 2017, Rev. 2.12
Dubna 2017
MPD NICA
Technical Design Report
of the
Time of Flight System (TOF)

- 1 -
TOF Group of the MPD Collaboration
Laboratory of High Energy Physics, JINR, Dubna:
V.A. Babkin,S.N. Bazylev, M.G. Buryakov, V.M. Golovatyuk, A.V. Dmitriev, P.O. Dulov,
D.S. Egorov, Yu.I. Fedotov,V.I. Kolesnikov, S.P. Lobastov,V.A. Petrov, M.M. Rumiantcev,
V.M. Slepnev, I.V. Slepnev, A.V. Shutov, V.B. Shutov, A.V. Shipunov, S.V. Volgin,
N.M. Vladimirova.
Warsaw University of Technology, Warsaw, Poland:
D. Dąbrowski, M.J. Peryt, K. Roslon.
B. I. Stepanov Institute of Physics, NASB, Minsk, Belarus:
A.V. Litomin.
Department of Engineering Physics, Tsinghua University, Beijing, China:
Yi Wang, Zhu Weiping,YuanjingLi, YinongLiu, ZhiDeng, GuanghuaGong, XiangleiZhu,
WeichengDing.
Center of Particle Physics and Technology (CPPT) of the University of Science and
Technology of China (USTC) Hefei, China:
Cheng Li, Hongfang Chen, Ming Shao, Xiaoliang Wang, Yongjie Sun, Zebo Tang.

- 2 -
Contents
1 Introduction ................................................................................................... - 4 -
1.1 The MPD experiment ..................................................................................................... - 4 -
1.2 Particles identification in the MPD ................................................................................ - 6 -
1.3 Requirements for the TOF system ................................................................................. - 6 -
1.3.1 The basic requirements ....................................................................................................... - 6 - 1.3.2 Required time resolution of the TOF system of the MPD ................................................... - 7 - 1.3.3 Occupancy and counting rate estimation ............................................................................ - 9 -
2 Development of the MRPC for the TOF ...................................................- 11 -
2.1 Motivation of choosing the MRPC for the TOF system .............................................. - 11 -
2.2 Designs of the MRPC prototypes ................................................................................ - 11 -
2.2.1 Pad prototype .................................................................................................................... - 11 - 2.2.2 The triple-stack MRPC prototype with strip readout electrodes ....................................... - 12 -
2.3 Beam setup and cosmic stand for testing detectors ..................................................... - 13 -
2.4 Test results ................................................................................................................... - 15 -
2.5 Study of rate capabilities of a MRPC .......................................................................... - 16 -
3 The TOF Detector Design ...........................................................................- 18 -
3.1 Detail layout of the MRPC for the MPD time-of-flight system. ................................. - 18 -
3.2 Mechanical design of the TOF barrel .......................................................................... - 20 -
3.3 The occupancy and geometric efficiency of the TOF system. .................................... - 23 -
3.4 Acceptance estimation and track matching.................................................................. - 24 -
3.5 Time-of-Flight particles identification performance ................................................... - 27 -
3.6 Front-end electronics and data acquisition system ...................................................... - 28 -
3.6.1 Preamplifiers for the TOF MRPC ..................................................................................... - 28 - 3.6.2 Preamplifier’s voltage supply ........................................................................................... - 33 - 3.6.3 Preamplifier’s control ....................................................................................................... - 33 - 3.6.4 Time-Over-Threshold method ........................................................................................... - 35 - 3.6.5 Time-to-digital converter TDC72VHL .............................................................................. - 35 -
3.7 Weight and material budget of the TOF system .......................................................... - 36 -
3.8 Area for mass-production of the TOF MRPC ............................................................. - 37 -
3.9 Step-by-step MRPC assembling procedure ................................................................. - 39 -
3.10 Modules installation procedure .................................................................................... - 42 -
4 Service ..........................................................................................................- 45 -
4.1 Gas system ................................................................................................................... - 45 -
4.1.1 Simple gas system for testing elements of the TOF ........................................................... - 45 - 4.1.2 Proposed closed loop circulation gas system .................................................................... - 46 -
4.2 High Voltage supplies .................................................................................................. - 50 -
4.3 Low Voltage power distribution .................................................................................. - 52 -
4.4 Slow control for the TOF system ................................................................................. - 53 -
4.5 Power consumption and cooling .................................................................................. - 55 -
5 Timetable and cost estimation ...................................................................- 56 -
References ..........................................................................................................- 57 -

- 3 -

- 4 -
1 Introduction
1.1 The MPD experiment
The MPD is designed as a 4π-spectrometer capable of detecting charged hadrons, electrons
and photons in heavy-ion collisions in the energy range of the NICA collider [1, 2]. To reach this
goal, the detector will include a precise 3-D tracking system and a high-performance particle
identification system based on time-of-flight measurements and calorimetry. At the design
luminosity, the event rate in the MPD interaction region is about 6 kHz; the total charged particle
multiplicity exceeds 1000 in the most central Au+Au collisions at 𝑆𝑁𝑁 = 11 GeV. As the
average transverse momentum of the particles produced in a collision at the NICA energies is
below 500 MeV/c, the detector design requires a very low material budget. The general layout of
the MPD apparatus is shown in Fig. 1.1.
The Multi-Purpose Detector consists of a barrel part and two endcaps located inside the
magnetic field. The barrel part is a shell-like set of various detector systems surrounding the
interaction point and aimed at reconstructions and identifying both charged and neutral particles in
the pseudorapidity region of |η| ≤ 1.3. The endcaps are aimed at the precise tracking over pseudo
rapidity range (1.3 < |η| < 2). The ion beams interact inside the beam pipe located along the z axis
with the central interaction point at z = 0 in the center of the detector. The interaction region
covers an interval of |z| ≤ 25 cm.
The barrel part shown in Fig. 1.1 consists of a tracker and particle identification
system.The principal tracker is the time projection chamber (TPC) supplemented by the inner
tracker (IT) surrounding the interaction region. Both subdetectors (IT and TPC) have to provide
precise track finding, momentum determination, vertex reconstruction and pattern recognition.

- 5 -
Figure 1.1: Cutaway side and cross views of the Central Detector of the MPD with dimensions.
- 6 -
1.2 Particles identification in the MPD
The event-by-event hadrons identification will provide us with the opportunity to measure,
with high statistics, on a single event basis the yields of pions, kaons and protons, their ratios, thus
giving a possibility of comprehensive study as many as possible event-by-event dynamical
fluctuations and correlations. Consequently, it will provide information on possible instabilities
during phase transitions, on the degree of thermal equilibrium, on collective flow phenomena and
on expansion dynamics.
Physics goals of the MPD require particle identification overas large as possible phase space
volume. The MPD has two main identification subsystems. The first subsystem is high
performance time-of-flight (TOF) detector. The TOF together with the TPC must be able to
identify charged hadrons and nuclear clusters in the broad rapidity range and up to total
momentum of 3 GeV/c. The fast forward detectors (FD) will provide the TOF system with the
start signal. The second PID system is the electromagnetic calorimeter. Its main goal is to identify
electrons, photons and measure their energy with high precision.
1.3 Requirementsfor the TOF system
1.3.1 The basic requirements
Ambitious physics goals of the MPD require excellent particle identificationcapabilities over
as large as possible phase coverage.Identification of charged hadrons (PID) at inter-mediate
momenta (0.1 – 2 GeV/c) is achieved by the time-of-flight (TOF) measurements which are
complemented by the energy loss (dE/dx) information from the TPC and IT detector systems.
The basic requirements for the TOF system are:
- large phase space coverage;
- high granularity to keep the overall system occupancy below 15%;
- good position resolution to provide effective matching of the TOF hits with the TPC tracks;
- high geometrical efficiency (better than 95%);
- separation of pions and kaons with up to pt < 1.5 GeV/c;
- separation of (anti)protons with up to pt < 3 GeV/c;
- TOF detector elements must function in a 0.5 T magnetic field.

- 7 -
1.3.2 Required time resolution of the TOF system of the MPD
For the charged particle identification (mass reconstruction) one needs to measure the
following parameters: momentum of the particle, its track length and time of flight from
interaction point to the TOF detector:
𝑚 = 𝑝 ∙ 𝑐2𝑡2
𝑙2− 1,
where m is the mass of the particle, p – the momentum, l – the track length and t is the time of
flight.There are three sources of the error in the mass reconstruction of the particle:
𝜕𝑚
𝑚=𝜕𝑝
𝑝
𝜕𝑚
𝑚=
𝐸
𝑚
2 𝜕𝑡
𝑡
𝜕𝑚
𝑚=
𝐸
𝑚
2 𝜕𝑙
𝑙
At the relativelyhigh momenta of particles the errors in the time of flight measurement and
track length definition have higher weight than the error of the momentum determination. The
momentum spectra of secondary particles at the NICA colliding energies produced in the regions
of pseudorapidity|η| < 1.2 and 1.2 < |η| < 2 for minimum (4 GeV) and maximum (11 GeV)
colliding energiesare presented in the Fig. 1.5. The average momentum of pions for energy 4 GeV
is about 300 MeV/c and for 11 GeV is about 400 MeV/c.

- 8 -
Figure 1.5: Momentum spectra of pions, kaons and protons in two regions of pseudorapidity: |η| < 1.2
(left) and 1.2 < |η| < 2 (right) and for two center of mass energy: 4 GeV (top) and 11 GeV (bottom).
The smallest track length for the time of flight measurement atthe MPD is 1.5 m. We
expect to have overall time resolution better than 100 ps. It allows us reliable separation of pions,
kaons and protons in the entire interval of momenta for produced particlesfor theNICA energies
(Fig. 1.6a, 1.6b).
Figure 1.6a: Calculation of the separation of pions and
kaons in units of standard deviation as a function of the
TOF base for the TOF resolutions: 80 and 100 ps.
Figure 1.6b: Separation of pions and kaons as a
function of secondary particles momenta for
different fixed bases (time resolution is 100 ps).

- 9 -
In Fig. 1.7 we present the fraction (in percent) of pions and kaons below a particular
momentum as a function of the momentum. These distributions are obtained for the particle
spectra from Fig. 1.2. One may conclude that theTOF system can separate pions on the level of
99% and kaons – almost 98% up to the total momentum of 1.5 GeV/c.
1.3.3 Occupancy and counting rate estimation
For simulation we used Au-Au interactions with total energy 4.5 + 4.5 GeV/n from the
UrQMD generator and GEANT4 for tracing particles in the detector. Impact parameter range for
minimum bias: b = 0 – 15.8 fm, for central collision: b = 0 – 3 fm.
Figure 1.8: Estimated occupancy of the TOF system
as a function of pseudorapidity.
Figure 1.9: Charged particles multiplicity per one
minimum bias interaction as a function of (θ-π/2).
Figure 1.7: Part of the pions and kaons below a particular momentum ( 𝑆𝑁𝑁 = 11 GeV).
- 10 -
Simulated occupancy of the proposed TOF system for primary charged particles is shown
in Fig .1.8. There is occupancy for the barrel partand end-cup part of the TOF in this figure.
Maximum occupancy does not exceed 0.2% per cm2 in the barrel even considering secondary
particles. On the basis of this analysis we should optimize the configuration of the location of
detectors and the size of the readout electrode.
For particles rate estimation the anticipated luminosity for Au + Au collisions L = 1027
cm-
2s
-1 was used. The collision rate for minimum bias events was taken as:
𝐿 × 𝜎 = 1 ∙ 1027 × 6𝑏𝑎𝑟𝑛 = 1 ∙ 1027 × 6 ∙ 10−24 = 6000𝐻𝑧
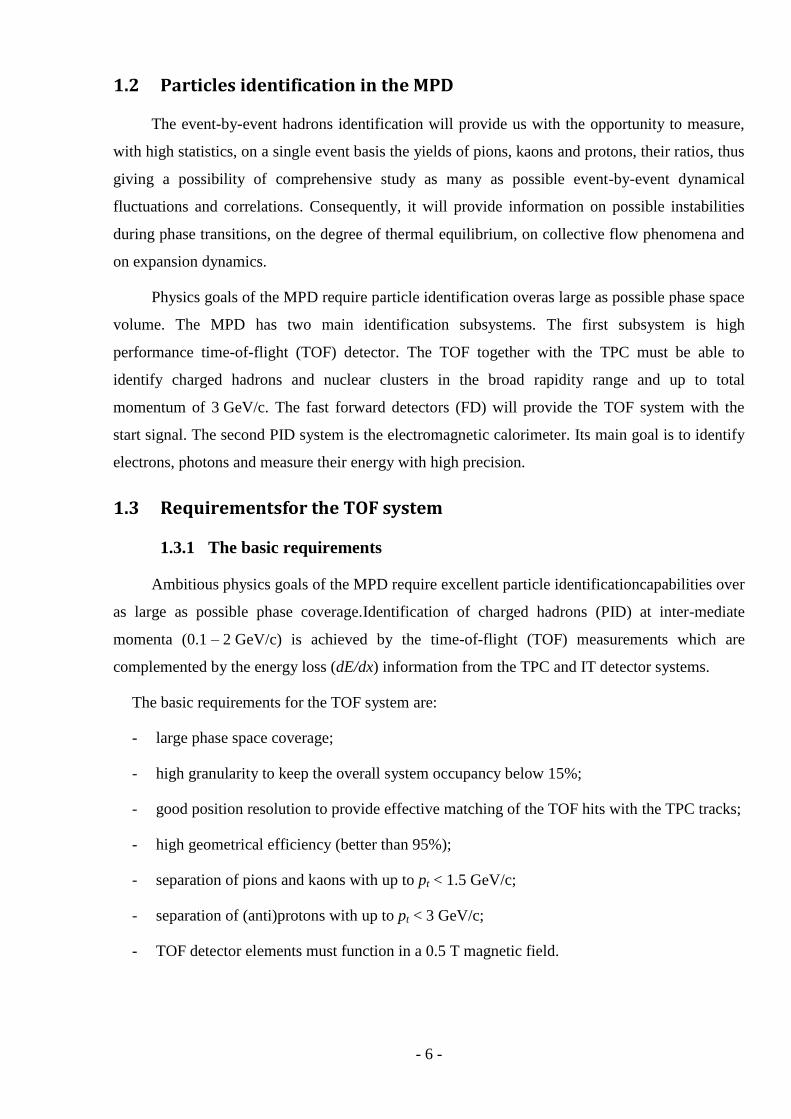
The interaction rate for central collisions is below 1 kHz. From Fig. 1.9one can see that
there are 0.005 charged particles that cross the surface of 2.6 cm2 in one event. The number of
charged particles per second crossed the 1 cm2 surface of the TOF is only N = 6000 Hz x
0.005 / 2.6 = 11.5 Hz/cm2.Our rate test of MRPConthe extracted beam of the
Nuclotrondemonstrated a good timing performance of the MRPC and its efficient work at particle
fluxes up to 103 cm
-2s
-1 (Fig. 1.10). So, the TOF MPD system based on the MRPC has to
demonstrate reliable work at particle flux bellow 12 Hz/cm2.
Figure 1.10: Efficiency and time resolution versus counting rate for MRPC.

- 11 -
2 Development of the MRPC for the TOF
2.1 Motivation of choosing the MRPC for the TOF system
Our choice for the TOFsystem is the Multigap Resistive Plate Chambers (MRPC), which
were widely used in such heavy-ion experiments as ALICE [3, 4], PHENIX [5], STAR [6],
HADES [7] and is planning the TOF CBM [8].Such widespread use of this detector caused by that
the multigap resistive plate chamber has good timing characteristics. At the same time the MRPC
is quite easy to manufacture and it is relatively inexpensive. Its production requires materials that
are commercially available.
The multigap resistive plate chamberconsists of a stack of resistive plates separated one
from the other with equal size spacers creating a series of gas gaps [9]. High voltage coating is
made on the outer surfaces of the outer resistive electrodes. Internal plates are left electrically
floating. The voltage of the internal plates appears due to the flow of electrons and ions created in
the gas gap.The resistive electrodes quench the streamer and prevent a spark breakdown. The
MRPC operates at high gain in avalanche mode. Float glass plates are used as resistive plate
electrodes.
2.2 Designs ofthe MRPC prototypes
Two types of MRPCs were considered: with the pad signal readout and with the strip
readout. Bothoptionshavetheirspecialtraitsin terms of assembling and operation.
Butatlowmultiplicityofevents, itmakes sense to use a strip electrode for readout.
Itreducesthenumberofchannelsmakingthesystemmorecost-effective.Therefore, strip MRPCs have
been chosen for the barrel part of the MPD. Atthe end cup parts of the detector, pad and strip
readouts will be combined there.
2.2.1 Pad prototype
The first prototype of a multigap resistive plate chamber (MRPC) for the TOF MPD
(Fig. 2.1) was madesmall with pad readout [10]. A 208 µmgasgapisformedby
amonofilamentfishing line of appropriate thickness. ThereadoutelectrodesarePCBof
140×120 cm2withcopper rectangles of 16×35 cm
2. In total theymakeuptwo rows of 8 padsin
each.Inordertosupplyhighvoltagetoglassesclosesttothereadoutelectrodes, they are coated with a
graphite conductive layer with a surface resistance of 2 – 10 MΩ per square.Signals from the pads
are transferred via the twisted pair cable to the amplifier.Thedetectorissituatedinaleak-tight box
(Fig. 2.2) in which a gas mixture is injected.

- 12 -
Figure 2.1:Pad MRPC scheme. Figure 2.2: Pad MRPC prototype in gas box.
2.2.2 The triple-stack MRPC prototype with strip readout electrodes
The expected multiplicity of particles in the central Au + Au collisions at 𝑆𝑁𝑁 = 11 GeV
allows using readout electrode area of 100 cm2 with the maximum occupancy about25%. On the
other hand, increasing the size of the electrode can lead to time resolution worsening due to
thesignal deterioration (front drops).In case of using readoutelectrode as a long narrow strip and
reading signal from both sides, it avoids the need to take the time dependence of the position of
the flight of the particleinto account. This method significantly reduces the number of channels of
readout electronics without degrading the time resolution.
The last and more successful strip prototype with an active area of 600x300 mm2has been
designed and tested on the beam. Main features of this MRPC are:three stacks of glass and the
readout from the inner stack(Fig. 2.3). In order to get good time resolution from MRPC by using
the time-over-threshold method one needs to provide very good termination of impedance
between thestrip, the cable and the preamplifier input. Any reflection could cause the wrong
estimation of the signal width when the amplitude correction applied. Working with double stack
MRPC with differential signal readout scheme one also has to pay attention to the fact that readout
strips for positive and negative signals have different impedances. The inner strip is surrounded on
both sides by the fiberglass PCB and glass with dielectric constant ~4. The external electrodes
have a honeycomb on one side and glass from the other. As a result, the positive and negative
parts of the signal propagate with different velocities. This fact can lead to worsening of time
resolution. One can make the impedance of anode and cathode strips in the double stack MRPC
equal by introducing the honeycomb spacer between two inner PCBs. A single-stack MRPC is the
example of good electrical symmetry. However, getting a large signal often requires more than 6

- 13 -
gaps.Large number of gaps reduces capacitance of the strip line. A proposed triple-stack MRPC
design is free of the mentioned above problems.
Each stack of the detector consists of 5 gas gaps width of 200 μm separated by the thin
(280 μm) glass. Such thickness of the glass was chosen for two reasons. Firstly, it reduces the
radiation length of the detector, and secondly, it improves the rate capability of the detector [13].
The active area of the MRPC is determined by the size of the glass (300×600 mm). Signals are
read from two sides of 24 readout strips 10 mm wide using the double twisted pair flat
cable(Fig. 2.4).
Figure 2.3: Layout of the strip MRPC. Figure 2.4: Readout from two stacks of the MRPC.
2.3 Beam setup and cosmic stand for testing detectors
The principal goal of the R&D is to investigate the problems associatedwith scaling up from
a small to a full size MRPC with strip readout electrodes.Various issues were addressed, such as:
(a) material and thickness of resistive plates (b) definition ofthe edge of the active area (c)
connection between readout electrodes and electronics (d) assembly problemsand (e) front-end
electronics. The tests were performed in both cosmic rays and proton beam of the Nuclotron.
Laboratory with cosmic test setup was organized (Fig. 2.5) for testing detectors in the
intervals between runs of the Nuclotron. Cosmic stand includes (Fig. 2.6):scintillation telescope
(S1-S8) which cover the entire active area of the tested detectors; 4-channel gas system with
MKS-Instruments controllers; fast readout electronics based on VME (ADC, TDC, TQDC ...);
high-voltage and low-voltage power supplies; the oscilloscopeLeCroy Wave Runner with a
bandwidth of 4 GHz; x-ray tube; fast start detector (FFD); slow control system (temperature, gas
flow, currents and voltages of the high and low voltage power supply).

- 14 -
Figure 2.5: Appearance of the cosmic test setup. Figure 2.6: Diagram of the cosmic test setup.
“Test beam MPD” facility is a complete system of equipment and devices for studying
detectors on the beams of particles(deuterons) from Nuclotron with energy range 1 – 4 GeV/n.
It includes (Fig. 2.7):
– two platforms made of aluminum profile for fixing and adjustment detectors along a beam axis;
– the precision positioning device for movement and turn of the tested detector concerning a beam
axis operated by remote control;
– three proportional chambers (MWPC 1, 2, 3) with 6 coordinate planesfor tracking and definition
of the profile of the beam with an accuracy of determination of coordinate about 1 mm;
– five scintillation counters for trigger and to determine the intensity of the beam;
– gas system consisting of two independent control panels, allowing to prepare the gas mixture to
blowing various gas-filled detectors with different gas mixtures (MRPC, GEM, DC etc.);
– data acquisition system (DAQ) based on the standard VME and Ethernet, allowing to control
operation of the detector "on-line", as well as to record data files for further processing.
The beam room and control room are provided with temperature stabilization system.
Figure 2.7: General view of the “Test beam MPD” setup during working in the 51 Nuclotron run.
Scint.
coucnte
r
MWPC 1 MWPC 2 Positioning
device Fast start
detector
Tested
detector
- 15 -
2.4 Test results
Detectors were tested on deuteron beam of the Nuclotron with energy of 3.5 GeV/nucleon.
The start signal to define the time of flight was generated by the fast Cherenkov detector with
micro-channel photomultiplier Photonis Planacon XP85012Q. The time resolution of the “start”
detector is about 37 ps [10].
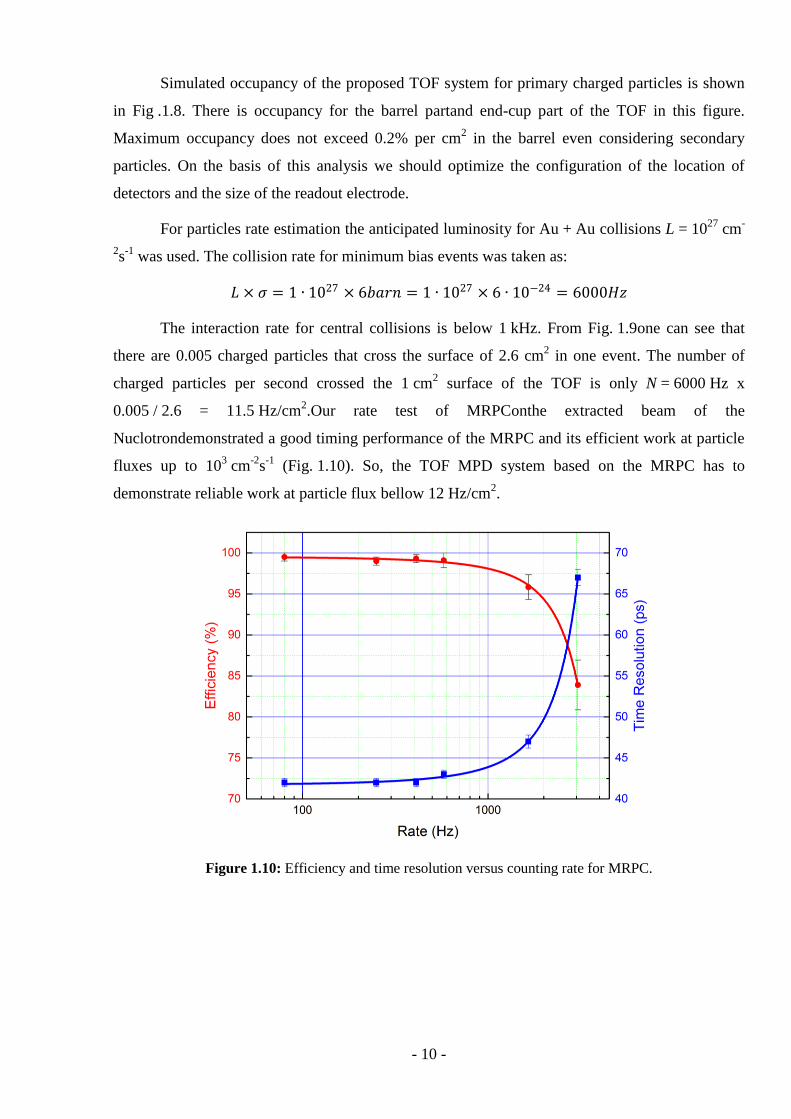
The total time resolution of the system FFD-Pad MRPC was approximately 70 ps
(Fig. 2.8). Thus, the time resolution of the pad MRPC prototype was in the region of 60 ps
(including the "jitter" of electronics) the with particle detection efficiency of about 99% (Fig. 2.9).
Figure 2.8: The distribution of the difference
between the start detector and the "pad" MRPC.
Figure 2.9: Efficiency and time resolution of the "pad"
MRPC in dependence of high voltage.
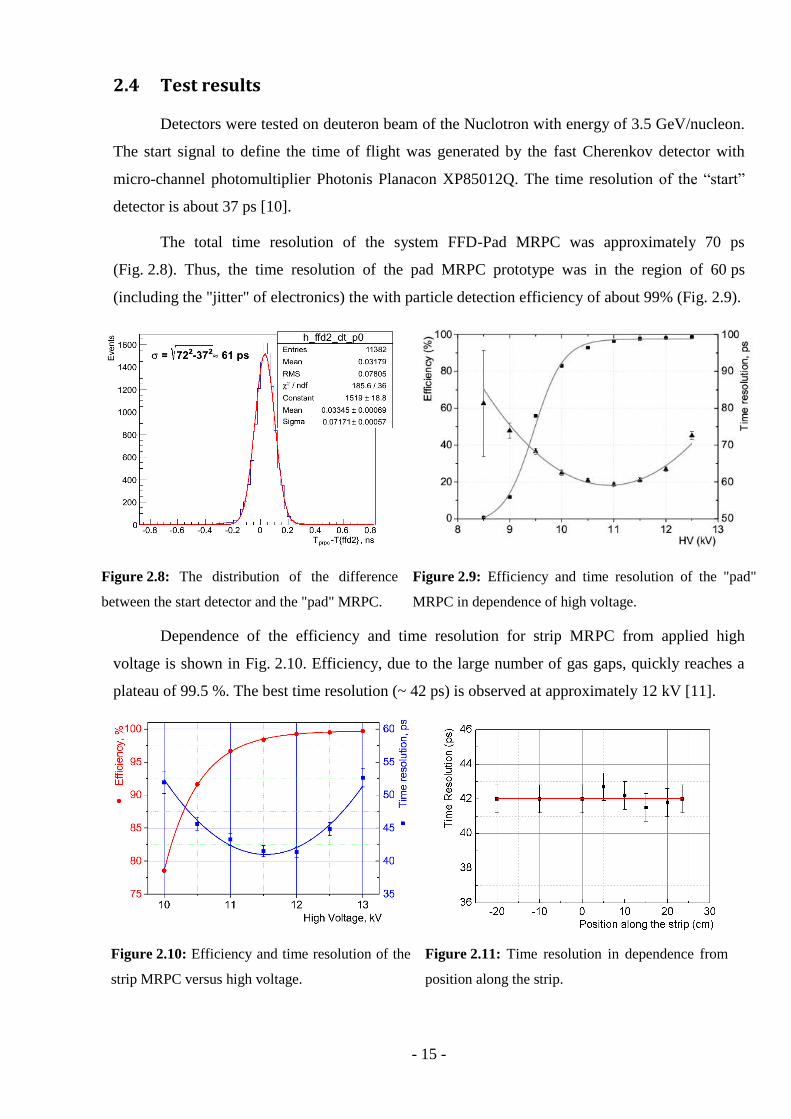
Dependence of the efficiency and time resolution for strip MRPC from applied high
voltage is shown in Fig. 2.10. Efficiency, due to the large number of gas gaps, quickly reaches a
plateau of 99.5 %. The best time resolution (~ 42 ps) is observed at approximately 12 kV [11].
Figure 2.10: Efficiency and time resolution of the
strip MRPC versus high voltage.
Figure 2.11: Time resolution in dependence from
position along the strip.

- 16 -
Upon further increasing of the high voltage the number of streamers rises sharply and the
resolution degrades. The time resolution of the detector does not change due the position of the
particles tracks along the strip (Fig. 2.11). All time resolution results include jitter of electronics
which is about 20ps.
Particles crosses detector at different angles in a real experiment. Angle between the
particle tracks and the plane of the detector can reach 60 degrees on the edge of the barrel.
Measurements of parameters of the detector from the angle of passing of particles were made
(Fig. 2.12). The efficiency not changes at angles from 0 to 60 degrees. The time resolution varies
slightly, but overall <55 ps. The cluster size goes up with increasing of angle. Increasing of strip
multiplicity determine by two factors. First factor is distribution of the charge for a few strips.
Second factor is increase of projection of track along the detector.
Figure 2.12:Time resolution in dependence of MRPC rotation in surface YZ (across the strip).
2.5 Study of rate capabilities of a MRPC
In order to use MRPCs in endcap TOF one need to keep in mind high multiplicity of
particles (up to 2000 particles/(cm2·s)) expected in the regions close to the beam axis for the
peripheral events. It is known that MRPC made of ordinary glass with thickness of 400 microns
are effective at particles rates up to 1 kHz/cm2. Therefore it is necessary to have detectors
operating at high particles intensities. Two case of solving the problem were chosen: reducing the
thickness of the glass[12] and reducing its conductivity.
High rate MRPCs made of low-resistance "Chinese" glass were tested on the beam of high
intensity in the 47 run of Nuclotron with a group of physicists from the Tsinghua University
(Beijing, China). Prototype with a low resistance glass showed excellent rate capability, as

- 17 -
expected. Its efficiency was higher than 90 % at particles rates up to 100 kHz/cm2. At the same
time resolution was better than 80 ps. The time resolution of this MRPC reached 52 ps (Fig. 2.13)
at low fluxes of particles [13].
The high rate test of MRPC made on thin float glass took place during the 50 run of
Nuclotron. Two prototypes of MRPCs were tested. Both MRPCs have identical construction but
first of them made on glass with thicknes 270 mkm, and second prototype made on glass with
thicknes 400 mkm. Degradation of efficiency and time resolution are showed on Fig.2.14.
Prototypes with different thin ordinary glass could be used in area where the particle flux will be
less than 2 kHz/cm2.
Figure 2.13: Efficiency and time resolution of
MRPC with low-resistance glass from the beam
intensity.
Figure 2.14: Efficiencies and time resolution of
MRPCs with different glasses from the beam
intensity.

- 18 -
3 The TOF Detector Design
3.1 Detail layout of the MRPC for the MPD time-of-flight system.
After analyzing the results of the prototypes testing we have fixed the design and geometry
of the MRPC for the TOF barrel. It will be triple stack MRPC with strip readout.
Figure 3.1: Sectional view of the proposed triple stack MRPC with strip readout for TOF MPD.
A scheme of the MPD TOF detector is presented in Fig. 3.1. The detector consists of three
stacks of 5 gas gaps each. As resistive electrodes we use common float glass. The outer glass
electrodes have the thickness of 0.4 mm. The internal glass electrodes have the thickness of 0.270
mm. The fishing line as a spacer defines the 200 μm gap between the all resistive electrodes. The
outer part of external glass electrodes is covered by the conductive paint with surface resistivity
about 2 – 10 MΩ/ to apply high voltage. All internal glasses are floating. The pickup electrodes
look like strips and made at the inner layer of the PCB (Fig. 3.2). It is necessary for better
electrical isolation of strips from high voltage layer.
An important feature of the triple-stack “strip” prototype is that readout strips are located
only inside of the detector. Outer PCBs are not metalized. This ensures the symmetry between two
strips, and provides the equal speed of signals on the anode and cathode strips and as a result
prevents the dispersion of the signal.

- 19 -
Figure 3.2: PCB board with 10 mm wide strips.
Dimension of active area of one MRPC is 300 x 640 mm2. It has 24 readout strips, 10 mm
wide and 640 mm long. To reduce crosstalk, the gap between strips is 2.5 mm. Thus the pitch of
electrodes in this case is 12.5 mm. The active surface of one strip is about 80 cm2. Mean
occupancy for this area (see Fig. 1.8)should not exceed 15 % for central Au-Au collisions with
energy 𝑆𝑁𝑁 = 11GeV.
The differential analog signal is transferred from the PCB by the twisted pair cable to
front-end electronics. The signal is read out from both ends of the strip. It provides better time
resolution and determination of the coordinate of a particle along the strip. For stiffening structure,
we glue aramid fiber honeycomb panel with the thickness of 5 mm on the outer part of the
external PCBs. The first prototypes of MRPCs (Fig. 3.3) for the TOF MPD already assembled and
tested.

- 20 -
Figure 3.3:First assembled MRPCs for the MPD TOF system.
3.2 Mechanical design of the TOF barrel
Figure 3.4: Main sizes of the TOF barrel in φ direction.
The cylindrical part of the TOF MPD is located in the barrel between the time-projection
chamber (TPC) and the electromagnetic calorimeter (ECal). The TOF barrel internal radiusis
about 1.5 m from the beam axis and outer radius is 1.7 m (Fig. 3.4).The active surface of the barrel
part of the MPD ToF covers the pseudorapidity range|η| ≤ 1.4and ~ 330° in φ angle. The total
surface of the barrel TOF system is about 52 m2.The TOF detector system is organized in a
modular way in order to minimize the number of components and cost.
The detector is segmented in φ direction into 14sectors of ~5.9 m length.The maximum
distance between two sector boxes does not exceed 5 mm. Each sector carries two individual
modules. The special shape of module minimizes the dead area inside the sector. The dead area
between sectors is due to the limited space along the radius of barrel. This fact does not allow
putting modules with overlap azimuthally dire.Wide gaps in the horizontal plane are required for
support structures for mounting the TPC.

- 21 -
Figure 3.5:Arrangement of MRPCsinside the gas box along the beam direction.
Each TOF module consists of a two separate volumes. The inner region is filled of the gas
mixture and contains 10 MRPCs. The outer one contains the Front End Electronic (FEE) cards,
cables, high voltage and gas plugs. The both boxes are made of the aluminum profile and
honeycomb 5 mm thick. The same honeycomb panel with thickness of 10 mm is located between
inner and outer volumes. It has special holes for the Interface Card (IC), which provides
connection of signals from MRPCs to preamplifiers. Holes for gas connectors and the HV
connectors are also provided at this panel. MRPCs are arranged inside the box as shown in Fig.
3.5. Special aluminum fixators (Fig. 3.6) are used to set detectors to the desired position.
Figure 3.6:Fixing of MRPCsinside the gas box using special elements.
Adjacent MRPCs will be positioned inside the module in such a way as to create an
overlap of 1-2 readout strips between two adjacent MRPCs, at the edge of the active area: this will
ensure the inter-calibration of the MRPCs via tracks traversing both of them. The signals from the
pick-up strips on the MRPCs are brought to the front-end electronics (FEE) via the Interface
Cards. TheICs are made of small PCBs and will be glued and fixed to the top cover of the box
closing the gas volume in this way. Each IC will have on one side the connectors facing the
MRPC, and the connectors for the FEEson the other side. To add safety to the system the
perimeter of the IC is poured with epoxy adhesive.

- 22 -
Figure 3.7: Layout of FEE, cables and connectors inside the module.
The volume containing front-end electronics and cables is enclosed within asame
aluminum honeycomb cover like for the gas volume. Cables taking the signals from the FEE, LV
cables, gas tubes and slow control buses will be routed through the center of the module to its
outer ends (Fig 3.7). Then they will come out from the external sides of the sector and pass
through special holes in the yoke. Total surface of one hole is about 690 cm2. Crates with readout
TDCs planned to mount directly on the MPD magnet yoke (Fig 3.8) opposite both ends of the
barrel TOF. The space about 30 cm2(< 5% of total size) is enough in each hole in the yoke for all
cables, tubes.Signal cables with a diameter ~13 mm require the most space (~23 cm2) for output.
Figure 3.8:Crates with readout electronics are mounted on the magnet yoke.

- 23 -
Main parameters of the TOF system parts are listed in Table 3.1. Calculated total sensitive
area of the TOF system is about 51.8 m2. The inner radius of the barrel is about 1.5 m. The total
area of a barrel with this inner radius and length of 5.9 m is about 55 m2. It means estimated
geometrical efficiency shall be about 94%.
Table 3.1Main parameters of the TOF system.
Number of
detectors
Number of
readout strips
Sensitive
area, m2
Number of
FEE cards
Number of
FEE channels
MRPC 1 24 0.2 2 48
Module 10 240 1.85 20 480
Sector 20 480 3.7 40 960
Barrel 280 6720 51.8 560 13440
(1680 chips)
3.3 The occupancy andgeometric efficiency of the TOF system.
Figure 3.9: The TOF detector layout in the MPDROOT framework.
Monte Carlo simulationshave been performed using the MPDROOT framework based on
theCERN ROOT software. The MPDROOT framework has interfaces to several event generators
(UrQMD, QGSM, HIJING, etc.) and includes all algorithms for MPD reconstruction and analysis,
thus providing a complete set of instruments to simulate ion-ion collisions.The barrel of the MPD
TOF system is a cylinder covering the region of polar angles|θ – 90°| < 63° (|η| < 1.4). The
structure of the TOF, the inner structure of each module and MRPC detectors have been described
in the GEANT 4 package. All simulations have been done for geometry presented in the previous
chapter.The three-dimensional model of the TOF is shown inFig. 3.9.

- 24 -
Figure 3.10:Average (by φangle) occupancy along
Z direction( 𝑆𝑁𝑁 = 11 𝐺𝑒𝑉).
Figure 3.11:Distribution of geometric efficiency along
Z directionintegrated over azimuth angle.
Preliminary results of the simulation showed that such geometry of detectors and readout
electrodes satisfies the requirements of the experiment. Maximum occupancy at maximum energy
of collision 𝑆𝑁𝑁 = 11 𝐺𝑒𝑉 is less than 15% (Fig. 3.10). One can notice a slight increase in
occupancy due to secondary particles arriving to the TOF from the TPC readout chambers.
Obviously, there are inactive areas at the junctions of TOF sectors. In Fig. 3.11 the TOF
geometric efficiency is shown in direction along the beam direction which is approximately 94%.
3.4 Acceptance estimation and track matching.
Pt versus rapidity distributions of the primary hadrons reaching the TOF barrel are
presented on Fig. 3.12. The events were simulated by QGSM at energy 𝑆𝑁𝑁 = 5 GeV and
11 GeV. The produced particles were traced with the GEANT at the magnetic field B = 0.5 T,
particle decays are also taken into account. The distributions are for theregion |η| < 1.4. Different
empty regions for pions, kaons and protons are due to magnetic field and polar angle acceptance.
Procedure of matching tracks with hits in the TOF system is to find the appropriate
timestamp for each of the TPC tracks. For a given TPC track, we have then a set of TOF strips and
TOF dead regions crossed by the probe tracks. For each TOF element (sensitive region or dead
region) a weight is defined as the sum of the weighting contributions from all the probe tracks that
cross it. The element with the largest weight is chosen to be the match for the TPC track.
Given N tracks matched withthe TOF system, these are subdivided into two sets:
mismatched tracks, Nmis, and well matched ones,Nmatch, with N = Nmis+Nmatch.For the well matched
tracks, to which a time-of-flight can be unambiguously attributed, one candistinguish between
those matched with true time, Nt, and those matched with wrong time, Nw, withNmatch = Nt + Nw.
The wrong time assignment corresponds to the matching of the extrapolated track with a strip fired
by another particle. The matching procedure can be evaluated in terms of efficiency and
contamination. These are definedas follows:efficiency = Nt/N, contamination = Nw/Nmatch.

- 25 -
Figure 3.12: MPD TOF phase-space for charged hadrons for 𝑆𝑁𝑁 =5 GeV (left) and 𝑆𝑁𝑁 =11 GeV. From
top to bottom: pions, kaons and protons. (1000 QGSM central events, B = 0.5 T).

- 26 -
Figure 3.13:The momentum dependence of the efficiency and contamination of the TPCtrack matching
with TOF hits for all primary charged particles ( 𝑆𝑁𝑁 = 5 GeV (left) and 11 GeV (right), B = 0.5T).
Figure 3.14: The efficiency and contamination of the TPC–TOF matching for all primary charged particles in
dependence from the pseudorapidity( 𝑆𝑁𝑁 = 5 GeV (left) and 11 GeV (right), B = 0.5T).
Table 3.2: Particles losses in the region |η|<1.4for central Au-Au collision with 𝑆𝑁𝑁 =5 GeV.
Mean number of primary particles in
one central collision:
π±
K±
p
Produced in 4π 410.2 24.3 152.3
Produced in pseudorapidity |η| < 1.4 306.4 1.0 18.4 1.0 90.0 1.0
Registered in TOF (looses due to field
B = 0.5 T, decay and interactions,
geometry and registration efficiency)
201.8 0.66 8.8 0.48 72.3 0.80
Matched with tracks 186.2 0.61 8.4 0.46 66.3 0.74
Table 3.3: Particles losses in the region |η|<1.4 for central Au-Au collision with 𝑆𝑁𝑁 =11 GeV.
Mean number of primary particles in
one central collision:
π±
K±
P
Produced in 4π 829.1 58.7 153.1
Produced in pseudorapidity |η| < 1.4 502.1 1.0 31.3 1.0 39.2 1.0
Registered in TOF (looses due to field
B = 0.5 T, decay and interactions,
geometry and registration efficiency,)
330.0 0.66 15.1 0.48 30.9 0.81
Matched with tracks 303.1 0.60 14.4 0.46 27.8 0.74

- 27 -
The momentum dependence of matching results for different energy of ion collision is
presented in Fig. 3.13.The pseudorapidity dependence of matching results for different energy of
ion collision is presented in Fig. 3.14. In Tables 3.2 and 3.3are summarized the absolute numbers
and the fractions of different particle specie (per event) registered by the TOF detector and
matched with TPC tracks.
3.5 Time-of-Flight particles identification performance
Particle's mass can be calculated using the information about the reconstructed momentum,
track length and time-of-flight from the collision vertex to the TOF hit. Detector response was
simulated in accordance with the processes taking place inside the TOF-module when a charged
particle passing through it, the overall time resolution of the TOF system (including the resolution
of the start counter) was estimated to be below 100 ps.In Fig. 3.15 an example of mass separation
capabilities of the TOF MPD system is presented. The green lines show a suggested way to select
particles, i.e. particles of given type which get outside of the boundary were counted as a loss of
efficiency while those in other area are counted as a contamination. The MPD PID performance
can be considerable enhanced using a combination of ionization loss (dE/dx) from TPC and time-
of-flight measurements. An example PID plot for the momentum interval of 0.5 < p < 1.0 GeV/c is
shown in Fig. 3.16.
As the results of simulation demonstrate for a typical track length of about 1.6 m the
pion/kaon separation will be achieved up to the total momentum of 1.5 GeV/c; one can select
protons from other species up to p = 3 GeV/c.
Figure 3.15: Mass separation with MPD TOF
(100 ps resolution). The green lines show
boundaries for efficiency and contamination
estimation.
Figure 3.16: Combined dE/dx and TOF particles
identification for 0.5 < p < 1 GeV/c region.
- 28 -
3.6 Front-end electronics and data acquisition system
A very important part of the high performance time-of-flight system is readout electronics.
For the full exploitation of the excellent timing properties of the Multigap Resistive Plate
Chamber, front-end electronics with special characteristics is needed. The signals from MRPCs
must be amplified and discriminated as fast as possible without lossless.
Leading and trailing timesof the discriminated signal must be digitized and measured with
accuracy much better than the time resolution of the detector. Readout electronics for the MPD-
TOF will consist of the front-end electronics (FEE) and data acquisition system (DAQ).
3.6.1 Preamplifiers for the TOF MRPC
For the front-end electronics we decided to use electronics like used in the TOF ALICE.
Such electronics is very convenient for our TOF system. Since each detector has a 24 strip it was
decided to create a 24-channel amplifier on the example of the front-end board of the TOF ALICE
based on the NINO ASIC.
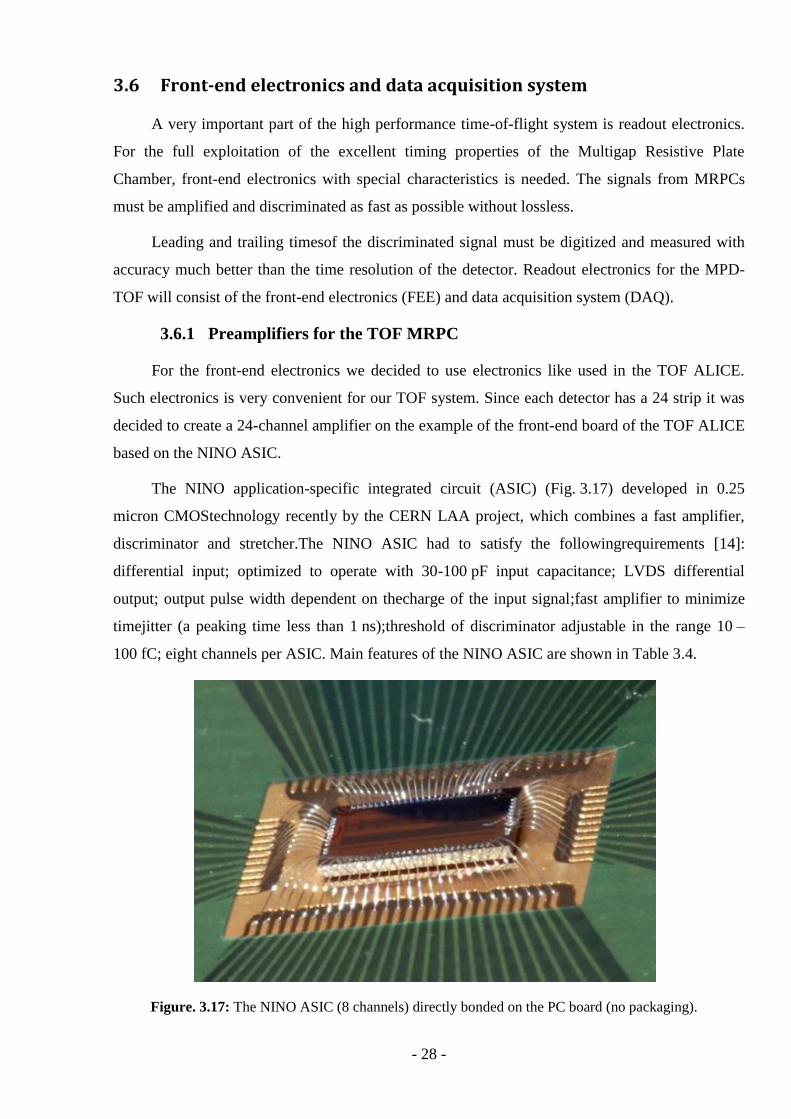
The NINO application-specific integrated circuit (ASIC) (Fig. 3.17) developed in 0.25
micron CMOStechnology recently by the CERN LAA project, which combines a fast amplifier,
discriminator and stretcher.The NINO ASIC had to satisfy the followingrequirements [14]:
differential input; optimized to operate with 30-100 pF input capacitance; LVDS differential
output; output pulse width dependent on thecharge of the input signal;fast amplifier to minimize
timejitter (a peaking time less than 1 ns);threshold of discriminator adjustable in the range 10 –
100 fC; eight channels per ASIC. Main features of the NINO ASIC are shown in Table 3.4.
Figure. 3.17: The NINO ASIC (8 channels) directly bonded on the PC board (no packaging).

- 29 -
Table 3.4:NINO ASIC specifications table.
Parameter Value
Number of channels 8
Peaking time 1 ns
Supply voltage 2.5 V
Power consumption 27 mW/ch
Input signal range 30 fC – 2 pC
Noise (with detector) < (2.5 – 5)×103 e- rms
Discriminator threshold 10 fC to 100 fC
Differential input impedance 40 Ω < Zin< 75 Ω
Timing precision <10ps jitter
Outputs LVDS
Figure 3.18: Block diagram of the NINO ASIC.
A block diagram of the NINO is shown in Fig. 3.18. The input stage is followed by 4stages
of low-gain, high-bandwidth differential amplifier (G=6, BW=500Mhz). A slow feedback circuit
supplies currentto ensure that the input stages remain correctlybiased. In addition, an offset is
added at this pointthat acts as a threshold adjustment. There is astretcher just before the LVDS
output driver. Thepulse width before stretching varies between 2 nsand 7ns; the digitizing
electronics based on the HPTDC chip [15] that will be used in the data acquisition system of the
TOF MPD can only measure both leading and trailingedges of an input pulse for widths greater
than 10 ns; thus the pulse stretcher will increase the pulse width by 10 ns.
- 30 -
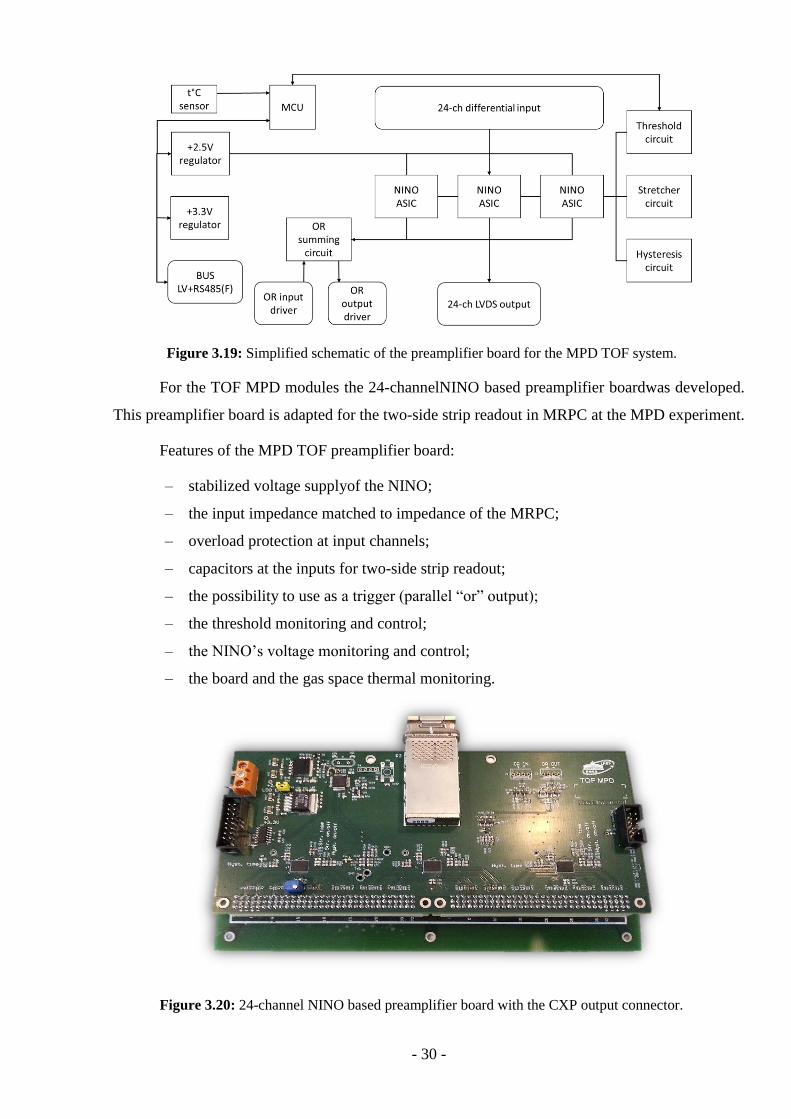
Figure 3.19: Simplified schematic of the preamplifier board for the MPD TOF system.
For the TOF MPD modules the 24-channelNINO based preamplifier boardwas developed.
This preamplifier board is adapted for the two-side strip readout in MRPC at the MPD experiment.
Features of the MPD TOF preamplifier board:
– stabilized voltage supplyof the NINO;
– the input impedance matched to impedance of the MRPC;
– overload protection at input channels;
– capacitors at the inputs for two-side strip readout;
– the possibility to use as a trigger (parallel “or” output);
– the threshold monitoring and control;
– the NINO’s voltage monitoring and control;
– the board and the gas space thermal monitoring.
Figure 3.20: 24-channel NINO based preamplifier board with the CXP output connector.

- 31 -
Block-scheme of the front-end board presented in Fig. 3.19. Preamplifier board supplies by
+5 V DC via connected bus, then regulating to +2.5 V DC for amplifiers and to +3.3 V DC for
microcontroller. STM8L152C8T6 is used to control +2.5 V regulator, threshold and temperature
acquisition from the board and the gas space. The threshold default value is 165 mV around base
line 1.25 V. Two DIN 41612 96abc (3 x 32) connectors as inputs and CXP connector as output
(Fig. 3.20, 3.22). There is OR logic circuit which links all NINO and could be used as trigger. The
stretcher and the hysteresis circuits adjusted to +1.25 V.Each input channel terminated to the
ground through 1 MΩ resistor. It allows changing the preamplifier when the high voltage applied
on the detector. Also, capacitively coupled by 1 nF capacitor. Differential pairs input impedance
designed to match to the impedance of the MRPC readout strip (55Ω) to minimize signal
reflection and crosstalk. The output preamplifier signal is in the LVDS standard. Overall
dimensions of the preamplifier are 196.5 x 89 mm2. Measured jitter between two channels of the
amplifier is about 7 ps (Fig. 3.21).
Figure 3.21: The time distribution between two channels of the NINO FE board measured using the
LeCroy 4 GHz oscilloscope.

- 32 -
Figure. 3.22: View of the Molex CXP Interconnect System.
Fig. 3.23 show the transmitting output signal from the NINO front-end board through the
CXP copper cables. The CXP copper cable assembled by Molex, it has 26 AWG cable size and
provides differential 100 Ω transmission line with good electrical characteristics up to 10m long.
Figure 3.23: LVDS signal after passing through 5 m length Molex CXP copper cable 26 AWG, 10 ns/div.

- 33 -
3.6.2 Preamplifier’s voltage supply
Stable power supply of the amplifiers and their accessories circuits is an important part, as
many parameters depend on it.
We propose the following power supply circuit. +5 V DC power supply organized by
MPOD low voltage source module (iSeg MPV 8016I) and 2 distribution boards (DB) connected
by DC cable (stranded copper conductor with cross-section of 1.5 mm2), then to each DB
connected 20 preamplifiers boards in parallel via 4 buses. Each bus controlled independently.
Input voltage on preamplifier board regulated to +2.5V DC (MIC37301-2.5WR) and +3.3V DC
(MIC37301-3.3WR). To compensate the voltage drop on the cables the MPOD LV source has
sense pins. Total current for each channel is about 2.1 A.
This scheme tested in laboratory (Fig. 3.24). Each amplifier consumes about 0.42 Amps.
Figure 3.24: Testing of the power supply and slow control system on five preamps connected in parallel.
3.6.3 Preamplifier’s control
It is necessary to control the voltage of chips and external circuits of adjustment such as
stretch stage and voltage on threshold stage to achieve precise results and efficiency.
Control of the preamplifiers boards is provided by Slow-Control System which include
from one side software based on TANGO toolkit and QT SDK, and other side hardware, which
includes analog-digital and digital-analog converters in microcontroller (STM8L152C8T6), which
installed in all FEE boards to monitor and manage voltage.Communication with the FEE boards is
based on RS-485 full-duplex interface via bus and then via Ethernet by the serial port sever
(MOXA NPort IA-5250).It provides access to devices from any authorized client via Internet
connection.

- 34 -
Figure 3.24: Powering Preampilfier board and connection scheme.
20 FEE boards are connected in parallel by the 20 pins twisted-pair cable to one
distribution board (Fig. 3.24), where the power channels from the LV source and the signal lines
are distributed to the buses. To each bus connected four FEE boards where the MAX3070E
transceiver installed. These transceivers communicate with serial port server (MOXA NPort IA-
5250) via RS-485 interface then serial port server via the Ethernet with PC. Monitoring and
control interface are available via the Internet simply using a special developed client’s application
with graphical user interface (Fig. 3.25).
Figure 3.25: Slow control GUI clients(left side for FEE, right LV source).

- 35 -
3.6.4 Time-Over-Threshold method
The signal amplitude must be taken into account in time measurements. The time-
amplitude correction can significantly improve the time resolution. The NINO pulse width is
somewhat dependent on the MRPC pulse height. Thus the integral of the pulse (charge) can be
obtained by measuring the pulse width. Time correction using the LVDS pulse width is called the
“Time-Over-Threshold” method [14]. Because this method requires only time information it can
simplify and reduce the cost of readout electronics.
The dependence of thewidth of the LVDSpulseon the charge at the input of the
NINOpreamplifier is shown in Fig. 3.26. A wide range of width for small amplitudes
allowsmaking corrections more accurate in the areas with the highest jitter of the input signal. An
example of the correction curve for the strip readout MRPC is shown in Fig. 3.27. This correction
improves the time resolution of the detector is almost twice.
Figure 3.26:Charge dependence of the width of the
output LVDS impulse from NINO preamplifier.
Figure 3.27: Example of the “time-over-threshold”
curve with the time-width distribution.
3.6.5 Time-to-digital converter TDC72VHL
Figure 3.28:Time-to-digital converter TDC72VHL
with the CXP input connector.
Figure 3.29: Electronics for the data acquisition
system in the VME rack.
- 36 -
New VME64x time-to-digital converter TDC72VHL (Fig. 3.28) based on HPTDC chip
was designed for MPD TOF readout. It is used for digitizing LVDS signals coming from the
output of the NINO amplifier. One VME module has 72 differential inputs (100 Ω) and produced
with the same type of connectors as on the preamplifier. Three amplifiers can be connected to one
such module. Time-sampling of the TDC72VHL is 24.4 ps per bin. The TDC72VHL provides the
ability of the precise “White Rabbit” [15] synchronization with other timing devices and can
operate in standalone mode.One VME rack can hold up to 18 of the TDC72VHL (Fig. 3.29). The
total amount of the TDC for the TOF MPD is 196 (14 modules per each of 14 VME crates).
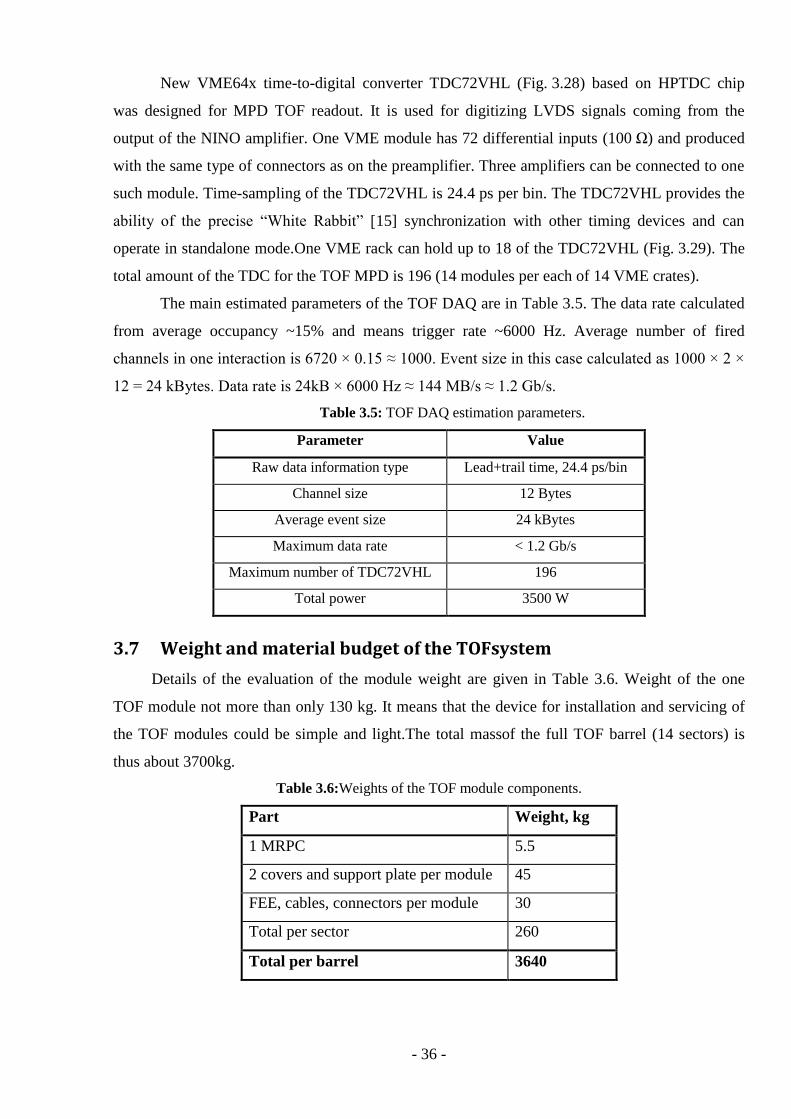
The main estimated parameters of the TOF DAQ are in Table 3.5. The data rate calculated
from average occupancy ~15% and means trigger rate ~6000 Hz. Average number of fired
channels in one interaction is 6720 × 0.15 ≈ 1000. Event size in this case calculated as 1000 × 2 ×
12 = 24 kBytes. Data rate is 24kB × 6000 Hz ≈ 144 MB/s ≈ 1.2 Gb/s.
Table 3.5: TOF DAQ estimation parameters.
Parameter Value
Raw data information type Lead+trail time, 24.4 ps/bin
Channel size 12 Bytes
Average event size 24 kBytes
Maximum data rate < 1.2 Gb/s
Maximum number of TDC72VHL 196
Total power 3500 W
3.7 Weight and material budget of the TOFsystem
Details of the evaluation of the module weight are given in Table 3.6. Weight of the one
TOF module not more than only 130 kg. It means that the device for installation and servicing of
the TOF modules could be simple and light.The total massof the full TOF barrel (14 sectors) is
thus about 3700kg.
Table 3.6:Weights of the TOF module components.
Part Weight, kg
1 MRPC 5.5
2 covers and support plate per module 45
FEE, cables, connectors per module 30
Total per sector 260
Total per barrel 3640
- 37 -
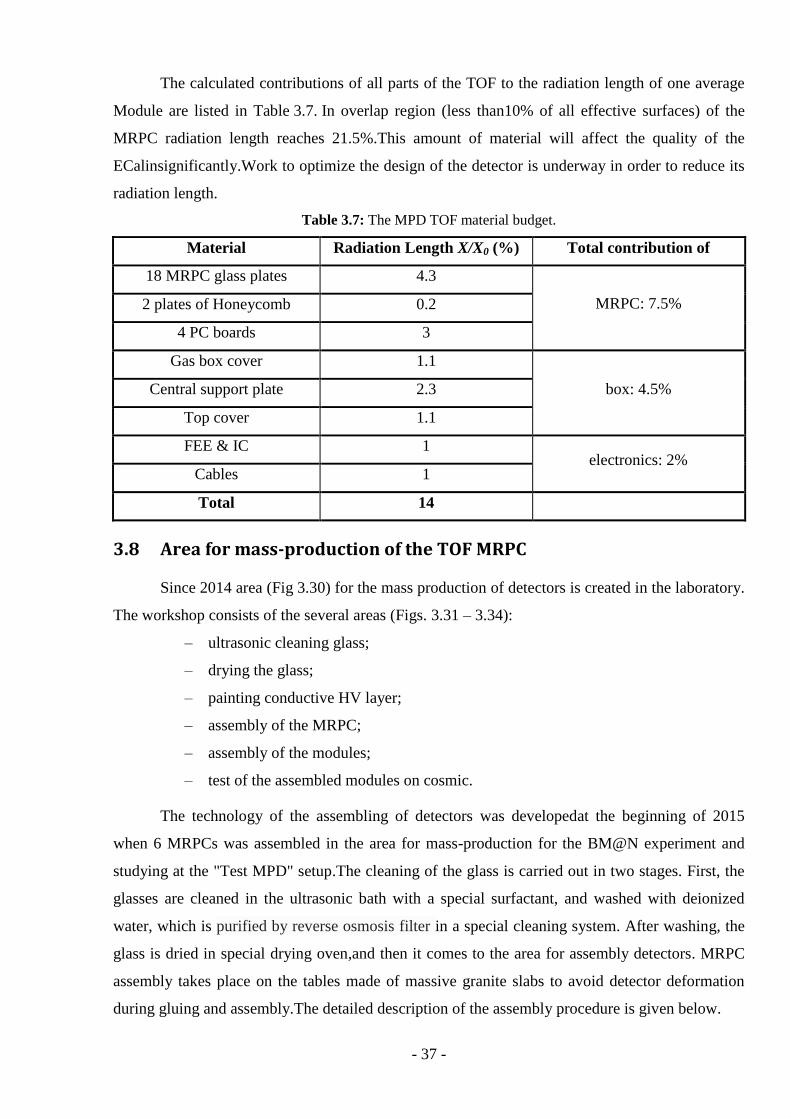
The calculated contributions of all parts of the TOF to the radiation length of one average
Module are listed in Table 3.7. In overlap region (less than10% of all effective surfaces) of the
MRPC radiation length reaches 21.5%.This amount of material will affect the quality of the
ECalinsignificantly.Work to optimize the design of the detector is underway in order to reduce its
radiation length.
Table 3.7: The MPD TOF material budget.
Material Radiation Length X/X0 (%) Total contribution of
18 MRPC glass plates 4.3
MRPC: 7.5% 2 plates of Honeycomb 0.2
4 PC boards 3
Gas box cover 1.1
box: 4.5% Central support plate 2.3
Top cover 1.1
FEE & IC 1 electronics: 2%
Cables 1
Total 14
3.8 Area for mass-production of the TOF MRPC
Since 2014 area (Fig 3.30) for the mass production of detectors is created in the laboratory.
The workshop consists of the several areas (Figs. 3.31 – 3.34):
– ultrasonic cleaning glass;
– drying the glass;
– painting conductive HV layer;
– assembly of the MRPC;
– assembly of the modules;
– test of the assembled modules on cosmic.
The technology of the assembling of detectors was developedat the beginning of 2015
when 6 MRPCs was assembled in the area for mass-production for the BM@N experiment and
studying at the "Test MPD" setup.The cleaning of the glass is carried out in two stages. First, the
glasses are cleaned in the ultrasonic bath with a special surfactant, and washed with deionized
water, which is purified by reverse osmosis filter in a special cleaning system. After washing, the
glass is dried in special drying oven,and then it comes to the area for assembly detectors. MRPC
assembly takes place on the tables made of massive granite slabs to avoid detector deformation
during gluing and assembly.The detailed description of the assembly procedure is given below.

- 38 -
Figure 3.30: Scheme of the MRPC mass production workshop.
Figure 3.31:The area of ultrasonic cleaning glass. Figure 3.32:Painting of the conductive HV layer.
Figure 3.33:Detectors assembling in the clean room. Figure 3.34: Module assembling procedure.

- 39 -
3.9 Step-by-step MRPC assembling procedure
Materials for the assembly of the MRPC are commercially available. The list of materials
to produce one detector is shown in Table 3.8. The assembly procedure is presented graphically in
Fig. 3.35.
Table 3.8: Components and materials for the production of one MRPC detector.
Name of material or component Dimensions Quantity
Aramide honeycomb panel with 0.5 mm 640x300x5 mm3 2 pcs
Fiberglass PCB with strips (inner) 645x330x2 mm3 2 pcs
Fiberglass PCB without strips (outer) 645x330x2 mm3 2 pcs
Float glass (inner)
(outer)
640x300x0.27 mm3
640x300x0.4 mm3
12pcs
6 pcs
Monofilament fishing line 0.2 mm 100 meters
PET screwswith nuts M5 x 20 mm 40 pcs
Mylar sheets 640x300x0.1 mm3 6 pcs
Kapton adhesive tape 10 mm width 10 m
Copper adhesive tape 10 mm width 10 cm
Double-sided adhesive tape 20-30 mm width 10 cm
Special conductive paint - 100 ml
Twisted pair cable 3M (16 pairs) 0.25 m 6 pcs
Teflon coated wire 0.35 mm2 2 m
Figure. 3.35: The sequence of operations of the MRPC assembly.

- 40 -
There are four main areas (rooms) in the workshop (see Fig. 3.33):
1. Clean rooms for washing and drying glass.
2. Room for applying the conductive paint to the glass.
3. Clean room for the MRPC detectors assembling.
4. Hall for modules assembling and testing.
Procedures to do in the area 1 (washing and drying):
1. The required number of glasses is checked for defects (splits, cracks and dirty) and measured
their thickness.
2. Glasses rinsed ordinary water to wash away particles of glass dust.
3. Container with glasses is placed into the ultrasonic bath with special detergent where the
glasses are washed for 10 minutes at the temperature of about 50 ºC.
4. Glass after cleaning in the ultrasonic bath thoroughly washed under a shower of deionized
water to wash away the detergent residues.
5. Container with washed glasses is placed in a drying oven for 1 hour at the temperature of
70 ºC.
6. Glasses in container after drying are moved from the oven to the closed shelves in the same
room.
7. Container with clean glasses is transferred to the assembly room.
Procedures to do in the area 2 (painting conductive layer):
1. Container with cleaned outer glasses brought to the room for applying conductive layer.
2. Preparation of glass for coating by conductive layer:
2.1. Each glass is taken out from the container and is blown by “ionizer” for preventing the
adhesion of dust.
2.2. Glasses are placed on the painting surface so that the paint consumption was minimal.
2.3. The high-voltage contact is glued on the glass to the side for painting.
2.4. Glass fixed on the edges by adhesive tape (3-5 mm from the edge of the glass).
3. Prepared glasses are placed in a fume hood.
4. The first layer of paint applied on the glassand dried by blow-dryer for 5 minutes.
5. The second layer is applied and also dried for 5 minutes.
6. The glasses are placed in a drying oven for 12 hours at a temperature of 90 °C.
7. Painted and dried glasses removed from the oven.
8. The adhesive tape removed carefully (so as not to damage the edge of the paint and glass).
9. Surface resistance is measured at the 6 – 10 points of the conductive layer. It must be within 5
– 20 MΩ/.
10. Ready-to-assemble glasses transferred to the assembling room.

- 41 -
Procedures to do in the area 3 (MRPC assembling):
1. Honeycomb panels are glued to the PCB:
1.1. In the special place outside the clean room the surface of the honeycomb panel treated
sandpaper and wiped with isopropyl alcohol.
1.2. Clean PCB's are transferred on the granite table for gluing with honeycomb panels.
1.3. The surface of the PCB with strips wiped with isopropyl alcohol.
1.4. Epoxy adhesive applied on the surface of the honeycomb panel.
1.5. Honeycomb panel is pressed to the outer side of the PCB without strips and pressed down
by the load (for example lead bricks).
1.6. The adhesive dries completely within 24 hours.
1.7. Surface is checked for flatness by mechanical method.
1.8. Boards with glued panels are ready for assembly.
2. Preparation of the external PCB for assembling:
2.1. The external PCB with honeycomb panel placed on the granite table.
2.2. The external glasssheet is put to the PCB,the surface painted with the resistive paint
facing the PCB.
2.3. Wire soldered to high voltage contact and insulated by polyimide tape.
2.4. Glass is glued on the edges to the PCB by the 10 mm polyimide (Kapton)adhesive tape.
2.5. Plastic screws are installed to holes at the long edge of the PCB.
2.6. Board isimmovablyfixed to the table.
3. Monofilament diameter of 0.2 mm binds to the first screw.
4. Monofilament is wound on the screws in the form of a triangle.
5. Mylar strips (5 mm width) are glued to the both short edges of the inner thin glass.
6. Inner thin glass (with) placed on the monofilament fishing line.
7. Steps 4 – 6 are repeated until the five layers of monofilament fishing line will lie in the stack.
8. Preparation of theinternal readout electrode:
8.1. Next glass with conductive coating puts conductive paint down on the one PCB of the
internal electrode. The high-voltage contact must be positioned on the PCB so that the
anode and cathode contacts located on the diagonal.
8.2. Wire soldered to inner high voltage contact and insulated by polyimide tape.
8.3. Glass glued around the perimeter of a polyimide tape 10 mm (3-5 mm from the edge).
8.4. The internal electrode is laid glass side down to the 5th layer of the monofilament line of
the first glass stack. Before lying the both surfaces are blown with ionizer.
8.5. The PCB is pressed tightly to the line.
- 42 -
9. Third glass with conductive coating puts conductive paint down on the other side of the
internal electrode in accordance with items 8.2 – 8.4.High voltage contact must be at the same
position that on the other side of the internal electrode.
10. Second stack assembled as the first one in order of 3 – 7.
11. Second internal readout electrode assembled as the first one in order of 8 – 9.
12. Third stack assembled as the first and the second in order of 3 – 7.
13. The upper outer board prepared in accordance with step 2 and placed on the last fishing line
layer in the third stack.
14. The Assembled detector is carefully pressed down by lead brick and stacks fixed by PET nut.
15. The twisted pair cable soldered to each strip (two pairs for one strip).
16. The IDC-32 connector is set on the free end of the cable.
17. The ready detector checked for defects on the special stand.
17.1. Cracks searched by laser.
17.2. Glass plates’ integrity in the assembled MRPC is controlled with video camera.
17.3. The readout differential line checked for the absence of reflections and the quality of the
electrical contacts with generator and oscilloscope.
Procedures to do in the area 4 (the TOF module assembling):
1. The module box is placed on the table.
2. The first detector is fixed to the box in the recess.
3. The remained detectors are stacked and fixed in a box.
4. After the installation of the detectors the lid is fixed above the box.
5. Connect all the connectors inside.
6. Close lid and fix it by screws.
7. Test module on gas tightness.
3.10 Modules installation procedure
The installation procedure is practically identical to the procedure for installing detectors in
the ALICE experiment, as the design of systems is very similar. The main advantage of the MPD
TOF is lightweight construction.Calculation of the mass of the TOF module has shown that the
maximum mass is 150 kg with all accessories. From this we can conclude that for installation and
service of the TOF system does not need a complicated and heavy device. As well structures for
fixation of the module inside the barrel could be lightweight and simple.In this case the following
variant is proposed.
- 43 -
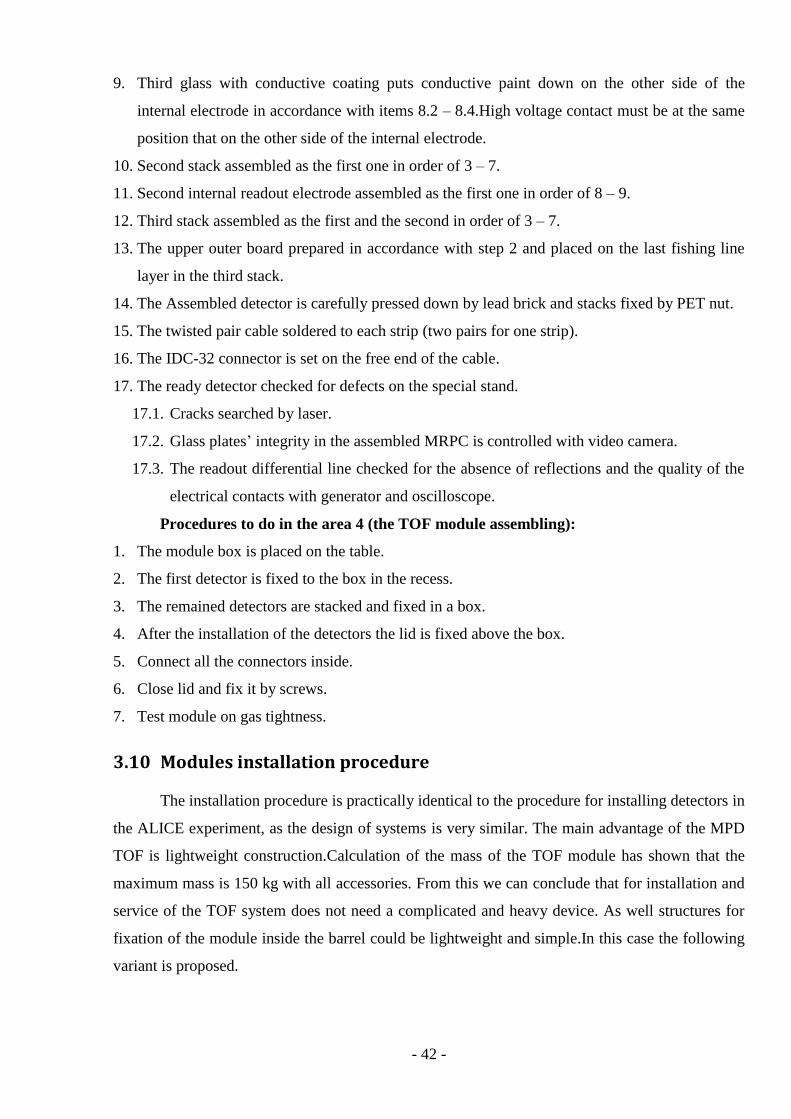
Figure. 3.36: The main support frame with the TOF and the TPC inside the MPD solenoid.
All detectors inside the barrel will mounted to the main support frame (red structure in
Fig. 3.36). The TOF modules located inside each of the 14 sectors will be kept in position by two
rails fixed to the TOF space frame. The TOF space frame is a supporting structure inside the barrel
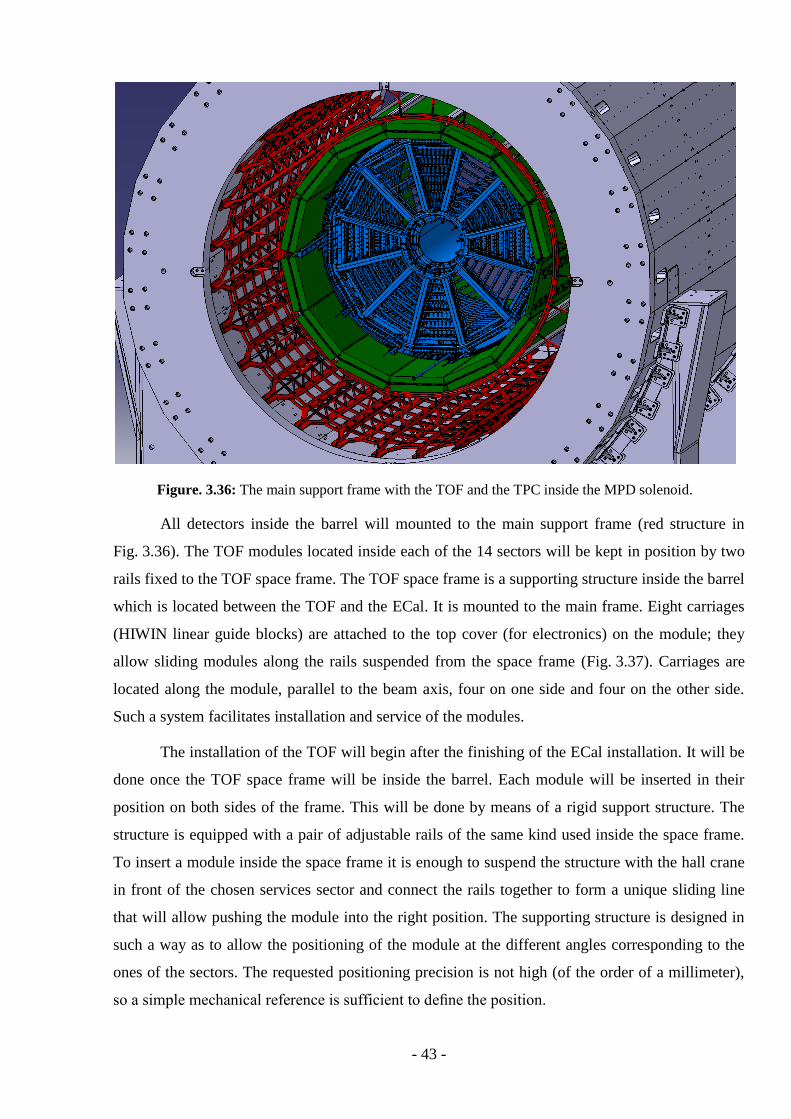
which is located between the TOF and the ECal. It is mounted to the main frame. Eight carriages
(HIWIN linear guide blocks) are attached to the top cover (for electronics) on the module; they
allow sliding modules along the rails suspended from the space frame (Fig. 3.37). Carriages are
located along the module, parallel to the beam axis, four on one side and four on the other side.
Such a system facilitates installation and service of the modules.
The installation of the TOF will begin after the finishing of the ECal installation. It will be
done once the TOF space frame will be inside the barrel. Each module will be inserted in their
position on both sides of the frame. This will be done by means of a rigid support structure. The
structure is equipped with a pair of adjustable rails of the same kind used inside the space frame.
To insert a module inside the space frame it is enough to suspend the structure with the hall crane
in front of the chosen services sector and connect the rails together to form a unique sliding line
that will allow pushing the module into the right position. The supporting structure is designed in
such a way as to allow the positioning of the module at the different angles corresponding to the
ones of the sectors. The requested positioning precision is not high (of the order of a millimeter),
so a simple mechanical reference is sufficient to define the position.
- 44 -
Fig. 3.37:The part of the space frame with detectors on the rails.
- 45 -
4 Service
4.1 Gas system
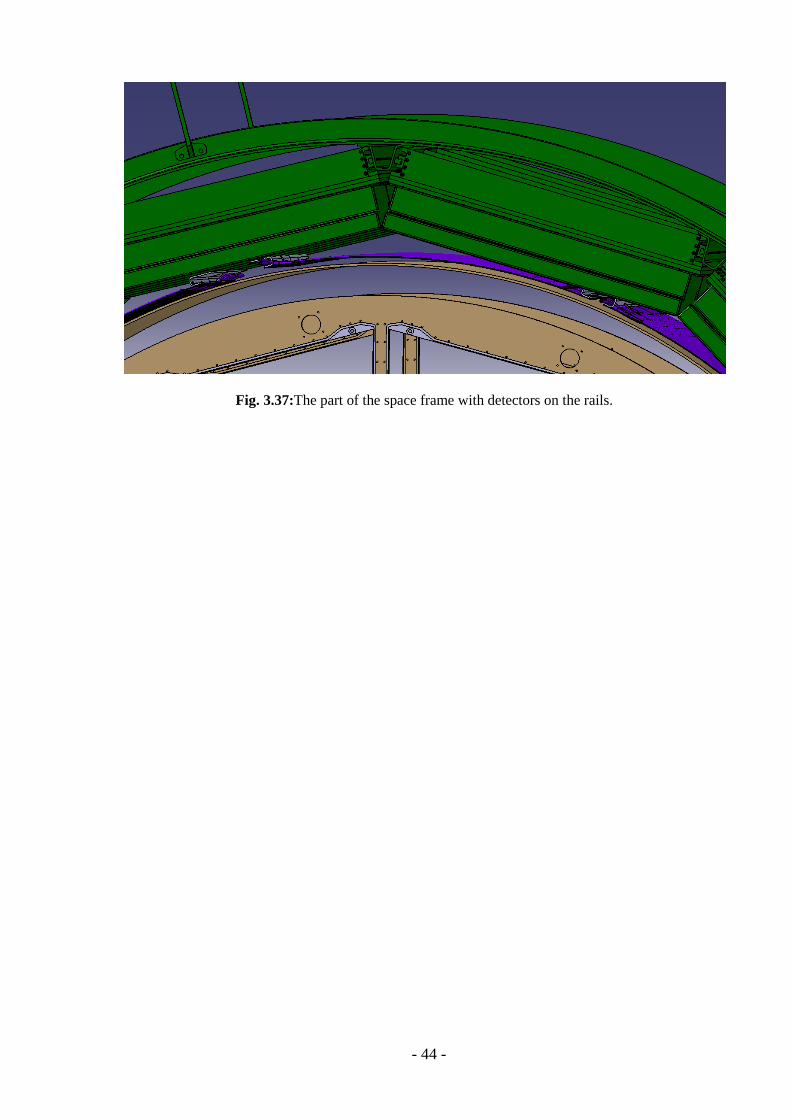
The TOF detectors will be operated with a non-flammable Freon rich gas mixture
containing 90% C2H2F4 + 5% i-C4H10 + 5% SF6. The total gas volume of the barrel is
approximately3000 literstaking into account the volume occupied by detectors. Volumes of all
elements of the TOF system are presented in the Table 4.1.
Table 4.1: Volumes of the elements of the MPD TOF.
Number of
detectors
Gas volume without
MRPC detectors, liters
Gas volume with
detectors, liters
Detector 1 5
Module 10 155 105
Sector 20 310 210
TOF Barrel 280 4340, ~4.3м3 2940, ~3 м
3
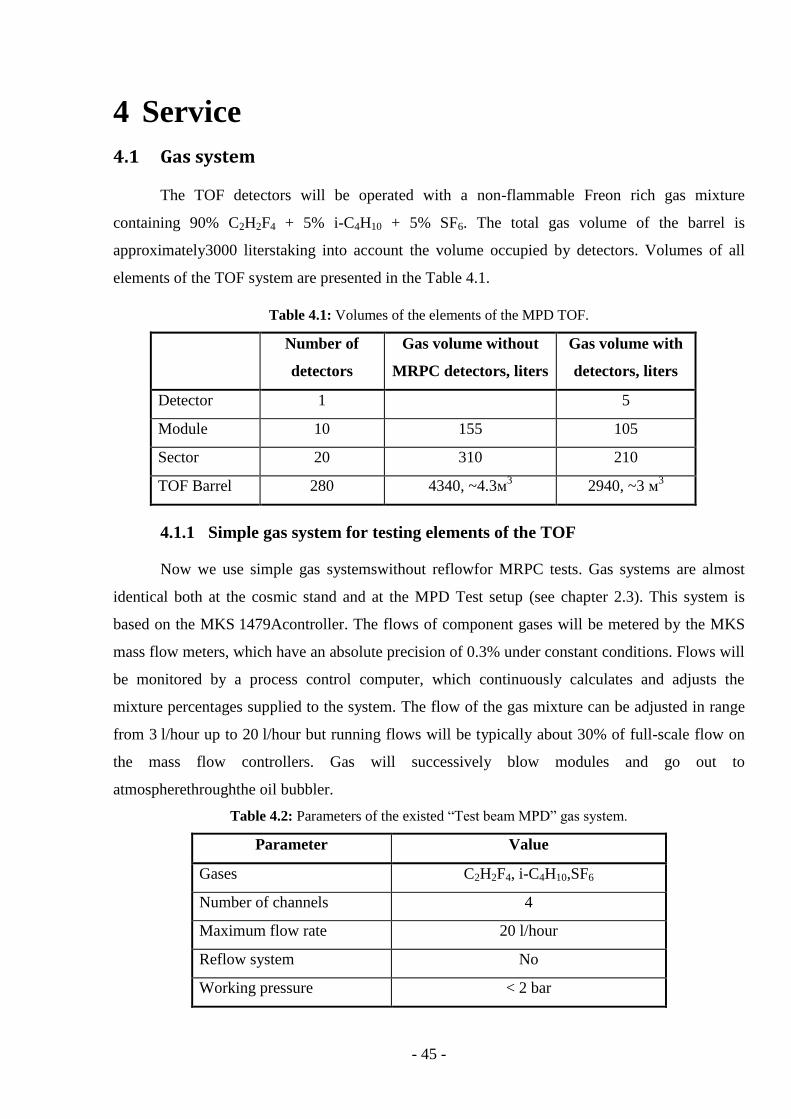
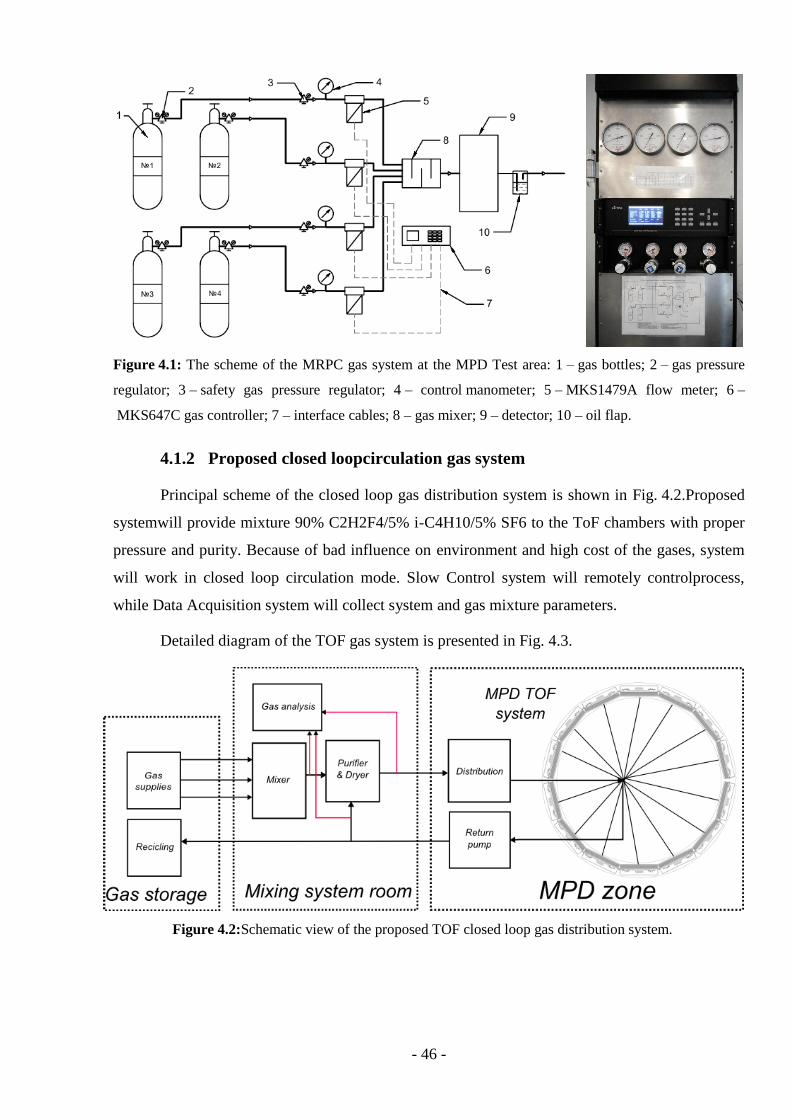
4.1.1 Simple gas system for testing elements of the TOF
Now we use simple gas systemswithout reflowfor MRPC tests. Gas systems are almost
identical both at the cosmic stand and at the MPD Test setup (see chapter 2.3). This system is
based on the MKS 1479Acontroller. The flows of component gases will be metered by the MKS
mass flow meters, which have an absolute precision of 0.3% under constant conditions. Flows will
be monitored by a process control computer, which continuously calculates and adjusts the
mixture percentages supplied to the system. The flow of the gas mixture can be adjusted in range
from 3 l/hour up to 20 l/hour but running flows will be typically about 30% of full-scale flow on
the mass flow controllers. Gas will successively blow modules and go out to
atmospherethroughthe oil bubbler.
Table 4.2: Parameters of the existed “Test beam MPD” gas system.
Parameter Value
Gases C2H2F4, i-C4H10,SF6
Number of channels 4
Maximum flow rate 20 l/hour
Reflow system No
Working pressure < 2 bar
- 46 -
Figure 4.1: The scheme of the MRPC gas system at the MPD Test area: 1 – gas bottles; 2 – gas pressure
regulator; 3 – safety gas pressure regulator; 4 – control manometer; 5 – MKS1479A flow meter; 6 –
MKS647C gas controller; 7 – interface cables; 8 – gas mixer; 9 – detector; 10 – oil flap.
4.1.2 Proposed closed loopcirculation gas system
Principal scheme of the closed loop gas distribution system is shown in Fig. 4.2.Proposed
systemwill provide mixture 90% C2H2F4/5% i-C4H10/5% SF6 to the ToF chambers with proper
pressure and purity. Because of bad influence on environment and high cost of the gases, system
will work in closed loop circulation mode. Slow Control system will remotely controlprocess,
while Data Acquisition system will collect system and gas mixture parameters.
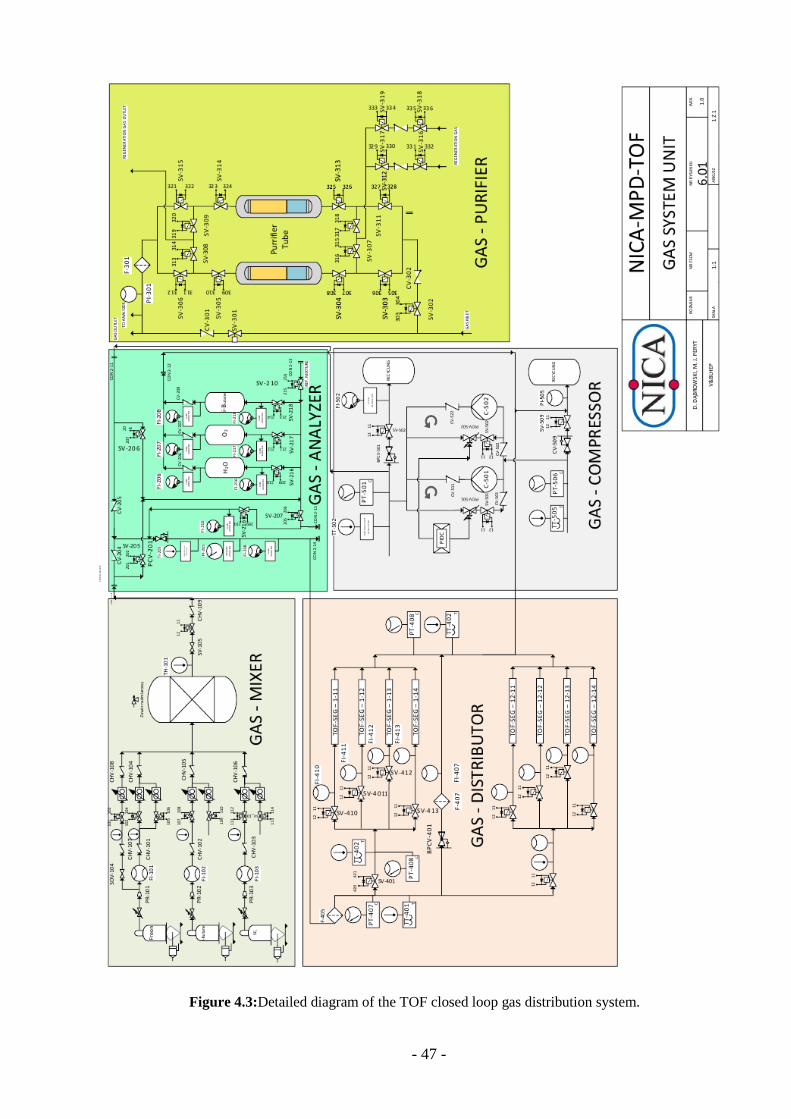
Detailed diagram of the TOF gas system is presented in Fig. 4.3.
Figure 4.2:Schematic view of the proposed TOF closed loop gas distribution system.
- 47 -
Figure 4.3:Detailed diagram of the TOF closed loop gas distribution system.

- 48 -
4.1.2.1 Gas supply & Mixer
Gas supply is a place from where fresh gases will be taken. Amount of the gases in the
cylinders will be measured by industrial weighting modules connected with Slow Control system.
Gas Mixer will ensure correct ratio of the gases. Main parts of this module will be mass flow
controllers – master controller for C2H2F4 with controllers i-C4H10 and SF6 slaved. It may be
necessary to use two mass flow controllers for every gas, one for filling operation and another for
running. The difference between flows during these operations is relatively high, what may have
bad influence on precision of the measurements while using one device for both purposes. This
part of the system will also consist pipeline with mass flow controller for pre-purging detector
with high flow of C2H2F4.
4.1.2.2 Analyzer
Quality of gas mixture properties are essential for proper work of the system. Isobutane is
flammable gas and its content has to stay under specified limits. High amount of water and oxygen
may disrupt results of the experiment. Gas analyzer will monitor theirs content in the mixture.
This information will be used to calculate necessary flow of the mixture in the purifier module.
During normal operation portion of gas mixture will be taken from the circulation.
Analyzermodule will provide ability to measure gas mixture separately from various parts of
whole GasSystem.
4.1.2.3 Purifier
To provide low water and oxygen content purifier module will be used. It will consist two
parallel columns filled with copper catalyst (to remove oxygen) and molecular sieve (to remove
moisture). During normal operation we expect to use one of them. Second will be reserve, used if
regeneration during operation will be necessary or another incident happen. Purification module
will also consist pipelines, valves heater and other required equipment used for columns
regeneration.
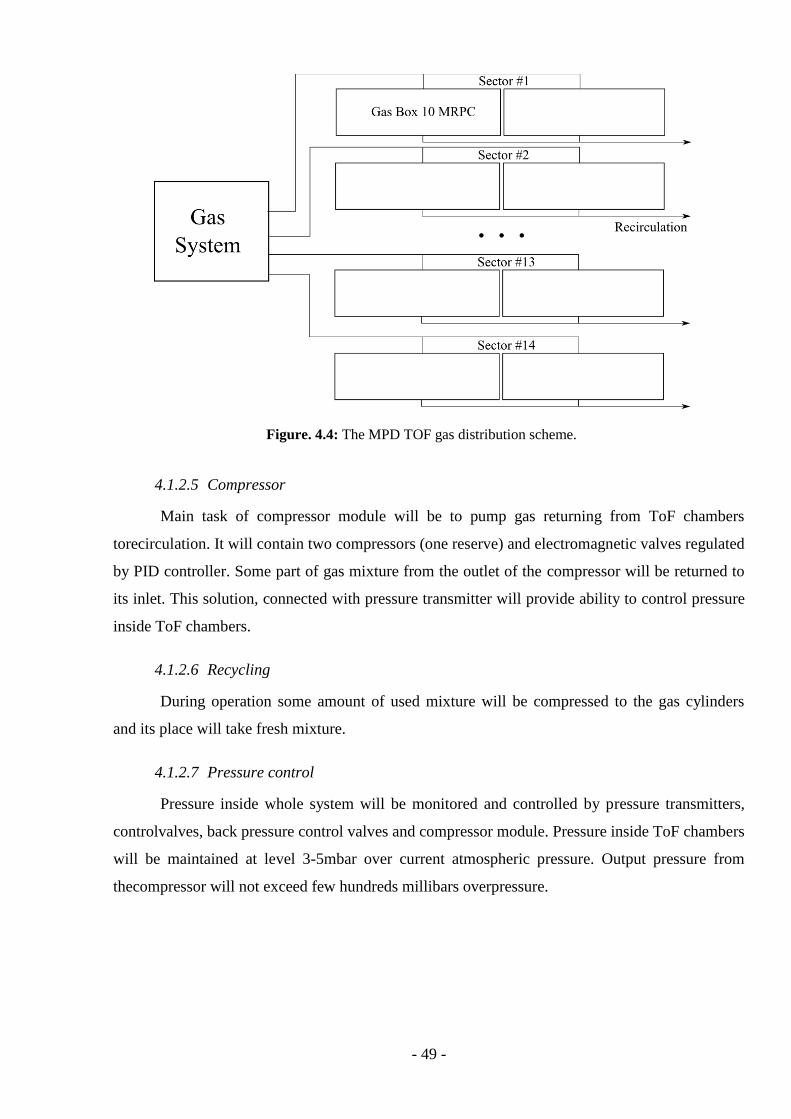
4.1.2.4 Distribution
The barrel of the Time-of-Flight system of the MPD consists of 14 sectors. Each sector
contains 2 gas boxes. Each box must be supplied gas independently (Fig. 4.4) to be able to
dismantle any module without disconnecting the other. Distribution system will divide stream and
deliver necessary amount of gas in every ToF segment. It will also contain pressure and
temperature indicators to monitor gas parameters.Pipe diameters vary to ensure that each module
will have the same gas flow.
- 49 -
Figure. 4.4: The MPD TOF gas distribution scheme.
4.1.2.5 Compressor
Main task of compressor module will be to pump gas returning from ToF chambers
torecirculation. It will contain two compressors (one reserve) and electromagnetic valves regulated
by PID controller. Some part of gas mixture from the outlet of the compressor will be returned to
its inlet. This solution, connected with pressure transmitter will provide ability to control pressure
inside ToF chambers.
4.1.2.6 Recycling
During operation some amount of used mixture will be compressed to the gas cylinders
and its place will take fresh mixture.
4.1.2.7 Pressure control
Pressure inside whole system will be monitored and controlled by pressure transmitters,
controlvalves, back pressure control valves and compressor module. Pressure inside ToF chambers
will be maintained at level 3-5mbar over current atmospheric pressure. Output pressure from
thecompressor will not exceed few hundreds millibars overpressure.

- 50 -
4.2 High Voltage supplies
The detector element of the TOF system, the MRPC, will be operated with a differential
voltage of about ±6 kV, i.e. ∼12 kV across each of the three 5 gap stacks.The maximum expected
rate at the MPD experiment will be of the orderof 50 Hz/cm2 and assuming that the average charge
produced in by minimum ionizing particle ∼3 pC [19], thecurrent and the power consumption of
the TOF detector can be evaluated as shown in Table 4.3.The measured power consumption and
the values quoted in Table 4.3 confirm that the MRPCsare low power devices.
Table 4.3: Estimates of the current and power for the HV system.
Current Power
MRPC 330 nA 3.4 mW
Module (10 MRPCs) 3.3 µA 34 mW
Sector (2 modules) 6.6 µA 68 mW
Whole TOF system (14 sectors) ~100 µA ~1 W
A multi-channel high voltage system with remote control and a relatively small cost
needed. The “HVSys” [20] high voltage power supplymeets these requirements.Sample HV
source with all necessary characteristics especially for the TOF system were produced. Device is
housed in the standard 19-inch module (Fig. 4.5). It consists of a controller, the main power
supply, and several high voltage cells. Main characteristics of the “HVSys” high-voltage source
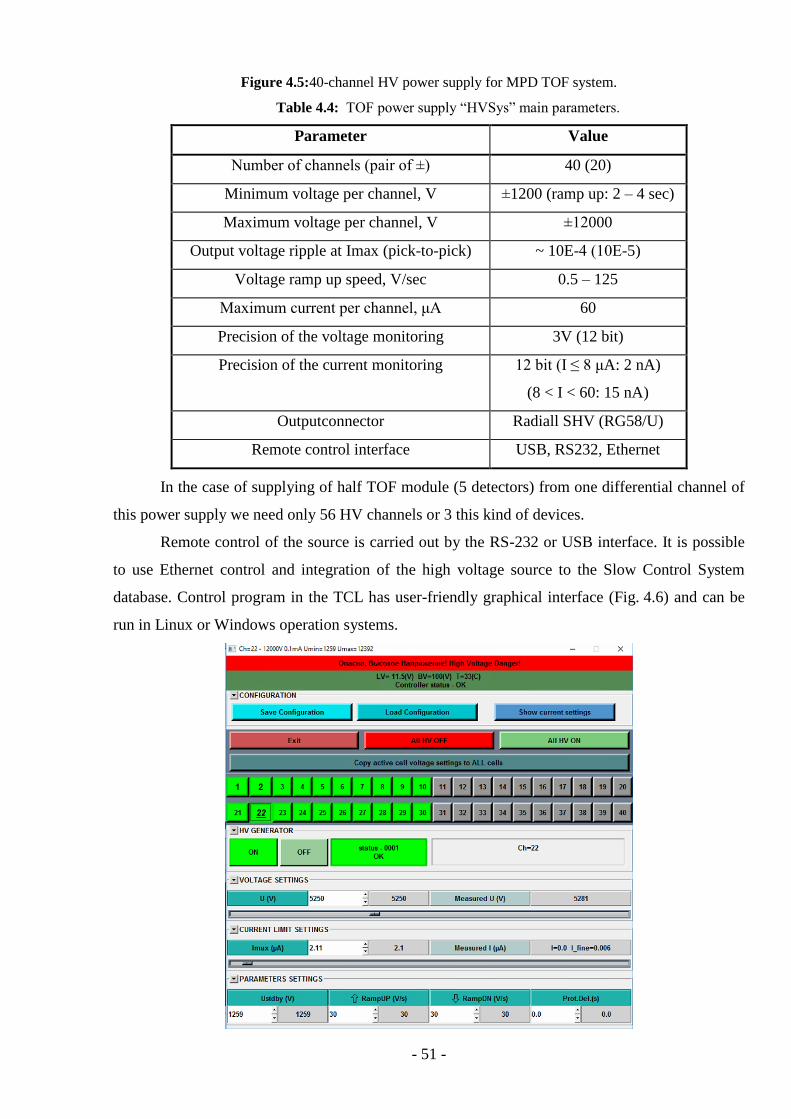
are given in Table 4.4.
- 51 -
Figure 4.5:40-channel HV power supply for MPD TOF system.
Table 4.4: TOF power supply “HVSys” main parameters.
Parameter Value
Number of channels (pair of ±) 40 (20)
Minimum voltage per channel, V ±1200 (ramp up: 2 – 4 sec)
Maximum voltage per channel, V ±12000
Output voltage ripple at Imax (pick-to-pick) ~ 10E-4 (10Е-5)
Voltage ramp up speed, V/sec 0.5 – 125
Maximum current per channel, μA 60
Precision of the voltage monitoring 3V (12 bit)
Precision of the current monitoring 12 bit (I ≤ 8 μA: 2 nA)
(8 < I < 60: 15 nA)
Outputconnector Radiall SHV (RG58/U)
Remote control interface USB, RS232, Ethernet
In the case of supplying of half TOF module (5 detectors) from one differential channel of
this power supply we need only 56 HV channels or 3 this kind of devices.
Remote control of the source is carried out by the RS-232 or USB interface. It is possible
to use Ethernet control and integration of the high voltage source to the Slow Control System
database. Control program in the TCL has user-friendly graphical interface (Fig. 4.6) and can be
run in Linux or Windows operation systems.

- 52 -
Figure 4.6: HVSys power supply remote control user interface.
4.3 Low Voltage power distribution
Figure. 4.7: "W-IE-NE-R" MPod mini crate and 8-channel LV power supply MPV 8016I.
The power consumption of one FE card is 1.5 W. The total power consumption of the TOF
is less than 850 W. Such a small power allowsusing a simple and cheap power supply scheme.We
stopped on a variant where power supplies are located outside the MPD magnet in the
experimental hall, delivering the needed voltage and current directly to the load.
The closest location for the power supplies is at ∼12 m on each side of the barrel. The TOF
system is subdivided in 14+14 half sectors (modules).Each half sector needs ∼30 W at 3.5 V for
the analogue electronics.Four "W-IE-NE-R" MPod [21] mini crates (Fig. 4.7) with four LV supply
modules(MPV 8016I) are enough to power all preamps of the TOF system.Mpod low voltage
modules have 8 channels with a maximum of 50W per channel in different voltage ranges. All
channels are individually controlled and monitored and have floating, individually sensed outputs.
Schematic diagram of the MPD TOF low voltage distribution is shown in the figure 4.8.
One Mpod crate used to supply voltage to 7 modules.The voltage supplies to one module through
4 cables (one cable for five FE cards) of 12 m length.Each cable line will draw a current of about
2.1 A (see chapter 3.2.2).Allowing maximum3.5 V voltage drop through the 12 m line, the cross
section of each LV cableis of order 1.5 mm2.So needs to set voltage not more than 7 V on the
power supply to provide voltage 3.5 V for each preamplifier.This connection scheme is the most
optimal at the moment.

- 53 -
Figure. 4.8:Schematic diagram of the TOF low voltage distribution.
4.4 Slow control for the TOF system
Slow control system (SCS) refers to a computer system that monitors and/or controls
multiple systems for failure prevention, monitoring and provides direct control by user or
automated control.
User interaction with SCS for MPD is based on a toolkit named TANGO Control System
[22], which also is being used at the Nuclotron in JINR. TANGO is a software for building control
systems, which unify access to hardware.Hardware can range from single bits of digital
input/output up to sophisticated detector systems.
All connections with devices are based on Ethernet. For devices without network access,
like temperature sensors with RS-485 interface, Serial-to-Ethernet MOXA NPort convertors are
applied.Acquired data from devices is being archived into database for further analysis and
handling. TANGO control system provides handy tools for browsing data history.
The Time-of-Flight system of the MPD is necessary to monitor several parameters of
different subsystemssuch as temperature monitoring, voltage monitoring, gas flow monitoring, etc.
subsystems with controlled parameters and control devicesare listed in Table 4.5. At present, most
of the slow control system has been developed and continues to develop.In the right column of the
table indicated the planned additions and changes of the system.
An example of the voltage and temperature monitoring which was carried during test run
on the BM@N is shown in Fig. 4.9.

- 54 -
Table 4.5:Status of the TOF slow-control system.
TOF Subsystem Monitored value Devices for monitoring,
realized
Planed
Detector Temperature,
pressure
Up to 255 on single line
DS1624-based temperature
sensors.
Honeywell
HSCDRRN005PD2A5
pressure sensors.
Gas system Flow, pressure 4-channel MKS 647C and
MKS 247C gas flow controllers.
readout.
Readout and control
directly from the
MKS 1479A.
Low Voltage Voltage, current 10-channel ICP DAS PET-
7017-10 voltage monitoring.
Integrated voltage and
current control.
High Voltage Voltage, current CAEN N471A source current
monitoring by 10-channel ICP
DAS PET-7017-10.
Integrated voltage and
current control and
monitoring.
Front-End
Electronics
Voltage, threshold ICP DAS PET-7017-10 voltage
monitoring.
Threshold control and
monitoring.
DAQ, Readout
Elecronics
Temperature,
voltage, current
--- Read values to the
database.
Figure 4.9: TANGO example of the voltage and temperature monitoring.
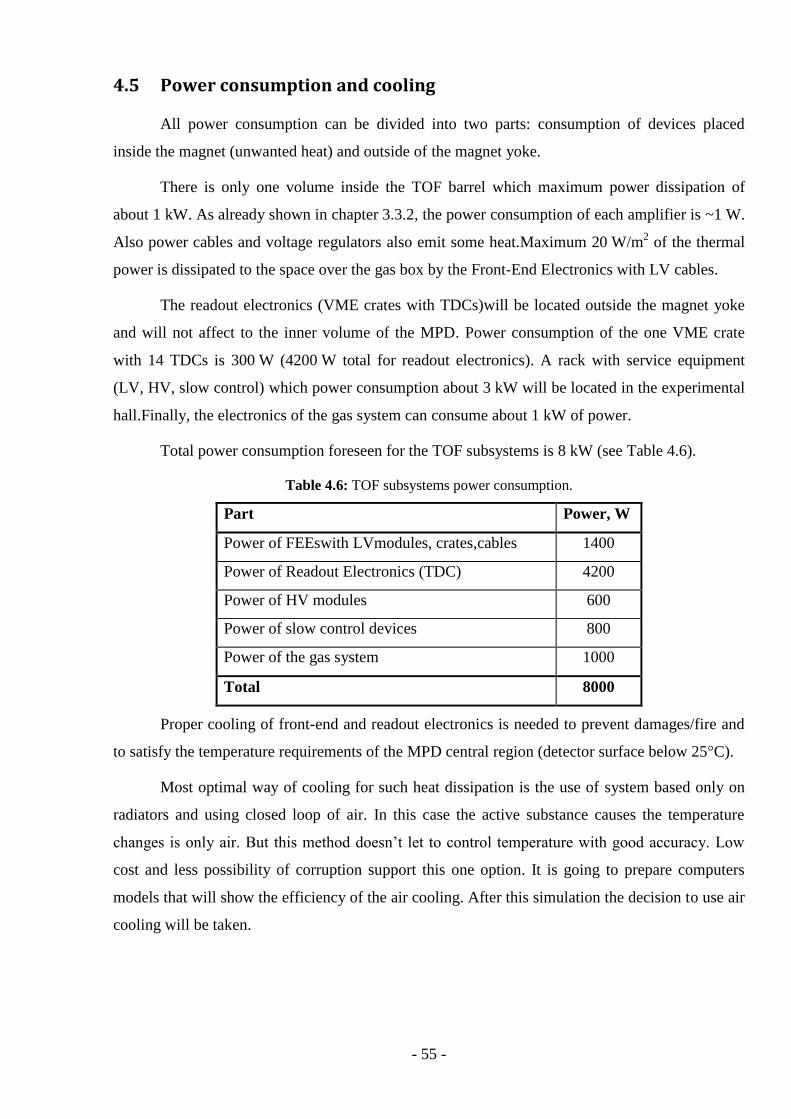
- 55 -
4.5 Power consumption and cooling
All power consumption can be divided into two parts: consumption of devices placed
inside the magnet (unwanted heat) and outside of the magnet yoke.
There is only one volume inside the TOF barrel which maximum power dissipation of
about 1 kW. As already shown in chapter 3.3.2, the power consumption of each amplifier is ~1 W.
Also power cables and voltage regulators also emit some heat.Maximum 20 W/m2 of the thermal
power is dissipated to the space over the gas box by the Front-End Electronics with LV cables.
The readout electronics (VME crates with TDCs)will be located outside the magnet yoke
and will not affect to the inner volume of the MPD. Power consumption of the one VME crate
with 14 TDCs is 300 W (4200 W total for readout electronics). A rack with service equipment
(LV, HV, slow control) which power consumption about 3 kW will be located in the experimental
hall.Finally, the electronics of the gas system can consume about 1 kW of power.
Total power consumption foreseen for the TOF subsystems is 8 kW (see Table 4.6).
Table 4.6: TOF subsystems power consumption.
Part Power, W
Power of FEEswith LVmodules, crates,cables 1400
Power of Readout Electronics (TDC) 4200
Power of HV modules 600
Power of slow control devices 800
Power of the gas system 1000
Total 8000
Proper cooling of front-end and readout electronics is needed to prevent damages/fire and
to satisfy the temperature requirements of the MPD central region (detector surface below 25°C).
Most optimal way of cooling for such heat dissipation is the use of system based only on
radiators and using closed loop of air. In this case the active substance causes the temperature
changes is only air. But this method doesn’t let to control temperature with good accuracy. Low
cost and less possibility of corruption support this one option. It is going to prepare computers
models that will show the efficiency of the air cooling. After this simulation the decision to use air
cooling will be taken.
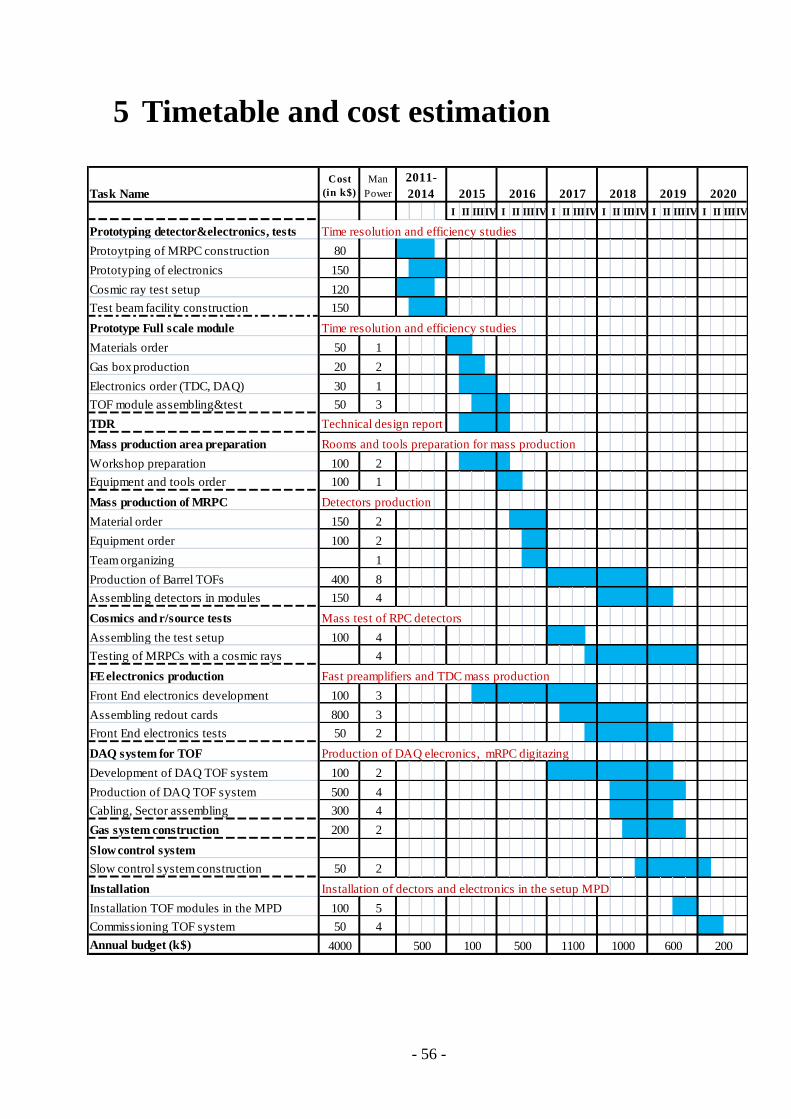
- 56 -
5 Timetable and cost estimation
Task Name
Cost
(in k$)
Man
Power
I II IIIIV I II IIIIV I II IIIIV I II IIIIV I II IIIIV I II IIIIV
Prototyping detector&electronics, tests Time resolution and efficiency studies
Protoytping of MRPC construction 80
Prototyping of electronics 150
Cosmic ray test setup 120
Test beam facility construction 150
Prototype Full scale module Time resolution and efficiency studies
Materials order 50 1
Gas box production 20 2
Electronics order (TDC, DAQ) 30 1
TOF module assembling&test 50 3
TDR Technical design report
Mass production area preparation Rooms and tools preparation for mass production
Workshop preparation 100 2
Equipment and tools order 100 1
Mass production of MRPC Detectors production
Material order 150 2
Equipment order 100 2
Team organizing 1
Production of Barrel TOFs 400 8
Assembling detectors in modules 150 4
Cosmics and r/source tests Mass test of RPC detectors
Assembling the test setup 100 4
Testing of MRPCs with a cosmic rays 4
FE electronics production Fast preamplifiers and TDC mass production
Front End electronics development 100 3
Assembling redout cards 800 3
Front End electronics tests 50 2
DAQ system for TOF Production of DAQ elecronics, mRPC digitazing
Development of DAQ TOF system 100 2
Production of DAQ TOF system 500 4
Cabling, Sector assembling 300 4
Gas system construction 200 2
Slow control system
Slow control system construction 50 2
Installation Installation of dectors and electronics in the setup MPD
Installation TOF modules in the MPD 100 5
Commissioning TOF system 50 4
Annual budget (k$) 4000
2016 2017 2018 2019
1100 1000 600 200
2011-
2014
500 100 500
2015 2020

- 57 -
References
[1] The MultiPurpose Detector (MPD), Conceptual Design Report,
v1.4,http://nica.jinr.ru/files/CDR_MPD/MPD_CDR_en.pdf.
[2] Kh.U. Abraamyan, et al., Nucl. Instr. Meth.A628(2011) 99.
[3] ALICE, (2000), CERN-LHCC-2000-012, ALICE TDR 8.
[4] ALICE, P. Cortese et al., (2002), CERN-LHCC-2002-016, Addendum to the ALICE TDR 8.
[5] K. Ikematsu et al., (1998), arXiv:physics/9802024 v1.
[6] F. Geurts et al., Nucl. Instr. Meth. A508 (2003) 60.
[7] H. Alvarez-Pol et al., Nucl. Instr. Meth. A535 (2004)277.
[8] CBM Technical Status Report 2006.
[9] E. Cerron Zeballos, I. Crotty, D. Hatzifotiadou, J. Lamas Valverde, S. Neupane,
M.C.S. Williams and A. Zichichi, Nucl. Instr. Meth. A374 (1996) 132.
[10]V.I. Yurevich et al., Phys.Part.Nucl.Lett. 12 (2015) 778-785.
[11] V. Babkin, et al., Nucl. Inst. Meth. A824 (2016) 490.
[12] W. Zhu, Yi. Wangetal., Science China Technological Sciences. 56(11)(2013) 2821.
[13]W. Zhu, Yi. Wang et al.,Nucl. Instr. Meth.A735 (2014) 277.
[14] F. Anghinolfi, et al., Nucl. Instr. Meth.A533 (2004) 183.
[15] P. Moreira, et al., White Rabbit: Sub-Nanosecond Timing Distribution over Ethernet, ISPCS
2009, Brescia, Italy.
[16] J. Christiansen, HPTDC High Performance Time to Digital Converter, V 2.2 for HPTDC
V 1.3, March 2004,http://tdc.web.cern.ch/tdc/hptdc/docs/hptdc_manual_ver2.2.pdf.
[17] A.V. Akindinov, A. Alici et al., Nucl. Instr. Meth. A533 (2004)178.
[18] D. McDonald (2010), Calibration of the STAR Time-of-Flight Detector for Particle
Identication, MS thesis, Houston, Texas, USA.
[19] A. Akindinov,A. Alici et al., Nucl. Instr. Meth. A490(2002) 58.
[20] http://www.hvsys.ru.
[21] http://www.wiener-d.com/sc/power-supplies/mpod--lvhv/mpod-lv-module.html
[22]J-M. Chaize et al., TANGO - an object oriented control system based on CORBA, ICALEPCS
1999, Trieste,1999.