mplab icd 3 in-circuit debugger user's...
TRANSCRIPT
© 2008 Microchip Technology Inc. DS51766A
MPLAB® ICD 3In-Circuit Debugger
User’s Guide
Note the following details of the code protection feature on Microchip devices:• Microchip products meet the specification contained in their particular Microchip Data Sheet.
• Microchip believes that its family of products is one of the most secure families of its kind on the market today, when used in the intended manner and under normal conditions.
• There are dishonest and possibly illegal methods used to breach the code protection feature. All of these methods, to our knowledge, require using the Microchip products in a manner outside the operating specifications contained in Microchip’s Data Sheets. Most likely, the person doing so is engaged in theft of intellectual property.
• Microchip is willing to work with the customer who is concerned about the integrity of their code.
• Neither Microchip nor any other semiconductor manufacturer can guarantee the security of their code. Code protection does not mean that we are guaranteeing the product as “unbreakable.”
Code protection is constantly evolving. We at Microchip are committed to continuously improving the code protection features of ourproducts. Attempts to break Microchip’s code protection feature may be a violation of the Digital Millennium Copyright Act. If such actsallow unauthorized access to your software or other copyrighted work, you may have a right to sue for relief under that Act.
Information contained in this publication regarding deviceapplications and the like is provided only for your convenienceand may be superseded by updates. It is your responsibility toensure that your application meets with your specifications.MICROCHIP MAKES NO REPRESENTATIONS ORWARRANTIES OF ANY KIND WHETHER EXPRESS ORIMPLIED, WRITTEN OR ORAL, STATUTORY OROTHERWISE, RELATED TO THE INFORMATION,INCLUDING BUT NOT LIMITED TO ITS CONDITION,QUALITY, PERFORMANCE, MERCHANTABILITY ORFITNESS FOR PURPOSE. Microchip disclaims all liabilityarising from this information and its use. Use of Microchipdevices in life support and/or safety applications is entirely atthe buyer’s risk, and the buyer agrees to defend, indemnify andhold harmless Microchip from any and all damages, claims,suits, or expenses resulting from such use. No licenses areconveyed, implicitly or otherwise, under any Microchipintellectual property rights.
DS51766A-page ii
Trademarks
The Microchip name and logo, the Microchip logo, Accuron, dsPIC, KEELOQ, KEELOQ logo, MPLAB, PIC, PICmicro, PICSTART, rfPIC, SmartShunt and UNI/O are registered trademarks of Microchip Technology Incorporated in the U.S.A. and other countries.
FilterLab, Linear Active Thermistor, MXDEV, MXLAB, SEEVAL, SmartSensor and The Embedded Control Solutions Company are registered trademarks of Microchip Technology Incorporated in the U.S.A.
Analog-for-the-Digital Age, Application Maestro, CodeGuard, dsPICDEM, dsPICDEM.net, dsPICworks, dsSPEAK, ECAN, ECONOMONITOR, FanSense, In-Circuit Serial Programming, ICSP, ICEPIC, Mindi, MiWi, MPASM, MPLAB Certified logo, MPLIB, MPLINK, mTouch, PICkit, PICDEM, PICDEM.net, PICtail, PIC32 logo, PowerCal, PowerInfo, PowerMate, PowerTool, REAL ICE, rfLAB, Select Mode, Total Endurance, WiperLock and ZENA are trademarks of Microchip Technology Incorporated in the U.S.A. and other countries.
SQTP is a service mark of Microchip Technology Incorporated in the U.S.A.
All other trademarks mentioned herein are property of their respective companies.
© 2008, Microchip Technology Incorporated, Printed in the U.S.A., All Rights Reserved.
Printed on recycled paper.
© 2008 Microchip Technology Inc.
Microchip received ISO/TS-16949:2002 certification for its worldwide headquarters, design and wafer fabrication facilities in Chandler and Tempe, Arizona; Gresham, Oregon and design centers in California and India. The Company’s quality system processes and procedures are for its PIC® MCUs and dsPIC® DSCs, KEELOQ® code hopping devices, Serial EEPROMs, microperipherals, nonvolatile memory and analog products. In addition, Microchip’s quality system for the design and manufacture of development systems is ISO 9001:2000 certified.
MPLAB® ICD 3 IN-CIRCUITDEBUGGER USER’S GUIDE
© 2008 Microchip Technology Inc. DS51766A-page iii
Table of Contents
Preface ........................................................................................................................... 1Part 1 –Getting StartedChapter 1. Overview
1.1 Introduction ..................................................................................................... 91.2 MPLAB ICD 3 In-Circuit Debugger Defined ................................................... 91.3 How the MPLAB ICD 3 In-Circuit Debugger Helps You ............................... 101.4 MPLAB ICD 3 In-Circuit Debugger Kit Components .................................... 101.5 Device and Feature Support ........................................................................ 11
Chapter 2. Theory of Operation2.1 Introduction ................................................................................................... 132.2 MPLAB ICD 3 In-Circuit Debugger vs. MPLAB ICE 2000/4000
In-Circuit Emulators ................................................................................ 132.3 MPLAB ICD 3 In-Circuit Debugger vs. MPLAB ICD 2 Debugger ................. 132.4 Debugger To Target Communication ........................................................... 142.5 Communication Connections ....................................................................... 152.6 Debugging with the Debugger ...................................................................... 172.7 Requirements For Debugging ...................................................................... 182.8 Programming with the Debugger .................................................................. 202.9 Resources Used by the Debugger ............................................................... 20
Chapter 3. Installation3.1 Introduction ................................................................................................... 213.2 Installing the Software .................................................................................. 213.3 Installing the USB Device Drivers ................................................................ 213.4 Connecting the Target .................................................................................. 223.5 Setting Up the Target Board ......................................................................... 223.6 Setting Up MPLAB IDE ................................................................................ 23
Chapter 4. General Setup4.1 Introduction ................................................................................................... 254.2 Starting the MPLAB IDE Software ................................................................ 254.3 Creating a Project ......................................................................................... 264.4 Viewing the Project ....................................................................................... 264.5 Building the Project ...................................................................................... 264.6 Setting Configuration Bits ............................................................................. 274.7 Setting the Debugger as the Debugger or Programmer ............................... 274.8 Debugger/Programmer Limitations .............................................................. 27
MPLAB® ICD 3 In-Circuit Debugger User’s Guide
DS51766A-page iv © 2008 Microchip Technology Inc.
Chapter 5. Tutorial5.1 Introduction ................................................................................................... 295.2 Setting Up the Environment and Selecting the Device ................................. 305.3 Creating the Application Code ...................................................................... 305.4 Running the Project Wizard .......................................................................... 335.5 Viewing the Project ....................................................................................... 355.6 Viewing Debug Options ................................................................................ 365.7 Creating a Hex File ....................................................................................... 375.8 Setting Up the Demo Board ......................................................................... 395.9 Loading Program Code For Debugging ....................................................... 395.10 Running Debug Code ................................................................................. 405.11 Debugging Code Using Breakpoints .......................................................... 405.12 Programming the Application ..................................................................... 45
Part 2 –TroubleshootingChapter 6. Frequently Asked Questions (FAQs)
6.1 Introduction ................................................................................................... 496.2 How Does It Work ........................................................................................ 496.3 What’s Wrong ............................................................................................... 50
Chapter 7. Error Messages7.1 Introduction ................................................................................................... 537.2 Specific Error Messages .............................................................................. 537.3 General Corrective Actions .......................................................................... 57
Part 3 –ReferenceChapter 8. Basic Debug Functions
8.1 Introduction ................................................................................................... 638.2 Breakpoints .................................................................................................. 638.3 Stopwatch ..................................................................................................... 63
Chapter 9. Debugger Function Summary9.1 Introduction ................................................................................................... 659.2 Debugging Functions ................................................................................... 659.3 Debugging Dialogs/Windows ....................................................................... 689.4 Programming Functions ............................................................................... 739.5 Settings Dialog ............................................................................................. 74
Table of Contents
© 2008 Microchip Technology Inc. DS51766A-page v
Chapter 10. Hardware Specification10.1 Introduction ................................................................................................. 7910.2 Highlights .................................................................................................... 7910.3 Declaration of Conformity ........................................................................... 7910.4 USB Port/Power ......................................................................................... 8010.5 MPLAB ICD 3 Debugger ............................................................................ 8010.6 Standard Communication Hardware .......................................................... 8110.7 ICD 3 Test Interface Board ......................................................................... 8210.8 Target Board Considerations ..................................................................... 83
Glossary ....................................................................................................................... 85Index ............................................................................................................................. 99Worldwide Sales and Service .................................................................................. 102

MPLAB® ICD 3 In-Circuit Debugger User’s Guide
DS51766A-page vi © 2008 Microchip Technology Inc.
NOTES:
MPLAB® ICD 3 IN-CIRCUITDEBUGGER USER’S GUIDE
© 2008 Microchip Technology Inc. DS51766A-page 1
Preface
INTRODUCTIONThis chapter contains general information that will be useful to know before using the MPLAB ICD 3 in-circuit debugger. Items discussed in this chapter include:• Document Layout• Conventions Used in this Guide• Warranty Registration• Recommended Reading• The Microchip Web Site• Development Systems Customer Change Notification Service• Customer Support• Revision History
DOCUMENT LAYOUTThis document describes how to use the MPLAB ICD 3 in-circuit debugger as a development tool to emulate and debug firmware on a target board, as well as how to program devices. The document is organized as follows:
Part 1 – Getting Started• Chapter 1. Overview – What the MPLAB ICD 3 in-circuit debugger is, and how it
can help you develop your application.• Chapter 2. Theory of Operation – The theory of MPLAB ICD 3 in-circuit debug-
ger operation. Explains configuration options.• Chapter 3. Installation – How to install the debugger software and hardware.• Chapter 4. General Setup – How to set up MPLAB IDE to use the debugger.• Chapter 5. Tutorial – A brief tutorial on using the debugger.
NOTICE TO CUSTOMERS
All documentation becomes dated, and this manual is no exception. Microchip tools and documentation are constantly evolving to meet customer needs, so some actual dialogs and/or tool descriptions may differ from those in this document. Please refer to our web site (www.microchip.com) to obtain the latest documentation available.
Documents are identified with a “DS” number. This number is located on the bottom of each page, in front of the page number. The numbering convention for the DS number is “DSXXXXXA”, where “XXXXX” is the document number and “A” is the revision level of the document.
For the most up-to-date information on development tools, see the MPLAB® IDE on-line help. Select the Help menu, and then Topics to open a list of available on-line help files.
MPLAB® ICD 3 In-Circuit Debugger User’s Guide
DS51766A-page 2 © 2008 Microchip Technology Inc.
Part 2 – Troubleshooting• Chapter 6. Frequently Asked Questions (FAQs) – A list of frequently asked
questions, useful for troubleshooting.• Chapter 7. Error Messages – A list of error messages and suggested
resolutions.
Part 3 – Reference• Chapter 8. Basic Debug Functions – A description of basic debugger features
available in MPLAB IDE when the MPLAB ICD 3 in-circuit debugger is chosen as either the debug or programming tool. This includes the debug features breakpoints, stopwatch, triggering and real-time watches.
• Chapter 9. Debugger Function Summary – A summary of debugger functions available in MPLAB IDE when the MPLAB ICD 3 debugger is chosen as the debug or program tool.
• Chapter 10. Hardware Specification – The hardware and electrical specifications of the debugger system.
Preface
© 2008 Microchip Technology Inc. DS51766A-page 3
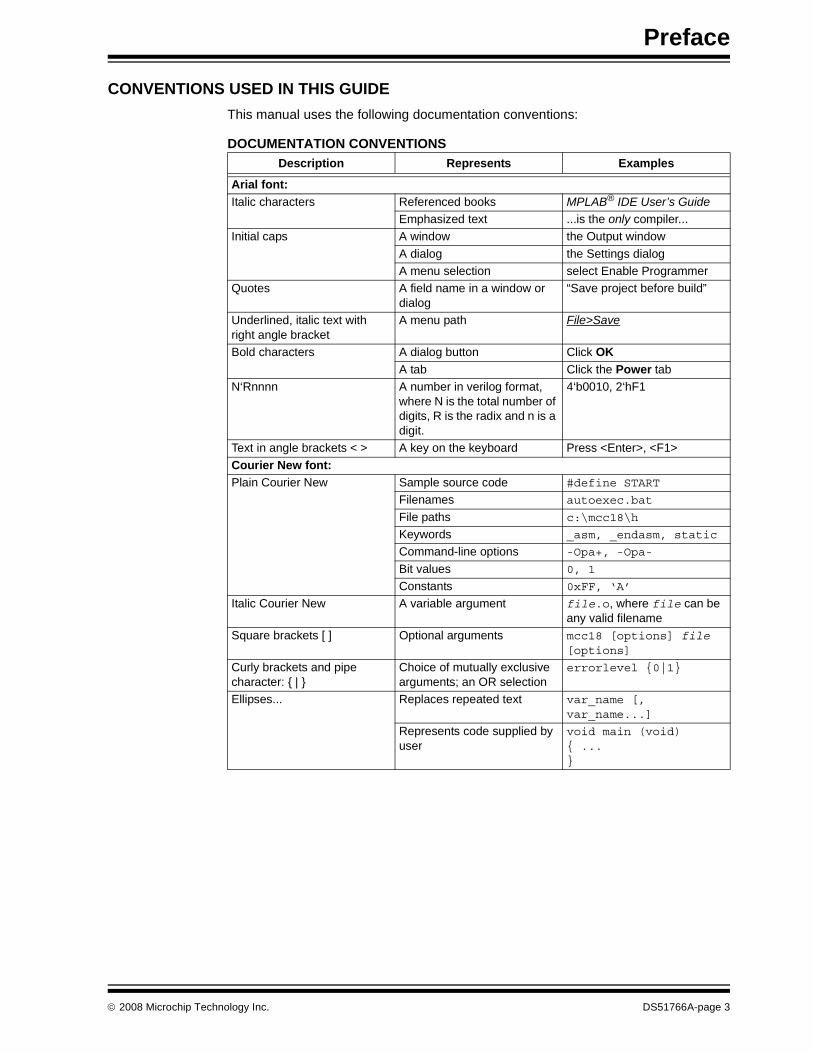
CONVENTIONS USED IN THIS GUIDEThis manual uses the following documentation conventions:
DOCUMENTATION CONVENTIONSDescription Represents Examples
Arial font:Italic characters Referenced books MPLAB® IDE User’s Guide
Emphasized text ...is the only compiler...Initial caps A window the Output window
A dialog the Settings dialogA menu selection select Enable Programmer
Quotes A field name in a window or dialog
“Save project before build”
Underlined, italic text with right angle bracket
A menu path File>Save
Bold characters A dialog button Click OKA tab Click the Power tab
N‘Rnnnn A number in verilog format, where N is the total number of digits, R is the radix and n is a digit.
4‘b0010, 2‘hF1
Text in angle brackets < > A key on the keyboard Press <Enter>, <F1>Courier New font:Plain Courier New Sample source code #define START
Filenames autoexec.bat
File paths c:\mcc18\h
Keywords _asm, _endasm, static
Command-line options -Opa+, -Opa-
Bit values 0, 1
Constants 0xFF, ‘A’
Italic Courier New A variable argument file.o, where file can be any valid filename
Square brackets [ ] Optional arguments mcc18 [options] file [options]
Curly brackets and pipe character: { | }
Choice of mutually exclusive arguments; an OR selection
errorlevel {0|1}
Ellipses... Replaces repeated text var_name [, var_name...]
Represents code supplied by user
void main (void){ ...}
MPLAB® ICD 3 In-Circuit Debugger User’s Guide
DS51766A-page 4 © 2008 Microchip Technology Inc.
WARRANTY REGISTRATIONPlease complete the enclosed Warranty Registration Card and mail it promptly. Sending in the Warranty Registration Card entitles users to receive new product updates. Interim software releases are available at the Microchip web site.
RECOMMENDED READINGThis user's guide describes how to use MPLAB ICD 3 in-circuit debugger. Other useful documents are listed below. The following Microchip documents are available and recommended as supplemental reference resources.
Please read this first! This document contains important information about operational issues that should be considered when using the MPLAB ICD 3 with your target design
Release Notes for MPLAB ICD 3 In-Circuit DebuggerFor the latest information on using MPLAB ICD 3 in-circuit debugger, read the “Readme for MPLAB ICD 3 Debugger.htm” file (an HTML file) in the Readmes subdirectory of the MPLAB IDE installation directory. The release notes (Readme) contains update information and known issues that may not be included in this user’s guide.
Using MPLAB ICD 3 In-Circuit Debugger Poster (DS51765)This poster shows you how to hook up the hardware and install the software for the MPLAB ICD 3 in-circuit debugger using standard communications and a target board.
MPLAB ICD 3 In-Circuit Debugger On-line Help FileA comprehensive help file for the debugger is included with MPLAB IDE. Usage, troubleshooting and hardware specifications are covered. This may be more up-to-date than the printed documentation. Also, debugger reserved resources and limitations are listed for various devices.
Header Board Specification (DS51292)This booklet describes how to install and use MPLAB ICD 3 in-circuit debugger headers. Headers are used to better debug selected devices using special -ICE device versions without the loss of pins or resources.
Transition Socket Specification (DS51194)Consult this document for information on transition sockets available for use with MPLAB ICE 2000/4000 device adaptors, MPLAB ICD 2 headers and MPLAB ICD 3 in-circuit debugger headers.
Preface
© 2008 Microchip Technology Inc. DS51766A-page 5
THE MICROCHIP WEB SITEMicrochip provides online support via our web site at www.microchip.com. This web site is used as a means to make files and information easily available to customers. Accessible by using your favorite Internet browser, the web site contains the following information:• Product Support – Data sheets and errata, application notes and sample
programs, design resources, user’s guides and hardware support documents, latest software releases and archived software
• General Technical Support – Frequently Asked Questions (FAQs), technical support requests, online discussion groups, Microchip consultant program member listing
• Business of Microchip – Product selector and ordering guides, latest Microchip press releases, listing of seminars and events, listings of Microchip sales offices, distributors and factory representatives
DEVELOPMENT SYSTEMS CUSTOMER CHANGE NOTIFICATION SERVICEMicrochip’s customer notification service helps keep customers current on Microchip products. Subscribers will receive e-mail notification whenever there are changes, updates, revisions or errata related to a specified product family or development tool of interest.To register, access the Microchip web site at www.microchip.com, click on Customer Change Notification and follow the registration instructions.The Development Systems product group categories are:• Compilers – The latest information on Microchip C compilers, assemblers, linkers
and other language tools. These include all MPLAB C compilers; all MPLAB assemblers (including MPASM™ assembler); all MPLAB linkers (including MPLINK™ object linker); and all MPLAB librarians (including MPLIB™ object librarian).
• Emulators – The latest information on Microchip in-circuit emulators.These include the MPLAB REAL ICE™, MPLAB ICE 2000 and MPLAB ICE 4000 in-circuit emulators
• In-Circuit Debuggers – The latest information on the Microchip in-circuit debuggers, the MPLAB ICD 2 in-circuit debugger and PICkit™ 2 debug express.
• MPLAB® IDE – The latest information on Microchip MPLAB IDE, the Windows® Integrated Development Environment for development systems tools. This list is focused on the MPLAB IDE, MPLAB IDE Project Manager, MPLAB Editor and MPLAB SIM simulator, as well as general editing and debugging features.
• Programmers – The latest information on Microchip programmers. These include the MPLAB PM3 and PRO MATE II device programmers and the PICSTART® Plus and PICkit 1 and 2 development programmers.
MPLAB® ICD 3 In-Circuit Debugger User’s Guide
DS51766A-page 6 © 2008 Microchip Technology Inc.
CUSTOMER SUPPORTUsers of Microchip products can receive assistance through several channels:• Distributor or Representative• Local Sales Office• Field Application Engineer (FAE)• Technical SupportCustomers should contact their distributor, representative or field application engineer (FAE) for support. Local sales offices are also available to help customers. A listing of sales offices and locations is included in the back of this document.Technical support is available through the web site at: http://support.microchip.com.
REVISION HISTORY
Revision A (September 2008)This is the initial release of this document.
MPLAB® ICD 3 IN-CIRCUITDEBUGGER USER’S GUIDE
© 2008 Microchip Technology Inc. DS51766A-page 7
Part 1 – Getting Started
Chapter 1. Overview....................................................................................................... 9Chapter 2. Theory of Operation .................................................................................. 13Chapter 3. Installation.................................................................................................. 21Chapter 4. General Setup ............................................................................................ 25Chapter 5. Tutorial........................................................................................................ 29
MPLAB® ICD 3 In-Circuit Debugger User’s Guide
DS51766A-page 8 © 2008 Microchip Technology Inc.
NOTES:
MPLAB® ICD 3 IN-CIRCUITDEBUGGER USER’S GUIDE
© 2008 Microchip Technology Inc. DS51766A-page 9
Chapter 1. Overview
1.1 INTRODUCTIONAn overview of the MPLAB ICD 3 in-circuit debugger system is given.• MPLAB ICD 3 In-Circuit Debugger Defined• How the MPLAB ICD 3 In-Circuit Debugger Helps You• MPLAB ICD 3 In-Circuit Debugger Kit Components• Device and Feature Support
1.2 MPLAB ICD 3 IN-CIRCUIT DEBUGGER DEFINEDThe MPLAB ICD 3 in-circuit debugger is an in-circuit debugger that is controlled by a PC running MPLAB IDE (v8.15 or greater) software on a Windows® platform. The MPLAB ICD 3 in-circuit debugger is an integral part of the development engineer's toolsuite. The application usage can vary from software development to hardware integration.The MPLAB ICD 3 in-circuit debugger is a complex debugger system used for hardware and software development of Microchip PIC® microcontrollers (MCUs) and dsPIC® Digital Signal Controllers (DSCs) that are based on In-Circuit Serial Programming™ (ICSP™) and Enhanced In-Circuit Serial Programming 2-wire serial interfaces.The debugger system will execute code like an actual device because it uses a device with built-in emulation circuitry, instead of a special debugger chip, for emulation. All available features of a given device are accessible interactively, and can be set and modified by the MPLAB IDE interface.The MPLAB ICD 3 debugger was developed for emulating embedded processors with rich debug facilities which differ from conventional system processors in the following aspects:• Processors run at maximum speeds• Capability to incorporate I/O port data inputIn addition to debugger functions, the MPLAB ICD 3 in-circuit debugger system also may be used as a development programmer.
MPLAB® ICD 3 In-Circuit Debugger User’s Guide
DS51766A-page 10 © 2008 Microchip Technology Inc.
1.3 HOW THE MPLAB ICD 3 IN-CIRCUIT DEBUGGER HELPS YOUThe MPLAB ICD 3 in-circuit debugger system allows you to:• Debug your application on your own hardware in real time• Debug with hardware breakpoints• Debug with software breakpoints• Set breakpoints based on internal events• Monitor internal file registers• Emulate full speed• Program your device
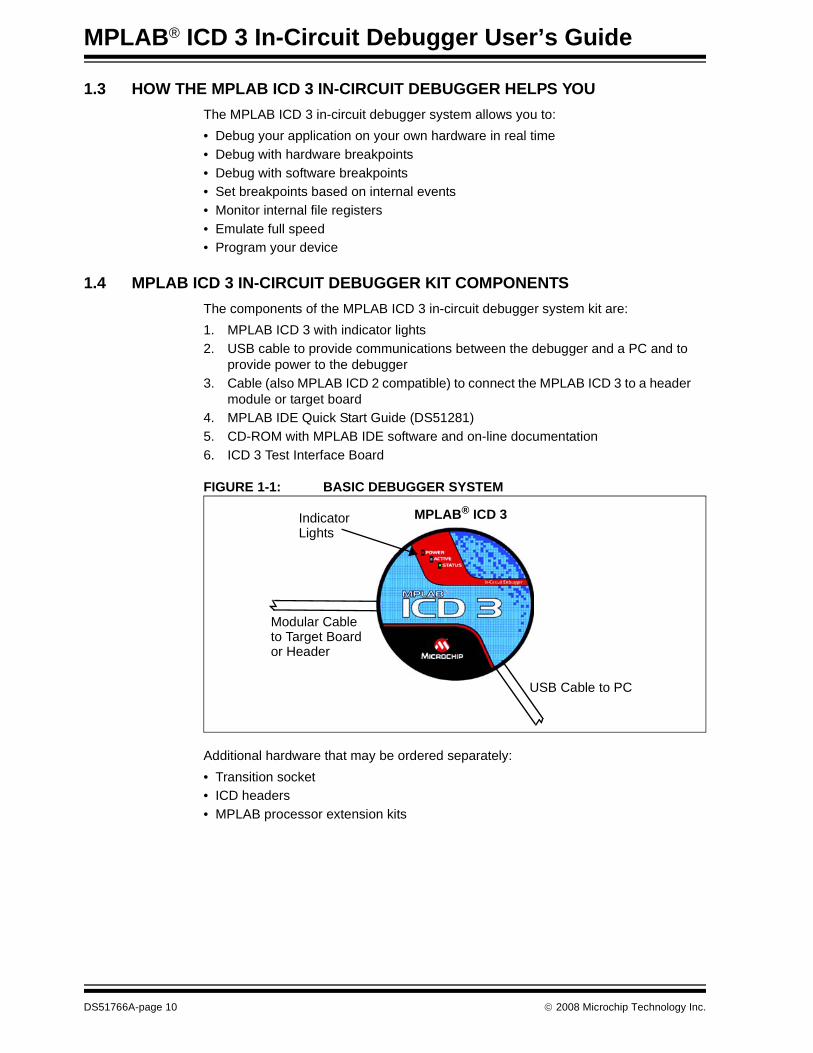
1.4 MPLAB ICD 3 IN-CIRCUIT DEBUGGER KIT COMPONENTSThe components of the MPLAB ICD 3 in-circuit debugger system kit are:1. MPLAB ICD 3 with indicator lights2. USB cable to provide communications between the debugger and a PC and to
provide power to the debugger3. Cable (also MPLAB ICD 2 compatible) to connect the MPLAB ICD 3 to a header
module or target board4. MPLAB IDE Quick Start Guide (DS51281)5. CD-ROM with MPLAB IDE software and on-line documentation6. ICD 3 Test Interface Board
FIGURE 1-1: BASIC DEBUGGER SYSTEM
Additional hardware that may be ordered separately:• Transition socket• ICD headers• MPLAB processor extension kits
MPLAB® ICD 3
Modular Cableto Target Board
USB Cable to PC
IndicatorLights
or Header
Overview
© 2008 Microchip Technology Inc. DS51766A-page 11
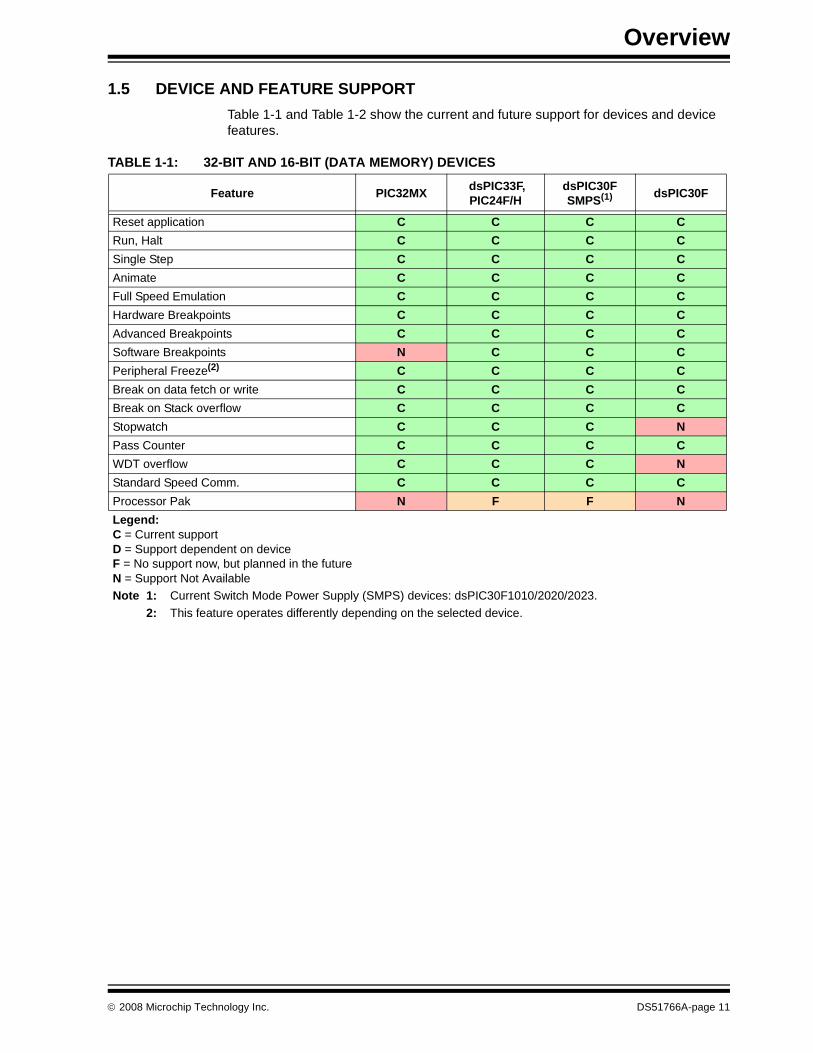
1.5 DEVICE AND FEATURE SUPPORTTable 1-1 and Table 1-2 show the current and future support for devices and device features.
TABLE 1-1: 32-BIT AND 16-BIT (DATA MEMORY) DEVICES
Feature PIC32MX dsPIC33F, PIC24F/H
dsPIC30F SMPS(1) dsPIC30F
Reset application C C C CRun, Halt C C C CSingle Step C C C CAnimate C C C CFull Speed Emulation C C C CHardware Breakpoints C C C CAdvanced Breakpoints C C C CSoftware Breakpoints N C C CPeripheral Freeze(2) C C C CBreak on data fetch or write C C C CBreak on Stack overflow C C C CStopwatch C C C NPass Counter C C C CWDT overflow C C C NStandard Speed Comm. C C C CProcessor Pak N F F NLegend:C = Current supportD = Support dependent on device F = No support now, but planned in the futureN = Support Not AvailableNote 1: Current Switch Mode Power Supply (SMPS) devices: dsPIC30F1010/2020/2023.
2: This feature operates differently depending on the selected device.
MPLAB® ICD 3 In-Circuit Debugger User’s Guide
DS51766A-page 12 © 2008 Microchip Technology Inc.
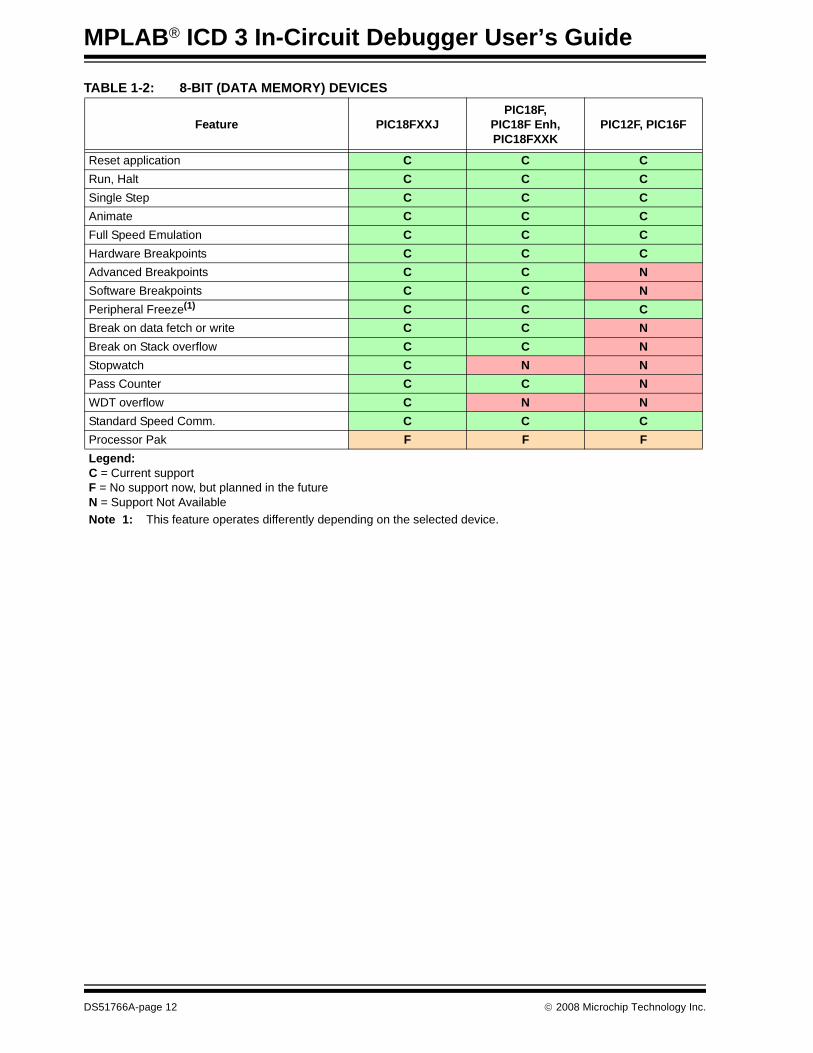
TABLE 1-2: 8-BIT (DATA MEMORY) DEVICES
Feature PIC18FXXJPIC18F,
PIC18F Enh, PIC18FXXK
PIC12F, PIC16F
Reset application C C CRun, Halt C C CSingle Step C C CAnimate C C CFull Speed Emulation C C CHardware Breakpoints C C CAdvanced Breakpoints C C NSoftware Breakpoints C C NPeripheral Freeze(1) C C CBreak on data fetch or write C C NBreak on Stack overflow C C NStopwatch C N NPass Counter C C NWDT overflow C N NStandard Speed Comm. C C CProcessor Pak F F FLegend:C = Current supportF = No support now, but planned in the futureN = Support Not AvailableNote 1: This feature operates differently depending on the selected device.
MPLAB® ICD 3 IN-CIRCUITDEBUGGER USER’S GUIDE
© 2008 Microchip Technology Inc. DS51766A-page 13
Chapter 2. Theory of Operation
2.1 INTRODUCTIONA simplified description of how the MPLAB ICD 3 in-circuit debugger system works is provided here. It is intended to provide enough information so a target board can be designed that is compatible with the debugger for both emulation and programming operations. The basic theory of in-circuit emulation and programming is described so that problems, if encountered, are quickly resolved.• MPLAB ICD 3 In-Circuit Debugger vs. MPLAB ICE 2000/4000 In-Circuit
Emulators• MPLAB ICD 3 In-Circuit Debugger vs. MPLAB ICD 2 Debugger• Debugger To Target Communication• Communication Connections• Debugging with the Debugger• Requirements For Debugging• Programming with the Debugger• Resources Used by the Debugger
2.2 MPLAB ICD 3 IN-CIRCUIT DEBUGGER VS. MPLAB ICE 2000/4000 IN-CIRCUIT EMULATORS
The MPLAB ICD 3 in-circuit debugger system is a next generation In-Circuit Debugger (ICD) system. It differs from classical in-circuit emulator systems (e.g., MPLAB ICE 2000/4000) in a single, but important way: the production device and emulation device are the same. This is a great benefit since differences (errata) between the production silicon and emulation silicon are eliminated. Additionally, as devices continue to operate at faster speeds, traditional emulator systems present bottlenecks caused by internal busses that must be carried off-chip to external memories and cannot offer full speed emulation.Another significant benefit is that there is no lead time between production silicon and emulation silicon. Further, a problem encountered on a production board can be easily debugged without having to install transition sockets and dealing with complicated cabling systems and setups to have access to the application.
2.3 MPLAB ICD 3 IN-CIRCUIT DEBUGGER VS. MPLAB ICD 2 DEBUGGERThe MPLAB ICD 3 in-circuit debugger system is similar in function to the MPLAB ICD 2 in-circuit debugger system, but surpasses it in speed and functionality. The MPLAB ICD 3 also: • Features USB high speed• Is USB powered• Is a hardware accelerator• Provides a programmable voltage power supply• Eliminates the RS-232 port• Includes a diagnostic self-test interface board
MPLAB® ICD 3 In-Circuit Debugger User’s Guide
DS51766A-page 14 © 2008 Microchip Technology Inc.
2.4 DEBUGGER TO TARGET COMMUNICATIONThe debugger system configurations are discussed in the following sections.
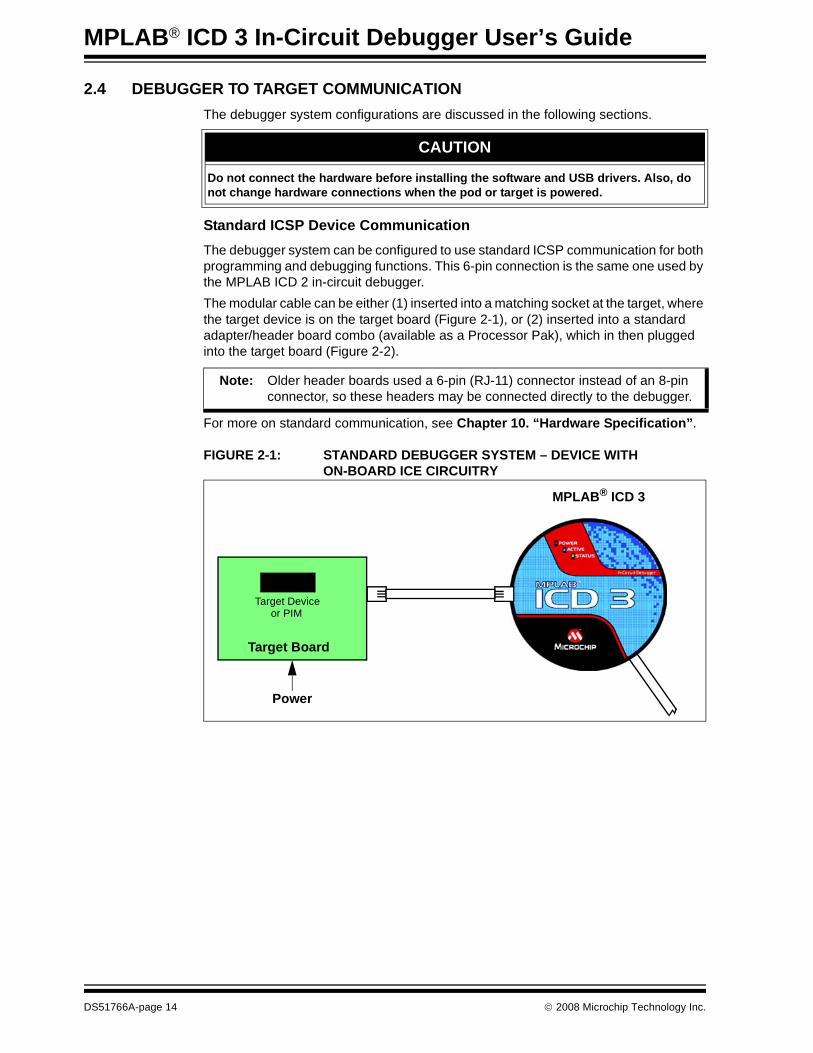
Standard ICSP Device CommunicationThe debugger system can be configured to use standard ICSP communication for both programming and debugging functions. This 6-pin connection is the same one used by the MPLAB ICD 2 in-circuit debugger.The modular cable can be either (1) inserted into a matching socket at the target, where the target device is on the target board (Figure 2-1), or (2) inserted into a standard adapter/header board combo (available as a Processor Pak), which in then plugged into the target board (Figure 2-2).
For more on standard communication, see Chapter 10. “Hardware Specification”.
FIGURE 2-1: STANDARD DEBUGGER SYSTEM – DEVICE WITH ON-BOARD ICE CIRCUITRY
CAUTION
Do not connect the hardware before installing the software and USB drivers. Also, do not change hardware connections when the pod or target is powered.
Note: Older header boards used a 6-pin (RJ-11) connector instead of an 8-pin connector, so these headers may be connected directly to the debugger.
MPLAB® ICD 3
Target Board
Target Deviceor PIM
Power
Theory of Operation
© 2008 Microchip Technology Inc. DS51766A-page 15
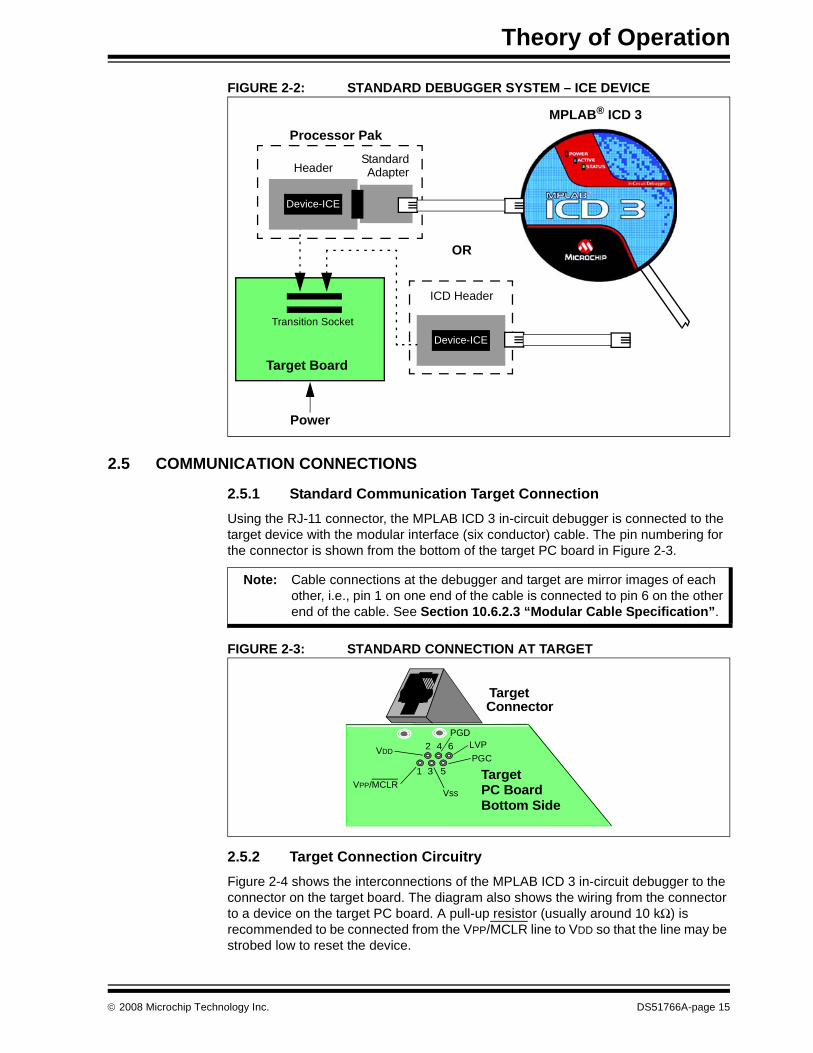
FIGURE 2-2: STANDARD DEBUGGER SYSTEM – ICE DEVICE
2.5 COMMUNICATION CONNECTIONS
2.5.1 Standard Communication Target ConnectionUsing the RJ-11 connector, the MPLAB ICD 3 in-circuit debugger is connected to the target device with the modular interface (six conductor) cable. The pin numbering for the connector is shown from the bottom of the target PC board in Figure 2-3.
FIGURE 2-3: STANDARD CONNECTION AT TARGET
2.5.2 Target Connection CircuitryFigure 2-4 shows the interconnections of the MPLAB ICD 3 in-circuit debugger to the connector on the target board. The diagram also shows the wiring from the connector to a device on the target PC board. A pull-up resistor (usually around 10 kΩ) is recommended to be connected from the VPP/MCLR line to VDD so that the line may be strobed low to reset the device.
MPLAB® ICD 3
Target Board
Transition Socket
Device-ICE
Processor Pak
StandardAdapterHeader
Device-ICE
ICD Header
OR
Power
Note: Cable connections at the debugger and target are mirror images of each other, i.e., pin 1 on one end of the cable is connected to pin 6 on the other end of the cable. See Section 10.6.2.3 “Modular Cable Specification”.
1
2
3
4
5
6
TargetConnector
Target
Bottom SidePC BoardVPP/MCLR
Vss
PGCVDD
PGDLVP
MPLAB® ICD 3 In-Circuit Debugger User’s Guide
DS51766A-page 16 © 2008 Microchip Technology Inc.
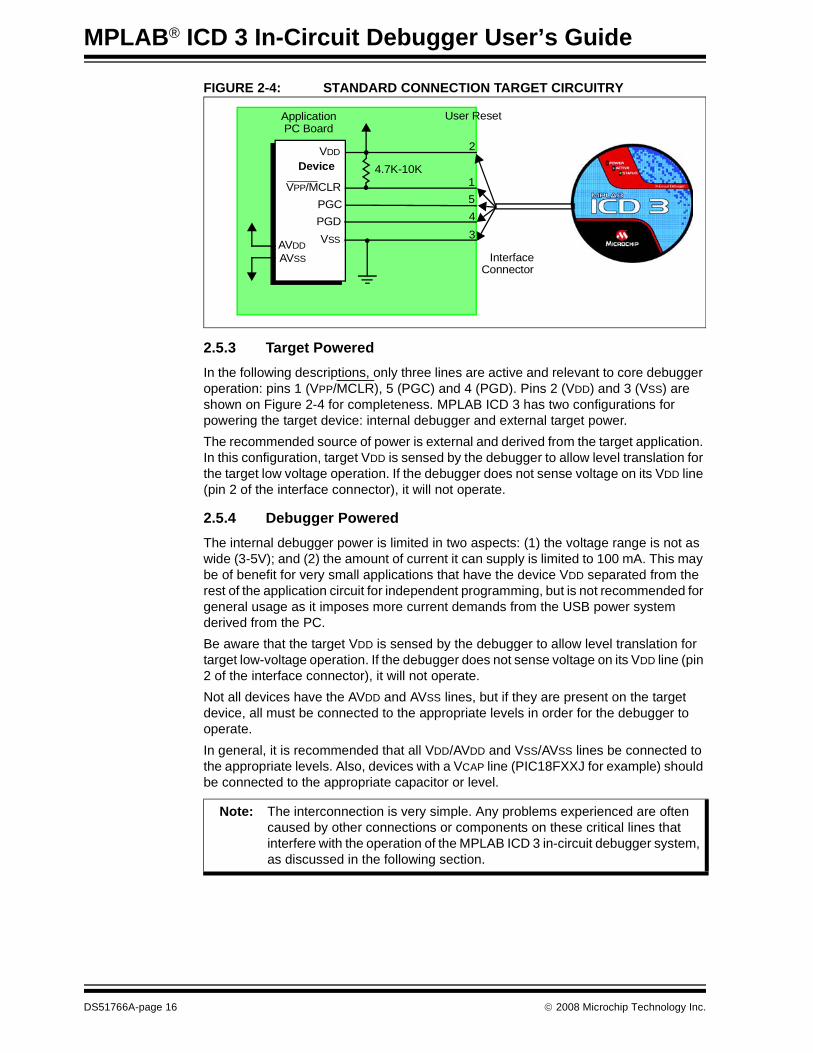
FIGURE 2-4: STANDARD CONNECTION TARGET CIRCUITRY
2.5.3 Target PoweredIn the following descriptions, only three lines are active and relevant to core debugger operation: pins 1 (VPP/MCLR), 5 (PGC) and 4 (PGD). Pins 2 (VDD) and 3 (VSS) are shown on Figure 2-4 for completeness. MPLAB ICD 3 has two configurations for powering the target device: internal debugger and external target power.The recommended source of power is external and derived from the target application. In this configuration, target VDD is sensed by the debugger to allow level translation for the target low voltage operation. If the debugger does not sense voltage on its VDD line (pin 2 of the interface connector), it will not operate.
2.5.4 Debugger PoweredThe internal debugger power is limited in two aspects: (1) the voltage range is not as wide (3-5V); and (2) the amount of current it can supply is limited to 100 mA. This may be of benefit for very small applications that have the device VDD separated from the rest of the application circuit for independent programming, but is not recommended for general usage as it imposes more current demands from the USB power system derived from the PC.Be aware that the target VDD is sensed by the debugger to allow level translation for target low-voltage operation. If the debugger does not sense voltage on its VDD line (pin 2 of the interface connector), it will not operate.Not all devices have the AVDD and AVSS lines, but if they are present on the target device, all must be connected to the appropriate levels in order for the debugger to operate.In general, it is recommended that all VDD/AVDD and VSS/AVSS lines be connected to the appropriate levels. Also, devices with a VCAP line (PIC18FXXJ for example) should be connected to the appropriate capacitor or level.
VDD
VPP/MCLRPGCPGDVSSAVDD
AVSS
2
1543
User Reset
4.7K-10K
InterfaceConnector
ApplicationPC Board
Device
Note: The interconnection is very simple. Any problems experienced are often caused by other connections or components on these critical lines that interfere with the operation of the MPLAB ICD 3 in-circuit debugger system, as discussed in the following section.
Theory of Operation
© 2008 Microchip Technology Inc. DS51766A-page 17
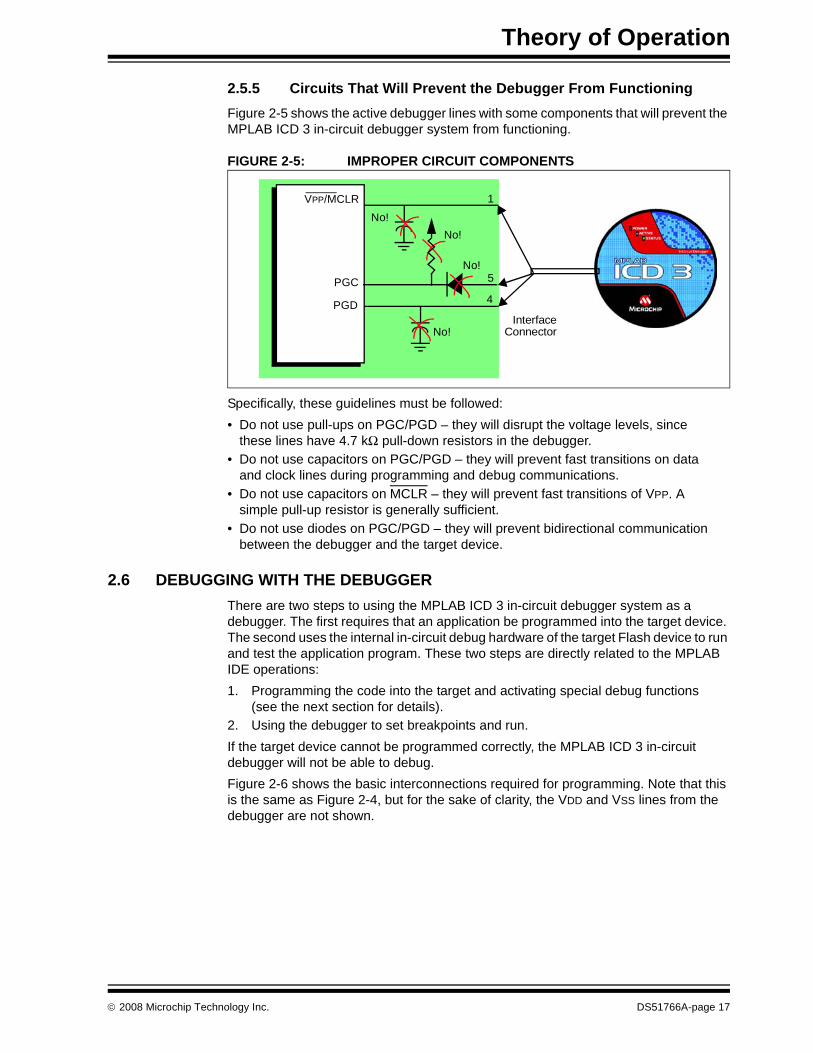
2.5.5 Circuits That Will Prevent the Debugger From FunctioningFigure 2-5 shows the active debugger lines with some components that will prevent the MPLAB ICD 3 in-circuit debugger system from functioning.
FIGURE 2-5: IMPROPER CIRCUIT COMPONENTS
Specifically, these guidelines must be followed:• Do not use pull-ups on PGC/PGD – they will disrupt the voltage levels, since
these lines have 4.7 kΩ pull-down resistors in the debugger.• Do not use capacitors on PGC/PGD – they will prevent fast transitions on data
and clock lines during programming and debug communications.• Do not use capacitors on MCLR – they will prevent fast transitions of VPP. A
simple pull-up resistor is generally sufficient.• Do not use diodes on PGC/PGD – they will prevent bidirectional communication
between the debugger and the target device.
2.6 DEBUGGING WITH THE DEBUGGERThere are two steps to using the MPLAB ICD 3 in-circuit debugger system as a debugger. The first requires that an application be programmed into the target device. The second uses the internal in-circuit debug hardware of the target Flash device to run and test the application program. These two steps are directly related to the MPLAB IDE operations:1. Programming the code into the target and activating special debug functions
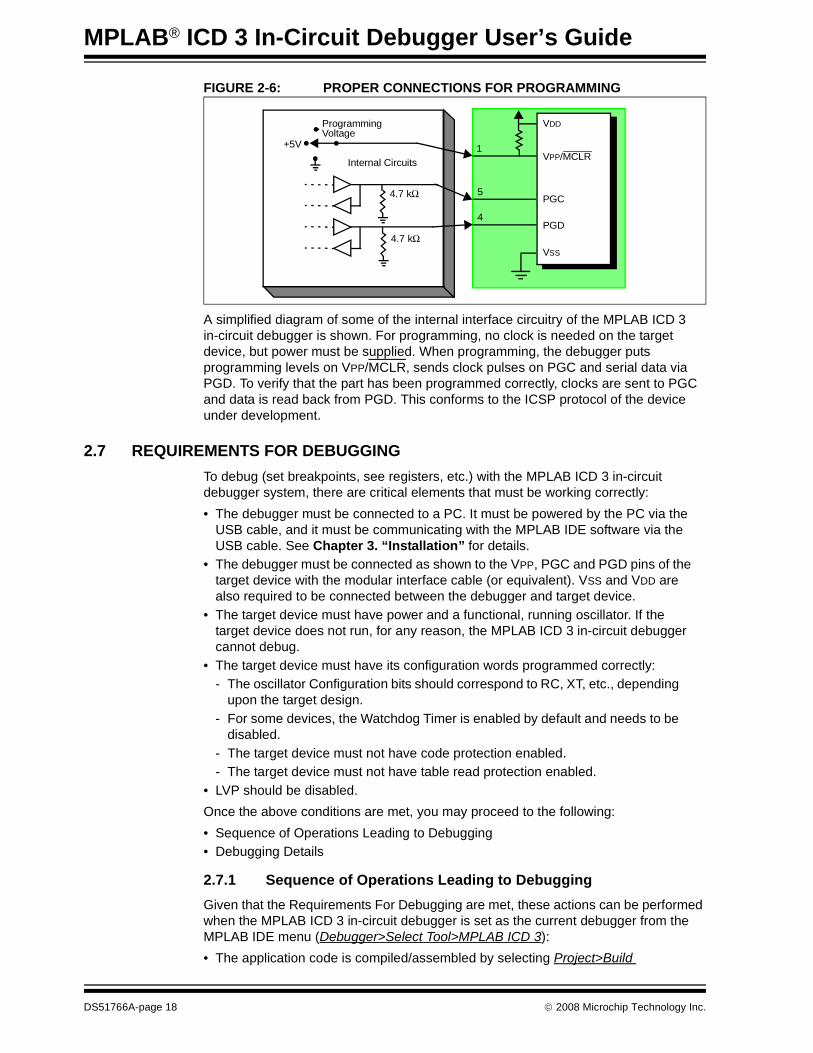
(see the next section for details).2. Using the debugger to set breakpoints and run.If the target device cannot be programmed correctly, the MPLAB ICD 3 in-circuit debugger will not be able to debug.Figure 2-6 shows the basic interconnections required for programming. Note that this is the same as Figure 2-4, but for the sake of clarity, the VDD and VSS lines from the debugger are not shown.
No!
No!
No!No!
VPP/MCLR
PGC
PGD
1
5
4
InterfaceConnector
MPLAB® ICD 3 In-Circuit Debugger User’s Guide
DS51766A-page 18 © 2008 Microchip Technology Inc.
FIGURE 2-6: PROPER CONNECTIONS FOR PROGRAMMING
A simplified diagram of some of the internal interface circuitry of the MPLAB ICD 3 in-circuit debugger is shown. For programming, no clock is needed on the target device, but power must be supplied. When programming, the debugger puts programming levels on VPP/MCLR, sends clock pulses on PGC and serial data via PGD. To verify that the part has been programmed correctly, clocks are sent to PGC and data is read back from PGD. This conforms to the ICSP protocol of the device under development.
2.7 REQUIREMENTS FOR DEBUGGINGTo debug (set breakpoints, see registers, etc.) with the MPLAB ICD 3 in-circuit debugger system, there are critical elements that must be working correctly:• The debugger must be connected to a PC. It must be powered by the PC via the
USB cable, and it must be communicating with the MPLAB IDE software via the USB cable. See Chapter 3. “Installation” for details.
• The debugger must be connected as shown to the VPP, PGC and PGD pins of the target device with the modular interface cable (or equivalent). VSS and VDD are also required to be connected between the debugger and target device.
• The target device must have power and a functional, running oscillator. If the target device does not run, for any reason, the MPLAB ICD 3 in-circuit debugger cannot debug.
• The target device must have its configuration words programmed correctly:- The oscillator Configuration bits should correspond to RC, XT, etc., depending
upon the target design.- For some devices, the Watchdog Timer is enabled by default and needs to be
disabled.- The target device must not have code protection enabled.- The target device must not have table read protection enabled.
• LVP should be disabled.Once the above conditions are met, you may proceed to the following:• Sequence of Operations Leading to Debugging• Debugging Details
2.7.1 Sequence of Operations Leading to DebuggingGiven that the Requirements For Debugging are met, these actions can be performed when the MPLAB ICD 3 in-circuit debugger is set as the current debugger from the MPLAB IDE menu (Debugger>Select Tool>MPLAB ICD 3):• The application code is compiled/assembled by selecting Project>Build
+5V
Programming
4.7 kΩ
4.7 kΩ
VPP/MCLR
PGC
PGD
1
5
4
Internal Circuits
VSS
VDDVoltage
Theory of Operation
© 2008 Microchip Technology Inc. DS51766A-page 19
Configuration>Debug.• When Debugger>Program is selected, the application code is programmed into
the device’s memory via the ICSP protocol as described above.• A small “debug executive” program is loaded into the high area of program
memory of the target device. Since the debug executive must reside in program memory, the application program must not use this reserved space. Some devices have special memory areas dedicated to the debug executive. Check your device data sheet for details.
• Special “in-circuit debug” registers in the target device are enabled. These allow the debug executive to be activated by the debugger.
• The target device is held in Reset by keeping the VPP/MCLR line low.
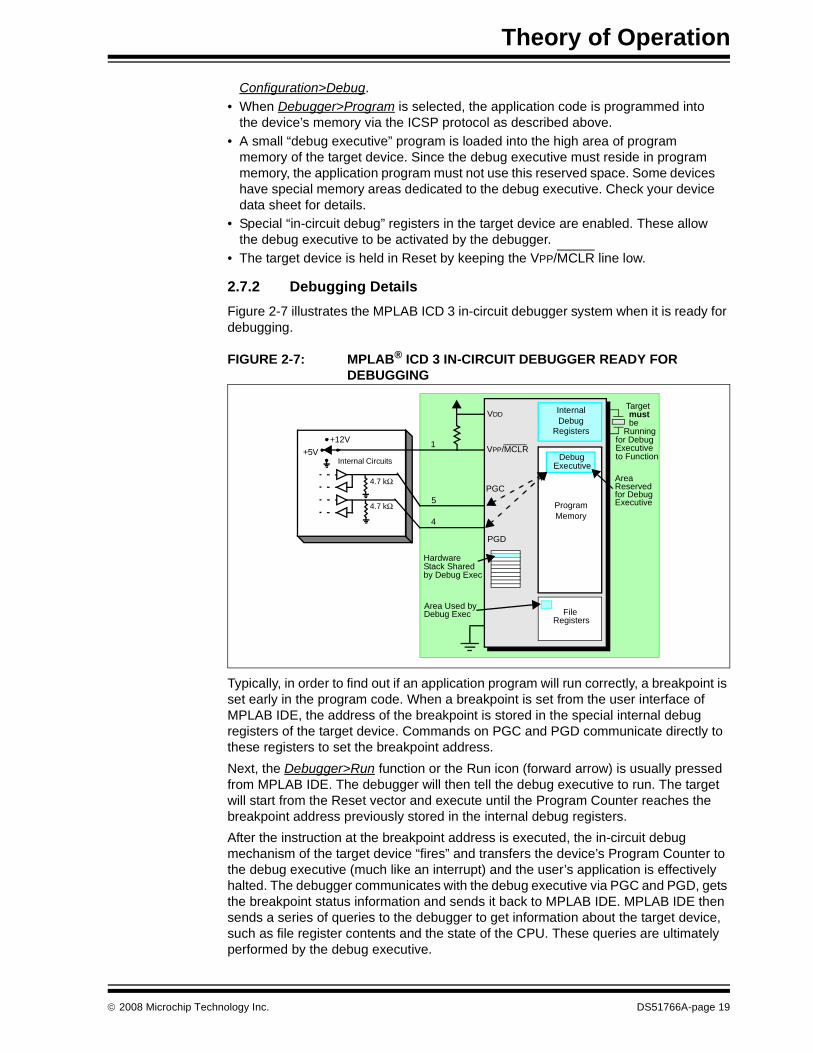
2.7.2 Debugging DetailsFigure 2-7 illustrates the MPLAB ICD 3 in-circuit debugger system when it is ready for debugging.
FIGURE 2-7: MPLAB® ICD 3 IN-CIRCUIT DEBUGGER READY FOR DEBUGGING
Typically, in order to find out if an application program will run correctly, a breakpoint is set early in the program code. When a breakpoint is set from the user interface of MPLAB IDE, the address of the breakpoint is stored in the special internal debug registers of the target device. Commands on PGC and PGD communicate directly to these registers to set the breakpoint address.Next, the Debugger>Run function or the Run icon (forward arrow) is usually pressed from MPLAB IDE. The debugger will then tell the debug executive to run. The target will start from the Reset vector and execute until the Program Counter reaches the breakpoint address previously stored in the internal debug registers.After the instruction at the breakpoint address is executed, the in-circuit debug mechanism of the target device “fires” and transfers the device’s Program Counter to the debug executive (much like an interrupt) and the user’s application is effectively halted. The debugger communicates with the debug executive via PGC and PGD, gets the breakpoint status information and sends it back to MPLAB IDE. MPLAB IDE then sends a series of queries to the debugger to get information about the target device, such as file register contents and the state of the CPU. These queries are ultimately performed by the debug executive.
+5V+12V
4.7 kΩ
4.7 kΩ
Internal Circuits
ProgramMemory
FileRegisters
InternalDebug
Registers
VPP/MCLR
PGC
PGD
1
5
4
ExecutiveDebug
Area Used by
Target
be Running
must
for DebugExecutiveto Function
Area
VDD
HardwareStack Sharedby Debug Exec
Debug Exec
Reserved for Debug
Executive
MPLAB® ICD 3 In-Circuit Debugger User’s Guide
DS51766A-page 20 © 2008 Microchip Technology Inc.
The debug executive runs just like an application in program memory. It uses some locations on the stack for its temporary variables. If the device does not run, for whatever reason, such as no oscillator, a faulty power supply connection, shorts on the target board, etc., then the debug executive cannot communicate to the MPLAB ICD 3 in-circuit debugger and MPLAB IDE will issue an error message.Another way to get a breakpoint is to press the MPLAB IDE’s Halt button (the “pause” symbol to the right of the Run arrow). This toggles the PGC and PGD lines so that the in-circuit debug mechanism of the target device switches the Program Counter from the user’s code in program memory to the debug executive. Again, the target application program is effectively halted, and MPLAB IDE uses the debugger communications with the debug executive to interrogate the state of the target device.
2.8 PROGRAMMING WITH THE DEBUGGERUse the MPLAB ICD 3 in-circuit debugger as a programmer to program an actual (non -ICE/-ICD) device, i.e., a device not on a header board. Select “MPLAB ICD 3” from Programmer>Select Programmer and compile/assemble your application code with the “Build Configuration” list box on the MPLAB IDE toolbar set to “Release”. Also, it may be set by selecting Project>Build Configuration>Release.All debug features are turned off or removed when the debugger is used as a programmer. When using the Programmer>Program selection to program a device, MPLAB IDE will disable the in-circuit debug registers so the MPLAB ICD 3 in-circuit debugger will program only the target application code and the Configuration bits (and EEPROM data, if available and selected) into the target device. The debug executive will not be loaded. As a programmer, the debugger can only toggle the MCLR line to reset and start the target. A breakpoint cannot be set, and register contents cannot be seen or altered.The MPLAB ICD 3 in-circuit debugger system programs the target using ICSP. VPP, PGC and PGD lines should be connected as described previously. No clock is required while programming, and all modes of the processor can be programmed, including code protect, Watchdog Timer enabled and table read protect.
2.9 RESOURCES USED BY THE DEBUGGERFor a complete list of resources used by the debugger for your device, please see the on-line help file in MPLAB IDE for the MPLAB ICD 3 in-circuit debugger.
MPLAB® ICD 3 IN-CIRCUITDEBUGGER USER’S GUIDE
© 2008 Microchip Technology Inc. DS51766A-page 21
Chapter 3. Installation
3.1 INTRODUCTIONHow to install the MPLAB ICD 3 in-circuit debugger system is discussed.• Installing the Software• Installing the USB Device Drivers• Connecting the Target• Setting Up the Target Board• Setting Up MPLAB IDE
3.2 INSTALLING THE SOFTWARETo install the MPLAB IDE software, first acquire the latest MPLAB IDE installation executable (MPxxxxx.exe, where xxxxx represents the version of MPLAB IDE) from either the Microchip web site (www.microchip.com) or the MPLAB IDE CD-ROM (DS51123). Then run the executable and follow the screens to install MPLAB IDE.
3.3 INSTALLING THE USB DEVICE DRIVERSInstalling MPLAB IDE will preinstall the USB device drivers for the MPLAB ICD 3 in-circuit debugger. Therefore, once you have installed MPLAB IDE, connect the debugger to the PC with a USB cable and follow the Windows “New Hardware Wizard” to automatically install the drivers.Expanded USB device driver installation instructions may found at:MPLAB IDE installation directory\ICD 3\Drivers\ddri.htm
Note: MPLAB IDE v8.15 or greater is required to use the MPLAB ICD 3 in-circuit debugger.
Note: If a new MPLAB ICD 3 is connected to your PC, you will need to reinstall the drivers for the new unit.
MPLAB® ICD 3 In-Circuit Debugger User’s Guide
DS51766A-page 22 © 2008 Microchip Technology Inc.
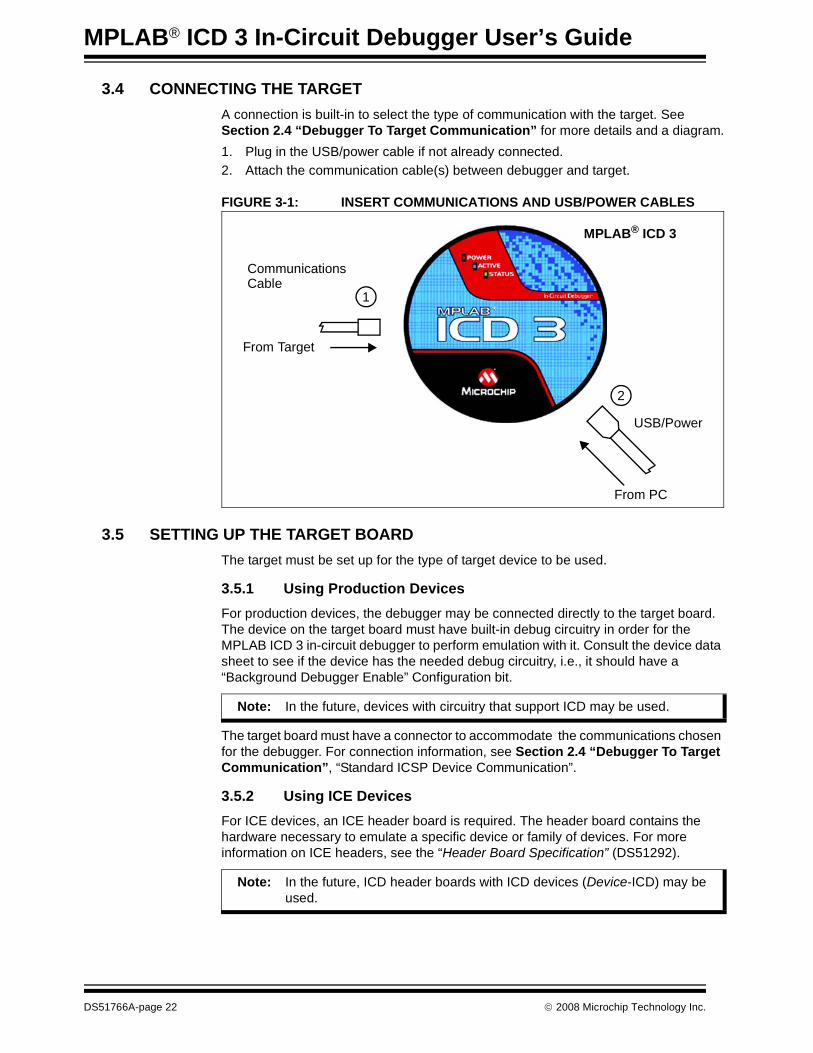
3.4 CONNECTING THE TARGETA connection is built-in to select the type of communication with the target. See Section 2.4 “Debugger To Target Communication” for more details and a diagram.1. Plug in the USB/power cable if not already connected.2. Attach the communication cable(s) between debugger and target.
FIGURE 3-1: INSERT COMMUNICATIONS AND USB/POWER CABLES
3.5 SETTING UP THE TARGET BOARDThe target must be set up for the type of target device to be used.
3.5.1 Using Production DevicesFor production devices, the debugger may be connected directly to the target board. The device on the target board must have built-in debug circuitry in order for the MPLAB ICD 3 in-circuit debugger to perform emulation with it. Consult the device data sheet to see if the device has the needed debug circuitry, i.e., it should have a “Background Debugger Enable” Configuration bit.
The target board must have a connector to accommodate the communications chosen for the debugger. For connection information, see Section 2.4 “Debugger To Target Communication”, “Standard ICSP Device Communication”.
3.5.2 Using ICE DevicesFor ICE devices, an ICE header board is required. The header board contains the hardware necessary to emulate a specific device or family of devices. For more information on ICE headers, see the “Header Board Specification” (DS51292).
USB/Power
From PC
CommunicationsCable
From Target
2
1
MPLAB® ICD 3
Note: In the future, devices with circuitry that support ICD may be used.
Note: In the future, ICD header boards with ICD devices (Device-ICD) may be used.
Installation
© 2008 Microchip Technology Inc. DS51766A-page 23
A transition socket is used with the ICE header to connect the header to the target board. Transition sockets are available in various styles to allow a common header to be connected to one of the supported surface mount package styles. For more information on transition sockets, see the “Transition Socket Specification” (DS51194).Header board layout will be different for headers or processor extension packs. For connection information, see Section 2.4 “Debugger To Target Communication”, “Standard ICSP Device Communication”.
3.5.3 Powering the TargetThere are a couple of configurations for powering MPLAB ICD 3 and the target.These are configuration essentials:• When using the USB connection, MPLAB ICD 3 can be powered from the PC but
it can only provide a limited amount of current, up to 100 mA, at VDD from 3-5V to a small target board.
• The desired method is for the target to provide VDD as it can provide a wider voltage range from 2-5V. The additional benefit is that plug-and-play target detection facility is inherited, i.e., MPLAB IDE will let you know in the Output window when it has detected the target and has detected the device.
If you have not already done so, connect the MPLAB ICD 3 to the target using the appropriate cables (see Section 3.4 “Connecting the Target”). Then power the target. If you are powering the target through the MPLAB ICD 3, see Section 9.5.8 “Settings Dialog, Power Tab” for instructions.
3.6 SETTING UP MPLAB IDEOnce the hardware is connected and powered, MPLAB IDE may be set up for use with the MPLAB ICD 3 in-circuit debugger.On some devices, you must select the communications channel in the Configuration bits, e.g., PGC1/EMUC1 and PGD1/EMUD1. Make sure the pins selected here are the same ones physically connected to the device.For more on setting up a project and getting started with MPLAB ICD 3, see Chapter 4. “General Setup”. To walk through the process of programming and debugging a device with the MPLAB ICD 3, see Chapter 5. “Tutorial”.
Note: The target voltage is only used for powering up the drivers for the ICSP interface; the target voltage does not power up the MPLAB ICD 3. The MPLAB ICD 3 system power is derived strictly from the USB port.

MPLAB® ICD 3 In-Circuit Debugger User’s Guide
DS51766A-page 24 © 2008 Microchip Technology Inc.
NOTES:
MPLAB® ICD 3 IN-CIRCUITDEBUGGER USER’S GUIDE
© 2008 Microchip Technology Inc. DS51766A-page 25
Chapter 4. General Setup
4.1 INTRODUCTIONHow to get started using the MPLAB ICD 3 in-circuit debugger is discussed.• Starting the MPLAB IDE Software• Creating a Project• Viewing the Project• Building the Project• Setting Configuration Bits• Setting the Debugger as the Debugger or Programmer• Debugger/Programmer Limitations
4.2 STARTING THE MPLAB IDE SOFTWAREAfter installing the MPLAB IDE software (Section 3.2 “Installing the Software”), invoke it by using any of these methods:• Select Start>Programs>Microchip>MPLAB IDE vx.xx>MPLAB IDE, where vx.xx is
the version number.• Double click the MPLAB IDE desktop icon.• Execute the file mplab.exe in the \core subdirectory of the MPLAB IDE
installation directory.For more information on using the software, see:• “MPLAB IDE User's Guide” (DS51519) – Comprehensive guide for using MPLAB
IDE.• “MPLAB IDE Quick Start Guide” (DS51281) – Chapters 1 and 2 of the user's
guide.• The on-line help files – Contains the most up-to-date information on MPLAB IDE
and MPLAB ICD 3 in-circuit debugger.• Readme files – Last minute information on each release is included in Readme for MPLAB IDE.txt and Readme for MPLAB ICD 3 Debugger.txt. Both files are found in the Readmes subdirectory of the MPLAB IDE installation directory.
MPLAB® ICD 3 In-Circuit Debugger User’s Guide
DS51766A-page 26 © 2008 Microchip Technology Inc.
4.3 CREATING A PROJECTThe easiest way to create a new project is to select Project>Project Wizard. With the help of the Project Wizard, a new project and the language tools for building that project can be created. The wizard will guide you through the process of adding source files, libraries, linker scripts, etc., to the various “nodes” on the project window. See MPLAB IDE documentation for more detail on using this wizard. The basic steps are provided here:• Select your device (e.g., PIC24FJ128GA010)• Select a language toolsuite (e.g., Microchip C30 Toolsuite)• Name the project• Add application files (e.g., program.c, support.s, counter.asm)
4.4 VIEWING THE PROJECTAfter the Project Wizard has created a project, the project and its associated files are visible in the Project window. Additional files can be added to the project using the Proj-ect window. Right click on any line in the project window tree to pop up a menu with additional options for adding and removing files.See MPLAB IDE documentation for more detail on using the Project window.
4.5 BUILDING THE PROJECTAfter the project is created, the application needs to be built. This will create object (hex) code for the application that can be programmed into the target by the MPLAB ICD 3 in-circuit debugger.To set build options, select Project>Build Options>Project.
When done, choose Project>Build All to build the project.
Note: If you do not have a custom linker script in your project, the Project Manager will select the appropriate linker script for you.
Note: On the Project Manager toolbar (View>Toolbars>Project Manager), select “Debug” from the drop-down list when using the MPLAB ICD 3 as a debugger, or select “Release” when using it as a programmer.
General Setup
© 2008 Microchip Technology Inc. DS51766A-page 27
4.6 SETTING CONFIGURATION BITSAlthough device Configuration bits may be set in code, they also may be set in the MPLAB IDE Configuration window. Select Configure>Configuration Bits. By clicking on the text in the “Settings” column, these can be changed.Some Configuration bits of interest are:• Watchdog Timer Enable – On most devices, the Watchdog Timer is enabled
initially. It is usually a good idea to disable this bit.• Comm Channel Select – For some devices, you will need to select the commun-
cations channel for the device, e.g., PGC1/EMUC1 and PGD1/EMUD1. Make sure the pins selected here are the same ones physically connected to the device.
• Oscillator – Select the configuration setting that matches the target oscillator.
4.7 SETTING THE DEBUGGER AS THE DEBUGGER OR PROGRAMMERSelect Debugger>Select Tool>MPLAB ICD 3 to choose the MPLAB ICD 3 in-circuit debugger as the debug tool. The Debugger menu and MPLAB IDE toolbar will change to display debug options once the tool is selected. Also, the Output window will open and messages concerning MPLAB ICD 3 status and communications will be displayed on the MPLAB ICD 3 tab. For more information, see Section 9.2 “Debugging Functions” and Section 9.3 “Debugging Dialogs/Windows”.Select Programmer>Select Programmer>MPLAB ICD 3 to choose the MPLAB ICD 3 in-circuit debugger as the programmer tool. The Programmer menu and MPLAB IDE toolbar will change to display programmer options once the tool is selected. Also, the Output window will open and messages concerning ICE status and communications will be displayed on the MPLAB ICD 3 tab. For more information, see Section 9.4 “Programming Functions”.Select Debugger>Settings or Programmer>Settings to open the Settings dialog (Section 9.5 “Settings Dialog”) and set up options as needed.If errors occurs, see:• Chapter 7. “Error Messages”• Chapter 6. “Frequently Asked Questions (FAQs)”• Section 10.7 “ICD 3 Test Interface Board”
4.8 DEBUGGER/PROGRAMMER LIMITATIONSFor a complete list of debugger limitations for your device, please see the MPLAB ICD 3 on-line help file in MPLAB IDE by selecting Help>Topics>MPLAB ICD 3 and click OK.

MPLAB® ICD 3 In-Circuit Debugger User’s Guide
DS51766A-page 28 © 2008 Microchip Technology Inc.
NOTES:
MPLAB® ICD 3 IN-CIRCUITDEBUGGER USER’S GUIDE
© 2008 Microchip Technology Inc. DS51766A-page 29
Chapter 5. Tutorial
5.1 INTRODUCTIONThis tutorial walks you through the process of developing a simple project using the sample programs counter.c and timer.c. This is an implementation of the PIC24FJ128GA010 device using the Explorer 16 Demo Board (DM240001). The program counter.c is a simple counting program. The incremental count, delayed by using Timer 1 (timer.c), is displayed via Port A on the demo board’s LEDs.Topics covered in this chapter:• Setting Up the Environment and Selecting the Device• Creating the Application Code• Running the Project Wizard• Viewing the Project• Viewing Debug Options• Setting Up the Demo Board• Setting Up the Demo Board• Loading Program Code For Debugging• Running Debug Code• Debugging Code Using Breakpoints• Programming the Application
MPLAB® ICD 3 In-Circuit Debugger User’s Guide
DS51766A-page 30 © 2008 Microchip Technology Inc.
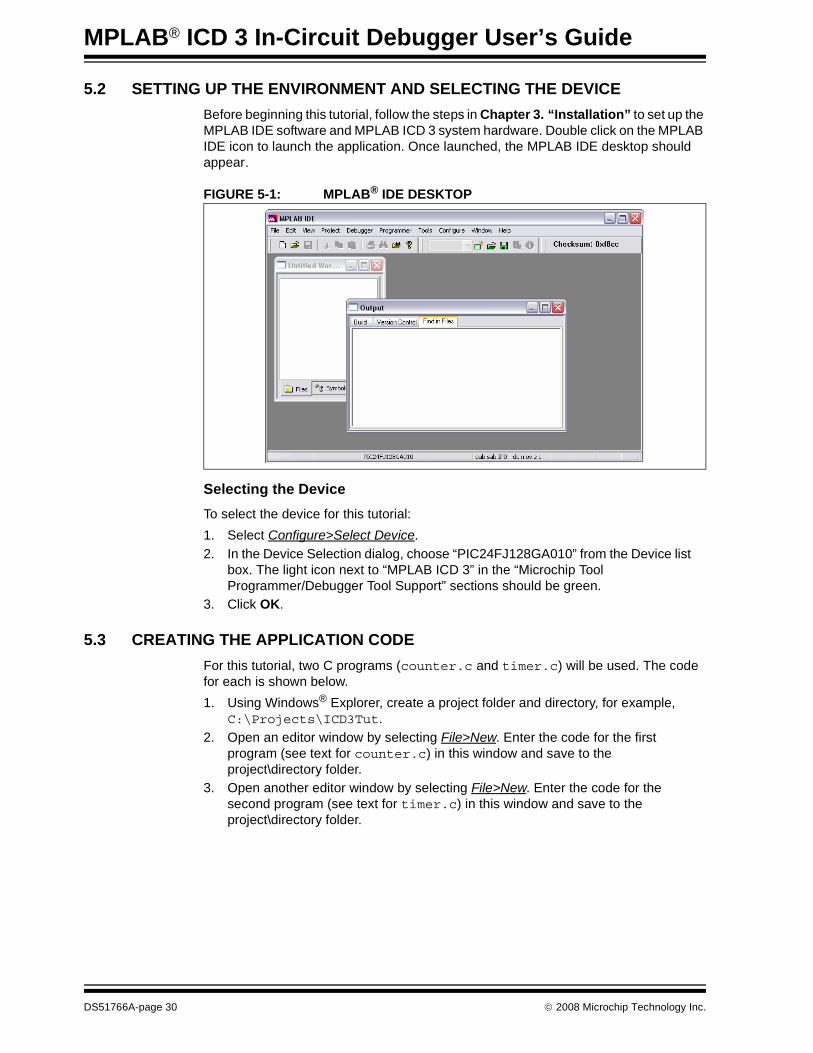
5.2 SETTING UP THE ENVIRONMENT AND SELECTING THE DEVICEBefore beginning this tutorial, follow the steps in Chapter 3. “Installation” to set up the MPLAB IDE software and MPLAB ICD 3 system hardware. Double click on the MPLAB IDE icon to launch the application. Once launched, the MPLAB IDE desktop should appear.
FIGURE 5-1: MPLAB® IDE DESKTOP
Selecting the DeviceTo select the device for this tutorial:1. Select Configure>Select Device.2. In the Device Selection dialog, choose “PIC24FJ128GA010” from the Device list
box. The light icon next to “MPLAB ICD 3” in the “Microchip Tool Programmer/Debugger Tool Support” sections should be green.
3. Click OK.
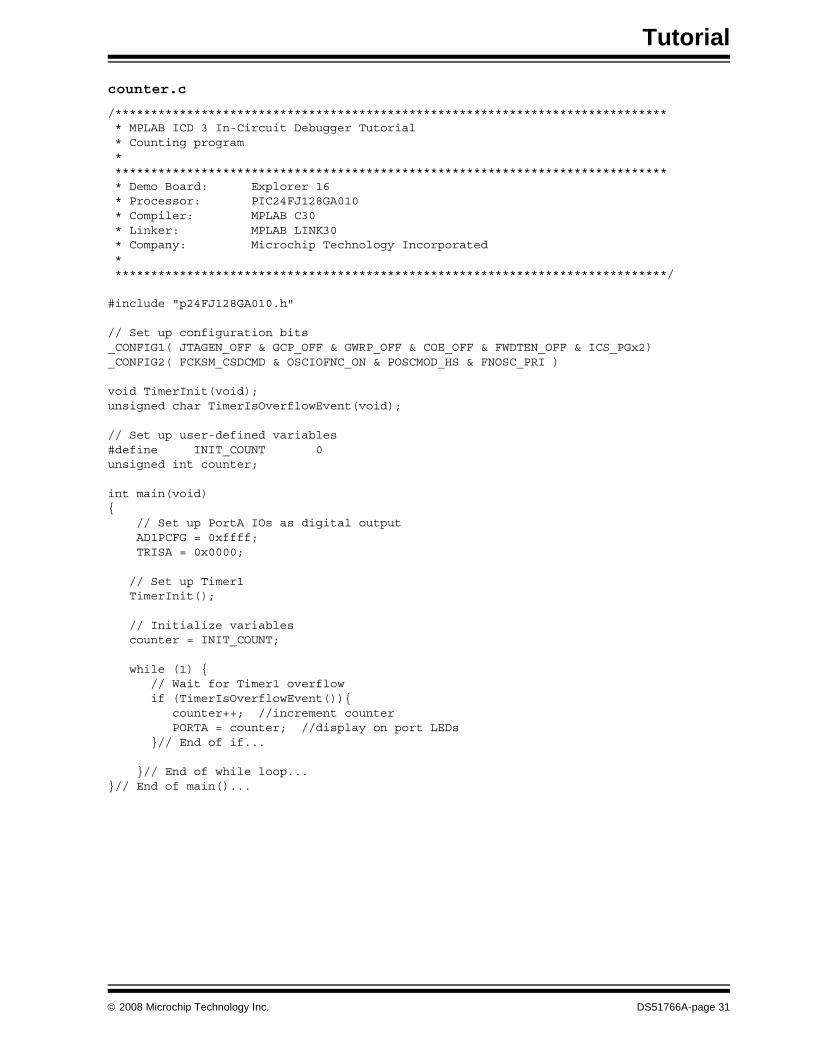
5.3 CREATING THE APPLICATION CODEFor this tutorial, two C programs (counter.c and timer.c) will be used. The code for each is shown below.1. Using Windows® Explorer, create a project folder and directory, for example,
C:\Projects\ICD3Tut.2. Open an editor window by selecting File>New. Enter the code for the first
program (see text for counter.c) in this window and save to the project\directory folder.
3. Open another editor window by selecting File>New. Enter the code for the second program (see text for timer.c) in this window and save to the project\directory folder.
Tutorial
© 2008 Microchip Technology Inc. DS51766A-page 31
counter.c
/***************************************************************************** * MPLAB ICD 3 In-Circuit Debugger Tutorial * Counting program * ***************************************************************************** * Demo Board: Explorer 16 * Processor: PIC24FJ128GA010 * Compiler: MPLAB C30 * Linker: MPLAB LINK30 * Company: Microchip Technology Incorporated * *****************************************************************************/
#include "p24FJ128GA010.h"
// Set up configuration bits_CONFIG1( JTAGEN_OFF & GCP_OFF & GWRP_OFF & COE_OFF & FWDTEN_OFF & ICS_PGx2)_CONFIG2( FCKSM_CSDCMD & OSCIOFNC_ON & POSCMOD_HS & FNOSC_PRI )
void TimerInit(void);unsigned char TimerIsOverflowEvent(void);
// Set up user-defined variables#define INIT_COUNT 0unsigned int counter;
int main(void){ // Set up PortA IOs as digital output AD1PCFG = 0xffff; TRISA = 0x0000;
// Set up Timer1 TimerInit();
// Initialize variables counter = INIT_COUNT;
while (1) { // Wait for Timer1 overflow if (TimerIsOverflowEvent()){ counter++; //increment counter PORTA = counter; //display on port LEDs }// End of if...
}// End of while loop...}// End of main()...
MPLAB® ICD 3 In-Circuit Debugger User’s Guide
DS51766A-page 32 © 2008 Microchip Technology Inc.
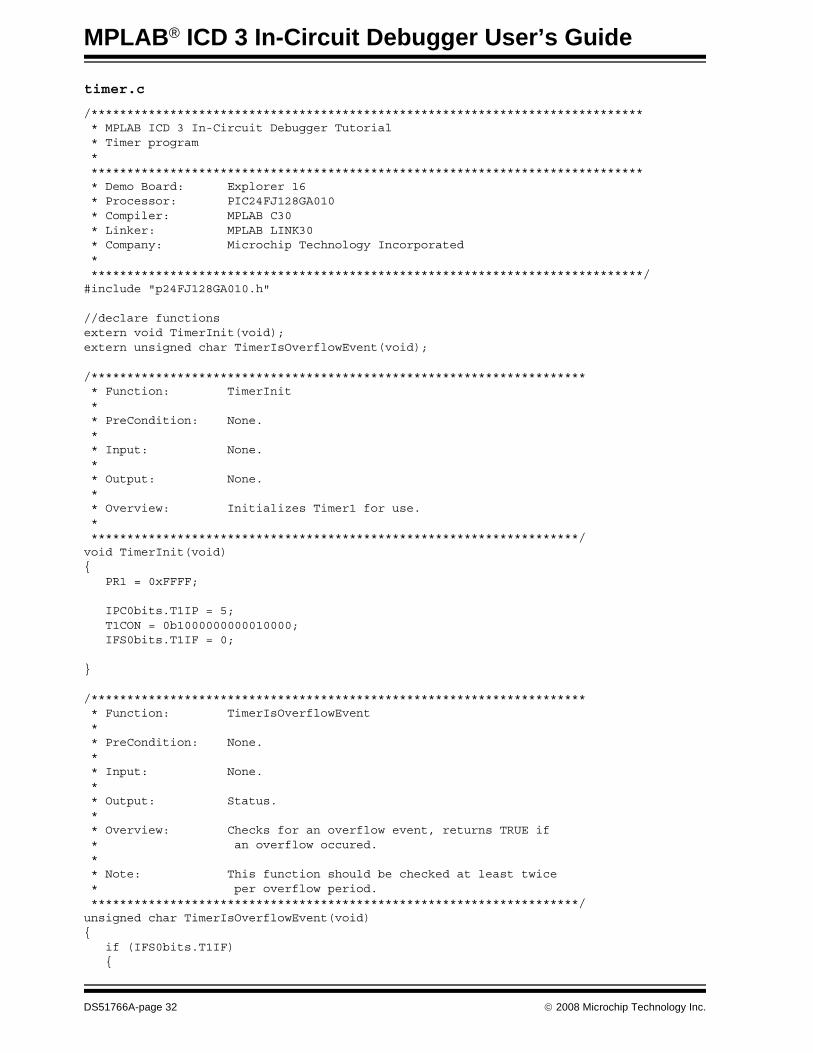
timer.c
/***************************************************************************** * MPLAB ICD 3 In-Circuit Debugger Tutorial * Timer program * ***************************************************************************** * Demo Board: Explorer 16 * Processor: PIC24FJ128GA010 * Compiler: MPLAB C30 * Linker: MPLAB LINK30 * Company: Microchip Technology Incorporated * *****************************************************************************/#include "p24FJ128GA010.h"
//declare functionsextern void TimerInit(void);extern unsigned char TimerIsOverflowEvent(void);
/********************************************************************* * Function: TimerInit * * PreCondition: None. * * Input: None. * * Output: None. * * Overview: Initializes Timer1 for use. * ********************************************************************/void TimerInit(void){ PR1 = 0xFFFF;
IPC0bits.T1IP = 5; T1CON = 0b1000000000010000; IFS0bits.T1IF = 0;
}
/********************************************************************* * Function: TimerIsOverflowEvent * * PreCondition: None. * * Input: None. * * Output: Status. * * Overview: Checks for an overflow event, returns TRUE if * an overflow occured. * * Note: This function should be checked at least twice * per overflow period. ********************************************************************/unsigned char TimerIsOverflowEvent(void){ if (IFS0bits.T1IF) {
Tutorial
© 2008 Microchip Technology Inc. DS51766A-page 33
IFS0bits.T1IF = 0; TMR1 = 0; return(1); }return(0);}
/********************************************************************* * EOF ********************************************************************/
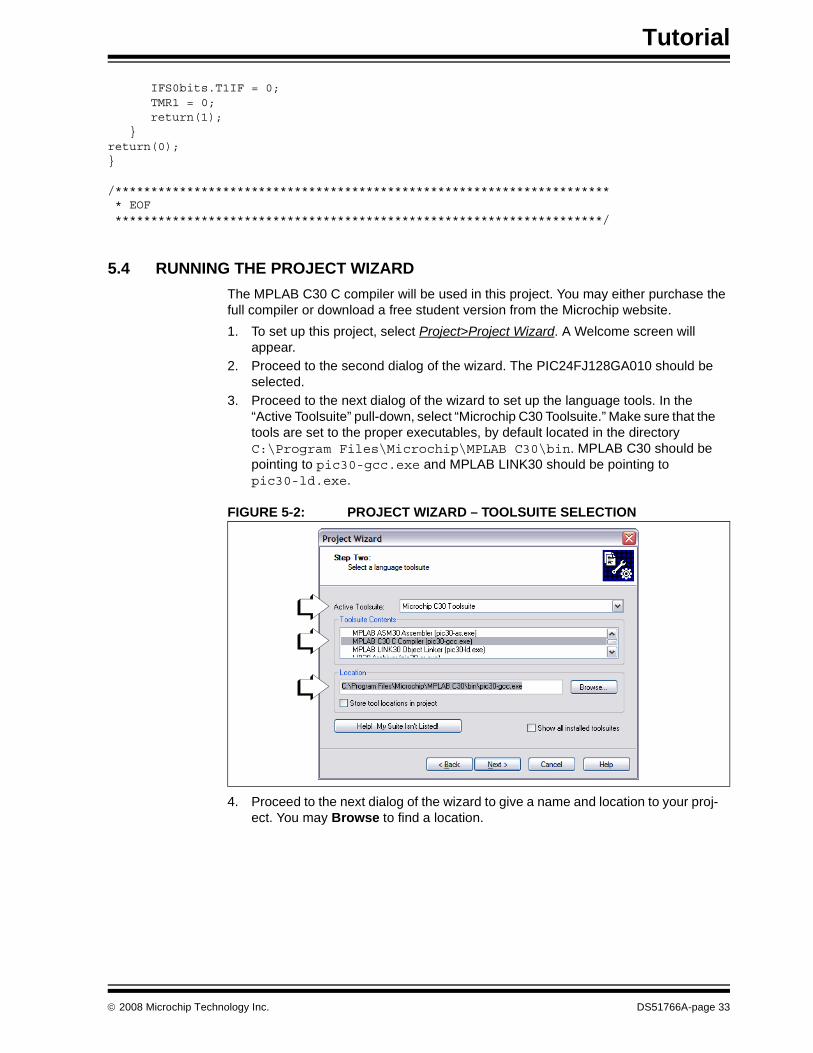
5.4 RUNNING THE PROJECT WIZARDThe MPLAB C30 C compiler will be used in this project. You may either purchase the full compiler or download a free student version from the Microchip website.1. To set up this project, select Project>Project Wizard. A Welcome screen will
appear.2. Proceed to the second dialog of the wizard. The PIC24FJ128GA010 should be
selected.3. Proceed to the next dialog of the wizard to set up the language tools. In the
“Active Toolsuite” pull-down, select “Microchip C30 Toolsuite.” Make sure that the tools are set to the proper executables, by default located in the directory C:\Program Files\Microchip\MPLAB C30\bin. MPLAB C30 should be pointing to pic30-gcc.exe and MPLAB LINK30 should be pointing to pic30-ld.exe.
FIGURE 5-2: PROJECT WIZARD – TOOLSUITE SELECTION
4. Proceed to the next dialog of the wizard to give a name and location to your proj-ect. You may Browse to find a location.
MPLAB® ICD 3 In-Circuit Debugger User’s Guide
DS51766A-page 34 © 2008 Microchip Technology Inc.
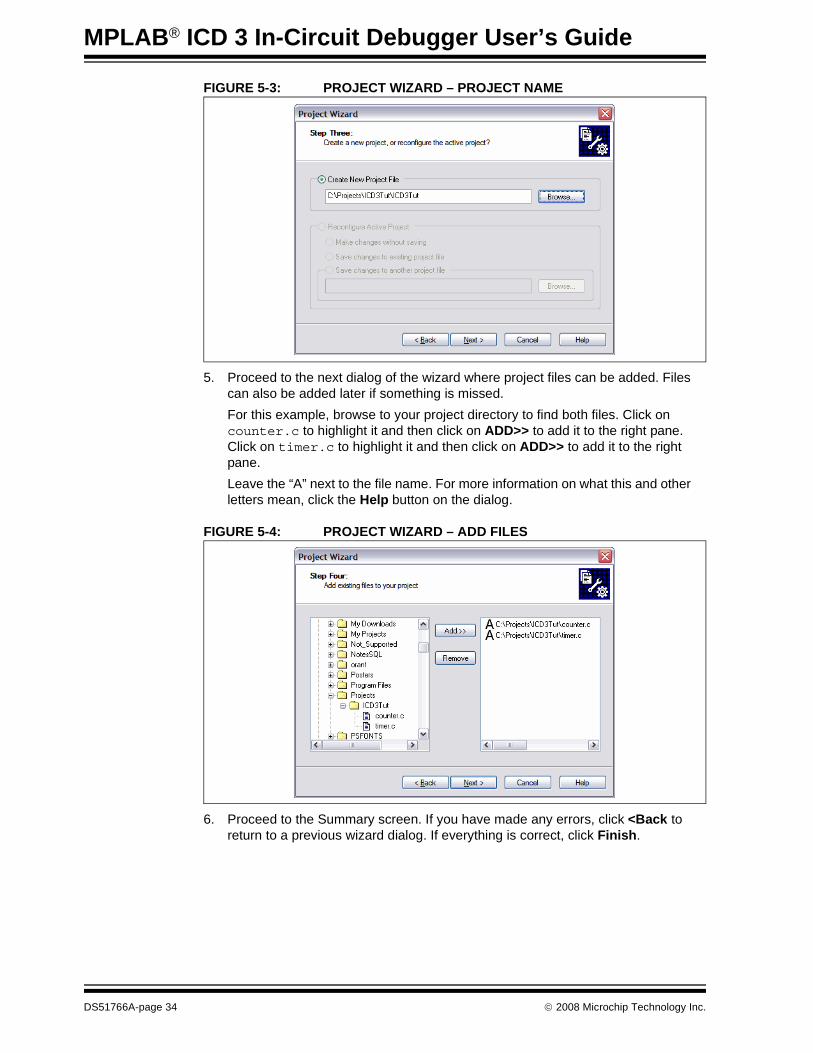
FIGURE 5-3: PROJECT WIZARD – PROJECT NAME
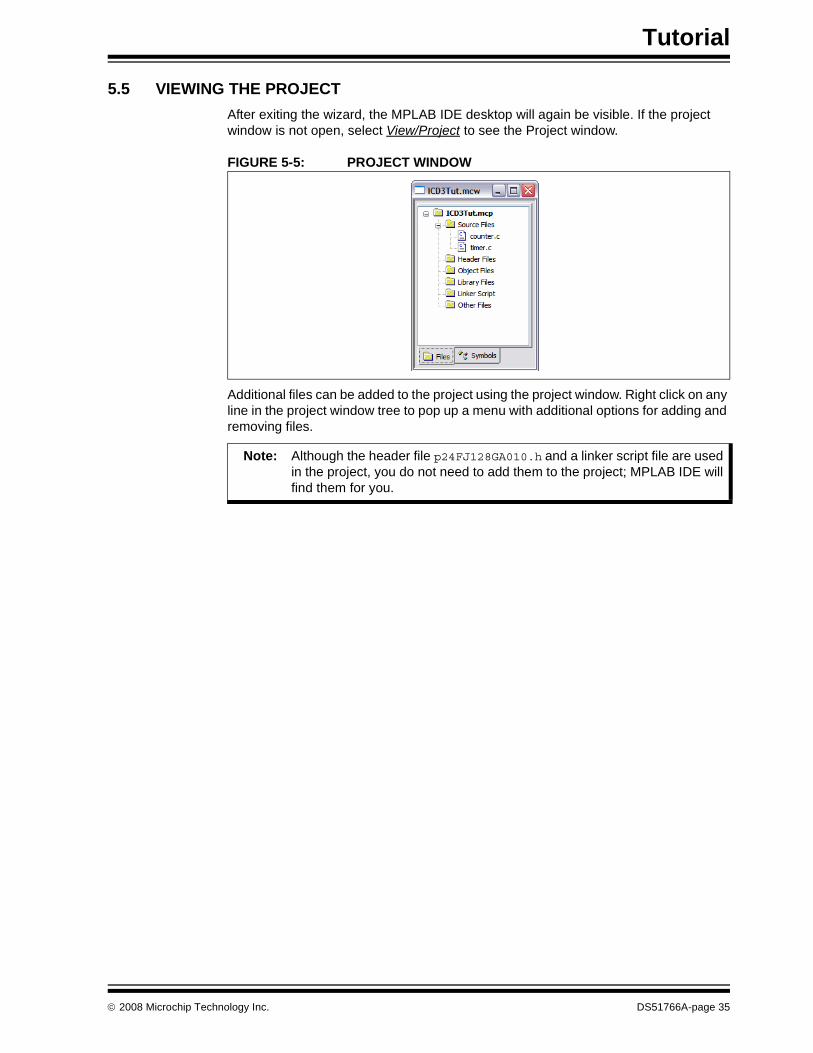
5. Proceed to the next dialog of the wizard where project files can be added. Files can also be added later if something is missed.For this example, browse to your project directory to find both files. Click on counter.c to highlight it and then click on ADD>> to add it to the right pane. Click on timer.c to highlight it and then click on ADD>> to add it to the right pane.Leave the “A” next to the file name. For more information on what this and other letters mean, click the Help button on the dialog.
FIGURE 5-4: PROJECT WIZARD – ADD FILES
6. Proceed to the Summary screen. If you have made any errors, click <Back to return to a previous wizard dialog. If everything is correct, click Finish.
Tutorial
© 2008 Microchip Technology Inc. DS51766A-page 35
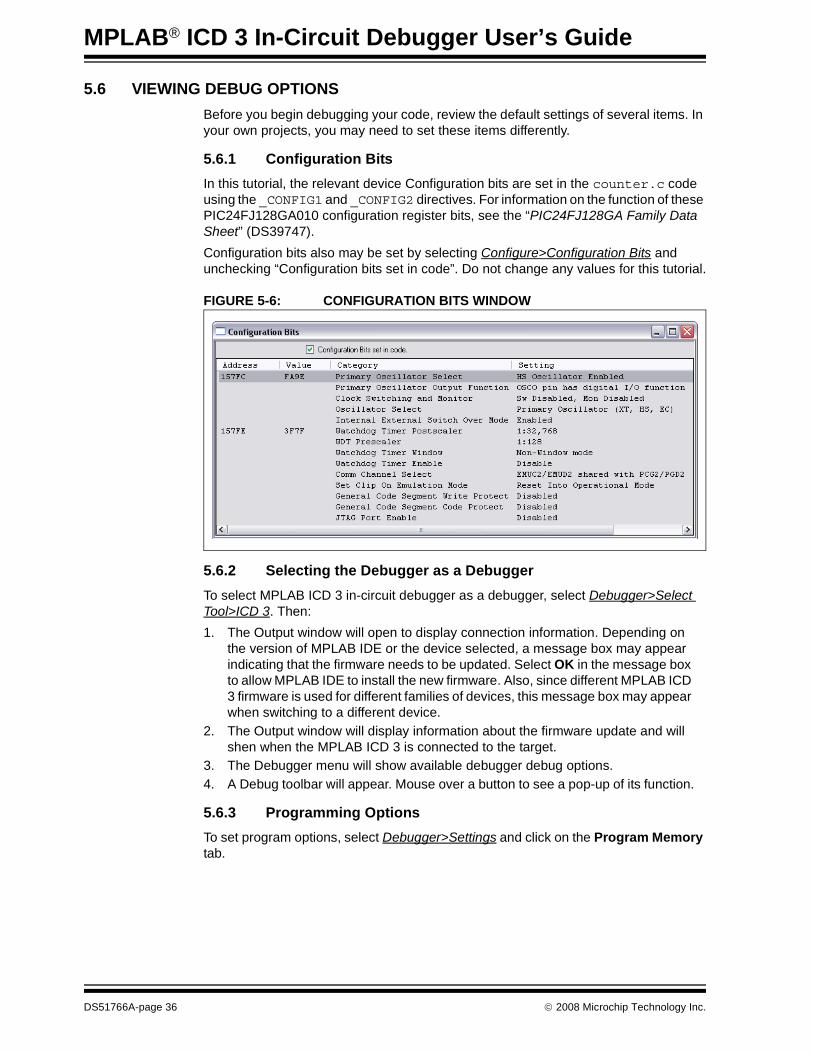
5.5 VIEWING THE PROJECTAfter exiting the wizard, the MPLAB IDE desktop will again be visible. If the project window is not open, select View/Project to see the Project window.
FIGURE 5-5: PROJECT WINDOW
Additional files can be added to the project using the project window. Right click on any line in the project window tree to pop up a menu with additional options for adding and removing files.
Note: Although the header file p24FJ128GA010.h and a linker script file are used in the project, you do not need to add them to the project; MPLAB IDE will find them for you.
MPLAB® ICD 3 In-Circuit Debugger User’s Guide
DS51766A-page 36 © 2008 Microchip Technology Inc.
5.6 VIEWING DEBUG OPTIONSBefore you begin debugging your code, review the default settings of several items. In your own projects, you may need to set these items differently.
5.6.1 Configuration BitsIn this tutorial, the relevant device Configuration bits are set in the counter.c code using the _CONFIG1 and _CONFIG2 directives. For information on the function of these PIC24FJ128GA010 configuration register bits, see the “PIC24FJ128GA Family Data Sheet” (DS39747).Configuration bits also may be set by selecting Configure>Configuration Bits and unchecking “Configuration bits set in code”. Do not change any values for this tutorial.
FIGURE 5-6: CONFIGURATION BITS WINDOW
5.6.2 Selecting the Debugger as a DebuggerTo select MPLAB ICD 3 in-circuit debugger as a debugger, select Debugger>Select Tool>ICD 3. Then:1. The Output window will open to display connection information. Depending on
the version of MPLAB IDE or the device selected, a message box may appear indicating that the firmware needs to be updated. Select OK in the message box to allow MPLAB IDE to install the new firmware. Also, since different MPLAB ICD 3 firmware is used for different families of devices, this message box may appear when switching to a different device.
2. The Output window will display information about the firmware update and will shen when the MPLAB ICD 3 is connected to the target.
3. The Debugger menu will show available debugger debug options.4. A Debug toolbar will appear. Mouse over a button to see a pop-up of its function.
5.6.3 Programming OptionsTo set program options, select Debugger>Settings and click on the Program Memory tab.
Tutorial
© 2008 Microchip Technology Inc. DS51766A-page 37
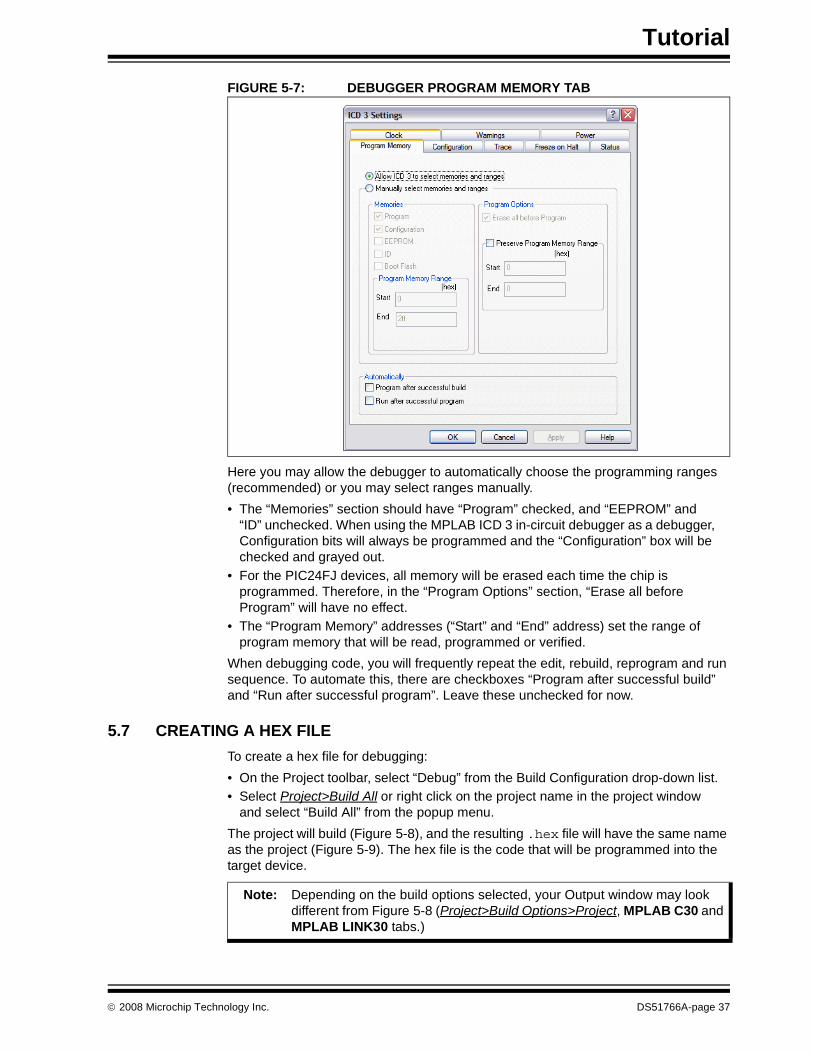
FIGURE 5-7: DEBUGGER PROGRAM MEMORY TAB
Here you may allow the debugger to automatically choose the programming ranges (recommended) or you may select ranges manually.• The “Memories” section should have “Program” checked, and “EEPROM” and
“ID” unchecked. When using the MPLAB ICD 3 in-circuit debugger as a debugger, Configuration bits will always be programmed and the “Configuration” box will be checked and grayed out.
• For the PIC24FJ devices, all memory will be erased each time the chip is programmed. Therefore, in the “Program Options” section, “Erase all before Program” will have no effect.
• The “Program Memory” addresses (“Start” and “End” address) set the range of program memory that will be read, programmed or verified.
When debugging code, you will frequently repeat the edit, rebuild, reprogram and run sequence. To automate this, there are checkboxes “Program after successful build” and “Run after successful program”. Leave these unchecked for now.
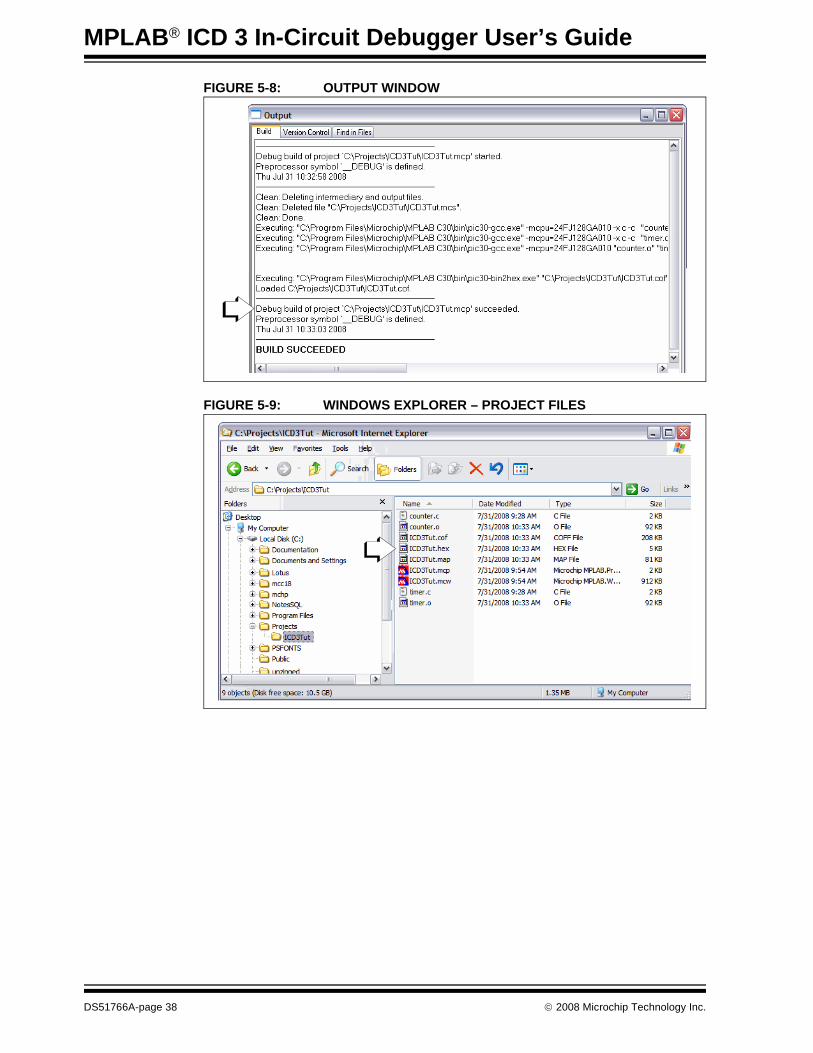
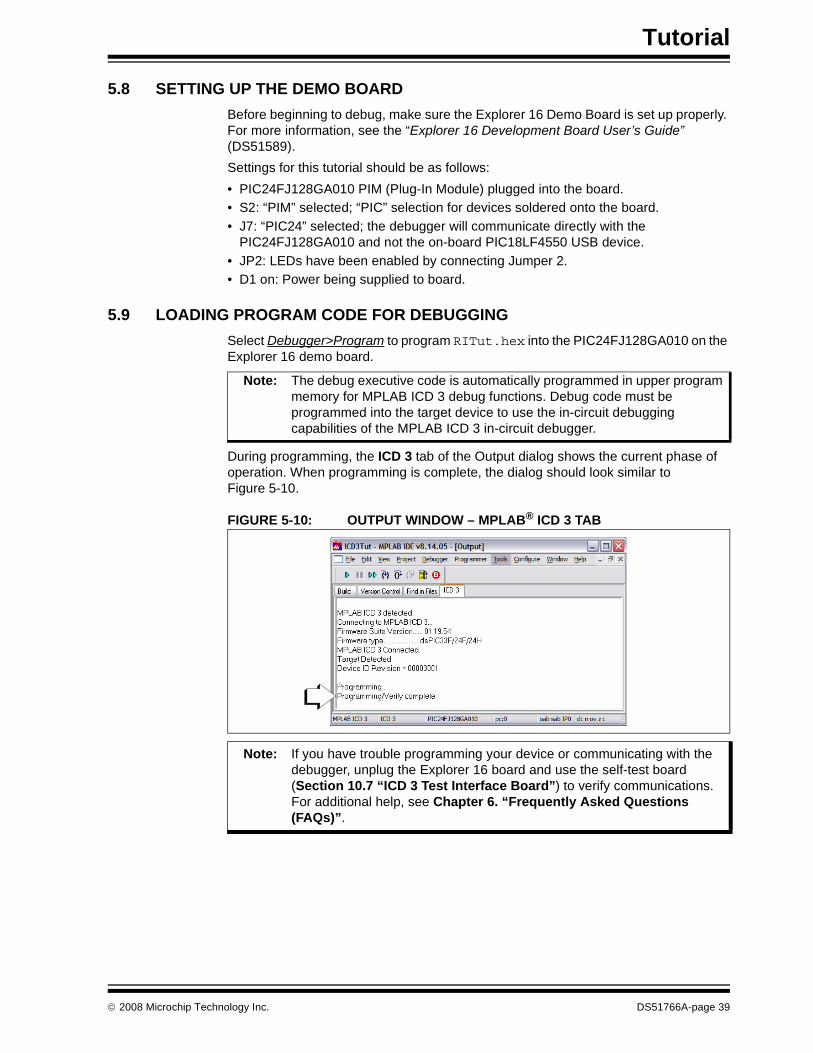
5.7 CREATING A HEX FILETo create a hex file for debugging:• On the Project toolbar, select “Debug” from the Build Configuration drop-down list.• Select Project>Build All or right click on the project name in the project window
and select “Build All” from the popup menu.The project will build (Figure 5-8), and the resulting .hex file will have the same name as the project (Figure 5-9). The hex file is the code that will be programmed into the target device.
Note: Depending on the build options selected, your Output window may look different from Figure 5-8 (Project>Build Options>Project, MPLAB C30 and MPLAB LINK30 tabs.)
MPLAB® ICD 3 In-Circuit Debugger User’s Guide
DS51766A-page 38 © 2008 Microchip Technology Inc.
FIGURE 5-8: OUTPUT WINDOW
FIGURE 5-9: WINDOWS EXPLORER – PROJECT FILES
Tutorial
© 2008 Microchip Technology Inc. DS51766A-page 39
5.8 SETTING UP THE DEMO BOARDBefore beginning to debug, make sure the Explorer 16 Demo Board is set up properly. For more information, see the “Explorer 16 Development Board User’s Guide” (DS51589).Settings for this tutorial should be as follows:• PIC24FJ128GA010 PIM (Plug-In Module) plugged into the board.• S2: “PIM” selected; “PIC” selection for devices soldered onto the board.• J7: “PIC24” selected; the debugger will communicate directly with the
PIC24FJ128GA010 and not the on-board PIC18LF4550 USB device.• JP2: LEDs have been enabled by connecting Jumper 2.• D1 on: Power being supplied to board.
5.9 LOADING PROGRAM CODE FOR DEBUGGINGSelect Debugger>Program to program RITut.hex into the PIC24FJ128GA010 on the Explorer 16 demo board.
During programming, the ICD 3 tab of the Output dialog shows the current phase of operation. When programming is complete, the dialog should look similar to Figure 5-10.
FIGURE 5-10: OUTPUT WINDOW – MPLAB® ICD 3 TAB
Note: The debug executive code is automatically programmed in upper program memory for MPLAB ICD 3 debug functions. Debug code must be programmed into the target device to use the in-circuit debugging capabilities of the MPLAB ICD 3 in-circuit debugger.
Note: If you have trouble programming your device or communicating with the debugger, unplug the Explorer 16 board and use the self-test board (Section 10.7 “ICD 3 Test Interface Board”) to verify communications. For additional help, see Chapter 6. “Frequently Asked Questions (FAQs)”.
MPLAB® ICD 3 In-Circuit Debugger User’s Guide
DS51766A-page 40 © 2008 Microchip Technology Inc.
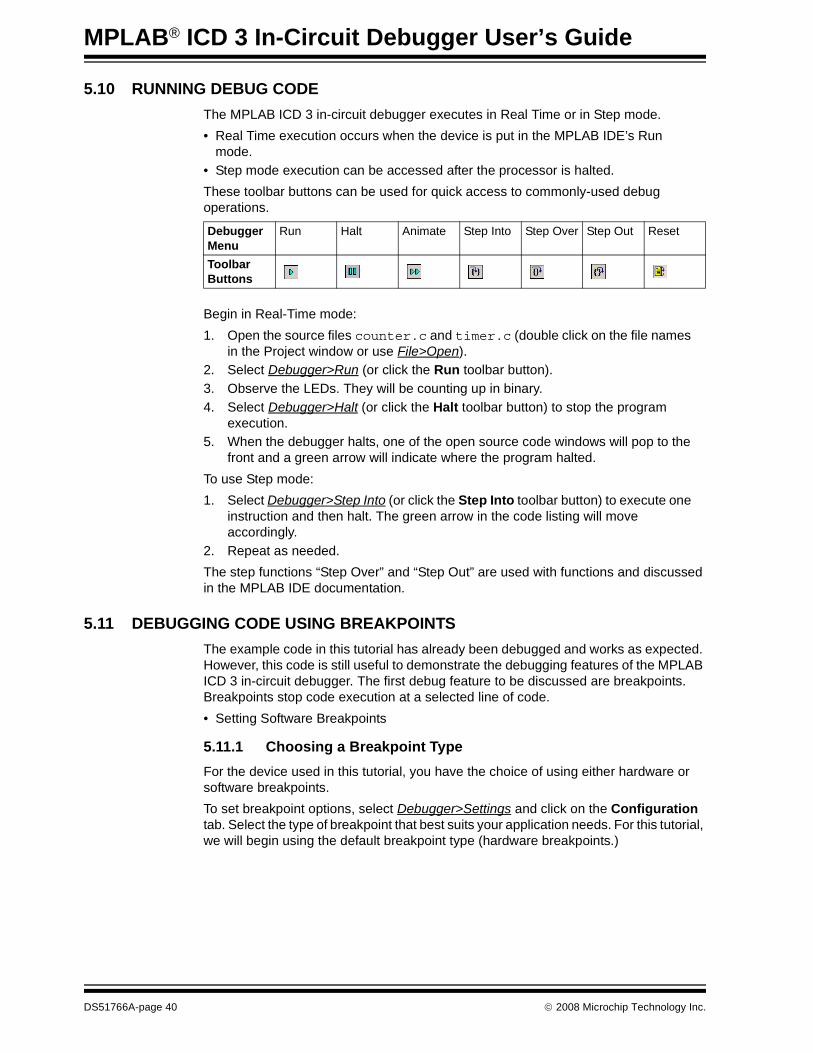
5.10 RUNNING DEBUG CODEThe MPLAB ICD 3 in-circuit debugger executes in Real Time or in Step mode.• Real Time execution occurs when the device is put in the MPLAB IDE’s Run
mode.• Step mode execution can be accessed after the processor is halted.These toolbar buttons can be used for quick access to commonly-used debug operations.
Begin in Real-Time mode:1. Open the source files counter.c and timer.c (double click on the file names
in the Project window or use File>Open).2. Select Debugger>Run (or click the Run toolbar button).3. Observe the LEDs. They will be counting up in binary.4. Select Debugger>Halt (or click the Halt toolbar button) to stop the program
execution.5. When the debugger halts, one of the open source code windows will pop to the
front and a green arrow will indicate where the program halted.To use Step mode:1. Select Debugger>Step Into (or click the Step Into toolbar button) to execute one
instruction and then halt. The green arrow in the code listing will move accordingly.
2. Repeat as needed.The step functions “Step Over” and “Step Out” are used with functions and discussed in the MPLAB IDE documentation.
5.11 DEBUGGING CODE USING BREAKPOINTSThe example code in this tutorial has already been debugged and works as expected. However, this code is still useful to demonstrate the debugging features of the MPLAB ICD 3 in-circuit debugger. The first debug feature to be discussed are breakpoints. Breakpoints stop code execution at a selected line of code.• Setting Software Breakpoints
5.11.1 Choosing a Breakpoint TypeFor the device used in this tutorial, you have the choice of using either hardware or software breakpoints.To set breakpoint options, select Debugger>Settings and click on the Configuration tab. Select the type of breakpoint that best suits your application needs. For this tutorial, we will begin using the default breakpoint type (hardware breakpoints.)
Debugger Menu
Run Halt Animate Step Into Step Over Step Out Reset
Toolbar Buttons
Tutorial
© 2008 Microchip Technology Inc. DS51766A-page 41
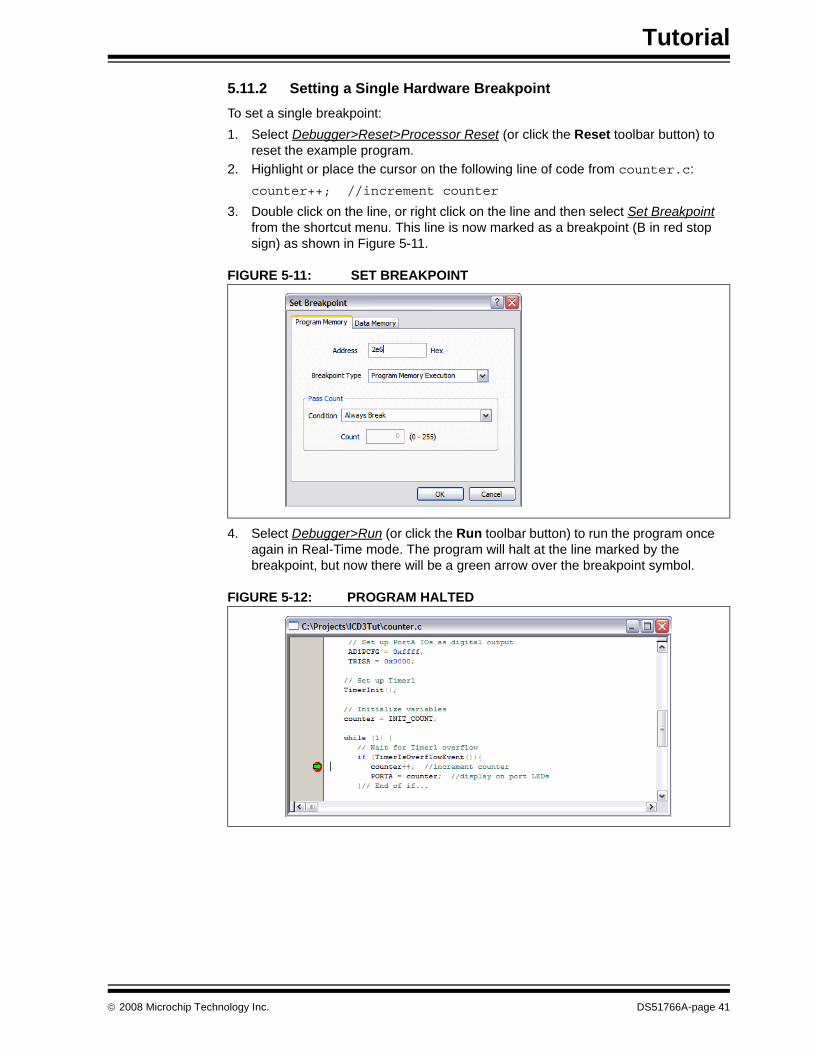
5.11.2 Setting a Single Hardware BreakpointTo set a single breakpoint:1. Select Debugger>Reset>Processor Reset (or click the Reset toolbar button) to
reset the example program.2. Highlight or place the cursor on the following line of code from counter.c:
counter++; //increment counter
3. Double click on the line, or right click on the line and then select Set Breakpoint from the shortcut menu. This line is now marked as a breakpoint (B in red stop sign) as shown in Figure 5-11.
FIGURE 5-11: SET BREAKPOINT
4. Select Debugger>Run (or click the Run toolbar button) to run the program once again in Real-Time mode. The program will halt at the line marked by the breakpoint, but now there will be a green arrow over the breakpoint symbol.
FIGURE 5-12: PROGRAM HALTED
MPLAB® ICD 3 In-Circuit Debugger User’s Guide
DS51766A-page 42 © 2008 Microchip Technology Inc.
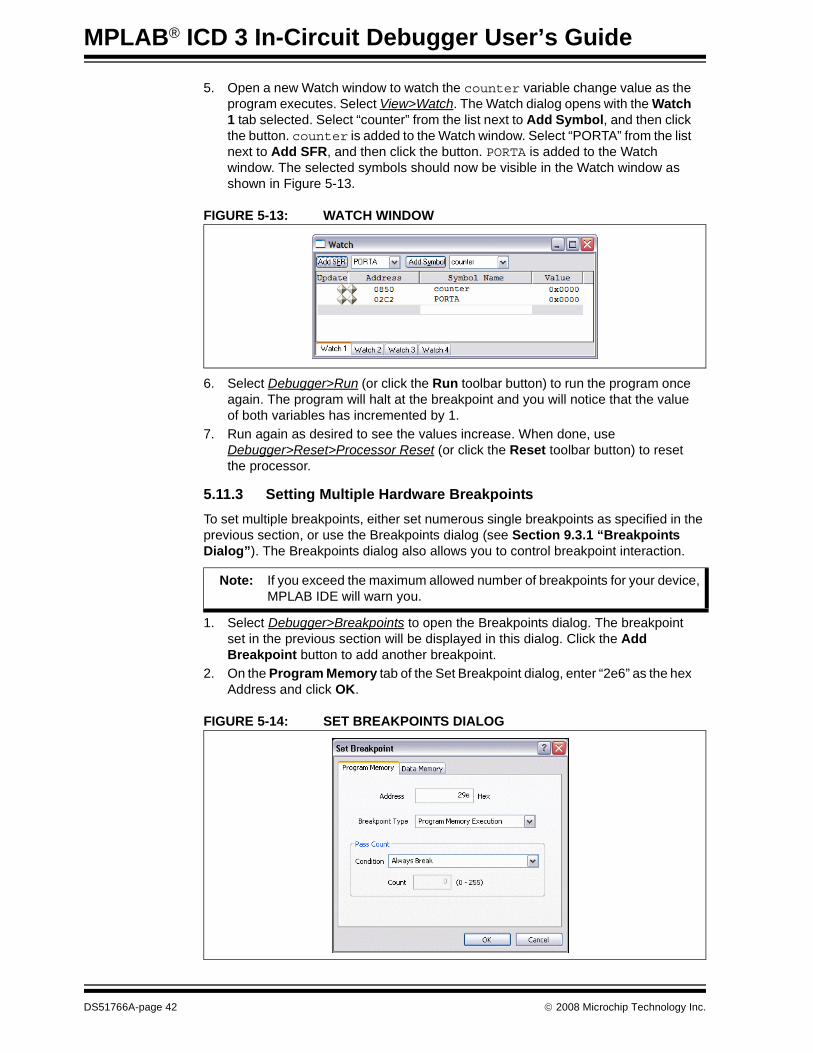
5. Open a new Watch window to watch the counter variable change value as the program executes. Select View>Watch. The Watch dialog opens with the Watch 1 tab selected. Select “counter” from the list next to Add Symbol, and then click the button. counter is added to the Watch window. Select “PORTA” from the list next to Add SFR, and then click the button. PORTA is added to the Watch window. The selected symbols should now be visible in the Watch window as shown in Figure 5-13.
FIGURE 5-13: WATCH WINDOW
6. Select Debugger>Run (or click the Run toolbar button) to run the program once again. The program will halt at the breakpoint and you will notice that the value of both variables has incremented by 1.
7. Run again as desired to see the values increase. When done, use Debugger>Reset>Processor Reset (or click the Reset toolbar button) to reset the processor.
5.11.3 Setting Multiple Hardware BreakpointsTo set multiple breakpoints, either set numerous single breakpoints as specified in the previous section, or use the Breakpoints dialog (see Section 9.3.1 “Breakpoints Dialog”). The Breakpoints dialog also allows you to control breakpoint interaction.
1. Select Debugger>Breakpoints to open the Breakpoints dialog. The breakpoint set in the previous section will be displayed in this dialog. Click the Add Breakpoint button to add another breakpoint.
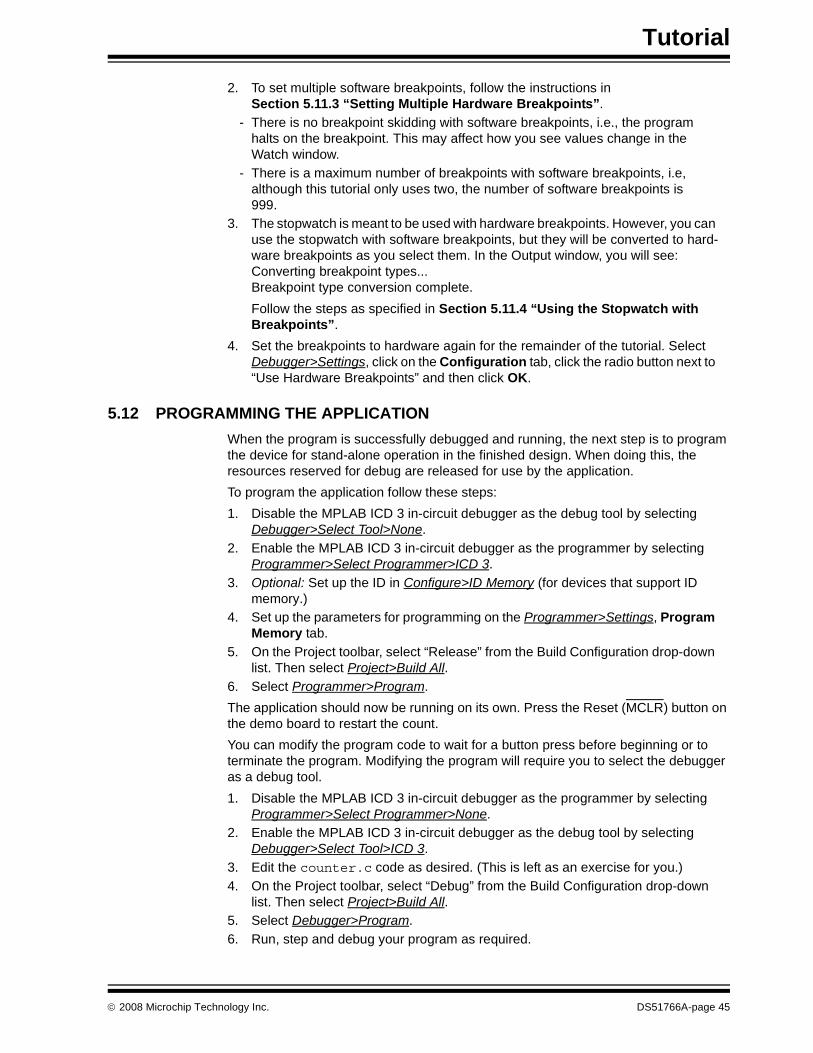
2. On the Program Memory tab of the Set Breakpoint dialog, enter “2e6” as the hex Address and click OK.
FIGURE 5-14: SET BREAKPOINTS DIALOG
Note: If you exceed the maximum allowed number of breakpoints for your device, MPLAB IDE will warn you.
Tutorial
© 2008 Microchip Technology Inc. DS51766A-page 43
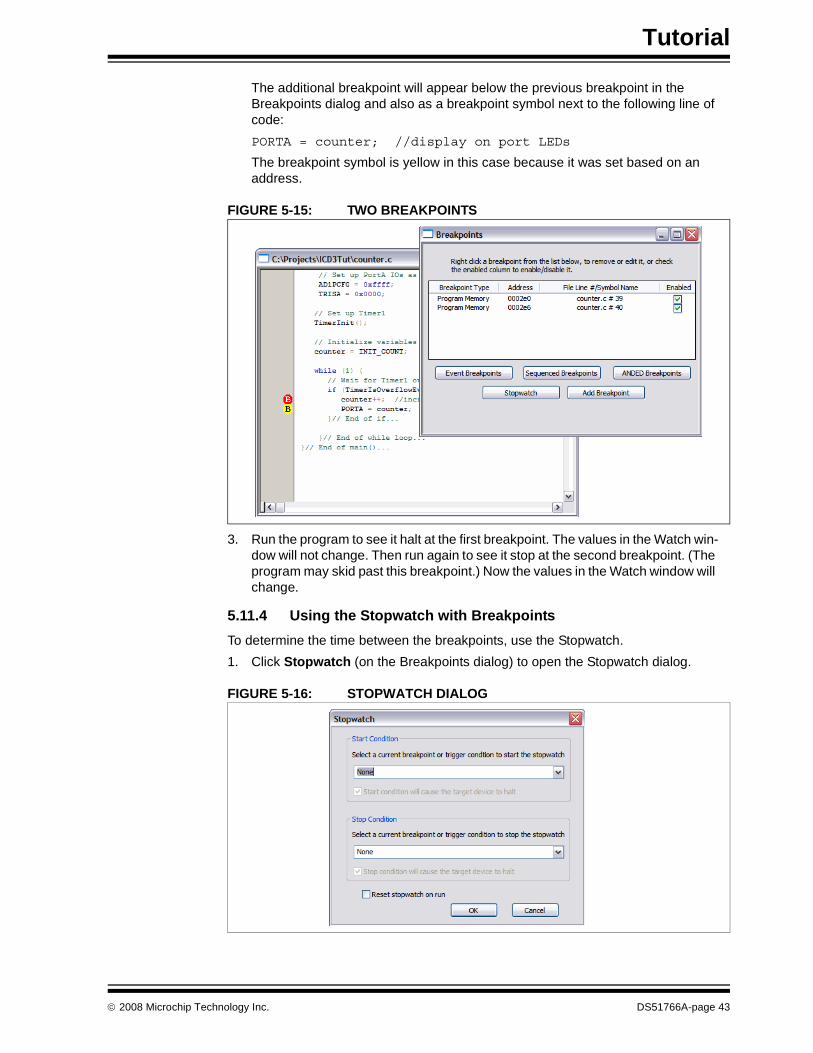
The additional breakpoint will appear below the previous breakpoint in the Breakpoints dialog and also as a breakpoint symbol next to the following line of code:PORTA = counter; //display on port LEDs
The breakpoint symbol is yellow in this case because it was set based on an address.
FIGURE 5-15: TWO BREAKPOINTS
3. Run the program to see it halt at the first breakpoint. The values in the Watch win-dow will not change. Then run again to see it stop at the second breakpoint. (The program may skid past this breakpoint.) Now the values in the Watch window will change.
5.11.4 Using the Stopwatch with BreakpointsTo determine the time between the breakpoints, use the Stopwatch.1. Click Stopwatch (on the Breakpoints dialog) to open the Stopwatch dialog.
FIGURE 5-16: STOPWATCH DIALOG
MPLAB® ICD 3 In-Circuit Debugger User’s Guide
DS51766A-page 44 © 2008 Microchip Technology Inc.
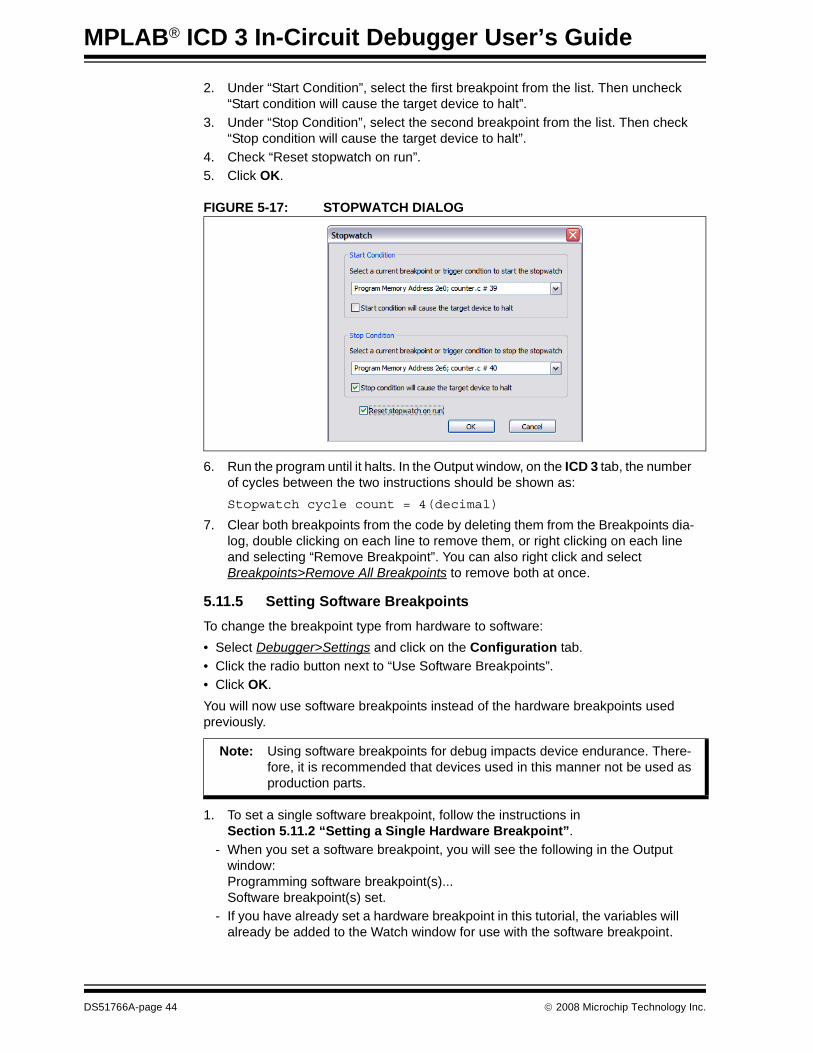
2. Under “Start Condition”, select the first breakpoint from the list. Then uncheck “Start condition will cause the target device to halt”.
3. Under “Stop Condition”, select the second breakpoint from the list. Then check “Stop condition will cause the target device to halt”.
4. Check “Reset stopwatch on run”.5. Click OK.
FIGURE 5-17: STOPWATCH DIALOG
6. Run the program until it halts. In the Output window, on the ICD 3 tab, the number of cycles between the two instructions should be shown as:Stopwatch cycle count = 4(decimal)
7. Clear both breakpoints from the code by deleting them from the Breakpoints dia-log, double clicking on each line to remove them, or right clicking on each line and selecting “Remove Breakpoint”. You can also right click and select Breakpoints>Remove All Breakpoints to remove both at once.
5.11.5 Setting Software BreakpointsTo change the breakpoint type from hardware to software:• Select Debugger>Settings and click on the Configuration tab.• Click the radio button next to “Use Software Breakpoints”.• Click OK.You will now use software breakpoints instead of the hardware breakpoints used previously.
1. To set a single software breakpoint, follow the instructions in Section 5.11.2 “Setting a Single Hardware Breakpoint”.
- When you set a software breakpoint, you will see the following in the Output window:Programming software breakpoint(s)...Software breakpoint(s) set.
- If you have already set a hardware breakpoint in this tutorial, the variables will already be added to the Watch window for use with the software breakpoint.
Note: Using software breakpoints for debug impacts device endurance. There-fore, it is recommended that devices used in this manner not be used as production parts.
Tutorial
© 2008 Microchip Technology Inc. DS51766A-page 45
2. To set multiple software breakpoints, follow the instructions in Section 5.11.3 “Setting Multiple Hardware Breakpoints”.
- There is no breakpoint skidding with software breakpoints, i.e., the program halts on the breakpoint. This may affect how you see values change in the Watch window.
- There is a maximum number of breakpoints with software breakpoints, i.e, although this tutorial only uses two, the number of software breakpoints is 999.
3. The stopwatch is meant to be used with hardware breakpoints. However, you can use the stopwatch with software breakpoints, but they will be converted to hard-ware breakpoints as you select them. In the Output window, you will see:Converting breakpoint types...Breakpoint type conversion complete.Follow the steps as specified in Section 5.11.4 “Using the Stopwatch with Breakpoints”.
4. Set the breakpoints to hardware again for the remainder of the tutorial. Select Debugger>Settings, click on the Configuration tab, click the radio button next to “Use Hardware Breakpoints” and then click OK.
5.12 PROGRAMMING THE APPLICATIONWhen the program is successfully debugged and running, the next step is to program the device for stand-alone operation in the finished design. When doing this, the resources reserved for debug are released for use by the application.To program the application follow these steps:1. Disable the MPLAB ICD 3 in-circuit debugger as the debug tool by selecting
Debugger>Select Tool>None.2. Enable the MPLAB ICD 3 in-circuit debugger as the programmer by selecting
Programmer>Select Programmer>ICD 3.3. Optional: Set up the ID in Configure>ID Memory (for devices that support ID
memory.)4. Set up the parameters for programming on the Programmer>Settings, Program
Memory tab.5. On the Project toolbar, select “Release” from the Build Configuration drop-down
list. Then select Project>Build All.6. Select Programmer>Program.The application should now be running on its own. Press the Reset (MCLR) button on the demo board to restart the count.You can modify the program code to wait for a button press before beginning or to terminate the program. Modifying the program will require you to select the debugger as a debug tool.1. Disable the MPLAB ICD 3 in-circuit debugger as the programmer by selecting
Programmer>Select Programmer>None.2. Enable the MPLAB ICD 3 in-circuit debugger as the debug tool by selecting
Debugger>Select Tool>ICD 3.3. Edit the counter.c code as desired. (This is left as an exercise for you.)4. On the Project toolbar, select “Debug” from the Build Configuration drop-down
list. Then select Project>Build All.5. Select Debugger>Program.6. Run, step and debug your program as required.

MPLAB® ICD 3 In-Circuit Debugger User’s Guide
DS51766A-page 46 © 2008 Microchip Technology Inc.
NOTES:
MPLAB® ICD 3 IN-CIRCUITDEBUGGER USER’S GUIDE
© 2008 Microchip Technology Inc. DS51766A-page 47
Part 2 – Troubleshooting
Chapter 6. Frequently Asked Questions (FAQs) ....................................................... 49Chapter 7. Error Messages.......................................................................................... 53

MPLAB® ICD 3 In-Circuit Debugger User’s Guide
DS51766A-page 48 © 2008 Microchip Technology Inc.
NOTES:
MPLAB® ICD 3 IN-CIRCUITDEBUGGER USER’S GUIDE
© 2008 Microchip Technology Inc. DS51766A-page 49
Chapter 6. Frequently Asked Questions (FAQs)
6.1 INTRODUCTIONLook here for answers to frequently asked questions about the MPLAB ICD 3 in-circuit debugger system.• How Does It Work• What’s Wrong
6.2 HOW DOES IT WORK
• What's in the silicon that allows it to communicate with the MPLAB ICD 3 in-circuit debugger?MPLAB ICD 3 in-circuit debugger can communicate with Flash silicon via the ICSP interface. It uses the debug executive located in test memory.
• How is the throughput of the processor affected by having to run the debug executive?
• The debug executive doesn't run while in Run mode, so there is no throughput reduction when running your code, i.e., the debugger doesn’t ‘steal’ any cycles from the target device. How does the MPLAB ICD 3 in-circuit debugger compare with other in-circuit emulators/debuggers?Please refer to Section 2.2 “MPLAB ICD 3 In-Circuit Debugger vs. MPLAB ICE 2000/4000 In-Circuit Emulators” and Section 2.3 “MPLAB ICD 3 In-Circuit Debugger vs. MPLAB ICD 2 Debugger”.
• How does MPLAB IDE interface with the MPLAB ICD 3 in-circuit debugger to allow more features than MPLAB ICD 2?MPLAB ICD 3 in-circuit debugger communicates using the debug executive located in the test area. The debug exec is streamlined for more efficient commu-nication. The debugger contains an FPGA, large SRAM Buffers (1Mx8) and a High Speed USB interface. Program memory image is downloaded and is con-tained in the SRAM to allow faster programming. The FPGA in the debugger serves as an accelerator for interfacing with the device in-circuit debugger modules.
• On the MPLAB ICE 2000/4000 debuggers, the data must come out on the bus in order to perform a complex trigger on that data. Is this also required on the MPLAB ICD 3 in-circuit debugger? For example, could I halt based on a flag going high?The MPLAB ICE 2000/4000 debuggers use a special debugger chip (-ME) for monitoring. There is no -ME with the MPLAB ICD 3 in-circuit debugger so there are no busses to monitor externally. With the MPLAB ICD 3 in-circuit debugger, rather than using external breakpoints, the built-in breakpoint circuitry of the debug engine is used – the busses and breakpoint logic are monitored inside the part.
MPLAB® ICD 3 In-Circuit Debugger User’s Guide
DS51766A-page 50 © 2008 Microchip Technology Inc.
• Does the MPLAB ICD 3 in-circuit debugger have complex breakpoints like MPLAB ICE 2000/4000?Yes. You can break based on a value in a data memory location. You can also do sequenced breakpoints, where several events are happening before it breaks, but you can only do 2 sequences instead of 4, as you can in the MPLAB ICE 2000. You can also do the AND condition and do PASS counts. See Section 9.3.1 “Breakpoints Dialog” for more information.
• Are any of the driver boards optoisolated or electrically isolated?They are DC optoisolated, but not AC optoisolated. You cannot apply a floating or high voltage (120V) to the current system.
• What limitations are there with the standard cable?The standard ICSP RJ-11 cable does not allow for clock speeds greater than about 15 Mb/sec. dsPIC33F DSCs running at full speed are greater than the 15 Mb/sec limit.
• Will this slow down the running of the program?There is no cycle stealing with the MPLAB ICD 3 in-circuit debugger. The output of data is performed by the state machine in the silicon.
• Is it possible to debug a dsPIC DSC running at any speed?The MPLAB ICD 3 is capable of debugging at any device speed as specified in the device’s data sheet.
• What is the function of pin 6, the LVP pin?Pin 6 is reserved for the LVP (Low-Voltage Programming) connection.
6.3 WHAT’S WRONG
• My PC went into power-down/hibernate mode, and now my debugger won’t work. What happened?When using the debugger for prolonged periods of time, and especially as a debugger, be sure to disable the Hibernate mode in the Power Options Dialog window of your PC’s operating system. Go to the Hibernate tab and clear or uncheck the “Enable hibernation” check box. This will ensure that all communication is maintained across all the USB subsystem components.
• I set my peripheral to NOT freeze on halt, but it is suddenly freezing. What's going on?For dsPIC30F/33F and PIC24F/H devices, a reserved bit in the peripheral control register (usually either bit 14 or 5) is used as a Freeze bit by the debugger. If you have performed a write to the entire register, you may have overwritten this bit. (The bit is user-accessible in Debug mode.)To avoid this problem, write only to the bits you wish to change for your application (BTS, BTC) instead of to the entire register (MOV).
Frequently Asked Questions (FAQs)
© 2008 Microchip Technology Inc. DS51766A-page 51
• When using a 16-bit device, an unexpected reset occurred. How do I determine what caused it?Some things to consider:- To determine a reset source, check the RCON register.- Handle traps/interrupts in an Interrupt Service Routine (ISR). You should include trap.c style code, i.e., void __attribute__((__interrupt__)) _OscillatorFail(void); : void __attribute__((__interrupt__)) _AltOscillatorFail(void); : void __attribute__((__interrupt__)) _OscillatorFail(void) { INTCON1bits.OSCFAIL = 0; //Clear the trap flag while (1); } : void __attribute__((__interrupt__)) _AltOscillatorFail(void) { INTCON1bits.OSCFAIL = 0; while (1); } :
- Use ASSERTs.
• I have finished debugging my code. Now I’ve programmed my part, but it won’t run. What’s wrong?Some things to consider are:- Have you selected the debugger as a programmer and then tried to program a header board? A header board contains an -ICE/-ICD version of the device and may not function like the actual device. Only program regular devices with the debugger as a programmer. Regular devices include devices that have on-board ICE/ICD circuitry, but are not the special -ICE/-ICD devices found on header boards.- Have you selected the debugger as a debugger and then tried to program a pro-duction device? Programming a device when the debugger is a debugger will pro-gram a debug executive into program memory and set up other device features for debug (see Section 2.7.1 “Sequence of Operations Leading to Debug-ging”). To program final (release) code, select the debugger as a programmer.- Have you selected “Release” from the Build Configuration drop-down list or Proj-ect menu? You must do this for final (release) code. Rebuild your project, repro-gram the device, and try to run your code again.
• I didn’t set a software breakpoint, yet I have one in my code. What’s going on?What you are seeing is a phantom breakpoint. Occasionally, a breakpoint can become enabled when it shouldn’t be. Simply disable or delete the breakpoint.
MPLAB® ICD 3 In-Circuit Debugger User’s Guide
DS51766A-page 52 © 2008 Microchip Technology Inc.
• I don’t see my problem here. Now what?Try the following resources:- Chapter 10. “Limitations”- Section 2.9 “Resources Used by the Debugger”- Section 7.2 “Specific Error Messages”- Section 7.3 “General Corrective Actions”
MPLAB® ICD 3 IN-CIRCUITDEBUGGER USER’S GUIDE
© 2008 Microchip Technology Inc. DS51766A-page 53
Chapter 7. Error Messages
7.1 INTRODUCTIONThe MPLAB ICD 3 in-circuit debugger produces many different error messages; some are specific and others can be resolved with general corrective actions.• Specific Error Messages• General Corrective Actions
7.2 SPECIFIC ERROR MESSAGESMPLAB ICD 3 in-circuit debugger error messages are listed below in numeric order.
Text in error messages listed below of the form %x (a variable) will display as text relevant to your particular situation in the actual error message.ICD3Err0001: Failed while writing to program memory.ICD3Err0002: Failed while writing to EEPROM.ICD3Err0003: Failed while writing to configuration memory.See Section 7.3.1 “Read/Write Error Actions”.ICD3Err0005: ICD 3 is currently busy and cannot be unloaded at this time.If you receive this error when attempting to deselect the debugger as a debugger or programmer:1. Wait – give the debugger time to finish any application tasks. Then try to deselect
the debugger again.2. Select Halt to stop any running applications. Then try to deselect the debugger
again.3. Unplug the debugger from the PC. Then try to deselect the debugger again.4. Shut down MPLAB IDE.ICD3Err0006: Failed while writing to user ID memory.ICD3Err0007: Failed while reading program memory.ICD3Err0008: Failed while reading EEPROM.ICD3Err0009: Failed while reading configuration memory.ICD3Err0010: Failed while reading user ID memory.See Section 7.3.1 “Read/Write Error Actions”.ICD3Err0011: Bulk erase failed.See Section 7.3.1 “Read/Write Error Actions”.If these do not work, try another device.
Note: Numbers may not yet appear in displayed messages. Use the Search tab on the Help viewer to find your message and highlight it below.
MPLAB® ICD 3 In-Circuit Debugger User’s Guide
DS51766A-page 54 © 2008 Microchip Technology Inc.
ICD3Err0012: Download debug exec failedIf you receive this error while attempting to program from the Debugger menu:1. Deselect the debugger as the debug tool.2. Close your project and then close MPLAB IDE.3. Restart MPLAB IDE and re-open your project.4. Reselect the debugger as your debug tool and attempt to program your target
device again.If this does not work, see Section 7.3.4 “Corrupted Installation Actions”.ICD3Err0013: NMMR register write failed.ICD3Err0014: File register write failed.See Section 7.3.2 “Debugger-to-Target Communication Error Actions”.ICD3Err0015: Data transfer was unsuccessful. %d byte(s) expected, %d byte(s) transferred.See Section 7.3.3 “Debugger-to-PC Communication Error Actions”.ICD3Err0016: Cannot transmit. ICD 3 not found.The debugger is not connected to the PC.ICD3Err0017: File register read failed.ICD3Err0018: NMMR register read failed.ICD3Err0019: Failed while reading emulation registers.ICD3Err0020: Failed while writing emulation registers.See Section 7.3.2 “Debugger-to-Target Communication Error Actions”.ICD3Err0021: Command not echoed properly. Sent %x, received %x.ICD3Err0022: Failed to get ICD 3 version information.ICD3Err0023: Download FPGA failed.ICD3Err0024: Download RS failed.ICD3Err0025: Download AP failed.See Section 7.3.3 “Debugger-to-PC Communication Error Actions”.ICD3Err0026: Download program exec failed.If you receive this error while attempting to program from the Debugger menu:1. Deselect the debugger as the debug tool.2. Close your project and then close MPLAB IDE.3. Restart MPLAB IDE and re-open your project.4. Reselect the debugger as your debug tool and attempt to program your target
device again.If this does not work, see Section 7.3.4 “Corrupted Installation Actions”.ICD3Err0027: Bulk transfer failed due to invalid checksumSee Section 7.3.3 “Debugger-to-PC Communication Error Actions”.Also, ensure that the cables used are the correct length.ICD3Err0028: Download device database failedIf you receive this error:1. Try downloading again. It may be a one-time error.2. Try manually downloading. Select Debugger>Settings, Configuration tab, and
click Manual Download. Select the highest number .jam file and click Open.ICD3Err0029: Communication failure. Unexpected command echo response %x received from ICD 3.See Section 7.3.3 “Debugger-to-PC Communication Error Actions”.
Error Messages
© 2008 Microchip Technology Inc. DS51766A-page 55
ICD3Err0030: Unable to read/find firmware File %s.If the Hex file exists:• Reconnect and try again.• If this does not work, the file may be corrupted. Reinstall MPLAB IDE.If the Hex file does not exist:• Reinstall MPLAB IDE.ICD3Err0031: Failed to get PC.ICD3Err0032: Failed to set PC.See Section 7.3.2 “Debugger-to-Target Communication Error Actions”.ICD3Err0033: %d bytes expected, %d bytes received.See Section 7.3.3 “Debugger-to-PC Communication Error Actions”.ICD3Err0034: This version of MPLAB IDE does not support hardware revision %06x. Please upgrade to the latest version of MPLAB IDE before continuing.Find the latest MPLAB IDE at www.microchip.com.ICD3Err0035: Failed to get Device ID.See Section 7.3.1 “Read/Write Error Actions”.ICD3Err0036: MPLAB IDE has lost communication with ICD 3.See Section 7.3.3 “Debugger-to-PC Communication Error Actions”.ICD3Err0037: Timed out waiting for response from ICD 3.ICD3Err0038: Failed to initialize ICD 3.ICD3Err0039: ICD 3 self-test failed.For this error, the debugger is not responding:1. Unplug and plug in the debugger.2. Reconnect to the debugger in MPLAB IDE.3. If the problem persists contact Microchip.ICD3Err0040: The target device is not ready for debugging. Please check your configuration bit settings and program the device before proceeding.You will receive this message when you have not programmed your device for the first time and try to Run. If you receive this message after this, or immediately after programming your device, please refer to Section 7.3.6 “Debug Failure Actions”.ICD3Err0041: While receiving streaming data, ICD 3 has gotten out-of-sync with MPLAB IDE. To correct this you must reset the target device.First try to Halt, Reset and then Run again. If this does not work:1. Unplug and plug in the debugger.2. Reconnect to the debugger in MPLAB IDE.3. Check that the target speed is entered on the Clock tab of the Settings dialog.4. Run again.ICD3Err0045: You must connect to a target device to use MPLAB ICD 3.No power has been found.1. Ensure VDD and GND are connected between the debugger and target.2. Ensure that the target is powered.3. Ensure that the target power is sufficient to be detected by the debugger (see
Chapter 10. “Hardware Specification”.)
MPLAB® ICD 3 In-Circuit Debugger User’s Guide
DS51766A-page 56 © 2008 Microchip Technology Inc.
ICD3Err0046: An error occurred while trying to read the stopwatch count. The stopwatch count may not be accurate.See Section 7.3.2 “Debugger-to-Target Communication Error Actions”.ICD3Err0047: Bootloader download failed.See Section 7.3.3 “Debugger-to-PC Communication Error Actions”.ICD3Err0052: The current ICD 3 hardware version %x, is out of date. This version of MPLAB IDE will support only version %x or higher.Did you click Cancel when asked to download the latest firmware? If so, you will need to download it now. Select Debugger>Settings, Configuration tab, and click Manual Download. Select the highest number .jam file and click Open.If you cannot find any files to download or if this does not work (corrupted file), you will need to get the latest version of MPLAB IDE and install it. Find the latest MPLAB IDE at www.microchip.com.ICD3Err0053: Unable to get ICD 3 protocol versions.See Section 7.3.3 “Debugger-to-PC Communication Error Actions”.ICD3Err0054: MPLAB IDE's ICD 3 protocol definitions are out of date. You must upgrade MPLAB IDE to continue.Find the latest MPLAB IDE at www.microchip.com.ICD3Err0055: Unable to set firmware suite version.ICD3Err0056: Unable to get voltages from ICD 3.See Section 7.3.3 “Debugger-to-PC Communication Error Actions”.ICD3Err0057: Self-test could not be completed.Ensure that you are using the ICD3 self-test board. Also, see Section 7.3.2 “Debugger-to-Target Communication Error Actions”.ICD3Err0063: Test interface clock write failure. Please ensure that the tester is properly connected.ICD3Err0064: Test interface data write failure.ICD3Err0065: Test interface clock read failure.ICD3Err0066: Test interface data read failure.Clock/data not being output from the debugger. Check your connections and try again.ICD3Err0067: Failed to set/clear software breakpoint.Reprogram and try again.ICD3Err0068: Failed while writing to boot FLASH memory.ICD3Err0069: Failed while reading boot FLASH memory.ICD3Err0070: Failed while writing peripheral memory.ICD3Err0071: Failed while reading peripheral memory.See Section 7.3.1 “Read/Write Error Actions”.ICD3Err0072: Unable to send freeze peripheral information.See Section 7.3.3 “Debugger-to-PC Communication Error Actions”.ICD3Err0073: Device is code protected.The device on which you are attempting to operate (read, program, blank check or verify) is code protected, i.e., the code cannot be read or modified. Check your Configuration bits setting for code protection.To disable code protection, set or clear the appropriate Configuration bits in code or in the Configuration Bits window (Configure>Configuration Bits), according to the device data sheet. Then erase and reprogram the entire device.ICD3Err0082: Test interface LVP failure.ICD3Err0083: Test interface MCLR failure
Error Messages
© 2008 Microchip Technology Inc. DS51766A-page 57
7.3 GENERAL CORRECTIVE ACTIONSThese general corrective actions may solve your problem:• Read/Write Error Actions• Debugger-to-Target Communication Error Actions• Debugger-to-PC Communication Error Actions• Corrupted Installation Actions• USB Port Communication Error Actions• Debug Failure Actions• Internal Error Actions
7.3.1 Read/Write Error ActionsIf you receive a read or write error:1. Did you hit Abort? This may produce read/write errors.2. Try the action again. It may be a one-time error.3. Ensure that the target is powered and at the correct voltage levels for the device.
See the device data sheet for required device voltage levels.4. Ensure that the debugger-to-target connection is correct (PGC and PGD are
connected.)5. For write failures, ensure that “Erase all before Program” is checked on the
Program Memory tab of the Settings dialog.6. Ensure that the cables used are of the correct length.
7.3.2 Debugger-to-Target Communication Error ActionsThe MPLAB ICD 3 in-circuit debugger and the target device are out-of-sync with each other.1. Select Reset and then try the action again.2. Ensure that the cable(s) used are the correct length.
7.3.3 Debugger-to-PC Communication Error ActionsThe MPLAB ICD 3 in-circuit debugger and MPLAB IDE are out-of-sync with each other.1. Unplug and then plug in the debugger.1. Reconnect to the debugger.2. Try the operation again. It is possible the error was a one time glitch.3. The version of MPLAB IDE installed may be incorrect for the version of firmware
loaded on the MPLAB ICD 3 in-circuit debugger. Follow the steps outlined in Section 7.3.4 “Corrupted Installation Actions”.
7.3.4 Corrupted Installation ActionsThe problem is most likely caused by a incomplete or corrupted installation of MPLAB IDE.1. Uninstall all versions of MPLAB IDE from the PC.2. Reinstall the desired MPLAB IDE version.3. If the problem persists contact Microchip.
MPLAB® ICD 3 In-Circuit Debugger User’s Guide
DS51766A-page 58 © 2008 Microchip Technology Inc.
7.3.5 USB Port Communication Error ActionsThe problem is most likely caused by a faulty or non-existent communications port.1. Reconnect to the MPLAB ICD 3 in-circuit debugger2. Make sure the debugger is physically connected to the PC on the appropriate
USB port.3. Make sure the appropriate USB port has been selected in the debugger Settings.4. Make sure the USB port is not in use by another device.5. If using a USB hub, make sure it is powered.6. Make sure the USB drivers are loaded.
7.3.6 Debug Failure ActionsThe MPLAB ICD 3 in-circuit debugger was unable to perform a debugging operation. There are numerous reasons why this might occur.
Top Reasons Why You Can’t Debug1. The oscillator is not working. Check your Configuration bits setting for the
oscillator.2. The target board is not powered. Check the power cable connection.3. The MPLAB ICD 3 in-circuit debugger has somehow become physically
disconnected from the PC. Check the USB communication cable connection.4. The debugger has somehow become physically disconnected from the target
board. Check the communications cable connection.5. The device is code-protected. Check your Configuration bits setting for code
protection.6. You are trying to rebuild the project while in Release mode. Select Debug in the
Build Configuration drop-down list on the project toolbar, then rebuild the project.7. The debugger is selected as a programmer, and not as a debugger, in MPLAB
IDE.8. Debugger to PC communications has somehow been interrupted. Reconnect to
the debugger in MPLAB IDE.9. The target application has somehow become corrupted or contains errors. For
example, the regular linker script was used in the project instead of the debugger version of the linker script (e.g., 18F8722.lkr was used instead of 18F8722i.lkr). Try rebuilding and reprogramming the target application. Then initiate a Power-on Reset of the target.
10. Other configuration settings are interfering with debugging. Any configuration setting that would prevent the target from executing code will also prevent the debugger from putting the code into debug mode.
11. The debugger cannot always perform the action requested. For example, the debugger cannot set a breakpoint if the target application is currently running.
Error Messages
© 2008 Microchip Technology Inc. DS51766A-page 59
Other Things to Consider1. It is possible the error was a one time glitch. Try the operation again.2. There may be a problem programming in general. As a test, switch to program-
mer mode and program the target with the simplest application possible (e.g., a program to blink an LED.) If the program will not run, then you know that something is wrong with the target setup.
3. It is possible that the target device has been damaged in some way (e.g., over current.) Development environments are notoriously hostile to components. Consider trying another target device.
4. Microchip Technology Inc. offers myriad demonstration boards to support most of its microcontrollers. Consider using one of these applications, which are known to work, to verify correct MPLAB ICD 3 in-circuit debugger functionality. Or, use the self-test board to verify the debugger itself (Section 10.7 “ICD 3 Test Interface Board”.)
5. Review debugger debug operation to ensure proper application setup (Chapter 2. “Theory of Operation”.)
6. If the problem persists contact Microchip.
7.3.7 Internal Error ActionsInternal errors are unexpected and should not happen. They are primarily used for internal Microchip development.The most likely cause is a corrupted installation (Section 7.3.4 “Corrupted Installation Actions”).Another likely cause is exhausted system resources.1. Try rebooting your system to free up memory.2. Make sure you have a reasonable amount of free space on your hard drive (and
that it is not overly fragmented.)If the problem persists contact Microchip.

MPLAB® ICD 3 In-Circuit Debugger User’s Guide
DS51766A-page 60 © 2008 Microchip Technology Inc.
NOTES:
MPLAB® ICD 3 IN-CIRCUITDEBUGGER USER’S GUIDE
© 2008 Microchip Technology Inc. DS51766A-page 61
Part 3 – Reference
Chapter 8. Basic Debug Functions............................................................................. 63Chapter 9. Debugger Function Summary .................................................................. 65Chapter 10. Hardware Specification........................................................................... 79

MPLAB® ICD 3 In-Circuit Debugger User’s Guide
DS51766A-page 62 © 2008 Microchip Technology Inc.
NOTES:
MPLAB® ICD 3 IN-CIRCUITDEBUGGER USER’S GUIDE
© 2008 Microchip Technology Inc. DS51766A-page 63
Chapter 8. Basic Debug Functions
8.1 INTRODUCTIONBasic MPLAB ICD 3 in-circuit debugger debug functions of breakpoints and stopwatch are discussed.
8.2 BREAKPOINTSUse breakpoints to halt code execution at specified lines in your code. Breakpoints and triggers use the same resources. Therefore, the available number of breakpoints is actually the available number of combined breakpoints/triggers.To select hardware or software breakpoints:1. Select Debugger>Settings and click the Configuration tab.2. Select the desired type of breakpoints for your application. A list of features for
each breakpoint type, hardware or software, is shown under that type. (See Section 9.5.2 “Settings Dialog, Configuration Tab” for more information.)
8.3 STOPWATCHUse the stopwatch with breakpoints to time code execution.To set a breakpoint in code, do one of the following:• Double click or right click on a line of code to set up an individual breakpoint.• Select Debugger>Breakpoints to open the Breakpoints dialog and set up multiple
breakpoints and breakpoint conditions. See Section 9.3.1 “Breakpoints Dialog” for more information.
To determine the time between the breakpoints, use the stopwatch:1. Open the Breakpoints dialog (Debugger>Breakpoints).1. Click Stopwatch on the Breakpoints dialog to open the Stopwatch dialog.2. Under “Start Condition”, select a breakpoint from the drop-down list. Also decide
if “Start condition will cause the target device to halt”.3. Under “Stop Condition”, select another breakpoint from the drop-down list. Also
decide if “Stop condition will cause the target device to halt”.4. Decide if there will be a “Reset stopwatch on run”.5. Click OK.
Note: Using software breakpoints for debug impacts device endurance. Therefore, it is recommended that devices used in this manner not be used as production parts.

MPLAB® ICD 3 In-Circuit Debugger User’s Guide
DS51766A-page 64 © 2008 Microchip Technology Inc.
NOTES:
MPLAB® ICD 3 IN-CIRCUITDEBUGGER USER’S GUIDE
© 2008 Microchip Technology Inc. DS51766A-page 65
Chapter 9. Debugger Function Summary
9.1 INTRODUCTIONA summary of the MPLAB ICD 3 in-circuit debugger functions on menus, in windows and on dialogs is listed here.• Debugging Functions• Debugging Dialogs/Windows• Programming Functions• Settings Dialog
9.2 DEBUGGING FUNCTIONSWhen you select the MPLAB ICD 3 from the Debugger menu, the following items will be added to the MPLAB IDE functions:• Debugger Menu – additional options are added to the drop-down menu• Right Mouse Button Debugger Menu – additional options are added to this menu• Toolbars/Status Bar – a toolbar appears below the menu bar; additional
information appears in the status bar
9.2.1 Debugger Menu
Run F9Execute program code until a breakpoint is encountered or until Halt is selected.Execution starts at the current Program Counter (as displayed in the status bar). The current Program Counter location is also represented as a pointer in the Program Memory window. While the program is running, several other functions are disabled.
AnimateAnimate causes the debugger to actually execute single steps while running, updating the values of the registers as it runs.Animate runs slower than the Run function, but allows you to view changing register values in the Special Function Register window or in the Watch window.To Halt Animate, use the menu option Debugger>Halt, the toolbar Halt or <F5>.
Halt F5Halt (stop) the execution of program code. When you click Halt, status information is updated.
Step Into F7Single step through program code.For assembly code, this command executes one instruction (single or multiple cycle instructions) and then halts. After execution of one instruction, all the windows are updated.
MPLAB® ICD 3 In-Circuit Debugger User’s Guide
DS51766A-page 66 © 2008 Microchip Technology Inc.
For C code, this command executes one line of C code, which may mean the execution of one or more assembly instruction, and then halts. After execution, all the windows are updated.
Step Over F8Execute the instruction at the current program counter location. At a CALL instruction, Step Over executes the called subroutine and halts at the address following the CALL. If the Step Over is too long or appears to “hang”, click Halt.
Step OutNot available.
Reset F6Issue a Reset sequence to the target processor. This issues a MCLR to reset the program counter to the Reset vector.
BreakpointsOpen the Breakpoint dialog (see Section 9.3.1 “Breakpoints Dialog”). Set multiple breakpoints in this dialog.
ProgramDownload your code to the target device.
ReadRead target memory. Information uploaded to MPLAB IDE.
Erase Flash DeviceErase all Flash memory.
Debug ReadReads program memory using the debug executive.
Abort OperationAbort any programming operation (e.g., program, read, etc.). Terminating an operation will leave the device in an unknown state.
ReconnectAttempt to re-establish communications between the PC and the MPLAB ICD 3 in-circuit debugger. The progress of this connection is shown on the ICD 3 tab of the Output dialog.
SettingsOpen the Programmer dialog (see Section 9.5 “Settings Dialog”). Set up program and firmware options.
Note: Do not step into a SLEEP instruction.
Note: You may also right click or double click on a line of code to set a simple breakpoint.
Debugger Function Summary
© 2008 Microchip Technology Inc. DS51766A-page 67
9.2.2 Right Mouse Button Debugger MenuThese debugger menu options will appear on the right mouse menus in code displays, such as program memory and source code files. Descriptions of other menu options not listed here can be found in the MPLAB IDE Help or the MPLAB Editor Help.
Set BreakpointSet or remove a breakpoint at the currently selected line.
BreakpointsRemove, enable or disable all breakpoints.
Run To CursorRun the program to the current cursor location. Formerly Run to Here.
Set PC at CursorSet the Program Counter (PC) to the cursor location.
Center Debug LocationCenter the current PC line in the window.
9.2.3 Toolbars/Status BarWhen the MPLAB ICD 3 in-circuit debugger is selected as a debugger, these toolbars are displayed in MPLAB IDE:• Basic debug toolbar (Run, Halt, Animate, Step Into, Step Over, Step Out, Reset).• Simple program toolbar (Read, Program, Erase Flash Device).The selected debug tool (MPLAB ICD 3), as well as other development information, is displayed in the status bar on the bottom of the MPLAB IDE desktop. Refer to the MPLAB IDE on-line help for information on the contents of the status bar.
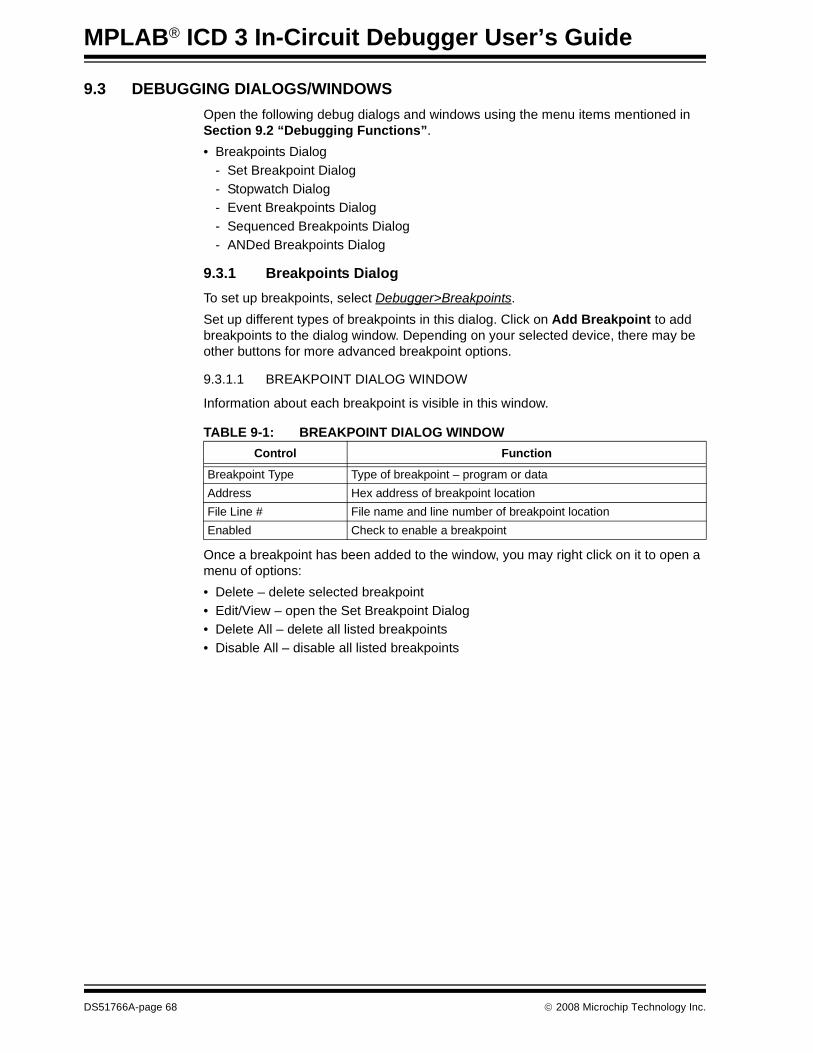
MPLAB® ICD 3 In-Circuit Debugger User’s Guide
DS51766A-page 68 © 2008 Microchip Technology Inc.
9.3 DEBUGGING DIALOGS/WINDOWSOpen the following debug dialogs and windows using the menu items mentioned in Section 9.2 “Debugging Functions”.• Breakpoints Dialog
- Set Breakpoint Dialog- Stopwatch Dialog- Event Breakpoints Dialog- Sequenced Breakpoints Dialog- ANDed Breakpoints Dialog
9.3.1 Breakpoints DialogTo set up breakpoints, select Debugger>Breakpoints.Set up different types of breakpoints in this dialog. Click on Add Breakpoint to add breakpoints to the dialog window. Depending on your selected device, there may be other buttons for more advanced breakpoint options.
9.3.1.1 BREAKPOINT DIALOG WINDOW
Information about each breakpoint is visible in this window.
Once a breakpoint has been added to the window, you may right click on it to open a menu of options:• Delete – delete selected breakpoint• Edit/View – open the Set Breakpoint Dialog• Delete All – delete all listed breakpoints• Disable All – disable all listed breakpoints
TABLE 9-1: BREAKPOINT DIALOG WINDOWControl Function
Breakpoint Type Type of breakpoint – program or dataAddress Hex address of breakpoint locationFile Line # File name and line number of breakpoint locationEnabled Check to enable a breakpoint
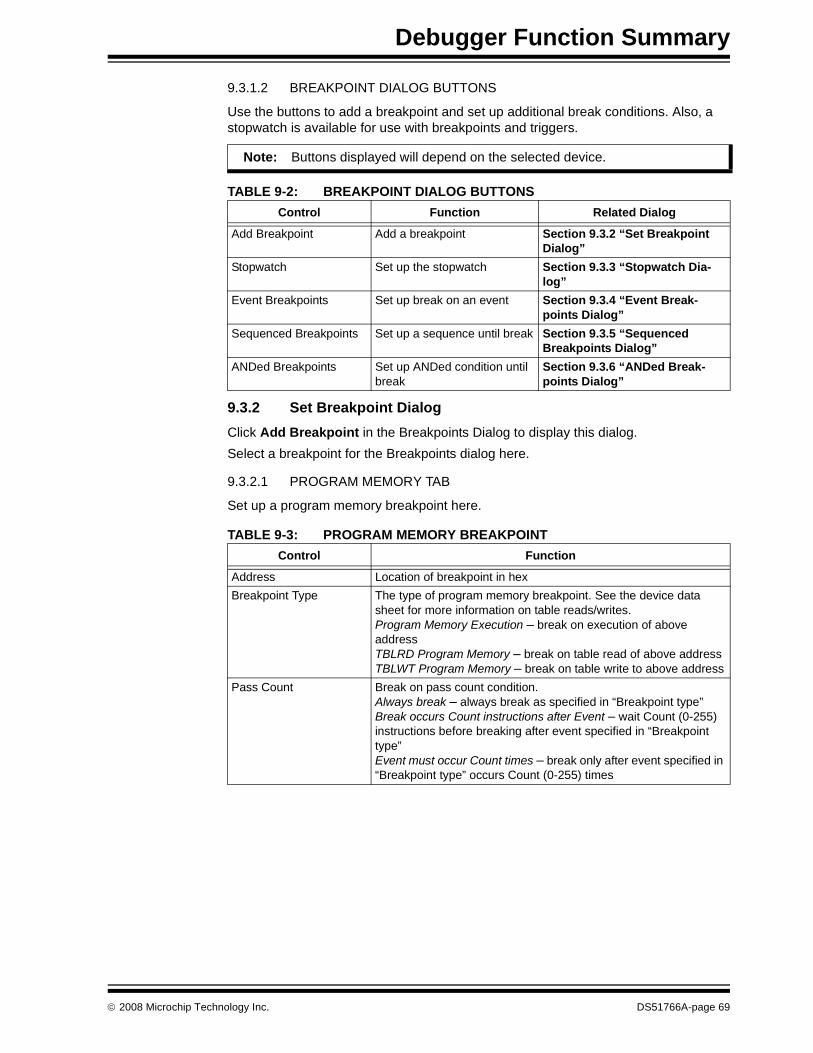
Debugger Function Summary
© 2008 Microchip Technology Inc. DS51766A-page 69
9.3.1.2 BREAKPOINT DIALOG BUTTONS
Use the buttons to add a breakpoint and set up additional break conditions. Also, a stopwatch is available for use with breakpoints and triggers.
9.3.2 Set Breakpoint DialogClick Add Breakpoint in the Breakpoints Dialog to display this dialog.Select a breakpoint for the Breakpoints dialog here.
9.3.2.1 PROGRAM MEMORY TAB
Set up a program memory breakpoint here.
Note: Buttons displayed will depend on the selected device.
TABLE 9-2: BREAKPOINT DIALOG BUTTONSControl Function Related Dialog
Add Breakpoint Add a breakpoint Section 9.3.2 “Set Breakpoint Dialog”
Stopwatch Set up the stopwatch Section 9.3.3 “Stopwatch Dia-log”
Event Breakpoints Set up break on an event Section 9.3.4 “Event Break-points Dialog”
Sequenced Breakpoints Set up a sequence until break Section 9.3.5 “Sequenced Breakpoints Dialog”
ANDed Breakpoints Set up ANDed condition until break
Section 9.3.6 “ANDed Break-points Dialog”
TABLE 9-3: PROGRAM MEMORY BREAKPOINTControl Function
Address Location of breakpoint in hexBreakpoint Type The type of program memory breakpoint. See the device data
sheet for more information on table reads/writes.Program Memory Execution – break on execution of above addressTBLRD Program Memory – break on table read of above addressTBLWT Program Memory – break on table write to above address
Pass Count Break on pass count condition.Always break – always break as specified in “Breakpoint type”Break occurs Count instructions after Event – wait Count (0-255) instructions before breaking after event specified in “Breakpoint type”Event must occur Count times – break only after event specified in “Breakpoint type” occurs Count (0-255) times
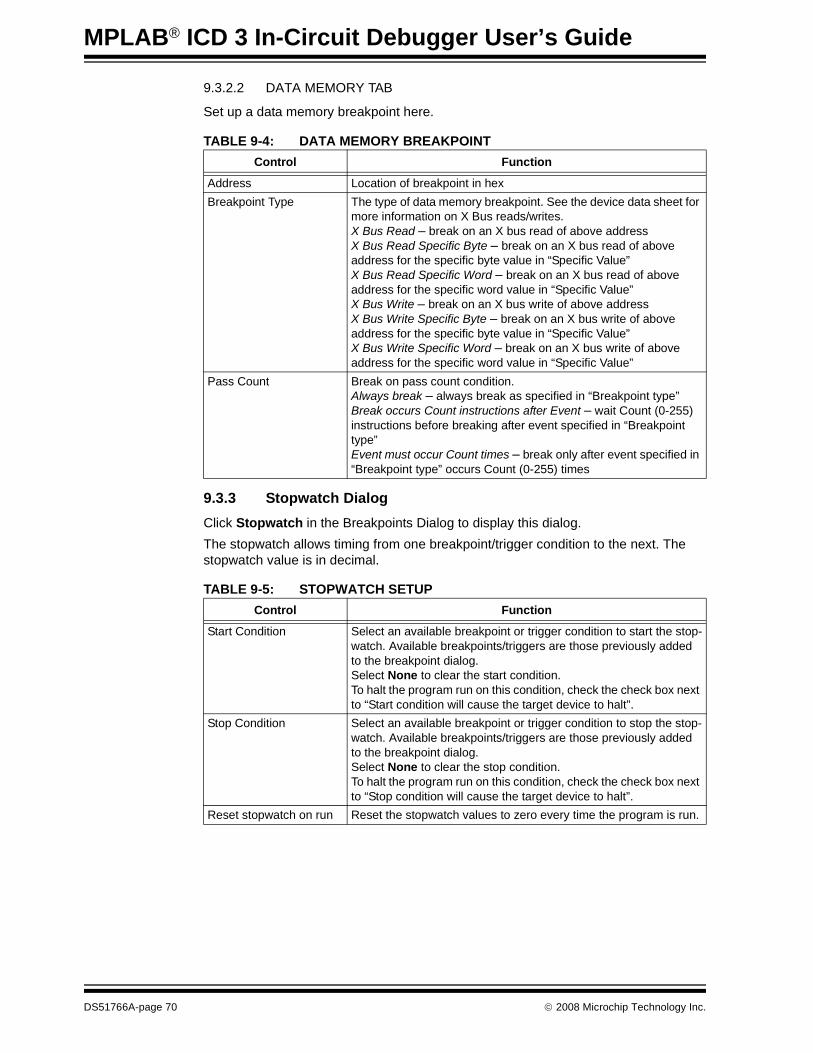
MPLAB® ICD 3 In-Circuit Debugger User’s Guide
DS51766A-page 70 © 2008 Microchip Technology Inc.
9.3.2.2 DATA MEMORY TAB
Set up a data memory breakpoint here.
9.3.3 Stopwatch DialogClick Stopwatch in the Breakpoints Dialog to display this dialog.The stopwatch allows timing from one breakpoint/trigger condition to the next. The stopwatch value is in decimal.
TABLE 9-4: DATA MEMORY BREAKPOINTControl Function
Address Location of breakpoint in hexBreakpoint Type The type of data memory breakpoint. See the device data sheet for
more information on X Bus reads/writes.X Bus Read – break on an X bus read of above addressX Bus Read Specific Byte – break on an X bus read of above address for the specific byte value in “Specific Value”X Bus Read Specific Word – break on an X bus read of above address for the specific word value in “Specific Value”X Bus Write – break on an X bus write of above addressX Bus Write Specific Byte – break on an X bus write of above address for the specific byte value in “Specific Value”X Bus Write Specific Word – break on an X bus write of above address for the specific word value in “Specific Value”
Pass Count Break on pass count condition.Always break – always break as specified in “Breakpoint type”Break occurs Count instructions after Event – wait Count (0-255) instructions before breaking after event specified in “Breakpoint type”Event must occur Count times – break only after event specified in “Breakpoint type” occurs Count (0-255) times
TABLE 9-5: STOPWATCH SETUPControl Function
Start Condition Select an available breakpoint or trigger condition to start the stop-watch. Available breakpoints/triggers are those previously added to the breakpoint dialog.Select None to clear the start condition. To halt the program run on this condition, check the check box next to “Start condition will cause the target device to halt”.
Stop Condition Select an available breakpoint or trigger condition to stop the stop-watch. Available breakpoints/triggers are those previously added to the breakpoint dialog.Select None to clear the stop condition. To halt the program run on this condition, check the check box next to “Stop condition will cause the target device to halt”.
Reset stopwatch on run Reset the stopwatch values to zero every time the program is run.
Debugger Function Summary
© 2008 Microchip Technology Inc. DS51766A-page 71
9.3.4 Event Breakpoints DialogClick Event Breakpoints in the Breakpoints Dialog to display this dialog.Select a condition where the program will always break:• Break on Watchdog Timer – Break every time the watchdog timer times out. Make
sure the Watchdog Timer is enabled in the Configuration bits.• Break on SLEEP instruction – Break when a SLEEP instruction is encountered in
the program.
9.3.5 Sequenced Breakpoints DialogClick Sequenced Breakpoints in the Breakpoints Dialog to display this dialog.Set up a sequential occurrence of breakpoints. Sequence execution of breakpoints is bottom-up; the last breakpoint in the sequence occurs first.To add a breakpoint to a sequence:• Select a breakpoint from the list of “Available Breakpoints”. Available
breakpoints/triggers are those previously added to the breakpoint dialog.• Select a sequence for the list of “Sequences”.• Click Add.To change the order of breakpoints in a sequence, drag-and-drop the breakpoint in the “Sequences list”. To remove a breakpoint from a sequence:• Select the breakpoint in the “Sequences” list.• Click Remove.
9.3.6 ANDed Breakpoints DialogClick ANDed Breakpoints in the Breakpoints Dialog to display this dialog.Set up an ANDed condition for breaking, i.e., breakpoint 1 AND breakpoint 2 must occur at the same time before a program halt. This can only be accomplished if a data breakpoint and a program memory breakpoint occur at the same time.To add a breakpoint to the AND condition:• Select a breakpoint from the list of “Available Breakpoints”. Available
breakpoints/triggers are those previously added to the breakpoint dialog.• Click Add.To remove a breakpoint from a sequence:• Select the breakpoint in the “ANDed Breakpoints” list.• Click Remove.
CloseClose this window.
FindOpens the Find dialog. In the Find What field, enter a string of text you want to find, or select text from the drop-down list. You can also select text in the edit window or place the cursor over a word you want to search for, before you open the Find dialog.In the Find dialog you may select any of the available options and the direction you want to search. Up searches backward from the insertion point, Down searches forward.
MPLAB® ICD 3 In-Circuit Debugger User’s Guide
DS51766A-page 72 © 2008 Microchip Technology Inc.
Find NextFind the next instance of Find text.<F3> repeats the last Find.<Shift> + <F3> reverses the direction of the last Find.
Go ToJump to the specified item:• Trigger – Jump to the location of the trigger.• Top – Jump to the top of the window.• Bottom – Jump to the bottom of the window.
Show SourceShow/hide the source code listing on the bottom of the window.
RefreshRefresh the viewable contents of the window.
PropertiesSet up window properties.
Debugger Function Summary
© 2008 Microchip Technology Inc. DS51766A-page 73
9.4 PROGRAMMING FUNCTIONSWhen you select the MPLAB ICD 3 in-circuit debugger from the Programmer menu, program items will be added to the following MPLAB IDE functions:• Programmer Menu• Toolbars/Status Bar
9.4.1 Programmer MenuProgramProgram specified memory areas: program memory, Configuration bits, ID locations and/or EEPROM data. See the Settings dialog for programming options.
VerifyVerify programming of specified memory areas: program memory, Configuration bits, ID locations and/or EEPROM data.
ReadRead specified memory areas: program memory, Configuration bits, ID locations and/or EEPROM data. See the Settings dialog for read options.
Blank Check AllCheck to see that all device memory is erased/blank.
Erase Flash DeviceErase all Flash memory.
SettingsOpen the Programmer dialog (see Section 9.5 “Settings Dialog”). Set up program and firmware options.
9.4.2 Toolbars/Status BarWhen the MPLAB ICD 3 in-circuit debugger is selected as a programmer, these toolbars are displayed in MPLAB IDE:• Basic program toolbar (Blank Check All, Read, Program, Verify, Erase Flash
Device).The selected programmer (MPLAB ICD 3), as well as other programming information, is displayed in the status bar on the bottom of the MPLAB IDE desktop. Refer to the MPLAB IDE on-line help for information on the contents of the status bar.
MPLAB® ICD 3 In-Circuit Debugger User’s Guide
DS51766A-page 74 © 2008 Microchip Technology Inc.
9.5 SETTINGS DIALOGSelect either Debugger>Settings or Programmer>Settings to open the Settings dialog and set up the MPLAB ICD 3 in-circuit debugger.
• Settings Dialog, Program Memory Tab• Settings Dialog, Configuration Tab• Settings Dialog, Freeze on Halt Tab• Settings Dialog, Status Tab• Settings Dialog, Clock Tab• Settings Dialog, Secure Segment Tab• Settings Dialog, Warnings Tab• Settings Dialog, Power Tab
9.5.1 Settings Dialog, Program Memory TabThis tab allows you to set up debug/programming options.• Allow MPLAB ICD 3 to select memories and ranges – the debugger uses your
selected device and default settings to determine what to program.• Manually select memories and ranges – you select the type and range of memory
to program.
• Set up automatic options – choose to “Program after successful build” and/or “Run after successful program”.
Note: Tabs displayed will depend on the selected device.
TABLE 9-6: MANUAL SELECTION OPTIONSMemoriesProgram Check to program Program Memory into target.Configuration Check to program Configuration bits into target.
Note: This memory is always programmed when debugger selected as a debugger.
EEPROM Check to erase and then program EEPROM memory on target, if available. Uncheck to erase EEPROM memory on target.
ID Check to program ID Memory into target.Program OptionsErase all before Program Check to erase all memory before programming begins.
Unless programming new or already erased devices, it is important to have this box checked. If not checked, the device is not erased and program code will be merged with the code already in the device.
Program MemoryStart, End The starting and ending hex address range in program memory for
programming, reading, or verification.If you receive a programming error due to an incorrect end address, you need to perform a reconnect, correct the end address and program again.Note: The address range does not apply to the Erase function. The Erase function will erase all data on the device.
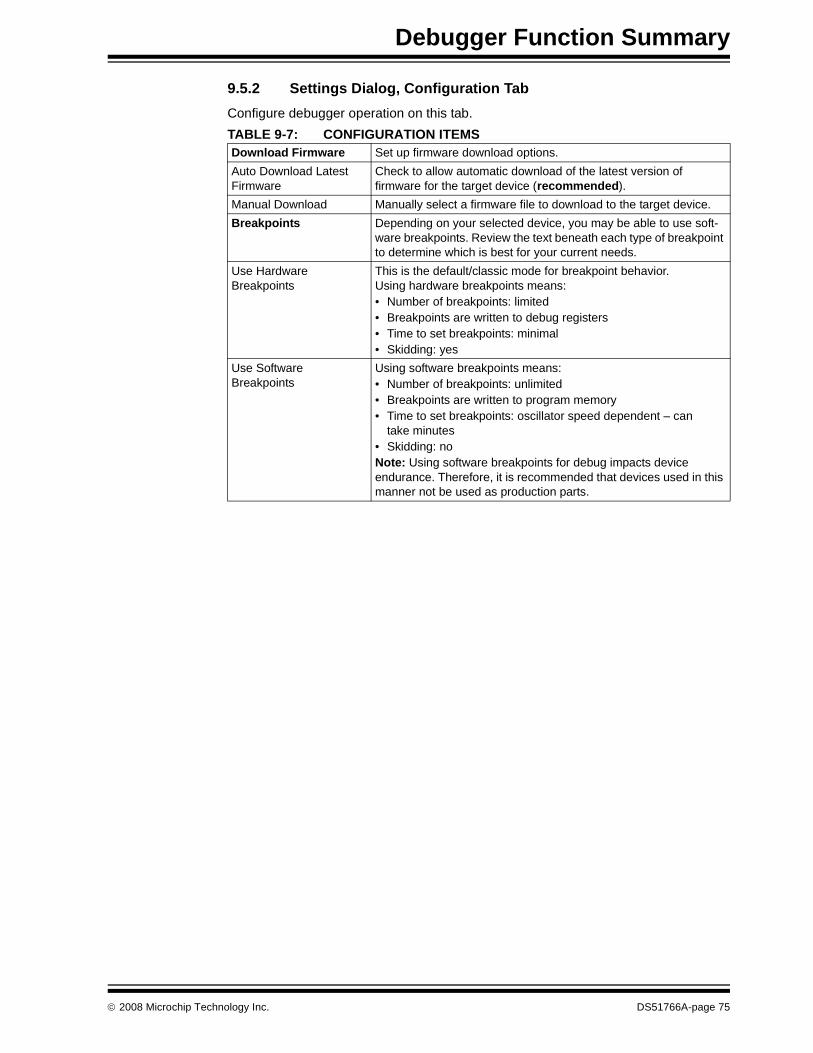
Debugger Function Summary
© 2008 Microchip Technology Inc. DS51766A-page 75
9.5.2 Settings Dialog, Configuration TabConfigure debugger operation on this tab.TABLE 9-7: CONFIGURATION ITEMSDownload Firmware Set up firmware download options.Auto Download Latest Firmware
Check to allow automatic download of the latest version of firmware for the target device (recommended).
Manual Download Manually select a firmware file to download to the target device.Breakpoints Depending on your selected device, you may be able to use soft-
ware breakpoints. Review the text beneath each type of breakpoint to determine which is best for your current needs.
Use Hardware Breakpoints
This is the default/classic mode for breakpoint behavior.Using hardware breakpoints means:• Number of breakpoints: limited• Breakpoints are written to debug registers• Time to set breakpoints: minimal• Skidding: yes
Use Software Breakpoints
Using software breakpoints means:• Number of breakpoints: unlimited• Breakpoints are written to program memory• Time to set breakpoints: oscillator speed dependent – can
take minutes• Skidding: noNote: Using software breakpoints for debug impacts device endurance. Therefore, it is recommended that devices used in this manner not be used as production parts.
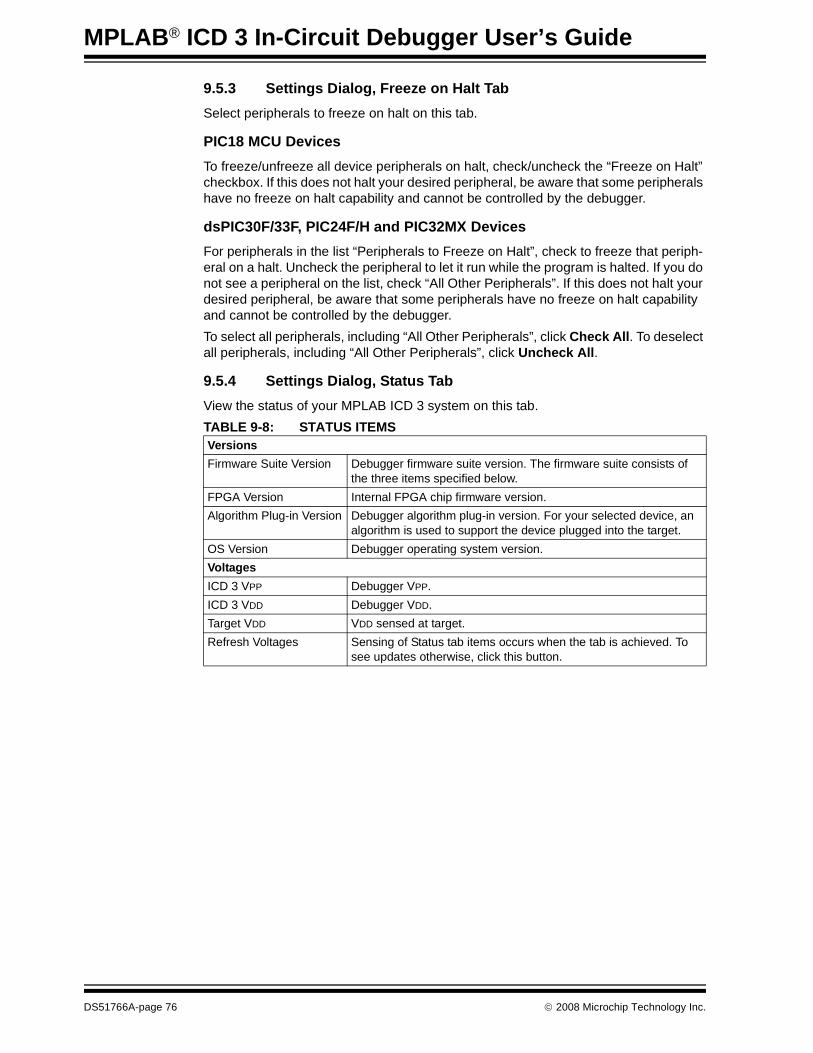
MPLAB® ICD 3 In-Circuit Debugger User’s Guide
DS51766A-page 76 © 2008 Microchip Technology Inc.
9.5.3 Settings Dialog, Freeze on Halt TabSelect peripherals to freeze on halt on this tab.
PIC18 MCU DevicesTo freeze/unfreeze all device peripherals on halt, check/uncheck the “Freeze on Halt” checkbox. If this does not halt your desired peripheral, be aware that some peripherals have no freeze on halt capability and cannot be controlled by the debugger.
dsPIC30F/33F, PIC24F/H and PIC32MX DevicesFor peripherals in the list “Peripherals to Freeze on Halt”, check to freeze that periph-eral on a halt. Uncheck the peripheral to let it run while the program is halted. If you do not see a peripheral on the list, check “All Other Peripherals”. If this does not halt your desired peripheral, be aware that some peripherals have no freeze on halt capability and cannot be controlled by the debugger.To select all peripherals, including “All Other Peripherals”, click Check All. To deselect all peripherals, including “All Other Peripherals”, click Uncheck All.
9.5.4 Settings Dialog, Status TabView the status of your MPLAB ICD 3 system on this tab. TABLE 9-8: STATUS ITEMSVersionsFirmware Suite Version Debugger firmware suite version. The firmware suite consists of
the three items specified below.FPGA Version Internal FPGA chip firmware version.Algorithm Plug-in Version Debugger algorithm plug-in version. For your selected device, an
algorithm is used to support the device plugged into the target.OS Version Debugger operating system version.VoltagesICD 3 VPP Debugger VPP.ICD 3 VDD Debugger VDD.Target VDD VDD sensed at target.Refresh Voltages Sensing of Status tab items occurs when the tab is achieved. To
see updates otherwise, click this button.
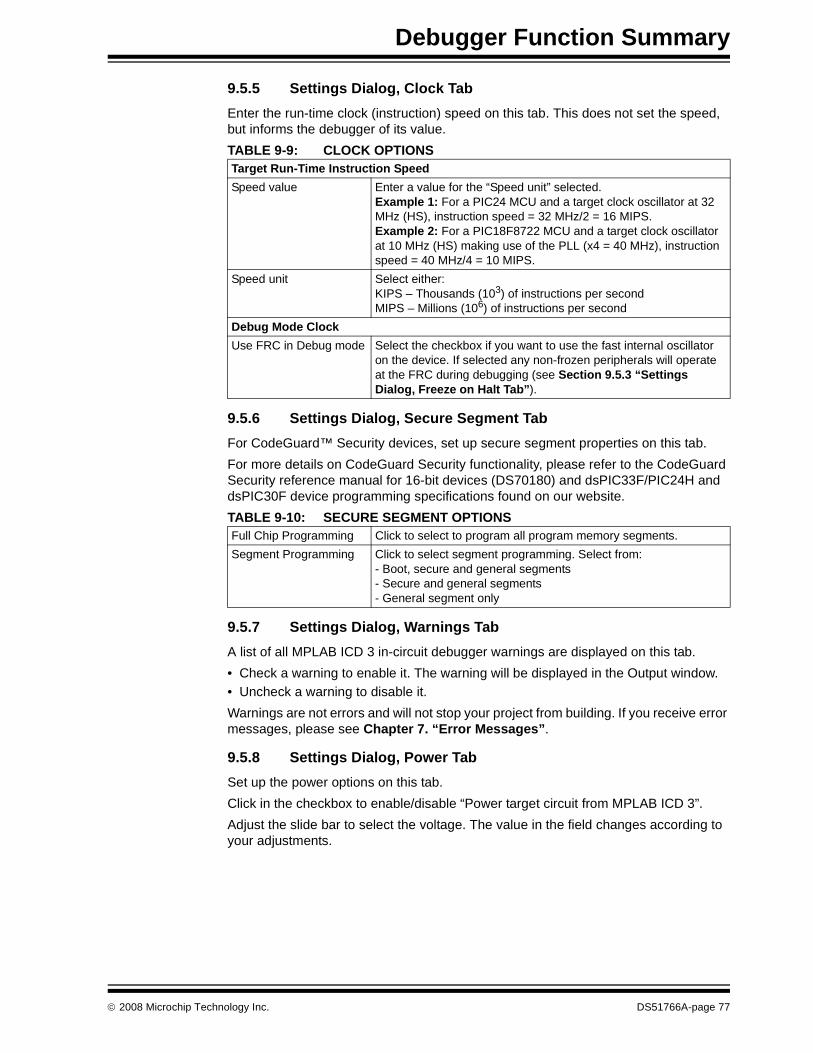
Debugger Function Summary
© 2008 Microchip Technology Inc. DS51766A-page 77
9.5.5 Settings Dialog, Clock TabEnter the run-time clock (instruction) speed on this tab. This does not set the speed, but informs the debugger of its value.
9.5.6 Settings Dialog, Secure Segment TabFor CodeGuard™ Security devices, set up secure segment properties on this tab.For more details on CodeGuard Security functionality, please refer to the CodeGuard Security reference manual for 16-bit devices (DS70180) and dsPIC33F/PIC24H and dsPIC30F device programming specifications found on our website.
9.5.7 Settings Dialog, Warnings TabA list of all MPLAB ICD 3 in-circuit debugger warnings are displayed on this tab.• Check a warning to enable it. The warning will be displayed in the Output window.• Uncheck a warning to disable it.Warnings are not errors and will not stop your project from building. If you receive error messages, please see Chapter 7. “Error Messages”.
9.5.8 Settings Dialog, Power TabSet up the power options on this tab.Click in the checkbox to enable/disable “Power target circuit from MPLAB ICD 3”.Adjust the slide bar to select the voltage. The value in the field changes according to your adjustments.
TABLE 9-9: CLOCK OPTIONSTarget Run-Time Instruction SpeedSpeed value Enter a value for the “Speed unit” selected.
Example 1: For a PIC24 MCU and a target clock oscillator at 32 MHz (HS), instruction speed = 32 MHz/2 = 16 MIPS.Example 2: For a PIC18F8722 MCU and a target clock oscillator at 10 MHz (HS) making use of the PLL (x4 = 40 MHz), instruction speed = 40 MHz/4 = 10 MIPS.
Speed unit Select either:KIPS – Thousands (103) of instructions per secondMIPS – Millions (106) of instructions per second
Debug Mode ClockUse FRC in Debug mode Select the checkbox if you want to use the fast internal oscillator
on the device. If selected any non-frozen peripherals will operate at the FRC during debugging (see Section 9.5.3 “Settings Dialog, Freeze on Halt Tab”).
TABLE 9-10: SECURE SEGMENT OPTIONSFull Chip Programming Click to select to program all program memory segments.Segment Programming Click to select segment programming. Select from:
- Boot, secure and general segments- Secure and general segments- General segment only

MPLAB® ICD 3 In-Circuit Debugger User’s Guide
DS51766A-page 78 © 2008 Microchip Technology Inc.
NOTES:
MPLAB® ICD 3 IN-CIRCUITDEBUGGER USER’S GUIDE
© 2008 Microchip Technology Inc. DS51766A-page 79
Chapter 10. Hardware Specification
10.1 INTRODUCTIONThe hardware and electrical specifications of the MPLAB ICD 3 in-circuit debugger system are detailed.
10.2 HIGHLIGHTSThis chapter discusses:• Declaration of Conformity• USB Port/Power• MPLAB ICD 3 Debugger• Standard Communication Hardware• ICD 3 Test Interface Board• Target Board Considerations
10.3 DECLARATION OF CONFORMITYWeMicrochip Technology, Inc.2355 W. Chandler Blvd.Chandler, Arizona 85224-6199USAhereby declare that the product:MPLAB® ICD 3 In-Circuit Debuggercomplies with the following standards, provided that the restrictions stated in the operating manual are observed:Standards: EN61010-1 Laboratory EquipmentMicrochip Technology, Inc.Date: August 2006Important Information Concerning the Use of the MPLAB ICD 3 In-Circuit DebuggerDue to the special nature of the MPLAB ICD 3 in-circuit debugger, the user is advised that it can generate higher than normal levels of electromagnetic radiation which can interfere with the operation of all kinds of radio and other equipment.To comply with the European Approval Regulations therefore, the following restrictions must be observed:1. The development system must be used only in an industrial (or comparable)
area.2. The system must not be operated within 20 meters of any equipment which may
be affected by such emissions (radio receivers, TVs etc.).
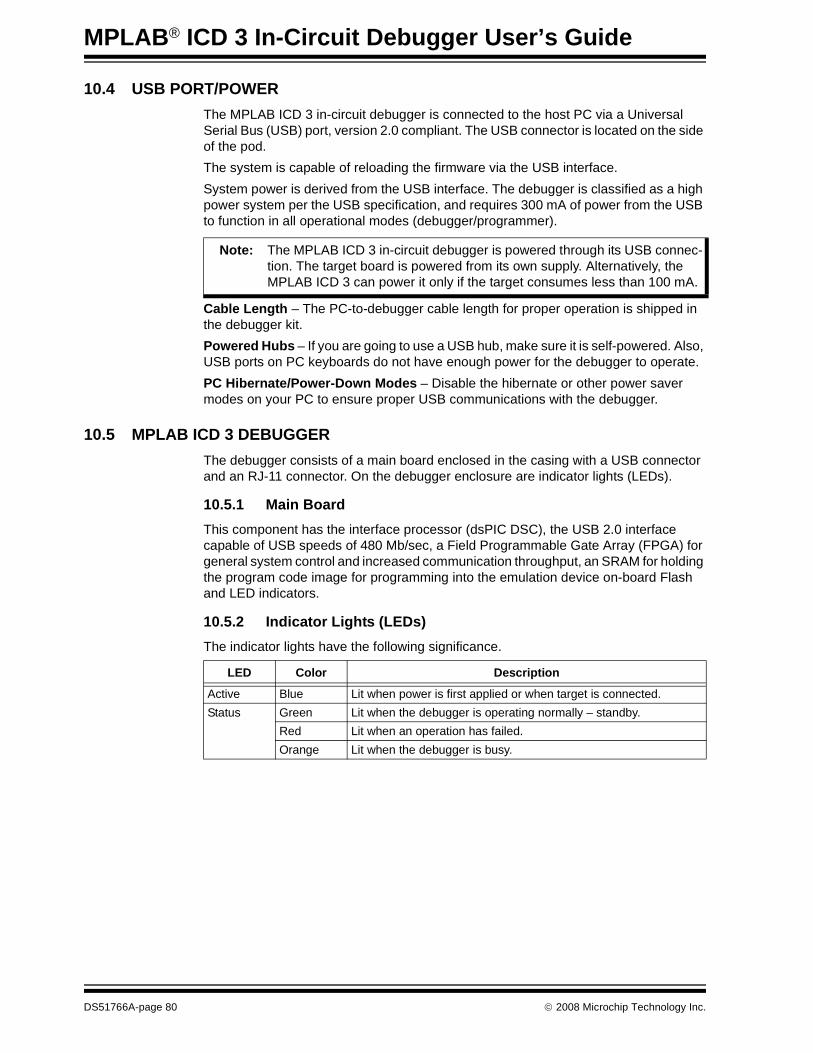
MPLAB® ICD 3 In-Circuit Debugger User’s Guide
DS51766A-page 80 © 2008 Microchip Technology Inc.
10.4 USB PORT/POWERThe MPLAB ICD 3 in-circuit debugger is connected to the host PC via a Universal Serial Bus (USB) port, version 2.0 compliant. The USB connector is located on the side of the pod.The system is capable of reloading the firmware via the USB interface.System power is derived from the USB interface. The debugger is classified as a high power system per the USB specification, and requires 300 mA of power from the USB to function in all operational modes (debugger/programmer).
Cable Length – The PC-to-debugger cable length for proper operation is shipped in the debugger kit.Powered Hubs – If you are going to use a USB hub, make sure it is self-powered. Also, USB ports on PC keyboards do not have enough power for the debugger to operate.PC Hibernate/Power-Down Modes – Disable the hibernate or other power saver modes on your PC to ensure proper USB communications with the debugger.
10.5 MPLAB ICD 3 DEBUGGERThe debugger consists of a main board enclosed in the casing with a USB connector and an RJ-11 connector. On the debugger enclosure are indicator lights (LEDs).
10.5.1 Main BoardThis component has the interface processor (dsPIC DSC), the USB 2.0 interface capable of USB speeds of 480 Mb/sec, a Field Programmable Gate Array (FPGA) for general system control and increased communication throughput, an SRAM for holding the program code image for programming into the emulation device on-board Flash and LED indicators.
10.5.2 Indicator Lights (LEDs)The indicator lights have the following significance.
Note: The MPLAB ICD 3 in-circuit debugger is powered through its USB connec-tion. The target board is powered from its own supply. Alternatively, the MPLAB ICD 3 can power it only if the target consumes less than 100 mA.
LED Color Description
Active Blue Lit when power is first applied or when target is connected.Status Green Lit when the debugger is operating normally – standby.
Red Lit when an operation has failed.Orange Lit when the debugger is busy.
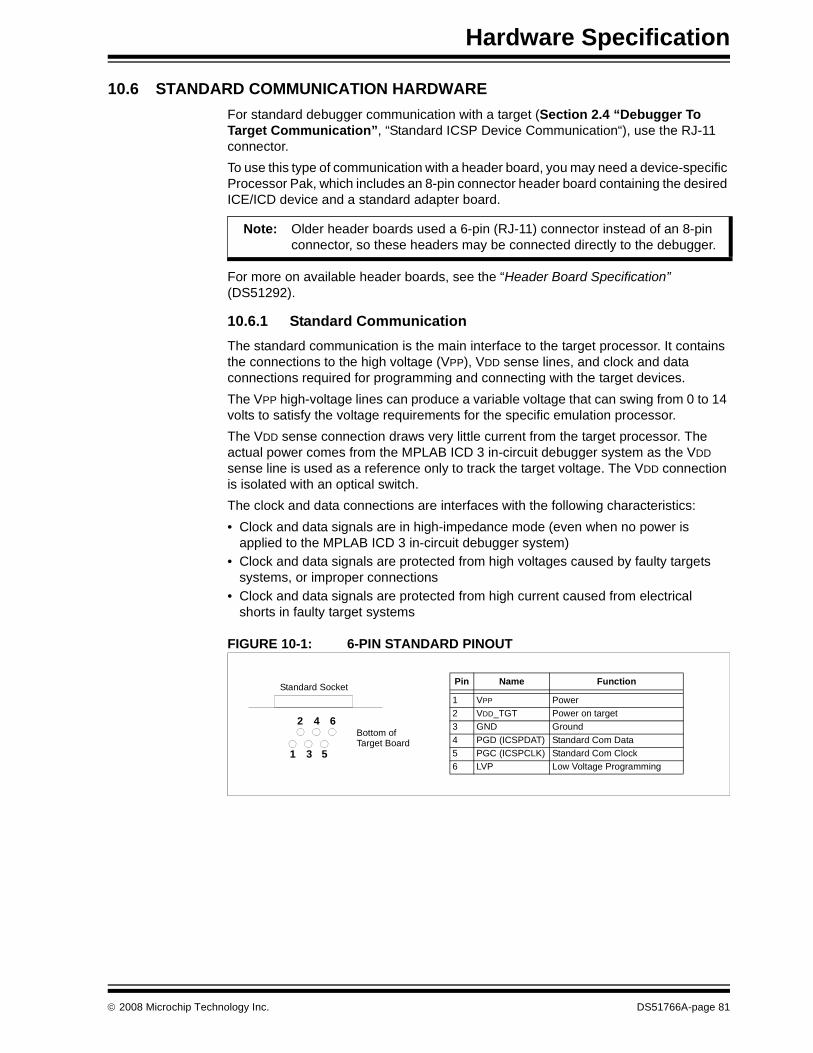
Hardware Specification
© 2008 Microchip Technology Inc. DS51766A-page 81
10.6 STANDARD COMMUNICATION HARDWAREFor standard debugger communication with a target (Section 2.4 “Debugger To Target Communication”, “Standard ICSP Device Communication“), use the RJ-11 connector.To use this type of communication with a header board, you may need a device-specific Processor Pak, which includes an 8-pin connector header board containing the desired ICE/ICD device and a standard adapter board.
For more on available header boards, see the “Header Board Specification” (DS51292).
10.6.1 Standard CommunicationThe standard communication is the main interface to the target processor. It contains the connections to the high voltage (VPP), VDD sense lines, and clock and data connections required for programming and connecting with the target devices.The VPP high-voltage lines can produce a variable voltage that can swing from 0 to 14 volts to satisfy the voltage requirements for the specific emulation processor. The VDD sense connection draws very little current from the target processor. The actual power comes from the MPLAB ICD 3 in-circuit debugger system as the VDD sense line is used as a reference only to track the target voltage. The VDD connection is isolated with an optical switch.The clock and data connections are interfaces with the following characteristics:• Clock and data signals are in high-impedance mode (even when no power is
applied to the MPLAB ICD 3 in-circuit debugger system)• Clock and data signals are protected from high voltages caused by faulty targets
systems, or improper connections• Clock and data signals are protected from high current caused from electrical
shorts in faulty target systems
FIGURE 10-1: 6-PIN STANDARD PINOUT
Note: Older header boards used a 6-pin (RJ-11) connector instead of an 8-pin connector, so these headers may be connected directly to the debugger.
1
2
3
4
5
6
Pin Name Function
1 VPP Power2 VDD_TGT Power on target3 GND Ground4 PGD (ICSPDAT) Standard Com Data5 PGC (ICSPCLK) Standard Com Clock6 LVP Low Voltage Programming
Bottom ofTarget Board
Standard Socket
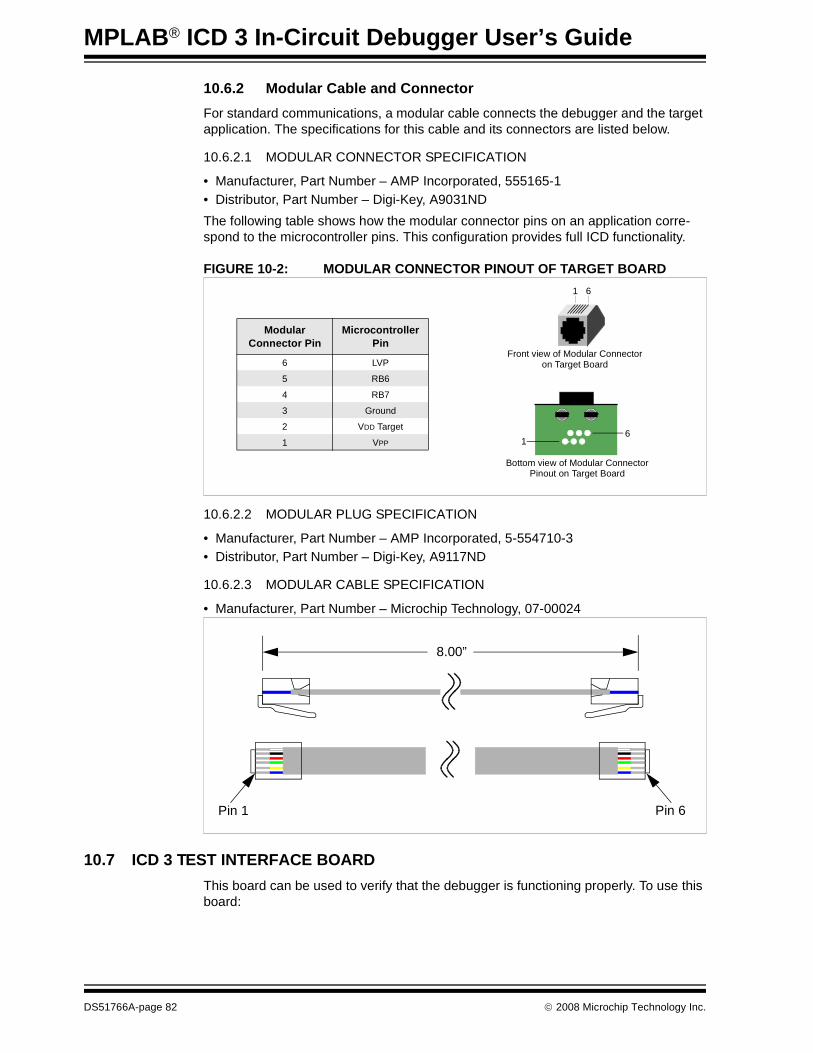
MPLAB® ICD 3 In-Circuit Debugger User’s Guide
DS51766A-page 82 © 2008 Microchip Technology Inc.
10.6.2 Modular Cable and ConnectorFor standard communications, a modular cable connects the debugger and the target application. The specifications for this cable and its connectors are listed below.
10.6.2.1 MODULAR CONNECTOR SPECIFICATION
• Manufacturer, Part Number – AMP Incorporated, 555165-1• Distributor, Part Number – Digi-Key, A9031NDThe following table shows how the modular connector pins on an application corre-spond to the microcontroller pins. This configuration provides full ICD functionality.
FIGURE 10-2: MODULAR CONNECTOR PINOUT OF TARGET BOARD
10.6.2.2 MODULAR PLUG SPECIFICATION
• Manufacturer, Part Number – AMP Incorporated, 5-554710-3• Distributor, Part Number – Digi-Key, A9117ND
10.6.2.3 MODULAR CABLE SPECIFICATION
• Manufacturer, Part Number – Microchip Technology, 07-00024
10.7 ICD 3 TEST INTERFACE BOARDThis board can be used to verify that the debugger is functioning properly. To use this board:
Modular Connector Pin
Microcontroller Pin
6 LVP
5 RB6
4 RB7
3 Ground
2 VDD Target
1 VPP 16
Bottom view of Modular Connector Pinout on Target Board
1 6
Front view of Modular Connector on Target Board
Pin 1
8.00”
Pin 6
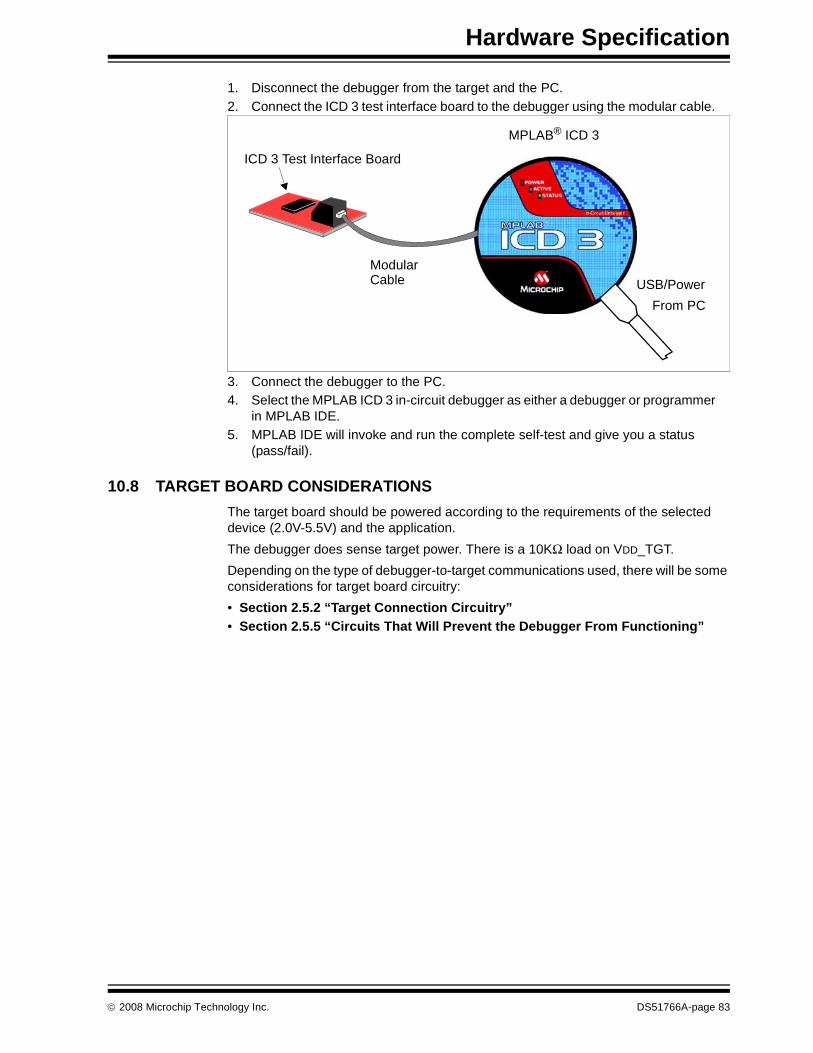
Hardware Specification
© 2008 Microchip Technology Inc. DS51766A-page 83
1. Disconnect the debugger from the target and the PC.2. Connect the ICD 3 test interface board to the debugger using the modular cable.
3. Connect the debugger to the PC.4. Select the MPLAB ICD 3 in-circuit debugger as either a debugger or programmer
in MPLAB IDE.5. MPLAB IDE will invoke and run the complete self-test and give you a status
(pass/fail).
10.8 TARGET BOARD CONSIDERATIONSThe target board should be powered according to the requirements of the selected device (2.0V-5.5V) and the application.The debugger does sense target power. There is a 10KΩ load on VDD_TGT.Depending on the type of debugger-to-target communications used, there will be some considerations for target board circuitry:• Section 2.5.2 “Target Connection Circuitry”• Section 2.5.5 “Circuits That Will Prevent the Debugger From Functioning”
ICD 3 Test Interface Board
USB/PowerFrom PC
ModularCable
MPLAB® ICD 3

MPLAB® ICD 3 In-Circuit Debugger User’s Guide
DS51766A-page 84 © 2008 Microchip Technology Inc.
NOTES:
MPLAB® ICD 3 IN-CIRCUITDEBUGGER USER’S GUIDE
© 2008 Microchip Technology Inc. DS51766A-page 85
Glossary
Absolute SectionA section with a fixed (absolute) address that cannot be changed by the linker.Access Memory (PIC18 Only)Special registers on PIC18 devices that allow access regardless of the setting of the Bank Select Register (BSR).AddressValue that identifies a location in memory.Alphabetic CharacterAlphabetic characters are those characters that are letters of the arabic alphabet(a, b, …, z, A, B, …, Z).AlphanumericAlphanumeric characters are comprised of alphabetic characters and decimal digits (0,1, …, 9).ANSIAmerican National Standards Institute is an organization responsible for formulating and approving standards in the United States.ApplicationA set of software and hardware that may be controlled by a PIC microcontroller.ArchiveA collection of relocatable object modules. It is created by assembling multiple source files to object files, and then using the archiver to combine the object files into one library file. A library can be linked with object modules and other libraries to create executable code.ArchiverA tool that creates and manipulates libraries.ASCIIAmerican Standard Code for Information Interchange is a character set encoding that uses 7 binary digits to represent each character. It includes upper and lower case letters, digits, symbols and control characters.AssemblerA language tool that translates assembly language source code into machine code.Assembly LanguageA programming language that describes binary machine code in a symbolic form.Asynchronous StimulusData generated to simulate external inputs to a simulator device.
MPLAB® ICD 3 In-Circuit Debugger User’s Guide
DS51766A-page 86 © 2008 Microchip Technology Inc.
BookmarksUse bookmarks to easily locate specific lines in a file.Under the Edit menu, select Bookmarks to manage bookmarks. Toggle (enable / disable) a bookmark, move to the next or previous bookmark, or clear all bookmarks.Breakpoint, HardwareAn event whose execution will cause a halt.Breakpoint, SoftwareAn address where execution of the firmware will halt. Usually achieved by a special break instruction.BuildCompile and link all the source files for an application.CA general-purpose programming language which features economy of expression, modern control flow and data structures, and a rich set of operators.Calibration MemoryA special function register or registers used to hold values for calibration of a PIC microcontroller on-board RC oscillator or other device peripherals.CleanUnder the MPLAB IDE Project menu, Clean removes all intermediary project files, such as object, hex and debug files, for the active project. These files are recreated from other files when a project is built.COFFCommon Object File Format. An object file of this format contains machine code, debugging and other information.Command Line InterfaceA means of communication between a program and its user based solely on textual input and output.CompilerA program that translates a source file written in a high-level language into machine code.Configuration BitsSpecial-purpose bits programmed to set PIC microcontroller modes of operation. A Configuration bit may or may not be preprogrammed.Control DirectivesDirectives in assembly language code that cause code to be included or omitted based on the assembly-time value of a specified expression.Cross Reference FileA file that references a table of symbols and a list of files that references the symbol. If the symbol is defined, the first file listed is the location of the definition. The remaining files contain references to the symbol.Data DirectivesData directives are those that control the assembler’s allocation of program or data memory and provide a way to refer to data items symbolically; that is, by meaningful names.
Glossary
© 2008 Microchip Technology Inc. DS51766A-page 87
Data MemoryOn Microchip MCU and DSC devices, data memory (RAM) is comprised of General Purpose Registers (GPRs) and Special Function Registers (SFRs). Some devices also have EEPROM data memory.Debugging InformationCompiler and assembler options that, when selected, provide varying degrees of infor-mation used to debug application code. See compiler or assembler documentation for details on selecting debug options.Device ProgrammerA tool used to program electrically programmable semiconductor devices such as microcontrollers.Digital Signal ControllerA microcontroller device with digital signal processing capability, i.e., Microchip dsPIC DSC devices.DirectivesStatements in source code that provide control of the language tool’s operation.DownloadDownload is the process of sending data from a host to another device, such as an debugger, programmer or target board.DSCSee Digital Signal Controller.EEPROMElectrically Erasable Programmable Read Only Memory. A special type of PROM that can be erased electrically. Data is written or erased one byte at a time. EEPROM retains its contents even when power is turned off.EmulationThe process of executing software loaded into emulation memory as if it were firmware residing on a microcontroller device.Emulation MemoryProgram memory contained within the debugger.DebuggerHardware that performs emulation.Debugger SystemThe MPLAB ICE 2000 and MPLAB ICE 4000 debugger systems include the pod, pro-cessor module, device adapter, target board, cables, and MPLAB IDE software. The MPLAB ICD 3 system consists of a pod, a driver (and potentially a receiver) card, target board, cables, and MPLAB IDE software.Environment – IDEThe particular layout of the desktop for application development.Environment – MPLAB PM3A folder containing files on how to program a device. This folder can be transferred to a SD/MMC card.EPROMErasable Programmable Read Only Memory. A programmable read-only memory that can be erased usually by exposure to ultraviolet radiation.
MPLAB® ICD 3 In-Circuit Debugger User’s Guide
DS51766A-page 88 © 2008 Microchip Technology Inc.
EventA description of a bus cycle which may include address, data, pass count, external input, cycle type (fetch, R/W), and time stamp. Events are used to describe triggers, breakpoints and interrupts.ExportSend data out of the MPLAB IDE in a standardized format.Extended Microcontroller ModeIn extended microcontroller mode, on-chip program memory as well as external mem-ory is available. Execution automatically switches to external if the program memory address is greater than the internal memory space of the PIC17 or PIC18 device.External LabelA label that has external linkage.External LinkageA function or variable has external linkage if it can be referenced from outside the module in which it is defined.External SymbolA symbol for an identifier which has external linkage. This may be a reference or a definition.External Symbol ResolutionA process performed by the linker in which external symbol definitions from all input modules are collected in an attempt to resolve all external symbol references. Any external symbol references which do not have a corresponding definition cause a linker error to be reported.External Input LineAn external input signal logic probe line (TRIGIN) for setting an event based upon external signals.External RAMOff-chip Read/Write memory.File RegistersOn-chip data memory, including General Purpose Registers (GPRs) and Special Function Registers (SFRs).FilterDetermine by selection what data is included/excluded in a trace display or data file.FlashA type of EEPROM where data is written or erased in blocks instead of bytes.FNOPForced No Operation. A forced NOP cycle is the second cycle of a two-cycle instruction. Since the PIC microcontroller architecture is pipelined, it prefetches the next instruction in the physical address space while it is executing the current instruction. However, if the current instruction changes the program counter, this prefetched instruction is explicitly ignored, causing a forced NOP cycle.GPRGeneral Purpose Register. The portion of device data memory (RAM) available for general use.HaltA stop of program execution. Executing Halt is the same as stopping at a breakpoint.
Glossary
© 2008 Microchip Technology Inc. DS51766A-page 89
Hex CodeExecutable instructions stored in a hexadecimal format code. Hex code is contained in a hex file.Hex FileAn ASCII file containing hexadecimal addresses and values (hex code) suitable for programming a device.High Level LanguageA language for writing programs that is further removed from the processor than assembly.ICDIn-Circuit Debugger. MPLAB ICD 2 is Microchip’s in-circuit debugger.ICEIn-Circuit Debugger. MPLAB ICE 2000, MPLAB ICE 4000 and MPLAB ICD 3 system are Microchip’s in-circuit debuggers.ICSPIn-Circuit Serial Programming. A method of programming Microchip embedded devices using serial communication and a minimum number of device pins.IDEIntegrated Development Environment. MPLAB IDE is Microchip’s integrated development environment.ImportBring data into the MPLAB IDE from an outside source, such as from a hex file.Instruction SetThe collection of machine language instructions that a particular processor understands.InstructionsA sequence of bits that tells a central processing unit to perform a particular operation and can contain data to be used in the operation.Internal LinkageA function or variable has internal linkage if it can not be accessed from outside the module in which it is defined.International Organization for StandardizationAn organization that sets standards in many businesses and technologies, including computing and communications.InterruptA signal to the CPU that suspends the execution of a running application and transfers control to an Interrupt Service Routine (ISR) so that the event may be processed. Upon completion of the ISR, normal execution of the application resumes.Interrupt HandlerA routine that processes special code when an interrupt occurs.Interrupt RequestAn event which causes the processor to temporarily suspend normal instruction exe-cution and to start executing an interrupt handler routine. Some processors have several interrupt request events allowing different priority interrupts.
MPLAB® ICD 3 In-Circuit Debugger User’s Guide
DS51766A-page 90 © 2008 Microchip Technology Inc.
Interrupt Service RoutineUser-generated code that is entered when an interrupt occurs. The location of the code in program memory will usually depend on the type of interrupt that has occurred.IRQSee Interrupt Request.ISOSee International Organization for Standardization.ISRSee Interrupt Service Routine.LibrarianSee Archiver.LibrarySee Archive.LinkerA language tool that combines object files and libraries to create executable code, resolving references from one module to another.Linker Script FilesLinker script files are the command files of a linker. They define linker options and describe available memory on the target platform.Listing DirectivesListing directives are those directives that control the assembler listing file format. They allow the specification of titles, pagination and other listing control.Listing FileA listing file is an ASCII text file that shows the machine code generated for each C source statement, assembly instruction, assembler directive, or macro encountered in a source file.Local LabelA local label is one that is defined inside a macro with the LOCAL directive. These labels are particular to a given instance of a macro’s instantiation. In other words, the symbols and labels that are declared as local are no longer accessible after the ENDM macro is encountered.Logic ProbesUp to 14 logic probes can be connected to some Microchip debuggers. The logic probes provide external trace inputs, trigger output signal, +5V, and a common ground.Machine CodeThe representation of a computer program that is actually read and interpreted by the processor. A program in binary machine code consists of a sequence of machine instructions (possibly interspersed with data). The collection of all possible instructions for a particular processor is known as its “instruction set”.Machine LanguageA set of instructions for a specific central processing unit, designed to be usable by a processor without being translated.MacroMacro instruction. An instruction that represents a sequence of instructions in abbrevi-ated form.
Glossary
© 2008 Microchip Technology Inc. DS51766A-page 91
Macro DirectivesDirectives that control the execution and data allocation within macro body definitions.MakefileExport to a file the instructions to Make the project. Use this file to Make your project outside of MPLAB IDE, i.e., with a make.Under Project>Build Options>Project, Directories tab, you must have selected “Assemble/Compile/Link in the project directory” under “Build Directory Policy” for this feature to work.Make ProjectA command that rebuilds an application, recompiling only those source files that have changed since the last complete compilation.MCUMicrocontroller Unit. An abbreviation for microcontroller. Also μC.MessageText displayed to alert you to potential problems in language tool operation. A message will not stop operation.MicrocontrollerA highly integrated chip that contains a CPU, RAM, program memory, I/O ports and timers.Microcontroller ModeOne of the possible program memory configurations of PIC17 and PIC18 microcon-trollers. In microcontroller mode, only internal execution is allowed. Thus, only the on-chip program memory is available in microcontroller mode.Microprocessor ModeOne of the possible program memory configurations of PIC17 and PIC18 microcon-trollers. In microprocessor mode, the on-chip program memory is not used. The entire program memory is mapped externally.MnemonicsText instructions that can be translated directly into machine code. Also referred to as opcodes.MPASM™ AssemblerMicrochip Technology’s relocatable macro assembler for PIC microcontroller devices, KeeLoq® devices and Microchip memory devices.MPLAB ASM30Microchip’s relocatable macro assembler for dsPIC digital signal controller and PIC24 PIC devices.MPLAB C17Obsoleted along with PIC17 MCU devices. See the MPLAB C18 C compiler.Refers to the MPLAB C17 C compiler from Microchip. MPLAB C17 is the C compiler for PIC17 MCU devices.MPLAB C18Refers to the MPLAB C18 C compiler from Microchip. MPLAB C18 is the C compiler for PIC18 MCU devices.MPLAB C30Microchip’s C compiler for dsPIC digital signal controller and PIC24 PIC devices.
MPLAB® ICD 3 In-Circuit Debugger User’s Guide
DS51766A-page 92 © 2008 Microchip Technology Inc.
MPLAB ICD 2Microchip’s in-circuit debugger that works with MPLAB IDE. The ICD supports Flash devices with built-in debug circuitry. The main component of each ICD is the pod. A complete system consists of a pod, header board (with a device-ICD), target board, cables, and MPLAB IDE software.MPLAB ICE 2000Microchip’s in-circuit debugger that works with MPLAB IDE. MPLAB ICE 2000 supports 8-bit PIC MCUs. The main component of each ICE is the pod. A complete system con-sists of a pod, processor module, cables, and MPLAB IDE software.MPLAB ICE 4000Not recommended for new designs. See the MPLAB ICD 3 in-circuit debugger.Microchip’s in-circuit debugger that works with MPLAB IDE. MPLAB ICE 4000 supports PIC18F and PIC24 MCUs and dsPIC DSCs. The main component of each ICE is the pod. A complete system consists of a pod, processor module, cables, and MPLAB IDE software.MPLAB IDEMicrochip’s Integrated Development Environment.MPLAB LIB30MPLAB LIB30 archiver/librarian is an object librarian for use with object modules created using either MPLAB ASM30 or MPLAB C30 C compiler.MPLAB LINK30MPLAB LINK30 is an object linker for the Microchip MPLAB ASM30 assembler and the Microchip MPLAB C30 C compiler.MPLAB PM3A device programmer from Microchip. Programs PIC18 microcontrollers and dsPIC digital signal controllers. Can be used with MPLAB IDE or stand-alone. Will obsolete PRO MATE II.MPLAB ICD 3 In-Circuit DebuggerMicrochip’s in-circuit debuggers that works with MPLAB IDE. The MPLAB ICD 3 debugger supports PIC18F and PIC24 MCUs and dsPIC DSCs. The main component of each ICE is the pod. A complete system consists of a pod, a driver (and potentially a receiver) card, cables, and MPLAB IDE software.MPLAB SIMMicrochip’s simulator that works with MPLAB IDE in support of PIC MCU and dsPIC DSC devices.MPLIB™ Object LibrarianMicrochip’s librarian that can work with MPLAB IDE. MPLIB librarian is an object librar-ian for use with COFF object modules created using either MPASM assembler (mpasm or mpasmwin v2.0) or MPLAB C17/C18 C compilers.MPLINK™ Object LinkerMPLINK linker is an object linker for the Microchip MPASM assembler and the Micro-chip MPLAB C17 or C18 C compilers. MPLINK linker also may be used with the Micro-chip MPLIB librarian. MPLINK linker is designed to be used with MPLAB IDE, though it does not have to be.MRUMost Recently Used. Refers to files and windows available to be selected from MPLAB IDE main pull down menus.
Glossary
© 2008 Microchip Technology Inc. DS51766A-page 93
Nesting DepthThe maximum level to which macros can include other macros.NodeMPLAB IDE project component.Non Real TimeRefers to the processor at a breakpoint or executing single-step instructions or MPLAB IDE being run in simulator mode.Non-Volatile StorageA storage device whose contents are preserved when its power is off.NOPNo Operation. An instruction that has no effect when executed except to advance the program counter.Object CodeThe machine code generated by an assembler or compiler.Object FileA file containing machine code and possibly debug information. It may be immediately executable or it may be relocatable, requiring linking with other object files, e.g., libraries, to produce a complete executable program.Object File DirectivesDirectives that are used only when creating an object file.Off-Chip MemoryOff-chip memory refers to the memory selection option for the PIC17 or PIC18 device where memory may reside on the target board, or where all program memory may be supplied by the debugger. The Memory tab accessed from Options>Development Mode provides the Off-Chip Memory selection dialog box.One-to-One Project-Workspace ModelThe most common configuration for application development in MPLAB IDE to is have one project in one workspace. Select Configure>Settings, Projects tab and check “Use one-to-one project-workspace model”.OpcodesOperational Codes. See Mnemonics.OperatorsSymbols, like the plus sign ‘+’ and the minus sign ‘-’, that are used when forming well-defined expressions. Each operator has an assigned precedence that is used to determine order of evaluation.OTPOne Time Programmable. EPROM devices that are not in windowed packages. Since EPROM needs ultraviolet light to erase its memory, only windowed devices are eras-able.Pass CounterA counter that decrements each time an event (such as the execution of an instruction at a particular address) occurs. When the pass count value reaches zero, the event is satisfied. You can assign the Pass Counter to break and trace logic, and to any sequential event in the complex trigger dialog.PCPersonal Computer or Program Counter.
MPLAB® ICD 3 In-Circuit Debugger User’s Guide
DS51766A-page 94 © 2008 Microchip Technology Inc.
PC HostAny PC running a supported Windows operating system.PIC MCUsPIC microcontrollers (MCUs) refers to all Microchip microcontroller families.PICSTART PlusA developmental device programmer from Microchip. Programs 8-, 14-, 28-, and 40-pin PIC microcontrollers. Must be used with MPLAB IDE software.Plug-insThe MPLAB IDE has both built-in components and plug-in modules to configure the system for a variety of software and hardware tools. Several plug-in tools may be found under the Tools menu.PodMPLAB ICD 3 system: The box that contains the emulation control circuitry for the ICE device on the header or target board. An ICE device can be a production device with built-in ICE circuitry or a special ICE version of a production device (i.e., device-ICE).MPLAB ICD 2: The box that contains the debug control circuitry for the ICD device on the header or target board. An ICD device can be a production device with built-in ICD circuitry or a special ICD version of a production device (i.e., device-ICD).MPLAB ICE 2000/4000: The external debugger box that contains emulation memory, trace memory, event and cycle timers, and trace/breakpoint logic.Power-on-Reset EmulationA software randomization process that writes random values in data RAM areas to simulate uninitialized values in RAM upon initial power application.PRO MATE IINo longer in Production. See the MPLAB PM3 device programmer.A device programmer from Microchip. Programs most PIC microcontrollers as well as most memory and KEELOQ devices. Can be used with MPLAB IDE or stand-alone.ProfileFor MPLAB SIM simulator, a summary listing of executed stimulus by register.Program CounterThe location that contains the address of the instruction that is currently executing.Program MemoryThe memory area in a device where instructions are stored. Also, the memory in the debugger or simulator containing the downloaded target application firmware.ProjectA project contains the files needed to build an application (source code, linker script files, etc.) along with their associations to various build tools and build options.Prototype SystemA term referring to a user's target application, or target board.PWM SignalsPulse-Width Modulation Signals. Certain PIC MCU devices have a PWM peripheral.QualifierAn address or an address range used by the Pass Counter or as an event before another operation in a complex trigger.

Glossary
© 2008 Microchip Technology Inc. DS51766A-page 95
RadixThe number base, hex, or decimal, used in specifying an address.RAMRandom Access Memory (Data Memory). Memory in which information can be accessed in any order.Raw DataThe binary representation of code or data associated with a section.Read Only Memory Memory hardware that allows fast access to permanently stored data but prevents addition to or modification of the data.Real TimeWhen an in-circuit debugger or debugger is released from the halt state, the processor runs in Real-Time mode and behaves exactly as the normal chip would behave. In Real-Time mode, the real time trace buffer of an debugger is enabled and constantly captures all selected cycles, and all break logic is enabled. In an in-circuit debugger or debugger, the processor executes in real time until a valid breakpoint causes a halt, or until the user halts the execution.In the simulator, real time simply means execution of the microcontroller instructions as fast as they can be simulated by the host CPU.Real-Time WatchA Watch window where the variables change in real-time as the application is run. See individual tool documentation to determine how to set up a real-time watch. Not all tools support real-time watches.RecursionThe concept that a function or macro, having been defined, can call itself. Great care should be taken when writing recursive macros; it is easy to get caught in an infinite loop where there will be no exit from the recursion.ROMRead Only Memory (Program Memory). Memory that cannot be modified.RunThe command that releases the debugger from halt, allowing it to run the application code and change or respond to I/O in real time.ScenarioFor MPLAB SIM simulator, a particular setup for stimulus control.SFRSee Special Function Registers.ShellThe MPASM assembler shell is a prompted input interface to the macro assembler. There are two MPASM assembler shells: one for the DOS version and one for the Windows version.SimulatorA software program that models the operation of devices.
MPLAB® ICD 3 In-Circuit Debugger User’s Guide
DS51766A-page 96 © 2008 Microchip Technology Inc.
Single StepThis command steps though code, one instruction at a time. After each instruction, MPLAB IDE updates register windows, watch variables, and status displays so you can analyze and debug instruction execution. You can also single step C compiler source code, but instead of executing single instructions, MPLAB IDE will execute all assembly level instructions generated by the line of the high level C statement.SkewThe information associated with the execution of an instruction appears on the proces-sor bus at different times. For example, the executed opcodes appears on the bus as a fetch during the execution of the previous instruction, the source data address and value and the destination data address appear when the opcodes is actually executed, and the destination data value appears when the next instruction is executed. The trace buffer captures the information that is on the bus at one instance. Therefore, one trace buffer entry will contain execution information for three instructions. The number of cap-tured cycles from one piece of information to another for a single instruction execution is referred to as the skew.SkidWhen a hardware breakpoint is used to halt the processor, one or more additional instructions may be executed before the processor halts. The number of extra instructions executed after the intended breakpoint is referred to as the skid.Source CodeThe form in which a computer program is written by the programmer. Source code is written in a formal programming language which can be translated into machine code or executed by an interpreter.Source FileAn ASCII text file containing source code.Special Function RegistersThe portion of data memory (RAM) dedicated to registers that control I/O processor functions, I/O status, timers or other modes or peripherals.Stack, HardwareLocations in PIC microcontroller where the return address is stored when a function call is made.Stack, SoftwareMemory used by an application for storing return addresses, function parameters, and local variables. This memory is typically managed by the compiler when developing code in a high-level language.Static RAM or SRAMStatic Random Access Memory. Program memory you can read/write on the target board that does not need refreshing frequently.Status BarThe Status Bar is located on the bottom of the MPLAB IDE window and indicates such current information as cursor position, development mode and device, and active tool bar.Step IntoThis command is the same as Single Step. Step Into (as opposed to Step Over) follows a CALL instruction into a subroutine.
Glossary
© 2008 Microchip Technology Inc. DS51766A-page 97
Step OverStep Over allows you to debug code without stepping into subroutines. When stepping over a CALL instruction, the next breakpoint will be set at the instruction after the CALL. If for some reason the subroutine gets into an endless loop or does not return properly, the next breakpoint will never be reached. The Step Over command is the same as Single Step except for its handling of CALL instructions.Step OutStep Out allows you to step out of a subroutine which you are currently stepping through. This command executes the rest of the code in the subroutine and then stops execution at the return address to the subroutine.StimulusInput to the simulator, i.e., data generated to exercise the response of simulation to external signals. Often the data is put into the form of a list of actions in a text file. Stimulus may be asynchronous, synchronous (pin), clocked and register.StopwatchA counter for measuring execution cycles.SymbolA symbol is a general purpose mechanism for describing the various pieces which comprise a program. These pieces include function names, variable names, section names, file names, struct/enum/union tag names, etc. Symbols in MPLAB IDE refer mainly to variable names, function names and assembly labels. The value of a symbol after linking is its value in memory.System Window ControlThe system window control is located in the upper left corner of windows and some dia-logs. Clicking on this control usually pops up a menu that has the items “Minimize,” “Maximize,” and “Close.”TargetRefers to user hardware.Target ApplicationSoftware residing on the target board.Target BoardThe circuitry and programmable device that makes up the target application.Target ProcessorThe microcontroller device on the target application board.TemplateLines of text that you build for inserting into your files at a later time. The MPLAB Editor stores templates in template files.Tool BarA row or column of icons that you can click on to execute MPLAB IDE functions.TraceAn debugger or simulator function that logs program execution. The debugger logs pro-gram execution into its trace buffer which is uploaded to MPLAB IDE’s trace window.Trace MemoryTrace memory contained within the debugger. Trace memory is sometimes called the trace buffer.
MPLAB® ICD 3 In-Circuit Debugger User’s Guide
DS51766A-page 98 © 2008 Microchip Technology Inc.
Trigger OutputTrigger output refers to an debugger output signal that can be generated at any address or address range, and is independent of the trace and breakpoint settings. Any number of trigger output points can be set.Uninitialized DataData which is defined without an initial value. In C,int myVar; defines a variable which will reside in an uninitialized data section.UploadThe Upload function transfers data from a tool, such as an debugger or programmer, to the host PC or from the target board to the debugger.USBUniversal Serial Bus. An external peripheral interface standard for communication between a computer and external peripherals over a cable using bi-serial transmission. USB 1.0/1.1 supports data transfer rates of 12 Mbps. Also referred to as high-speed USB, USB 2.0 supports data rates up to 480 Mbps.WarningAn alert that is provided to warn you of a situation that would cause physical damage to a device, software file, or equipment.Watch VariableA variable that you may monitor during a debugging session in a Watch window.Watch WindowWatch windows contain a list of watch variables that are updated at each breakpoint.Watchdog TimerA timer on a PIC microcontroller that resets the processor after a selectable length of time. The WDT is enabled or disabled and set up using Configuration bits.WDTSee Watchdog Timer.WorkbookFor MPLAB SIM stimulator, a setup for generation of SCL stimulus.WorkSpaceA workspace contains MPLAB IDE information on the selected device, selected debug tool and/or programmer, open windows and their location, and other IDE configuration settings.
MPLAB® ICD 3 IN-CIRCUITDEBUGGER USER’S GUIDE
© 2008 Microchip Technology Inc. DS51766A-page 99
Index
AAbort Operation........................................................ 66Animate.................................................................... 65AVdd ........................................................................ 16AVss......................................................................... 16
BBlank Check............................................................. 73Breakpoints
Dialog................................................................ 68Enabling............................................................ 67Hardware ...............................................41, 63, 75Setup .....................................................41, 63, 66Software.................................................44, 63, 75
Build Configuration..............................................20, 58
CCables
Length..........................................................80, 82Capacitors ...........................................................16, 17CD-ROM .................................................................. 10Circuits That Will Prevent the Debugger
From Functioning ................................................. 17Code Protect ............................................................ 18CodeGuard Security ................................................ 77Configuration Bits..........................................18, 27, 36Creating a Hex File .................................................. 37Customer Notification Service.................................... 5Customer Support ...................................................... 6
DDebug
Executive .......................................................... 19Registers........................................................... 20
Debug ModeSequence of Operations ................................... 18
Debug Read............................................................. 66Debugger Menu ....................................................... 40Debugging................................................................ 40Demo Board............................................................. 39Device and Feature Support .................................... 11Documentation
Conventions........................................................ 3Layout ................................................................. 1
Download Firmware ................................................. 75Driver Board
Standard ........................................................... 81Durability, Card Guide.............................................. 80
EErase........................................................................ 73Erase All Before Programming................................. 37Erase Flash Device .................................................. 66Explorer 16 Demo Board.......................................... 29
FFeature Support ....................................................... 11Firmware Downloads ............................................... 75Freeze on Halt.......................................................... 50
GGeneral Corrective Actions ...................................... 57
HHalt ........................................................................... 65Hardware Breakpoints.............................................. 41Header Board
Specification........................................................ 4Hex File .................................................................... 37Hibernate mode.............................................50, 51, 80Hubs, USB ............................................................... 80
IICD 3 Test Interface Board ................................ 10, 82ICD Headers ............................................................ 10ICD3Err0001 ............................................................ 53ICD3Err0002 ............................................................ 53ICD3Err0003 ............................................................ 53ICD3Err0005 ............................................................ 53ICD3Err0006 ............................................................ 53ICD3Err0007 ............................................................ 53ICD3Err0008 ............................................................ 53ICD3Err0009 ............................................................ 53ICD3Err0010 ............................................................ 53ICD3Err0011 ............................................................ 53ICD3Err0012 ............................................................ 54ICD3Err0013 ............................................................ 54ICD3Err0014 ............................................................ 54ICD3Err0015 ............................................................ 54ICD3Err0016 ............................................................ 54ICD3Err0017 ............................................................ 54ICD3Err0018 ............................................................ 54ICD3Err0019 ............................................................ 54ICD3Err0020 ............................................................ 54ICD3Err0021 ............................................................ 54ICD3Err0022 ............................................................ 54ICD3Err0023 ............................................................ 54ICD3Err0024 ............................................................ 54ICD3Err0025 ............................................................ 54ICD3Err0026 ............................................................ 54ICD3Err0027 ............................................................ 54
MPLAB® ICD 3 In-Circuit Debugger User’s Guide
DS51766A-page 100 © 2008 Microchip Technology Inc.
ICD3Err0028 ............................................................ 54ICD3Err0029 ............................................................ 54ICD3Err0030 ............................................................ 55ICD3Err0031 ............................................................ 55ICD3Err0032 ............................................................ 55ICD3Err0033 ............................................................ 55ICD3Err0034 ............................................................ 55ICD3Err0035 ............................................................ 55ICD3Err0036 ............................................................ 55ICD3Err0037 ............................................................ 55ICD3Err0038 ............................................................ 55ICD3Err0039 ............................................................ 55ICD3Err0040 ............................................................ 55ICD3Err0041 ............................................................ 55ICD3Err0045 ............................................................ 55ICD3Err0046 ............................................................ 56ICD3Err0047 ............................................................ 56ICD3Err0052 ............................................................ 56ICD3Err0053 ............................................................ 56ICD3Err0054 ............................................................ 56ICD3Err0055 ............................................................ 56ICD3Err0056 ............................................................ 56ICD3Err0057 ............................................................ 56ICD3Err0063 ............................................................ 56ICD3Err0064 ............................................................ 56ICD3Err0065 ............................................................ 56ICD3Err0066 ............................................................ 56ICD3Err0067 ............................................................ 56ICD3Err0068 ............................................................ 56ICD3Err0069 ............................................................ 56ICD3Err0070 ............................................................ 56ICD3Err0071 ............................................................ 56ICD3Err0072 ............................................................ 56ICD3Err0073 ............................................................ 56ICSP........................................................18, 19, 20, 81ICSPCLK.................................................................. 81ICSPDAT.................................................................. 81Indicator Lights ......................................................... 80Internet Address......................................................... 5
KKit Components........................................................ 10
LLEDs .................................................................. 29, 80Light Icons................................................................ 30Loading Program and Debug Code.......................... 39
MMicrochip Internet Web Site ....................................... 5Modular Interface Cable........................................... 18MPLAB C30 ............................................................. 33MPLAB ICD 3 Defined................................................ 9MPLAB IDE .............................................................. 21
PPC, Power Down .......................................... 50, 51, 80PGC...................................................15, 16, 17, 18, 19PGD...................................................15, 16, 17, 18, 19PIC24FJ128GA010, Tutorial .................................... 29PIM ........................................................................... 14Port A ....................................................................... 29Power-Down mode....................................... 50, 51, 80Processor Extension Kits ......................................... 10Program.............................................................. 66, 73Program after successful build ................................. 74Program Memory Tab .............................................. 37Programming............................................................ 45Programming Options .............................................. 36Project Wizard .................................................... 26, 33Pull-ups .................................................................... 17
RRead................................................................... 66, 73Reading, Recommended............................................ 4Readme...................................................................... 4Reconnect ................................................................ 66Reserved Resources by Device ............................... 20Reset
Processor .......................................................... 66Resistors .................................................................. 17Run........................................................................... 65Run after successful program .................................. 74Running code ........................................................... 40
SSecure Segments..................................................... 77Selecting Device and Development Mode ............... 30Set a Breakpoint....................................................... 41Setting Program and Debug Options ....................... 38Setting Up Hardware and Software.......................... 30SMPS ....................................................................... 11Software Breakpoints ............................................... 44Standard Communication
Connections ...................................................... 15Driver Board ...................................................... 81
Standard ICSP Device Communication ................... 14Step .......................................................................... 65Stopwatch........................................................... 43, 63
TTable Read Protect .................................................. 18Target Connection
Circuitry ............................................................. 15Improper Circuits............................................... 17Standard............................................................ 15
Target Device ........................................................... 18Timer1 ...................................................................... 29Toolbar Buttons ........................................................ 40Transition Socket...................................................... 10
Specification.................................................. 4, 23Tutorial ..................................................................... 29
Index
© 2008 Microchip Technology Inc. DS51766A-page 101
UUSB.....................................................................80, 98
Cables............................................................... 10Device Drivers .................................................. 21Hubs ................................................................. 80
VVcap......................................................................... 16Vdd.......................................................... 15, 16, 17, 18Verify........................................................................ 73Vpp.................................................... 15, 16, 17, 18, 19Vss .......................................................... 15, 16, 17, 18
WWarranty Registration ................................................ 4Watch Window ......................................................... 42Watchdog Timer..................................................18, 98WWW Address........................................................... 5

DS51766A-page 102 © 2008 Microchip Technology Inc.
AMERICASCorporate Office2355 West Chandler Blvd.Chandler, AZ 85224-6199Tel: 480-792-7200 Fax: 480-792-7277Technical Support: http://support.microchip.comWeb Address: www.microchip.comAtlantaDuluth, GA Tel: 678-957-9614 Fax: 678-957-1455BostonWestborough, MA Tel: 774-760-0087 Fax: 774-760-0088ChicagoItasca, IL Tel: 630-285-0071 Fax: 630-285-0075DallasAddison, TX Tel: 972-818-7423 Fax: 972-818-2924DetroitFarmington Hills, MI Tel: 248-538-2250Fax: 248-538-2260KokomoKokomo, IN Tel: 765-864-8360Fax: 765-864-8387Los AngelesMission Viejo, CA Tel: 949-462-9523 Fax: 949-462-9608Santa ClaraSanta Clara, CA Tel: 408-961-6444Fax: 408-961-6445TorontoMississauga, Ontario, CanadaTel: 905-673-0699 Fax: 905-673-6509
ASIA/PACIFICAsia Pacific OfficeSuites 3707-14, 37th FloorTower 6, The GatewayHarbour City, KowloonHong KongTel: 852-2401-1200Fax: 852-2401-3431Australia - SydneyTel: 61-2-9868-6733Fax: 61-2-9868-6755China - BeijingTel: 86-10-8528-2100 Fax: 86-10-8528-2104China - ChengduTel: 86-28-8665-5511Fax: 86-28-8665-7889China - Hong Kong SARTel: 852-2401-1200 Fax: 852-2401-3431China - NanjingTel: 86-25-8473-2460Fax: 86-25-8473-2470China - QingdaoTel: 86-532-8502-7355Fax: 86-532-8502-7205China - ShanghaiTel: 86-21-5407-5533 Fax: 86-21-5407-5066China - ShenyangTel: 86-24-2334-2829Fax: 86-24-2334-2393China - ShenzhenTel: 86-755-8203-2660 Fax: 86-755-8203-1760China - WuhanTel: 86-27-5980-5300Fax: 86-27-5980-5118China - XiamenTel: 86-592-2388138 Fax: 86-592-2388130China - XianTel: 86-29-8833-7252Fax: 86-29-8833-7256China - ZhuhaiTel: 86-756-3210040 Fax: 86-756-3210049
ASIA/PACIFICIndia - BangaloreTel: 91-80-4182-8400 Fax: 91-80-4182-8422India - New DelhiTel: 91-11-4160-8631Fax: 91-11-4160-8632India - PuneTel: 91-20-2566-1512Fax: 91-20-2566-1513Japan - YokohamaTel: 81-45-471- 6166 Fax: 81-45-471-6122Korea - DaeguTel: 82-53-744-4301Fax: 82-53-744-4302Korea - SeoulTel: 82-2-554-7200Fax: 82-2-558-5932 or 82-2-558-5934Malaysia - Kuala LumpurTel: 60-3-6201-9857Fax: 60-3-6201-9859Malaysia - PenangTel: 60-4-227-8870Fax: 60-4-227-4068Philippines - ManilaTel: 63-2-634-9065Fax: 63-2-634-9069SingaporeTel: 65-6334-8870Fax: 65-6334-8850Taiwan - Hsin ChuTel: 886-3-572-9526Fax: 886-3-572-6459Taiwan - KaohsiungTel: 886-7-536-4818Fax: 886-7-536-4803Taiwan - TaipeiTel: 886-2-2500-6610 Fax: 886-2-2508-0102Thailand - BangkokTel: 66-2-694-1351Fax: 66-2-694-1350
EUROPEAustria - WelsTel: 43-7242-2244-39Fax: 43-7242-2244-393Denmark - CopenhagenTel: 45-4450-2828 Fax: 45-4485-2829France - ParisTel: 33-1-69-53-63-20 Fax: 33-1-69-30-90-79Germany - MunichTel: 49-89-627-144-0 Fax: 49-89-627-144-44Italy - Milan Tel: 39-0331-742611 Fax: 39-0331-466781Netherlands - DrunenTel: 31-416-690399 Fax: 31-416-690340Spain - MadridTel: 34-91-708-08-90Fax: 34-91-708-08-91UK - WokinghamTel: 44-118-921-5869Fax: 44-118-921-5820
WORLDWIDE SALES AND SERVICE
01/02/08