m&poo - national radio astronomy observatory · mmn/reh/4. an investiration of possible...
TRANSCRIPT

U N I V E R S I T Y O F C A M B R I D G EDEPARTMENT OF PHYSICS
MULLARD RADIO ASTRONOMY OBSERVATORY
Postal address:CAVENDISH LABORATORY MADINGLEY ROAD CAMBRIDGE CB3 OHE Telephone: Cambridge (0223) 66477 Telex: 81292
April 1976 ___
Dr J Findlay zsrichr- WaveNational Radio Astronomy Observatory M \Edgemont Road M&POOCharlottesville -Virginia 22901 — — — .
Dear John
Thanks for your letter and the picture. It is a shame the Griffolyn didn't last because its RF properties are really rather good. My impression from the photograph is that it’s only the white plastic that has broken down, which is not surprising since it will obviously be much less protected from UV than the black. The trouble is that one would prefer to have the white plastic on the outside to reflect as much of the sun’s heat as possible.
I enclose the results of tests we have had done so far by NFL. These have concentrated on a very light thin inner membrane which is not supposed to stand up to the weather and which could be replaced fairly often. However, because of the costs associated with the rotating astrodome, we have to continue to consider conventional radomes, so we are very interested in the Essco materials. It is my understanding that Essco are having some tests of their materials done at NPL, and I assume they would pass the"Results on to you. If, however, you have any doubts about them I think we could get some more measurements made fairly easily. NPL only need a few inches square as far as I know.
On the measurement problem we are still pursuing the rather heavy handed ,,engineeringn solutions, as you will see from the paper on "UV method".There are some practical snags with this of course - such as how do you swing it round past the feed legs? - and^I don’t think such a machine would be practical for dishes much larger than ours, but I am fairly hopeful that it can do the job for us.
One other thing I have done recently is to calculate the effect of deformations of surface panels caused by the weight of a curvature measuring trolley. (See second half of "Note on Deformation...") I don't know how serious these effects are likely to be in practice, but I thought the sum was probably worth doing. Please don't take the first part of that note too seriously; it is pretty much an academic exercise. The point is, I think, that one of the main reasons for always supporting panels at their corners is to stop them blowing around in the wind. If you put the telescope in a radome this may no longer be the right thing to do.
Another example of the same argument, and probably a much more important one, is the question of the weight of the telescope. Obviously in a radome it can

Dr J Findlay 2 l(+ April 1976
be much lighter than if it has to stand up to the weather. The contrast between the new Bell Telephone antenna by Philco and the Essco one being made for U. Mass is very marked in this respect. However, it is not possible to cut the weight much unless one can find a way of making the panels light and this seems likely to be a problem with castings. Certainly the Bell Telephone ones were very heavy. We are trying to decide which lines to follow in doing some experiments. Did you go ahead with getting some more trial panels made? If you did, would it be possible to compare notes on the results? It would be good to avoid too much duplication of effort if possible.
You will have gathered that our project is pushing on, at least on paper, although of course it is going too slowly, and that we are trying to get some practical work started. The latter is made difficult by our lack of a proper in-house engineering base. The prospects for getting the full project approved are still none too good, with competition hotting up as the funds get scarce. I was impressed by the increase in astronomy funding in next year’s US budget. What is the earliest you can now hope to build your 25 m telescope
With best wishes,Yours sincerely
Richard Hills
Enclosures: NPL membrane interim report UV measurement MMN/REH/4
An I n v e s t ir a t io n o f P o ss ib le M illim etre Wavelength Radorao M ater ia lsInterim Report
This report presents a discussion of the preliminary results of an
investigation into the suitability of various materials as radomes for a
proposed millimetre wavelength telescope. The general requirements for the
radome material can be summarised as follows:(i) A power transmission in excess of 0.90 from 100 to 300 GHz with a
lower figure acceptable at frequencies up to the $00 GHz atmospheric window.
(ii) A real relative permittivity less than 2.
(iii) An optical thickness less than ^/4 at 375 0,2 in ,
(iv) A rejection of near infrared and visible solar radiation of about 0.
(v) Mechanical strength and weathering resistance.
(vi) Reasonable cost and availability.
(vii) Eace of handling and mounting.Poly?;:• T'S are the class of materialo meat likely to satisfy these
requirements. Low-loss polymers are ccramer jially available, have low real
refractive indices - 1.4 to 1.5 (e* ~ 1.96 to 2.25), are easily woven to
increase tensile Lfcrength and resistance to tearing and can be filled to
improve their near infrared and visible rejection characteristics.The part of the investigation reported ho re is the initial measure.r.cr.t
of the millimetre wavelength power transmission of five commonly available
low—loss polymers with various fillers and coatings. These results will t.\en
be used to eliminate obviously unsuitable materials according to the fir^t
requirement. The measurements were mr.ie using the techniques of Fourier
transform spectrometry with a two—beam Michelson interferometer, phase modulation and a liquid helium cooled indium antimonide photoconductor used
in the Roll in mode. The power transmission of each specimen was measured
from 210 to 900 GHs (7 to 30 ciiT1) at ambient temperature (~ 290K) in the
collimated beam leaving the exit aperture of the interferometer. Table 1

listo tho specimens studied
MATERIAL FILLER COATING THICKISSS (urn)
Polypropylene - - 20
Polytetrafluoroethylene - - 90
Polyethylene Ti02 - 47.5Carbon black 72.5
Polyurethane — — 117 and 302Carbon black - 62.5 and 612
Polyethylene mm Nickel-cadmium 25torephthalate - Aluminium 47.5
Ti02 - 37# 5- Graphite 25- Carbon black 32.5
Sailcloth Parachute cloth Plasticised F V C
Griffolyn
82.5 ana 140 300 762 100
RESULTS AND DISCUSSIONS
(i) Polypropylene and polytetrafluoroethylene (PTJE)
These were included in the survey to show the extremely low level of
transmission loss that can be achieved in commercially available polymers.
In these thicknesses the losses in the clear polypropylene film are mainly
reflective and the power transmission is greater than 0.95 between 10 and
30 cnf^ (Fig 1)« The PTJE specimen was considerably thicker and its
transmission lies between 0.90 and 0.92 over this range (Fig 2). PTFE
has a naturally white colour but would not reject sufficient visible and
near infrared solar radiation in thin film form.

(ii) Polyethylene
Unfilled or uncoated polyethylene based radomes will be largely
unsuitable due to the rapid degradation of* polyethylene in ultraviolet
radiation. The addition of a filler or coating to absorb the ultraviolet
radiation will go some way in overcoming this, and in general loading with
carbon black considerably improves the weathering properties of most
polymers. The measurements on the TiO^ and carbon black filled
polyethylene specimens are of interest in showing that the addition of
fillers to low loss polymers does not introduce substantial transmission losses (Figs 3 and 4)*
(iii) Polyurethane
This is a more weather resistant material than polyethylene and the
measurements were made on two thicknesses of each of clear and black F1C0
polyurethane film supplied by ICI and known as Daltoflex. The transmission
measurements indicate that it is a fairly lossy material with the thinnest
(117 pn) clear specimen having a transmission below 0.8 at 30C GHz. In
addition all the specimens exhibited well-defined multiple-beam interference fringes (Figs 5 and 6).
(iv) Polyethylene terephthalate (EST)
This material, which is also known as Kelinex, Mylar and Terylene, is
the principal material used for the beam dividers of far infrared inter
ferometers and its optical properties are fairly well-known. It is
intensely absorbing above 1 .5 THz (50 cm*"1) but transparent in thin film
form. Figures 7 and 8 show the transmissions of two films that had been
lightly metalised. One had been lightly aluminised and was fairly
transparent (* 0.5) in the visible while the other was heavily coated with
nickel-cadmium and was visibly opaque as judged by the eye. These had very low
transmissions <0.05 and were clearly unsuitable. Two coated PET specimens
were measured, one with graphite and one with carbon black and their
transmissions are shown in Figures 9 and 10. These were fairly high but not

to tho required level. The final PET film used was filled with TiO^ and
had a transmission in excess of 0.90 below 300 GHz (Fig 11).(v) Sailcloth and parachute cloth
These were supplied by Carrington Performance Fabrics, a subsidiary
of ICI. Sailcloth is a woven terylene dipped in clear polyurethane for
wind-and water-proofing and measurements were made on orange and white
coloured 82.5 thicknesses and on a blue 140 specimen. The
thinner specimens showed identical millimetre wavelength transmissions in
excess of 0.95 at 300 GHz falling to about 0.80 at 900 GHz (Fig 12).
The parachute cloth was a fairly open nylon weave and not wind-proofed.
Its transmission, shown in Fig 13 is fairly high but only rises to about
O.65 by 300 GHz .
(vi) Plasticised FVC
This was a white composite supplied by Mr Shenton of the Appleton
Laboratory from an American source. Although fairly transparent at
millimetre wavelengths it has closely spaced interference fringes that
render it unsuitable for radome use (Fig 14).
(vii) Griffolyn
This was a composite material again supplied by Mr Shenton. It corr.pric*black and a white polyethylene sheet glued together with PIB glue over a
widely spaced (~ 8-10 mm) grid of nylon threads. Its transmission was
fairly constant at 0.80 from 210 to 900 GHz (Fig 15).Of the specimens studied five can be recommended for further
consideration as possible radome materials in the following descending order of preference.
(i) 82.5 Mni sailcloths These have extremely high transmission characteristics and their woven
nature implies high strength and resistance to tearing. It is unlikely that
in their present form they would reject much visible and near infrared *Pol yi uobutadione

- 5 -
radiation but the measurements on filled polyethylene and polyurethane
indicate that it should be possible to use a black polyurethane dip on the
teiylene instead of the present clear one. The major reservation about this
material comes from its periodic structure and possible diffraction effects._2The individual fibres used have a very small diameter <10 mm but they
■*1are collected together in flat strips ~ 10“ mm width (Fig 16) which could
give rise to considerable diffraction at 900 GHz , This point should be
considered further.
(ii) Griffolyn
This has a rather low, but constant, transmission of about 0.80 from
210 to 900 GHz although from thin film theory one would expect this to
increase to ~ 1.0 as the frequency decreases further. It is predominantly
polyethylene although the fillers used should inhibit ultraviolet degradation,
and the nylon reinforcing fibres ensure that it has considerable strength.
If the terylene sailcloths prove to be unsuitable then this material should
be considered in spite of its low transmission. The glue used for holding
the two sheets together is known to be a lossy material and it might be
possible to replace it with a lower loss one,
(iii) Carbon black and TiO^ filled polyethylene, TiO^ filled polyethylene terephthalate
These remaining possible materials all have excellent transmission
characteristics and (especially the carbon black) should have good short
wavelength blocking characteristics. They would, however, be much more
difficult to mount and more liable to tear than the woven materials but
should be considered, in the absence of suitable woven alternatives.
In the final report on the complete investigation the power transmission
measurements will be extended down to ~ 100 GHz and the total (specular and
diffuse) transmission and reflectivity of the preferred materials measured
from 0. 35 to 2.1 Jim .

JRS021 21 MAY 75POLYPROPYLENE FILM
POWER TRANSMISSION
UAVENUMBER CH-1

JRS021 21 MAY 75PTF8 SHEET 0.003 INCH
POWER TRANSMISSION1.0
.80
,60 --
.40 —
.20
-nc s 'r°
H-- 1-- 1-- 1-- r - t- H -- 1-- K 10 2 04-— I-- 1-- 1-- 1-- 1-- !-- i-- 5-- 1
wavenltser at-i

JRS021 21 MAY 75TI02 FILLED POLYETHYLENE
POUER TRANSMISSION
WAVENUM3ER CH-1

JRS021 21 MAY 75CARBON BLACK FILLED POLYETHYLENE
POWER TRANSMISSION
WAVENUrSER Ctt-1

POWER TRANSMISSION1.0 -r
JRS021 21 MAY 75F100 POLYURETHANE
1— I— I— i— »— i— i— I— »— 1— I— I— i— I— h— i— i— I— i— |— i— i— i— i— i— i— i— i— i— |10 20MAVENUMBER CM-1

POWER TRANSMISSION1.0 -1-
JRS021 21 MAY 75F100 BLACK POLYURETHANE
.80 --
•60 - -
.40
.20 --
TlC?'
<P -- 1-- 1-- 1-- 1-- 1-- 1-- 1-- 1-- 1-- 1-- 1-- !-- 1-- 1-- 1-- 1-- 1-- 1-- 1-- 1-- 1-- 1-- 1-- 1-- 1-- 1-- 1-- 1-- 110 20 WAVENUM3ER CM-1

JRS021 21 MAY 75NI-CD METALISED PET
POWER TRANSMISSION
WAVENUK8ER CM-1

JRS021 21 MAY 75FLASH ALUMINISED PET
POWER TRANSMISSION .10
.08 --
.0* --
.04 --
.02 - -
4-- 1-- 1-- 1-- 1-- 1-- 1-- 1-- 1-- 1-- f-- 1-- 1-- 1-- 1-- 1-- 1-- 1-- 1---|-- 1-- 1-- 1-- 1-- 1-- 1-- 1-- 1-- 1—10 20 WAVENUM3ER CM-1

POWER TRANSMISSION1.0 -r
JRS021 21 MAY 75GRAPHITE COATED PET
.80 --
.60 - -
.40 — *
.20 - -
H-- 1-- 1-- 1-- 1-- 1-- 1-- 1-- 1-- 1-- 1-- 1-- 1-- 1-- 1-- 1-- \-- 1-- 1-- 1-- 1-- 1-- 1-- 1-- 1-- 1-- 1-- 1-- \-- 110 20 WAYENUM3ER CM-1

JRS021 21 MAY 75PET CARBON COMPUTER PRINT OUT
POWER TRANSMISSION
WAVENUttSER CM-1

JRS021 21 MAY 75TI02 FILLED PET
POWER TRANSMISSION1.0 -r
.80 --
.60 --
.40 --
.20 - -
H-- 1-- 1-- 1-- 1-- 1-- 1-- 1-- 1-- 1-- 1-- 1-- I-- 1-- 1-- !-- !-- 1-- 1-- 1-- 1-- 1-- 1-- 1-- 1-- 1-- 1-- 1---I-- 110 20 WAVENUM8ER CM-1

JRS021. 21 MAY 75 SAILCLOTHS
POWER TRANSMISSION
-rtO'
P
WAVENUM3ER CM-1

POUER TRANSMISSION1.0 -T-
JRS021 21 MAY 75PARACHUTE MATERIAL
.80 --
.60 --
.40
.20 - -
H-- 1-- 1-- 1-- 1-- 1-- 1-- 1-- f- H-- 1-- 1-- 1-- 1-- 1-- 1-- 1-- 1-- 1-- 1-- 1-- 1-- 1-- 110 20 UAVENUMBER CM-1

"*I\
^
JRS021 21 MAY 75 WHITE COMPOSITE
POWER TRANSMISSION

JRS021 21 MAY 75 REINFORCED GLUED 2-LAYER SANDWICH
POWER TRANSMISSION
WAVENUnSER CM-1

A
O.S
O.S
w«we. *0 »‘*N£«\C«OAlS *<i

The UV Method of Dish Alignment
Description and Outline of Possible Implementation
In this scheme a trolley runs along a straight inclined track from the vertex of the dish to the edge. The trolley carries a probe which measures the distance from the straight line to the surface of the dish. We call this the UV method to distinguish it from other geometries such as X-Y, r-0 etc (see figure 1). It is intended that this method be used only to align and check the surface with the telescope in the zenith position. However, it should be possible to reinstall it and make further checks after the telescope has been in operation for a while. Measurements of an arbitrary set of points on the surface should be possible and a complete survey of the surface (K 5 points per panel) would be obtained in a few hours, under computer control. A direct read-out of a single point with the probe positioned on it would be used during adjustment of the surface.
The principal advantages of this method of measurement are:
1. The origin of the measuring system and the position and direction of the axis of symmetry are all defined by components located in the strong part of the telescope near the vertex.2. The measuring probe is short ('v* 0.7 m) and nearly normal to the telescope surface. This simplifies construction and eases the tolerances on some of the lengths and angles to be measured.
The main disadvantage would appear to be that the track and the probe do not lie in the horizontal and vertical directions, so that slightly more elaborate arrangements of rollers might be needed to ensure smooth motion.
GeometryWe measure the co-ordinates of a point on the dish surface (u,v) in a frame rotated with respect to the axis of the telescope (z) by an angle 0.
The frames are connected byu = xc + zs s = sinO v = - xs + zc, c = cosG
and converselyx = uc - vs z = us + vc
In general, if we know the desired shape of the surface in the form zg = zg(x), we can measure u and v, convert these to x and z and calculate the normal distance
- 1 -
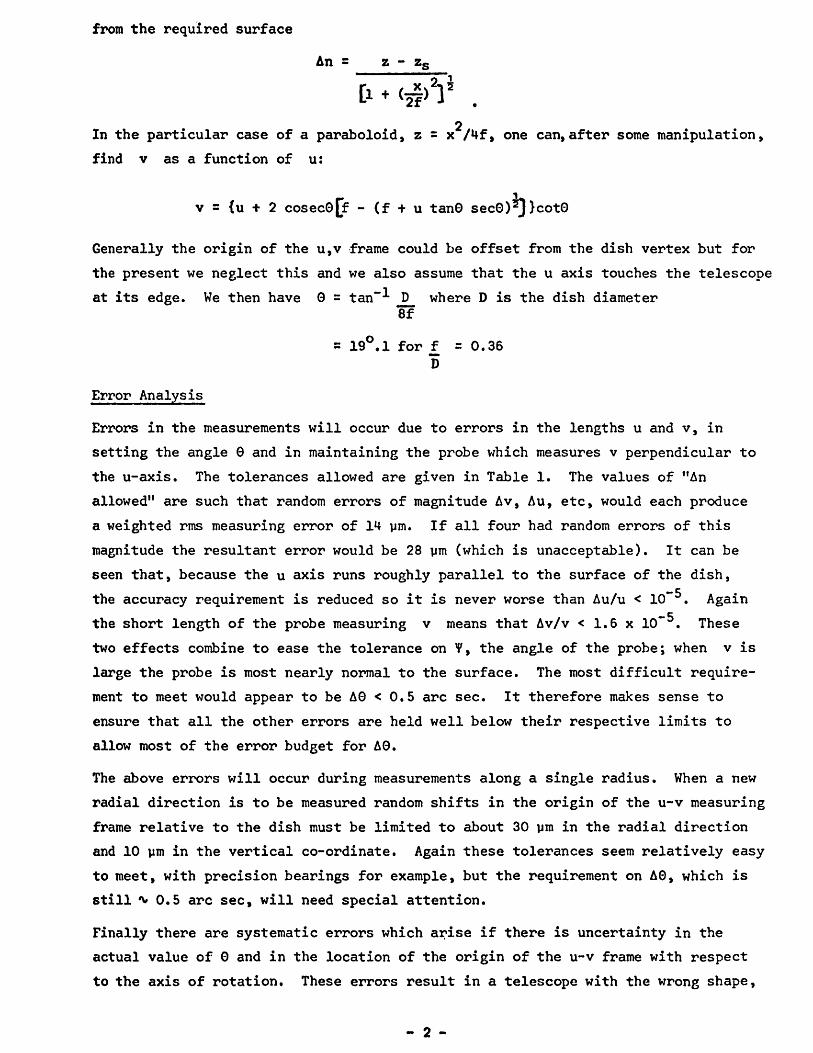
from the required surface
An = z - zs
& * < r i > V .2In the particular case of a paraboloid, z = x /Hf, one can, after some manipulation,
find v as a function of u:
v = {u + 2 cosec©[f - (f + u tan© secGj^JcotQ
Generally the origin of the u,v frame could be offset from the dish vertex but forthe present we neglect this and we also assume that the u axis touches the telescopeat its edge. We then have 0 = tan~^ D where D is the dish diameter
8f
= 19°.1 for f =0.36 D
Error Analysis
Errors in the measurements will occur due to errors in the lengths u and v, in setting the angle 0 and in maintaining the probe which measures v perpendicular to the u-axis. The tolerances allowed are given in Table 1. The values of "An allowed" are such that random errors of magnitude Av, Au, etc, would each produce a weighted rms measuring error of m pm. If all four had random errors of this magnitude the resultant error would be 28 pm (which is unacceptable). It can be seen that, because the u axis runs roughly parallel to the surface of the dish, the accuracy requirement is reduced so it is never worse than Au/u < 10** . Again the short length of the probe measuring v means that Av/v < 1.6 x 10“ . These two effects combine to ease the tolerance on Y, the angle of the probe; when v is large the probe is most nearly normal to the surface. The most difficult requirement to meet would appear to be A0 < 0.5 arc sec. It therefore makes sense to ensure that all the other errors are held well below their respective limits to allow most of the error budget for A0.
The above errors will occur during measurements along a single radius. When a new radial direction is to be measured random shifts in the origin of the u-v measuring frame relative to the dish must be limited to about 30 pm in the radial direction and 10 pm in the vertical co-ordinate. Again these tolerances seem relatively easy to meet, with precision bearings for example, but the requirement on A0, which is still ^0.5 arc sec, will need special attention.
Finally there are systematic errors which arise if there is uncertainty in the actual value of 0 and in the location of the origin of the u-v frame with respect to the axis of rotation. These errors result in a telescope with the wrong shape,
2

but much of the error can be removed by adjusting the focal length. A fitting program will have to be run to check the errors allowed here but they are probably about 2 arc sec for 0 and 50 ym for u.
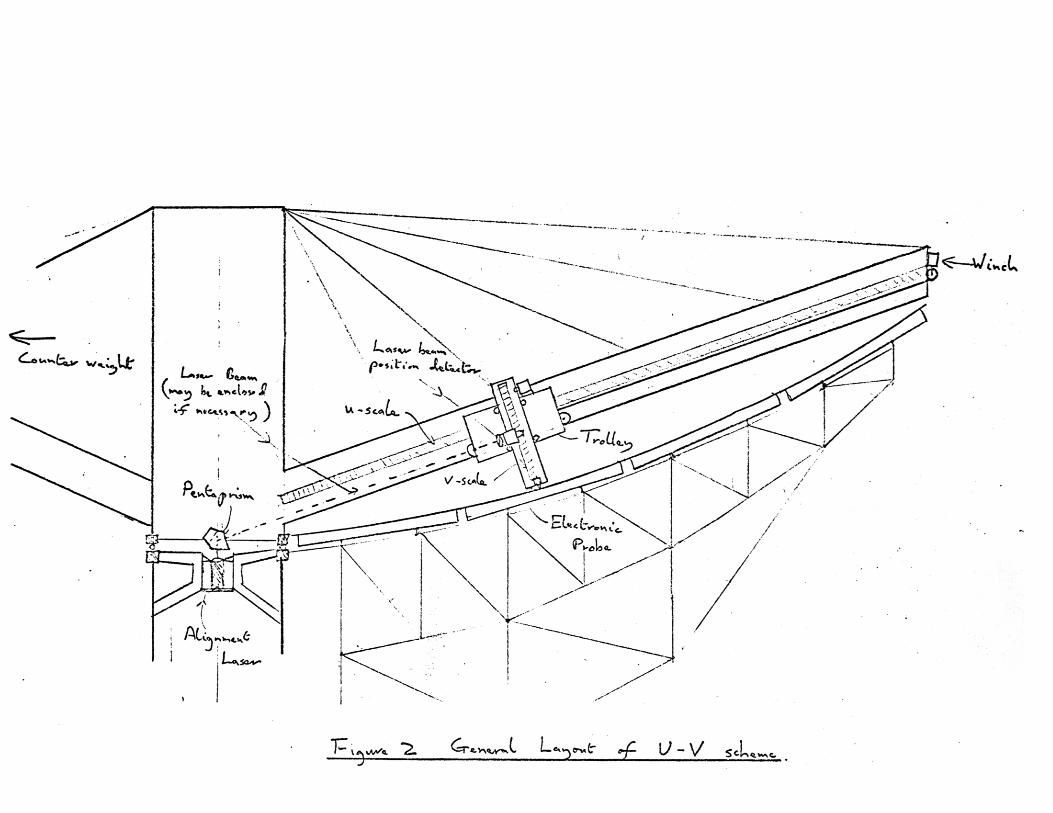
Implementation
The general scheme is shown in figure 2. A rotating sweep arm has replaced the overhead gantry used in earlier proposals. This substitution is based on the need to keep the measuring machine accurately located relative to the hub of the telescope, rather than to any external datum point. (The use of an independently supported gantry would almost certainly make it necessary to provide servo mechanisms to compensate for movements between it and the telescope.) It might perhaps be necessary to provide some support to the outside of the sweep arm when, for example, one wanted to work on the trolley.
It would obviously be desirable to have an instrument which, once calibrated, gave an absolute read-out of position. That is to say, one could turn on the measuring system with the probe in any position and read its co-ordinates. The machine illustrated in figure 2 attempts to meet this aim by employing mechanical means to measure the lengths u and v. It is believed that the accuracies indicated in the5previous section 1 in 10 ) could be achieved. One possibility that can be imagined is the linear equivalent of an optical shaft encoder, with a coded set of lines etched onto the side of a solid bar. These possibilities have not been investigated in detail since alternative solutions described below seem more attractive at present.
The straightness and the direction of the u-axis are defined by a laser beam. According to the manufacturer’s claims it should be good enough to use an alignment laser and pentaprism as illustrated in figure 2. However, in view of the doubts about the directional stability of lasers expressed by NPL, a slightly more complex scheme, illustrated in figure 3, would probably be necessary. In this an optical flat replaces the laser as the primary reference for the direction of the telescope axis. By using detectors on the trolley which measure the positions of both the incident and the reflected beams and averaging their outputs, one obtains a reading which is independent of the alignment of the laser. The difference in the readings of these two detectors gives a measure of the laser mis-alignment and the output of a third detector on the pentaprism reads the error in the height of the light beam. A second pair of detectors on the trolley could be used to check tilting of the trolley.
The pentaprism is mounted on a precision bearing and it is the axis and plane of this bearing which define the position of the axis of the telescope and the origin of the z-co-ordinate; only the direction of the axis is referred to the optical flat.

There are two problems with the use of mechanical devices for measuring the lengths u and v; they are likely to be expensive, and their accuracy is likely to be only just adequate. In particular they will suffer from thermal deformations and will require very careful mounting and handling. We therefore alsoconsider incremental methods of measurement., in particular the HP laser inter-
6ferometer. This has an intrinsic accuracy of better than 1 part in 10 and so can achieve our goal of reducing the errors in u and v to essentially negligible levels. The range of distances to be measured, up to about 30 feet, falls comfortably within the specifications of the instrument (max range 200 ft). However, the laser interferometer is a fringe counting device and can only measure changes in the distances between the optical components (see figure H). It is therefore essential to provide a means of setting the zero points of the axes and to ensure that the beam is not broken by lateral motion of the trolley or tilting of the laser. The allowable tolerances on misalignment are ± 2.5 mm, which corresponds to about 1 arc minute at the end of the track, so the requirements for engineering the measuring machine are not too severe. It might be necessary to provide a separately supported walkway so that adjustments could be made to the machine without deflecting the track too far. With luck this would only be needed during the setting up of the instrument.
To provide an accurate zero point it would be best to drive the probe back onto the optical flat which defines the dish axis. If this is difficult to arrange, a machined ring, rigidly attached to the hub of the telescope, could be used. An initial set of measurements would be needed to find the orientation of this ring with respect to the optical flat, but the zero point would then be available at any radial position of the arm.
If the laser interferometer is used to make the length measurements, then it seems logical to try to use it for defining the u-axis as well. HP does make a straightness measuring device, which works by measuring the differences in two slant paths to a pair of mirrors (see figure 5). The straight line is defined by the bisector of the angle between the two mirrors. The claimed accuracy is very good - below 0.1 arc sec. There are two problems with using the device as it stands. First,HP makes the straightness interferometer in two versions, short range (0.1 to 3 m) and long range (1 m to 30 m). We need an intermediate range device, say 0.3 to 10 m. Secondly, and more fundamentally, there is no obvious way of keeping the pair of mirrors at a fixed angle to the optical flat with an accuracy of better than 0.5 arc sec. Figure 6 illustrates a possible way round this. We replace the pair of mirrors by viewing the optical flat through a pair of prisms whose deviation angles must be accurately matched to those of the Wollaston prism. This combination is in turn seen through the pentaprism, which defines the angle 0. This

pentaprism would need to be specially made since it would need an entrance aperture about 4 inches by J inch. It would probably be best made from two mirrors rather than out of solid glass. In all these optical components it will be necessary to pay attention to their polarising properties since the separation of the two orthogonal polarisations is vital to the performance of the HP instrument.Finally we must consider how the probe is to contact the surface of the dish. Ideally one would reflect the light directly off the surface panels, but this is ruled out by surface roughness and the gaps between the panels. Experiments with a strip of aluminised mylar, which can be held down to the surface by electro-static attraction, showed that this did provide a sufficiently smooth surface to give a usable fringe in the interferometer, but the laying down and taking up of these strips would be rather awkward. An attractive possibility is to roll a steel sphere over the surface and to focus the laser beam on the back of the sphere (figure 7a). Slightly less attractive is a probe with a small retro-reflector attached (figure 7b). The probe tip would have to slide over the surface in this case. If neither of these works then the use of an electronic probe and normal corner reflector (figure 7c) seems practical, although slightly more complex.
R E Hills 9 March 1976
AddendumI am indebted to Dr D M A Wilson for pointing out that, although one cannot expect a single bearing to keep the rotating and fixed parts parallel to better than a second of arc, one might, be able to achieve this with a rigid shaft and two well separated bearings (figure 8). The line through the centres of the bearings then defines both the position and direction of the telescope axis. It should then be possible to mount the HP "straight-edge” on this shaft so that the pentaprism, prisms and optical flat of figure 6 are no longer needed. One is left with the problem of not having a version of the interferometer device to cover the range of distances needed.In order to achieve an accuracy of 0.3 arc seconds one would need bearings accurate to 1 micro-metre on a shaft 1 metre long. This is a stiff requirement and experiments will be needed to see if it can be achieved.
- 5 -

Table 1
x(m) v(m) 0-0no An allowed (ym) Av(ym) Au(ym) A0" AH'"
0.5 .153 16.4 10 10 35 4.1 471 .284 13.8 10 10 42 2.1 31
1.5 .393 11.2 10 10 51 1.3 272 .481 8.6 10 10 67 1.0 292.5 .546 6 .1 11 11 104 0.9 393 .590 3.6 11 11 175 0.75 61
.612 1.2 11 11 525 0.57 1775 .546 5.7 13 13 130 0.53 496 .393 10.0 15 15 81 0.51 437 .153 13.8 18 19 75 0.52 101
7.5 0 15.6 22 23 81 0.59 —
Notes
The quantities Av, Au, A0 and AY are the errors in v, n, 0 and Ywhich would each produce the measuring error "An allowed11 normal tothe surface. Y is the angle between the probe which measures vand the u-axis; it should be a right-angle. Expressions are
2 -1 -1 v = - xs + x c/Uf 0 = tan A__ 0 = tan x_8f n 2f
Av = An sec(0-0n) Au = An cosec(0-0n)A0 = An/(2f + z)sin0n AY = An cosec(0-0n)/v

T«.fli»wcbv>- *^>*v «f<rv*<, yvvuyicc^vU^ Wvs^^<*-«Aa
)“- T~C-V>«v< nC 1— v- crv>(r g-^ U -V Scj^^wvc.

Optical F L t1 7 0 1 ^ L c ^ U r « %(p) +0^ 0 3 \O k ) - Tr#lL*p sl*h(r “ i- D\ + 01-03 - o^)
L^ia^ fA 2 i- gj -fi'x -v 03 —
I*3> l/sa- <T Ojpl'm cxl 'PLt" fc & Q,-y.g T^lctcya. A.>-y'v
H -o-V.14 C o /IM /-
ontai,
LLf t
o.Xv4tCilV4l
”3Z> tc»''o VL-st. »«*
-t;. « 5v~ i. c
tVoWA J.0
^-eyM
OS
wO*-*

fU* M<W«
^ \ \ y . r1X . t
W oU m I'oW P,i' hv-. a i {tvkVvlS t£*. tv/. >ol.o,Y*S«.t‘tr»si
M P S t W ^ f c VnV ^ _ )A» t»v ■v»rW ^ q^/U !
-fU .tr
*U t'fa.
P,l;<U0 -.il
P I£lJu* vtf *»i
jJ
C<xv*\vC'xITc-V' ~£cAt» ni JL44/
F y CdirVsa*'(irlt
d t t tv - o ^ tclf>i'-ol»a
F u w . 7 0 ^--;^ </ V- -1'
^PCs.tAVg- ( 7 lAoctt-^c^io*, b- Rel^bi- 0 J t*xi« (Tc gp vICa(-

f
lyva. g u So-

A note on selection of support points for surface panels and on their deflection under the weight of a measuring trolley
On most telescopes the surface panels are approximately rectangular and are supported at their four corners. This has obvious advantages from the point of view of economy in the supporting structure and it also minimises any tendencey for the panels to twist when buffeted by wind. For a protected high precision dish, however, the deformations of the panels under their own weight become more important and the question arises as to whether other points of support should be used. We here use a very simple approximation to estimate the advantage that might be gained. The same simple model is also used to calculate the effect of panel deformations on the method of measuring the shape of the surface described by Findlay and Payne (Rev.Sci.Instruments, 4_7, 50, 1976 January) which uses a trolley driven over the surface.
Unless the panels are almost square most of the sag will occur along their length rather than across their width, so that we can represent them as a simple beam supported at two points. We chose these to be equidistant from the centre. If the panel is fairly thin (say thickness < 1/10 length) we can concentrate on the effect of bending and neglect that of shear. One then proceeds in the usual way by taking moments about a point at a distance x from the centre of the beam.
<-------— i------------ -
2 2 ~X > f
where I is the length of the beam, w the weight per unit length and a is the separation of the supports. By relating the moment to the local curvature:
A2d y m— j = eT * *n E *s Young's modulus and I the second moment ofdx
area of the cross section, and the integrating twice one obtains the deflected shape ^
At \y 384 El *
where the dimensionless geometric factor d has the formd = ~ a ) 3 t 6(1 - 2 | ) ( ^ | ) 2 X > |
= (^)“ + 6(1 - -2f) (2 | ) 2 x * |
Note that the deflection scales as the fourth power of the length, which is why

there is a fairly sharp upper limit to the possible size of panels. Generally it will also be inversely proportional to the square of the thickness, and with our assumptions independent of the width. The form of d is shown in the figure for various positions of the support.
At the end of the beam the value of the deflection relative to the centre is
de = d(x = |) = 3 - 12(f) 2 + **(f03
for support at the end (a = A), d = - 5, at the centre (a = o), d =3, and fore esupport at the mid-points (a = A/2), dfi = g.
The minimum value of the downward deflection is obtained when the deflection at the end equals that in the centre dg = o. This is found by trial and error to occur when a = 0.554JU The highest point is then at 2x = 0.57JI and has the value d = - 0.105.Thus one could in principle obtain a peak deflection which is nearly 50 times smaller than that of a panel of the same length supported at the ends. Alternatively one could make the panels twice as long and still have about 3 times less peak deflection. In practice of course the simplifying assumptions we have made do not justify these claims. However, it is probably reasonable to suppose that a factor 10 reduction in deflection could be obtained by supporting the panels at2 points about midway from the centre to the edge. Thus we could probably go from 4 rings of panels 1.8 metres long, requiring 5 rings of support points, to3 rings of panels 2.4 metres long requiring 6 supporting rings.
A numerical calculation of the rms deviations of the shapes has been made and this shows that a similar gain in the rms deviation is also found. Except for values of a/ I close to 0.55 the rms deviation is about 0.3 times the peak.A final point on this topic is that if the telescope is to behave homologously then ideally the surface panels should deflect in the same sense as the telescope. The telescope is supported in the centre, so that its focal length tends to increase when it points at the zenith. Panels supported at their ends are the worst choice in this respect, since they deflect in the sense which reduces their focal length. By fitting a parabola to the form of d(x) it was found that in principle it should be possible to gain about an order of magnitude by choosing the deflections of the panel to match those of the dish. This analysis would suggest supporting the weight, of the panel at a point as near as possible to its centre of gravity and having only fine adjusting screws at its edge.
- 2 -

Deflection due to a measuring trolley
For the rest of this note we assume that the above speculations come to nothing and consider only panels supported at their ends. In this case the largest deflection occurs when the trolley is in the middle of the panel and it amountst0 3W_* 8 W-,yT = - T = __I yn48 EI 5 W pPwhere W,j, is the weight of the trolley, W^ that of the panel and y^ is the deflection of the panel under its own.weight. By itself this would not be serious provided the weight of the trolley was small compared to that of the panel. However, with the Findlay-Payne type of trolley, which measures the local curvature of the surface and integrates twice to obtain the shape, these deflections produce a cumulative systematic error. This is a result of the additional curvature caused by the sag of the panels which is always in the same sense.
If the trolley is short compared to the panel the additional curvature is justd2y W„, . ._ T x(Jl - x). 2 ’ YI Idx
When the trolley moves from one end to the other and the shape is calculated the error will be
y|*a = = * yT* * 12 El 1
Furthermore the angle of slope is then in error by
d£| _ WT*2dx' x = I ” —6 El
This leads to a further error so that after the trolley has traversed a second panel the position error is
y>x = 21 = 16 yT
These errors continue to build up as the square of the number of panels, „ 2 „ 3 2 n 2 W_
y|x = n* = “n *T * - j - g - I ypP
On a large dish it will therefore be necessary to keep the trolley very light. It should be noticed, however, that the error is a parabolic one so that, to the extent that all the panels are the same and the deformations are as calculated, the result is only a change in focal length. It would also be possible to account for these deformations by running the measurements twice with weights added to the trolley for the second run. The difference in the runs would provide the correction to

be made for deformations. One would still have to be careful that the load on each of the wheels was increased in the same proportion because there may be local deformations in the surface, particularly with honeycomb panels. It is hard to see how this controlled increase in loading could be easily achieved if the centre
R E Hills D B Shenton7 April 1976

Ov **> L e (_«. j-vCT ,« [<(Jl-
Li <M\il C-.o ___ ».1
Ui) Lo~*l~ 'V^ * v %/i