mpumalanga department of education departmental strategic … budget/2003/strategic... · education...
TRANSCRIPT

MPUMALANGA DEPARTMENT OF EDUCATION
DEPARTMENTAL STRATEGIC PLAN
2003/2004 – 2005/2006

EDUCATION STRATEGIC PLANNING 1
CONTENTS
PART A: VISION, MISSION AND OVERALL STRATEGIES ……...2 1. Statement of policy and commitment by the MEC…………………………………………………2 2. Overview by the accounting officer………………………………………………………………...3 3. Mission…………………………………………………………………………………………….4 4. Vision, strategic priorities and strategic objectives…………………………………………………5 5. Legislative and other mandates…………………………………………………………………….7 6. Description of a status quo…………………………………………………………………………9 7. Description of strategic planning process…………………………………………………………10 PART B: THREE YEAR STRATEGIC PLAN 8. Measurable objectives, activities, performance measures and performance targets by programme and
sub-programme…………………………………………………………………………………...12 PART C: BACKGROUND INFORMATION TABLE 1: Enrolment and population statistics…………………………………………………...55 TABLE 2: Number of institutions………………………………………………………………..56 TABLE 3: Resourcing effected via the post provisioning norms…………………………………56 TABLE 4: Number of employees………………………………………………………………..56 TABLE 5: Absolute spread across economic categories…………………………………………57 TABLE 6: Proportional spread across economic categories……………………………………...57 TABLE 7: Resourcing effected via the post provisioning norms…………………………………57 TABLE 8: Employment and vacancies by programme…………………………………………..58 TABLE 9: Resourcing effected via the school funding norms……………………………………72 TABLE 10: Age specific enrolment rates for schools……………………………………………..73 TABLE 11: Classrooms available for programme 2………………………………………………73 TABLE 12: Learner – educator ratios in programme 2 schools…………………………………...74 TABLE 13: Breakdown of non-personnel recurrent in programme 2 …………………………….74 TABLE 14: Programme 2 enrolment and flow rate details………………………………………..75 TABLE 15: Educator attendance - indicators for programme 2…………………………………..75 TABLE 16: Learner attendance – indicators for programme 2……………………………………75 FIGURE 1: Medium term revenues and expenditures………………………………….76 FIGURE 2: Summarised version of the organogram…………………………………....86
FIGURE 3: Analysis of the 2002 matric results…………………………………….87

EDUCATION STRATEGIC PLANNING 2
PART A: VISION, MISSION AND OVERALL STRATEGIES 1. STATEMENT OF POLICY AND COMMITMENT BY THE MEC
The challenge facing the education portfolio is to provide a life long quality
education that will encourage and mobilize the citizens of this country to be
catalysts and agents of change towards the realization of a peaceful,
prosperous and democratic society. This portfolio also seeks to deliver an
education system that is reconstructed, transformed and geared towards
contributing productively to the South African economy by offering the
relevant skills and knowledge.
The co-operation and commitment of our clients and all stakeholders in
this co-venture is highly valued and should be maximized. Their
continuous involvement in policy formulation and the delivery of quality
educational service serves as a source of hope and inspiration. I once
more wish to express my appreciation to all the parents, educators,
learners, the business community, non-governmental organisations,
community-based organisations, religious formations and all those who
selflessly invest in education by continuously working in partnership
with us citizens of this country.
This partnership will assist all involved to make the TIRISANO vision
realistic and achievable. It is my hope and belief that this action plan
will lead to a paradigm shift in the way schools conduct their business
and further create opportunities for them to work in an orderly, proper
and professional manner. May I once more call on all teachers to
teach, learners to learn, governing bodies to govern and officials to
deliver quality educational services. Our actions will indeed bring about
a better life to all.
CNM Padayachee MPL, MEC for Education

EDUCATION STRATEGIC PLANNING 3
2. OVERVIEW BY THE DEPUTY DIRECTOR-GENERAL
The Mpumalanga Department of Education seeks to develop the citizens
of this Province by providing quality learning, teaching and service at all
educational institutions within its jurisdiction. It is our belief that this will
lead to a well skilled, knowledgeable and progressive citizenry.
A number of educational policies have been introduced so as to open
the doors of learning to all and to address the educational backlogs. It
is now the right time for the Department to monitor and support the
implementation of these policies. In this way educators, learners,
parents and all stakeholders will be motivated to participate and
provide the required support.
Besides embarking on policy implementation and actionable
educational programmes, the Department has openly declared its
resolve to be responsive to its clients and to uphold the principles of
Batho Pele which echo our core business of providing quality education
through developing an education system that will capacitate, develop
and empower humanity in all respects. The recipe for achieving a
better life for all is by investing in the education of our present and
future generations. As a Government Department we once more
commit ourselves to be true servants of the citizens of this country by
carrying out mandates and policies of government and by providing the
necessary advice and support to the Member of the Executive Council
(MEC) for Education in this Province.
I therefore wish to recommit myself, my colleagues and the entire
Department to this Strategic Plan which will culminate in the delivery of
a highly professional, efficient, effective service and the provisioning of
a lifelong quality education for all.

EDUCATION STRATEGIC PLANNING 4
Dr. MT Mashinini Deputy Director General for Education
3. MISSION
The Mpumalanga Department; working in partnership with all stakeholders; is committed to render learner-centered quality education through capacity building and maximum utilization of existing resources.
4. VISION, STRATEGIC PRIORITIES AND OBJECTIVES
4.1 Vision • Providing quality education • Restore the culture of learning • Has effective Personnel • Utilize resources properly • Less Bureaucracy • People driven • Responsive to the needs of the communities • Learner-centered • Right-sized, effective and efficient • Communicate effectively • Relevant curriculum • Develops human resources
4.2 Strategic priorities
(a) Strategic objectives
• To render an effective and efficient administration service to the Mpumalanga Education Department;
• To initiate, develop and co-ordinate all educational projects;
• To research, facilitate and promote a systematic strategic and developmental approach to the reconstruction of education;
• To render legal service to the Department;
• To communicate effectively with all stakeholders;
• To develop human resources to maximum;
• To provide effective and efficient human resource management services;
• To render departmental provision management services;
• To render an effective and efficient financial management
system;

EDUCATION STRATEGIC PLANNING 5
• To provide an effective internal audit service for the
Department;
• To provide and render an effective and efficient management service w.r.t. FET, GET and Quality Assurance;
• To support independent schools in accordance with the South African Schools Act;
• To provide education to learners with special needs;
(b Tirisano objectives
• To make our provincial systems work by making co-operative government work;
• To break the back of illiteracy among adults and youths by
2005;
• To make schools centres of community life;
• To end conditions of physical degradation in South African schools;
• To develop the professional quality of our teaching force;
• To ensure the success of active learning through outcomes-based education;
• To create a vibrant further education and training system to equip youth and adults to meet the social and economic needs of the 21st century;
• To deal urgently and purposefully with the HIV/AIDS emergency in and through the education and training system.
(c) Outlook for the coming financial year
Strategic objectives and service delivery indicators 2003-2004.
OBJECTIVE 1
• To deal urgently and purposefully with HIV/AIDS emergency in and through the education and training system;
• Raise awareness and the level of knowledge of HIV/AIDS among

EDUCATION STRATEGIC PLANNING 6
educators and learners at all levels and institutions within the Mpumalanga education and training system, including departmental employees;
• Ensure that life skills and HIV/AIDS education are integrated into curriculum at all levels of the education and training system.
OBJECTIVE 2
• To develop the professional quality of our teaching force and ensure success of active learning through outcomes-based education;
• Develop a school system that functions efficiently and effectively to realize the educational and social goals of the country and the province in particular;
• Implement proper management;
• Ensure that all schools have governing bodies and all secondary and combined schools have Representative Council for Learners in accordance with SASA;
• Ensure improved learner performance and attainment;
• Provide ongoing support for the implementation of Curriculum 2005.
OBJECTIVE 3
• To break the back of illiteracy amongst adults and youth in five years;
• Reduce literacy through the mobilization of societal support for a literacy campaign;
• Develop an improved Adult Basic Education and Training system.
OBJECTIVE 4
• To create a vibrant further education and training system to equip

EDUCATION STRATEGIC PLANNING 7
youth and adults to meet social and economic needs of the 21st century;
• Ensure that appropriate management and governance structures are in place and are effectively functioning in every FET institution;
• Establish training and development programmes for members of governing bodies, management and other constituencies of FET institutions;
• Promote inter-provincial relations in regard to training of educators in languages dominant in the Province.
OBJECTIVE 5
• To ensure that our provincial educational system, work by making co-operative governance work;
• Develop a service delivery improvement program;
• Restructure functions of the department according to policy directives;
• Develop planning tools to support the policy, budget and tendering processes;
• Ensure that integrated and functional administrative and management systems are in place;
• Support the policy, planning, budget and implementation processes.
5. LEGISLATIVE AND OTHER MANDATES 5.1 The Department derives its Core mandate from the Constitution. The
Department is currently guided by over nine (9) pieces of legislation.
Section 27 of the Constitution of the RSA states:
5.1.1 Everyone has the right:-

EDUCATION STRATEGIC PLANNING 8
• to a basic education, including adult basic education; and • to further education, which the state, through reasonable measures, must make progressively available and accessible.
5.1.2 Everyone has the right:-
• to receive education in the official language or languages of their choice
in public educational institutions where that education is reasonably practicable. In order to ensure the effective access to, and implementation of this right, the state must consider all reasonable educational alternatives including single medium institutions, taking into account:
a) equity; b) practicability; and c) the need to redress the results of past racially discriminatory
laws and practices. 5.1.3 Everyone has the right:-
• to establish and maintain, at their own expense, independent educational
institutions that do not discriminate on the basis of race; are registered with the state; and maintain standards that are not inferior to standards at comparable public educational institutions.
5.2 The following list of Acts further elaborate the legislative mandate of the
Department.
• National Education Policy Act (No. 27 of 1996): It provides for the determination of National Policy for education, determine policy on salaries and principles that govern education.
• South African Schools Act (No. 84 of 1996):
To provide for a uniform system, for the organisation governance and funding of schools, to amend and repeal certain laws to schools, and to provide for matters connected therewith.
• Mpumalanga School Education Act, 1995: It provides for development of regulations and policies within the
province and it is in line with the South African Schools Act No. 84 of 1996.
• South African Qualifications Authority Act No. 58 of 1995:

EDUCATION STRATEGIC PLANNING 9
It provides for development and implementation of a National Qualification
Framework and for this purpose to establish the South African Qualifications Authority, and to provide for matters connected
therewith. • The General and Further Education and Training Quality Assurance Act (No. 58 pf 2001): To provide for the establishment, composition and functioning of the General and Further Education and Training Quality Assurance Council; to provide for Quality Assurance in General and Further Education and Training.
• Further Education and Training Act (No. 98 of 1998): To regulate Further Education and Training and provide for the establishment, governance and funding of Public Further Education and Training institutions.
• Public Service Act of 1994: The Public Service Regulations of 2001 set up a regulatory
framework underpinning the operations of the department in the discharge of its mandate.
• Public Finance Management Act:
To regulate financial management in the national government and provincial governments; to ensure that all revenue, expenditure, assets and liabilities of those governments are managed effectively and efficiently.
• Employment of Educators Act (No. 76 of 1998): To provide for the employment of educators by the state and for the regulation of the conditions of service, discipline, retirement and discharge of educators.
• Employment Equity Act (No. 55 of 1998): It provides for the redress on the discriminatory laws and practices, disparities in employment occupation and income within the
National Labour Market.
• Skills Development Act (No. 97 of 1998):\
It provides an institutional framework to devise and implement national; sector and workplace strategies; to develop and improve the skills of the South African workforce; to integrate those strategies within the National Qualifications Framework

EDUCATION STRATEGIC PLANNING 10
contemplated in the South African Qualifications Authority Act 1995; to provide for learnerships that lead to recognised occupational qualifications; to provide for the financing of skills development by means of a levy grant scheme and a National Skills Fund; to provide for and regulate employment services; and to provide for matters connected therewith.
• Adults Basic Education Act (Act 52 of 2000:
To regulate adult basic education and training; to provide for the establishment, governance and funding of public adult learning centers.
5.3 Core Business
To provide an education of progressively high quality for all learners and so doing lay a strong foundation for the development of all our people talents and capabilities and advance the democratic transformation of society.
6. STATUS QUO WITHIN THE DEPARTMENT
Since the introduction of the Public Finance Management Act (1 of 1999) and the Public Service Regulations within the Government, the Department has managed to implement policies and regulations that promote accountability within its systems.
The introduction of the BAS, LOGIS and PERSAL systems within the financial management systems have improved the performance of the Department with respect to processing of payments and asset management within the Department. Efficiency and effectiveness in controlling banking arrangements, reconciliation of accounts as a result of this system. A comprehensive fraud prevention plan has been formulated and a risk assessment strategy has been developed. The estimated budget for 2002/2003 is R3,7 billion. 91% is for personnel expenditure, whilst 9% is for non-personnel expenditure. The major challenge is to strive to reduce the personnel expenditure to 85%.
With regard to the Outcome Based Education (OBE) the Department has already conducted intensive training programmes for the implementation of CTA in Grades 7,8 and 9 respectively.
The Department is faced with a challenge of increasing the adult learner population to deal with the scourge of illiteracy; and to this effect, the Department in collaboration with UNISA – South African National Literacy Initiative. Talking into cognisance of the 1996 census figure (STATS-SA), 1,5% of the Mpumalanga population of 2,8 million indicates high level of illiteracy. A sustainable budget and the implementation plan for the ABET programmes need to be developed. An investigation structure is to be set up to deal with these issues. That also touches learner drop-out.

EDUCATION STRATEGIC PLANNING 11
The expansion of ECD sites within the public ordinary schools remain one of the major challenges. ECD practitioners have been trained to meet such challenges.
An amount of R148 325 96.38 has been spent to purchase textbook for Grade 12and the other grades, while for the schools’ stationery an amount of R577 060 56.82 was spent. There are 1 065 026 learners in our public primary and secondary schools, and the section 21 status has been granted.
The Department will built 635 classrooms, 37 admin. Blocks, 15 special rooms, and these infrastructural projects will eventual cost an estimated amount of R86, 848.
The new amendments in the Admissions for Ordinary Public Schools (General Notice 2432 of 1998) is also posing a challenge, because it entails that learners turning to six years of age by June of each and every year should be admitted to Public Ordinary Primary Schools. These changes impact on the provisioning of both human and physical resources within the learning institutions.
The process of relocating the Departmental Head Office from Middelburg to Nelspruit is complete. While the Department was relocating, it also was undergoing the process of restructuring of the Department. This process meant that the existing district offices had to be clustered into three regions viz Enkangala, Eastvaal and Ehlanzeni, which is with accordance to the Provincial boundaries.
The Mpumalanga Department of Education has embarked on the process of maintaining high standard performance, hence we have developed intensive programmes with regard to Skills Development, Human Resource, Infrastructure Development, Risk Management and Intensive Management Programme for schools, which is with accordance to our theme: “Towards Learner Excellence and School Effectiveness.”
7. DESCRIPTION OF STRATEGIC PLANNING PROCESS
The strategic planning process started in November 2001 at Greenway Woods in white River then continued in June 2002 at the Protea Hotel in Hazyview. The result was 3-year strategic plan for the MTEF process. The Senior Management aligned this plan in September 2002. This plan was consulted with in the 3 Regional Directors of the province. The Portfolio Committee was presented with a this document. The Plan was also discussed at Cabinet Budget Lekgotla, October 2002. Meetings with both Provincial and National Treasury were held, and the document was fully discussed with them.
The Strategic Planning Process of the Mpumalanga Department of Education for the 5-year MTEF process (2002/3 – 2005/6) took place

EDUCATION STRATEGIC PLANNING 12
after the Matric Results Task Team had investigated the poor performance on the 2001 Grade 12 results. It was appointed during January 2002. Mr. CNM Padayachee appointed a task team that included members from various education stakeholders and educationists to determine what the key factors are that led towards the poor Grade 12 results in 2001. Other key factors were identified as follows:
Lack of textbooks Overcrowding as a result of shortage of classrooms Poor discipline among learners eg. Late coming, truancy
absenteeism, etc. Weak control throughout all levels of management. Low level of parent involvement. Lack of career guidance, inadequate information on subject choice,
grouping of subjects and subject grades.
When the strategic planning process was conducted the funding and recommendations by the Matric Results Task Team were considered. The vision and mission of the Department as it was agreed upon in the Malaga-Summit was re-evaluated in the planning process of the strategic plan. A thorough SWOT analyses was done that further confirmed that the Department still experiences shortcomings within its systems and procedures, co-ordination of activities, implementation and monitoring mechanisms.

EDUCATION STRATEGIC PLANNING 13
THREE YEAR STRATEGIC PLAN
TABLE A.1: PROGRAMMES, MEASURABLE OBJECTIVES, ACTIVITIES AND PERFORMANCE MEASURES Provincial Vote 7: Education (R4 522 763 000) Aim of vote: To provide education in the province to people whose education is the responsibility of the department
Measurable Objectives Activities Performance Measures A: To ensure that the population of compulsory school-going age in the province attends schools.
Introducing Radio Programmes where we inform parents about the right to learn Expansion of the community based ECD Programme Introduction of scholar transport in rural areas
Percentage of the population aged 5 to 14 attending schools is 97.1%.
B: To make FET progressively available to youth and adults above compulsory school-going age.
Expanding and introducing satellite campuses in communities which are far from FET Centres Expansion of the ABET Centres Funding the Mpumalanga Regional Training Trust to develop skills amongst unemployed youth Prioritise other secondary schools to offer FET related Programmes
Percentage of the population aged 15 to 17 attending schools and other educational institutions is 68.4%.
C: To build a society that is well educated. Expanding the ABET Centres Introducing Skills training for adult learners Introduction of ICT in Schools
Average highest GET or FET level attained by 2,8 adults in the population is 1,4% (1996 census) Adult literacy rate 0,003% (1996 census) (growth rate
Programme 1: Administration (R354 971 000) Programme objective: To render an effective and efficient administration service to the Mpumalanga Education Department
Measurable Objectives Activities Performance Measures To bring about effective management at all levels of the system.
• Percentage of schools with Section 21 status • Percentage of recurrent non-personnel funding being
channelled through the School Funding Norms
100%
To realise an optimal distribution of financial, physical and human resources across the system.
Average real per learner allocation for recurrent non-personnel items using funding supplied via the School Funding Norms
R631 per learner
To ensure that the flow of learners through the system is optimal.
Performance in Senior Certificate and FET levels.

EDUCATION STRATEGIC PLANNING 14
Sub- Programme 1.1 Office of the MEC (R2 294 000) Sub-Programme objective: To provide for the functioning of the office of the MEC for education
Measurable Objectives Activities Performance Measures To provide overall Management of the Education system in accordance with the National Education Policy Act, the South African Schools Act, the Public Finance Management Act, Employment of Educators Act, the Public Service Act, FET Act Regulation and Policies
MEC to provide political vision direction and leadership. HOD to provide administration leadership and Senior Managers to provide operational management Councils established: MPETC Examination Board ABET ECD
MEC budget speech and policies. Annual Report of the Department. Operational effectiveness and efficiency of the Councils.
To ensure that the population of compulsory school going age in the Province attends schools
Advocacy Campaign through Circulars and the media. 96% of the population aged 6 to 14 attending schools
To build a society that is well educated in the Province in the different fields of education.
Implement stringent measures for school going age learners to attend school and assists adults.
Average highest GET or FET level attained by adults in the population.
To ensure accountability Monitoring, research and evaluation of programmes and projects
The extend to which principles of accountability are prioritised and reports are submitted in a timely manner
To ensure the MDoE is kept abreast with international developments
Liaison and consultation The extend to which partnerships are established with international stakeholders. 89% of donor funded projects are implemented on schedule.
Sub-Programme 1.2 To provide management services that are not education specific for the education system (R146 862 000)
Measurable Objectives Activities Performance Measures
To ensure through tenders and procurement that economic development and job creation projects / initiatives are enhanced.
Preparation of advertisements in terms of set criteria Evaluation of tenders
The extent to which the number of job creation projects are increased
To improve access to Information, Communication and Technology (ICT)
ICT Service plan developed Implementation of ICT Service Plan IT Posts in Regions created and filled
The extent to which all regions/directorates/schools are linked electronically to all relevant systems and/or programs, e.g. LOGIS, BASS, PERSAL, EMIS, etc.

EDUCATION STRATEGIC PLANNING 15
To reduce losses due to poor asset and inventory management
Updating of internal control procedures Updating of asset register Disposal of assets Stock taking Monitoring and evaluation of internal control procedures
The extent to which asset registers are accurate, complete and updated The extent to which losses are reduced.
To improve communication with stakeholders Implementation of communication strategy Liaise with communities, unions and School Governing Bodies
The Regional office hold meetings with the relevant stakeholders
Measurable Objectives Activities Performance Measures
Performance audits to check on effectiveness of units to meet their objectives
Monitor all programs and projects 50% audits done of performance
To provide an effective Internal Audit Service for the Department
• Monitoring adherence to internal control procedures
• Conduct Risk Assessment • Fraud investigations • Internal Audit: An Audit Unit was established • Improve the integrity of the PERSAL System • Monitor and audit asset registers in line with
GRAP
The extent to which the average number of fraud cases in the department are reduced The Risk Assessment process has been finalised through a tender process and will be functional from January 2004 The unit is fully established, and plans to reach the Head Office and the five (3) Regions through workshops Risk Management Plan and Policy has been established To the extend the Fraud Prevention Plan and Policy is implemented Internal Audit function will be established once the Risk Assessment has been completed Cost centres visited once per year to verify payrolls 100% of Regional asset registers audited
Provide effective and efficient Human Resource Management Services
Effective Planning and Provisioning of HR resources To appropriately absorb non-educator staff appointed to abolish posts on the pre-revised structure of institutions, to posts approved in terms of the funded post provisioning norms.
To implement a process for the permanent filling of approved teacher posts (post level 1), temporarily filled by teachers employed on closed annual contract in accordance with applicable Regulations
Implement Provincial ELRC Resolution No. 1 of 2001 as amended, which provides for a process whereby all professionally qualified temporary contract teachers who have completed 2 years of service, will be permanently appointed in substantive vacant teacher posts.

EDUCATION STRATEGIC PLANNING 16
To deal with the transfer of displaced educators on post level 2 and higher in institutions, in terms of operational requirements.
Identify excess educators in promotional posts in institutions. Attempt to place displaced educators on post level 2 and higher, in suitable vacant posts in institutions or offices
Measurable Objectives Activities Performance Measures
To fill approved vacant promotional educator posts in schools
Issue Vacancy List containing all approved vacant promotional educator posts in schools. Obtain recommendations from School Governing Bodies in regard of the filling of the advertised promotional educator posts in schools. Approve and implement appointments of educators to advertised promotional posts.
To ensure adequately trained PERSAL users and Managers both in the Head Office and Regional Offices
Do a complete audit of PERSAL training and skills already obtained as compared to PERSAL training and skills required. Arrange for required PERSAL courses with the Provincial Help Desk after identification of training needs.
To encourage the creation and maintenance of an enabling PERSAL environment both in the Head Office and Regional Offices
Consult and advise relevant responsibility managers on the need to plan, budget and annually provide/replace key PERSAL equipment
To standardize and maintain good practice in regard of PERSAL
Develop and agree PERSAL Job Performance Agreements Initiate and monitor the capturing of misconduct cases on PERSAL Initiate and monitor the capturing of bursary information on PERSAL
Sub-programme 1.3 – Education Management: To provide education management services for the education system (R203 815 000)
Measurable Objectives Activities Performance Measures
To improve access to quality education and training in urban and rural areas through infra-structure development
Guidelines developed for Education Resource Centres and Teachers’ Centres
The extend to which the Guidelines are implemented

EDUCATION STRATEGIC PLANNING 17
Assist with ECD criteria
All ABET Centres, ECD sites and Home based sites are correctly registered according to set criteria and monitored according to set criteria and monitored where relevant
Measurable Objectives Activities Performance Measures
• Foundation Phase – national programmes shared with schools
• Intermediate Phase – learning programmes developed and implemented
• Participate in National Learning Areas committee to develop policy and guidelines related to curriculum delivery in the GET and FET
• Participate in the development of assessment adjustments for ELSEN learners in all learning areas
Learning programmes developed including HIV/AIDS, environment and values in education with inputs from all relevant projects Collaborative development of national and provincial curriculum policies Assessment and all other relevant aspects of the curriculum adjusted where necessary for ELSEN learners
• Assist with training • Senior phase programmes developed in line with CTAs • FET exemplars developed for transition • Guidelines for LPs distributed and training supported
The extent to which assessment and all other relevant aspects of the curriculum are adjusted where necessary for ELSEN learners 100%
• OBE INFO Sessions • Provincial Guidelines and Circulars for Foundation
Phase, Intermediate Phase, Senior Phase and FET on: Assessment progression, CTAs, methodologies, reporting, recording and general classroom practice.
• Participate in the development of assessment policy in GET
Guidelines developed for C2005 implementation 100%
• CTAs adapted • Inclusion guidelines workshop at all schools • Assessment guidelines and circulars, as well as
methodologies and classroom practice for all phases and FET band
Assessment and all other relevant aspects of he curriculum adjusted where necessary for ELSEN learners 100%
Provincialisation of all relevant national curriculum policies (e.g. how to deal with Intermediate Phase, general progression etc.)
Collaborative development of national and provincial curriculum policies
Learner Profiles to be developed and distributed Cumulative record cards (profiles) designed and produced for all learners in the system

EDUCATION STRATEGIC PLANNING 18
Promote the development and implementation of policy, programmes and systems for learners with special educational needs, inclusive education, school health (SHP) and HIV/AIDS awareness.
Train teachers on AIDS. Supply LSM for HIV persons Teachers trained on HIV/AIDS & LSM supplied to 50% of schools.
Train traditional leaders on HIV/AIDS related issues 80% of traditional leaders attended workshops
Train teachers on White Paper 6 10% of teachers trained on White Paper 6
Measurable Objectives Activities Performance Measures
Implement Child Protection Policy (Inclusive EDU) Child Protection Policy implemented in 10% of schools
Establish school based support system School based support teams established in 10% schools
Make schools accessible for wheelchairs 1% of schools made accessible for wheelchair users
Enrol learners with disabilities 1% of disabled learners enrolled at public schools. SHP implemented in 10% of schools.
To improve access to information, communication and technology (ICT)
• Moving the Education Library to Building 8, Riverside Government Complex
• Computerisation of the Education library • Train ELITS staff to use PALS • Market the services of the Education Library • Purchase the stock for the Education Library
The extent to which the Provincial Education Library is established to provide access to all the Mpumalanga employees.
Measurable Objectives Activities Performance Measures
To ensure that the population of compulsory school-going age in province attend schools
To make the Public aware through Circulars and the media 98% of the population aged 6-15 attending schools
Number of failing schools decreased and enhancement of School Effectiveness
Curriculum support in terms of subject packages redress, assistance with study methods, classroom management, methodologies Implement the intervention Programme
Poorly performing schools decreased by 50% 100% of Secondary Schools implement the Intervention Programmes
To provide Grade R spaces in Public Ordinary Schools and in education funded community sites in accordance with policy but specifically White Paper 5
Further extending Grade R spaces in Public ordinary Schools
60% spaces for Grade R in Ordinary Public schools Develop provincial policy, including registration policy, on ECD provision in schools and community based sites in consultation with ECD council, the ELRC and other relevant stakeholders

EDUCATION STRATEGIC PLANNING 19
Sub-Programme 1.4: Human Resource Development to provide human resource development for office based staff (R2 000 000)
Measurable Objectives Activities Performance Measures
Provide Human Resource Development for office-based staff.
Workplace Skills Plan developed, approved and implemented
The extent to which the workplace skills plan is developed and implemented for office based educators and provide:
Maximize advocacy campaign on Workplace Skills Plan Develop instruments to measure success - 10% sample of Office Based staff.
Allocate bursaries for re-skilling in IT and OBE methodology Allocate bursaries for enhancement in line functions and Management and Governance
Bursaries
Offer skills programmes in Management, Governance & Leadership, Curriculum delivery and Assessment, Sport capacity building, youth Development, IT, Inclusive Education and line functions
SETA Learnerships & Skills Programs
Develop a HRD Data Base Data Base captured on the EMIS system
Facilitate the attendance of short courses, seminars and conferences in line function delivery
Short courses, seminars and conferences in line function delivery
Develop and Implement Human Resource Plan Develop and Implement Employment Equity Plan
Human Resources Plan and Employment Equity Plan
Develop job descriptions framework Maintain job description data base Support the implementation of performance work plan through training
Job descriptions and performance work plans
Develop and implement appropriate wellness programmes, including HIV/AIDS in the workplace
Employee wellness programs
Measurable Objectives Activities Performance Measures The extend to which the workplace skills plan is developed
and implemented for office based public servants (including SMS) and provide:
Allocate bursaries in Financial Management, Human Resources Management, Organisation and Human Resource Development, Psychology, Information Management, Project Management, Management and Administration, IT and Labour Relations
Bursaries

EDUCATION STRATEGIC PLANNING 20
Offer skills programmes in Financial Management, Human Resources Management, Assessor, Moderator, Verifier, Job Descriptions, Psychology, IT, Project Management, Management and Administration, Labour Relations, Office Admin, Line Functions and ABET
Skills programms
Facilitate the attendance of short courses, seminars and conferences in line function delivery
Short courses, conferences and seminars
Develop & implement Human Resource Plan Develop & Implement Employment Equity Plan
Human Resources Plan and Employment Equity Plan
Develop job descriptions in framework Maintain job description data base support the implementation of performance work plans through training
Job Descriptions and Performance Work plans
Develop and implement appropriate wellness programmes, including HIV/AIDS in the workplace
Employee wellness programs
Programme 2: Public ordinary school education (R3 843 702 000) Programme objective: To provide public ordinary education from Grades 1 to 12 in accordance with the South African Schools Act. Sub-programme 2.1: Public primary phase (R2 490 693 000) Programme objective: To provide specific public primary ordinary schools with resources required for the Grades 1 to 7 phase.
Measurable Objectives Activities Performance Measures To provide public ordinary education from grades R-9 in accordance with the South African Schools Act.
Campaigning for early registering of learners. Distribution of approved Post Provisioning lists.
609946 spaces provided in the Public Primary Phase.
To provide Educators at the Public Primary Phase in accordance with Policy
Consultation of Post Provision model with Unions. Distribution of post establishments to schools by September of each year.
16478 of educators provided at the Public Primary Phase. The LE Ratio is 37 : 1 ratio in the Public Primary Phase.
Measurable Objectives Activities Performance Measures

EDUCATION STRATEGIC PLANNING 21
To improve access to quality of formal education at learning institutions in terms of school effectiveness and educator professionalism in the primary school (Grades 1–7)
Campaigning for early registration of learners Curriculum supports the implementation of OBE and maintenance by means of national and provincial policy initiatives, thorough circulars, newsletters and guidelines Collection of relevant data establishment of database by March 2003 Targets established collectively
Repetition rate in the Public Primary Schools
Curriculum supports this by means of national and provincial policy initiatives, thorough circulars, newsletters and guidelines in terms of updated teaching methodologies
Drop out rate in Public Primary Schools
Learning support programmes Improve 100% of learners in Grade 6 attaining acceptable outcomes in numeracy, literacy and life skills Criteria to be established by June 2003
To make schools centres of community life To organise Choral Eisteddfod Programmes Improve gardens and engage in church, Sport & recreation community meetings
20% of parents/community involved in school / community related activities
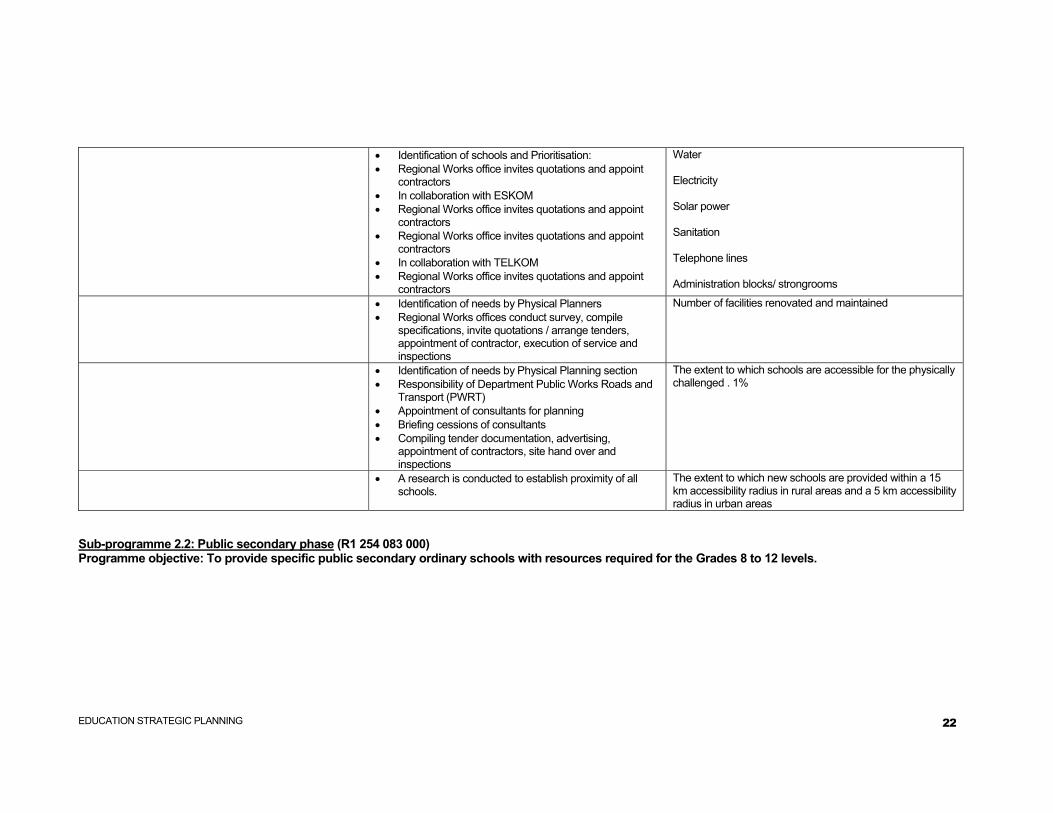
To put the basic infrastructure for primary schooling in place in accordance with policy
Implement priority list for 2003/4 after approved by Cabinet according to needs analysis.
Number of new classrooms build - 428. Specialist rooms - 24, and Admin Blocks - 27. Number of new toilets built - 311. Number of Schools to be provided with water: 15; electricity: 20; renovate: 94 schools and 37 schools provided with fences.
• Investigations and prioritisations by Physical Planning • Survey of Works Regional Office for cost estimation • Commit funds against allocations • Compiling of tender documentation (specifications) • Tender / quotation procedure – appointment of
contractor • Execution by contractor – progress payments • Final site hand over
The extent to which schools / educational institutions / offices are upgraded
• On site survey – to determine extent of needs (equipment)
• Estimation of cost and approval • Compile specifications by Control Works Inspector • Tender procedure – appointment of contractor
Appropriate new equipment provided (excluding halls and administration blocks) (equipment for hostels)
Facilities provided in terms of:
EDUCATION STRATEGIC PLANNING 22
• Identification of schools and Prioritisation: • Regional Works office invites quotations and appoint
contractors • In collaboration with ESKOM • Regional Works office invites quotations and appoint
contractors • Regional Works office invites quotations and appoint
contractors • In collaboration with TELKOM • Regional Works office invites quotations and appoint
contractors
Water Electricity Solar power Sanitation Telephone lines Administration blocks/ strongrooms
• Identification of needs by Physical Planners • Regional Works offices conduct survey, compile
specifications, invite quotations / arrange tenders, appointment of contractor, execution of service and inspections
Number of facilities renovated and maintained
• Identification of needs by Physical Planning section • Responsibility of Department Public Works Roads and
Transport (PWRT) • Appointment of consultants for planning • Briefing cessions of consultants • Compiling tender documentation, advertising,
appointment of contractors, site hand over and inspections
The extent to which schools are accessible for the physically challenged . 1%
• A research is conducted to establish proximity of all schools.
The extent to which new schools are provided within a 15 km accessibility radius in rural areas and a 5 km accessibility radius in urban areas
Sub-programme 2.2: Public secondary phase (R1 254 083 000) Programme objective: To provide specific public secondary ordinary schools with resources required for the Grades 8 to 12 levels.

EDUCATION STRATEGIC PLANNING 23
To improve access to information, communication and technology
• 24 schools • Organise exhibitions to screen, select and evaluate
relevant resources • Process stock for the schools • Market the school library service • Deliver stock to school • Train educators on basic library skills (to set up
libraries)
Provided core school library resources in 96 schools The extent to which public ordinary schools are provided with school library core collections to increase access to information is improved and enhanced
• 50% of educators Library based resources are integrated into classroom practice
• Curriculum update on selection criteria • LSM and resource catalogues are produced and
approved • Distribution of catalogues for ordering
Learning resources are screened, evaluated for inclusion in the resource catalogue
To improve access to and quality of formal education at learning institutions in terms of school effectiveness and educator professionalism in the secondary school (grades 8-12)
• Curriculum support in terms of subject package redress, assistance with study methods, classroom management, methodologies, etc.
• Develop and re-skill all grade 9 educators to follow appropriate assessment procedures and process
• Participate in the national bench-marking process of external assessment tools
• Establish a databank with information on the performance of Grade 9 learners
Improvement for Grade 9 through the application of CTA
To put the basic infrastructure for Secondary Schools in place with accordance with policy
• Organising of exhibitions to screen, select and evaluate relevant learning resources
• Acquisition of printed and electronic resources • Processing of stock for schools • Marketing the library service • Delivering stock to schools • Training educators on basic library set-up skills
The extent to which public secondary ordinary schools are provided with school library core collections
• Production of resource catalogues • Distribution of catalogues for ordering
The extent to which multi-media resources are screened, evaluated and selected
• Training of educators on information and research skills • Training of educators on reading skills • Training of educators on computer skills
The extent to which library based resources are integrated into classroom practice

EDUCATION STRATEGIC PLANNING 24
• Identification of schools and Prioritisation: • Regional Works office invites quotations and appoint
contractors • In collaboration with ESKOM • Regional Works office invites quotations and appoint
contractors • Regional Works office invites quotations and appoint
contractors • In collaboration with TELKOM • Regional Works office invites quotations and appoint
contractors
Water Electricity Solar power Sanitation Telephone lines Administration blocks/ Strongrooms
• Identification of needs by Physical Planners • Regional Works offices conduct survey, compile
specifications, invite quotations / arrange tenders, appointment of contractor, execution of service and inspections
The extent to which facilities are renovated and maintained
• Identification of needs by Physical Planning section Responsibility of Department Public Works Roads and • Transport (PWRT) • Appointment of consultants for planning • Briefing sessions of consultants • Compiling tender documentation, advertising,
appointment of contractors, site hand over and inspections
The extent to which schools are accessible for the physically disabled.
To foster a culture of effective learning and teaching Colts Campaigns Safe Schools Project Visit Schools by Circuit Manager (CM) and Curriculum implementers
Percentage of learner days lost due to Learner absenteeism in the Secondary Phase reduced Percentage of working days lost due to Educator absenteeism in the Secondary Phase reduced to 0 - school performance improves.
To develop the Educator Corps Workshops Seminars and Bursaries provided plus Skills Development
Average hours of development activities per Educator in the Secondary Phase increase.
To ensure that the flow of learners through the Primary and Secondary Phase is optimal
Issue, implement and monitor on repetition Monitor drop-out rates and minimise
Repetition rate in the Secondary phase – 5% Dropout rate in Secondary phase – 5%
To promote the participation of historically marginalized groups of learners, for example: Out of School Youth as per White Paper 6
Advocacy Campaign encourage all stakeholders to fully support policy
Gender parity index in Secondary Schools who are disabled
Sub-programme 2.3: Professional services (R81 826 000)
EDUCATION STRATEGIC PLANNING 25
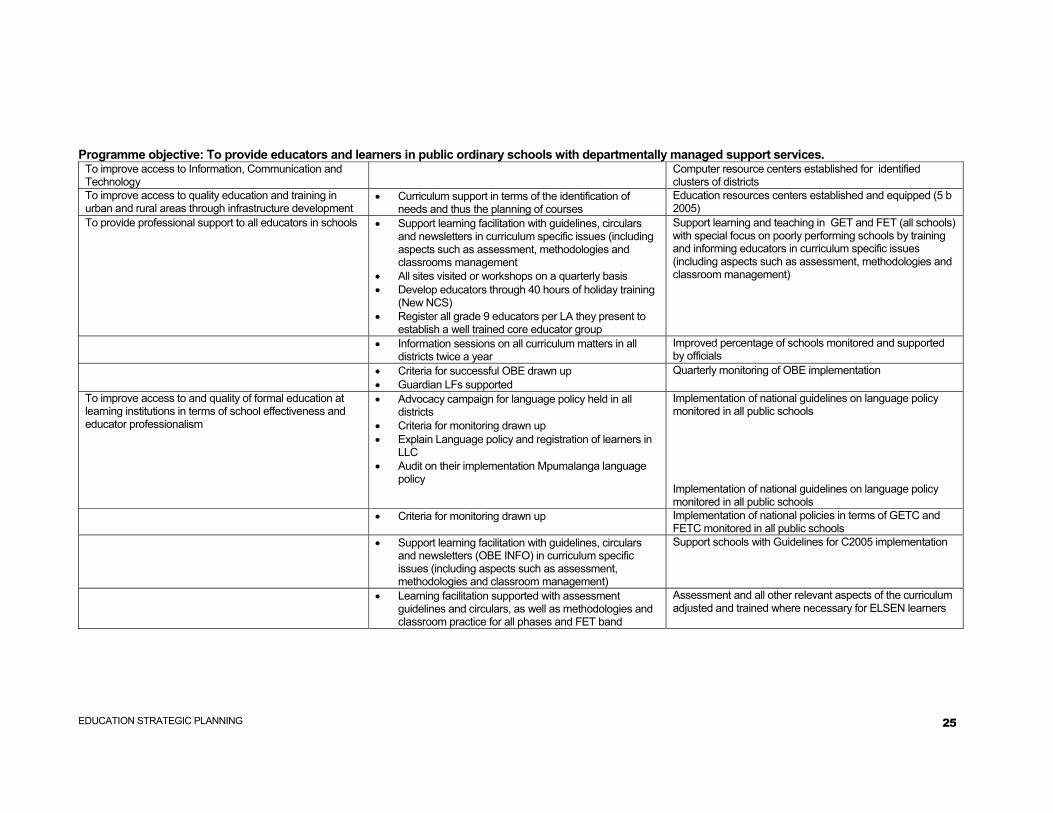
Programme objective: To provide educators and learners in public ordinary schools with departmentally managed support services. To improve access to Information, Communication and Technology
Computer resource centers established for identified clusters of districts
To improve access to quality education and training in urban and rural areas through infrastructure development
• Curriculum support in terms of the identification of needs and thus the planning of courses
Education resources centers established and equipped (5 b 2005)
To provide professional support to all educators in schools • Support learning facilitation with guidelines, circulars and newsletters in curriculum specific issues (including aspects such as assessment, methodologies and classrooms management
• All sites visited or workshops on a quarterly basis • Develop educators through 40 hours of holiday training
(New NCS) • Register all grade 9 educators per LA they present to
establish a well trained core educator group
Support learning and teaching in GET and FET (all schools) with special focus on poorly performing schools by training and informing educators in curriculum specific issues (including aspects such as assessment, methodologies and classroom management)
• Information sessions on all curriculum matters in all districts twice a year
Improved percentage of schools monitored and supported by officials
• Criteria for successful OBE drawn up • Guardian LFs supported
Quarterly monitoring of OBE implementation
To improve access to and quality of formal education at learning institutions in terms of school effectiveness and educator professionalism
• Advocacy campaign for language policy held in all districts
• Criteria for monitoring drawn up • Explain Language policy and registration of learners in
LLC • Audit on their implementation Mpumalanga language
policy
Implementation of national guidelines on language policy monitored in all public schools Implementation of national guidelines on language policy monitored in all public schools
• Criteria for monitoring drawn up Implementation of national policies in terms of GETC and FETC monitored in all public schools
• Support learning facilitation with guidelines, circulars and newsletters (OBE INFO) in curriculum specific issues (including aspects such as assessment, methodologies and classroom management)
Support schools with Guidelines for C2005 implementation
• Learning facilitation supported with assessment guidelines and circulars, as well as methodologies and classroom practice for all phases and FET band
Assessment and all other relevant aspects of the curriculum adjusted and trained where necessary for ELSEN learners
EDUCATION STRATEGIC PLANNING 26
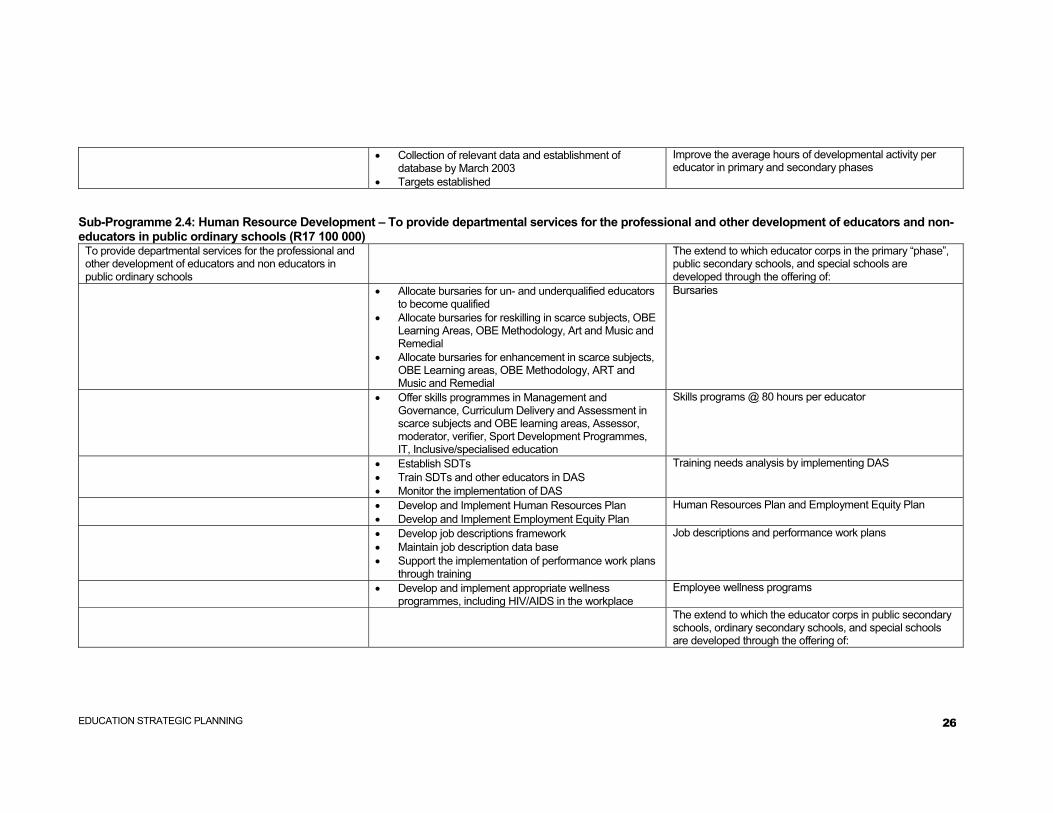
• Collection of relevant data and establishment of database by March 2003
• Targets established
Improve the average hours of developmental activity per educator in primary and secondary phases
Sub-Programme 2.4: Human Resource Development – To provide departmental services for the professional and other development of educators and non-educators in public ordinary schools (R17 100 000)
To provide departmental services for the professional and other development of educators and non educators in public ordinary schools
The extend to which educator corps in the primary “phase”, public secondary schools, and special schools are developed through the offering of:
• Allocate bursaries for un- and underqualified educators to become qualified
• Allocate bursaries for reskilling in scarce subjects, OBE Learning Areas, OBE Methodology, Art and Music and Remedial
• Allocate bursaries for enhancement in scarce subjects, OBE Learning areas, OBE Methodology, ART and Music and Remedial
Bursaries
• Offer skills programmes in Management and Governance, Curriculum Delivery and Assessment in scarce subjects and OBE learning areas, Assessor, moderator, verifier, Sport Development Programmes, IT, Inclusive/specialised education
Skills programs @ 80 hours per educator
• Establish SDTs • Train SDTs and other educators in DAS • Monitor the implementation of DAS
Training needs analysis by implementing DAS
• Develop and Implement Human Resources Plan • Develop and Implement Employment Equity Plan
Human Resources Plan and Employment Equity Plan
• Develop job descriptions framework • Maintain job description data base • Support the implementation of performance work plans
through training
Job descriptions and performance work plans
• Develop and implement appropriate wellness programmes, including HIV/AIDS in the workplace
Employee wellness programs
The extend to which the educator corps in public secondary schools, ordinary secondary schools, and special schools are developed through the offering of:

EDUCATION STRATEGIC PLANNING 27
• Offer skills programmes in Financial Management, • Resource Management, Management and
Administration • Project Management, IT, Line Functions and ABET
Improved financial management skills
• Develop and Implement Human Resource Plan • Develop and Implement Employment Equity Plan
Human Resources Plan and Employment Equity Plan
• Develop job descriptions framework • Maintain job description data base • Support the implementation of performance work plans
through training
Job descriptions and performance work plans
• Develop and Implement appropriate wellness programmes, including HIV/AIDS in the workplace
Employee wellness programs
Programme 3: Independent school subsidies (R8 956 000) Programme objective: To support independent schools in accordance with the South African Schools Act.
To support independent schooling especially if catering for poor communities as a complement to public schooling
The extent to which library-based resources are integrated into classroom practice
Sub-programme 3.1: Primary Schools – To support independent schools in grades 1-7 (R4 926 000)
To support independent schooling especially if catering for poor communities as a complement to public schooling
• Train educators on information and research skills • Train educators on reading skills • Train educators on computer skills
The extent to which library-based resources are integrated into classroom practice
The extent to which learning and teaching in GET are supported with special focus on poorly performing schools by training and informing educators in curriculum specific issues (including aspects such as assessment, methodologies and classroom management)

EDUCATION STRATEGIC PLANNING 28
Percentage improvement of schools monitored and supported by officials in the phasing in of OBE and the maintenance of subjects
The extent to which Implementation of national guidelines on language policy are monitored in all public schools
The extent to which systems and procedures for the early identification and addressing of barriers to learning in the Foundation Phase are established.
Render support independent schools in accordance with SASA and the norms and standards
Determining subsidy in line with norms and standards 67.44% of independent schools receiving state subsidy
Sub-programme 3.2: Secondary Schools – To support independent schools in grades 8-12 (R4 030 000)
Guidelines are available for C2005 implementation To support independent schools especially if catering for poor communities as a complement to public schooling
Provisioning of ELSEN Assessment and all other relevant aspects of the curriculum are adjusted and training provided where necessary for ELSEN learners
Training of educators on information and research skills Training of educators on reading skills Training of educators on computer skills
Library based resources are integrated into classroom practice
Curriculum 2005 policies are implemented in FET (Secondary schools)
Learning and teaching are supported in GET and FET (all schools) with special focus on poorly performing schools by training and informing educators in curriculum specific issues (including aspects such as assessment, methodologies and classroom management)
Improvement of schools monitored and supported by officials in the phasing in of OBE and the maintenance of subjects
Render support to independent schools in accordance with SASA and the norms and standards
Determining subsidy in line with the norms and standards 67.44% of independent schools receiving state subsidy
Implementation of national policies are monitored in terms of GETC and FETC in all independent schools
Programme 4: Public special school education (R68 924 000) Programme objective: To provide compulsory public education in special schools in accordance with the South African Schools Act and White Paper 6 on inclusive education

EDUCATION STRATEGIC PLANNING 29
Sub-Programme 4.3: Human Resource Development – To provide departmental services for the professional and other development of educators and non educators in public special schools (R600 000)
To provide departmental services for the professional and other development of educators and non-educators in public special schools.
• Allocate bursaries for enhancement in special education
Bursaries
• Offer skills programmes in Management and Governance, Curriculum delivery and assessment, Assessors, moderators and verifiers, sport development programmes, youth development programmes and IT.
• Offer skills programmes in Financial Management,
Project Management, IT, Line functions and ABET
Improved management skills.
• Establish SDTs • Train SDTs and other educators in DAS • Monitor the implementation of Das
Effective implementation of DAS.
• Develop and implement Human Resource Plan • Develop and implement Employment Equity Plan
Human Resources Plan and Employment Equity Plan
• Develop job descriptions framework • Maintain job description data base • Support and implementation of performance work plans
through training
Job descriptions and Performance Work Plans
• Develop and implement appropriate wellness programmes, including HIV/AISDS in the workplace
Employee wellness programs
Programme 5: Further Education and Training (R97 762 000) Programme objective: To provide Further Education and Training (FET) at public FET colleges in accordance with the Further Education and Training Act. Sub-programme 5.1: Public institutions (R97 262 000) Programme objective: To provide specific public FET colleges with resources.
EDUCATION STRATEGIC PLANNING 30
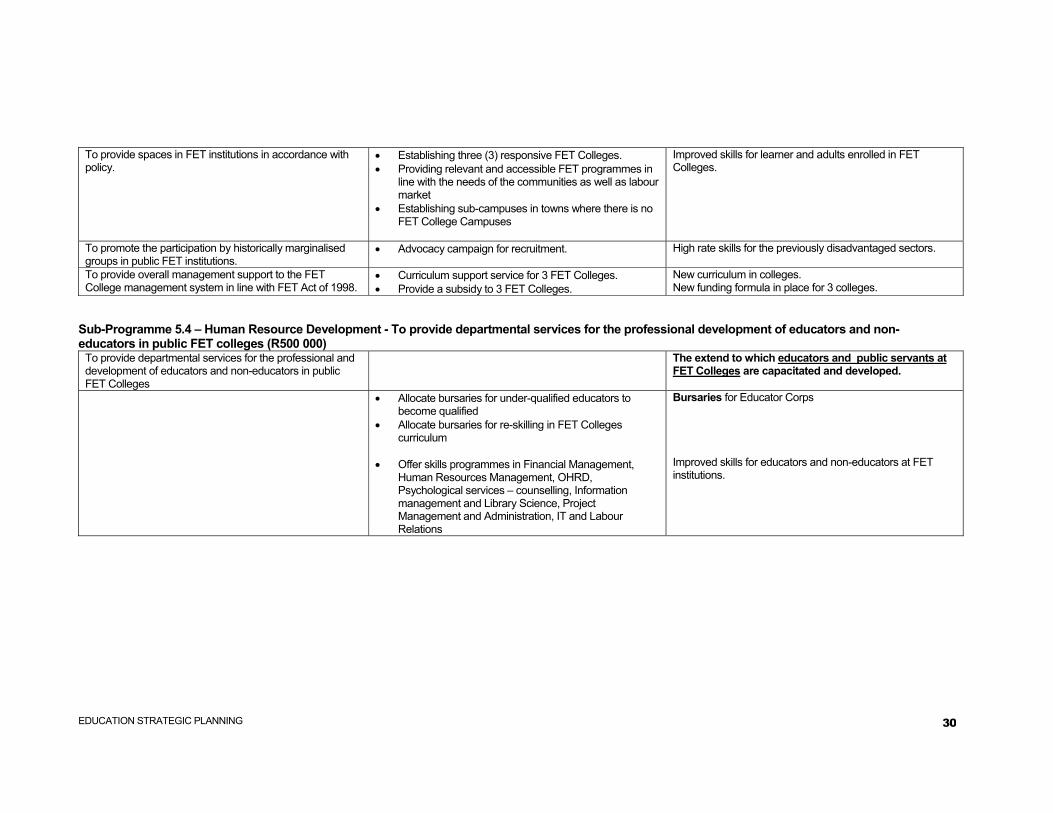
To provide spaces in FET institutions in accordance with policy.
• Establishing three (3) responsive FET Colleges. • Providing relevant and accessible FET programmes in
line with the needs of the communities as well as labour market
• Establishing sub-campuses in towns where there is no FET College Campuses
Improved skills for learner and adults enrolled in FET Colleges.
To promote the participation by historically marginalised groups in public FET institutions.
• Advocacy campaign for recruitment. High rate skills for the previously disadvantaged sectors.
To provide overall management support to the FET College management system in line with FET Act of 1998.
• Curriculum support service for 3 FET Colleges. • Provide a subsidy to 3 FET Colleges.
New curriculum in colleges. New funding formula in place for 3 colleges.
Sub-Programme 5.4 – Human Resource Development - To provide departmental services for the professional development of educators and non-educators in public FET colleges (R500 000)
To provide departmental services for the professional and development of educators and non-educators in public FET Colleges
The extend to which educators and public servants at FET Colleges are capacitated and developed.
• Allocate bursaries for under-qualified educators to become qualified
• Allocate bursaries for re-skilling in FET Colleges curriculum
• Offer skills programmes in Financial Management,
Human Resources Management, OHRD, Psychological services – counselling, Information management and Library Science, Project Management and Administration, IT and Labour Relations
Bursaries for Educator Corps Improved skills for educators and non-educators at FET institutions.

EDUCATION STRATEGIC PLANNING 31
• Offer skills programmes in Management and Governance, Curriculum delivery and Assessment, Assessor, moderator and verified, sport capacity building programs, IT, inclusive education and line functions
• Offer skills programmes in Financial Management,
Human Resource Management, Psychological services, Information science, Internet and e-mail, Project management, Management and Administration, IT, Labour Relation, Office Admin, line functions and ABET
• Facilitate the attendance of short courses, seminars and conferences in line function delivery
Short courses and seminars
• Develop and Implement Human Resource Plan • Develop and Implement Employment equity Plan
Human Resource Plan and Employment Equity Plan
• Develop job descriptions framework • Maintain job description data base • Support the implementation of performance work plans
through training
Job descriptions and Performance Work Plans
• Develop and implement appropriate wellness programmes, including HIV/AIDS in the workplace
Employee wellness programs

EDUCATION STRATEGIC PLANNING 32
Programme 6: Adult Basic Education and Training (R47 200 000) Programme objective: To provide Adult Basic Education and Training (ABET) in accordance with the Adult Basic Education Act. Sub-programme 6.1: Public centres (R46 000 000) Programme objective: To provide specific public ABET sites with resources
To provide spaces in public ABET centres in accordance with policy.
• Information source: EMIS • Develop recruitment and advocacy manual • Train ABET educator practitioners and personnel in
recruitment strategies • Intensify Adult Learners’ Week Campaign and
International Day Celebrations • Provide motivational sessions on and ongoing basis to
reduce learner dropout • Monitor learner attendance • Provide various interventions • Train adult educators on Fundamentals, Core and
Electives 1 • Train them in the development of Learning
programmes • Train adult educators in the use of Unit Standards and
the development of Learner Portfolios • To monitor adult educators work and give regular
feedback
The extend to which the number of full-time equivalent enrolments in public ABET centres increase progressively Illiteracy rate radicated. Adult learners attaining General Education and Training Certificate increases progressively
EDUCATION STRATEGIC PLANNING 33
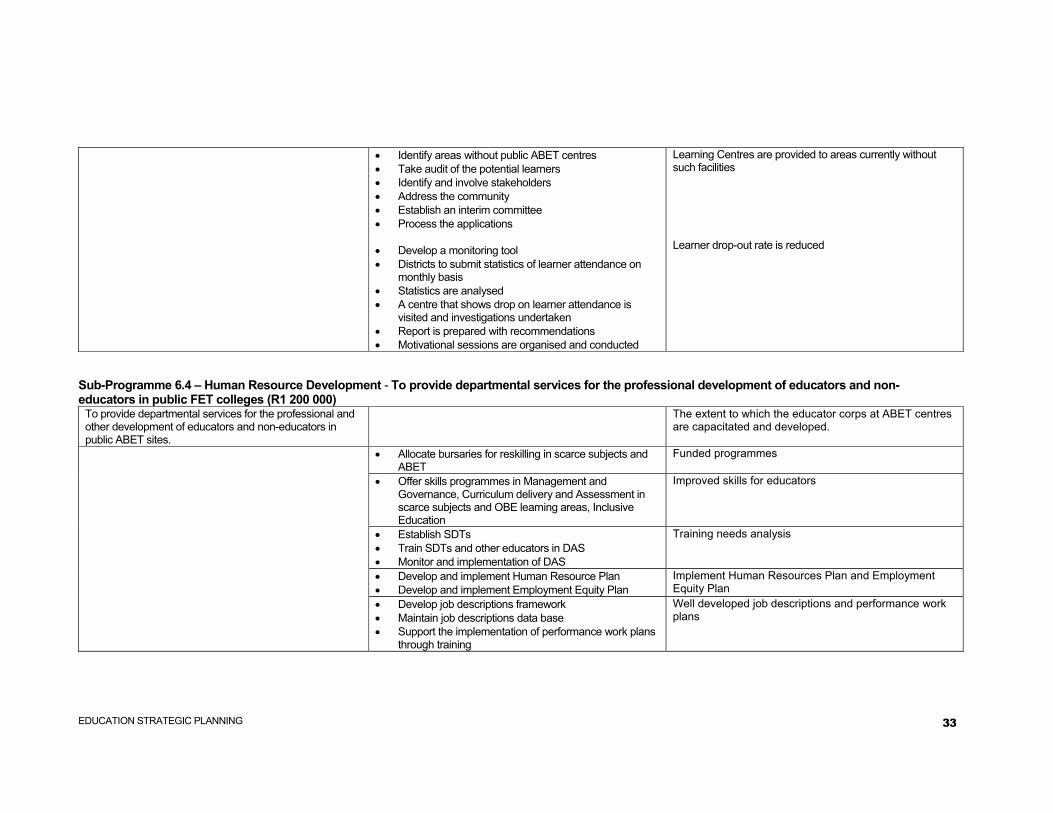
• Identify areas without public ABET centres • Take audit of the potential learners • Identify and involve stakeholders • Address the community • Establish an interim committee • Process the applications • Develop a monitoring tool • Districts to submit statistics of learner attendance on
monthly basis • Statistics are analysed • A centre that shows drop on learner attendance is
visited and investigations undertaken • Report is prepared with recommendations • Motivational sessions are organised and conducted
Learning Centres are provided to areas currently without such facilities Learner drop-out rate is reduced
Sub-Programme 6.4 – Human Resource Development - To provide departmental services for the professional development of educators and non-educators in public FET colleges (R1 200 000)
To provide departmental services for the professional and other development of educators and non-educators in public ABET sites.
The extent to which the educator corps at ABET centres are capacitated and developed.
• Allocate bursaries for reskilling in scarce subjects and ABET
Funded programmes
• Offer skills programmes in Management and Governance, Curriculum delivery and Assessment in scarce subjects and OBE learning areas, Inclusive Education
Improved skills for educators
• Establish SDTs • Train SDTs and other educators in DAS • Monitor and implementation of DAS
Training needs analysis
• Develop and implement Human Resource Plan • Develop and implement Employment Equity Plan
Implement Human Resources Plan and Employment Equity Plan
• Develop job descriptions framework • Maintain job descriptions data base • Support the implementation of performance work plans
through training
Well developed job descriptions and performance work plans

EDUCATION STRATEGIC PLANNING 34
• Develop and implement appropriate wellness programmes, including HIV AIDS in the workplace
Employee wellness programs.
Programme 7: ECD (R61 209 000) Sub-programme 7.1: Grade R in public schools (R29 400 000) Programme objective: To provide specific public ordinary schools with resources required for Grade R
To provide Grade R spaces in public ordinary schools in accordance with policy, but specifically White Paper 5.
• Include additional Grade R classes each year depending on approved budget allocated
Number of ECD sites at primary schools increased. Policy and implementation workshops and meetings
• Establish records of all ECD school-based sites Percentage of 5 year olds in publicly funded school Grade R • Establish needs for classroom resources for Grade R at
public schools Provide basic resources required in ECD sites at Primary Schools
To provide Grade R spaces in education-funded community based sites in accordance with policy, but specifically White Paper 5.
• Identify and include community-based site in the system
• Sites
Number of learners in education-funded community-based ECD sites
• Collection of relevant data The extent to which the Number of ECD sites at community based sites are increased
• Establish records of all ECD community-based sites The extent to which the Number of learners in education funded community based ECD sites increased.
• Provide community-based centres with resources for the classroom
Provide basic resources required in community based ECD sites
Sub-programme 7.2: Professional Services – To provide educators and learners at ECD sites with departmental management support (R31 609 000)
To improve access to qualify access to quality education and training in urban and rural areas through infrastructure development
• Finalised by March 2003 • Achieved
Design funding mechanisms in consultation with Human Resources and Financial Management All qualifying ECD sites are monitored for subsidy payment Finalise curriculum delivery models for Grade R, including guidelines for assessment by 30 April 2002
• Finalise by December 2003
Develop norms and standards for basic resources required in community based ECD sites
• Register all school-based sites, Independent sites and community based sites
• Develop registration process for school-based sites and Independent sites
All ABET centres, ECD sites and home based sites are correctly registered according to set criteria and monitored where relevant
To improve access to quality education and training in urban and rural areas through infra structure development
• Guidelines developed for C2005 implementation Guidelines developed for C2005 implementation

EDUCATION STRATEGIC PLANNING 35
• Collaborative development of national and provincial curriculum policies
Advise on the policy developments
Sub-programme 7.3: Human Resource Development – To provide departmental services for the professional and other development of educators in ECD sites (200 000)
To develop the educator corps in the ECD sector • Training of ECD practitioners to NQF level 4 Community based practitioners trained to NQF level 4 • Identify training needs of educators and implement
training Free standing educators re-skilled or trained
• Identify training needs and implement training School based educators re-skilled or trained To improve effectiveness of governance and management in educational institutions at all levels of the system
• ECD managers trained on ECD matters • Management committees trained for effective site
management • Training of officials
Increase the number of ECD managers qualified in leadership and management
To improve access to quality education and training in urban and rural areas through infra structure development
• Develop implementation guidelines • One workshop in each district per term
Support learning and teaching in the ECD sector by training and informing educators in curriculum specific issues
• Procurement of external evaluation(s) • Comprehensive evaluation of:
- Current status of activities / programmes in schools - Materials
- Quality of Educator training - Cascading of training - Quality of implementation in the classroom - Documentation of models of best practice - Identification of needs
Comprehensive Evaluation – of current status of activities / programmes in schools
To provide employee human resource development in accordance with the Skills Development Act
To utilise the 1% skills levy effectively and efficiently.
To provide for departmentally managed examination services To improve access to and quality of formal education at learning institutions in terms of school effectiveness and Educator professionalism
• Capturing of entries • Determination of timetable • Distribution of examination papers • Marking of examination scripts & re-marking of
examination scripts • Moderation of examination papers and scripts
Examinations (including Grade 12 end of year, supplementary and common examinations, ABET level 4 and the GETC) are conducted according to relevant national policy and provincial guidelines in terms of entries, timetabling, distribution, marking, re-marking, moderation, certification and payment
• Appoint examiners and moderators for period of three years
• Follow up on paper progress
To develop provincial examination papers for Grade 12 November and supplementary examinations 3 months prior to commencement of the examinations

EDUCATION STRATEGIC PLANNING 36
To ensure that schools and candidates receive recognition for their performance at a successful well-done function
• Ensure that enough money is budgeted for the task • Write necessary submission concerning all expenditure • Regular committee meetings are held to ensure
progress • Nominees should be invited as soon as possible to
ensure attendance
Schools and candidates receive recognition for their performance at an award function for best performing learners, schools and regions.
TABLE A.3: PERFORMANCE TARGETS Provincial Vote …: Education (R4 522 763 000) Aim of vote: To provide education in the province to people whose education is the responsibility of the department
Performance measure 2001/02 actual 2002/03 estimated 2003/04 target 2004/05 target 2005/06 target Percentage of the population aged 6 to 14 attending schools.
96% 98% 99% 100% 100%%
Percentage of the population aged 15 to 17 attending schools and other educational institutions.
72% 80% 90% 100%%
Average highest GET or FET level attained by adults in the population. Adult literacy rate.
70%
Programme 1: Administration (R 354 971 000) Programme objective: To provide overall management of the education system in accordance with the National Education Policy Act., the Public Finance Management Act, and other policies.
Performance measure 2001/02 actual 2002/03 estimated 2003/04 target 2004/05 target 2005/06 target Percentage of schools with Section 21 status. Percentage of recurrent non-personnel funding being channelled through the School Funding Norms.
8%
9%
100%
100%
100%
Average real per learner allocation for recurrent non-personnel items using funding supplied via the School Funding Norms. Percentage of non-Section 21 schools with all LSMs and other required materials delivered on day one of the school year.
R239
90%
R479
100%
R631
100%
R631
100%
R631
100%
EDUCATION STRATEGIC PLANNING 37
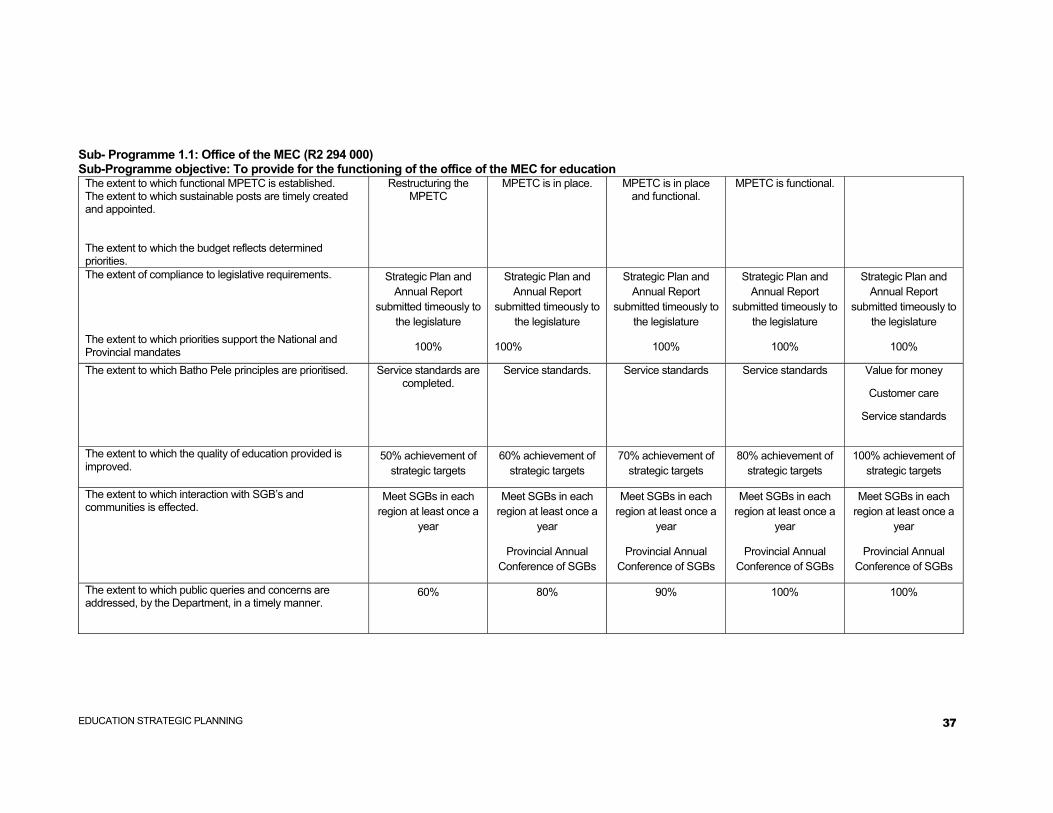
Sub- Programme 1.1: Office of the MEC (R2 294 000) Sub-Programme objective: To provide for the functioning of the office of the MEC for education
The extent to which functional MPETC is established. The extent to which sustainable posts are timely created and appointed. The extent to which the budget reflects determined priorities.
Restructuring the MPETC
MPETC is in place. MPETC is in place and functional.
MPETC is functional.
The extent of compliance to legislative requirements. The extent to which priorities support the National and Provincial mandates
Strategic Plan and Annual Report
submitted timeously to the legislature
100%
Strategic Plan and Annual Report
submitted timeously to the legislature
100%
Strategic Plan and Annual Report
submitted timeously to the legislature
100%
Strategic Plan and Annual Report
submitted timeously to the legislature
100%
Strategic Plan and Annual Report
submitted timeously to the legislature
100%
The extent to which Batho Pele principles are prioritised. Service standards are completed.
Service standards. Service standards Service standards Value for money
Customer care
Service standards
The extent to which the quality of education provided is improved.
50% achievement of strategic targets
60% achievement of strategic targets
70% achievement of strategic targets
80% achievement of strategic targets
100% achievement of strategic targets
The extent to which interaction with SGB’s and communities is effected.
Meet SGBs in each region at least once a
year
Meet SGBs in each region at least once a
year
Provincial Annual Conference of SGBs
Meet SGBs in each region at least once a
year
Provincial Annual Conference of SGBs
Meet SGBs in each region at least once a
year
Provincial Annual Conference of SGBs
Meet SGBs in each region at least once a
year
Provincial Annual Conference of SGBs
The extent to which public queries and concerns are addressed, by the Department, in a timely manner.
60% 80% 90%
100% 100%
EDUCATION STRATEGIC PLANNING 38
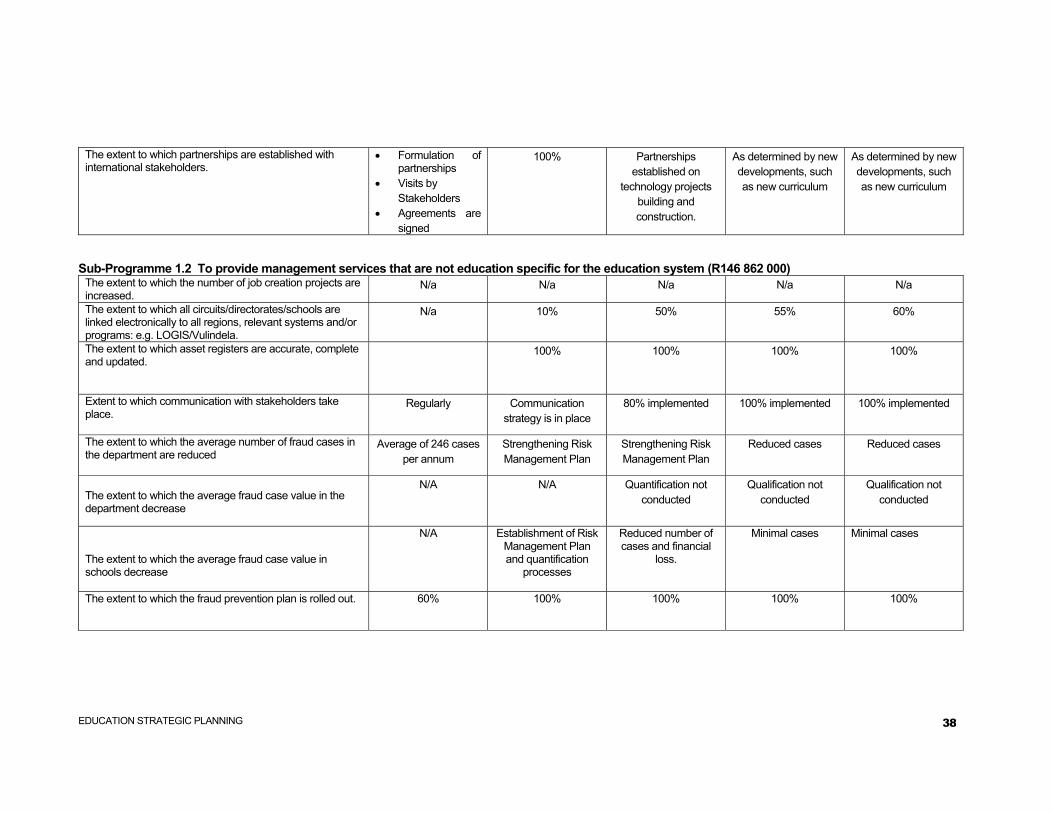
The extent to which partnerships are established with international stakeholders.
• Formulation of partnerships
• Visits by Stakeholders • Agreements are
signed
100% Partnerships established on
technology projects building and construction.
As determined by new developments, such as new curriculum
As determined by new developments, such as new curriculum
Sub-Programme 1.2 To provide management services that are not education specific for the education system (R146 862 000)
The extent to which the number of job creation projects are increased.
N/a N/a N/a N/a N/a
The extent to which all circuits/directorates/schools are linked electronically to all regions, relevant systems and/or programs: e.g. LOGIS/Vulindela.
N/a 10% 50% 55% 60%
The extent to which asset registers are accurate, complete and updated.
100% 100%
100%
100%
Extent to which communication with stakeholders take place.
Regularly Communication strategy is in place
80% implemented 100% implemented 100% implemented
The extent to which the average number of fraud cases in the department are reduced
Average of 246 cases per annum
Strengthening Risk Management Plan
Strengthening Risk Management Plan
Reduced cases Reduced cases
The extent to which the average fraud case value in the department decrease
N/A N/A
Quantification not conducted
Qualification not conducted
Qualification not conducted
The extent to which the average fraud case value in schools decrease
N/A Establishment of Risk Management Plan and quantification
processes
Reduced number of cases and financial
loss.
Minimal cases Minimal cases
The extent to which the fraud prevention plan is rolled out.
60%
100%
100%
100%
100%

EDUCATION STRATEGIC PLANNING 39
The extent to which Responsibility Managers provide a representation letter on compliance to the Chief Financial Officer by 31 March per annum (Adherence to Risk Management Policy)
100% 100% 100% 100%
The extent to which all vacant funded educator and public servants posts are permanently filled in a timely manner within budget limitations
No target was set
Filled within six months for non-
educators and within three months for
educators
Filled within six months for non-
educators and within three months for
educators
Filled within six months for non-
educators and within three months for
educators
Filled within six months for non-
educators and within three months for
educators
The extent to which the Human Resources Plan are updated
Data base conducted Programme developed
Implementation of the human resource plan
Implementation of the human resource plan
Review of the human resource plan
The extent to which a strategy has been developed for the prioritisation of appointment of educators who have completed there studies and remain unemployed
N/a Strategy being developed
Implementation by sending students to tertiary institutions
Employment of educators on scarce subjects.
Employment of educators.
The extent to which identified Batho Pele principles are adhered to
Service standards developed
80% Trained personnel on customer care
Standards set and adhered to
Standards set and adhered to
The extent of adherence to all statutory requirements
100% 100% 100%
Personnel Cost: Current cost split 91:9% 88:12% 85.5:14.5 85.5:14.5
The extent to which internal disciplinary hearings are finalised timeously
Not applicable Finalised within three months
Finalised within two months
Finalised within two months
Finalised within two months
Sub-programme1.3 – Education Management Programme objective: To provide education management services for the education system (203 815 000)
The extent to which all ABET Centres, ECD sites and Home based sites are correctly registered and monitored according to set criteria
100% 100% 100% 100% 100%

EDUCATION STRATEGIC PLANNING 40
The extent to which learning programmes are developed including HIV/AIDS, environment and values in education with inputs from all relevant projects
1 period / class / per school / per week
1 period / class / per schools / per week
1 period / class / per schools / per week
1 period / class / per schools / per week
1 period / class / per schools / per week
The extent to which guidelines developed for C2005 implementation
Inclusive education piloted in 10 schools through the scope
project
Inclusive education piloted in 10 schools through the scope
project
Inclusive education piloted in 10 schools through the scope
project
Inclusive education piloted in 10 schools through the scope
project
Inclusive education piloted in 10 schools through the scope
project
The extent to which assessment and all other relevant aspects of the curriculum are adjusted where necessary for ELSEN learners
100% 100% 100%
The extent to which collaborative development of national and provincial curriculum policies occur.
Necessary policies developed
100%
Necessary policies developed 100%
Necessary policies developed 100%
Necessary policies developed 100%
Necessary policies developed 100%
The extent to which cumulative record cards (profiles) are designed and produced for all learners in the system
N/a Design finalized by March 2003
Grade 1 supplied with profiles
Grade 1, 2 and 3 Grade 1 and Intermediate Phase supplied
The extent to which the number of failing schools are decreased Development Strategy Intervention.
N/a By 50% By 50% By 100% By 100% (new criteria)
Sub-Programme 1.4 - Human Resource Development Programme objective: To provide human resource development for office based staff (R2 000 000)
2001/2002 2002/2003 2003/2004 2004/2005 2005/2006
The extent to which the workplace skills plan is developed and implemented for office based educators and provide
N/a 7% 100%
100% 100%
Bursaries 107 120 150 204 300
Skills Programs 238 960 1100 1100 1100
Short courses, seminars and conferences in line function delivery
20 30 30 30
The extent to which a training needs analyses completed
Research conducted Database is available Implementation mechanisms developed
Training programmes facilitated
Review of the training programme

EDUCATION STRATEGIC PLANNING 41
The extent to which an Impact assessment of training on service delivery system is developed.
Adherence to implementation plan
Timeous provisioning of services
Backlogs are addressed
Review of the resource plan
The extent to which an Employee wellness program (HIV/AIDS in the workplace) is developed.
Continuously Continuously Continuously
The extent to which an Employee wellness program (HIV/AIDS in the workplace) is implemented.
100% 100% 100%
The extend to which the workplace skills plan is developed and implemented for office based public servants (including SMS) and provide
30% 60% 80% 100% 100%
Bursaries 30 114 286 286 286
Learnerships: Financial Management 30 60 80 100% 100%
Skills programs 138 800 800 800
Short courses, conferences and seminars 30 +50 +60 80 90
Human Resources Plan and employment Equity Plan 80% 90% 100% Review of the plan
Job Descriptions and Performance Work plans 80% 100% 100% 100%
Employee wellness programs 80% 100% 100% 100%
Programme 2: Public ordinary school education (R3 843 702 000) Programme objective: To provide public ordinary education from Grades 1 to 12 in accordance with the South African Schools Act. Sub-programme 2.1: Public primary and combined phase (R2 490 693 000) Programme objective: To provide specific public primary ordinary schools with resources required for the Grades 1 to 7 phase.
Number of educators provided at the public primary phase. L:E ratio in the public primary phase.
1:40 1:37 1:37 1:35 1:35
Number of new classrooms built. L:C ratio in the public primary phase.
216 318 315 331 347
Number of new toilets built. 182 485 803 844 886
Percentage of schools with a water supply.

EDUCATION STRATEGIC PLANNING 42
Percentage of capex budget spent on maintenance.
Gender parity index in public primary schools.
Collecting relevant data
Collecting relevant data
Percentage of learners in public primary schools who are challenged
Number of ordinary full-service schools per 100,000 learners at the primary phase.
Percentage of learner days lost due to learner absenteeism in the primary phase.
Collecting relevant data Collecting
Percentage of working days lost due to educator absenteeism in the primary phase.
Collecting relevant data
Average hours of development activities per educator in the primary phase.
? ? 80 Hours 80 Hours 80 Hours
Repetition rate in the primary phase. Dropout rate in the primary phase.
Collecting relevant data
8% 7% 7%
Percentage of learners in Grade 3 attaining acceptable outcomes in numeracy, literacy and life skills.
70% 80% 90%
Percentage of learners in Grade 6 attaining acceptable outcomes in numeracy, literacy and life skills.
Criteria to be established
70% 80%
The extent to which the number of schools with two computers are increased
276 526
The extent to which basic ICT facilities and resources are provided in newly built schools
The extent to which public primary ordinary schools are provided with school library core collections
2000-775
2001-253
749 600 1000 1000
The extent to which LSM and multi-media resources are screened, evaluated and selected
100% 100% 100% 100% 100%
The extent to which library based resources are integrated into classroom practice
20% 20% 50% of educators 70% of educators 90% of educators
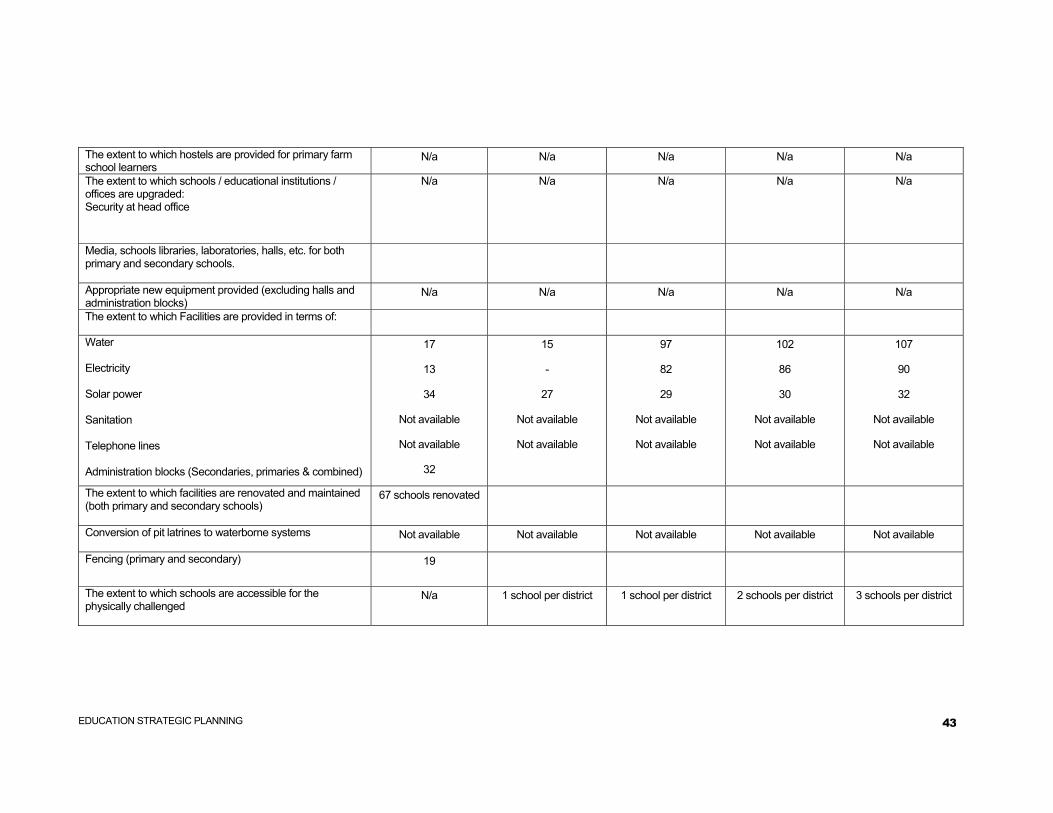
EDUCATION STRATEGIC PLANNING 43
The extent to which hostels are provided for primary farm school learners
N/a N/a N/a N/a N/a
The extent to which schools / educational institutions / offices are upgraded: Security at head office
N/a
N/a N/a N/a
N/a
Media, schools libraries, laboratories, halls, etc. for both primary and secondary schools.
Appropriate new equipment provided (excluding halls and administration blocks)
N/a N/a N/a N/a N/a
The extent to which Facilities are provided in terms of:
Water Electricity Solar power Sanitation Telephone lines Administration blocks (Secondaries, primaries & combined)
17
13
34
Not available
Not available
32
15
-
27
Not available
Not available
97
82
29
Not available
Not available
102
86
30
Not available
Not available
107
90
32
Not available
Not available
The extent to which facilities are renovated and maintained (both primary and secondary schools)
67 schools renovated
Conversion of pit latrines to waterborne systems
Not available Not available Not available Not available Not available
Fencing (primary and secondary) 19
The extent to which schools are accessible for the physically challenged
N/a 1 school per district 1 school per district 2 schools per district 3 schools per district

EDUCATION STRATEGIC PLANNING 44
The extent to which new schools are provided within a 15 km accessibility radius in rural areas and a 5 km accessibility radius in urban areas
Collection of relevant data
A comprehensive resource plan is in
place
Sub-programme 2.2: Public secondary phase (1 254 083 000) Programme objective: To provide specific public secondary ordinary schools with resources required for the Grades 8 to 12 levels.
Number of spaces provided in the public secondary phase. 287996
Number of educators provided at the public secondary phase. L:E ratio in the public secondary phase.
8649
33.3
Number of new classrooms built. L:C ratio in the public secondary phase.
200 102 124 130 137
Number of new toilets built.
773 159 198 208 218
Percentage of schools with a water supply.
68% 80% 90%
Percentage of capex budget spent on maintenance.
Percentage of secondary schools with functioning science laboratories.
42% 50% 55%
Gender parity index in public ordinary schools.
Percentage of learners in public ordinary schools who are disabled.
Percentage of learner days lost due to learner absenteeism in the secondary phase.
Percentage of working days lost due to educator absenteeism in the secondary phase.
Average hours of development activities per educator in the secondary phase.
Repetition rate in the secondary phase.
Dropout rate in the secondary phase.

EDUCATION STRATEGIC PLANNING 45
Percentage of over-aged learners in the secondary phase. 26%
Percentage of learners in Grade 9 attaining acceptable educational outcomes.
Pass ratio in Grade 12 examinations. 47% 56% 66% 82%
Percentage of schools with a Grade 12 pass rate of less than 40%.
10% - - -
Improved Grade 12 endorsement rate (school based) from 14.5% to 26.5%
10% 15% 20% 25%
The extent to which the number of schools with two computers are increased
The extent to which basic ICT facilities and resources are provided in newly built schools
The extent to which public secondary ordinary schools are provided with school library core collections
The extent to which LSM and multi-media resources are screened, evaluated and selected
The extent to which library based resources are integrated into classroom practice
The extent to which hostels are provided for secondary farm school learners
N/a N/a N/a N/a N/a
The extent to which schools / educational institutions / offices are upgraded (for both primary and secondary)
67
Media, school libraries, laboratories, halls, etc. (special rooms) for both primary and secondary schools.
42
The extent to which Appropriate new equipment are provided (excluding halls and administration blocks)
Facilities provided in terms of:

EDUCATION STRATEGIC PLANNING 46
Water Electricity Solar power Sanitation Telephone lines Administration blocks (primary and secondary)
17
13
Not available
Not available
32
14
Not available
362
Collecting of data
97
82
Not available
667
01
86
-
700
106
90
-
735
The extent to which facilities are renovated and maintained Conversion of pit latrines to waterborne systems Fencing
67
-
19
82
-
36
74
-
56
78
-
59
82
-
62
The extent to which schools are to be accessible for the physically challenged
N/a 1 school per district 1 school per district 1 school per district 2 school per district
The extent to which the Grade 12 endorsement rate (school based) is improved
6% for 2001 grade 12 results
5% for 2002 grade 12 results
Concentration on the improvement of the
20% schools performing poorly
26.5%
Sub-programme 2.3: Professional services (R81 826 000) Programme objective: To provide educators and learners in public ordinary schools with departmentally managed support services.
PM 2.3.A: Hours of training and other support provided to schools-based educators.
80 Hours 80 Hours 80 Hours
Ten Teacher Resource Centres are established and equipped.
• Drafting policy • Consult • Financial and
Human Resource planning
Functional Functional Improvement on teacher development
Maintenance and support

EDUCATION STRATEGIC PLANNING 47
Support learning and teaching in GET and FET (all schools) with special focus on poorly performing schools by training and informing educators in curriculum specific issues (including aspects such as assessment, methodologies and classroom management)
All sites visited or workshops on a quarterly basis
All sites visited or workshops on a quarterly basis
All sites visited or workshops on a quarterly basis
All sites visited or workshops on a quarterly basis
Improved percentage of schools monitored and supported by officials
100% 100% 100% 100%
Quarterly monitoring of OBE implementation in all schools 100% 100% 100% 100% Implementation of national guidelines on language policy monitored in all public schools
100% 100% 100% 100%
Implementation of national policies in terms of GETC and FETC monitored in all public schools
100% 100% 100%
Support schools with Guidelines for C2005 implementation 100% 100% 100% 100% Assessment and all other relevant aspects of the curriculum adjusted and trained where necessary for ELSEN learners
100% 100% 100%
Improve the average hours of developmental activity per educator in primary and secondary phases (a vast data-base is essential here for this to be possible)
Collection of relevant data and establishment of data-base to be established.
50% of 80 hours 60% of 80 hours 70% of 80 hours
Sub-Programme 2.4: Human Resource Development (R17 100 000) Programme Objective: To provide departmental services for the professional and other development of educators and non-educators in public ordinary schools
The extend to which the educator corps in the primary “phase” are developed through the offering of:
Bursaries 1065 2150 2150 2150 The extent to which a Training needs analyses is completed: DAS
50%
40%
60%
100%
The extend to which the public servants at primary schools is developed through the offering of
Skills Programs: 71 2336 2336 2336 Training needs analyses: Developing Job Descriptions Framework
60% 80% 100%

EDUCATION STRATEGIC PLANNING 48
Bursaries 1448 2590 2595 2595 Bursaries to best performing grade 12 learners whose parents cannot afford to pay for their further study
150 70 30 10
Skills Programs @ 80 hours per educator: 2132 11419 11419 11419 Youth Development Programs for members of RCL
The extend to which public servants in ordinary secondary schools are developed through the offering of:
70% 80% 90% 100%
Skills Programs: Training needs analyses: Developing Job Descriptions Framework
Programme 3: Independent school subsidies (R 8 956 000) Programme objective: To support independent schools in accordance with the South African Schools Act.
PM 3.A.a: Average real per learner subsidy. PM 3.A.b: Percentage of independent school learners receiving a state subsidy.
Collecting data R864 79%
R864 79%
R864 79%
Sub-programme 3.1: Primary Schools – To support independent schools in grades 1-7 (R4 926 000)
The extent to which Assessment and all other relevant aspects of the curriculum are adjusted ad training provided where necessary for ELSEN learners
100% 100% 100%
The extent to which LSM and multi-media resources are screened, evaluated and selected
The extent to which library based resources are integrated into classroom practice
50% 50% 50% of educators 70% of educators 90% of educators
The extent to which learning and teaching are supported in GET with special focus on poorly performing schools by training and informing educators in curriculum specific issues (including aspects such as assessment, methodologies and classroom management)
All sites visited or workshops on a quarterly basis
All sites visited or workshops on a quarterly basis
All sites visited or workshops on a quarterly basis
All sites visited or workshops on a quarterly basis
Percentage improvement of schools monitored and supported by officials in the phasing in of OBE and the maintenance of subjects
50% 75% 100% 100%
The extent to which Implementation of national guidelines on language policy are monitored in all public schools
100% 100% 100% 100%
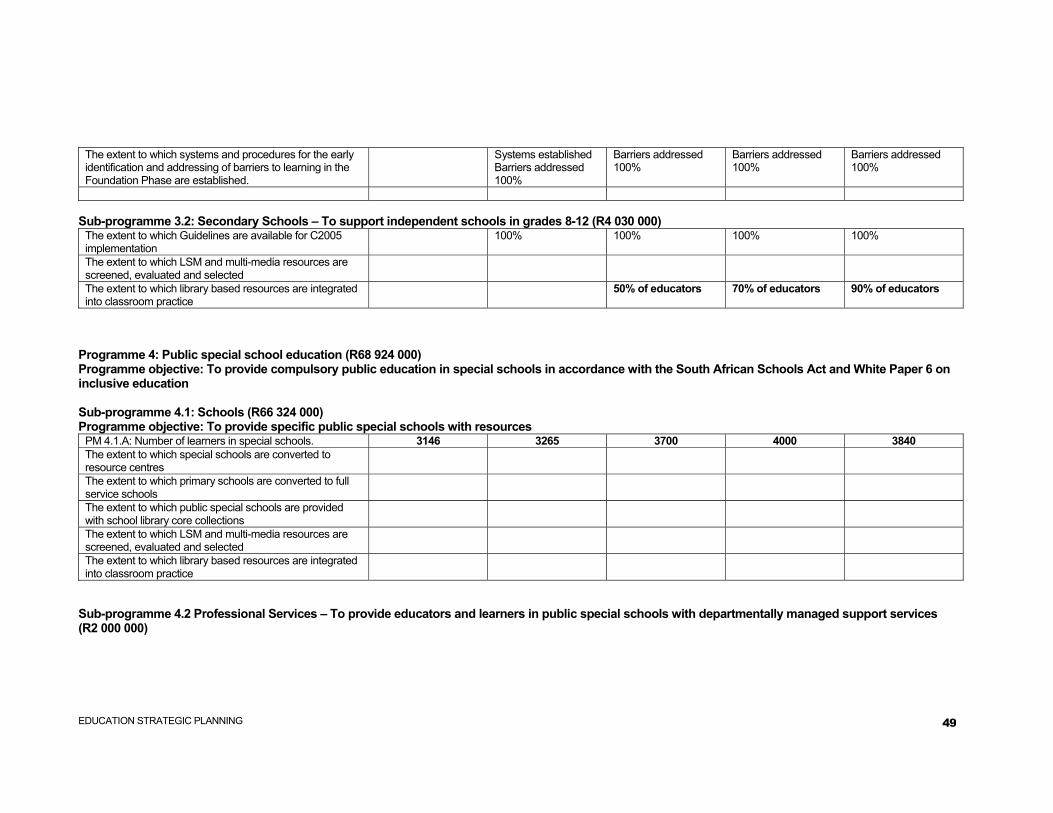
EDUCATION STRATEGIC PLANNING 49
The extent to which systems and procedures for the early identification and addressing of barriers to learning in the Foundation Phase are established.
Systems established Barriers addressed 100%
Barriers addressed 100%
Barriers addressed 100%
Barriers addressed 100%
Sub-programme 3.2: Secondary Schools – To support independent schools in grades 8-12 (R4 030 000)
The extent to which Guidelines are available for C2005 implementation
100% 100% 100% 100%
The extent to which LSM and multi-media resources are screened, evaluated and selected
The extent to which library based resources are integrated into classroom practice
50% of educators 70% of educators 90% of educators
Programme 4: Public special school education (R68 924 000) Programme objective: To provide compulsory public education in special schools in accordance with the South African Schools Act and White Paper 6 on inclusive education Sub-programme 4.1: Schools (R66 324 000) Programme objective: To provide specific public special schools with resources
PM 4.1.A: Number of learners in special schools. 3146 3265 3700 4000 3840 The extent to which special schools are converted to resource centres
The extent to which primary schools are converted to full service schools
The extent to which public special schools are provided with school library core collections
The extent to which LSM and multi-media resources are screened, evaluated and selected
The extent to which library based resources are integrated into classroom practice
Sub-programme 4.2 Professional Services – To provide educators and learners in public special schools with departmentally managed support services (R2 000 000)

EDUCATION STRATEGIC PLANNING 50
The extent to which learning and teaching are supported in GET and FET by training and informing educators in curriculum specific issues (including aspects such as assessment, methodologies and classroom management)
All sites visited on a regular basis
All sites visited on a regular basis
All sites visited on a regular basis
All sites visited on a regular basis
All sites visited on a regular basis
Percentage improvement of schools monitored and supported by officials
50% 55% 75% 80% 100%
The extent to which Quarterly monitoring of OBE implementation takes place in all special schools
20% 40% 75% 80% 100%
The extent to which Implementation of national guidelines on language policy are monitored in all special schools
20% 40% 75% 80% 100%
The extent to which Implementation of national policies in terms of GETC and FETC are monitored in all public special schools
20% 50% 75% 80% 100%
Sub-Programme 4.3: Human Resource Development – To provide departmental services for the professional and other development of educators and non educators in public special schools (R600 000)
2001/2002 2002/2003 2003/2004 2004/2005 2005/2006 The extend to which the educator corps in special schools Schools: Educators: are developed through the offering of
Schools: 18 Educators: 244
Schools: 18 Educators: 256
Schools: 18 Educators: 270
Schools: 18 Educators: 285
Schools: 18 Educators: 300
Bursaries 100 100 50 25 25 Skills Programs @ 80 hours per educator: - 22 660 660 The extent to which a training needs analyses is completed: DAS
18 schools 18 schools 22 schools
The extend to which the public servants corps in special schools are developed through
Skills Programs: 70 70 80 80 100 The extent to which a Training needs analyses is completed:
Policy and programme development
Resourcing Quality Assurance Inclusive Education
Promotion of inclusive education Introduction: OBE
Developing job descriptions Framework
Curriculum adaptation policy and programme development
Programme 5: Further Education and Training (R97 762 000) Programme objective: To provide Further Education and Training (FET) at public FET colleges in accordance with the Further Education and Training Act. Sub-programme 5.1: Public institutions (R97 262 000)

EDUCATION STRATEGIC PLANNING 51
Programme objective: To provide specific public FET colleges with resources. PM 5.1.A.a: Percentage of adults enrolled in FET institutions. PM 5.1.A.b: Number full-time equivalent enrolments in FET institutions.
8490.5
9198.5
40% 10\613.5
PM 5.1.B.a: Percentage of students who are girls or women. PM 5.1.B.b: Percentage of educators who are African.
10% 10%
20% 30%
30% 40%
The extent to which learnerships are provided to learners, including out-of-school youth
Sub-Programme 5.4 – Human Resource Development - To provide departmental services for the professional development of educators and non-educators in public FET colleges (R500 000)
The extend to which educator corps at FET Colleges are developed through the offering of:
Bursaries 282 390 430 430 Skills programs 178 720 805 805 The extent to which a Training needs analyses is completed through: Developing job description framework Developing a Performance Workplan Framework. DAS or self development plan framework.
-
-
220 educators s
The extent to which a Quality Assurance of training programs system developed
- -
The extent to which a Quality Assurance of training programs system implemented
- - March 2006
The extent to which a Impact assessment of training on service delivery system developed
- -
The extent to which a mpact assessment of training on service delivery system implemented
- - March 2006
The extent to which a Employee wellness (HIV/AIDS in the workplace) program developed
- -
The extent to which a Employee wellness (HIV/AIDS in the workplace) program implemented
- -
March 2006
The extend to which the public servants at FET Colleges are developed through

EDUCATION STRATEGIC PLANNING 52
Bursaries 15 210 266 266 Skills programs 181 198 240 240 The extent to which a Training needs analyses is completed:
Developing a Job Descriptions Framework. Developing Performance Workplans Framework. Developing self development plan / individual training framework.
The extent to which a Quality Assurance of training programs system is developed
- - 5
The extent to which a Quality Assurance of training programs system is implemented
- - March 2006
The extent to which an Impact assessment of training on service delivery system is developed
- - 5
The extent to which an Impact assessment of training on service delivery system is implemented
- - March 2006
The extent to which an Employee wellness (HIV/AIDS in the workplace) program is developed
- -
The extent to which an Employee wellness (HIV/AIDS in the workplace) program is implemented
- -
March 2006
Programme 6: Adult Basic Education and Training (R47 200 000) Programme objective: To provide Adult Basic Education and Training (ABET) in accordance with the Adult Basic Education Act. Sub-programme 6.1: Public centres (R46 000 000) Programme objective: To provide specific public ABET sites with resources.
2001/2002 2002/2003 2003/2004 2004/2005 2005/2006

EDUCATION STRATEGIC PLANNING 53
Number of full-time equivalent enrolments in public ABET centres. Percentage of illiterate adults in the province enrolled in public ABET centre programmes.
4.3%
The extent to which Learning Centres are provided to villages currently without such facilities The extent to which Learner drop-out rate is reduced. The extent to which Learners achieving General Education and Training Certificate in ABET are increased
60% Sub-Programme 6.2 – Human Resource Development - To provide departmental services for the professional development of educators and non-educators in public FET colleges Sub-Programme 6.4 – Human Resource Development - To provide departmental services for the professional development of educators and non-educators in public FET colleges (R1 200 000)
The extend to which the educator corps (1 528) at ABET (164) centres are developed through
50 1640 1640 1640 grams @ 80 hours per educator = 5 days 3712 3712 3712 Programme 7: Early Childhood Development (R61 209 000) Programme objective: To provide Early Childhood Education (ECD) at the Grade R and earlier levels in accordance with White Paper 5.
Percentage of learners in Grade 1 who have received some formal pre-Grade 1 education. Percentage of learners in Grade 1 who have received some formal pre-Grade 1 education.
Collecting data 19%
26%
Sub-programme 7.1: Grade R in public schools (R29 400 000) Programme objective: To provide specific public ordinary schools with resources required for Grade R.
Percentage of 5 year olds in publicly funded school Grade R.
Collecting data
The extent to which the Number of ECD sites at primary schools is increased
200 227 227 427 774

EDUCATION STRATEGIC PLANNING 54
The extent to which basic resources required in ECD sites at Primary Schools (not responsibility of this branch but needs to be included for budgeting purposes) is provided.
Number of learners in education-funded community-based ECD sites.
Collecting data
The extent to which the Number of ECD sites at community based sites are increased
180 sites 285 additional sites (conditional grant)
Maximum of 100 additional Practitioners
Maximum of 100 additional practitioners 465 sites in total
Completed (15% of total number of sites for community based sites
The extent to which the number of learners in education funded community based ECD sites are increased
(no statistics available now – will be available in 2003 after ECD audit)
The extent to which basic resources required in community based ECD sites (not responsibility of this branch but needs inclusion for budgeting purposes) are provided
Sub-programme 7.2: Professional Services – To provide educators and learners at ECD sites with departmental management support services (R31 809 000)
The extent to which All qualifying ECD sites are monitored for subsidy payment
100% 100% 100% 100%
The extent to which norms and standards for basic resources required in community based ECD sites are determined
Finalise December 2003
Completed
Sub-programme 7.3: Human Resource development – To provide departmental services for the professional and other development of educators in ECD sites (200 000)
The extend to which the educator corps at the following ECD sites 180 X free standing 280 community based sites 300 school based Grade R independent and home based Grade R – n/a are developed through:
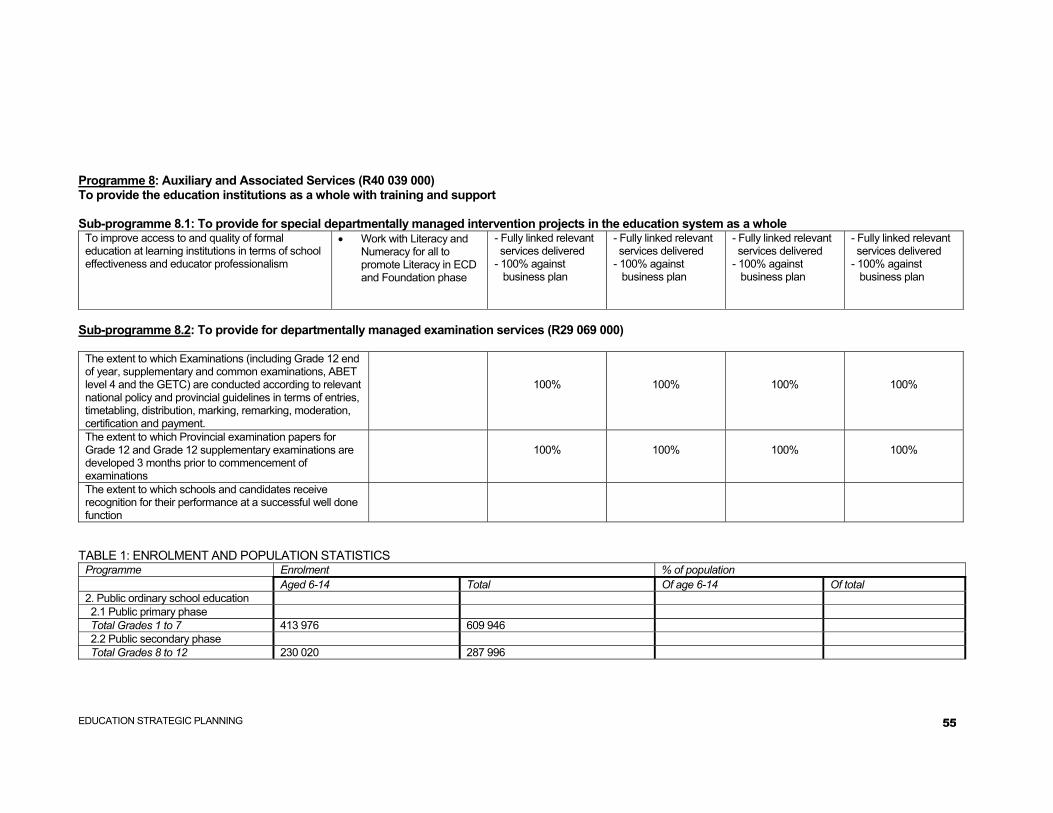
EDUCATION STRATEGIC PLANNING 55
Programme 8: Auxiliary and Associated Services (R40 039 000) To provide the education institutions as a whole with training and support Sub-programme 8.1: To provide for special departmentally managed intervention projects in the education system as a whole
To improve access to and quality of formal education at learning institutions in terms of school effectiveness and educator professionalism
• Work with Literacy and Numeracy for all to promote Literacy in ECD and Foundation phase
- Fully linked relevant services delivered - 100% against business plan
- Fully linked relevant services delivered - 100% against business plan
- Fully linked relevant services delivered - 100% against business plan
- Fully linked relevant services delivered - 100% against business plan
Sub-programme 8.2: To provide for departmentally managed examination services (R29 069 000)
The extent to which Examinations (including Grade 12 end of year, supplementary and common examinations, ABET level 4 and the GETC) are conducted according to relevant national policy and provincial guidelines in terms of entries, timetabling, distribution, marking, remarking, moderation, certification and payment.
100%
100%
100%
100%
The extent to which Provincial examination papers for Grade 12 and Grade 12 supplementary examinations are developed 3 months prior to commencement of examinations
100%
100%
100%
100%
The extent to which schools and candidates receive recognition for their performance at a successful well done function
TABLE 1: ENROLMENT AND POPULATION STATISTICS
Programme Enrolment % of population Aged 6-14 Total Of age 6-14 Of total 2. Public ordinary school education 2.1 Public primary phase Total Grades 1 to 7 413 976 609 946 2.2 Public secondary phase Total Grades 8 to 12 230 020 287 996

EDUCATION STRATEGIC PLANNING 56
3. Independent school subsidies 8 422 4. Public special school education 3 265 Total for all schools FETs 5. Further Education and Training 5.1 Public institutions 5.2 Youth colleges 6. Adult Basic Education and Training 6.1 Public centres 6.2 Subsidies to private centres 7. Early Childhood Development Age 5 4815 0.65 7.1 Schools (Age 6 & 7) 17 241 0.28 7.2 Gr R in community centres 7 398 0.49 7.1 Pre-Grade R 12 819 Total for all programmes
TABLE 2: NUMBER OF INSTITUTIONS
Programme Public institutions Subsidised private institutions Non-subsidised private institutions
Total institutions
2. Public ordinary school education 2.1 Public primary phase 1 721 1 729 2.2 Public secondary phase 273 273 Combined schools 93 93 3. Independent school subsidies 42 25 67 4. Public special school education 40 5. Further Education and Training 5.1 Public institutions 14 5.2 Youth colleges 6. Adult Basic Education and Training 6.1 Public centres 199 6.2 Subsidies to private centres 4 7. Early Childhood Development 7.1 Schools 342 342 7.2 Gr R in community centres 326 7.1 Pre-Grade R 348 Total for all programmes

EDUCATION STRATEGIC PLANNING 57
TABLE 3: RESOURCING EFFECTED VIA THE POST PROVISIONING NORMS
Programmes/Purpose of posts PL1 PL2 PL3 PL4 Total educator
posts Learners/ FTEs L:E ratio
Posts top-sliced before model is run Posts distributed by model 2. Public ordinary school education 2.1 Public primary phase 10 280 1440 485 334 Posts attached to schools Posts not attached to schools Curriculum redress posts … 2.2 Public secondary phase 6 399 1 289 410 226 Posts attached to schools Posts not attached to schools 21 Curriculum redress posts 200 … 4. Public special school education 305 71 21 6 5. Further Education and Training
TABLE 4: NUMBER OF EMPLOYEES
Programme Educators Public servants Other public employees Total employees 1. Administration 1.1 Office of the MEC
…all programmes and sub-programmes to be included… 8.3 Special projects 8.4 External examinations Total for all programmes

EDUCATION STRATEGIC PLANNING 58
TABLE 5: ABSOLUTE SPREAD ACROSS ECONOMIC CATEGORIES
Current expenditure (R 000)
Personnel
Programme
Educators Non-educators Non-personnel Total
Capital exp. (R 000)
Total (R 000)
1. Administration 1.1 Office of the MEC
…all programmes and sub-programmes to be included…
8.3 Special projects 8.4 External examinations Total for all programmes
TABLE 6: PROPORTIONAL SPREAD ACROSS ECONOMIC CATEGORIES
% current expenditure % personnel
Programme
% educators % non-educators % non-personnel % total
% capital exp.
% total
1. Administration 100% 1.1 Office of the MEC 100%
…all programmes and sub-programmes to be included…
8.3 Special projects 100% 8.4 External examinations 100% Total for all programmes 100% TABLE 7: RESOURCING EFFECTED VIA THE POST PROVISIONING NORMS Programmes/Purpose of posts PL1 PL2 PL3 PL4 Total educator posts Learners/ FTEs L:E ratio Posts top-sliced before model is run Posts distributed by model 2. Public ordinary school education 2.1 Public primary phase 19441 3066 766 1854 25127 897942 35.7 Posts attached to schools 12670 1818 489 1501 16478

EDUCATION STRATEGIC PLANNING 59
Posts not attached to schools 12670 1818 489 1501 16478 Curriculum redress posts … 2.2 Public secondary phase 6771 1248 277 353 8649 Posts attached to schools 6771 1248 277 353 8649 Posts not attached to schools Curriculum redress posts … 4. Public special school education 173 36 7 17 233 2793 11.9 5. Further Education and Training TABLE 8: EMPLOYMENT AND VACANCIES BY PROGRAMME
Programme Approved Establishment Number of Employees Vacancy Rate Additional (-) PROGRAMME 1 1 915 1 125 790 PROGRAMME 2 29 442 - 1 299 PROGRAMME 3 - - - PROGRAMME 4 762 516 246 PROGRAMME 5 71 58 13 PROGRAMME 6 533 294 239 PROGRAMME 7 14 14 0 SUBSTITUTE EDUCATOR 33 33 0 32 770 30 183 2 587

EDUCATION STRATEGIC PLANNING 60
TABLE 8(a)
HEAD OFFICE
STATUS OF PUBLIC SERVICE POSTS AS ON 20030115
PROG-GRAM
SR 15 T
SR 15 F
SR 15 V
SR 14 T
SR 14 F
SR 14 V
SR 13 T
SR 13 F
SR 13 V
SR 11-12 T
SR 11-12F
SR 11-12 V
SR 9-10 T
SR 9-10 F
SR 9-10 V
SR 7-8 T
SR 7-8 F
SR 7-8 V
SR 3-6 T
SR 3-6 F
SR 3-6 V
SR 1-2 T
SR 1-2 F
SR 1-2 V
T
P
Pr 1: Admin 1 1 0 4 4 0 11 9 2 18 10 8 38 12 26 114 48 66 179 106 73 36 17 19
TOTAL 1 1 0 4 4 0 11 9 2 18 10 8 38 12 26 114 48 66 179 106 73 36 17 19
NDEBELE C/E
STATUS OF PUBLIC SERVICE POSTS AS ON 20030115
PROGRAM SR 13 T
SR 13 F
SR 13 V
SR 11-
12 T
SR 11-12 F
SR 11-12 V
SR 9-
10 T
SR 9-
10 F
SR 9-10 V
SR 7-8 T
SR 7-8 F
SR 7-8 V
SR 3-6 T
SR 3-6 F
SR 3-6 V
SR 1-2 T
SR 1-2 F
SR 1-2 V
TOTAL POSTS

EDUCATION STRATEGIC PLANNING 61
Pr 5: Teacher Training 0 0 0 0 0 0 0 0 0 0 0 0 9 7 2 34 28 6 41
Totals 0 0 0 0 0 0 0 0 0 0 0 0 9 7 2 34 28 6 41
*College has been downsized in terms of curriculum, educators and students. We need final clarity on which of the above PS posts the College is still entitled to.
EASTVAAL REGION
STATUS OF PUBLIC SERVICE POSTS AS ON 20030115
PROGRAMME SR 13 T
SR 13 F
SR 13 V
SR 11-12 T
SR 11-12 F
SR 11-12 V
SR 9-10
T
SR 9-10
F
SR 9-10 V
SR 7-8 T
SR 7-8 F
SR 7-8 V
SR 3-6 T
SR 3-6 F
SR 3-6 V
SR 1-2 T
SR 1-2 F
SR 1-2 V
TOTAL POSTS
Pr 1: Regional Office 1 1 0 1 1 0 5 3 2 53 19 34 115 58 57 12 12 0 187
Pr 1: Circuit Offices (19) 0 0 0 0 0 0 0 0 0 19 1 18 38 37 1 38 18 20 95
PR 1: Teacher Centres (3) 0 0 0 0 0 0 0 0 0 0 0 0 3 0 3 3 1 2 6

EDUCATION STRATEGIC PLANNING 62
Pr 2: Public Ordinary Schools 0 0 0 0 0 0 0 0 0 0 0 0 311 247 64 784 540 244 1095
Pr 2: Public ECD Schools 0 0 0 0 0 0 0 0 0 0 0 0 1 1 0 10 10 0 11
Pr 4: Education In Special Schools 0 0 0 0 0 0 0 0 0 3 3 0 53 53 0 214 95 119 270
Pr 6: FET College Education 1 0 1 0 0 0 0 0 0 3 0 3 17 6 11 6 1 5 27
Pr 7: Non Formal Education 0 0 0 0 0 0 0 0 0 0 0 0 3 3 0 1 1 0 4
Totals 2 1 1 1 1 0 5 3 2 78 23 55 541 405 136 1068 678 390 1695
NKANGALA REGION
STATUS OF PUBLIC SERVICE POSTS AS ON 20030115
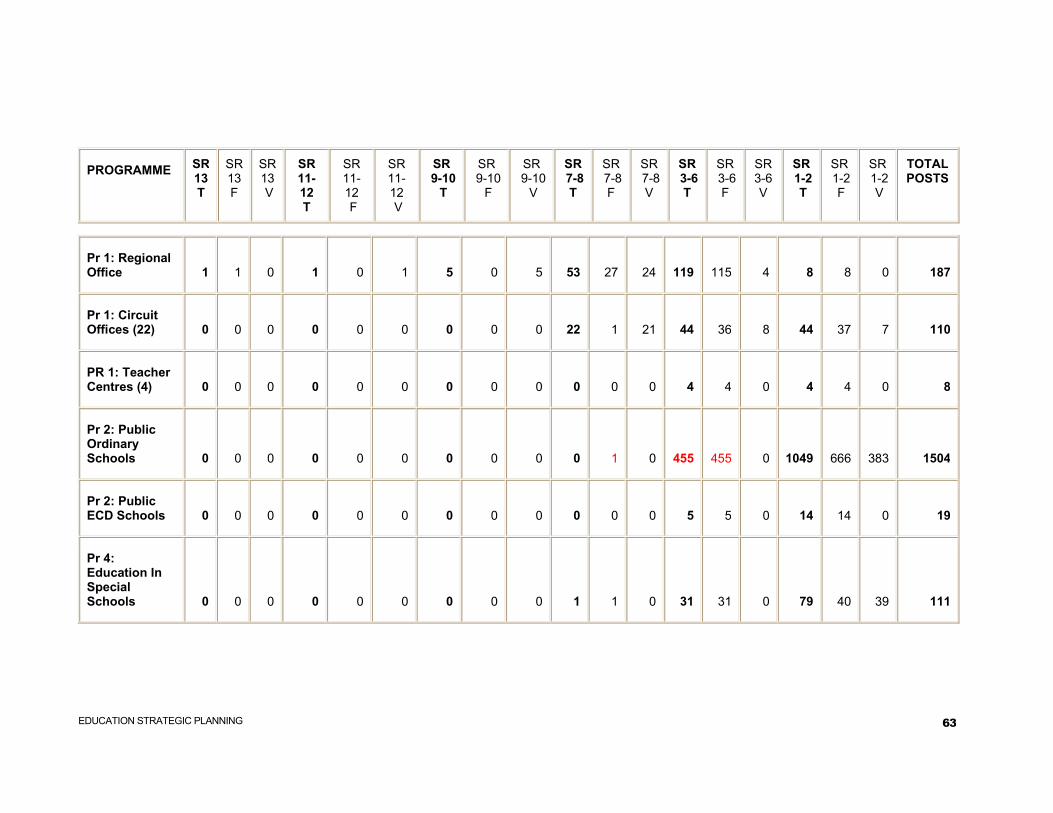
EDUCATION STRATEGIC PLANNING 63
PROGRAMME SR 13 T
SR 13 F
SR 13 V
SR 11-12 T
SR 11-12 F
SR 11-12 V
SR 9-10
T
SR 9-10
F
SR 9-10
V
SR 7-8 T
SR 7-8 F
SR 7-8 V
SR 3-6 T
SR 3-6 F
SR 3-6 V
SR 1-2 T
SR 1-2 F
SR 1-2 V
TOTAL POSTS
Pr 1: Regional Office 1 1 0 1 0 1 5 0 5 53 27 24 119 115 4 8 8 0 187
Pr 1: Circuit Offices (22) 0 0 0 0 0 0 0 0 0 22 1 21 44 36 8 44 37 7 110
PR 1: Teacher Centres (4) 0 0 0 0 0 0 0 0 0 0 0 0 4 4 0 4 4 0 8
Pr 2: Public Ordinary Schools 0 0 0 0 0 0 0 0 0 0 1 0 455 455 0 1049 666 383 1504
Pr 2: Public ECD Schools 0 0 0 0 0 0 0 0 0 0 0 0 5 5 0 14 14 0 19
Pr 4: Education In Special Schools 0 0 0 0 0 0 0 0 0 1 1 0 31 31 0 79 40 39 111
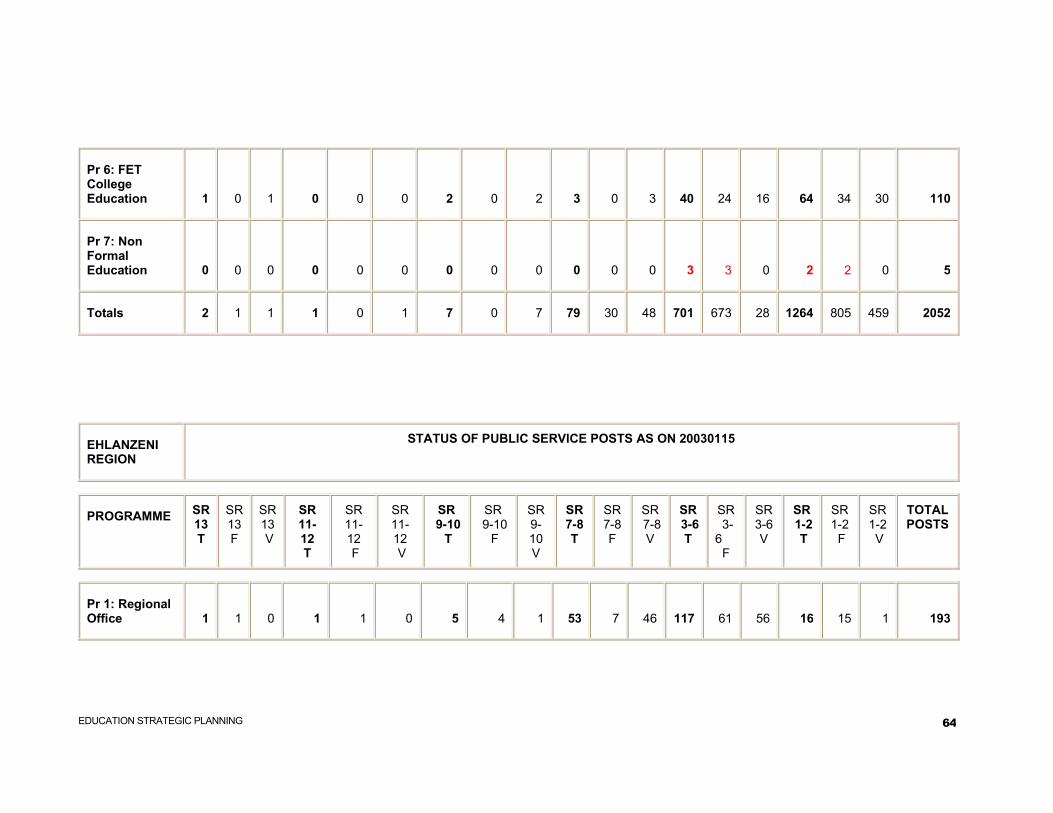
EDUCATION STRATEGIC PLANNING 64
Pr 6: FET College Education 1 0 1 0 0 0 2 0 2 3 0 3 40 24 16 64 34 30 110
Pr 7: Non Formal Education 0 0 0 0 0 0 0 0 0 0 0 0 3 3 0 2 2 0 5
Totals 2 1 1 1 0 1 7 0 7 79 30 48 701 673 28 1264 805 459 2052
EHLANZENI REGION
STATUS OF PUBLIC SERVICE POSTS AS ON 20030115
PROGRAMME SR 13 T
SR 13 F
SR 13 V
SR 11-12 T
SR 11-12 F
SR 11-12 V
SR 9-10
T
SR 9-10
F
SR 9-10 V
SR 7-8 T
SR 7-8 F
SR 7-8 V
SR 3-6 T
SR 3-6
F
SR 3-6 V
SR 1-2 T
SR 1-2 F
SR 1-2 V
TOTAL POSTS
Pr 1: Regional Office 1 1 0 1 1 0 5 4 1 53 7 46 117 61 56 16 15 1 193
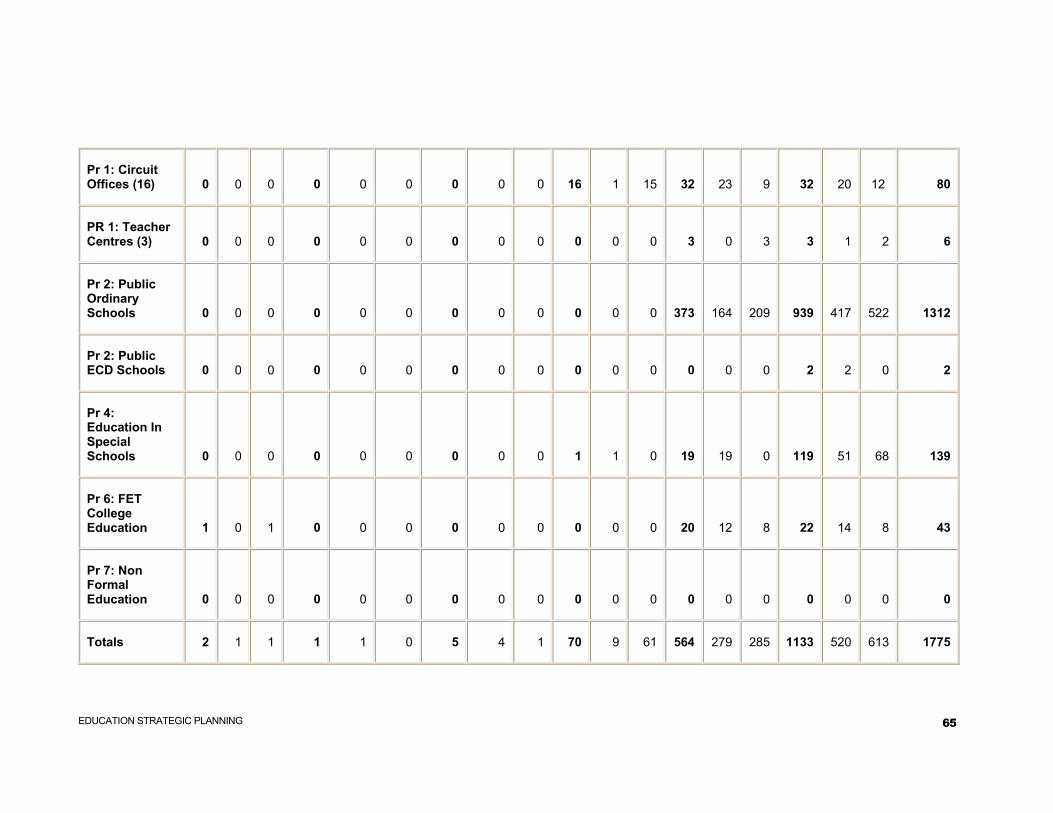
EDUCATION STRATEGIC PLANNING 65
Pr 1: Circuit Offices (16) 0 0 0 0 0 0 0 0 0 16 1 15 32 23 9 32 20 12 80
PR 1: Teacher Centres (3) 0 0 0 0 0 0 0 0 0 0 0 0 3 0 3 3 1 2 6
Pr 2: Public Ordinary Schools 0 0 0 0 0 0 0 0 0 0 0 0 373 164 209 939 417 522 1312
Pr 2: Public ECD Schools 0 0 0 0 0 0 0 0 0 0 0 0 0 0 0 2 2 0 2
Pr 4: Education In Special Schools 0 0 0 0 0 0 0 0 0 1 1 0 19 19 0 119 51 68 139
Pr 6: FET College Education 1 0 1 0 0 0 0 0 0 0 0 0 20 12 8 22 14 8 43
Pr 7: Non Formal Education 0 0 0 0 0 0 0 0 0 0 0 0 0 0 0 0 0 0 0
Totals 2 1 1 1 1 0 5 4 1 70 9 61 564 279 285 1133 520 613 1775

EDUCATION STRATEGIC PLANNING 66
GRAND TOTALS
STATUS OF PUBLIC SERVICE POSTS AS ON 20030115
ALL
SR 15 T
SR 15 F
SR 15 V
SR 14 T
SR 14 F
SR 14 V
SR 13 T
SR 13 F
SR 13 V
SR 11-12 T
SR 11-12F
SR 11-12 V
SR 9-10 T
SR 9-10 F
SR 9-10 V
SR 7-8 T
SR 7-8 F
SR 7-8 V
SR 3-6 T
SR 3-6 F
SR 3-6 V
SR 1-2 T
SR 1-2 F
SR 1-2 V
TOTAL POSTS
H/O 1 1 0 4 4 0 11 9 2 18 10 8 38 12 26 114 48 66 179 106 73 36 17 19 401
C/E 0 0 0 0 0 0 0 0 0 0 0 0 0 0 0 0 0 0 9 7 2 34 28 6 41
E/V 0 0 0 0 0 0 2 1 1 1 1 0 5 3 2 78 23 55 541 405 136 1068 678 390 1695
NKA 0 0 0 0 0 0 2 1 1 1 0 1 7 0 7 79 30 48 701 673 28 1264 805 459 2052
EHL 0 0 0 0 0 0 2 1 1 1 1 0 5 4 1 70 9 61 564 279 285 1133 520 613 1775
TOT 1 1 0 4 4 0 17 12 5 21 12 9 55 19 36 341 110 230 1994 1470 524 3535 2048 1487 5964
TABLE 8(b)

EDUCATION STRATEGIC PLANNING 67
HEAD OFFICE
STATUS OF PUBLIC SERVICE POSTS AS ON 20030115
PROG-GRAM
SR 15 T
SR 15 F
SR 15 V
SR 14 T
SR 14 F
SR 14 V
SR 13 T
SR 13 F
SR 13 V
SR 11-12 T
SR 11-12F
SR 11-12 V
SR 9-10 T
SR 9-10 F
SR 9-10 V
SR 7-8 T
SR 7-8 F
SR 7-8 V
SR 3-6 T
SR 3-6 F
SR 3-6 V
SR 1-2 T
SR 1-2 F
SR 1-2 V
T
P
Pr 1: Admin 1 1 0 4 4 0 11 9 2 18 10 8 38 12 26 114 48 66 179 106 73 36 17 19
TOTAL 1 1 0 4 4 0 11 9 2 18 10 8 38 12 26 114 48 66 179 106 73 36 17 19
NDEBELE C/E
STATUS OF PUBLIC SERVICE POSTS AS ON 20030115
PROGRAM SR 13 T
SR 13 F
SR 13 V
SR 11-
12 T
SR 11-12 F
SR 11-12 V
SR 9-
10 T
SR 9-
10 F
SR 9-10 V
SR 7-8 T
SR 7-8 F
SR 7-8 V
SR 3-6 T
SR 3-6 F
SR 3-6 V
SR 1-2 T
SR 1-2 F
SR 1-2 V
TOTAL POSTS

EDUCATION STRATEGIC PLANNING 68
Pr 5: Teacher Training 0 0 0 0 0 0 0 0 0 0 0 0 9 7 2 34 28 6 41
Totals 0 0 0 0 0 0 0 0 0 0 0 0 9 7 2 34 28 6 41
*College has been downsized in terms of curriculum, educators and students. We need final clarity on which of the above PS posts the College is still entitled to.
EASTVAAL REGION
STATUS OF PUBLIC SERVICE POSTS AS ON 20030115
PROGRAMME SR 13 T
SR 13 F
SR 13 V
SR 11-12 T
SR 11-12 F
SR 11-12 V
SR 9-10
T
SR 9-10
F
SR 9-10 V
SR 7-8 T
SR 7-8 F
SR 7-8 V
SR 3-6 T
SR 3-6 F
SR 3-6 V
SR 1-2 T
SR 1-2 F
SR 1-2 V
TOTAL POSTS
Pr 1: Regional Office 1 1 0 1 1 0 5 3 2 53 19 34 115 58 57 12 12 0 187
Pr 1: Circuit Offices (19) 0 0 0 0 0 0 0 0 0 19 1 18 38 37 1 38 18 20 95
PR 1: Teacher Centres (3) 0 0 0 0 0 0 0 0 0 0 0 0 3 0 3 3 1 2 6

EDUCATION STRATEGIC PLANNING 69
Pr 2: Public Ordinary Schools 0 0 0 0 0 0 0 0 0 0 0 0 311 247 64 784 540 244 1095
Pr 2: Public ECD Schools 0 0 0 0 0 0 0 0 0 0 0 0 1 1 0 10 10 0 11
Pr 4: Education In Special Schools 0 0 0 0 0 0 0 0 0 3 3 0 53 53 0 214 95 119 270
Pr 6: FET College Education 1 0 1 0 0 0 0 0 0 3 0 3 17 6 11 6 1 5 27
Pr 7: Non Formal Education 0 0 0 0 0 0 0 0 0 0 0 0 3 3 0 1 1 0 4
Totals 2 1 1 1 1 0 5 3 2 78 23 55 541 405 136 1068 678 390 1695
NKANGALA REGION
STATUS OF PUBLIC SERVICE POSTS AS ON 20030115
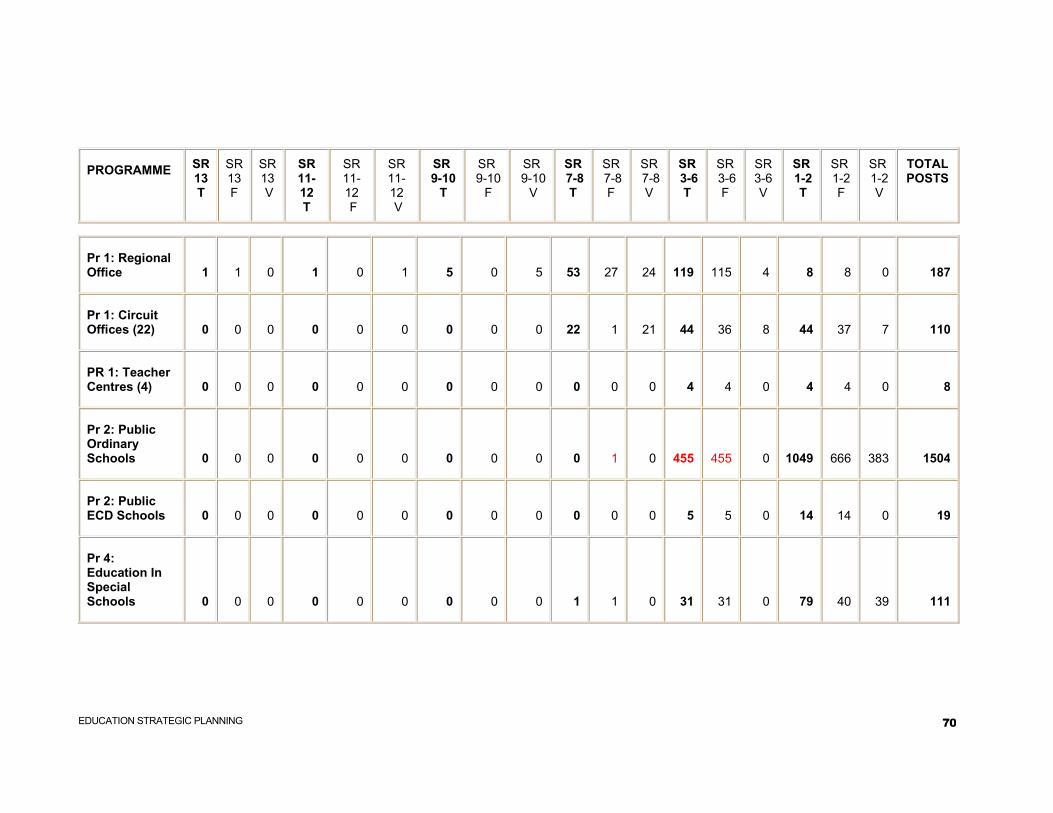
EDUCATION STRATEGIC PLANNING 70
PROGRAMME SR 13 T
SR 13 F
SR 13 V
SR 11-12 T
SR 11-12 F
SR 11-12 V
SR 9-10
T
SR 9-10
F
SR 9-10
V
SR 7-8 T
SR 7-8 F
SR 7-8 V
SR 3-6 T
SR 3-6 F
SR 3-6 V
SR 1-2 T
SR 1-2 F
SR 1-2 V
TOTAL POSTS
Pr 1: Regional Office 1 1 0 1 0 1 5 0 5 53 27 24 119 115 4 8 8 0 187
Pr 1: Circuit Offices (22) 0 0 0 0 0 0 0 0 0 22 1 21 44 36 8 44 37 7 110
PR 1: Teacher Centres (4) 0 0 0 0 0 0 0 0 0 0 0 0 4 4 0 4 4 0 8
Pr 2: Public Ordinary Schools 0 0 0 0 0 0 0 0 0 0 1 0 455 455 0 1049 666 383 1504
Pr 2: Public ECD Schools 0 0 0 0 0 0 0 0 0 0 0 0 5 5 0 14 14 0 19
Pr 4: Education In Special Schools 0 0 0 0 0 0 0 0 0 1 1 0 31 31 0 79 40 39 111

EDUCATION STRATEGIC PLANNING 71
Pr 6: FET College Education 1 0 1 0 0 0 2 0 2 3 0 3 40 24 16 64 34 30 110
Pr 7: Non Formal Education 0 0 0 0 0 0 0 0 0 0 0 0 3 3 0 2 2 0 5
Totals 2 1 1 1 0 1 7 0 7 79 30 48 701 673 28 1264 805 459 2052
EHLANZENI REGION
STATUS OF PUBLIC SERVICE POSTS AS ON 20030115
PROGRAMME SR 13 T
SR 13 F
SR 13 V
SR 11-12 T
SR 11-12 F
SR 11-12 V
SR 9-10
T
SR 9-10
F
SR 9-10 V
SR 7-8 T
SR 7-8 F
SR 7-8 V
SR 3-6 T
SR 3-6
F
SR 3-6 V
SR 1-2 T
SR 1-2 F
SR 1-2 V
TOTAL POSTS
Pr 1: Regional Office 1 1 0 1 1 0 5 4 1 53 7 46 117 61 56 16 15 1 193
Pr 1: Circuit Offices (16) 0 0 0 0 0 0 0 0 0 16 1 15 32 23 9 32 20 12 80

EDUCATION STRATEGIC PLANNING 72
PR 1: Teacher Centres (3) 0 0 0 0 0 0 0 0 0 0 0 0 3 0 3 3 1 2 6
Pr 2: Public Ordinary Schools 0 0 0 0 0 0 0 0 0 0 0 0 373 164 209 939 417 522 1312
Pr 2: Public ECD Schools 0 0 0 0 0 0 0 0 0 0 0 0 0 0 0 2 2 0 2
Pr 4: Education In Special Schools 0 0 0 0 0 0 0 0 0 1 1 0 19 19 0 119 51 68 139
Pr 6: FET College Education 1 0 1 0 0 0 0 0 0 0 0 0 20 12 8 22 14 8 43
Pr 7: Non Formal Education 0 0 0 0 0 0 0 0 0 0 0 0 0 0 0 0 0 0 0
Totals 2 1 1 1 1 0 5 4 1 70 9 61 564 279 285 1133 520 613 1775

EDUCATION STRATEGIC PLANNING 73
GRAND TOTALS
STATUS OF PUBLIC SERVICE POSTS AS ON 20030115
ALL
SR 15 T
SR 15 F
SR 15 V
SR 14 T
SR 14 F
SR 14 V
SR 13 T
SR 13 F
SR 13 V
SR 11-12 T
SR 11-12F
SR 11-12 V
SR 9-10 T
SR 9-10 F
SR 9-10 V
SR 7-8 T
SR 7-8 F
SR 7-8 V
SR 3-6 T
SR 3-6 F
SR 3-6 V
SR 1-2 T
SR 1-2 F
SR 1-2 V
TOTAL POSTS
H/O 1 1 0 4 4 0 11 9 2 18 10 8 38 12 26 114 48 66 179 106 73 36 17 19 401
C/E 0 0 0 0 0 0 0 0 0 0 0 0 0 0 0 0 0 0 9 7 2 34 28 6 41
E/V 0 0 0 0 0 0 2 1 1 1 1 0 5 3 2 78 23 55 541 405 136 1068 678 390 1695
NKA 0 0 0 0 0 0 2 1 1 1 0 1 7 0 7 79 30 48 701 673 28 1264 805 459 2052
EHL 0 0 0 0 0 0 2 1 1 1 1 0 5 4 1 70 9 61 564 279 285 1133 520 613 1775
TOT 1 1 0 4 4 0 17 12 5 21 12 9 55 19 36 341 110 230 1994 1470 524 3535 2048 1487 5964

EDUCATION STRATEGIC PLANNING 74
TABLE 9: RESOURCING EFFECTED VIA THE SCHOOL FUNDING NORMS
Programmes/Legal status/Poverty
quintiles Schools Total expenditure Learners Expenditure per learner
2. Public ordinary schooling education 1852 896611 Non-Section 21 schools 1679 795203 Quintile 1 (poorest) 538 173974 Quintile 2 370 170990 Quintile 3 294 172306 Quintile 4 295 166740 Quintile 5 (least poor) 182 111193 Section 21 schools 173 101408 Quintile 1 (poorest) 9 5175 Quintile 2 15 8363 Quintile 3 11 7131 Quintile 4 18 12548 Quintile 5 (least poor) 120 68191 Total for public quintile 1 Total for public quintile 2 Total for public quintile 3 Total for public quintile 4 Total for public quintile 5 3. Independent school subsidies 56 8422 Quintile 1 (poorest) Not ranked Quintile 2 Quintile 3 Quintile 4 Quintile 5 (least poor) Grand total

EDUCATION STRATEGIC PLANNING 75
TABLE 10: AGE-SPECIFIC ENROLMENT RATES FOR SCHOOLS
Learners Population Age-specific enrolment rate Public ordinary schools (PR 2) Independent
ordinary schools (PR 3)
Special schools (PR 4)
Age 6 36347 848 No breakdown In age group
No emis data
Age 7 74131 669 Age 8 75042 663 Age 9 76708 663 Age 10 78087 675 Age 11 78304 704 Age 12 75005 695 Age 13 76957 700 Age 14 73415 631 Age 15 71199 544 Age 16 68608 522 Age 17 62146 524 Age 18 51993 368 Total 897942 10691 3265 TABLE 11: CLASSROOMS AVAILABLE FOR PROGRAMME 2
Programme Learners Classrooms L:C ratio Classroom backlog 2.1 Public primary phase 561805 10476 53 2.2 Public secondary phase 336137 5490 61 Total for public ordinary schools 897942 15966 56

EDUCATION STRATEGIC PLANNING 76
TABLE 12: LEARNER-EDUCATOR RATIOS IN PROGRAMME 2 SCHOOLS
Learners Publicly employed educators
Public L:E Privately employed educators
Total educators Effective L:E ratio
2.1 Public primary phase No emis data Quintile 1 (poorest) Quintile 2 Quintile 3 Quintile 4 Quintile 5 (least poor) 2.2 Public secondary phase Quintile 1 (poorest) Quintile 2 Quintile 3 Quintile 4 Quintile 5 (least poor) TABLE 13: BREAKDOWN OF NON-PERSONNEL RECURRENT IN PROGRAMME 2
Budget Expenditure Programme Funding via SFN/
RTL Total non-pers.
recurrent % to SFN/ RTL Funding via SFN/ RTL Total non-pers.
recurrent % to SFN/ RTL
2.1 Public primary phase No emis data 2.2 Public secondary phase Total for public ordinary schools

EDUCATION STRATEGIC PLANNING 77
TABLE 14: PROGRAMME 2 ENROLMENT AND FLOW RATE DETAILS
Learners Repeaters Repeater rate Dropouts Dropout rate Grade 1 92719 9554 10.3 2874 3.1 Grade 2 78598 6202 7.9 1685 2.1 Grade 3 76375 6651 8.7 1691 2.2 Grade 4 78674 6694 8.5 1960 2.5 Grade 5 85824 7534 8.7 2864 3.3 Grade 6 78969 4869 6.1 2443 3.1 Grade 7 71763 2123 2.9 1396 1.9 Grade 8 73343 3898 5.3 1468 2.0 Grade 9 89117 11007 12.3 4511 5.1 Grade 10 70085 12020 17.1 5085 7.3 Grade 11 59996 11436 19.1 5008 8.4 Grade 12 42479 5915 13.9 9928 23.4 Total 897942 87903 9.8 40913 4.6 TABLE 15: EDUCATOR ATTENDANCE INDICATORS FOR PROGRAMME 2
Programme Educator working days Educators Potential working days Working days lost % days lost
2.1 Public primary phase 2.2 Public secondary phase Total for public ordinary schools TABLE 16: LEARNER ATTENDANCE INDICATORS FOR PROGRAMME 2
Programme Learner days Learners Potential learner days Learner days lost % days lost
2.1 Public primary phase 2.2 Public secondary phase Total for public ordinary schools

EDUCATION STRATEGIC PLANNING 78
FIGURE 1 – MEDIUM TERM REVENUES AND EXPENDITURES Table 4.2 Conditional grants: Department of Education : Vote 7 1999/00 2000/01 2001/02 2002/03 2003/04 2004/05 Actual Actual Est. MTEF MTEF R'000 Expenditure Expenditure Actual Voted Budget Budget Vote: 7 Financial Management and Quality Enhancement
6,548
9,233
20,753
16,375
17,112
18,139
HIV/AIDS - 228
7,108
10,366
8,570
9,119
Early Childhood Development - - 1,533
3,796
6,424
-
Flood Reconstruction - 4,600
5,361
15,000
8,000
-
Provincial Infrastructure - - 24,494
47,584
71,267
88,228
Vote: Vote: Vote: Vote: Provincial total
6,548
14,061
59,249
93,121
111,373
115,486 6. Summary of service delivery measures and indicators (budgeting for service delivery)
Table 6.1 Education outputs measures Number of schools Number of learners 2001/02 2002/03 2003/04 2004/05 2001/02 2002/03 Pre-primary school
8,814
8,861
8,897
8,926
144
145 Primary school
480,998
482,971
483,620
484,362
1,271
1,282 Secondary school
281,279
281,636
481,990
482,614
352
357 Special education
318
255
202
114
14
12 Combined
137,598
136,533
134,326
129,113
293
294 Technical college
5,161
5,250
5,525
6,003
12
12 Teacher Training
4
1
1
1
314
455 Non-formal
18,320
18,500
18,750
1,900
216
221
Other (specify) 100
109
117
138
4
4
4 REVENUE AND FINANCING The following sources of funding are used for the Vote
Table 4.1 Summary of revenue: (Department of Education) 1999/00 2000/01 2001/02 2002/03 2003/04 2004/05 2005/06 Actual Actual Actual Est. MTEF MTEF MTEF R'000 Expenditure Expenditure Expenditure Actual Budget Budget Budget

EDUCATION STRATEGIC PLANNING 79
Equitable Share 2,795,345 2,965,591 3,248,152 3,717,495 4,231,822 4,613,302 4,982,045 Conditional grants 14,016 31,044 59,250 98,924 112,356 116,488 123,746 Other(Specify) - - 23,531 70,000 103,764 107,755 183,343 Total Revenue 2,809,361 2,996,635 3,330,933 3,886,419 4,447,942 4,837,545 5,289,134
5 EXPENDITURE SUMMARY The MTEF baseline allocations for the period 2003/2004 to 2005/2006 are: Financial year 2003/2004: R 4,447,942,000 Financial year 2004/2005: R 4,837,942,000 Financial year 2005/2006: R 5,289,134,000
Table 5.1 Summary of expenditure and estimates: (Department of Education) 1999/00 2000/01 2001/02 2002/03 2003/04 2004/05 2005/06 Actual Actual Actual Est. MTEF MTEF MTEF R'000 Expenditure Expenditure Expenditure Actual Budget Budget Budget 1. Administration 134,290 158,332 232,909 290,445 354,971 426,143 472,312 2. Public Ordinary school Education 2,487,152 2,659,807 2,898,446 3,359,210 3,768,881 4,073,107 4,465,084 3. Independent School Education 8,165 11,441 5,477 8,449 8,956 9,493 10,063 4. Education in Specialised Schools 48,023 50,983 52,838 64,457 68,924 73,023 77,368 5. FET Further Education and Training 38,854 24,139 25,357 21,148 97,762 103,028 106,610 6. ABET 42,658 44,003 50,992 65,798 47,200 49,780 52,515 7. ECD Early Childhood Development 35,212 30,927 28,940 36,133 61,209 54,713 54,618 8. Auxiliary and associated services 15,007 17,003 35,974 40,779 40,039 48,258 50,564 Total: (Department of Education) 2,809,361 2,996,635 3,330,933 3,886,419 4,447,942 4,837,545 5,289,134
Table 5.2 Summary of expenditure and estimates: Department of Education : Vote 7 1999/00 2000/01 2001/02 2002/03 2003/04 2004/05 2005/06 Actual Actual Actual Est. MTEF MTEF MTEF R'000 Expenditure Expenditure Expenditure Actual Budget Budget Budget CURRENT Personnel 2,587,202 2,788,180 2,959,686 3,249,388 3,681,218 3,997,948 4,394,178 Transfers 17,157 24,621 19,545 32,354 126,803 158,629 180,542 Other Current 141,190 141,590 259,531 454,992 433,915 445,201 471,199 Total Current 2,745,549 2,954,391 3,238,762 3,736,734 4,241,936 4,601,778 5,045,919 CAPITAL Acquisition of capital Assets 63,812 42,244 92,171 149,685 206,006 235,767 243,215 Transfer Payment - - - - - - - Total Capital 63,812 42,244 92,171 149,685 206,006 235,767 243,215 Total standard item/GFS classification
2,809,361 2,996,635 3,330,933 3,886,419 4,447,942 4,837,545 5,289,134
Table 5.3 Summary of expenditure and estimates (standrd item classification): Vote 7 1999/00 2000/01 2001/02 2002/03 2003/04 2004/05 2005/06 Actual Actual Actual Est. MTEF MTEF MTEF R'000 Expenditure Expenditure Expenditure Actual Budget Budget Budget Personnel 2,587,203 2,788,180 2,959,686 3,249,388 3,681,218 3,997,948 4,394,178 Administrative Expenditure 31,883 38,368 61,584 50,215 113,754 118,375 125,680 Store and livestock Current 67,497 61,384 113,032 266,607 202,281 179,590 189,466
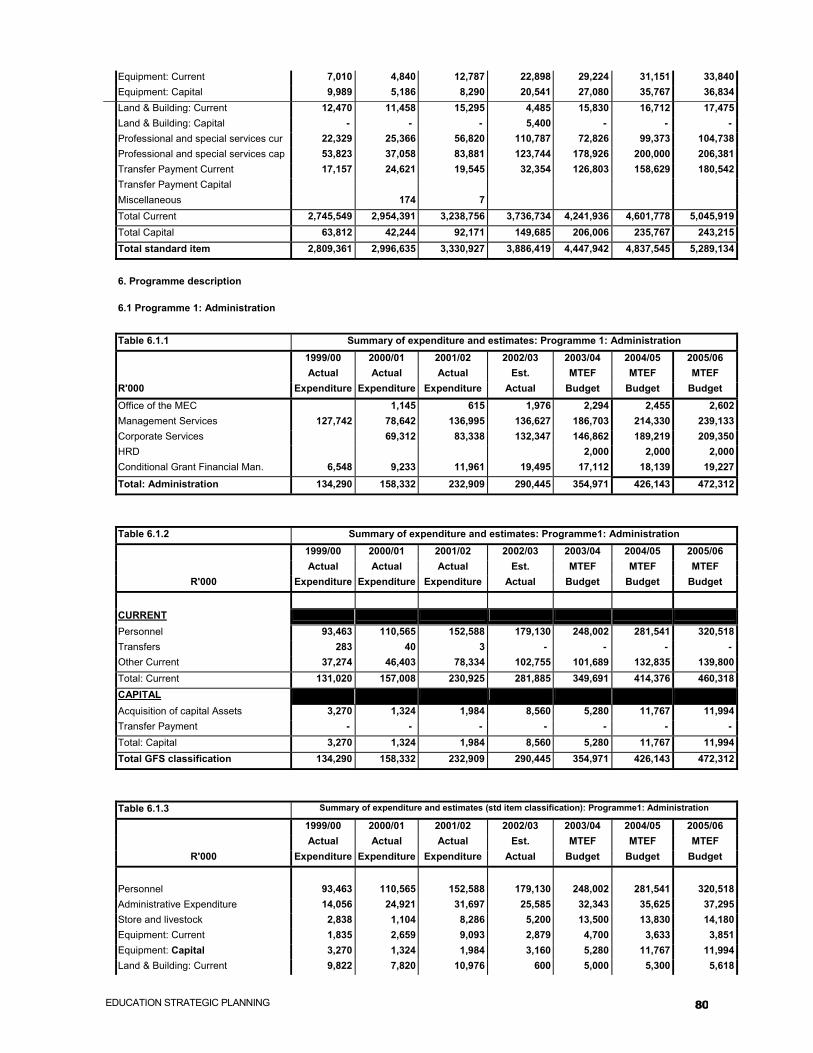
EDUCATION STRATEGIC PLANNING 80
Equipment: Current 7,010 4,840 12,787 22,898 29,224 31,151 33,840 Equipment: Capital 9,989 5,186 8,290 20,541 27,080 35,767 36,834 Land & Building: Current 12,470 11,458 15,295 4,485 15,830 16,712 17,475 Land & Building: Capital - - - 5,400 - - - Professional and special services cur 22,329 25,366 56,820 110,787 72,826 99,373 104,738 Professional and special services cap 53,823 37,058 83,881 123,744 178,926 200,000 206,381 Transfer Payment Current 17,157 24,621 19,545 32,354 126,803 158,629 180,542 Transfer Payment Capital Miscellaneous 174 7 Total Current 2,745,549 2,954,391 3,238,756 3,736,734 4,241,936 4,601,778 5,045,919 Total Capital 63,812 42,244 92,171 149,685 206,006 235,767 243,215 Total standard item 2,809,361 2,996,635 3,330,927 3,886,419 4,447,942 4,837,545 5,289,134 6. Programme description 6.1 Programme 1: Administration Table 6.1.1 Summary of expenditure and estimates: Programme 1: Administration 1999/00 2000/01 2001/02 2002/03 2003/04 2004/05 2005/06 Actual Actual Actual Est. MTEF MTEF MTEF R'000 Expenditure Expenditure Expenditure Actual Budget Budget Budget Office of the MEC 1,145 615 1,976 2,294 2,455 2,602 Management Services 127,742 78,642 136,995 136,627 186,703 214,330 239,133 Corporate Services 69,312 83,338 132,347 146,862 189,219 209,350 HRD 2,000 2,000 2,000 Conditional Grant Financial Man. 6,548 9,233 11,961 19,495 17,112 18,139 19,227 Total: Administration 134,290 158,332 232,909 290,445 354,971 426,143 472,312
Table 6.1.2 Summary of expenditure and estimates: Programme1: Administration 1999/00 2000/01 2001/02 2002/03 2003/04 2004/05 2005/06 Actual Actual Actual Est. MTEF MTEF MTEF R'000 Expenditure Expenditure Expenditure Actual Budget Budget Budget CURRENT Personnel 93,463 110,565 152,588 179,130 248,002 281,541 320,518 Transfers 283 40 3 - - - - Other Current 37,274 46,403 78,334 102,755 101,689 132,835 139,800 Total: Current 131,020 157,008 230,925 281,885 349,691 414,376 460,318 CAPITAL Acquisition of capital Assets 3,270 1,324 1,984 8,560 5,280 11,767 11,994 Transfer Payment - - - - - - - Total: Capital 3,270 1,324 1,984 8,560 5,280 11,767 11,994 Total GFS classification 134,290 158,332 232,909 290,445 354,971 426,143 472,312 Table 6.1.3 Summary of expenditure and estimates (std item classification): Programme1: Administration
1999/00 2000/01 2001/02 2002/03 2003/04 2004/05 2005/06 Actual Actual Actual Est. MTEF MTEF MTEF R'000 Expenditure Expenditure Expenditure Actual Budget Budget Budget Personnel 93,463 110,565 152,588 179,130 248,002 281,541 320,518 Administrative Expenditure 14,056 24,921 31,697 25,585 32,343 35,625 37,295 Store and livestock 2,838 1,104 8,286 5,200 13,500 13,830 14,180 Equipment: Current 1,835 2,659 9,093 2,879 4,700 3,633 3,851 Equipment: Capital 3,270 1,324 1,984 3,160 5,280 11,767 11,994 Land & Building: Current 9,822 7,820 10,976 600 5,000 5,300 5,618
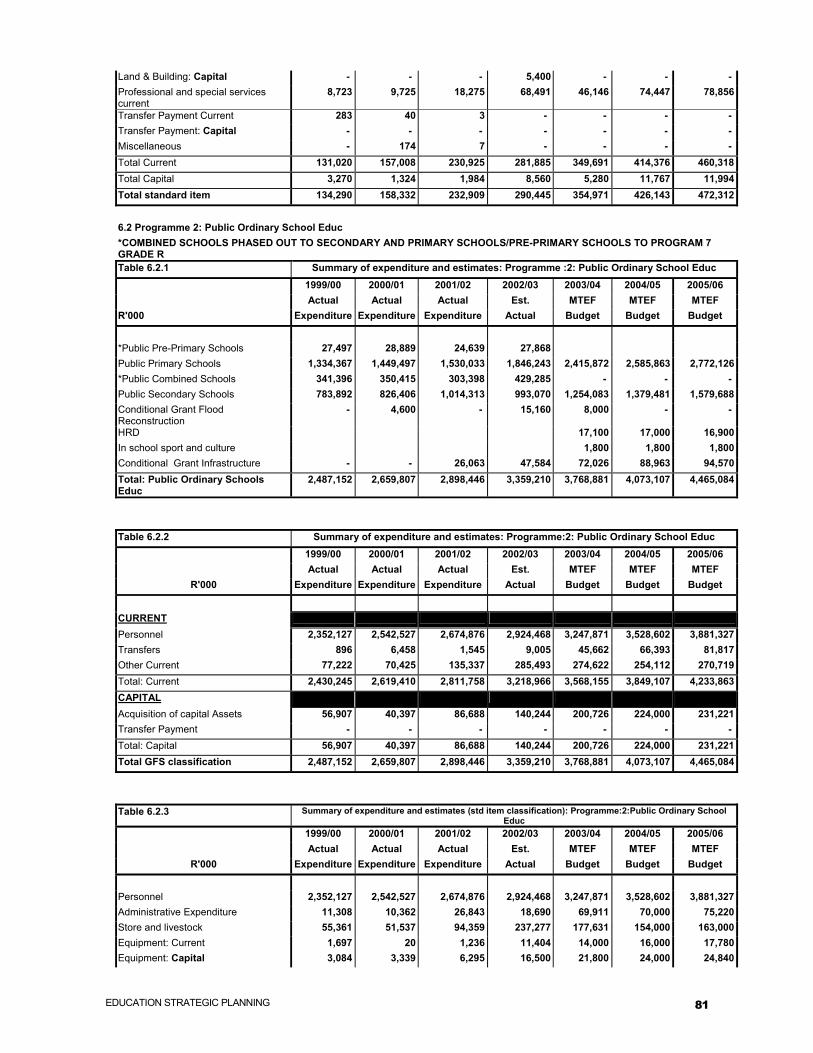
EDUCATION STRATEGIC PLANNING 81
Land & Building: Capital - - - 5,400 - - - Professional and special services current
8,723 9,725 18,275 68,491 46,146 74,447 78,856
Transfer Payment Current 283 40 3 - - - - Transfer Payment: Capital - - - - - - - Miscellaneous - 174 7 - - - - Total Current 131,020 157,008 230,925 281,885 349,691 414,376 460,318 Total Capital 3,270 1,324 1,984 8,560 5,280 11,767 11,994 Total standard item 134,290 158,332 232,909 290,445 354,971 426,143 472,312 6.2 Programme 2: Public Ordinary School Educ *COMBINED SCHOOLS PHASED OUT TO SECONDARY AND PRIMARY SCHOOLS/PRE-PRIMARY SCHOOLS TO PROGRAM 7 GRADE R
Table 6.2.1 Summary of expenditure and estimates: Programme :2: Public Ordinary School Educ 1999/00 2000/01 2001/02 2002/03 2003/04 2004/05 2005/06 Actual Actual Actual Est. MTEF MTEF MTEF R'000 Expenditure Expenditure Expenditure Actual Budget Budget Budget *Public Pre-Primary Schools 27,497 28,889 24,639 27,868 Public Primary Schools 1,334,367 1,449,497 1,530,033 1,846,243 2,415,872 2,585,863 2,772,126 *Public Combined Schools 341,396 350,415 303,398 429,285 - - - Public Secondary Schools 783,892 826,406 1,014,313 993,070 1,254,083 1,379,481 1,579,688 Conditional Grant Flood Reconstruction
- 4,600 - 15,160 8,000 - -
HRD 17,100 17,000 16,900 In school sport and culture 1,800 1,800 1,800 Conditional Grant Infrastructure - - 26,063 47,584 72,026 88,963 94,570 Total: Public Ordinary Schools Educ
2,487,152 2,659,807 2,898,446 3,359,210 3,768,881 4,073,107 4,465,084
Table 6.2.2 Summary of expenditure and estimates: Programme:2: Public Ordinary School Educ 1999/00 2000/01 2001/02 2002/03 2003/04 2004/05 2005/06 Actual Actual Actual Est. MTEF MTEF MTEF R'000 Expenditure Expenditure Expenditure Actual Budget Budget Budget CURRENT Personnel 2,352,127 2,542,527 2,674,876 2,924,468 3,247,871 3,528,602 3,881,327 Transfers 896 6,458 1,545 9,005 45,662 66,393 81,817 Other Current 77,222 70,425 135,337 285,493 274,622 254,112 270,719 Total: Current 2,430,245 2,619,410 2,811,758 3,218,966 3,568,155 3,849,107 4,233,863 CAPITAL Acquisition of capital Assets 56,907 40,397 86,688 140,244 200,726 224,000 231,221 Transfer Payment - - - - - - - Total: Capital 56,907 40,397 86,688 140,244 200,726 224,000 231,221 Total GFS classification 2,487,152 2,659,807 2,898,446 3,359,210 3,768,881 4,073,107 4,465,084 Table 6.2.3 Summary of expenditure and estimates (std item classification): Programme:2:Public Ordinary School
Educ 1999/00 2000/01 2001/02 2002/03 2003/04 2004/05 2005/06 Actual Actual Actual Est. MTEF MTEF MTEF R'000 Expenditure Expenditure Expenditure Actual Budget Budget Budget Personnel 2,352,127 2,542,527 2,674,876 2,924,468 3,247,871 3,528,602 3,881,327 Administrative Expenditure 11,308 10,362 26,843 18,690 69,911 70,000 75,220 Store and livestock 55,361 51,537 94,359 237,277 177,631 154,000 163,000 Equipment: Current 1,697 20 1,236 11,404 14,000 16,000 17,780 Equipment: Capital 3,084 3,339 6,295 16,500 21,800 24,000 24,840

EDUCATION STRATEGIC PLANNING 82
Land & Building: Current 750 1,324 2,231 1,485 8,080 8,612 8,889 Land & Building: Capital - - - - - - - Professional and special services cur 8,106 7,182 10,668 16,637 5,000 5,500 5,830 Professional and special services cap 53,823 37,058 80,393 123,744 178,926 200,000 206,381 Transfer Payment Current 896 6,458 1,545 9,005 45,662 66,393 81,817 Transfer Payment: Capital - - - - - - - Miscellaneous - - - - - - - Total Current 2,430,245 2,619,410 2,811,758 3,218,966 3,568,155 3,849,107 4,233,863 Total Capital 56,907 40,397 86,688 140,244 200,726 224,000 231,221 Total standard item 2,487,152 2,659,807 2,898,446 3,359,210 3,768,881 4,073,107 4,465,084 6.3 Programme 3: Independent School Educ
Table 6.3.1 Summary of expenditure and estimates: Programme:3: Independent School Educ 1999/00 2000/01 2001/02 2002/03 2003/04 2004/05 2005/06 Actual Actual Actual Est. MTEF MTEF MTEF R'000 Expenditure Expenditure Expenditure Actual Budget Budget Budget Independent Primary Schools 8,165 11,441 5,477 8,449 4,926 5,221 5,536 Independent Secondary Schools 4,030 4,272 4,527 Total: Independent School Educ 8,165 11,441 5,477 8,449 8,956 9,493 10,063
Table 6.3.2 Summary of expenditure and estimates: Programme :3: Independent School Educ 1999/00 2000/01 2001/02 2002/03 2003/04 2004/05 2005/06 Actual Actual Actual Est. MTEF MTEF MTEF R'000 Expenditure Expenditure Expenditure Actual Budget Budget Budget CURRENT Personnel Transfers 8,165 11,441 5,477 8,449 8,956 9,493 10,063 Other Current Total: Current 8,165 11,441 5,477 8,449 8,956 9,493 10,063 CAPITAL Acquisition of capital Assets Transfer Payment Total: Capital - - - - - - - Total GFS classification 8,165 11,441 5,477 8,449 8,956 9,493 10,063 Table 6.3.3 Summary of expenditure and estimates (std item classification): Programme 3 : Independent School Educ
1999/00 2000/01 2001/02 2002/03 2003/04 2004/05 2005/06 Actual Actual Actual Est. MTEF MTEF MTEF R'000 Expenditure Expenditure Expenditure Actual Budget Budget Budget Personnel - - - - - - - Administrative Expenditure - - - - - - - Store and livestock - - - - - - - Equipment: Current - - - - - - - Equipment: Capital - - - - - - - Land & Building: Current - - - - - - - Land & Building: Capital - - - - - - - Professional and special services cur - - - - - - - Transfer Payment Current 8,165 11,441 5,477 8,449 8,956 9,493 10,063 Transfer Payment: Capital - - - - - - - Miscellaneous - - - - - - - Total Current 8,165 11,441 5,477 8,449 8,956 9,493 10,063

EDUCATION STRATEGIC PLANNING 83
Total Capital - - - - - - - Total standard item 8,165 11,441 5,477 8,449 8,956 9,493 10,063 6.4 Programme 4: Education In Spec Schools
Table 6.4.1 Summary of expenditure and estimates: Programme 4 : Education In Spec Schools 1999/00 2000/01 2001/02 2002/03 2003/04 2004/05 2005/06 Actual Actual Actual Est. MTEF MTEF MTEF R'000 Expenditure Expenditure Expenditure Actual Budget Budget Budget Special Schools 48,023 50,983 52,838 64,457 68,324 72,423 76,768 HRD 600 600 600 Total: Education in Spec Scools 48,023 50,983 52,838 64,457 68,924 73,023 77,368
Table 6.4.2 Summary of expenditure and estimates: Programme 4: Education in Spec Schools 1999/00 2000/01 2001/02 2002/03 2003/04 2004/05 2005/06 Actual Actual Actual Est. MTEF MTEF MTEF R'000 Expenditure Expenditure Expenditure Actual Budget Budget Budget CURRENT Personnel 36,574 39,595 40,116 46,757 48,324 52,423 55,568 Transfers 5,782 6,190 5,663 7,500 20,000 20,000 21,200 Other Current 5,145 4,844 7,048 9,319 600 600 600 Total: Current 47,501 50,629 52,827 63,576 68,924 73,023 77,368 CAPITAL Acquisition of capital Assets 522 354 11 881 - - - Transfer Payment - - - - - - - Total: Capital 522 354 11 881 - - - Total GFS classification 48,023 50,983 52,838 64,457 68,924 73,023 77,368 Table 6.4.3 Summary of expenditure and estimates (std item classification): Programme 4: Education In Spec
Schools 1999/00 2000/01 2001/02 2002/03 2003/04 2004/05 2005/06 Actual Actual Actual Est. MTEF MTEF MTEF R'000 Expenditure Expenditure Expenditure Actual Budget Budget Budget Personnel 36,575 39,595 40,116 46,757 48,324 52,423 55,568 Administrative Expenditure 537 462 849 1,200 600 600 600 Store and livestock 2,735 2,682 4,069 4,500 - - - Equipment: Current 55 1 172 1,019 - - - Equipment: Capital 522 354 11 881 - - - Land & Building: Current - - - - - - - Land & Building: Capital - - - - - - - Professional and special services cur 1,817 1,699 1,952 2,600 - - - Professional and special services cap - - - - - - - Transfer Payment Current 5,782 6,190 5,663 7,500 20,000 20,000 21,200 Transfer Payment:Capital - - - - - - - Miscellaneous - - 6 - - - - Total Current 47,501 50,629 52,827 63,576 68,924 73,023 77,368 Total Capital 522 354 11 881 - - - Total standard item 48,023 50,983 52,838 64,457 68,924 73,023 77,368 6.5 Programme 5: FET(FURTHER EDUCATION AND TRAINING) * 2003/2004 ) Teachers Training and Technical Colleges changes to FET
Table 6.5.1 Summary of expenditure and estimates: Programme 5: FET (Further Education and Training)
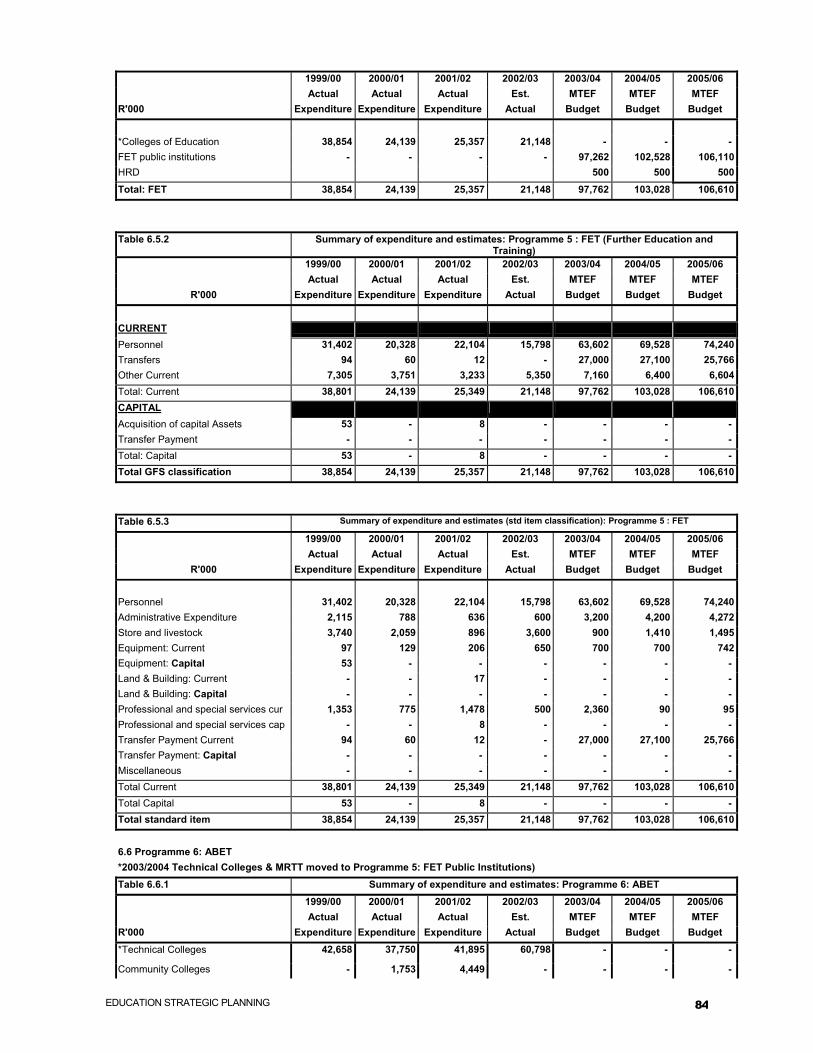
EDUCATION STRATEGIC PLANNING 84
1999/00 2000/01 2001/02 2002/03 2003/04 2004/05 2005/06 Actual Actual Actual Est. MTEF MTEF MTEF R'000 Expenditure Expenditure Expenditure Actual Budget Budget Budget *Colleges of Education 38,854 24,139 25,357 21,148 - - - FET public institutions - - - - 97,262 102,528 106,110 HRD 500 500 500 Total: FET 38,854 24,139 25,357 21,148 97,762 103,028 106,610
Table 6.5.2 Summary of expenditure and estimates: Programme 5 : FET (Further Education and Training)
1999/00 2000/01 2001/02 2002/03 2003/04 2004/05 2005/06 Actual Actual Actual Est. MTEF MTEF MTEF R'000 Expenditure Expenditure Expenditure Actual Budget Budget Budget CURRENT Personnel 31,402 20,328 22,104 15,798 63,602 69,528 74,240 Transfers 94 60 12 - 27,000 27,100 25,766 Other Current 7,305 3,751 3,233 5,350 7,160 6,400 6,604 Total: Current 38,801 24,139 25,349 21,148 97,762 103,028 106,610 CAPITAL Acquisition of capital Assets 53 - 8 - - - - Transfer Payment - - - - - - - Total: Capital 53 - 8 - - - - Total GFS classification 38,854 24,139 25,357 21,148 97,762 103,028 106,610
Table 6.5.3 Summary of expenditure and estimates (std item classification): Programme 5 : FET
1999/00 2000/01 2001/02 2002/03 2003/04 2004/05 2005/06 Actual Actual Actual Est. MTEF MTEF MTEF R'000 Expenditure Expenditure Expenditure Actual Budget Budget Budget Personnel 31,402 20,328 22,104 15,798 63,602 69,528 74,240 Administrative Expenditure 2,115 788 636 600 3,200 4,200 4,272 Store and livestock 3,740 2,059 896 3,600 900 1,410 1,495 Equipment: Current 97 129 206 650 700 700 742 Equipment: Capital 53 - - - - - - Land & Building: Current - - 17 - - - - Land & Building: Capital - - - - - - - Professional and special services cur 1,353 775 1,478 500 2,360 90 95 Professional and special services cap - - 8 - - - - Transfer Payment Current 94 60 12 - 27,000 27,100 25,766 Transfer Payment: Capital - - - - - - - Miscellaneous - - - - - - - Total Current 38,801 24,139 25,349 21,148 97,762 103,028 106,610 Total Capital 53 - 8 - - - - Total standard item 38,854 24,139 25,357 21,148 97,762 103,028 106,610 6.6 Programme 6: ABET *2003/2004 Technical Colleges & MRTT moved to Programme 5: FET Public Institutions)
Table 6.6.1 Summary of expenditure and estimates: Programme 6: ABET 1999/00 2000/01 2001/02 2002/03 2003/04 2004/05 2005/06 Actual Actual Actual Est. MTEF MTEF MTEF R'000 Expenditure Expenditure Expenditure Actual Budget Budget Budget *Technical Colleges 42,658 37,750 41,895 60,798 - - -
Community Colleges - 1,753 4,449 - - - -

EDUCATION STRATEGIC PLANNING 85
*MRTT - 4,500 4,648 5,000 - - - ABET Public Centres 46,000 48,580 51,315 HRD 1,200 1,200 1,200 Total: ABET 42,658 44,003 50,992 65,798 47,200 49,780 52,515
Table 6.6.2 Summary of expenditure and estimates: Programme 6: ABET 1999/00 2000/01 2001/02 2002/03 2003/04 2004/05 2005/06 Actual Actual Actual Est. MTEF MTEF MTEF R'000 Expenditure Expenditure Expenditure Actual Budget Budget Budget CURRENT Personnel 35,527 40,391 36,588 46,358 36,850 39,330 41,690 Transfers 1,844 364 6,845 7,400 - - - Other Current 2,227 3,079 4,120 12,040 10,350 10,450 10,825 Total: Current 39,598 43,834 47,553 65,798 47,200 49,780 52,515 CAPITAL Acquisition of capital Assets 3,060 169 3,439 - - - - Transfer Payment - - - - - - - Total: Capital 3,060 169 3,439 - - - - Total GFS classification 42,658 44,003 50,992 65,798 47,200 49,780 52,515
Table 6.6.3 Summary of expenditure and estimates (std item classification): Programme 6 : ABET
1999/00 2000/01 2001/02 2002/03 2003/04 2004/05 2005/06 Actual Actual Actual Est. MTEF MTEF MTEF R'000 Expenditure Expenditure Expenditure Actual Budget Budget Budget Personnel 35,527 40,391 36,588 46,358 36,850 39,330 41,690 Administrative Expenditure 117 104 115 390 1,800 1,850 1,889 Store and livestock 1,723 2,322 2,437 9,000 8,550 8,600 8,936 Equipment: Current 75 97 2 150 - - - Equipment: Capital 3,060 169 - - - - - Land & Building: Current - - - - - - - Land & Building: Capital - - - - - - - Professional and special services cur 312 556 1,566 2,500 - - - Professional and special services cap - - 3,439 - - - - Transfer Payment Current 1,844 364 6,845 7,400 - - - Transfer Payment: Capital - - - - - - - Miscellaneous - - - - - - - Total Current 39,598 43,834 47,553 65,798 47,200 49,780 52,515 Total Capital 3,060 169 3,439 - - - - Total standard item 42,658 44,003 50,992 65,798 47,200 49,780 52,515 6.7 Programme 7: ECD (Early Childhood Development) *FROM 2003/2004 ABET MOVED TO PROGRAMME 6
Table 6.7.1 Summary of expenditure and estimates: Programme 7: ECD (Early Childhood Development) 1999/00 2000/01 2001/02 2002/03 2003/04 2004/05 2005/06 Actual Actual Actual Est. MTEF MTEF MTEF R'000 Expenditure Expenditure Expenditure Actual Budget Budget Budget *ABET 35,212 30,927 28,940 36,133 Grade R in Public Schools 29,400 18,870 12,722 Pre grade R 25,185 35,643 41,696 Conditional Grant ECD 6,424 HRD 200 200 200 Total: ECD 35,212 30,927 28,940 36,133 61,209 54,713 54,618

EDUCATION STRATEGIC PLANNING 86
Table 6.7.2 Summary of expenditure and estimates: Programme 7 : ECD 1999/00 2000/01 2001/02 2002/03 2003/04 2004/05 2005/06 Actual Actual Actual Est. MTEF MTEF a R'000 Expenditure Expenditure Expenditure Actual Budget Budget Budget CURRENT Personnel 34,179 30,646 28,780 30,153 29,400 18,870 12,722 Transfers 80 54 - - 25,185 35,643 41,696 Other Current 953 227 160 5,980 6,624 200 200 Total: Current 35,212 30,927 28,940 36,133 61,209 54,713 54,618 CAPITAL Acquisition of capital Assets - - - - - - - Transfer Payment - - - - - - - Total: Capital - - - - - - - Total GFS classification 35,212 30,927 28,940 36,133 61,209 54,713 54,618
Table 6.7.3 Summary of expenditure and estimates (std item classification): Programme 7 :ECD
1999/00 2000/01 2001/02 2002/03 2003/04 2004/05 2005/06 Actual Actual Actual Est. MTEF MTEF MTEF R'000 Expenditure Expenditure Expenditure Actual Budget Budget Budget Personnel 34,179 30,646 28,780 30,153 29,400 18,870 12,722 Administrative Expenditure 897 183 111 550 200 200 200 Store and livestock 56 26 49 5,430 - - - Equipment: Current - - - - - - - Equipment: Capital - - - - - - - Land & Building: Current - - - - - - - Land & Building: Capital - - - - - - - Professional and special services cur - 18 - - 6,424 Professional and special services cap - - - - - - - Transfer Payment Current 80 54 - - 25,185 35,643 41,696 Transfer Payment: Capital - - - - - - - Miscellaneous - - - - - - - Total Current 35,212 30,927 28,940 36,133 61,209 54,713 54,618 Total Capital - - - - - - - Total standard item 35,212 30,927 28,940 36,133 61,209 54,713 54,618 6.8 Programme 8: AUXILIARY AND ASSOCIATED SERVICES *FROM 2003/2004 ECD MOVED TO PROGRAMME 7 Table 6.8.1 Summary of expenditure and estimates: Programme 8: Auxiliary ser 1999/00 2000/01 2001/02 2002/03 2003/04 2004/05 2005/06 Actual Actual Actual Est. MTEF MTEF MTEF R'000 Expenditure Expenditure Expenditure Actual Budget Budget Budget Payment to SETA 2,400 2,500 2,600 Conditional Grant HIV/AIDS - 228 1,065 11,356 8,570 9,119 9,949 External Examinations 15,007 16,775 34,909 24,094 29,069 36,639 38,015 *ECD 5,329 Total: Auxiliary Services 15,007 17,003 35,974 40,779 40,039 48,258 50,564
Table 6.8.2 Summary of expenditure and estimates: Programme 8 : Auxiliary ser 1999/00 2000/01 2001/02 2002/03 2003/04 2004/05 2005/06 Actual Actual Actual Est. MTEF MTEF MTEF

EDUCATION STRATEGIC PLANNING 87
R'000 Expenditure Expenditure Expenditure Actual Budget Budget Budget CURRENT Personnel 3,930 4,128 4,634 6,724 7,169 7,654 8,113 Transfers 13 14 - - - - - Other Current 11,064 12,861 31,299 34,055 32,870 40,604 42,451 Total: Current 15,007 17,003 35,933 40,779 40,039 48,258 50,564 CAPITAL Acquisition of capital Assets - - 41 - - - - Transfer Payment - - - - - - - Total: Capital - - 41 - - - - Total GFS classification 15,007 17,003 35,974 40,779 40,039 48,258 50,564
Table 6.8.3 Summary of expenditure and estimates (std item classification): Programme 8 : Auxiliary 1999/00 2000/01 2001/02 2002/03 2003/04 2004/05 2005/06 Actual Actual Actual Est. MTEF MTEF MTEF R'000 Expenditure Expenditure Expenditure Actual Budget Budget Budget Personnel 3,930 4,128 4,634 6,724 7,169 7,654 8,113 Administrative Expenditure 2,853 1,548 1,333 3,200 5,700 5,900 6,204 Store and livestock 1,044 1,654 2,936 1,600 1,700 1,750 1,855 Equipment: Current 3,251 1,934 2,078 6,796 9,824 10,818 11,467 Equipment: Capital - - - - - - - Land & Building: Current 1,898 2,314 2,071 2,400 2,750 2,800 2,968 Land & Building: Capital - - - - - - - Professional and special services cur 2,018 5,411 22,881 20,059 12,896 19,336 19,957 Professional and special services cap - - 41 - - - - Transfer Payment Current 13 14 - - - - - Transfer Payment: Capital - - - - - - - Miscellaneous - - - - - - - Total Current 15,007 17,003 35,933 40,779 40,039 48,258 50,564 Total Capital - - 41 - - - - Total standard item 15,007 17,003 35,974 40,779 40,039 48,258 50,564
Table 4.2 Departmental revenue collection: (Department of Education) 1999/00 2000/01 2001/02 2002/03 2003/04 2004/05 2005/06 Actual Actual Actual Est. MTEF MTEF MTEF R'000 Expenditure Expenditure Expenditure Actual Budget Budget Budget Current Revenue Tax revenue Non-tax revenue Interest - - 5,914 1,200 1,300 1,200 1,272 Loan Subsidised Transport 352 249 683 50 - - - Rent Official Housing 408 459 225 600 650 700 742 Levies for Persal Deduction 3,425 3,005 4,678 3,600 4,000 4,500 4,770 Exam Certficates 100 272 31 350 700 1,000 1,060 Dept Contract Debt 3,625 100 3,866 4,000 6,000 7,000 7,420 Rent of buildings - - 5 300 400 500 530 Miscellaneous Revenue - - 2,044 600 700 800 848 Other Nox Tax Revenue 336 99 2,191 500 600 700 742 Capital Revenue Sale of land and buildings Sale of stock, livestock, etc Other capital revenue (specify) Total provincially sourced revenue 8,246 4,184 19,637 11,200 14,350 16,400 17,384

EDUCATION STRATEGIC PLANNING 88
FIGURE 2 – SUMMARISED VERSION OF THE ORGANOGRAM
2/25/2003
UPDATED REVISED ORGANISATIONAL STRUCTURE FOR HEAD OFFICE AS ON 20021031 Page 1
PURPOSE/FUNCTION: (056089)The rendering of ministerial services to the MEC for Education
M EC SUPPORT OFFICE120000
1 x Deputy Director (Office M anager) 704051 x M edia Liason Officer (Parliamentary
O fficer) 704721 x Assistant Director (App. Secretary) 704061 x Sr/Secretary/Receptionist 70408/704071 x Sr/Registry Clerk 70410/704091 x Sr/Messenger/Driver 70412/70411
PROVINCIAL EDUCATIONAND TRAINING COUNCIL
DIRECTORATE:INTERNAL AUDIT
130000(page 4)
M PUM ALANGA DEPARTM ENT OF EDUCATION110000
PURPOSE: (054089)To ensure that all learners receive basic education and training of high quality
FUNCTIONS:1. Develop, evaluate and maintain policy, programmes and systems for general and further educationand training, including ABE Tand ECD.
2. Provide education policy, planning and development support services for the department.3. M anage and render corporate services.4. Render financial management services.5. Render internal audit services.6. Execute the requirements of the Public Finance Management Act pertaining to the responsibilities
of Accounting Officers..1 x Deputy D irector-General (Accounting Officer) 704011 x Assistant D irector (Office Manager) 70402 1 x Senior Secretary (SL 8) 70404/70403
CHIEF DIRECTORATE: G ENERAL-AND FURTHER EDUCATION
AND TRAINING 140000
CHIEF DIRECTORATE:SYSTEM S AND PLANNING
150000
CHIEF DIRECTORATE:CORPORATE SERVICES
160000
PURPOSE: (054089)To develop, evaluate and maintain policy,programmes and systems for general andfurther education and training, includingABET and ECD
FUNCTIONS:1.Develop, evaluate and maintain
policy, programmes and systems forgeneral education and training, including ABETand ECD.
2.Develop, evaluate and maintain policy, programmes and systems forfurther education and training.
3.Develop and maintain a quality assurance system and the management of systems concerning publicexaminations.
FUNCTIONS:1. Render services concerning the
strategic research and co-ordination ofmacro policy and planning processes, legislative services as well as projectsco-ordination.
2. Render integrated education resource planning and - management
information services.3. Develop human resources.4. Render communication - and related
services.5. Co-ordinate regions.
PURPOSE: (054089)To provide education policy, planning and development support services to thedepartment
PURPOSE: (056089)To ensure the development,planning, implementation,monitoring, assessment and co-ordination of policyand systems for the rendering of human resource management-,provisioning and logisticalmanagement- and legal services
FUNCTIONS:1. Render human resource
management services.2. Render provisioning- and
logistical management services.
3. Render legal services.
1. 3.2.
SUBDIRECTORATE:TRANSFORM ATION
110020(page 3)
CHIEF DIRECTORATE:FINANCIAL M ANAGEM ENT
170000
PURPOSE: (056089)To ensure the development, planning,implementation, monitoring, assessment and co-ordination of policy and systems forthe rendering of financial management
services
FUNCTIONS:1. Manage and render services i..r.o the
department’s budget and revenue,bookkeeping and system (BAS) control.
2. Manage and render services i..r.o the department’s general expenditure, salaries and salary accounts.
3. Assist the Accounting Offices indischarging all the duties allocated interms of the Public FinanceManagement
Act.
4.
DIVISION:SECURITY M ANAG EM ENT
110010(page 2)

EDUCATION STRATEGIC PLANNING 89
R E V IS E D R E G IO N A L O F F IC E S T R U C T U R E A S O N 20 03 01 01
P U R P O S E :T o ensu re tha t a ll lea rn e rs in the reg ion receive ba sic edu ca tion and tra in ing o f h igh quality
1 x D irector1 x A dm in O ffice r1 x S r/S ecreta ry (S /R 6 )
F U N C T IO N S :1 . M anage th e im p lem en ta tion and m a in tenan ce o f p olicy, p rog ram m es and s ys tem s fo r g en era l and fu rth e r
edu cation and tra in ing , in clud ing A B E T and E C D in the reg ion .2 . P rovid e in teg ra ted reg iona l edu cation res ou rce p lann ing -, h um an resou rce d evelopm en t-, lia is on - and
exam ination adm in is tra tion s ervices .3 . R end er co rp ora te s ervices fo r th e reg ion in a cco rdan ce w ith policy and d elega tions , in ord e r to p rovid e an
enab ling en vironm en t n ecessa ry fo r th e su ccessfu l d elive ry o f p ro fess ional support and services .4 . C o-o rd ina te th e e ffec tive m anag em en t o f tea ch er cen tres an d circu its .5 . O ve rsee th e overa ll p erfo rm an ce and a ch ievem en t o f th e reg ion and fa cilita te th e crea tion o f a condu cive
edu cationa l en vironm en t fo r p rodu ctive lea rn ing and tea ch ing and service d elivery. 6 . A ctively engag e in p olicy d evelopm en t to ensu re th e supp o rt o f th e reg ion in th e con tinu ous review o f p olicy
im pera tives and im p lem en ta tion th e reo f. 7 . Facilita te th e con tinu ous d evelopm en t o f s elf-m anag ing edu cationa l in s titu tions .8 . A ccoun t to th e D epu ty D irector- G en era l fo r a ll p olicy and finan cia l m anda tes o f th e reg ion .9 . C o-o rd ina te and m on itor tha t th e a lloca tion and u tilisa tion o f res ou rces in th e reg ion is cost e ffec tive and
ben e fits the in s titu tions equ itab ly. 10 . H and le o f a ll o fficia l com m un ica tions and pub lica tions .11 . R espond to an y com pla in ts or enqu iries re fe rred b y th e o ffice o f th e D eputy D irecto r-G en e ra l.12 E nsu re th e tran s fo rm a tion o f civil s ociety.
S U B D IR E C T O R A T E :C O R P O R A T E SE R V IC E S
S U B D IR E C T O R A T E :S Y S T E M S A N D
P L A N N IN G
S U B D IR E C T O R A T E :G E N E R A L A N D
F U R T H E R E D U C A T IO N A N D T R A IN IN G
1 32
P age 2
4
S U B D IR E C T O R A T E :T E A C H E R C E N T R E - A N D
C IR C U IT C O -O R D IN A T IO N
D IV IS IO N : T R A N SF O R M A T IO N
P U R P O S E :T o ensu re th e tran s fo rm a tion o f civil s ociety
F U N C T IO N S :1 . M onitor th e im p lem en ta tion o f
trans form a tion -, equ ity and g end er p lans .2 . In itia te p rojects and p rog ram m es a im ed a t th e
em p ow erm en t o f w om en .3 . Sensitise pa ren ts and the pub lic on th e s ta tu s
o f ch ild ren and th ei r righ ts .4 . P rom ote rep resen ta tion , recognition and
developm en t o f p ers ons w ith d isab ilities .5 . F acilita te tran s form a tion in th e w orkp la ce.6 . P rom ote g end er equa lity.7 . K eep relevan t s ta tis tics and records .8 . R end er adm in is tra tive supp ort s ervices .
1 x A ssis tan t D irecto r (S R 9 )1 x S r/A dm in C le rk(N ew func tions and pos ts w .e .f . 20021205)
FIGURE 3: ANALYSIS OF THE 2002 MATRIC RESULTS
Percentage
No. of schools
100%
21
90-99%
42
80-89% 18
70-79% 36
60-69% 45
50-59% 76
40-49% 61
30-39% 59
20-29% 39
10-19% 11
Schools that obtained
0-9% 1
Total number of schools 412