mpx corporate presentation_june
TRANSCRIPT

June 2012
MPX CORPORATE PRESENTATION
The material that follows is a presentation of general background information about MPX Energia S.A. and its subsidiaries (collectively, “MPX”
or the “Company ”) as of the date of the presentation. It is information in summary form and does not purport to be complete. No
representation or warranty, express or implied, is made concerning, and no reliance should be placed on, the accuracy, fairness, orcompleteness of this information.
This presentation may contain certain forward-looking statements and information relating to MPX that reflect the current views and/orexpectations of the Company and its management with respect to its performance, business and future events. Forward looking statementsinclude, without limitation, any statement that may predict, forecast, indicate or imply future results, performance or achievements, andmay contain words like “may”, “plan”, “believe”, “anticipate”, “expect”, “envisages”, “will likely result”, or any other words or phrases of similar
meaning. Such statements are subject to a number of risks, uncertainties and assumptions. We caution you that a number of importantfactors could cause actual results to differ materially from the plans, objectives, expectations, estimates and intentions expressed in thispresentation. In no event, neither the Company, any of its affiliates, directors, officers, agents or employees nor any of the placementagents shall be liable before any third party (including investors) for any investment or business decision made or action taken in reliance onthe information and statements contained in this presentation or for any consequential, special or similar damages.
This presentation does not constitute an offer, or invitation, or solicitation of an offer, to subscribe for or purchase any securities.
Neither this presentation nor anything contained herein shall form the basis of any contract or commitment whatsoever.
Recipients of this presentation are not to construe the contents of this summary as legal, tax or investment advice and recipients shouldconsult their own advisors in this regard.
The market and competitive position data, including market forecasts, used throughout this presentation were obtained from internalsurveys, market research, publicly available information and industry publications. Although we have no reason to believe that any of thisinformation or these reports are inaccurate in any material respect, we have not independently verified the competitive position, marketshare, market size, market growth or other data provided by third parties or by industry or other publications. MPX, the placement agentsand the underwriters do not make any representation as to the accuracy of such information.
This presentation and its contents are proprietary information and may not be reproduced or otherwise disseminated in whole or in partwithout MPX’s prior written consent.
DISCLAIMER
2

MPX AT A GLANCE
1

A PROVEN RECORD OF ACHIEVEMENT
4
IPO: US$ 1.1
billion raised
1,080 MW
contracted in the
A-5 Auction
2007 First acquisition of
mining rights in
Colombia
365 MW contracted in
the A-5 Auction
Construction works at
TPP Pecém I begin
2008 Construction works
at TPPs Itaqui and
Pecém II begin
Acquisition of
interest in 7 onshore
exploratory blocks in
the Parnaíba basin
2009
MPX Colombia – 1st
Technical Report:
coal resources of
144 MM tons
License granted for
TPP Parnaiba
(1,863 MW)
Initiation of drilling
campaign in the
Parnaíba basin
2010
TPP Parnaíba licensed
capacity increased to
3,722 MW
Power supply
contracts secured for
1,193 MW and
construction works at
TPP Parnaíba begin
D&M estimates for
risked resources in
the Parnaíba basin
amount to over 11Tcf
Declaration of
commerciality for 2
gas fields with
estimated production
of 6 MM m3/day
2011 MPX/E.ON
partnership
Drawdown of bridge-
loans totaling R$ 1.6
billion for natural
gas production and
power generation in
the Parnaíba Basin
Spin-off of
Colombian coal
assets to a new
company listed at
the BM&FBOVESPA
E.ON’s acquisition of
minority interest at
MPX through a R$
1.0 billion capital
increase
2012
4
The First Five Years

A DIVERSIFIED ENERGY COMPANY
Largest Portfolio Of Integrated Projects In South America
Açu TPP2,100 MW – Coal3,300 MW – Natural Gas
Amapari Energia23 MW
Itaqui TPP360 MW
Energia Pecém720 MW
Pecém II TPP365 MW
Solar Tauá1 MW
Parnaíba TPP1,531 MW
Exploratory blocks11.3 Tcf GN
Seival mine
Seival TPP600 MW
Sul TPP727 MW
Castilla TPP2,100 MW
Desalination Plant
740 l/s
Parnaíba TPP2,191 MW
JV
MPX
Power Generation
Power agreements secured for 3.0 GW
Environmental license for an additional 11 GW
Joint-Venture with leading global player E.ON AG
Natural Resources
Natural Gas: >11 Tcf of risked resources in the Parnaiba Basin
5

MPX OWNERSHIP STRUCTURE
6
EIKE BATISTA
Free Float
Contracted Power
Generation
Natural Resources
100% 50%
50%
Energia Pecém
(365 MW)
Pecém II
(365 MW)
Itaqui
(365 MW)
TPP Parnaíba
(1,087 MW)
Amapari
(12 MW)
Seival
OGX Maranhão
MPX- E.ON JV50/50
53.9% 11.7%34.3%
TPP Parnaíba
(1,534 MW)
Açu – Natural
Gas (3,300 MW)
Açu – Coal
(2,100 MW)
Castilla - Coal
(2,100 MW)
Sul and Seival -
Coal (1,327 MW)
Greenfield Thermal
Generation
50% 50%
50%
Supply & Trading
Renewables
New Projects
100%
(after conclusion of capital increase, assuming no subscription by minority shareholders)

EXPERIENCED MANAGEMENT TEAM TO EXECUTE ON
STRATEGIC VISION
Partner at Villemor Amaral Advogados (2002-2004) and Tozzini, Freire & Silva Advogados (2001-2002)
General Counsel at MMX Mineração e Metálicos S.A.
Legal Director at General Motors Corp. in Lisbon and Delphi Automotive Systems
Marcus Bernd TemkeCOO
Over 20 years of experience in operations at multinational corporations
COO at Rio Polímeros S.A.
Holds an MBA from COPPEAD-UFRJ
Over 25 years of experience in the financial area at multinational corporations
CFO at MMX Mineração e Metálicos S.A.
CFO at Unisys in Brazil and Germany
Eduardo KarrerCEO & IRO
Over 22 years of experience in a wide range of M&A and corporate finance transactions related to the natural
resources, electricity, sanitation and logistics sectors
CEO at El Paso Brasil Ltda.and Rio Polímeros S.A..
Executive manager for the Gas&Energy and International Markets divisions at Petrobrás
Rudolph IhnsCFO
Xisto Vieira FilhoOfficer for Regulatory Affairs & Commercialization
Former National Secretary for Energy
Coordinator of the Subcommittees for Electricity Studies of the Interconnected System and Secretary of National
Energy Policy Committee of Brazil
Chairman of the Board of Directors of CHESF and Eletrosul and Board member of Eletrobrás, Furnas, Cepel and
Grupo Rede
Former president of the National Committee of Cigré (Conference Internationale des Grand Réseaux Électriques)
Bruno ChevalierGeneral Counsel
7

INVESTMENT CONSIDERATIONS
2

Exposure to Brazil’s growing energy demand
Tax-advantaged thermal power plants coming on-line in 2012
Attractive monetization of natural gas resources
Robust pipeline of thermal projects to meet Brazil’s need for a more reliable
electric system
Joint-venture with E.ON to develop strong portfolio of energy assets while
unlocking value of Colombian coal assets
Experienced management team to execute on strategic vision
INVESTMENT CONSIDERATIONS
9

EXPOSURE TO BRAZIL’S GROWING ENERGY DEMAND
3
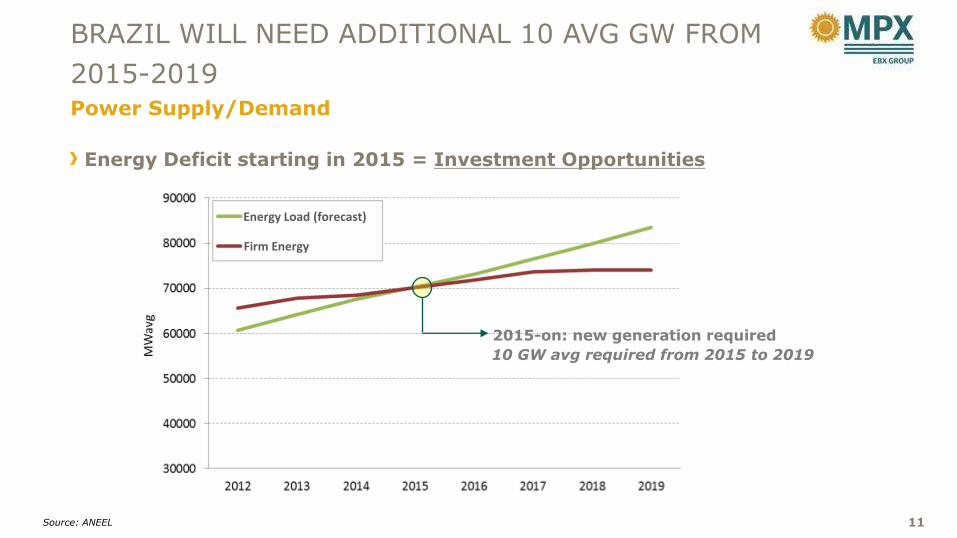
Energy Deficit starting in 2015 = Investment Opportunities
BRAZIL WILL NEED ADDITIONAL 10 AVG GW FROM
2015-2019Power Supply/Demand
Source: ANEEL 11
2015-on: new generation required
10 GW avg required from 2015 to 2019
Firm Energy
Energy Load (forecast)
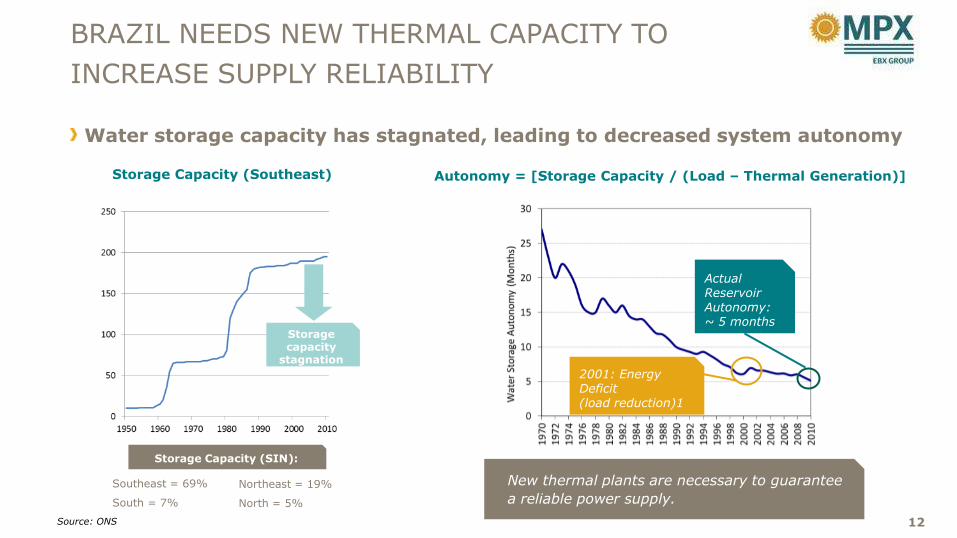
Water storage capacity has stagnated, leading to decreased system autonomy
BRAZIL NEEDS NEW THERMAL CAPACITY TO
INCREASE SUPPLY RELIABILITY
12Source: ONS
Storage Capacity (Southeast)
Storage Capacity (SIN):
Autonomy = [Storage Capacity / (Load – Thermal Generation)]
New thermal plants are necessary to guarantee
a reliable power supply.Northeast = 19%
North = 5%
Storage capacity
stagnation
Southeast = 69%
South = 7%
2001: Energy Deficit(load reduction)1
Actual Reservoir Autonomy: ~ 5 months

Transmission expansion delays will affect reliability of energy supply: greater
need for thermal plantes located close to power consumption centers
TRANSMISSION DELAYS REINFORCE THE
IMPORTANCE OF THERMAL PLANTS
13Source: ANEEL
Average delay = 1.2 year103 delays of up to 1 year100 delays greater than 1 year
TAX-ADVANTAGED THERMAL POWER PLANTS COMING ON-LINE STARTING IN 2012
4
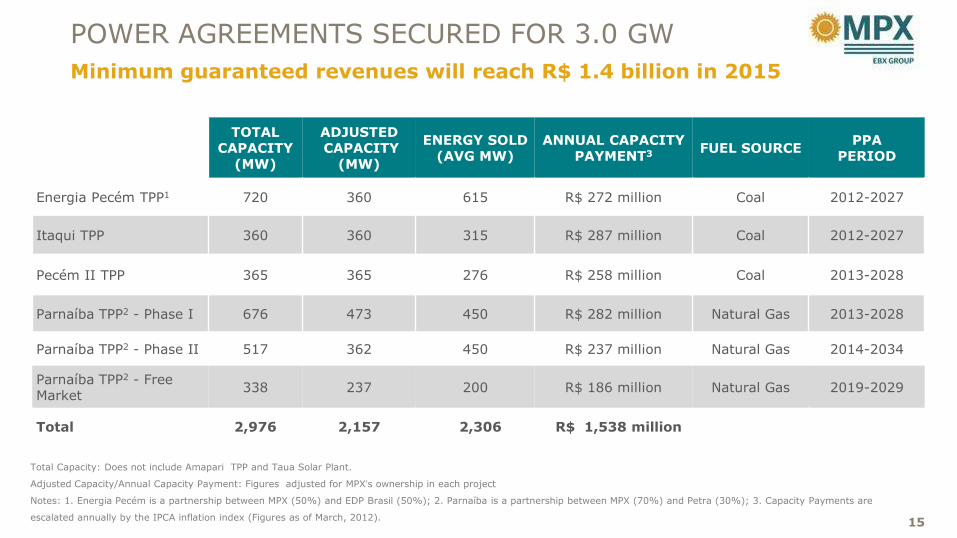
POWER AGREEMENTS SECURED FOR 3.0 GW
Minimum guaranteed revenues will reach R$ 1.4 billion in 2015
15
TOTAL CAPACITY
(MW)
ADJUSTEDCAPACITY
(MW)
ENERGY SOLD (AVG MW)
ANNUAL CAPACITY PAYMENT3 FUEL SOURCE
PPA PERIOD
Energia Pecém TPP1 720 360 615 R$ 272 million Coal 2012-2027
Itaqui TPP 360 360 315 R$ 287 million Coal 2012-2027
Pecém II TPP 365 365 276 R$ 258 million Coal 2013-2028
Parnaíba TPP2 - Phase I 676 473 450 R$ 282 million Natural Gas 2013-2028
Parnaíba TPP2 - Phase II 517 362 450 R$ 237 million Natural Gas 2014-2034
Parnaíba TPP2 - Free Market
338 237 200 R$ 186 million Natural Gas 2019-2029
Total 2,976 2,157 2,306 R$ 1,538 million
Total Capacity: Does not include Amapari TPP and Taua Solar Plant.
Adjusted Capacity/Annual Capacity Payment: Figures adjusted for MPX’s ownership in each project
Notes: 1. Energia Pecém is a partnership between MPX (50%) and EDP Brasil (50%); 2. Parnaíba is a partnership between MPX (70%) and Petra (30%); 3. Capacity Payments are
escalated annually by the IPCA inflation index (Figures as of March, 2012).

STEADY AND PREDICTABLE CASH FLOWS
16
Minimum Guaranteed Gross Revenues3
(MM)Installed Capacity (MW)
720
1,558
1,920
2012 2013 2014
Energia Pecém TPP 1
Itaqui TPP
Pecém II TPP
Parnaíba TPP2 – Phase I
Parnaíba TPP2 – Phase II
Figures adjusted considering MPX’s interest in each project
Notes: 1. TPP Energia Pecém is a partnership between MPX (50%) and EDP (50%); 2. TPP Parnaíba – Phases I and II are partnerships between MPX (70%) and Petra (30%); 3. Capacity
Payments are escalated annually by the IPCA inflation index (Figures as March, 2012).
182
1,113
1,2911,352
2012 2013 2014 2015

ENERGIA PECÉM TPP (720 MW)
Execution highlights
The plant is in the commissioning
phase
Coal conveyor belt already in
operation
Next steps:
Steam to turbine and Turbine no
load test
Synchronization and load tests
Commercial Operation
Estimated Remaining Capex until
completion*: R$ 199 million
17Energia Pecém is a partnership between MPX (50%) and EDP Brasil (50%)
* From April 2012

ITAQUI TPP (360 MW)
Execution highlights
Currently in hot commissioning
stage. First firing of the boiler has
been carried out
Turbine assembly completed
FGD (Flue Gas Desulfurization):
electrical and instrumentation tests
completed
Estimated Remaining Capex until
completion*: R$ 291 million
18* From April 2012

PECÉM II TPP (365 MW)
Execution highlights
The plant’s main equipment is in
the final stage of construction and
assembly
The coverage of the metal
structure in the turbine building
and the assembly of the surface
condenser are in the process of
being completed
Estimated Remaining Capex until
completion*: R$ 238 million
19* From April 2012

PARNAÍBA TPP – PHASES I (676 MW) & II (517 MW)Execution highlights
EPC contracts signed with Duro Felguera (Phase I)
and Initec Energia (Phase II)
Implementation initiated and site preparation advanced
3 turbines and 3 electrical generators on site and other 2 already shipped to Brazil
Partnership with GE ensures timely equipment supply
Estimated Remaining Capex until completion*:
Phase I: R$ 644 million
Phase II: R$ 1,063 million
R$ 1,375 million in bridge-loans disbursed to fund
Phase I and Phase II.
20* From April 2012

ATTRACTIVE MONETIZATION OF NATURAL GAS RESOURCES
5

MPX OWNS 23% OF A UNIQUE ONSHORE NATURAL
GAS PORTFOLIO
Ownership Structure:
2 commercial production fields under development:
Gavião Real and Gavião Azul
Prospective risked resources surpass 11 Tcf (2.0 bi boe)
3 drill-rigs in operation and 3 seismic crews in the region
Exploratory campaign has identified 4 accumulations and
over 20 prospects
14 exploratory wells planned until the end of 2013 at a
cost of approximately US$ 15 MM per well 22
OGX MaranhãoBlocks
Total area:
24,500 km²
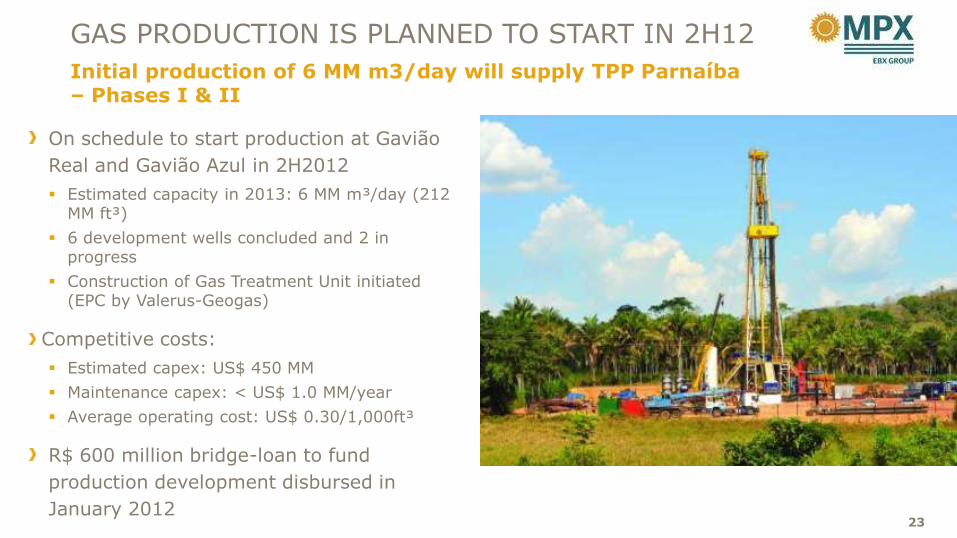
On schedule to start production at Gavião
Real and Gavião Azul in 2H2012
Estimated capacity in 2013: 6 MM m³/day (212 MM ft³)
6 development wells concluded and 2 in progress
Construction of Gas Treatment Unit initiated (EPC by Valerus-Geogas)
Competitive costs:
Estimated capex: US$ 450 MM
Maintenance capex: < US$ 1.0 MM/year
Average operating cost: US$ 0.30/1,000ft³
R$ 600 million bridge-loan to fund
production development disbursed in
January 2012
GAS PRODUCTION IS PLANNED TO START IN 2H12
Initial production of 6 MM m3/day will supply TPP Parnaíba– Phases I & II
23

Thermal power plant located at <
2km from gas fields
2.2 GW licensed and still uncontractedcould demand further 11 MM m3/day
Inexpensive connection to the electrical grid
Limited competition in natural gas
Tax-advantaged region can attract
industrial investments with gas is
available
ATTRACTIVE OPPORTUNITIES TO MONETIZE
ADDITIONAL PRODUCTION
Efficient Integration of Natural Gas Resources with Energy Production
24

JOINT-VENTURE WITH E.ON TO DEVELOP ROBUST PIPELINE OF THERMAL PROJECTS
6

MPX and E.ON AG* recently formed a 50/50 joint-venture to develop a strong portfolio of energy
assets in Brazil and Chile
E.ON has committed to support MPX’s investment needs at the JV, at E.ON’s cost of equity in
Brazil, to expedite the development of the power generation projects of the JV
MPX is in the process of raising R$1.0 billion through a capital increase
E.ON should acquire a 10% equity interest in MPX through a capital investment of R$ 850 million
If minority shareholders do not exercise their preemptive rights, E.ON has committed to subscribe up to R$ 1.0 billion, equivalent to an 11.7% equity interest in the company
CREATING VALUE THROUGH JOINT-VENTURE
WITH E.ON
Leveraging Strong Complementary Capabilities to Enhance Growth
26
(*) E.ON has one of the broadest and most diverse power and gas asset bases in Europe.
Installed Capacity: 69 GW
2011 Traded Volumes: 2,000 billion kWh of power / 2,500 billion kWh of gas / 600 million tons of carbon / 300 million tons of coal
2011 Figures : Cash Position: EUR 6,610 million / Total assets: EUR 152,872 million / Sales: EUR 112,954 million

MPX E.ON JOINT VENTURE
27
50%
MPX- E.ON JV50/50
Greenfield Thermal
Generation
50%
Supply & Trading
Renewables New Projects
11GW in greenfield licensed
thermal capacity
50% 100% 100% 100%
340 MW in greenfield wind
generation projects

FUTURE GROWTH OPPORTUNITIESMPX is positioned for leadership in the Brazilian and Chilean energy markets
CURRENT THERMAL PIPELINE
TOTAL CAPACITY
(MW)
ADJUSTEDCAPACITY
(MW)FUEL SOURCE
Parnaíba1 2,191 1,534 Natural Gas
Açu 3,300 3,300 Natural Gas
Açu 2,100 2,100 Coal
Castilla (Chile) 2,100 2,100 Coal
Sul and Seival 1,327 1,327 Coal
Jandaíra 140 140 Wind
Pontal 200 200 Wind
Total 11,358 10,701
1 Parnaíba - partnership between MPX (70%) and Petra (30%)28

Integrated Project: Power Plant + Deep-Water Port
+ Desalination Plant
SIC: Central Interconnected System (90% of GDP &
92% of population)
Located 700 Km North of Santiago
Port concession and environmental license granted
Power plant capacity: 6 x 350 MW = 2,100 MW
Desalination plant capacity: 740 l/s
Strategically located in a region with significant
pent-up demand for energy and water
CASTILLA: 2.1 GW IN COAL-FIRED CAPACITY
IN CHILECastilla is the largest licensed greenfield power plant in the SIC
29

AÇU: A 5.4 GW GREENFIELD GENERATION COMPLEX
3.3 GW in gas-fired + 2.1 GW in coal-fired capacity located in Brazil’s load center
Located in one of the most important port-industrial complex in Latin America
Total capacity of 5,400 MW
Coal: 2,100 MW
Natural Gas: 3,300 MW
Located 150km from natural gas accumulations
discovered in the Campos Basin
The industries located within the Superport will
benefit from auto production sharing, which at
current prices represents a reduction in energy
costs by approximately 30%30

MPX Sul and MPX Seival:
Capacity: 727 MW + 600 MW
Fluidized Coal Bed technology
Lower emissions resulting from the mix burning of coal and wood chips
Seival Mine:
Partnership between MPX and Copelmi –one of Brazil’s largest coal miner
Operating License granted
152 MM tons in proven reserves and 459 MM tons in total resources
Located in a region with limited hydro
potential and transmission constraints.
SUL + SEIVAL: 1.3 GW INTEGRATED TO A
LIGNITE MINE Open-pit mine with low mining costs, located adjacent to the power plants, resulting in competitive fuel costs
31
João
Câmara
Complexos Eólicos
Ventos
RN
PROJECTCAPACITY
(MW)Load Factor
(%)
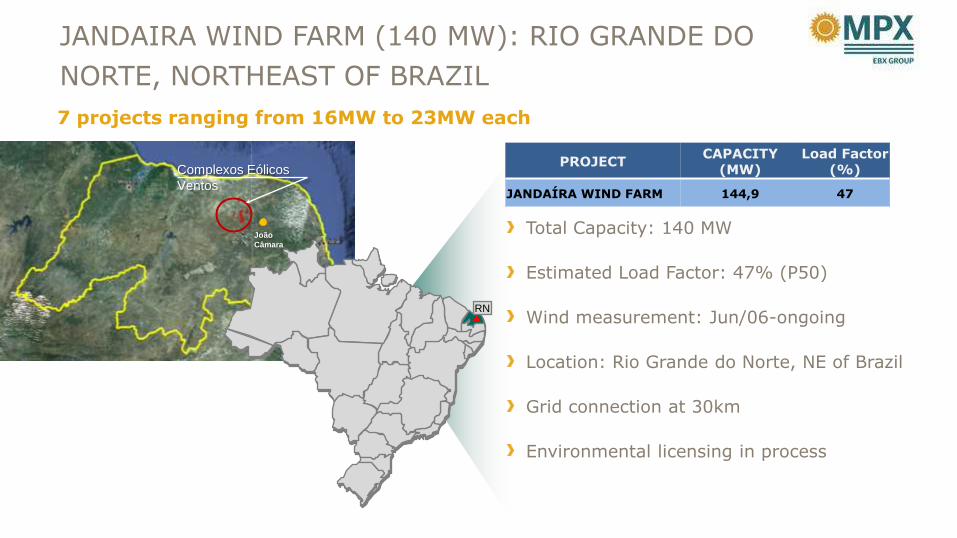
JANDAÍRA WIND FARM 144,9 47
JANDAIRA WIND FARM (140 MW): RIO GRANDE DO
NORTE, NORTHEAST OF BRAZIL
Total Capacity: 140 MW
Estimated Load Factor: 47% (P50)
Wind measurement: Jun/06-ongoing
Location: Rio Grande do Norte, NE of Brazil
Grid connection at 30km
Environmental licensing in process
7 projects ranging from 16MW to 23MW each

RS
PROJECTCAPACITY
(MW)Load Factor
(%)
PONTAL WIND FARM 200,0 43,0
PONTAL WIND FARM (200MW): RIO GRANDE DO
SUL, SOUTH OF BRAZIL
8 projects of 25MW each
Total Capacity: 200 MW
Estimated Load Factor: 42% (P50)
Wind measurement
50 meters: Apr/06-Mar/08
80 meters: Jun/10-ongoing
Location: Rio Grande do Sul, S of Brazil
Grid connection at 2 km
Preliminary license granted

FINANCIAL HIGHLIGHTS
7

ESTIMATED CAPEX
35
CAPEX (R$ Bi)
(Including 23.3% participation interest in gas onshore blocks in the Parnaíba Basin)
0.1
0.6
0.8
1.5 1.5
1.8
0.3
0.1
2007 2008 2009 2010 2011 2012E 2013E 2014E

Debt Maturity Profile**
(R$ million)
DEBT & CASH POSITION (end of 1Q12)
36
Consolidated Cash and Cash Equivalents: R$ 1,325.1 million
• R$ 694 million transferred to CCX
• Capital increase should be concluded by mid-July, adding R$ 1.0 billion to
total cash
Total Consolidated Gross Debt*: R$ 4,632 million
Short term: R$ 1,269 million
R$ 1,0 billion bridge loan to Parnaíba Phase I and II => to be paid-
off with draw down from long-term financing expected for 2H2012
Long term: R$ 3,363 million
Average amortization: 14 years
Average cost of debt: 9.75%
Average tenure: 6.1 years
Debt (R$ million)
** Values incorporate principal + capitalized interest + charges***R$ 823 million bridge loan to Parnaíba
1,269(27%)
3,363(73%)
Short Term Long Term
1,325.1
480.7
990.2
251.9 227.7
2,688.2
Cash & Cash Equivalents
2012 2013 2014 2015 From 2016 on
*Adjusted so as to exclude debt transferred to CCX before spin-off
***
