mr appearance of normal uterine endometrium considering title...
TRANSCRIPT
TitleMR appearance of normal uterine endometrium consideringmenstrual cycle: differentiation with benign and malignantendometrial lesions( Dissertation_全文 )
Author(s) Shitano, Fuki
Citation Kyoto University (京都大学)
Issue Date 2016-03-23
URL https://doi.org/10.14989/doctor.k19582
Right 許諾条件により本文は2017-01-18に公開
Type Thesis or Dissertation
Textversion ETD
Kyoto University

Acta Radiologica, 2016
MR appearance of normal uterine endometrium considering
menstrual cycle: differentiation with benign and malignant
endometrial lesions
Authors’ names
Fuki Shitano1, Aki Kido1, Masako Kataoka1, Koji Fujimoto1, Kayo Kiguchi1, Yasutaka
Fushimi1, Ikuo Konishi2, and Kaori Togashi1
Affiliation
1 Department of Diagnostic Imaging and Nuclear Medicine, Graduate School of
Medicine, Kyoto University, 54 Kawahara-cho Shogoin, Sakyo-ku, Kyoto, 606-8507,
Japan
2 Department of Gynecology and Obstetrics, Kyoto University Graduate School of
Medicine, 54 Kawahara-cho Shogoin, Sakyo-ku, Kyoto, 606-8507, Japan
Corresponding author’s name, address, fax and e-mail
Aki Kido
Department of Diagnostic Imaging and Nuclear Medicine, Graduate School of Medicine,
Kyoto University, 54 Kawahara-cho Shogoin, Sakyo-ku, Kyoto, 606-8507, Japan
Tel:+81-75-751-3760
Fax:+81-75-771-9709
e-mail: [email protected]

Abstract
Background: The thickness and signal intensity (SI) of normal uterine endometrium on
T2-weighted images (WI) changes depend on the menstrual cycle phase. Cases of normal
endometrium that appear similar to endometrial lesions sometimes occur, and may result
in misdiagnosis.
Purpose: To investigate normal endometrial appearance in luteal phase (LP) compared to
that in follicular phase (FP), and to differentiate these appearances with those of
endometrial lesions.
Material and Methods: Thirty-two normal volunteers prospectively underwent MR
examinations during LP and FP. Patients with pathologically confirmed endometrial
polyps (n=9), hyperplasia (n=7) and cancer (n=15), who underwent MR examinations,
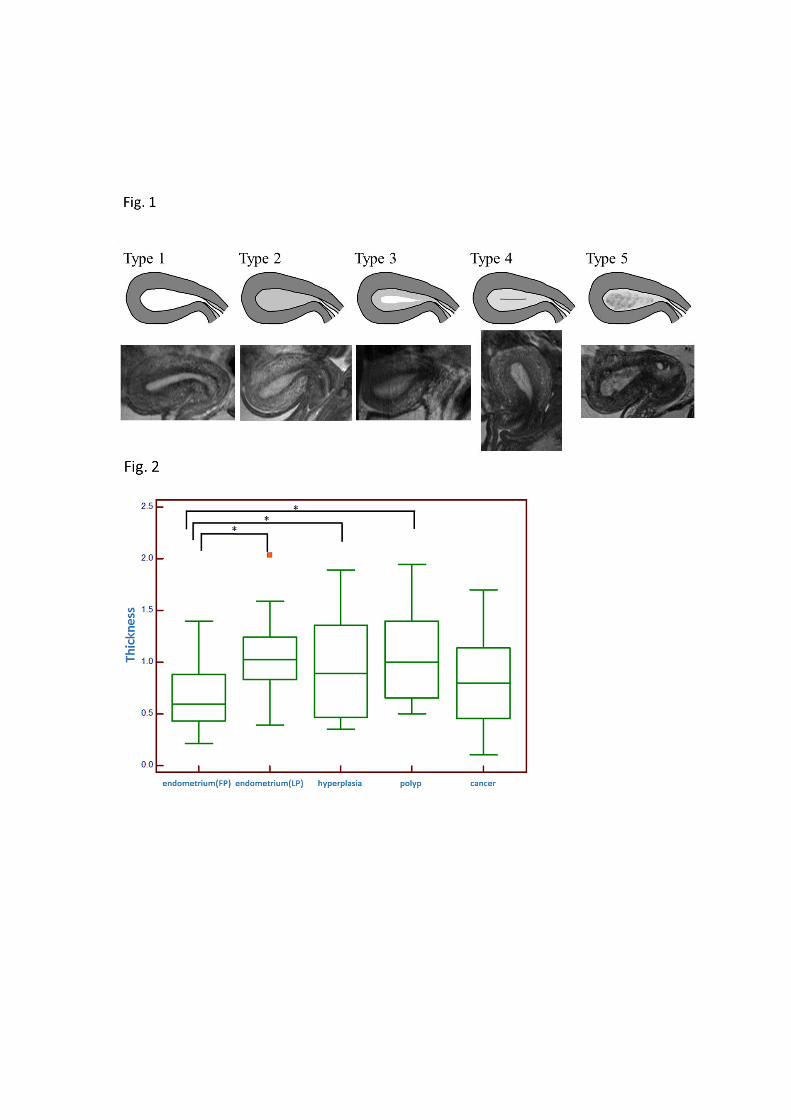
were evaluated for comparison. Endometrial appearance was categorized into the
following five types on sagittal T2-WI and compared between LP, FP and endometrial
lesions: type 1) homogeneous higher SI, type 2) homogeneous iso SI, type 3) a bright
midline and a peripheral iso SI layer, type 4) a lower/iso SI central line, type 5)
heterogeneous lower/iso SI. Endometrial thickness and SI were measured and also
compared.
Results: Endometrial lesions were more frequently categorized as type 5 than normal
endometrium (p<0.05). Endometrial thickness in LP (mean: 1.0cm) was significantly
greater than that in FP (0.6cm), but not significantly different from polyps (1.1cm),
hyperplasia (1.0cm) and cancer (0.9cm). SI in FP was significantly higher than that in LP
and that of all endometrial lesions.
Conclusion: Differentiation between normal endometrium in LP and endometrial lesions
may be difficult based on thickness alone. Heterogeneous low SI may help to differentiate
normal endometrium from endometrial lesions. Performing MRI during FP may also help
due to higher SI of normal endometrium.
Keywords: uterine endometrium; luteal phase; MRI; endometrial lesions

Introduction
The initial imaging modality of choice for evaluating abnormal uterine
endometrium or abnormal uterine bleeding is generally ultrasonography. Magnetic
resonance imaging (MRI) may be a useful problem-solving tool when ultrasonography
findings are inconclusive (1-3). Thickened endometrium on MRI is indicative of
endometrial lesions (4-8); however, normal endometrial thickness can increase to a mean
peak of over 1.0 cm in the luteal phase (9, 10). Signal intensity (SI) on T2-weighted
images (WI) is also known to change from the early proliferative to the mid-secretory
phase (11). This can result in imaging findings of “thickened endometrium with
decreased SI” on T2-WI, which is in fact normal variation but mimics other endometrial
lesions and may lead to over-diagnosis. For accurate MRI diagnosis of endometrial
abnormalities, it is important to known the range of variation in “normal endometrial
appearance”. However, there are a limited number of studies investigating normal
variation of the endometrium and its differentiation from endometrial lesions.
The aim of this study was to evaluate the appearance of normal endometrium in
the luteal phase (LP) and follicular phase (FP), as well as the appearance of endometrium
with lesions including endometrial cancer, endometrial polyps and endometrial
hyperplasia, and to compare the endometrial thickness and SI of the endometrium with
and without endometrial lesions on T2-WI.

Material and Methods
Study population
The protocol of this study was approved by the Ethics Committee of our institute.
The study population consisted of two groups: prospectively recruited healthy volunteers
and patients with confirmed endometrial lesions who were retrospectively selected.
For the group of healthy volunteers, the inclusion criteria were as follows:
healthy females having regular menstrual cycles. A regular menstrual cycle was defined
as a range of 24-35 days (12). A total of 38 females with regular menstrual cycles (mean
age: 30.8 years, age range: 20-44 years) were recruited from May 2012 to January 2014
and written informed consent was obtained from all subjects. The exclusion criteria were
as follows: taking exogenous hormones, having endometrial lesions or distortion of
uterine cavity on MRI, and having inadequate MR image quality for evaluation. Distorted
endometrium was excluded as the thickness of the endometrium could not be measured
accurately or the area of the endometrium was not large enough for evaluation of the
appearance and SI. From the 38 subjects, six were excluded for the following reasons:
taking an emergency contraceptive pill (n=1), accompanying endometrial lesion (n=1),
endometrial distortion on MRI (n=3) (submucosal uterine leiomyoma (n=1), multiple
leiomyoma (n=1), large adenomyosis in the anterior uterine wall (n=1)), and poor image
quality due to severe bowel motion artifacts (n=1). As a result, 32 subjects were included
in the study.
Data from patients with endometrial lesions was extracted from the computer
databases of the Departments of Pathology, Gynecology and Radiology between August
2008 and December 2013. The inclusion criteria were patients who were pathologically
confirmed to have endometrial lesions and patients who underwent MR examinations on
3.0-T magnet units before surgical procedures. Patients with the following three
endometrial lesions were included in this study: 15 patients with endometrial cancer
which was limited within the endometrium (mean age: 53.2 years, age range: 41-66
years) (5 pre-menopausal and 10 post-menopausal patients), seven patients with
endometrial hyperplasia (mean age: 38.0 years, age range: 22-51 years), and nine patients
with endometrial polyps (mean age: 47.0 years, age range: 29-70 years). Endometrial

hyperplasia was confirmed with dilation and curettage in four patients and with
hysterectomy in three patients. The exact phases of patients’ menstrual cycles on MR
examination could not be determined retrospectively, as sequential menstrual cycle was
not written in the patients’ charts and abnormal bleeding made it difficult to distinguish
from menstruation.
MR scanning protocols
MR examinations for the 38 healthy female subjects were performed during LP
(Cycle Day (CD) 14-34, 1-12 days before the next cycle (late LP in 27/32 women, early
LP in 5/32 women)) and FP (CD 6-16, 12-30 days before the next cycle) of the next or
after the next cycle. The number of days between the two examinations was 12-46 days.
Among the 32 subjects, 28 underwent MR examinations at sequential menstrual cycles.
The other four subjects underwent the second MR examinations two menstrual cycles
later. All subjects were asked to note the beginning of the subsequent menstrual cycle to
allow menstrual cycle phase confirmation. MR examinations were obtained using a 3-T
MR unit (Toshiba Medical Systems, Otawara, Japan) with a phased-array coil. Sagittal
T2-weighted fast spin-echo (FSE) images, axial T2-weighted fast-advanced spin echo
(FASE) images and sagittal T1-weighted FSE images were obtained. Sagittal T1 and
T2-WI were obtained in mid-plane of the uterus. Acquisition parameters for each
sequence are summarized in Table 1. Pre-medication, including anti-cholinergic drugs,
were not administered.
MR examinations for the 31 patients with endometrial lesions were performed
using 3.0-T magnet units (MAGNETOM Trio and Skyra, Siemens, Erlangen, Germany)
with phased-array coils. Sagittal T1-weighted spin-echo (SE) images and sagittal and
axial T2-weighted FSE images were obtained. Acquisition parameters for each sequence
are summarized in Table 1. Anti-cholinergic drugs (Buscopan; Nippon Boehringer
Ingelheim, Tokyo, Japan) were administered in 14 of 15 patients with endometrial cancer,
in all 7 patients with endometrial hyperplasia, and in 7 of 9 patients with endometrial
polyps.
Image analysis

The MR images of the 32 healthy subjects and 31 patients were independently
interpreted for the appearance of the endometrium, including endometrial lesions, by two
radiologists with six years (F.S. reader A) and 17 years (A.K. reader B) of experience in
female pelvic MRI, respectively. The readers were blinded to the pathological findings
but were aware that there were patients in the group of healthy subjects because of the
different image protocols between the healthy subjects and patients. The readers visually
evaluated the normal endometrium of the healthy subjects in LP and FP, and the
endometrium of the patients with lesions, on sagittal T2-WI to categorize as the following
five types: type 1) homogeneous higher SI than endocervical mucosa, type 2)
homogeneous iso SI to endocervical mucosa, type 3) two layer appearance with a bright
midline and a peripheral iso SI layer compared to endocervical mucosa, type 4) the
presence of a lower/iso SI central line within the endometrium compared to endocervical
mucosa, type 5) heterogeneous lower/iso SI areas within the endometrium compared to
endocervical mucosa (Fig. 1).
For all subjects, the maximum thickness of the endometrium was measured on
sagittal T2-WI by one radiologist. As for the measurement of SI in the endometrium,
polygonal regions of interest (ROIs) were drawn to delineate the contour of the
endometrium at the mid-sagittal plane of the uterus. Reference ROIs were drawn on the
paraspinal muscles and subcutaneous fat in the hip, avoiding vessels and ghosting
artifacts. Since MR units and acquisition parameters were different between the
volunteers and the patients, the SI of each ROI was converted to the relative SI (rSI) by
the following formula according to a previous report (13):
rSI = (mean SI of each uterine region - mean SI of paraspinal muscle) / (mean SI
of fat - mean SI of paraspinal muscle) x 100
Statistical analysis
The difference in the five types of endometrial appearance between normal
endometrium in LP and FP was examined in each of the five types using Fisher’s exact
test (MedCalc Software, version 12.7.2.0, Ostend, Belgium). Each endometrial lesion
was also compared with normal endometrium in LP and FP in each of the five types using
Fisher’s exact test.

The maximum thickness and rSI of the normal endometrium was compared
between LP and FP by paired Student’s t-tests (MedCalc Software, version 12.7.2.0).
The maximum thickness and the rSI of the normal endometrium in LP and FP
were compared with each of the three types of endometrial lesions by unpaired Student’s
t-tests.
The maximum thickness of endometrium with endometrial cancer were
compared between pre and post-menopausal patients by an unpaired Student’s t-test.
A P value of less than 0.05 was regarded as statistically significant.
Concordance of the two readers’ results of the appearance of the endometrium
was measured by the kappa coefficient. A kappa value less than 0.00 signified poor
agreement; 0.00-0.20, slight agreement; 0.21-0.40, fair agreement; 0.41-0.60; moderate
agreement; 0.61-0.80, substantial agreement; 0.81-1.00, almost perfect agreement (14).

Results
The results of the evaluation of the appearance of the endometrium are shown in
Table 2. Type 1 was identified more frequently in the normal endometrium in FP than that
in LP and endometrial lesions by both readers. A significant difference was observed
between normal endometrium in FP and LP (p<0.05) by both readers, and between
normal endometrium in FP and endometrial cancer (p<0.05) by reader B. More than half
of the cases of endometrial cancer were categorized as type 2 by both readers, but a
significant difference between endometrial cancer and normal endometrium in LP was
only observed (p<0.05) by reader B. Another significant difference was observed
between normal endometrium in FP and endometrial polyps (p<0.05). Type 3 was
observed more frequently in the normal endometrium in LP by both readers. A significant
difference was observed between normal endometrium in LP and endometrial cancer
(p<0.05) and between normal endometrium in LP and FP (p<0.05) by reader A. Type 4
was more frequently identified in the normal endometrium in LP, and a significant
difference was observed between normal endometrium in LP and endometrial cancer
(p<0.05) by both readers. Type 5 was observed significantly more in each of the
endometrium with endometrial lesions than in normal endometrium (p<0.05) by both
readers.
Interobserver agreement was substantial or almost perfect for the evaluation of
the endometrial appearance in FP and LP and endometrial hyperplasia, polyps, and cancer
(κ = 0.67, 0.68, 0.78, 0.81 and 0.89, respectively).
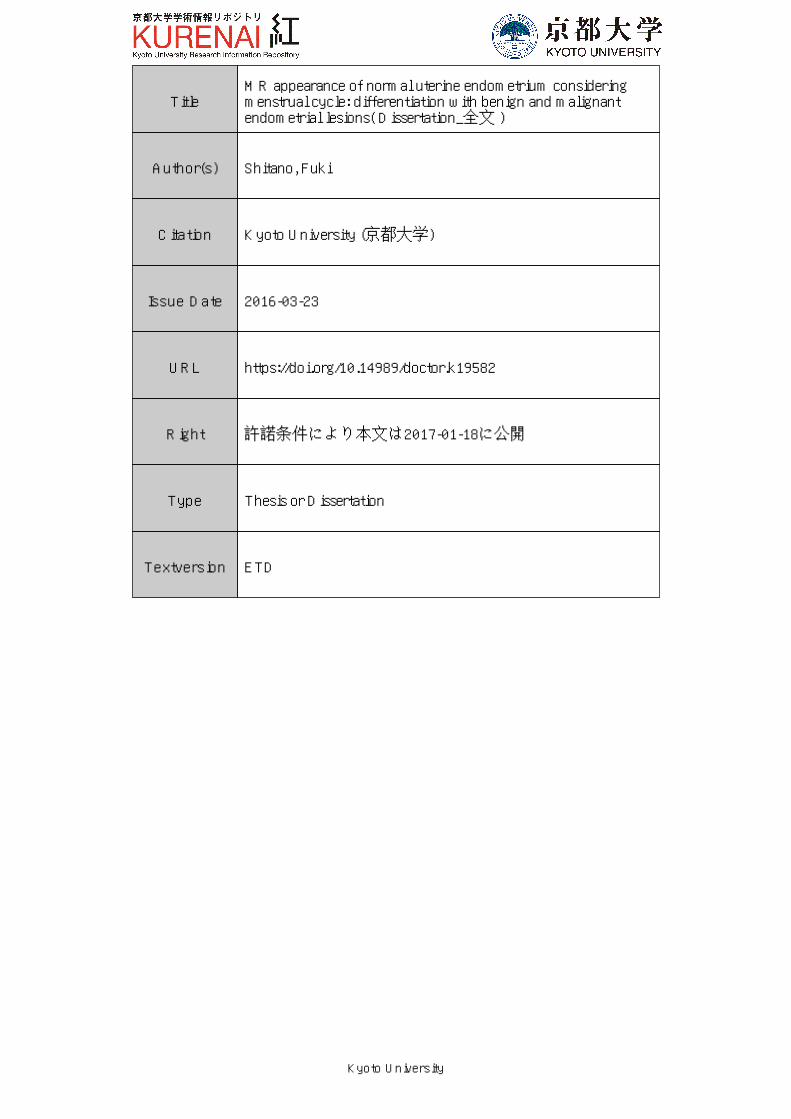
The maximum thickness of the normal endometrium in LP and FP compared
with that of each endometrial lesion is shown in Fig. 2. The mean maximum thickness of
the normal endometrium was 1.04 cm (range: 0.39-2.04 cm) in LP and 0.65 cm (range:
0.21-1.40 cm) in FP, and the difference was significant (P<0.05) (Table 3). There was no
significant difference in the maximum thickness between the normal endometrium in LP
and that of all endometrial lesions including endometrial cancer, hyperplasia and polyps
(p = 0.14, 0.74 and 0.88, respectively). When compared to the normal endometrium in FP,
a significant difference was observed with endometrial hyperplasia and with endometrial
polyps (p<0.05), but not with endometrial cancer (p = 0.07). With respect to endometrial

cancer, there was no significant difference in the maximum endometrial thickness
between pre and post-menopausal women (p = 0.90) (mean: 0.83 mm, range: 0.31-1.48
cm, mean: 0.87mm, range: 0.10-1.70 cm, respectively).
The rSI of the normal endometrium in LP and FP compared with that of each
endometrial lesion is shown in Fig. 3. The rSI of the normal endometrium was
significantly lower in LP than in FP (P<0.05). The rSI of the normal endometrium in LP
was significantly higher than that of patients with endometrial cancer (P<0.05) and
endometrial polyps (P<0.05), but not with endometrial hyperplasia (p = 0.09). Forty-eight
percent of the range of the rSI of the normal endometrium in LP and 55 percent of the
range of the rSI of endometrial cancer overlapped. The rSI of the normal endometrium in
FP was significantly higher than that of all patients with endometrial lesions (P<0.05).
Representative sample cases are shown in Fig. 4.

Discussion
This study demonstrated that there is a considerable overlap in the endometrial
thickness and SI between normal subjects and patients with endometrial lesions.
From the results of this study, differentiation of normal endometrium, both in LP
and FP, from endometrial cancer by thickness alone was difficult regardless of
menopausal state. The mean maximum thickness of endometrial cancer was 0.86cm. The
mean maximum thickness of the normal endometrium was 0.64cm in FP and 1.04cm in
the LP, which is in agreement with previous reports (9-11, 15). However, there was a
significant difference in the mean thickness of the two phases. In addition, the range of
the endometrial thickness was 0.21-1.40 cm in FP and 0.39-2.04 cm in LP, despite the fact
that the upper limit of the normal endometrium at reproductive age is believed to be 1cm
(11, 16). These results suggest that the distinction between normal endometrium and
endometrial lesions only by the endometrial thickness may be difficult depending on the
menstrual cycle. Differentiation between normal and abnormal endometrial thickness
might be easier if MRI is not performed during LP. Thus, scheduling recommendations
might suggest MR examination prior to ovulation.
With respect to the SI of the endometrium, a significant difference was observed
between all but normal endometrium in LP and endometrial hyperplasia, although
considerable overlap was observed between the SI of normal endometrium and those of
the endometrium with lesions as shown in Fig. 3. Difficulties due to normal low
endometrial SI might also be reduced by performing MRI before ovulation. This
recommendation might be important in premenopausal woman, as the incidence or
prevalence of endometrial hyperplasia and polyps increases with age over age 30 (17, 18).
In addition to SI, our study also suggested the use of endometrial appearance as an
additional differential point. It is well known that endometrial cancer typically shows
medium to low SI relative to the normal endometrium on T2-WI (5, 16, 19-23).
According to our results, heterogeneous low SI endometrium (type 5) was more
frequently observed in each of endometrial lesions than in normal endometrium.
Heterogeneity of the endometrium can also be a differential point. In the case of
endometrial polyps, the presence of a central fibrous core and intratumoral cysts are
known to be key imaging findings (4, 24), and may also be a cause of the heterogeneity of
the endometrium. The SI and its inhomogeneous appearance may be useful to
differentiate endometrial cancer from normal endometrium, since endometrial cancer is
most frequently diagnosed at perimenopausal/ postmenopausal age, but up to 10% to 15%
of cancers can occur in premenopausal patients (25, 26).
In the normal endometrium, a significant difference was observed in the SI
between the two phases. Homogeneous high SI endometrium on T2-WI could be
observed in FP, but only in less than 10% of subjects in LP. A pattern of iso/low SI area,
such as peripheral or central iso/low SI, was observed in most of the endometrium in LP.
The reason for the appearance of this pattern could not be determined as there was no
correlation with the pathology observed in this study. One possible cause may be the
peridecidualization of the endometrial stroma, which can be observed after cycle day
22-23 (27). In the present study, most of the MR images in LP (27/32 women) were
obtained in late LP, which corresponds to the period of peridecidualization. Pathological
correlation with MRI will be required for the next steps.
Classification of the appearance of the endometrium has not been previously
reported. Advancements in MR units may contribute to improve detailed contrast within
the endometrium. Here, we used 3.0-T MR units, resulting in higher signal to noise ratio
(SNR) than the 1.5-T, 0.35-T or 0.15-T MR units previously reported for evaluation of
endometrial visualization in MRI (9, 15, 19, 20, 28, 29). According to increased SNR, the
slice thickness can be made thinner with increased matrix, and thus improved spatial
resolution can be obtained on 3.0-T MR units. Therefore, this demonstrated that detailed
structure of the endometrium could be distinguished using 3.0-T MR units. Likewise, our
T2-WI were obtained with FSE, while T2-WI in previous studies were obtained with SE
(9, 15, 19, 20, 28, 29). Since image acquisition time of a FSE sequence is shorter than that
of a SE sequence, the images may be less affected by motion artifacts such as bowel
peristalsis and breathing motion.
There are some limitations to the present study. First, the population with
endometrial lesions was small. Although the patients were collected retrospectively, the
study could be improved if patients were collected prospectively. Second, we determined
the menstrual cycle phases at MR examination based on their menstrual cycle. A more

accurate method for determining the exact phase would be to perform hormonal or
temperature measurements. Third, we could not correlate the imaging of the normal
endometrium with its pathological state. It may be possible to pathologically examine
patients with normal endometrium undergoing operation for other diseases, such as
ovarian tumors.
In conclusion, distinction between normal endometrium in LP and endometrial
lesions may be difficult using only endometrial thickness. Heterogeneous low SI may
help to differentiate the normal endometrium from those with lesions. Performing MRI
during FP may also help due to higher SI of normal endometrium.
Acknowledgement
The authors would like to thank Tomohisa Okada, MD, PhD (Department of
Diagnostic Imaging and Nuclear Medicine, Graduate School of Medicine, Kyoto
University), Shinya Fujii, MD, PhD (Division of Radiology, Department of
Pathophysiological and Therapeutic Science, Faculty of Medicine, Tottori University),
Sayaka Daido, MD (Department of Diagnostic Imaging and Nuclear Medicine, Graduate
School of Medicine, Kyoto University) and Yuki Himoto, MD (Department of Diagnostic
Imaging and Nuclear Medicine, Graduate School of Medicine, Kyoto University) for
their contributions to this study and, Kyoko Takakura, RT (Department of Diagnostic
Imaging and Nuclear Medicine, Graduate School of Medicine, Kyoto University), Yuki
Kanazawa, RT, PhD (Institute of Health Biosciences, The University of Tokushima
Graduate School), Hajime Sagawa, RT (Clinical Radiology Service, Kyoto University
Hospital) and Naotaka Sakashita (Toshiba Medical Systems Corporation) for their
technical assistance.
Declaration of Conflicting Interests
One of the authors, K. T. was provided a sponsored research program,
“Researches for improvement of MR visualization (No. 150100700014)” by Toshiba
Medical Systems Corporation, Japan. For the remaining authors none were declared.
Funding
This research was supported by a sponsored research program, “Researches for
improvement of MR visualization” provided to one of the authors, K. T. by Toshiba
Medical Systems Corporation, Japan (No. 150100700014).

References
1. Bennett GL, Andreotti RF, Lee SI, et al. ACR appropriateness criteria(®) on abnormal
vaginal bleeding. J Am Coll Radiol 2011;8:460-468.
2. Vargas HA, Akin O, Zheng J, et al. The value of MR imaging when the site of uterine
cancer origin is uncertain. Radiology 2011;258:785-792.
3. American College of Obstetricians and Gynecologists. ACOG Committee Opinion No.
426: The role of transvaginal ultrasonography in the evaluation of postmenopausal
bleeding. Obstet Gynecol 2009;113:462-464.
4. Hase S, Mitsumori A, Inai R, et al. Endometrial polyps: MR imaging features. Acta
Med Okayama 2012;66:475-485.
5. Chaudhry S, Reinhold C, Guermazi A, et al. Benign and malignant diseases of the
endometrium. Top Magn Reson Imaging 2003;14:339-357.
6. Nalaboff KM, Pellerito JS, Ben-Levi E. Imaging the endometrium: disease and normal
variants. Radiographics 2001;21:1409-1424.
7. Atri M, Reinhold C. Neoplasm, Benign; Endometrial Polyps; Endometrial Hyperplasia.
In: Hricak H, ed. Diagnostic Imaging: Gynecology. Salt Lake City: Amirsys,
2007:128-139.
8. Akin O, Reinhold C, Rafat Z, et al. Neoplasm, Malignant; Endometrial Cancer,
Characterization; Endometrial Cancer, Early Stage. In: Hricak H, ed. Diagnostic
Imaging: Gynecology. Salt Lake City: Amirsys, 2007:140-149.
9. McCarthy S, Tauber C, Gore J. Female pelvic anatomy: MR assessment of variations
during the menstrual cycle and with use of oral contraceptives. Radiology
1986;160:119-123.
10. Janus CL, Wiczyk HP, Laufer N. Magnetic resonance imaging of the menstrual cycle.
Magn Reson Imaging 1988;6:669-674.
11. Demas BE, Hricak H, Jaffe RB. Uterine MR imaging: effects of hormonal stimulation.
Radiology 1986;159:123-126.
12. Speroff L, Glass RH, Kase NG. Part 1: Reproductive Physiology Chapter 6:
Regulation of the Menstrual Cycle, In: Mitchell C, ed. Clinical Gynecologic
Endocrinology and Infertility Sixth Edition. Philadelphia: Lippincott Williams & Wilkins,

1999: 201-246.
13. Fujimoto K, Nakai A, Okada T, et al. Effect of hyoscine butylbromide (HBB) on the
uterine corpus: quantitative assessment with T2-weighted (T2W) MRI in healthy
volunteers. J Magn Reson Imaging 2010;32:441-445.
14. Landis JR, Koch GG. The measurement of observer agreement for categorical data.
Biometrics 1977;33:159-174.
15. Haynor DR, Mack LA, Soules MR, et al. Changing appearance of the normal uterus
during the menstrual cycle: MR studies. Radiology 1986;161:459-462.
16. Hricak H, Stern JL, Fisher MR, et al. Endometrial carcinoma staging by MR imaging.
Radiology 1987;162:297-305.
17. Reed SD, Newton KM, Clinton WL, et al. Incidence of endometrial hyperplasia. Am J
Obstet Gynecol 2009; 200:678 e671-676
18. Van Bogaert LJ. Clinicopathologic findings in endometrial polyps. Obstet Gynecol
1988; 71:771-773
19. Worthington JL, Balfe DM, Lee JK, et al. Uterine neoplasms: MR imaging.
Radiology 1986;159:725-730.
20. Lee JK, Gersell DJ, Balfe DM, et al. The uterus: in vitro MR-anatomic correlation of
normal and abnormal specimens. Radiology 1985; 157:175-179.
21. Posniak HV, Olson MC, Dudiak CM, et al. MR imaging of uterine carcinoma:
correlation with clinical and pathologic findings. Radiographics 1990;10:15-27.
22. Sala E, Wakely S, Senior E, et al. MRI of malignant neoplasms of the uterine corpus
and cervix. Am J Roentgenol 2007;188:1577-1587.
23. Beddy P, O'Neill AC, Yamamoto AK, et al. FIGO staging system for endometrial
cancer: added benefits of MR imaging. Radiographics 2012;32:241-254.
24. Grasel RP, Outwater EK, Siegelman ES, et al. Endometrial polyps: MR imaging
features and distinction from endometrial carcinoma. Radiology 2000;214:47-52.
25. Howlader N, Noone AM, Krapcho M, et al. SEER Cancer Statistics Review,
Bethesda: National Cancer Institute, 1975-2012. http://seer.cancer.gov/csr/1975_2012/
(based on November 2014 SEER data submission, posted to the SEER web site, April
2015)
26. Renaud MC, Le T, Bentley J, et al. Epidemiology and investigations for suspected

endometrial cancer. J Obstet Gynaecol Can 2013; 35:380-383.
27. Mutter GL, Ferenczy A. Chapter 9 Anatomy and Histology of the Uterine Corpus. In:
Kurman RJ, ed. Blaustein's Pathology of the Female Genital Tract Fifth Edition. New
York: Springer, 2002:383-419.
28. Hricak H, Alpers C, Crooks LE, et al. Magnetic resonance imaging of the female
pelvis: initial experience. Am J Roentgenol 1983;141:1119-1128.
29. McCarthy S, Scott G, Majumdar S, et al. Uterine junctional zone: MR study of water
content and relaxation properties. Radiology 1989;171:241-243.

Table 1: Acquisition parameters for MR imaging examinations for normal volunteers and patients.
Abbreviation: FSE = fast spin-echo, WI = weighted image, FASE = fast-advanced spin echo, TR = repetition time,
TE= echo time, FOV = field of view, FA = flip angle.
normal volunteers patients
sagittal FSE T2-WI sagittal FSE T1-WI axial FASE T2-WI sagittal FSE T2-WI sagittal SE T1-WI axial FSE T2-WI
TR/TE (msec) 5756/80 571/12 15000/80 4000-4500/81-83 600-608/11 4500/81-83
FOV (mm) 260 x 260 260 x 260 300 x 330 260 x209-212 260 x 204-208 320 x 320
slice thickness (mm) 4 4 5 4 4 4
matrix 512 x 256 320 x 256 256 x 352 448 x 288-328 384 x 230-240 512 x 512
FA (deg) 90 90 90 90 80 90
refocusing FA (deg) 170 180 160 150 180 150

Table 2: Categorization of the appearance of the normal endometrium in periovulatory and luteal phase and the
endometrium with lesions as evaluated by two readers.
Reader A
type 1 type 2 type 3 type 4 type 5 total
normal endometrium (FP) 6 (19%) 15 (47%) 4 (13%) 7 (22%) 0 (0%) 32 (100%)
normal endometrium (LP) 0 (0%) 8 (25%) 14 (44%) 9 (28%) 1 (3%) 32 (100%)
endometrial hyperplasia 0 (0%) 3 (43%) 1 (14%) 0 (0%) 3 (43%) 7 (100%)
endometrial polyp 1 (11%) 0 (0%) 1 (11%) 1 (11%) 6 (67%) 9 (100%)
endometrial cancer 1 (7%) 8 (53%) 1 (7%) 0 (0%) 5 (33%) 15 (100%)
Reader B
type 1 type 2 type 3 type 4 type 5 total
normal endometrium (FP) 10 (31%) 8 (25%) 6 (19%) 8 (25%) 0 (0%) 32 (100%)
normal endometrium (LP) 2 (6%) 3 (9%) 13 (41%) 12 (38%) 2 (6%) 32 (100%)
endometrial hyperplasia 0 (0%) 2 (29%) 2 (29%) 0 (0%) 3 (43%) 7 (100%)
endometrial polyp 1 (11%) 0 (0%) 2 (22%) 1 (11%) 5 (56%) 9 (100%)
endometrial cancer 0 (0%) 8 (53%) 2 (13%) 0 (0%) 5 (33%) 15 (100%)
*p<0.05. Abbreviation: FP = follicular phase, LP = luteal phase.
* * *
*
*
*
* *
* *
*
* * * *
*
* * * * *

Table 3: The maximum thickness and relative signal intensities (rSI) of the normal endometrium and endometrial
lesions.
maximum thickness (cm) rSI (%)
normal endometrium (FP) 0.64 (0.21-1.40) 83.1 (56.1-112.8)
normal endometrium (LP) 1.04 (0.39-2.04) 75.9 (56.4-109.4)
endometrial hyperplasia 0.99 (0.35-1.89) 64.8 (43.1-88.9)
endometrial polyp 1.06 (0.50-1.95) 63.2 (43.6-86.2)
endometrial cancer 0.86 (0.10-1.70) 57.2 (36.0-81.7)
Abbreviation: FP = follicular phase, LP = luteal phase.

Figure Legends
Fig. 1: The sagittal FSE T2-weighted images of the normal endometrium in luteal and
periovulatory phase and those with endometrial lesions were categorized as the
following five types: type 1) homogeneous higher signal intensity than that of
endocervical mucosa, type 2) homogeneous iso signal intensity to that of endocervical
mucosa, type 3) two layer appearance with a bright midline and a peripheral iso SI layer
compared to endocervical mucosa, type 4) the presence of a lower/iso signal intensity
central line within the endometrium compared to the signal of endocervical mucosa,
type 5) heteorogeneous lower/iso signal intensity areas within the endometrium
compared to the signal of endocervical mucosa.
Fig. 2: Maximum thickness of the normal endometrium in luteal and follicular phase and
of those with each endometrial lesion. *p<0.05. The endometrial thickness in LP was
significantly greater than that in FP. There was no significant difference between the
normal endometrium in LP and that of all endometrial lesions including endometrial
cancer, hyperplasia and polyps. There was a significant difference between the normal
endometrium in FP and endometrial hyperplasia and between the normal endometrium
in FP and endometrial polyps. There was no significant difference between the normal
endometrium in FP and endometrial cancer.
FP = follicular phase, LP = luteal phase.
Fig. 3: Relative signal intensity (rSI) of the normal endometrium in luteal and follicular
phase and of those with each endometrial lesion. *p<0.05. The rSI of the normal
endometrium was significantly lower in LP than in FP. The rSI of the normal
endometrium in LP was significantly higher than that of patients with endometrial
cancer and endometrial polyps, but not with endometrial hyperplasia. The rSI of the
normal endometrium in FP was significantly higher than that of all patients with
endometrial lesions.
FP = follicular phase, LP = luteal phase.
Fig. 4 (a) – (e): Representative sagittal T2-weighted images: (a) 33-year-old woman
with normal endometrium in luteal phase, (b) The same woman as Fig. 4 (a) in follicular
phase, obtained 17 days later, (c) 41-year-old woman with endometrial hyperplasia, (d)
41-year-old woman with endometrial polyp, and (e) 41-year-old woman with
endometrial cancer. Fig. 4 (a) was classified as type 3, and Fig. 4 (b) was classified as
type 4. Fig. 4 (c), (d) and (e) were classified as type 5. In Fig. 4 (d), a prominent low
signal intensity spot in T2-WI called the fibrous core of endometrial polyp can be
recognized within the endometrium. In endometrial cancer (Fig. 4 (e)), the endometrial
thickness was similar to that in Fig. 4 (a), but the appearance was heterogeneous.