mr coos watershed
DESCRIPTION
noTRANSCRIPT

FINAL PROJECT COMPLETION REPORT
OWEB Grant 204-082
Coos Watershed Integrated Monitoring
(1). Description of the Project.
The purpose of this project is to begin answering the following question:
Does the collective effect of restoration actions result in improved watershed condition and fish response (PNAMP, 2005a)?
The Coos Watershed Association (CoosWA) has implemented approximately 300 restoration projects over the past twelve years throughout the 610 square mile watershed. The CoosWA has a long history of successful project-level effectiveness monitoring. Based on an earlier OWEB grant (200-211), CoosWA conducted and published the results of its project-effectiveness monitoring on a subset of its restoration projects, including culvert replacements, large wood placement, and boulder weirs. Concurrent with this project we also evaluated the programmatic effectiveness of our road sediment reduction and riparian restoration activities. With these efforts, however, we identified the need to isolate the individual and cumulative effects of restoration projects while controlling ocean influences and natural variation (i.e., climatic cycles, etc.) while at the same time evaluate the cumulative effects on anadromous fish and water quality of multiple restoration project types and sites within a single stream, sub-basin, and the entire watershed draining through Coos Bay.
Approaches to develop answers to these questions have evolved during the term of this project. In our proposal we identified “validation watersheds” as a targeted approach, with the idea that we could control for natural cycles by nesting our monitoring within the Oregon Coastal Salmon Inventory (OCSI) by utilizing an EMAP sampling design (Stevens, 2002). As a part of this process we identified two 6th field HUC sub-basins, one in the Coos Bay lowlands and one in the upper watershed, where we would conduct intensive surveys of aquatic habitat, salmon spawning, and juvenile coho (see Figure 1). In addition, we identified specific stream reaches where we would use these techniques in a Before-After-Control Impact (BACI) design to evaluate project effectiveness.
At the same time that we were implementing this project, the Pacific Northwest Aquatic Monitoring Partnership was developing strategies to coordinate monitoring among various parties (PNAMP, 2005a). Objective 4. Outcome E of the strategy calls for the establishment of “Intensively Monitored Watersheds” (IMW) that share many of the approaches we contemplated for our project. Because the IMW approach represents the current state-of-the-art for integrated monitoring, and meets the objectives we outlined in our grant proposal, the results reported here will focus on how the work conducted for this project relates to PNAMP’s Intensively Monitored Watershed requirements. These requirements are found in Establishing A Network of Intensively Monitored Watersheds in the Pacific Northwest (PNAMP’s 2005b).
Major components of the Intensively Monitored Watersheds protocol (PNAMP, 2005b) are: • Long term commitments to juvenile, outmigrant, and adult fish monitoring; • Capitalize on availability of suitable scientific knowledge; • Provide results related to important management questions; • Provide representation for specific areas/ecosystems, species, and project types; • Have a broad base of support in the locally affected area.
Page 1

�
����
�
�
���
��
��
�
���
� �
�
�
� �
���
�
��
�
�
�
�
�
�
�
��
�
�
�
�
�
�
�
�
� � �
�� �
� �
�
����
�
�
�
��
�
�
�
�
��
�
���
�
�
�
���
��
�
��
�
�
�
�
� �
���
�
�
�
�
�
�
�
�
�
�
�
�
�
�
�
� �
�
�
�
�
�
�
��
�
�
�
�����
�
�
�
�
��
�
�
�
�
��
�
�
�
��
�
�
�
�
�
�
�
��
�
������� �
�
�
�
�
�
����������� �������������� ������������������������������������������� ��������������������
� � � � � � ����� ��
�������� ����� ���� ���� ��� ��
� ���������� ���������������������
�������������� � ������� ������ ���������
���� �� �!��
���������������� ������������������
��������������������� ������������������
������
The results of this project—in conjunction with other assessment and monitoring efforts—provide a solid foundation to move forward with incorporating the Intensively Monitored Watershed concept in the Coos watershed.
Three components to meet the overall objective of this project were:
1. Establish a systematic sampling framework so that links between 6th and 7th field HUC project- and program-effectiveness monitoring and the Coast-wide status and trend monitoring can be made to control for cyclical patterns.
2. Use two 6th field HUC watersheds as pilot studies (Larson and Palouse Creeks and the upper West Fork Millicoma River) to implement sampling to identify project and program effectiveness.
3. Continue the development of program-effectiveness monitoring through evaluating our road sediment reduction and riparian restoration programs.
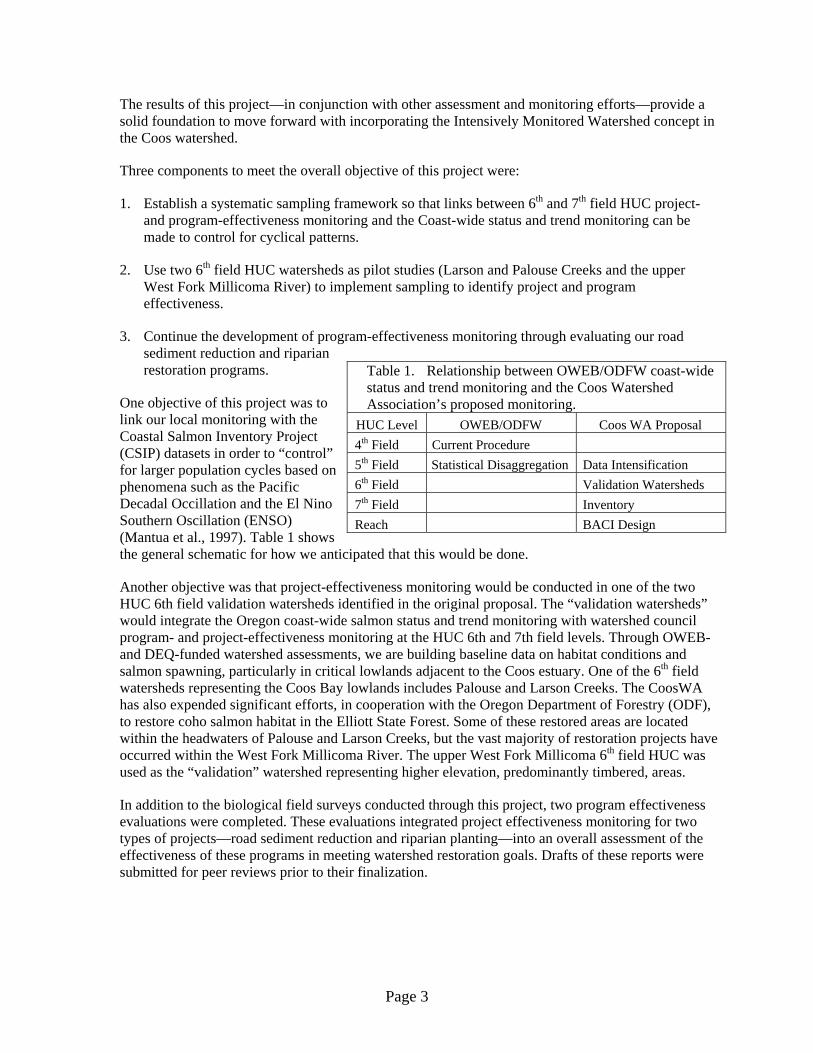
One objective of this project was to link our local monitoring with the Coastal Salmon Inventory Project (CSIP) datasets in order to “control” for larger population cycles based on phenomena such as the Pacific Decadal Occillation and the El Nino Southern Oscillation (ENSO) (Mantua et al., 1997). Table 1 shows the general schematic for how we anticipated that this would be done.
Table 1. Relationship between OWEB/ODFW coast-wide status and trend monitoring and the Coos Watershed Association’s proposed monitoring.
HUC Level OWEB/ODFW Coos WA Proposal 4th Field Current Procedure 5th Field Statistical Disaggregation Data Intensification 6th Field Validation Watersheds 7th Field Inventory Reach BACI Design
Another objective was that project-effectiveness monitoring would be conducted in one of the two HUC 6th field validation watersheds identified in the original proposal. The “validation watersheds” would integrate the Oregon coast-wide salmon status and trend monitoring with watershed council program- and project-effectiveness monitoring at the HUC 6th and 7th field levels. Through OWEB- and DEQ-funded watershed assessments, we are building baseline data on habitat conditions and salmon spawning, particularly in critical lowlands adjacent to the Coos estuary. One of the 6th field watersheds representing the Coos Bay lowlands includes Palouse and Larson Creeks. The CoosWA has also expended significant efforts, in cooperation with the Oregon Department of Forestry (ODF), to restore coho salmon habitat in the Elliott State Forest. Some of these restored areas are located within the headwaters of Palouse and Larson Creeks, but the vast majority of restoration projects have occurred within the West Fork Millicoma River. The upper West Fork Millicoma 6th field HUC was used as the “validation” watershed representing higher elevation, predominantly timbered, areas.
In addition to the biological field surveys conducted through this project, two program effectiveness evaluations were completed. These evaluations integrated project effectiveness monitoring for two types of projects—road sediment reduction and riparian planting—into an overall assessment of the effectiveness of these programs in meeting watershed restoration goals. Drafts of these reports were submitted for peer reviews prior to their finalization.
Page 3

(2). Number of Volunteers.
Volunteers who participated and provided technical assistance for this project were: Jennifer Feola and Bruce Miller, ODFW, Charleston; Randy Smith, ODF, Coos Bay, and Craig Cornu and Michelle Kohler, SSNERR, Coos Bay, OR.
(3). List of Other Participants.
Phil Larsen and Tony Olsen (USEPA, Corvallis Research Laboratory), and Don Stevens (OSU Statistics Department), provided technical assistance in developing the data requirements for the probability-based sampling contemplated for the project. Guillermo Giannico (OSU), Gordon Reeves and Kirsten Gallo (USFS), and Tim Beechie and Phil Roni (NOAA-NWFSC), and Heather Stout and Justin Mills (NOAA-Newport) provided assistance and review of the coho intrinsic potential and EMDS efforts on Larson and Palouse Creeks. Guillermo Giannico was instrumental in facilitating the intrinsic potential, limiting factors, and EMDS portions of the project as part of a National Sea Grant Pilot Project in watershed assessments for streams draining into estuaries.
A large number of landowners permitted access to their property for the monitoring efforts conducted through this grant. On Larson Creek, Dan Brelage, Brian Bond, Faith Taylor and Mark DeBrito, Adrienne Jernigan, Tom Matosec, Horace and Geraldine Wideman, Larry Schoolcraft, John and Elizabeth Cheslock, Joseph and Carol Gauthier, Vernon and Elaine Bryson, Michael and Tenzin Bottoroff, and Jeanne and Richard Currie all provided access to their property for spawning surveys, juvenile snorkel surveys, or life cycle monitoring traps. On Palouse Creek, the Oregon Department of Forestry, King and Yvonne Frey and Walt Granum hosted the life cycle monitoring traps, and ODF, Menasha, Lorie Retallick, Ray Marshall, nad Jim and Adrienne Jordan allowed access to their properties for spawning surveys. All field work on the West Fork Millicoma River was located on the Elliott State Forest, managed by the Department of Forestry for the State Land Board.
The two program effectiveness reports were peer reviewed by the following people: (1) Road Sediment Reduction Program Effectiveness – Dr. William Elliot, USFS Rocky Mountain Experiment Station, Moscow, ID; Keith Mills, ODF, Salem, OR; Tim Beechie, NOAA Northwest Fisheries Science Center; Mark Nauman, Weyerhaeuser Dellwood Operations; Marianne Reiter, Weyerhaeuser Research, Springfield, OR; Mike Barrett, Coos County Forestry; and John Colby, BLM, Coos Bay; (2) Riparian Restoration Program Effectiveness – Chris Massingill, Monroe, OR; John Colby, BLM, Coos Bay , OR; and Mark Stueve, Coos Bay, OR..
Coos Watershed Association staff participating in this project included Jon A. Souder, Executive Director; Matthew Anderson, Restoration Projects Manager; Bessie Joyce, Watershed Assessment and Outreach Coordinator; Kristen Hovenkotter, Lisa Biggs, Dan Draper, and Freelin Reasor collected field data.
(4). Materials and Methods.
The overall framework for this project is consistent with the monitoring strategies proposed in Establishing a Network of Intensively Monitored Watersheds in the Pacific Northwest (PNAMP, 2005).
Our efforts to integrate the Oregon costal included an introductory meeting with Phil Larsen and Tony Olsen at the USEPA Corvallis Research Laboratory to discuss sampling strategies and data needs. This meeting was followed up in March, 2006 with a meeting with Don Stevens and Phil
Page 4

Larsen to discuss continuing development of a sampling scheme for monitoring overall watershed restoration program effectiveness. Additional methodology for EMAP study designs is found at the U.S.E.P.A.’s website www.
The Before-After-Control-Impact (BACI) project effectiveness monitoring was conducted through aquatic habitat inventories (AHI), salmon spawning surveys, and juvenile coho snorkel surveys. Techniques generally followed those outlined in the Coos Watershed Association’s Effectiveness Monitoring of Large Wood, Boulder Weirs, and Culvert Replacement Projects in Selected Streams of the Coos Watershed (Banks et al., 2001).
Activities occurring in the Coos Bay Lowlands (Palouse and Larson Creeks) 6th Field HUC: 1. Long-term salmon spawning surveys (peak count data from 1950; AUC surveys from the 1990’s;
complete basin spawning surveys from 2003 (including two years funded by this grant). 2. Adult spawning salmon traps established in Larson (2004) and Palouse (2005). 3. Smolt traps established in Larson and Palouse (spring, 2005). 4. Aquatic habitat inventories (ODFW implementation of Hankin and Reeves (1988) conducted on
all accessible portions of the two basins (2001 – 2004). 5. Network of summer water temperature monitors (2004 and 2005), data analyses, and
determination of thermally-suitable salmonid habitat. 6. Determination of coho intrinsic potential for both streams (Larson and Palouse) and their major
tributaries following Thompson (2005) procedures. 7. Limiting factors analysis for coho salmon using the Reeves et al. (1989) methodology. 8. An additional coho limiting factors analysis using Ecosystem Management Decision Support
(Reynolds, 2002 and Reynolds and Hessburg, 2005).
Aquatic Habitat Inventories were conducted following standard ODFW protocols, which are based on the Hankin and Reeves (1988) methodology. Salmon spawning and juvenile snorkel surveys were also conducted according to standard ODFW protocols. Evaluation of effectiveness for instream complexity projects was based on attaining Habitat Benchmarks identified by Kelly Moore (ODFW, 1997).
(5). Project Results.
Developing a probabilistic-based sampling strategy for the entire Coos watershed was the goal of our initial meeting with Tony Olsen and Phil Larsen. From this meeting we identified the following needs prior to conducting the EMAP sample design:
• A consistent GIS stream layer that includes stream widths and fish presence status based on ODF criteria. We have obtained the Coos County portion of the stream layer from ODF, but are awaiting the Douglas County portion. However, based on our assessment efforts in the Coos Bay lowlands, it is apparent that considerable work needs to be accomplished to reconcile the various sources of stream layers and/or transfer information to a single layer. We chose the latter strategy for our assessment work which forms the basis for our validation (or intensively monitored) watershed approach in the Coos Bay Lowlands.
• A database containing all restoration projects in the Coos watershed. The Oregon Watershed Restoration Inventory provides the best, consistent data source to provide information needed for sample design to evaluate restoration project and program effectiveness. We are working with the OWRI staff to insure that their records of activities in the Coos watershed are accurate and complete. Based on the latest query of the database (August, 2006) we identified sixteen reported projects that had not been entered into the database, a suite of newer voluntary riparian tree retention, fish passage upgrades, and road improvement work by CoosWA partners that had yet to
Page 5

be submitted, and a lack of mid- to late-1990s reporting of riparian restoration and road improvement projects completed under the BLM’s Jobs-in-the Woods (JITW) and USFWS’s Northwest Economic Adjustment Initiative (NEAI) programs. The forms for these projects will be completed and submitted to the OWRI during the fall, 2006. We have also requested that BLM provide information on their restoration projects in the Coos watershed, and will work to get OWRI forms reported for these projects.
• An accurate GIS layer with the location and extent of existing watershed restoration projects. Unfortunately, the OWRI features appear to be identified at the1:100,000 scale, while most of our project-specific files are based on field corrections at 1:24,000 scale.
Upper West Fork Millicoma River 6th Field HUC Validation Monitoring.
The Upper West Fork Millicoma River is within Management Basin 11 of the Elliott State Forest. This management area covers the Upper West Fork Millicoma River watershed beginning below the confluence (and including) Elk Creek. In 2003, the Oregon Department of Forestry published the Elliott State Forest Watershed Analysis (ODF, 2003) that provides the baseline for evaluating restoration actions in the Upper West Fork Millicoma River (see Figure 2 and Table 2).
Table 2. Watershed restoration projects in the Upper West Fork Millicoma River 6th Field HUC validation watershed.
Project Costs Project Type Number
Length (mi.) Cash In-kind Total
Combined 1 0.8 $41,068 $35,273 $76,341 Fish Passage* 14 37.0 $285,459 $33,651 $319,110 Instream 15 7.3 $169,907 $247,732 $417,639 Riparian 16 3.2 $54,577 $6,000 $60,577 Road 17 12.6 $365,985 $6,000 $371,985
Totals 63 60.9 $916,996 $328,656 $1,245,652 * Stream length made accessible to adults and juveniles.
Initial project effectiveness monitoring for large wood placements in the upper West Fork Millicoma River was conducted in 2001 (Banks et al., 2001). This evaluation covered wood placed in 1995 and 1998. Subsequent to this evaluation, additional wood placement projects were conducted in 2003 and 2005 (see Figure 2). This year (September, 2006), a perched, undersized culvert where the 8000 Road crosses the West Fork below Cougar Creek was replaced with a 68’ bridge, with additional road improvements scheduled for the ESF 7600 road.
The upper West Fork Millicoma River 6th Field HUC validation watershed encompasses a number of aquatic survey activities from 2003 to present (see Table 3). Figure 3 shows the locations of these surveys within the two sub-watersheds, Elk Creek and upper West Fork Millicoma River, that comprise the Validation Watershed.
Page 6

�
�
�
�
�
��
�
�
�
�
��
�
�
�
�
��
�
�
�
�
�
�
�
�
��
�
�
�
�
��
�
�
�
�
��
�
�
�
������������ ���� ���� ������������������������� ��������� ����������������������������������������������� �����������
������������ �� ���������������������������
����������� �� �������������������
����� ������ ������������
������� �� ���� ����
������ ������������������������ �������������� �����������
��� � ��� � ��� !���
����������������� ���������
�����
����
�������
��������
��������
����� � ����������������� ��������
�����
� ���
����
���!�"��
������

������������ �������������� ������������ ����������������������� ���������� �!����� ���������������������� ������
"������������ � �������� ����������� ������
� ������� �������
��� � ��� � ��� ����
������������� �!��������� �"�������� �
#$�����%�&���������� � �'#%�(
)����� ����������
������
��������
���
���
�� ��
�����
���������� ���
����� � �������
����������
�� ����
����
�
������
����
����������� �!����"�����������

Table 3. Aquatic surveys in the Upper West Fork Millicoma River Validation Watershed.
Survey Type Elk Creek Upper W. F. Millcoma R.
Aquatic Habitat Inventory (AHI) Winter 2005 2004, 2005 Summer 2004 2003, 2004, 2005
Adult Spawning Survey 2003, 2004, 2005 2003, 2004, 2005 Juvenile Snorkel Survey 2006 2005
As can be seen in Figure 3, spawning surveys have been conducted in virtually the entire Elk Creek sub-watershed above the fish ladder (located just above the Elk Creek confluence with Hidden Valley Creek (see Figure 2). Spawning surveys were conducted in 2003 in the upper Elk Creek watershed above Gould Lake. Surveys were conducted in 2004 in the area between Skunk Creek upstream past the confluence with the unnamed tributary (and including the tributary downstream from the perched culvert) where the 2005 culvert replacement occurred. Spawning surveys were conducted in 2005 for the area from the fish ladder up through the 2005 project site on the tributary in the coming (2006-07) spawning season.
Spawning surveys have also been conducted for the reach of the West Fork Millicoma River upstream from its confluence with Fish Creek until its confluence with Cougar Creek. This stream reach has had extensive (and intensive) large wood placements over the period 1998 – 2005, and the spawning surveys are designed to evaluate the effectiveness of these projects in creating spawning and rearing habitats that result in increased spawner recruits. During the term of this grant, spawning surveys were conducted in 2003, 2004, and 2005, and will be continued during the coming season (2006-07).
Aquatic habitat inventory (AHI) surveys have been conducted less extensively in the upper West Fork Millicoma Validation Watershed. Both summer and winter AHI surveys were conducted by ODFW as part of effectiveness monitoring during 2004 and 2005 in the reach covered by large wood placement projects on Elk Creek. Winter and summer AHI surveys were also conducted by ODFW on the West Fork Millcoma River from its confluence with Fish Creek upstream to the confluence with Panther Creek. This reach has received extensive large wood and boulder placements to improve spawning and rearing habitat.
The third aquatic survey technique used in the Upper West Fork Millicoma River Validation Watershed was snorkel surveys of juvenile salmonids. These surveys were intended to provide measures of habitat capacities (in conjunction with the AHI surveys) and juvenile habitat usage (i.e. population numbers). Snorkel surveys were conducted on the West Fork Millicoma River throughout the large wood placement reach from Fish Creek to Panther Creek during 2005. During 2006, snorkel surveys were conducted on Elk Creek throughout the two large wood placement areas.
Additional efforts in cooperation with the Oregon Department of Forestry include systematically determining the extent of perennial streams, assessing fish presence, and updating the stream layer within Management Basin 11 which comprises the Validation Watershed. This information will then provide the starting point to determine systematic long-term sampling sites to determine overall restoration program effectiveness in the West Fork Millicoma River.
The Upper West Fork Millicoma River Validation Watershed in the Elliott State Forest represents an area of concentrated and comprehensive watershed restoration projects linked with a long history of inventory and monitoring activities. Based on the data collected as part of this project we will be able
Page 9

to determine coho salmon habitat limiting factors using the Reeves et al. (1989) procedure. Given the depth of data available (habitats, adult spawning estimates, juvenile summer rearing estimates) we should be able to calibrate this model for upper areas in the Coos watershed.
While the Upper West Fork Millicoma River Validation Watershed provides a wealth of possibilities for project- and program-effectiveness monitoring, its usefulness as an “Intensively Monitored Watershed” is limited for two reasons. First, considerable watershed restoration activities have occurred over both the Elk Creek and Upper West Fork 7th Field HUCs that would probably preclude their use as “treatments” and “controls,” respectively. Alternatively, using the combined 6th Field HUC as the “treatment” would necessitate identifying a comparable “control” either within the Elliott State Forest or on adjacent private and/or BLM lands. Probably the best location for this control watershed would be on the Weyerhaeuser Millicoma Tree Farm in one of the drainages into the East Fork Millicoma River.
The second constraint on using the Upper West Fork Millicoma River Validation Watershed as an Intensively Monitored Watershed is the requirement to have adult spawning traps and outmigrating smolt traps to determine population levels. At this point there are no such installations within the project area. The most convenient location for an adult trap would be on Elk Creek at the fish ladder. This site would capture the majority of spawning coho and steelhead in the Elk Creek. It would also be easy to install a smolt trap in close vicinity with the fish ladder. Alternate adult and smolt traps in the West Fork Millicoma River mainstem below its confluence with Elk Creek would require more effort, but would not be impossible. Traps at these sites would capture the productivity of the entire 6th Field HUC so as to accurately reflect the sum total of responses to watershed restoration projects.
Coos Bay Lowlands (Larson/Palouse Creeks) 6th Field HUC Validation Monitoring
The Coos Bay Lowlands 6th Field HUC Validation Watershed consists of the Palouse and Larson Creeks 7th Field HUCs (see Figure 4). The two streams are highly productive for coho salmon (Palouse Creek typically ranks as one of the highest spawning densities per mile on the Oregon coast), and have had salmon spawning surveys conducted since 1950. These two lowland basins have been the focus of concentrated monitoring efforts related to their stream mouth tide gates. The Larson Slough tide gate was replaced in 2001 with a “fish-friendlier” side-hinged design, while the Palouse Creek tide gate remains in its original 1988 configuration of a top-hinged wooden gate with a significant perched invert.
Both Larson and Palouse Creeks have had a history of watershed restoration projects (see Figure 4 and Table 4). Large wood placement projects began in the late-1990s in the upper reaches of Palouse Creek within the Elliott State Forest. This area was also the location for early riparian restoration projects on Palouse Creek (starting in the mid-1995s) and upper Larson Creek (1998-1999).
Table 4. Watershed restoration projects in the Coos Bay Lowlands 6th Field HUC validation watershed.
Project Costs Project Type Number
Length (mi.) Cash In-kind Total
Fish Passage* 5 17.2 $106,344 $1,330 $106,344Instream 6 1.2 $13,996 $3,474 $17,270Riparian 6 3.5 $124,130 $40,000 $164,130Road 3 0.2 $1,770 $10,000 $1,770Wetland 2 0.2 $159,785 $0 $159,785
Totals 22 22.0 $406,025 $54,804 $449,299* Stream length made accessible to adults and juveniles.
Page 10

�
���
� �
���
�
�� � ������������ �� �������������
�������
�����������
����������
�� ���� ������ ������
��������� ������������������
��� � ��� ���� ���
����� ������ ������������
�������� �����
!
���������
������������� ������ ���������������� ����������� ������������ ������� ����� �������������� !��"��������������� ���
�������

Fish passage restoration projects have occurred in three locations. The one that affects the most potential coho habitat is the replacement of the Larson Slough tide gate in 2001 with a “fish friendlier” side-hinged design. While the previous tide gate (first installed in 1929, with the previous replacement in 1988) had not prevented adult passage—as indicated in the high spawning salmon numbers—juvenile passage between the Haynes Inlet and Larson Creek was precluded, while the new design has certainly enhanced adult passage in the 15 miles of stream habitat in Larson Creek that has intrinsic potential for coho salmon (with the exception of one small tributary stream with a perched culvert). Other fish passage projects have included a culvert replacement in upper Larson, and three culvert replacements in upper Palouse Creek, each of which has provided access to additional spawning habitat.
Two significant instream complexity projects have been installed within the Validation Watershed area. Upper Palouse Creek within the Elliott State Forest has a long history with five large wood placement projects (since the late 1990’s), and these are currently well established. The second area of instream projects is located on the Brelage Pacific Dairy in the middle section of Larson Creek. In 2001, 24 conifer logs were placed perpendicular to the stream flow at 12 sites (2 logs/site) over 0.75 mile of stream. Pre-project AHI’s were conducted in 2000, and limited juvenile seining was conducted by ODFW in February, 2001 which netted no juvenile fish.
There are two wetland restoration projects of note in the Coos Bay Lowlands 6th Field HUC Validation Watershed. Both are perpetual easements under the USDA-Wetland Reserve Program (WRP). The Cowan site, approximately 51 acres, is located at the mouth of Larson Creek just upstream from the tide gate. This project has been restored by Duck Unlimited with an emphasis on providing freshwater wetland habitat for waterfowl. Ancillary riparian plantings have occurred on approximately 6.1 acres of the site, including about 3,000 feet the south bank of Larson Creek. The second site is the Fredrickson WRP project on lower Palouse Creek. This 17 acre easement has not yet been restored, and at present provides few wetland-related benefits.
Considerable watershed assessment and project monitoring efforts have occurred in the Coos Bay Lowlands 6th Field HUC Validation Watershed. Larson and Palouse are two of the sub-basins in the Coos Bay Lowlands Watershed Assessment (www.cooswatershed.org/Assess_CBLowlands.html). Very detailed analyses of aquatic habitats, coho spawning, and water temperatures are included in the assessment, along with a Limiting Factors analysis (Reeves et al., 1989). The Assessment also included recommendations and prioritization of needed actions that will govern restoration actions over the next five to ten years.
Program-effectiveness monitoring in the Coos Bay Lowlands (Palouse and Larson Creeks) 6th Field HUC has focused over the last five years on determining the effects of the Larson Slough tide gate on coho salmon life histories in the Larson sub-basin. For these evaluations, the Palouse sub-basin represents the “control”, with other land uses and restoration practices effecting populations variously. System-wide assessment and monitoring through this grant—and by cooperators—is listed in Table 5 and displayed in Figure 5.
Table 5. Aquatic surveys in the Coos Bay Lowlands Validation Watershed.
Survey Type Larson Creek Palouse Creek.
Aquatic Habitat Inventory (AHI) Winter 2004 Summer 2000, 2003, 2004 2003, 2004
Adult Spawning Survey 2002, 2003, 2004, 2005 2003, 2004, 2005 Juvenile Snorkel Survey 2005 2005
Page 12

����
��
��
��
������������ �������������� ��������������������������������������� �������� !��"����� ����#� ������
������������ ������������������� �
����������������������� ���������������
���������������������� �������������� ����!����
�������"��#�$�#���������������������%�������� $
� �����&���'() ' '() * *() +����
�������
����
�������

Through the assessment process and this grant, aquatic habitat inventories (AHI) have been conducted on all lands where access was permitted in the principal stream reaches, especially those important for salmon spawning. The only major lapse in AHI coverage is in a short portion of Larson Creek in the mid-valley section, and the lower two-thirds of Sullivan Creek, the major tributary to Larson Creek. Aside from this area, there is a lower, essentially “tidal” channel just behind the Larson tide gate that has not had AHI, but this area has been topographically surveyed so that similar data is available. Spawning surveys have occurred in all suitable habitats in both Larson and Palouse Creeks (possibly with the exception of the upper reach of Sullivan Creek). Interestingly, significant spawning was found in small, ephemeral tributaries in the upper Palouse watershed.
Project-effectiveness monitoring on Larson Creek targeted the lower elevation large wood placement. An AHI inventory was conducted in 2004 throughout this project area to allow comparison with the pre-project 2000 survey. At the same time as the post-project AHI a juvenile salmon snorkel survey was conducted. The results from these surveys showed that significant pool habitat developed as a result of the wood placement, and that these pools were occupied by coho salmon juveniles in comparatively higher densities than portions adjacent stream reaches without the wood.
The Coos Bay Lowlands 6th Field HUC Validation Watershed comprising the Larson and Palouse sub-basins provides a significant opportunity as “Intensively Monitored Watersheds” due to the long history of data collection and presence of existing life cycle monitoring sites. This area has:
• Long-term salmon spawning surveys (peak count data from 1950; AUC surveys from the 1990’s; complete basin spawning surveys from 2003 (including two years funded by this grant).
• Adult spawning salmon traps established in Larson (2004) and Palouse (2005). • Smolt traps established in Larson and Palouse (spring, 2005). • Aquatic habitat inventories (ODFW implementation of Hankin and Reeves (1988) conducted on
all accessible portions of the two basins (2001 – 2004). • Network of summer water temperature monitors (2004 and 2005), data analyses, and
determination of thermally-suitable salmonid habitat. • Determination of coho intrinsic potential for both streams (Larson and Palouse) and their major
tributaries following Thompson (2005) procedures. • Limiting factors analysis for coho salmon using the Reeves et al. (1989) methodology. • An additional coho limiting factors analysis using Ecosystem Management Decision Support
(Reynolds, 2002 and Reynolds and Hessburg, 2005).
Along with the intensive data collection and analyses, the Coos Watershed Association has existing relationships with landowners in both sub-basins that have allow continuing data collection and operation of the life cycle monitoring sites. As a result of the “coffee klatch” process conducted as part of the Coos Bay Lowlands Watershed Assessment, there is strong support in the area for watershed restoration projects, and a recognition that monitoring the results of these efforts contributes to improving conditions both for salmon and landowners in the project area.
(6). Other Project Information.
Lessons Learned
This project provided information and allowed data analyses that will provide the Coos Watershed Association with continuing value into the future. We were able to take a more holistic look at our
Page 14

programs, and test different methods to integrate monitoring into our watershed assessment, restoration project implementation, and project- and program-effectiveness evaluations. Through this process we learned a number of lessons that will guide our overall Association programs in the future if we are to answer the underlying question, “Does the collective effect of restoration actions on the part of CoosWA and its partners result in improved watershed condition and fish response?”
1. We need for good assistance for study design and analysis. Through this project we were able to establish excellent relationships with Drs. Phil Larsen at the U.S.E.P.A. Corvallis Research Laborary and Don Stevens of the Statistics Department of Oregon State University. They (along with Tony Olsen at U.S.E..P.A.) identified data requirements in order to create the EMAP probability-based sampling design at the beginning of this project. We again checked in with Drs. Larsen and Stevens towards the end of the project, and will shortly be able to generate the sample design. Two challenges emerged in the statistical design element of the study: first, we lacked consolidated GIS layers and databases of restoration projects of sufficient quality and accuracy to provide a reliable sample design; and secondly, the scale with which the EMAP group in Oregon is drawing samples for coastal studies is changing from 1:100,000 to 1:24,000. Our expectation is that higher quality sample designs will be possible using the more detailed data layers. Our development of data is consistent with this scale. Finally, the U.S.E.P.A. Star program which Dr. Stevens used to support his statistical “outreach” has expired. He has prepared a grant proposal to continue his effort.
2. Problems with staffing qualifications and turnover affected the continuity of the project and our ability to meet all our original objectives.
3. Our ability to create and maintain a scientifically-credible and adaptively managed watershed restoration program is positively affected by our relationships with University scientists (particularly Guillermo Giannico at OSU Sea Grant), a broad range of agency researchers (USFS, NOAA), and partners such as South Slough National Estuarine Research Reserve and the Oregon Department of Fish and Wildlife Charleston Office.
Literature Cited
Anderson, M. and J. Souder. 2005. Coos Watershed Association Riparian Restoration Planting and Establishment Monitoring Report. November, 2005. Charleston, OR: Coos Watershed Association.
Banks, J., E. Kolkemo, J. Colby, and J. Souder. 2001. Effectiveness Monitoring of Large Wood, Boulder Weirs, and Culvert Replacement Projects in Selected Streams of the Coos Watershed. Charleston, OR: Coos Watershed Association.
Firman, J. and S. Jacobs. 2001. A Survey Design for Integrated Monitoring of Salmonids. Corvallis, OR: Oregon Department of Fish and Wildlife.
Hankin, D. G. and G. H. Reeves. 1988. “Estimating total fish abundance and total habitat area in small streams based on visual estimation methods.” Can. J. Fish. and Aquatic Sci. 45: 834-844.
Mantua, N. J., S. R. Hare, Y. Zhang, J. M. Wallace, and R. C. Francis. 1997. “A Pacific interdecadal climate oscillation with impacts on salmon production.” Bull. Amer. Meteor. Soc. 78: 1069 – 1079.
ODF (Oregon Department of Forestry). 2003. Elliott State Forest Watershed Analysis. Prepared by
Page 15

Biosystems, Water Work Consulting, Coos Watershed Association, Alsea Geospatial, and Karen Bahus Technical Writing. October, 2003. Salem, OR: Oregon Department of Forestry.
PNAMP (Pacific Northwest Aquatic Monitoring Partnership). 2005a. Strategy For Coordinating Monitoring of Aquatic Environments in the Pacific Northwest. February, 2005.
PNAMP (Pacific Northwest Aquatic Monitoring Partnership). 2005ba. Establishing a Network of Intensively Monitored Watersheds in the Pacific Northwest. April 5, 2005.
Reeves, G. H., F. H. Everest, and T. E. Nickelson. 1989. Identification of Physical Habitats Limiting the Production of Coho Salmon in Western Oregon and Washington General Technical Report PNW-GTR-245 USDA-Pacific Northwest Research Station, Corvallis, OR.
Reynolds, K.M. and Hessburg, P.F. 2005. “Decision support for integrated landscape evaluation and restoration planning” Forest Ecology and Management 207:263-278.
Souder, J., M. Lester, and M. Anderson. 2005. Road Drainage Improvement for Sediment Reduction: Program Effectiveness Monitoring Report. Draft, November 10, 2005. Charleston, OR: Coos Watershed Association.
Stevens, D.L. 2002. Sampling Design and Statistical Analysis Methods for the Integrated Biological and Physical Monitoring of Oregon Streams. Report No. OPSW-ODFW-2002-07. Corvallis, OR: Oregon Department of Fish and Wildlife.
Thompson, J. 2005. “All streams are not created equal” Science Findings 72 USDA, Pacific Northwest Research Station, Corvallis, OR.
(7). Accounting of Project Exenditures. Table 5. Project expenditures by budget category.
Expense Type Budget Expenditures Monitoring Crew $36,560.00 $36,991.39 GIS Analyst $3,000.00 $2,776.01 Supplies/Materials $2,860.00 $2,859.24 Equipment $1,070.00 $1,049.88 Printing & Reproduction $250.00 $250.00 Travel $4,087.00 $3,898.67
Sub-totals $47,827.00 $47,825.19 Administration (10%) 4,782.70 $4,782.52
Total Project $52,609.70 $52,607.71
See attached match / in-kind documentation sheet.
Page 16

Ore
gon
Wat
ersh
ed E
nhan
cem
ent B
oard
(OW
EB)
File
: F:/u
ser/o
web
/form
s/m
atch
spr
eads
heet
Mat
ch /
In-K
ind
Doc
umen
tatio
n fo
r Fin
al R
epor
tO
WEB
Gra
nt #
204
-082
Org
aniz
atio
n N
ame
Act
ual
Don
ated
/ In
-Kin
dVo
lunt
eers
Gen
eral
Cas
h C
ontr
ibut
ion
Serv
ice s
Hou
rs W
orke
dH
ourly
Rat
eVo
lunt
eer V
alue
Des
crip
tion
OW
EB F
inal
Exp
endi
ture
s-->
$52,
608
N/A
N/A
N/A
N/A
OW
EB
Cas
h
Oth
er O
rgan
izat
ions
Sou
th S
loug
h N
ER
R$0
$8,0
940
$0$0
Dep
artm
ent o
f Env
ironm
enta
l Q
ualit
y §
319
Pro
gram
$5,0
59$0
$0To
tal D
olla
r Am
ount
$5,0
59$8
,094
0$0
Tota
l Ove
rall
Proj
ect C
osts
$65,
761
(Tot
al d
olla
r val
ue o
f OW
EB &
Oth
er O
rgan
izat
ion'
s A
ctua
l Cas
h C
ontr
ibut
ions
, In
-Kin
d Se
rvic
es a
nd V
olun
teer
val
ue A
LL a
dded
toge
ther
)
Tota
l Non
-OW
EB F
unds
$13,
153
(Tot
al d
olla
r val
ue o
f Oth
er O
rgan
izat
ion'
s A
ctua
l Cas
h C
ontr
ibut
ions
, In
-Kin
d Se
rvic
es a
nd V
olun
teer
val
ue A
LL a
dded
toge
ther
)
OW
EB M
atch
$1
3,15
3(W
hat d
olla
r val
ue o
f the
Tot
al N
on-O
WEB
Fun
ds a
re y
ou c
laim
ing
as O
WEB
Mat
ch. Y
ou a
re re
quire
d to
sho
w a
min
imum
of 2
5% o
f th
e to
tal a
ctua
l OW
EB c
ash
cont
ribut
ions
. You
may
sho
w m
ore
than
25%
.)(G
ener
al D
escr
iptio
n co
lum
n ca
n be
use
d to
des
crib
e ca
tego
ries
such
as
Tree
Pla
ntin
g, R
ent,
Cas
h, e
tc.)
Not
e: V
olun
teer
Hou
rs X
Vol
unte
er R
ate
= Vo
lunt
eer V
alue
(Com
bine
Vol
unte
er H
ours
by
Type
of W
ork.
Exa
mpl
e:To
tal p
roje
ct tr
ee p
lant
ing
hour
s (5
00) x
rate
. Do
not s
how
n in
divi
dual
am
ount
s - r
etai
n th
ose
reco
rds
in y
our f
iles)
Page 17