mr. g. ganesh dr. s. soosai john rosario - apjor.comapjor.com/downloads/010920156.pdf · the...
TRANSCRIPT

Asia Pacific Journal of Research Vol: I. Issue XXX, August 2015
ISSN: 2320-5504, E-ISSN-2347-4793
www.apjor.com Page 42
CONSUMERS’ PERCEPTION TOWARDS BRAND LOYALTY OF FMCG PRODUCTS
-AN ANALYSIS
Mr. G. GANESH
Assistant Professor and Research Scholar,
Siga College of Management and Computer Science,
Kappiyampuliyur, Villupuram, Mobile-8122355336
Dr. S. SOOSAI JOHN ROSARIO
Assistant Professor and Research Guide,
PG and Research Department of Commerce,
Periyar Government Arts College, Cuddalore-607001
ABSTRACT
The consumers’ perception towards brand loyalty of the FMCG product is analyzed awareness,
knowledge, attitude of the brand, risk aversion to change the brand, satisfaction and brand trust of the
consumers, variables namely brand, image, product quality, product knowledge, product involvement,
products attributes and brand loyalty of consumers. This highlights research article consumers’ perception
towards brand loyalty of FMCG products-an analysis
KEY WORDS: Consumer Perception, Brand Loyalty, Fast Moving Consumable Goods (FMCG), Brand
Awareness, Knowledge, Consumers Risk Aversion, Correlation and Regression Analysis
INTRODUCTION
Consumer perception towards the brand loyalty refers the continuous purchase of the products or
services from the same company instead of a substitute product or service from a competitor. Consumers’
perception is the identification of a particular brand in the mind of the consumer and it has a significant impact
on a brand. The consumer perception does not necessarily have very much impact on the actual performance of
the product; whereas it is based on the current reputation of brand and product image with respect to the
knowledge of the consumers. The consumers’ perception is the process of influence of the brand, information
about the brand which can lead to transformation of brand into brand loyalty. The consumers’ perception
towards brand loyalty of the FMCG product is analyzed awareness, knowledge, attitude of the brand, risk
aversion to change the brand, satisfaction and brand trust of the consumers.

Asia Pacific Journal of Research Vol: I. Issue XXX, August 2015
ISSN: 2320-5504, E-ISSN-2347-4793
www.apjor.com Page 43
Consumer Perception Consumer perception applies the concept of sensorial to marketing and advertising. Just as sensory
perception relates to how humans perceive and process sensory stimuli through their five senses. Consumer
perception pertains to how individuals form opinions about companies and the merchandise they offer
through the purchases the make.
Brand
A name, term, sign, symbol / design / a combination of them which is intended to identify the goods /
services of one seller / groups of sellers add to differentiate them from those of competitors is termed as
brand.
Brand Loyalty Brand loyalty is the favorable image turned in the minds of buyer which encourages him to buy the
product repeatedly. Even if his favorable brand is out of stock, brand loyalist would not switch over to rival
brands. He/she will wait till is available. It is said to occur when a consumer makes the choice of purchasing
one brand from among a set of alternatives consistently over a period of time. It is always considered to be
related to repetitive purchase behavior.
Fast Moving Consumable Goods (FMCGs)
FMCG generally includes wide range of frequently purchased consumer products such as toiletries,
soap, cosmetics, tooth cleaning products, shaving products and detergents, as well as other non-durables such
as glassware, bulbs, batteries, paper products, and plastic goods. FMCG also include pharmaceuticals,
consumer electronics, packaged food products, soft drinks, tissue paper, and chocolate bars.
CONSUMERS’ PERCEPTION TOWARDS BRAND LOYALTY OF FMCG PRODUCTS-AN ANALYSIS
Brand awareness is “the ability of the potential buyer to recognize and recall that a brand is a member of
a certain product category”. Brand awareness is essential for existing brand equity in any product or service.1
The brand awareness of the respondents in the fast moving consumer goods in Cuddalore district is presented in
the below Table 1.
Table 1: Descriptive Statistics of the Brand Awareness
S. No. Statement N Mean S.D. Variance
1. The Brand of FMCG product stays fixed in mind 560 3.86 1.23 1.51
2. Able to distinguish one brand from the other by its performance
560 3.99 0.91 0.83
3. Able to discriminate between brands, as I have prior knowledge about them
560 3.64 0.82 0.67
4. Awareness of the other brands produced by the same manufacturer
560 3.30 1.00 1.00
5. Good exposure to the brand plays an important role for remembrance
560 3.82 0.84 0.71
6. Brand recognition of the FMCGs products is due to its performance
560 3.79 1.03 1.07
Source: Computed from Primary Data
The descriptive statistics also show the consumers are able to distinguish one brand to other brand by its
performance with mean score of 3.99, followed by the FMCG products constantly stay in the consumer mind
with mean score of 3.86 and the good exposure to the brand plays an important role for remembrance of the
consumer with mean score of 3.82 towards the brand awareness of the consumers. The consumer are
recognise the brand only its performance and they are able to discriminate between brands, as they have
prior knowledge about them with mean score of 3.79 and 3.64 respectively. The awareness of the other
1 Aaker, D.A., (1991), Managing Brand Equity: Capitalizing on the Value of a Brand Name, New York: Capitalizing
on the Value of a Brand Name, New York:

Asia Pacific Journal of Research Vol: I. Issue XXX, August 2015
ISSN: 2320-5504, E-ISSN-2347-4793
www.apjor.com Page 44
brands produced by the same manufacturer has lowest mean score of 3.30 towards the brand awareness of the
consumers in fast moving consumer goods.
Brand Knowledge
Kevin Keller defined brand knowledge as awareness of the brand name and belief about the brand image.
Valuable beliefs are authentic beliefs - consistent and durable. In addition to belief, consumer experience is an
important part of brand knowledge. Consumer experience includes emotions, sensations, and activity. Using the
terminology of philosophy, beliefs are “explicit” knowledge meaning they can be put in words, and experience
is “tacit” knowledge meaning it cannot be put in words. The brand knowledge of the respondents in the fast
moving consumer goods in Cuddalore district is presented in the below Table 2.
Table 2: Descriptive Statistics of the Brand Knowledge
S. No. Statement N Mean S.D. Variance
1. Sure decision about the brand before buying 560 3.24 1.49 2.22 2. Helps to recall the attributes of the product 560 3.25 1.02 1.05
3. Brand knowledge helps to identify the ingredients of the product
560 3.34 1.12 1.26
4. Stimulates the use of the same brand 560 3.95 0.85 0.73
5. Enables one to understand the image of the brand 560 3.54 0.76 0.57
6. Able to distinguish between original brand and spurious brand
560 4.36 0.85 0.73
Source: Computed from Primary Data
The consumers are able differentiate the original brand to spurious brand has scored highest mean value of
4.36, followed by mean value of 3.95 for they are stimulated to use the same brand, mean value of 3.54 for
consumers enables to understand the image of the brand and mean value of 3.34 for the brand help them to
understanding the ingredients of the product. However, brand knowledge helps them to recall the attributes
of the product and a considerable portion of the consumers are not taken sure decision about what type brand
before the buying has scored lowest mean value of 3.25 and 3.24 towards the respondents in the fast moving
consumer goods.
Brand Loyalty
Brand loyalty is the one of the important concept in strategic marketing. Brand loyalty is the consumer
faithfulness towards a specific brand and it is expressed through repeat purchases of the brand and other positive
behaviours of the mouth advocacy, irrespective of the marketing pressures generated by the other competing
brands. The brand loyalty of the respondents in the fast moving consumer goods in Cuddalore district is
displayed in the Table 3.
Table 3: Descriptive Statistics for Consumer Attitude towards the Brand Loyalty
S. No. Statement N Mean S.D. Variance
1. The brand chosen has a good reputation 560 4.20 0.87 0.76
2. Stick to the same brand 560 3.95 0.90 0.81
3. Enjoy using this brand 560 3.78 0.83 0.68
4. Appreciate those who use the same brand 560 3.31 0.98 0.95
5. I say positive things about my brand 560 3.74 0.75 0.57
6. I always buy my chosen brand 560 4.07 1.05 1.10
7 I consider myself loyal to my brand 560 3.79 0.87 0.75
8. I would recommend my main brand to other people
560 2.97 1.07 1.15
9. Share views of the brand with others 560 2.41 1.22 1.49
Source: Computed from Primary Data

Asia Pacific Journal of Research Vol: I. Issue XXX, August 2015
ISSN: 2320-5504, E-ISSN-2347-4793
www.apjor.com Page 45
Descriptive statistics shows that the consumers are selecting the product on the basis of good reputation of the brand with highest mean value of 4.20, followed by they always purchase the chosen brand with mean value of 4.07, they attach with the same brand with mean value of 3.95, they consider the loyalty of their brand with mean value of 3.97 and they enjoy using the brand with mean value of 3.78 towards the respondent attitude of brand loyalty. They appreciate those who are using the brand and they recommend the brand to other people with mean value of 3.31 and 2.97 respectively. They have to share views of the brand with others has scored lowest mean value of 2.41 towards the consumer attitude of the brand loyalty. Satisfaction of the Brand Consumer satisfaction is the measure of how the products or service are meeting the expectation of the consumers. In the competitive market how the business concern competes the customer satisfaction and also it is the key strategy of marketing. The satisfaction of the brand of the respondents in the fast moving consumer goods in Cuddalore district is displayed in the Table 4.
Table 4: Descriptive Statistics for Satisfaction of the Brand
S.No Statement N Mean S.D. Variance
1. I am satisfied with the brand purchased the product 560 3.97 0.90 0.81
2. Different product attributes keep me in the same brand
560 3.69 0.80 0.64
3. My loyalty towards a particular product brand is increases the satisfaction about the brand
560 3.26 1.21 1.46
4. I am dissatisfied about a particular brand I do not like to purchase the repeatedly
560 3.96 1.06 1.13
5. I attain pleasure from the particular FMCG brands I am loyal towards the brand
560 3.90 0.82 0.67
Source: Computed from Primary Data
The descriptive statistics also indicates that they satisfied with the brand purchased the product with mean value of 3.97, followed by the consumers are dissatisfied about a particular brand they don’t like to purchase the repeatedly with mean value of 3.96, they attain pleasure from the particular FMCG brands I am loyal towards the brand with mean value of 3.90 and different product attributes keep me in the same brand with mean value of 3.69 towards the respondents in the satisfaction of brand loyalty. They are loyalty in a particular product brand is increases the satisfaction about the brand has scored lowest mean value of 3.26 towards the respondents satisfaction of brand loyalty. Consumers Risk Aversion to Change the Products The risk aversion has been defined as a decision maker’s “preference for a guaranteed outcome over a probabilistic one having an equal expected value”. The consumers risk aversion has been measured by way risk aversion is inferred from their responses to various choices and outcomes.
Table 5: Descriptive Statistics for Consumers Risk Aversion to Change the Products
S. No. Statement N Mean S.D. Variance
1. I do not switch FMCG brand because of the high switch cost implications
560 3.27 1.58 2.49
2. I do not switch FMCG brand because of the effort required to reach a level of comfort.
560 3.19 1.04 1.08
3. I avoid switching FMCG brands due to the risk involved.
560 3.25 0.95 0.90
4. I switch FMCG brands according to the prevailing economic conditions
560 3.86 1.37 1.88
5. I prefer do not to switch FMCG brand as I stand to lose out on the benefits from loyalty programmes.
560 3.65 0.76 0.58
6. If I like a brand I rarely switch from it just to try something different
560 3.24 1.02 1.04
7. I would rather wait for others to try a new brand than try it myself
560 2.66 1.39 1.93
Source: Computed from Primary Data
Asia Pacific Journal of Research Vol: I. Issue XXX, August 2015
ISSN: 2320-5504, E-ISSN-2347-4793
www.apjor.com Page 46
It is clear from the Table 5 the consumers switch FMCG brands according to the prevailing economic
conditions with mean value of 3.86, followed by they prefer do not to switch FMCG brand as they stand to
lose out on the benefits from loyalty programmes with mean value of 3.65, they do not switch FMCG brand
because of the high switch cost implications with mean value of 3.27 towards the respondents risk aversion
to change the products. They avoid to switching the FMCG brands due to the risk involved with mean value
of 3.25 and they like a brand rarely switch from it just to try something different with value of 3.24 towards
the respondents. The consumers not switch FMCG brand because of the effort required to reach a level of
comfort and they will rather to wait for other to try a new brand with lowest mean value of 3.19 and 2.66
respectively towards the respondents risk aversion to change the products.
Brand Trust
Brand trust is the willingness of the average consumer to rely on the ability of the brand to perform its
stated function. Brand trust is simply the trust a consumer has in that specific brand. Brand trust leads to
brand loyalty or brand commitment because trust creates exchanges in relationships that are highly valued.
The concept of brand commitment is related to the loyalty of consumers towards a particular brand in a
product class and is gaining increasing weight in consumer behaviour.
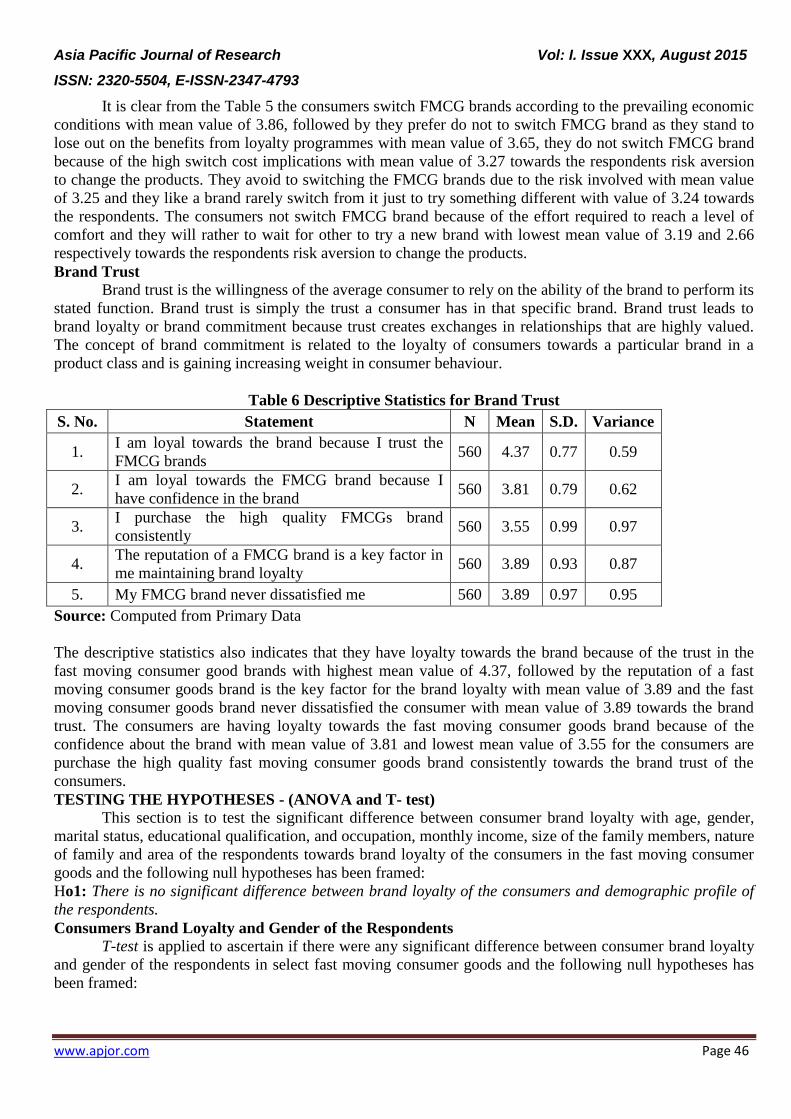
Table 6 Descriptive Statistics for Brand Trust
S. No. Statement N Mean S.D. Variance
1. I am loyal towards the brand because I trust the
FMCG brands 560 4.37 0.77 0.59
2. I am loyal towards the FMCG brand because I
have confidence in the brand 560 3.81 0.79 0.62
3. I purchase the high quality FMCGs brand
consistently 560 3.55 0.99 0.97
4. The reputation of a FMCG brand is a key factor in
me maintaining brand loyalty 560 3.89 0.93 0.87
5. My FMCG brand never dissatisfied me 560 3.89 0.97 0.95
Source: Computed from Primary Data
The descriptive statistics also indicates that they have loyalty towards the brand because of the trust in the
fast moving consumer good brands with highest mean value of 4.37, followed by the reputation of a fast
moving consumer goods brand is the key factor for the brand loyalty with mean value of 3.89 and the fast
moving consumer goods brand never dissatisfied the consumer with mean value of 3.89 towards the brand
trust. The consumers are having loyalty towards the fast moving consumer goods brand because of the
confidence about the brand with mean value of 3.81 and lowest mean value of 3.55 for the consumers are
purchase the high quality fast moving consumer goods brand consistently towards the brand trust of the
consumers.
TESTING THE HYPOTHESES - (ANOVA and T- test)
This section is to test the significant difference between consumer brand loyalty with age, gender,
marital status, educational qualification, and occupation, monthly income, size of the family members, nature
of family and area of the respondents towards brand loyalty of the consumers in the fast moving consumer
goods and the following null hypotheses has been framed:
Ho1: There is no significant difference between brand loyalty of the consumers and demographic profile of
the respondents.
Consumers Brand Loyalty and Gender of the Respondents
T-test is applied to ascertain if there were any significant difference between consumer brand loyalty
and gender of the respondents in select fast moving consumer goods and the following null hypotheses has
been framed:

Asia Pacific Journal of Research Vol: I. Issue XXX, August 2015
ISSN: 2320-5504, E-ISSN-2347-4793
www.apjor.com Page 47
Ho 1a: There is no significant difference between consumer brand loyalty and gender of the respondents.
Table 7: T- Test for Consumers Brand Loyalty and Gender of the Respondents
Variables Gender N Mean S.D Std. Error
of Mean F-Value P-Value
Brand Awareness
Male 350 21.99 3.00 0.16
-4.856 0.001* Female 210 23.06 2.22 0.15
Total 560 22.39 2.78 0.12
Brand Knowledge
Male 350 21.21 3.15 0.17
-5.001 0.001*
rejected Female 210 22.45 2.63 0.18
Total 560 21.67 3.03 0.13
Attitude towards
Brand Loyalty
Male 350 32.08 4.10 0.22 -1.093
accepted 0.275 Female 210 32.44 3.53 0.24
Total 560 32.21 3.90 0.16
Satisfaction of the
Brand
Male 350 22.09 2.77 0.15
-3.413 0.001* Female 210 22.85 2.42 0.17
Total 560 22.38 2.67 0.11
Risk Aversion to
Change the Products
Male 350 22.66 4.58 0.24
-3.373 0.004* Female 210 23.90 3.96 0.27
Total 560 23.13 4.39 0.19
Brand Trust
Male 350 19.05 2.35 0.13
-7.319 0.001* Female 210 20.26 1.56 0.11
Total 560 19.50 2.16 0.09
Source: Computed from Primary Data
The calculated t value of the brand awareness (t value -4.856), brand knowledge (t value -5.001),
satisfaction of the brand (t value -3.413), risk aversion to change the products (t value -3.373), and brand trust
(t value -7.319) are significant at 5 per cent level. Hence, the stated hypothesis of there is no significant
difference between consumer brand loyalty and gender of the respondents is rejected. However, the calculated
t value of -1.093 for the consumer attitude towards brand loyalty is not significant. Hence, the stated
hypothesis of there is no significant difference between consumer brand loyalty and gender of the respondents
is accepted.
Further, the mean value indicates that the female respondents are having more brand loyalty as
compared to male respondents.
Consumers Brand Loyalty and Age Group of the Respondents
One way ANOVA was applied to ascertain if there were any significant difference between consumer
brand loyalty and age groups of the respondents and the following null hypotheses has been framed:

Asia Pacific Journal of Research Vol: I. Issue XXX, August 2015
ISSN: 2320-5504, E-ISSN-2347-4793
www.apjor.com Page 48
Ho 1b: There is no significant difference between consumer brand loyalty and age of the respondents.
Table 7: One Way ANOVA for Consumers Brand Loyalty and Age of the Respondents
Variables Age N Mean S.D. Std. Error
of Mean F-Value P-Value
Brand
Awareness
16 to 25 years 99 22.23 2.26 0.23
6.175 0.001*
26 - 35 Years 186 23.05 2.08 0.15
36-45 Years 179 22.15 2.97 0.22
Above 45 Years 96 21.71 3.70 0.38
Total 560 22.39 2.78 0.12
Brand
Knowledge
16 to 25 years 99 22.24 2.76 0.28
5.846 0.001*
26 - 35 Years 186 21.67 2.49 0.18
36-45 Years 179 21.94 3.08 0.23
Above 45 Years 96 20.59 3.81 0.39
Total 560 21.67 3.03 0.13
Attitude
towards Brand
Loyalty
16 to 25 years 99 31.51 4.36 0.44
7.091 0.001*
26 - 35 Years 186 32.63 3.03 0.22
36-45 Years 179 32.86 2.95 0.22
Above 45 Years 96 30.94 5.69 0.58
Total 560 32.21 3.90 0.16
Satisfaction of
the Brand
16 to 25 years 99 21.56 3.45 0.35
4.251 0.006*
26 - 35 Years 186 22.40 2.77 0.20
36-45 Years 179 22.69 2.16 0.16
Above 45 Years 96 22.60 2.21 0.23
Total 560 22.38 2.67 0.11
Risk Aversion
to Change the
Products
16 to 25 years 99 23.07 4.76 0.48
3.366 0.018*
26 - 35 Years 186 23.68 3.69 0.27
36-45 Years 179 22.33 4.69 0.35
Above 45 Years 96 23.59 4.54 0.46
Total 560 23.13 4.39 0.19
Brand Trust
16 to 25 years 99 18.93 2.12 0.21
3.833 0.010*
26 - 35 Years 186 19.69 2.43 0.18
36-45 Years 179 19.74 2.12 0.16
Above 45 Years 96 19.29 1.58 0.16
Total 560 19.50 2.16 0.09
Source: Computed from Primary Data
The calculated F value of 6.175, 5.846, 7.091, 4.251, 3.366 and 3.833 to the above respective variable of
brand awareness, brand knowledge, attitude towards brand loyalty, satisfaction of the brand, risk aversion to
change the products, and brand trust are significant at 5 per cent level. Hence, the stated hypothesis of there is
no significant difference between consumer brand loyalty and age of the respondents is rejected.
Further, the mean score indicates that the age category of 26 to 35 years is having more brand
awareness as compared to other category of respondents. The age category of 16 to 25 years is having more
brand knowledge as compared to other category of respondents. The age category of 36 to 45 years is having
more brand loyalty, satisfaction and brand trust as compared to other category of respondents. The age
category of 26 to 35 years is having more risk aversion to change the products as compared to other category
of respondents.
Consumers brand loyalty and marital status of the respondents
One way ANOVA was applied to ascertain if there were any significant difference between consumer
brand loyalty and marital status of the respondents and the following null hypotheses has been framed:

Asia Pacific Journal of Research Vol: I. Issue XXX, August 2015
ISSN: 2320-5504, E-ISSN-2347-4793
www.apjor.com Page 49
Ho 1c: There is no significant difference between consumer brand loyalty and marital status of the
respondents.
Table 8: ANOVA for Consumers Brand Loyalty and Marital Status
Variables Marital
Status N Mean S.D.
S.E.
Mean F-Value P-Value
Brand
Awareness
Married 360 22.65 2.33 0.12
7.561 0.001* Unmarried 160 22.15 3.16 0.25
Others (Divorced /Widow) 40 20.98 4.16 0.66
Total 560 22.39 2.78 0.12
Brand
Knowledge
Married 360 21.24 3.07 0.16
10.531 0.001* Unmarried 160 22.41 2.45 0.19
Others (Divorced /Widow) 40 22.60 3.91 0.62
Total 560 21.67 3.03 0.13
Attitude
towards Brand
Loyalty
Married 360 32.20 4.01 0.21
2.151 0.117 Unmarried 160 31.95 3.77 0.30
Others (Divorced /Widow) 40 33.38 3.17 0.50
Total 560 32.21 3.90 0.16
Satisfaction of
the Brand
Married 360 22.59 2.61 0.14
6.429 0.002* Unmarried 160 21.76 2.74 0.22
Others (Divorced /Widow) 40 22.90 2.47 0.39
Total 560 22.38 2.67 0.11
Risk Aversion
to Change the
Products
Married 360 23.42 4.11 0.22
2.838 0.059 Unmarried 160 22.43 4.35 0.34
Others (Divorced /Widow) 40 23.30 6.41 1.01
Total 560 23.13 4.39 0.19
Brand Trust
Married 360 19.69 1.72 0.09
4.302 0.014* Unmarried 160 19.09 2.67 0.21
Others (Divorced /Widow) 40 19.43 3.13 0.49
Total 560 19.50 2.16 0.09
Source: Computed from Primary Data
The calculated F value of 7.561, 10.531, 6.429, and 4.302 to the above respective variable of brand
awareness, brand knowledge, satisfaction of the brand, and brand trust are significant at 5 per cent level.
Hence, the stated hypothesis of there is no significant difference between consumer brand loyalty and marital
status of the respondents is rejected.
However, the calculated F value of 2.151 and 2.838 of the variable of attitude towards brand loyalty
and risk aversion to change the products are significant at 5 per cent level. Hence, the stated hypothesis of
there is no significant difference between consumer brand loyalty and marital status of the respondents is
accepted.
Consumers brand loyalty and educational qualification of the respondents
One way ANOVA was applied to ascertain if there were any significant difference between consumer
brand loyalty and educational qualification of the respondents and the following null hypotheses has been
framed:

Asia Pacific Journal of Research Vol: I. Issue XXX, August 2015
ISSN: 2320-5504, E-ISSN-2347-4793
www.apjor.com Page 50
Ho 1d: There is no significant difference between consumer brand loyalty and education of the respondents.
Table 9: One Way ANOVA for Consumers Brand Loyalty and Education
Variables Education N Mean S.D. Std. Error
of Mean F-Value P-Value
Brand
Awareness
High School Level 175 21.55 3.21 0.22
6.774 0.001* Graduate Level 212 21.85 3.32 0.25
Post Graduate 173 21.43 2.41 0.18
Total 560 21.67 3.03 0.13
Brand
Knowledge
High School Level 175 33.00 4.16 0.31
1.303 0.272 Graduate Level 212 31.30 4.38 0.30
Post Graduate 173 32.54 2.57 0.20
Total 560 32.21 3.90 0.16
Attitude
towards
Brand Loyalty
High School Level 175 22.33 2.48 0.19
10.375 0.001* Graduate Level 212 22.06 2.81 0.19
Post Graduate 173 22.82 2.63 0.20
Total 560 22.38 2.67 0.11
Satisfaction of
the Brand
High School Level 175 23.53 5.40 0.41
3.895 0.021* Graduate Level 212 23.48 3.88 0.27
Post Graduate 173 22.29 3.71 0.28
Total 560 23.13 4.39 0.19
Risk Aversion
to Change the
Products
High School Level 175 19.44 2.03 0.15
4.618 0.010* Graduate Level 212 19.23 2.17 0.15
Post Graduate 173 19.90 2.24 0.17
Total 560 19.50 2.16 0.09
Brand Trust
High School Level 175 21.95 3.32 0.25
4.655 0.010* Graduate Level 212 21.65 3.21 0.22
Post Graduate 173 21.43 2.41 0.18
Total 560 21.67 3.03 0.13
Source: Computed from Primary Data
The calculated F value 6.774, 10.375, 3.895, 4.618, and 4.655 to the above respective variable of
brand awareness, attitude towards brand loyalty, satisfaction of the brand, risk aversion to change the
products, and brand trust are significant at 5 per cent level. Hence, the stated hypothesis of there is no
significant difference between consumer brand loyalty and education of the respondents is rejected.
The graduate level educated respondents are more brand awareness as compared to other category of
educated respondents. The post graduate level educated respondents are more brand attitude towards the
brand loyalty as compared to other category of educated respondents. The high school level educated
respondents are more satisfaction, risk aversion to change the products and brand trust towards the brand
loyalty as compared to other category of educated respondents.
CONSUMER PRE- PURCHASE DECISION TOWARDS FMCGs
Consumer purchase behaviour is mainly depend with the needs of the consumers, attitude, past
experience in the usage, and external influences like advertisement, promotion, retail availability, personal
selling, word-of-mouth, packaging and pricing. The consumers also decide what type of product to be
purchased, how much to be purchased, when to buy the products and where to buy the products. After
purchasing the products or services the consumption and responses generate the post-usage feelings of

Asia Pacific Journal of Research Vol: I. Issue XXX, August 2015
ISSN: 2320-5504, E-ISSN-2347-4793
www.apjor.com Page 51
satisfaction and changes in attitude. These various aspects of consumer pre purchase behaviour and post
purchase behavior is presented in this section.
Table 10: Family Initiated the Need for FMCG Products
S.No. Initiation No. of Respondents Frequency Cumulative Frequency
1 Father 12.32 12.32 12.32
2 Mother 6.61 18.93 6.61
3 Husband 39.11 58.04 39.11
4 Wife 35.00 93.04 35.00
5 Children 6.96 100.00 6.96
Total 100.00
Source: Primary Data
It is clear from the Table 10 that the husband has initiated the need for FMCG has highest of 39.11
percent and wife initiated the need for the products 35 per cent. The position of father 12.32 per cent, children
6.96 per cent and mother 6.61 per cent towards the initiated in the family need for FMCGs products in the
Cuddalore district.
Table 11: Circumstances for the Reorganization of Your Needs
S. No. Statements SA A N DA SDA Total
1. Interest towards FMCGs products 97 265 187 2 9 560
17.32 47.32 33.39 0.36 1.61 100
2. Emerging beauty consciousness 104 152 100 132 72 560
18.57 27.14 17.86 23.57 12.86 100
3. To be fashionable 96 109 100 110 145 560
17.14 19.46 17.86 19.64 25.89 100
4. To protect health 247 207 89 8 9 560
44.11 36.96 15.89 1.43 1.61 100
5. To live healthy and hygienic life 212 173 150 13 12 560
37.86 30.89 26.79 2.32 2.14 100
6. Sales and promotional activities of firms 80 238 179 50 13 560
14.29 42.50 31.96 8.93 2.32 100
7. Low-unit price of FMCGs products 100 170 157 123 10 560
17.86 30.36 28.04 21.96 1.79 100
8. To attain prestige and social status 81 238 139 90 12 560
14.46 42.50 24.82 16.07 2.14 100
9. Inherent features and attributes of
FMCGs products
42 217 237 21 43 560
7.50 38.75 42.32 3.75 7.68 100
Source: Primary Data
The need for recognition shows that the FMCGs are mainly to protect health, to live healthy and
hygienic life, interest towards FMCGs products, and to attain prestige and social status are the predominant
reason among the respondents. However, they are to be fashionable, emerging beauty consciousness, inherent
features and attributes of FMCGs products and low-unit price of FMCGs products are less dominant among
the respondents in the need for recognition.

Asia Pacific Journal of Research Vol: I. Issue XXX, August 2015
ISSN: 2320-5504, E-ISSN-2347-4793
www.apjor.com Page 52
Table 12: Post- Purchase Behaviour
S. No. Variables SA A N DA SDA Total
1. Lodge complaints to the seller if the
product fails to satisfy
183 219 30 70 58 560
32.68 39.11 5.36 12.50 10.36 100
2.
If satisfied, will have discussions
with my friends to popularize the
brand name
57 315 118 50 20 560
10.18 56.25 21.07 8.93 3.57 100
3.
Speak well about the product and
brand if it fulfills expectations about
the brand
111 121 299 20 9 560
19.82 21.61 53.39 3.57 1.61 100
4.
Advertisement increases the brand
image and product information of
FMCGs products.
34 168 130 178 50 560
6.07 30.00 23.21 31.79 8.93 100
5. Advertisement results in price hike 280 154 108 9 9 560
50.00 27.50 19.29 1.61 1.61 100
6. Switch over to other brands if it fails
to satisfy
248 201 92 9 10 560
44.29 35.89 16.43 1.61 1.79 100
7.
Speak ill of the product and brand if
it fails to fulfill expectations about
the brand
75 176 239 60 10 560
13.39 31.43 42.68 10.71 1.79 100
8.
Advertised products are more
reliable and dependable than
unadvertised ones
41 42 158 19 300 560
7.32 7.50 28.21 3.39 53.57 100.00
9. Product attributes are overstated in
most of the advertisements
91 370 78 11 10 560
16.25 66.07 13.93 1.96 1.79 100.00
10.
The procedure followed by retailers
and manufacturers in handling
complaints are satisfactory
29 122 279 121 9 560
5.18 21.79 49.82 21.61 1.61 100.00
Source: Primary Data
Majority of the consumers are strongly agree with the product attributes are overstated in most of the
advertisements and they switch over to other brands if the product fails to satisfy the consumers. The majority
of the consumers also agree with the advertisement results in the price hike of the products. The consumers
are lodge complaints to the seller if the products fail to satisfy them and at the same time if they satisfied, they
have discussion with their friends to popularize the brand name are significant among the respondents.
However, most of the respondents are strongly disagree with advertised products are more reliable and
dependable than unadvertised ones towards the respondents post purchase beahviour in the brand loyalty.
Regression Analysis of Consumer Perception towards the Brand Loyalty
The regression analysis is used to analyse the consumer perception towards brand loyalty by way of
brand awareness, brand loyalty, attitude towards the brand, satisfaction of the brand, risk aversion to change
the brand and brand trust. The following hypothesis has been formulated.
Ho2: There is no significant difference between the family member initiation of the FMCGs products and the
consumer perception towards brand loyalty.

Asia Pacific Journal of Research Vol: I. Issue XXX, August 2015
ISSN: 2320-5504, E-ISSN-2347-4793
www.apjor.com Page 53
Table 13: Model Summary
Model R R Square Adjusted R Square Std. Error of the
Estimate
1 .262a .069 .058 1.04433
Source: Computed from Primary Data
Table 13 (a): ANOVAa
Model Sum of
Squares Df Mean Square F Sig.
1
Regression 44.384 6 7.397 6.783 .000b
Residual 603.114 553 1.091
Total 647.498 559
Source: Computed from Primary Data
Table 139(b): Coefficientsa
Model Unstandardized Coefficients
Standardized
Coefficients t Sig.
B Std. Error Beta
1
(Constant) 2.401 0.584
4.112 0.000
Brand awareness -0.016 0.018 -0.040 -0.862 0.389
Brand knowledge -0.087 0.019 -0.246 -4.666 0.000
Attitude towards
brand loyalty 0.052 0.015 0.189 3.576 0.000
Satisfaction of the
brand 0.059 0.020 0.147 3.022 0.003
Risk aversion to
change the
products
-0.006 0.013 -0.024 -0.450 0.653
Brand trust 0.008 0.021 0.015 0.354 0.723
Source: Computed from Primary Data
The calculated t value of -0.862, 0.450, and -0.354 to the variables of brand knowledge, brand loyalty and
satisfaction of the brand is significant. Hence, the stated hypothesis of there is no significant difference
between family members initiated the need for FMCGs and consumer perceptions towards brand loyalty, is
rejected.
The calculated t value of -4.666, 3.576, and 3.022 to the variables of brand knowledge, brand loyalty
and satisfaction of the brand is significant. Hence, the stated hypothesis of there is no significant difference
between family members initiated the need for FMCGs and consumer perceptions towards brand loyalty, is
rejected.
FINDINGS AND SUGGESTIONS
The following importance findings and suggestions are as under
Based on product quality the mean value of the sun feast have scored highest average acceptance
score of 17.95 and lowest average acceptance score of 15.76 for dukes towards the brand loyalty of
the
Based on price the mean value of the Britannia industries limited have scored highest average
acceptance score of 10.81 and lowest average acceptance score of 9.80 for dukes towards the brand
loyalty of the consumers.

Asia Pacific Journal of Research Vol: I. Issue XXX, August 2015
ISSN: 2320-5504, E-ISSN-2347-4793
www.apjor.com Page 54
Based on promotion the mean value of the Sun feast have scored highest average acceptance score of
17.34 and lowest average acceptance score of 14.50 for Priya Gold biscuits towards the brand loyalty
of the consumers.
Based on distribution the mean value of the Britannia industries limited have scored highest average
acceptance score of 14.43 and lowest average acceptance score of 12.98 for Priya Gold biscuits
towards the brand loyalty of the consumers.
SUGGESTIONS
Building brand equity is crucial for FMCG products where consumers heavily depend on the brand for
the product category in a highly competitive and brand conscious market. Researchers found that brand
awareness, brand loyalty, perceived quality and brand associations had a significant effect on band equity.
Brand association demonstrated the strongest impact, indicating the essential role of developing feels and
thoughts with the brand in building brand equity in the Indian FMCG industry. This means that, consistent
with previous studies, strong associations that support a competitively attractive and distinct brand position
could create a favorable feeling and behavior toward the FMCG brands. The results also portrayed the
significant influence of brand loyalty to the development of brand equity. The empirical data and statistical
tests in the study provided support for the positive and direct relationship between perceived quality and
brand equity. Surprisingly, brand awareness emerged as a not so important factor indicating that having a
brand name alone is not a guarantee of a successful brand in the FMCG industry. Since marketing and brand
managers often have limited
CONCLUSION
The consumers’ perception towards brand loyalty of the FMCG product is analyzed awareness,
knowledge, attitude of the brand, risk aversion to change the brand, satisfaction and brand trust of the
consumers. The researcher application analysis towards t- test, ANOVA, regression and correlation analysis,
the next chapter focuses on the summary of findings, suggestions, conclusion and scope for the future
directions.
REFERENCES 1. Aaker, D.A., (1991), Managing Brand Equity: Capitalizing on the Value of a Brand Name, New
York: Capitalizing on the Value of a Brand Name, New York: 2. Burlakanti and Romala Vijaya Srinivas, “The Most Influential Factors of Consumers’ Buying
Pattern At Organized And Unorganized Retail Stores With Special Reference To Kakinada City, Andhra Pradesh”, Indian Journal of Marketing, January 2013, pp. 14-22.
3. Edward Vinod and Rajeshwari Panigrahi, “Purchase Behavior of Gen Y in the Indian Market – Influence of Advertisements”, GITAM Journal of Management, Vol.11 No.4, pp.104-122
4. Gurupandi, M (2013)“Customer’s Behavior and Motivating Factors towards Purchase of Ornament Products - An Analytical Study”, GITAM Journal of Management, Jan-Mar 2013, Vol.11 No.1, pp.90-100
5. HA, H.Y. (2004), Factors Influencing Consumer Perceptions of Brand Trust Online, Journal of Products and Brand Management.
6. Keerthi Pandiyan and K.K. RamaChandran(2013)1 “Awareness of Postal Retail Services:
Customers Perpective”, GITAM Journal of Management, Vol.11 No.4, pp.18-40 Oct-Dec 2013. 7. Rajeev K. Shukla, Ajit Upadhyaya and Deepak Modi(2013)“Income Effect on Customer
Satisfaction for Corporate Hospitals Services-An Empirical Investigation”, Vol.11 No.1 pp. 90-100
8. Rama Mohana Rao, K and K. Ratna Manikyam(2013) “Customer’s Shopping and Buying Experience with Small Scale Retail Units - A Case Study.” GITAM Journal of Management Vol.11 No.2 PP11-25 Apr-Jun 2013.
9. Valarie A. Zeithaml (1988), “Consumer Perceptions of Price, Quality, and Value: A Means - End Model and Synthesis of Evidence, Journal of Marketing Vol. 52 (7), pp. 2 -22.
10. Veni, P and Vishwanath, B, “Consumer and Retailers Perception about Chinese Mobile Handsets in Hyderabad City - An Analytical Study”, GITAM Journal of Management Jul-Sept 2013,Vol.11 No.3, pp.132-143