mr glossary - ttumr image. the effect is used in bright-blood imaging of the heart for dynamic...
TRANSCRIPT

www.siemens.com/medical
MR Glossary


A B C D E F G H I J K L M N O P Q R S T U V W Z 123A
Acquisition MR measurement technique. Data acquisition during MR imaging. To improve the signal-to-noise ratio in the image, several acquisitions can be performed to image a slice. At the same time, they are averaged during image reconstruction (averages).
Acquisition matrix –> Raw data matrix
Acquisition time (TA) MR measurement technique. Measurement time for an entire data set.
Acquisition window MR measurement technique. The time frame in a pulse sequence during which the MR signal was acquired.
Active shielding Magnetic field: For strong magnets, the stray field has to be actively shielded to increase the safety zone. For this purpose, secondary com-pensating coils are attached around the magnet opposite the primary field-generating coils.Gradients: Gradient systems with opposed coils to reduce eddy currents.
TA:Time to Acquisition

A B C D E F G H I J K L M N O P Q R S T U V W Z 123A
Active shim Quality assurance. Shim by adjusting the cur-rents in the shim coils.
Adaptive Combine Measurement parameters. Algorithm for com-bining the channels of MR signals from several receiver coils. Adaptive Combine improves the measurement results for most measurement protocols.
ADC image Diffusion-weighted imaging. ADC images can be reconstructed from diffusion-weighted images with at least 2 b-values. The contrast corresponds to the spatially distributed diffusion coefficients of the acquired tissue and does not contain T1 or T2* portions.
Aliasing artifact Image quality. Aliasing artifacts are generated when the measurement object is outside the FoV but still within the sensitive volume of the coil. Signals from outside the FoV overlap the image, but on the opposite side. Caused by the sampling and subsequent Fourier transformation of signal components above the Nyquist frequency. Reme-

A B C D E F G H I J K L M N O P Q R S T U V W Z 123A
died primarily through oversampling, but regional presaturation may be used as well.
Analog-to-digital converter (ADC)
MR components. Part of the computer system which converts the analog MR signal into a digi-tal signal.
Array coil MR components. An array coil combines the advantages of smaller coils (high signal-to-noise ratio) with those of larger coils (large field of view). It consists of multiple independent coil elements that can be combined depending on the requirements of the examination.–> Integrated Panorama Array (IPA)
Array processor MR components. An array processor comprises multiple computer and storage units that are switched in sequence and in parallel while simul-taneously performing a computing task. Core of the image reconstruction system.
A B C D E F G H I J K L M N O P Q R S T U V W Z 123A
ART Image reconstruction. Three-dimensional tech-nique for fully automatic motion correction. To minimize motion errors, the 3D data sets are shifted, rotated, and interpolated to correspond closely to a reference data set.
Arterial Spin Labeling (ASL)
Perfusion imaging. Arterial Spin Labeling uses the water in arterial blood as an endogenous contrast agent by marking a specific vessel with an RF pulse. By subtracting images with/without markings, statements about the relative blood flow can be made. This technique allows insight into perfusion and the functional physiology of the brain. ASL is suitable for evaluating tumors, degenerative diseases and seizure disorders, as well as neuro-scientific research, e.g., for exam-ining functional changes in the blood flow of the brain.
Artifact Image quality. Signal intensities in the MR image that do not correspond to the spatial distribution of tissue in the image plane. They
ART:Advanced Retrospective Technique
ASL:Arterial Spin Labeling

A B C D E F G H I J K L M N O P Q R S T U V W Z 123A
result mainly from physiological as well as system-related influences.–> Aliasing artifact–> Distortion artifact–> Flow artifact–> Motion artifact
AutoAlign Head LS Slice positioning. Automatic orientation of the slice position, applicable for head examinations. Independent of patient positioning, the MR sys-tem automatically performs reproducible slice positioning and simplifies as well as accelerates examination planning. Uses bony structures as anatomical orientation points.
AutoAlign Spine Slice positioning. Automatic positioning and double-orthogonal orientation of transverse slice groups during examination of the spine based on the anatomical conditions of the intervertebral disk. Allows for easier and faster examinations with a better and standardized image quality.

A B C D E F G H I J K L M N O P Q R S T U V W Z 123A
Auto-calibration MR measurement technique . When using Parallel Acquisition Techniques (PAT), coil profile information required for reconstruction is obtained via a calibration measurement.
Auto-calibration is integrated into the measure-ment and is both faster (approx. 1 second) and more exact than a separate calibration. It is per-formed with sequence characteristics that are identical to the acquisition and for the current patient position (including possible motions).
Averages Measurement parameters. Mean value of mea-sured signals in a slice to improve the signal-to-noise ratio. Averaging is performed, for example, on a measurement with 2 acquisitions.
Axial –> Orthogonal slices

A B C D E F G H I J K L M N O P Q R S T U V W Z 123B
Bandwidth Measurement parameters. Frequency spectrum (minimum to maximum processed frequency) of a pulse sequence acquired by an RF system.–> Readout bandwidth–> Transmission bandwidth
Baseline BOLD imaging: Non-activated image, in contrast to activated image, refer also to paradigm.MR spectroscopy: Background signal from which the peaks rise.
Baseline correction MR spectroscopy. Post-processing of the spec-trum to suppress baseline deviations from the zero line.
Basic image Measurement. Image selected as the default for slice positioning; localizer, scout.Post-processing. Image measured for post-processing; for example, MIP or MPR.
BEAT Cardiac imaging. syngo tools to optimize cardiac examinations with a few mouse clicks.
A B C D E F G H I J K L M N O P Q R S T U V W Z 123B
BLADE MR measurement technique. The BLADE tech-nique helps reduce the motion sensitivity of MR examinations: BLADE is available for the TurboSE sequence. Each echo train of the sequence generates a low resolution image with a phase-encoding direction rotated from one excitation to the next. Subsequently, the individual, low-reso-lution images are combined into a high-resolu-tion image.
Body coil MR components. The body coil is an integral part of the magnet. It functions as a transceiver coil. It has a large measurement field, but does not have the high signal-to-noise ratio of special coils.
BOLD effect BOLD imaging. During increased neural activity, oxygen concentration increases in the venous blood volume. Local blood flow increases as well.
As oxygen increases, the magnetic characteris-tics of erythrocytes approximate that of the sur-rounding blood plasma. Transverse magnetiza-tion in blood vessels decays more slowly. This

A B C D E F G H I J K L M N O P Q R S T U V W Z 123B
BOLD effect extends T2 and T2*, measurable as an increase in signal in the blood volume under examination.
BOLD imaging MR application. BOLD imaging uses local changes in blood flow to indicate the current level of activity in a region of the brain. Hydrogen protons in human blood are the signal carriers.
Blood works as an intrinsic contrast agent: local concentrations of oxygen associated with changes in blood flow are measured (BOLD effect).
Bolus Examination with contrast agent. Partial vol-umes in a vascular section. A small amount of contrast agent transported by blood flow whose spread is tracked (Bolus Tracking).
BRACE MR mammography. Methods for soft-tissue corrections with MR mammography. Eliminates motion artifacts during dynamic imaging.
BOLD:Blood Oxygenation Level Dependent Imaging
BRACE:Breast Acquisition Correction

A B C D E F G H I J K L M N O P Q R S T U V W Z 123B
Breathhold technique MR measurement technique. To avoid respira-tory artifacts, the patient holds his breath during the entire measurement. Suitable for use in abdominal and cardiac examinations. Not suit-able for use with uncooperative patients, small children, or anesthetized patients.
Bright-blood effect Image quality. Brightly-displayed blood, as an effect of slow flow. Vascular spins are completely replaced by unsaturated spins during repetition time TR. In gradient echo sequences, the signal is maximum, and blood is displayed bright in the MR image.
The effect is used in bright-blood imaging of the heart for dynamic display of blood flow, an effect that is similar for ToF angiography.
b-value Diffusion imaging. Diffusion weighting factor. The higher the b-value, the stronger the diffu-sion weighting.
B0 field MR physics. The static main magnetic field of a magnetic resonance system.

A B C D E F G H I J K L M N O P Q R S T U V W Z 123B
B1 field MR physics. The alternating magnetic field of RF radiation generated by a transmitter coil.

A B C D E F G H I J K L M N O P Q R S T U V W Z 123C
Cardiac imaging –> MR cardiology
Cardiac triggering Physiological imaging. Cardiac triggering prevents or reduces motion artifacts in the MR image caused by the heartbeat or pulsating blood flow. Triggering enables MR images to be acquired synchronized to cardiac movement.
ECG and pulse triggering enable precise func-tional examinations of the cardiovascular system and the CSF in the head and spine. Major vessels, the myocardium, and blood flow can be dis-played.
Cardio –> MR cardiology
Care Bolus Contrast-enhanced MRA. Using Care Bolus, the center of the Fourier space is measured as quickly as possible once the contrast agent reaches the region to be examined. This ensures optimal contrast of arterial vessels.
Center –> Windowing
CARE:Combined Applications to Reduce Exposure

A B C D E F G H I J K L M N O P Q R S T U V W Z 123C
Chemical shift MR physics. Shift in the resonance frequency of an atomic nucleus depending on the chemical bonds of the atom or structure of the molecule. Caused primarily by a weakening of the applied magnetic field by the electron shell, and is pro-portional to the magnetic field strength. Units: 1 ppm of the resonance frequency.
Chemical shift artifact
Image quality. With gradient echo sequences, the chemical shift may lead to “phase cancella-tion” in the image. The cause are the slightly different resonance frequencies of fat and water (approx. 3.5 ppm), which lead to a phase shift in a voxel containing fat/water. In an opposed-phase image, contour artifacts may appear at the interface of fat and water-containing tissue.
Chemical shift imaging (CSI)
MR spectroscopy. In contrast to single volume spectroscopy, the two CSI methods map the metabolic information from a Volume of Interest (VoI) in a spectral matrix. The spatial encoding requires a minimum measurement time of sev-eral minutes.
A B C D E F G H I J K L M N O P Q R S T U V W Z 123C
Cine Image display. To display dynamic processes, such as cardiac movement. The MR images run automatically through the active screen seg-ment, either in a cycle or forward and backward (yoyo).
CISS sequence MR measurement technique. Strong T2-weighted 3D gradient echo technique with high resolution, where two acquisitions with dif-ferent excitation levels are performed internally and subsequently combined. Prevents streaks, for example in the inner ear. Post-processing with MPR or MIP.
Coil profile Physics. Receiver signal homogeneity of an RF coil, also known as coil sensitivity profile. The strength of the MR signal received from a voxel depends on the voxel location relative to the coil. In general, the signal is greatest in the vicinity of the coil. The farther away the voxel is from the coil, the weaker the signal.
CISS:Constructive Interference in Steady State
A B C D E F G H I J K L M N O P Q R S T U V W Z 123C
The coil profiles can be obtained either from a separate calibration measurement or via an auto-calibration integrated into the measurement.
Coils –> RF coils
Columns MR measurement technique. The frequency-encoded portion of the measurement matrix.–> Rows
Concatenation Measurement parameters. Distributing the slices to be measured over multiple measure-ments. Possible applications:• For a short TR, increase the number of concate-
nations to be able to measure more slices.• To prevent cross talk when the slice distance is
short, set concatenations to 2 and use an inter-leaved slice sequence.
Contour artifact –> Chemical shift artifact
Contrast Image quality. Relative difference in signal strength between two adjacent tissue types.

A B C D E F G H I J K L M N O P Q R S T U V W Z 123C
Contrast agent Image quality. Chemical compounds to improve contrast. For MR, normally paramagnetic con-trast agents, such as Gadolinium DTPA or other Gadolinium compounds are used.
In contrast to X-ray techniques, where contrast agent is directly visible, in MR, contrast agents have an indirect effect only; they reduce the relaxation times for water in tissue.
Contrast-enhanced MR angiography (CE MRA)
MR application. Contrast-enhanced MR angiog-raphy utilizes the T1 reduction of blood through Gadolinium-based contrast agent. Since CE MRA is not limited by saturation effects, it allows for large measurement fields and any orientation.
Contrast-to-noise ratio (CNR)
Image quality. The contrast-to-noise ratio in the MR image is the difference of the signal-to-noise ratios between two relevant tissue types, A and B.CNR = SNRA – SNRB
Coronal –> Orthogonal slices
A B C D E F G H I J K L M N O P Q R S T U V W Z 123C
CP coil MR components. Circularly polarized transmis-sion or receiver coil with two orthogonal trans-mission and/or receiver channels, also known as quadrature coil. A receiver coil has a better sig-nal-to-noise ratio than a linearly polarized coil.
Cross-talk Image quality. If slices are too close, the signals from adjacent slices affect one another, espe-cially when the slice distance equals 0. Caused by a slice profile that is not ideal due to the con-straints of the measurement technology. Cross talk effects T1 contrast.
Remedied primarily using an interleaved slice sequence.
Cryogens Magnet technology. Cooling agent to maintain the superconductivity of the magnet (liquid helium or nitrogen).
CP:Circularly Polarized

A B C D E F G H I J K L M N O P Q R S T U V W Z 123D
Dark Blood Cardiac imaging. Special preparation pulse that saturates the blood; for displaying cardiovascular anatomy.
Dark-fluid imaging(FLAIR)
MR measurement technique. Turbo inversion recovery technique with a long effective echo time and long inversion time to suppress fluids. Lesions that are normally covered by bright fluid signals using conventional T2 contrastare made visible by the dark-fluid technique. The inversion pulse is applied such that the T1 relaxation of the fluid reaches zero crossing at time point TI, resulting in the signal being “erased”.
dB/dt MR physics. Formula for the temporal change of the magnetic field, read “dB over dt”. Using alternating magnetic fields, electrical fields are generated in conductive material, such as human tissue. These fields may induce electrical current in the patient's body.
dB/dt is an important value for safety thresholds.–> Stimulation
FLAIR:Fluid Attenuated Inversion Recovery

A B C D E F G H I J K L M N O P Q R S T U V W Z 123D
Defocussing –> Dephasing
Delay time –> Trigger delay time (TD)
Dephasing MR physics. After RF is applied, phase differ-ences appear between precessing spins, result-ing in a decay in transverse magnetization. Caused primarily by spin-spin interaction and inhomogeneity in the magnetic field, can also be caused by switching specific gradient fields (flow dephasing).–> Rephasing
DESS sequence MR measurement technique. DESS is a 3D gradient echo technique where two different gradient echoes (FISP sequence and PSIF sequence) are acquired during repetition time TR. During image reconstruction, the strongly T2-weighted PSIF image is added to the FISP image. Use: Joints, good contrast for cartilage. Post-processing with MPR.
DESS:Dual Echo Steady State

A B C D E F G H I J K L M N O P Q R S T U V W Z 123D
Diamagnetism MR physics. Effect resulting in a slightly weak-ened magnetic field when a substance is intro-duced into it. Magnetization of a diamagnetic material is opposite the main magnetic field. The material is considered to have a negative mag-netic susceptibility (magnetizability).
DICOM Standard for electronic data exchange of medical images.
The DICOM standard enables the transfer of digital medical images and corresponding infor-mation, independent of device and manufac-turer. In addition, DICOM provides an interface to hospital systems based on other standards.
Diffusion Physics. Process by which molecules or other particles move from areas of higher concentra-tion to areas of lower concentration. When con-centrations are equal, there is a statistical bal-ance, even though the molecules are constantly under thermal movement (Brownian molecular movement).
DICOM:Digital Imaging and Communication in Medicine

A B C D E F G H I J K L M N O P Q R S T U V W Z 123D
Diffusion contrast Diffusion imaging. The diffusion of water molecules along a field gradient reduces the MR signal. The behavior is exponential:Signal = S0 exp(−b D)
In areas of low diffusion (pathological tissue), signal loss is less intense. These areas are shown brighter.
Diffusion tensor Diffusion imaging. Physical magnitude which takes into account the directional dependency of diffusion. The diffusion tensor displays the mobility of water molecules in all three coordi-nates. The tensor data are used as the basis for computing additional maps (e.g., FA map) or diffusion tractography.
Diffusion tensor imaging (DTI)
MR application. Method for displaying the direc-tional dependency of diffusion. Application: examinations involving the architecture, configu-ration and integrity of nerve fiber bundles (neu-rological research).

A B C D E F G H I J K L M N O P Q R S T U V W Z 123D
Diffusion tractography Diffusion tensor imaging. Method for display-ing diffusion tracts using diffusion tensor mea-surements.
Tractography supports the planning of opera-tions and supports neurophysiological research regarding the connectivity and pathology of the white matter.
Diffusion-weighted imaging
MR application. MR imaging is sensitive to motion and flow and to the relatively low diffu-sion effect, when the gradients are strong enough. Diffusive movements in tissue (e.g., nat-ural diffusion of water) reduce the signal.
Of interest are regions where diffusion is reduced compared to its surroundings (such as cell membranes, along white matter tracts, or in areas of the brain affected by stroke). Reduced diffusion means the reduction in signal is less intense: the affected regions are displayed brighter in the image.
Diffusion weighting factor
–> b-value

A B C D E F G H I J K L M N O P Q R S T U V W Z 123D
Distortion artifact Image quality. Image distortions are caused by inhomogeneity in the magnetic field, gradient non-linearity, or ferromagnetic materials in prox-imity to the examination.
Dixon technique MR measurement technique. Dixon is a tech-nique for separating fat and water. For this pur-pose, the technique uses the different resonance frequencies of fat and water protons (chemical shift). Essentially an in-phase and an opposed-phase image are measured. By adding the in-phase and opposed-phase, pure water images are generated while pure fat images are gener-ated through subtraction.
Double-contrast sequences
MR measurement technique. TurboSE counter-part to double-echo sequences, generally 5 times as fast.
To keep the pulse train as short as possible, only echoes for PD- and T2-weighted images where the phase-encoding gradient has a small amplitude are measured separately. The echoes that determine resolution are used in both raw
A B C D E F G H I J K L M N O P Q R S T U V W Z 123D
data matrices (echo sharing). This reduces the number of echoes required. More slices can be acquired for the TR specified, and the RF stress (SAR) drops.
Double-echo sequence MR measurement technique. Spin-echo sequence with two echoes. In addition, proton density weighted images are generated without increasing the measurement time. They are pro-duced from the first echo of a T2-weighted dou-ble-echo sequence.
Double-oblique slice Slice positioning. Obtained by rotating an oblique slice about one axis in the image plane.
Duty cycle Gradient technology. Time permitted during which the gradient system can be run at maxi-mum power. Based on the total time (in %), including the cool-down phase.
A B C D E F G H I J K L M N O P Q R S T U V W Z 123E
Eccentricity –> Off-center
ECG triggering Physiological imaging. ECG triggering synchro-nizes the measurement with the cardiac signal of the patient. The R wave is used as the trigger. This method is particularly useful for measure-ments of the heart or thorax, because images can be blurred due to cardiac contractions.
Echo MR physics. The MR signal generated by an RF or gradient pulse.–> Gradient echo–> Spin-echo (SE)
Echo-planar imaging (EPI)
MR measurement technique. Extremely fast MR technique where the complete image is obtained using a single selective excitation pulse. Field gradients are switched periodically to generate a series of gradient echoes. An image of the excited plane is obtained by using a Fourier transformation on the resulting echo train.

A B C D E F G H I J K L M N O P Q R S T U V W Z 123E
Echo sharing MR measurement technique. For double-con-trast sequences. Echoes that determine image resolution are used in both raw data matrices.
Echo spacing MR measurement technique. Distance between two echoes; e.g., TurboSE or EPI sequences. A short echo space produces com-pact sequence timing and fewer image artifacts.
Echo time (TE) Measurement parameters. The time between the excitation pulse of a sequence and the result-ing echo used as the MR signal. Determines image contrast.
Echo train Multi-echo sequences. Two or more echoes in sequence; each of them obtains a different phase-encoding direction.
Eddy currents MR measurement technique. Electrical currents generated in a conductor by changing magnetic fields or movement of the conductor within the magnetic field. Can be reduced using shielded
TE:Time to Echo

A B C D E F G H I J K L M N O P Q R S T U V W Z 123K
gradients. Eddy currents are a source for arti-facts.
Edge oscillation –> Truncation artifact
Effective echo time (TEeff)
MR measurement technique. The contrast and signal-to-noise ratio of an MR image are deter-mined primarily by the temporal position of the echo where the phase-encoding gradient has the smallest amplitude. In this case, the echo signal undergoes minimal dephasing and has the stron-gest signal. The time period between the excita-tion pulse and this echo is the effective echo time.
Effective repetition time (TReff)
Physiological imaging. For prospective cardiac triggering, repetition time TR cannot be set as desired; rather, it is determined by the time inter-val for the trigger. The effective repetition time TReff established by the trigger interval fluctuates with the physiological rhythm.
TR:Time to Repetition

A B C D E F G H I J K L M N O P Q R S T U V W Z 123K
EPI factor Echo-planar imaging. Number of gradient ech-oes of an EPI sequence acquired after a single excitation pulse (typically 64 to 128). EPI factor 128 means a measurement time 128 times faster than a normal gradient echo sequence.
EPI technique –> Echo-planar imaging (EPI)
Ernst angle MR measurement technique. The flip angle (< 90°) of a gradient echo sequence where a tis-sue with a specific T1 generates its maximum signal. Depending on the repetition time TR.αErnst = arccos (e–TR/T1)
Excitation pulse MR measurement technique. The equilibrium of the spins in the magnetic field is distorted by a brief RF pulse. The higher the energy of an exci-tating RF pulse, the greater is the tip angle of the net magnetization. The tip angle of the magneti-zation at the end of the RF pulse is known as the flip angle.
EPI:Echo-Planar Imaging

A B C D E F G H I J K L M N O P Q R S T U V W Z 123F
FA map Diffusion imaging. An FA map displays the anisotropic character of the diffusion in relation-ship to the average overall diffusion.
Isotropic diffusion: Water molecules move the same way in every direction.
Anisotropic diffusion: The water molecules clearly move in a preferred direction.
Isotropic diffusion is displayed dark, anisotropic diffusion is displayed bright. The color encodes the orientation of diffusion. The FA map is one of the parametric maps for diffusion tensor imag-ing.
Fast Fourier Transformation (FFT)
Image reconstruction. Algorithm for fast MR image reconstruction from raw data.
Fat image A pure fat image only displays the signal from fat protons in the image and suppresses the signal from water protons. Is generated with the Dixon technique, for example.
FA:Fractional Anisotropy

A B C D E F G H I J K L M N O P Q R S T U V W Z 123F
FatSat –> Fat saturation
Fat saturation (FatSat) Image quality. To suppress the fat portion in the MR signal, the fat protons are saturated by fre-quency-selective RF pulses. The fat saturation depends on the homogeneity, the chemical shift is 3.5 ‚ppm.–> Presaturation
Fat suppression Image quality. The MR signal comprises the sum of signals from water and fat protons. Different techniques are used to suppress the fat signal.–> Fat saturation
Feet First Positioning. The patient is positioned feet first in the magnet bore.
Ferromagnetism Physics. Effect where a material, e.g., iron is drawn toward a magnetic field. Relevant to safety for MR imaging.
FID signal MR physics. Signal induced by the RF excitation of the nuclear spins, and that decreases expo-
FatSat:Fat Saturation
FID:Free Induction Decay
A B C D E F G H I J K L M N O P Q R S T U V W Z 123F
nentially without external influence at a charac-teristic time constant T2*.
Field of View (FoV) Measurement parameters. Base (square) size of the slice to be measured (in mm). The smaller the field of view, the higher the resolution, since the voxels are smaller for the same matrix size.
Field strength –> Magnetic field strength
Filter –> Image data filter–> Normalization filter–> Raw data filter
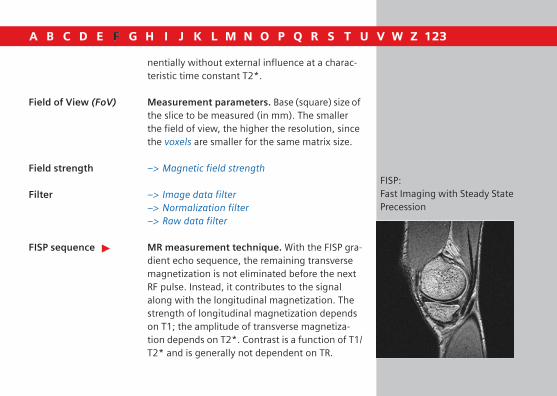
FISP sequence MR measurement technique. With the FISP gra-dient echo sequence, the remaining transverse magnetization is not eliminated before the next RF pulse. Instead, it contributes to the signal along with the longitudinal magnetization. The strength of longitudinal magnetization depends on T1; the amplitude of transverse magnetiza-tion depends on T2*. Contrast is a function of T1/T2* and is generally not dependent on TR.
FISP:Fast Imaging with Steady State Precession

A B C D E F G H I J K L M N O P Q R S T U V W Z 123F
FLAIR technique –> Dark-fluid imaging (FLAIR)
FLASH sequence MR measurement technique. The FLASH gradi-ent echo sequence uses the equilibrium of longi-tudinal magnetization. The remaining transverse magnetization is eliminated by a strong gradient (spoiler gradient). T1-weighted and T2*-weighted contrast can be set with the FLASH sequence.
Flip angle Measurement parameters. The tip angle of magnetization from the longitudinal direction at the end of an RF pulse. Frequently used flip angles are 90° and 180° flip angles.
Flow artifact Image quality. Motion artifacts caused by local signal changes during a measurement. For exam-ple, the inflow intensity of a vessel perpendicular to the image plane changes periodically due to pulsatile blood flow. In transverse body imaging, ghosting appears in the aorta. Due to turbulent blood flow in the heart, non-periodic inflow enhancement results in smearing of the image.
FLASH:Fast Low Angle Shot

A B C D E F G H I J K L M N O P Q R S T U V W Z 123F
Flow compensation (GMR)
MR measurement technique. To override the signal loss caused by spin movement, both moved and unmoved spins can be rephased. Additional gradient pulses are switched in suit-able size and time duration.
Flow dephasing MR measurement technique. Exclusion of the signal from flowing substances such as blood, through the application of specifically applied gradient fields.–> Dephasing
Flow effect Image quality. Flow effects play two conflicting roles in MR imaging:• Source of unwanted image artifacts–> Flow artifact• In MR angiography, displays blood vessels and
provides quantitative information on the veloc-ity of blood flow.
–> Bright-blood effect–> Inflow amplification–> Jet effect–> Signal elimination
GMR:Gradient Motion Rephasing

A B C D E F G H I J K L M N O P Q R S T U V W Z 123F
–> Washout effect
Flow encoding MR measurement technique. Use of phase-encoding or other techniques to obtain informa-tion regarding the direction and velocity of mov-ing material.
Flow quantification MR application. Quantitative flow measure-ments using phase contrast to examine patholo-gies in large vessels or as part of an extensive car-diovascular MR examination. Flow measurements enable the non-invasive evalua-tion of blood flow.
Flow rephasing –> Rephasing
Flow sensitivity (venc)
Phase-contrast angiography. The flow sensitiv-ity of a phase-contrast sequence refers to the flow velocity where the phase difference between flow-compensating and flow-encoding scans is 180 degrees.
fMRI –> Functional imaging
venc:velocity encoding
fMRI:functional Magnetic Resonance Imaging

A B C D E F G H I J K L M N O P Q R S T U V W Z 123F
Fourier space MR measurement technique. The axes of the raw data matrix axes are known as kx and ky. They divide the matrix into four squares. The plane spanned by the two axes is called Fourier space or k-space.
Fourier Transformation
Imaging: Mathematical procedure for recon-structing images from raw data.MR spectroscopy: Method for calculating MR spectra from MR time data.
FoV –> Field of View (FoV)
Fractional anisotropy –> FA map
Free induction decay –> FID signal
Frequency Physics. The number of repetitions of a periodic process in a unit of time (unit: Hertz).
Frequency encoding MR measurement technique. During data acquisition, a magnetic field gradient is applied in one spatial direction, providing nuclear spins
A B C D E F G H I J K L M N O P Q R S T U V W Z 123F
with linearly increasing precessional frequencies. The readout MR signal is a mix of all these fre-quencies. These various frequencies must be fil-tered individually. In the row direction, the loca-tion of the nuclear spin can be reconstructed from the frequency. This axis is called the fre-quency-encoding axis.
The perpendicular axis to it is the direction of the phase encoding.
Frequency tuning MR measurement technique. Setting the RF system frequency to the resonance frequency of the main magnetic field (Larmor frequency).
Functional imaging –> BOLD imaging

A B C D E F G H I J K L M N O P Q R S T U V W Z 123G
Gadolinium DTPA Contrast agent. The uptake of gadolinium-con-taining contrast medium reduces the T1 and T2 values of tissues, depending on the concentra-tion. The effect: T1 weighting increases, while T2 weighting is suppressed. The T1 effect is the more relevant in clinical routines.
Gauss MR physics. Old unit for magnetic field strength. Today, the unit Tesla (T) is used(1 Tesla = 10000 Gauss).
Ghost images Image quality. During periodic movement such as breathing, some phase-encoding steps are acquired during inspiration (e.g., inspiration phase), and others during expiration (e.g., expi-ration phase). This quasi-periodic misencoding results in a displaced false image of the body region. Signal-rich structures like subcutaneous fat are particularly susceptible to ghosting due to movement. The distance between the ghost images depends on the movement period and relaxation time TR.
A B C D E F G H I J K L M N O P Q R S T U V W Z 123G
During echo-planar imaging, ghosting may occur at a distance of half the FoV.
Gibbs artifact –> Truncation artifact
GLM BOLD imaging. GLM calculates BOLD images by adjusting a linear combination of different signal portions. In addition, interferences such as slow signal fluctuation are successfully suppressed and reliable activation maps are obtained. GLM also allows a detailed evaluation of the measure-ment data.
Global Bolus Plot (GBP)
–> Global time-density curve
Global Shim Quality assurance. For several techniques, such as fat saturation, EPI or spectroscopy, especially high magnetic field homogeneity is required. In this case, shim coils can be used to optimize homogeneity.
GLM:General Linear Model

A B C D E F G H I J K L M N O P Q R S T U V W Z 123G
Global time-density curve
Perfusion imaging. Diagram for evaluating successful bolus transport.
GRACE MR spectroscopy. GRACE is a SVS procedure in breast spectroscopy, used to quantify the cholin signal.
Gradients MR physics. A gradient defines the strength and orientation of change of a magnitude in space. A magnetic field gradient is a change in the magnetic field of a certain orientation, a linear increase or decrease. The magnetic gradient fields are generated with gradient coils. They determine, for example, the spatial resolution in an image.
Parameters: rise time, duty cycle, gradient lin-earity, gradient strength, slew rate.
Gradient coils MR components. Coils to generate magnetic gradient fields. Gradient coils are operated in pairs in the magnet, at the same current, how-ever, of opposite polarities.
GRACE:Generalized Breast Spectroscopy Exam

A B C D E F G H I J K L M N O P Q R S T U V W Z 123G
One of the coils increases the static magnetic field by a certain amount, the opposite coil reduces it by the same amount. This changes the magnetic field overall. The change is the linear gradient. According to the coordinate axes, there are x, y, and z gradient coils. In connection with the gradient amplifier, they form the gradient system, used to precisely localize the requested slice position.
Gradient echo MR physics. Echo created by switching a pair of dephasing and rephasing gradients, without a rephasing 180° pulse as with the spin-echo tech-nique.
Gradient Motion Rephasing (GMR)
–> Flow compensation
Gradient strength Gradient technology. Amplitude of the gradi-ent field, measurement unit mT/m (millitesla per meter).
A B C D E F G H I J K L M N O P Q R S T U V W Z 123G
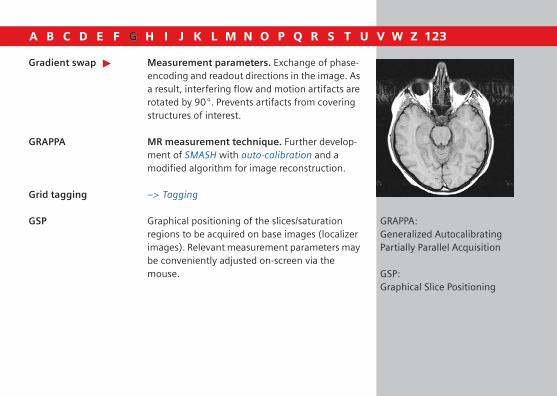
Gradient swap Measurement parameters. Exchange of phase-encoding and readout directions in the image. As a result, interfering flow and motion artifacts are rotated by 90°. Prevents artifacts from covering structures of interest.
GRAPPA MR measurement technique. Further develop-ment of SMASH with auto-calibration and a modified algorithm for image reconstruction.
Grid tagging –> Tagging
GSP Graphical positioning of the slices/saturation regions to be acquired on base images (localizer images). Relevant measurement parameters may be conveniently adjusted on-screen via the mouse.
GRAPPA:Generalized Autocalibrating Partially Parallel Acquisition
GSP:Graphical Slice Positioning
A B C D E F G H I J K L M N O P Q R S T U V W Z 123H
Half-Fourier matrix MR measurement technique. The raw data matrix has a specific symmetry which theoreti-cally makes sampling of only half the matrix sufficient. The other half can be symmetrically reconstructed; mathematically, the matrices are conjugated complexes.
However, unavoidable phase errors due to minor magnetic field inhomogeneity require a phase correction. For this reason, only slightly more than half of the raw data are acquired. Measurement time is reduced by just under 50 %.
Hanning filter Type of raw data filter
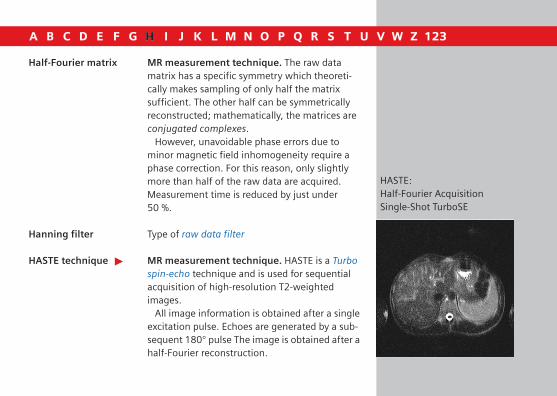
HASTE technique MR measurement technique. HASTE is a Turbo spin-echo technique and is used for sequential acquisition of high-resolution T2-weighted images.
All image information is obtained after a single excitation pulse. Echoes are generated by a sub-sequent 180° pulse The image is obtained after a half-Fourier reconstruction.
HASTE:Half-Fourier Acquisition Single-Shot TurboSE

A B C D E F G H I J K L M N O P Q R S T U V W Z 123H
Head First Positioning. The patient is positioned head first in the magnet bore.
Hertz MR physics. SI unit of frequency (1 Hz = 1 s−1).
Homogeneity Image quality. A magnetic field is considered homogeneous when it has the same field strength across the entire field. With MR, the homogeneity of the static magnetic field is an important criterion for magnet quality. High homogeneity is important for spectral fat satura-tion, a large field of view (FoV), off-center imag-ing, echo-planar imaging, and MR spectroscopy.
Hybrid spectroscopy MR application. Combination of single volume spectroscopy and chemical shift imaging. The CSI measurement is performed across a selec-tively-excited volume of interest. Via volume selection, areas with strong distorting signals (e.g., fat) are not stimulated. For this reason, they do not contribute signal to the spectra.

A B C D E F G H I J K L M N O P Q R S T U V W Z 123I
Image contrast Image quality. The contrast in the image is the relative difference in the signal strength between two adjacent tissue types. It depends primarily on the existing tissue parameters T1, T2, proton density) and, in the case of MRA, on the flow as well.
Contrast can be affected by the sequence used (spin echo, inversion recovery, gradient echo, TurboSE etc.), the measurement parameters (TR, TE, TI, flip angle) and the use of contrast agent.
Image data filter Reconstruction parameter. Filters of various strengths (strong, medium, soft) can subse-quently be applied to MR images to reduce noise. High pass and low pass filters are used with dif-ferent shapes to the characteristic curves. Other filter types include, for example, smoothing filters.
Image manipulation Post-processing. MR images can be manipulated in various ways for manipulation. The gray scale of the images—either in its entirety or in sections—can be modified as desired (e.g., addi-
A B C D E F G H I J K L M N O P Q R S T U V W Z 123I
tion, subtraction, averaging, rotation, flip, offset, inversion).
Image matrix Image display. The MR image consists of a mul-titude of picture elements (pixel). Pixels are allo-cated to a matrix in a checkered pattern. Every pixel in the image matrix displays a specific gray scale level. Viewed as a whole, the matrix of gray levels constitutes the image.
Not to be confused with a measurement matrix.
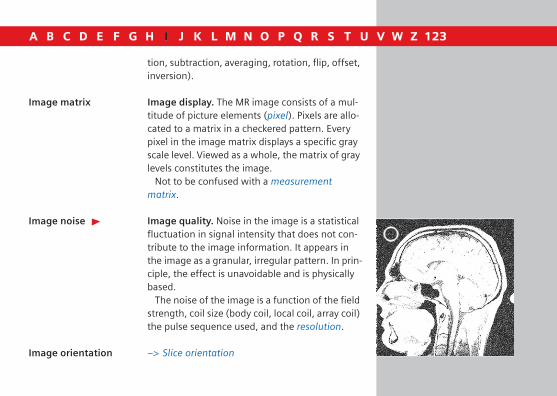
Image noise Image quality. Noise in the image is a statistical fluctuation in signal intensity that does not con-tribute to the image information. It appears in the image as a granular, irregular pattern. In prin-ciple, the effect is unavoidable and is physically based.
The noise of the image is a function of the field strength, coil size (body coil, local coil, array coil) the pulse sequence used, and the resolution.
Image orientation –> Slice orientation

A B C D E F G H I J K L M N O P Q R S T U V W Z 123I
Image quality The diagnostic quality of an MR image. Characteristics include:–> Artifact–> Contrast (Contrast-to-noise ratio)–> Noise (Signal-to-noise ratio–> Resolution
Image reconstruction system
MR component. Part of the computer system that reconstructs MR images from the raw data using a Fourier transformation.
Image resolution Image quality. Is the ability to differentiate neighboring tissue structures. The higher the image resolution, the better small pathologies may be diagnosed.
Resolution increases with a larger matrix, smaller FoV, and smaller slice thickness.–> In-plane resolution–> Spatial resolution
Image windowing –> Windowing
Imager –> Image reconstruction system
A B C D E F G H I J K L M N O P Q R S T U V W Z 123I
Induction, electromagnetic
Physics. The electrical voltage in a receiver coil created by a temporal change in the magnetic field.
Inflow amplification Image quality. A blood volume flowing slowly perpendicular to the slice yields a stronger signal than the surrounding tissue.
Using a 90° pulse, a bolus is excited within the slice to be measured. The excited spins cannot recover fully within a short repetition time. They remain saturated to a certain extent. The signal is weaker than that after a sufficiently long repeti-tion time TR in relationship to T1.
However, spin ensembles outside the slice are fully magnetized. Spins flowing out of the slice are replaced by fresh inflowing spins. As a result, vascular magnetization within the slice increases.
Inflow technique –> Time-of-flight angiography (ToF)

A B C D E F G H I J K L M N O P Q R S T U V W Z 123I
Inline Display Image display. Immediate display of recon-structed images. Frequently used to display dynamic changes (e.g., CARE bolus and BOLD imaging).
In-phase image MR measurement technique. An in-phase image is generated with a measurement at a time when two components in the tissue (usually fat and water) are in the same phase, that is, the transverse magnetizations have the same orien-tation and add up. The cause for different phase-velocities is the chemical shift between fat and water protons.
In-plane resolution Image quality. In-plane resolution is deter-mined by the size of the pixels. The smaller the pixel, the better the in-plane resolution.
Integrated Panorama Array (IPA)
MR components. The concept of the integrated panorama array (IPA) significantly accelerates setup time and increases patient throughput.
Depending on the system, up to 4, 8, or 16 independent array coil systems can be connected
IPA:Integrated Panorama Array

A B C D E F G H I J K L M N O P Q R S T U V W Z 123I
simultaneously with IPA. Up to 4 CP coil elements can be combined for a measurement.
Interactive real time MR measurement technique. Changing mea-surement parameters in real time.
Interactive shim Quality assurance. Manual tuning of the shim coils to improve magnetic field homogeneity. Shim currents can be set and optimized individu-ally for a selected pulse sequence.
lnterleaved slices –> Slice sequence
Interpolation MR measurement technique. Calculation of values that lie between known values in a mathe-matical function; e.g., enlarging the image matrix from 256 × 256 to 512 × 512. The mea-surement time is not increased, but interpolated images do require more storage space.
Inversion Recovery (IR)
MR measurement technique. Method for creat-ing a signal dependent primarily on T1. With inversion recovery sequences, the longitudinal
A B C D E F G H I J K L M N O P Q R S T U V W Z 123I
magnetization is inverted in the opposite direc-tion by a 180° pulse. Transverse magnetization remains equal to zero.
During the subsequent recovery, the negative longitudinal magnetization decays to zero and then begins to rise. Because transverse magneti-zation is not possible, no signal is measured.
To generate an MR signal, the longitudinal magnetization has to be converted to transverse magnetization through application of a 90° pulse.
Inversion time (TI) Measurement parameters. Interval between a 180° inversion pulse and a 90° excitation pulse in an inversion recovery sequence.
iPAT MR measurement technique. iPAT stands for integrated Parallel Acquisition Techniques. iPAT is Siemens’ implementation of Parallel Acquisition Techniques (PAT) on MAGNETOM systems.
iPAT includes the mSENSE and GRAPPA mea-surement techniques as well as auto-calibration.
TI:Time to Inversion
iPAT:integrated Parallel Acquisition Techniques
A B C D E F G H I J K L M N O P Q R S T U V W Z 123I
iPAT2 3D imaging. 3D sequences include two phase-encoding directions: the conventional 2D (PE) direction and the additional phase encoding in the partitions direction (3D).
The acceleration in the 3D direction is known as “iPAT2”.
Isocenter Image quality. The main magnetic field is only homogeneous within a roughly spherical region about the isocenter of the magnetic field. In this area, the examination region are positioned to ensure the best possible image quality.

A B C D E F G H I J K L M N O P Q R S T U V W Z 123J
Jet effect Image quality. Spin dephasing for complex flow patterns such as turbulences. The degree of sig-nal loss and the size of low-signal regions depend on the flow patterns and pulse sequence used. This effect must be taken into account when evaluating the extent of vascular stenosis.

A B C D E F G H I J K L M N O P Q R S T U V W Z 123K
k-space –> Fourier space

A B C D E F G H I J K L M N O P Q R S T U V W Z 123L
Larmor frequency MR physics. Frequency at which the nuclear spins precess about the direction of the outer magnetic field. The frequency depends on the type of nuclei and the strength of the magnetic field.
At 1.0 Tesla, the Larmor frequency of protons is approx. 42 MHz, at 1.5 Tesla, it is approx. 63 MHz.–> Precession
Lattice MR physics. Magnetic and thermal environment where the nuclei exchange energy during longi-tudinal relaxation.
Local coils MR components. Special coils are used for each area of the body to be examined (surface coil). They have a high signal-to-noise ratio at a small measurement field.
Local shim Quality assurance. The shim is limited to a pre-viously selected local volume.–> 3D shim
A B C D E F G H I J K L M N O P Q R S T U V W Z 123L
Localized MIP MR angiography. Localized “MIPing” improves image quality and considerably reduces the reconstruction time. Only a partial data volume is used which contains the voxels of the vessel of interest. As a result, the projection includes fewer background noise pixels and displays less bright fat signal. Individual vessels can be selected as well for reconstruction to maintain a comprehen-sive image.
Localizer –> Basic image
Logical gradients MR measurement technique. For orthogonal slices, each of the 3 physical gradients has exactly one “logical” task: slice selection, frequency encoding, and phase encoding. For oblique slices, the logical gradients are a mix of the physical gradients.
Longitudinal magnetization (Mz)
MR physics. Longitudinal magnetization Mz is the portion of the macroscopic magnetization vector in the direction of the z-axis, that is, along the outer magnetic field. After excitation by an
MIP:Maximum Intensity Projection
A B C D E F G H I J K L M N O P Q R S T U V W Z 123L
RF pulse, Mz returns to equilibrium M0 with a characteristic time constant T1.Mz(t) = M0 (1–exp(–t/T1)
Longitudinal relaxation
MR physics. Return to equilibrium of the longitu-dinal magnetization after excitation, due to the energy exchange between the spins and sur-rounding lattice (also called spin-lattice relax-ation).
Longitudinal relaxation time
–> T1 constant
LOTA technique MR measurement technique. Data averaging to reduce motion artifacts.
LOTA: Long Term Averaging

A B C D E F G H I J K L M N O P Q R S T U V W Z 123M
Magnet –> Permanent magnet–> Resistive magnet–> Superconductive magnet
Magnetic field MR physics. The space surrounding a magnet (or a conductor with current flowing through it) has special characteristics. Every magnetic field exer-cises a force on magnetizable parts aligned along a primary axis (magnetic north or south pole). The effect and direction of this force is symbol-ized by magnetic field lines.
Magnetic field gradients
–> Gradients
Magnetic field homogeneity
–> Homogeneity
Magnetic field strength
MR physics. The strength of the magnetic field force on magnetizable parts. In physics, the effect is called magnetic induction. In MR, it is referred to as magnetic field strength. Units:
A B C D E F G H I J K L M N O P Q R S T U V W Z 123M
Tesla (T), 1 Tesla is approximately 20,000 times the strength of the earth's magnetic field.
Magnetic resonance (MR)
MR physics. Absorption or emission of electro-magnetic energy by atomic nuclei in a static magnetic field, after excitation by electromag-netic RF radiation at resonance frequency.
Magnetic shielding In space: ShieldingThrough tissue: Weakening of the applied mag-netic field at the nucleus by the counter field induced in the electron shell of the surrounding tissue.–> Chemical shift
Magnetizability –> Susceptibility
Magnetization transfer (MTC)
MR measurement technique. Indirect obser-vation of fast relaxing magnetization through presaturation. Through magnetization transfer contrast, the signal from specific “solid” tissue (e.g., brain parenchyma) is reduced, and the
MTC:Magnetization Transfer Contrast

A B C D E F G H I J K L M N O P Q R S T U V W Z 123M
signal from a more fluid component (e.g., blood) is retained.
With MTC, the saturation of bound protons is transferred to adjacent free protons. This reduces the visible MR signal in these areas.
Magneto-hydro dynamic effect
Image quality. Additional electrical charges generated by loaded particles (ions in blood) that move perpendicular to the magnetic field.
Magnitude contrast angiography
MR application. Used to display slow flow with good resolution across a large volume.
Two data volumes are measured: the flow rephased image shows bright flow, and the flow dephased image shows dark flow. Stationary tis-sue looks the same in both data volumes. The data volumes are subtracted from one another pixel-by-pixel. What remains is the signal inten-sity of the flowing blood.

A B C D E F G H I J K L M N O P Q R S T U V W Z 123M
Magnitude image Image reconstruction. Normal image display. In a magnitude image, the gray value of a pixel corresponds to the magnitude of the MR signal at that location.
Alternative: Phase images
MAP shim Quality assurance. MAP shim globally tunes the shim currents. Correction functions are calcu-lated using a fixed algorithm and applied to the corresponding shim currents. As can be seen, the shim is applied to the entire measurement field.
Modern systems no longer require the MAP shim.
Matrix –> Image matrix–> Raw data matrix
Matrix coils MR components. Matrix coils have multiple coil elements combined into groups (clusters), typi-cally 3 coil elements per cluster. Each coil ele-ment is equipped with a low-noise preamplifier to maximize the signal-to-noise ratio. For exam-
MAP:Multi-angle projection

A B C D E F G H I J K L M N O P Q R S T U V W Z 123M
ple, a spine matrix coil has 24 coil elements and 24 preamplifiers.
Matrix coil mode Measurement parameters. The Matrix coil mode defines the allocation between Matrix coil elements and the RF receive channels.• Matrix coil mode CP• The coil elements of a coil cluster are combined
to one RF receive channel. This mode is opti-mized for a maximum signal-to-noise ratio. Example: In the Matrix coil mode CP, the head matrix coil acts like a CP head array with 4 ele-ments.
• Matrix coil mode Dual or TripleThe coil elements of a coil cluster are allocated
to two or three RF receive channels. This allows for additional information that may be used for improving the signal-to-noise ratio at the image margin and/or for obtaining higher PAT factors. Example: In the Matrix coil mode Triple, the head matrix coil acts like a CP head array with 12 ele-ments.

A B C D E F G H I J K L M N O P Q R S T U V W Z 123M
Matrix size Measurement parameters. Size of the raw data matrix; influences not only the measurement time, but also the resolution and signal-to-noise ratio.
With a square raw data matrix, the number of rows equals the number of columns.
Maximum Intensity Projection
–> MIP
MDDW Diffusion imaging. To compute the diffusion tensor, the technique provides multi-directional diffusion weighting (MDDW) measurements in at least 6 spatial directions. One diffusion-weighted image each is generated per slice position, b-value, and direction of diffusion (for b > 0).
Measurement field MR physics. Spherical volume in the center of the magnetic field where the field has a defined homogeneity. For MR examinations, objects to be measured have to be positioned at all times in the measurement field (to prevent signal distor-tions).
MDDW:Multi Directional Diffusion Weighting

A B C D E F G H I J K L M N O P Q R S T U V W Z 123M
Measurement matrix Raw data matrix, not to be confused with the image matrix.
Measurement sequence
–> Pulse sequence
Measurement time MR measurement technique. The measure-ment time for a 2D measurement is as follows:
Measurement time = no. of scans x TR x no. of acquisitions
MEDIC technique MR measurement technique. Multiple echoes acquired in one measurement are combined into an image. The advantage: higher SNR per time period, fewer artifacts. Application: cervical spine, joints.
MIP Post-processing. Maximum projections can be reconstructed from 3D or multi-slice measure-ments that can be combined into MIP series. This procedure is used mainly for MR angiography. Blood vessels are displayed brighter than the rest of the image.
MEDIC:Multi-Echo Data-Image Combination
MIP:Maximum Intensity Projection

A B C D E F G H I J K L M N O P Q R S T U V W Z 123M
Mosaic image BOLD imaging. Between16 to 64 EPI images are compiled into a mosaic image. This increases the clarity of BOLD displays.
Motion artifact Image quality. Results from random or involun-tary movement: breathing, heartbeat, blood flow, eye movement, swallowing, and patient movement. The effect appears as ghosting or smearing in the images. In the phase-encoding direction only.
MPR –> Multi-planar reconstruction (MPR)
MPRAGE technique MR measurement technique. MPRAGE is a 3D extension of the TurboFLASH technique with prepared inversion pulses. Only one segment or partition of a 3D data record is obtained per pre-paratory pulse.
After the acquisition, all rows within a 3D parti-tion use delay time TD. The delay time is neces-sary to prevent saturation effects.
MPRAGE:Magnetization Prepared Rapid Gradient Echo Imaging

A B C D E F G H I J K L M N O P Q R S T U V W Z 123M
MR angiography MR application. Angiography with MR does not really display the blood volume, but rather a spe-cific physical characteristic of the blood; for example, the magnetization status or local veloc-ity. This is perceived as blood volume. MRA does not display a single vessel, but rather all vessels in the blood volume. Various views can be subse-quently reconstructed (MIP) from 3D data vol-umes.
MR cardiology MR application. The advantages of cardiac MR include:• free selection of image planes and FoVs• high tissue contrast• temporal and spatial resolution
Image plane projections can be compared in angiocardiography, scintigraphy, or 2D echocardiography. Multiple cardiac slices can be acquired along the respective slice plane. In this way, complete anatomical display of the heart in all three dimensions is provided. Data records acquired across cardiac phases enable cine display of the heartbeat.

A B C D E F G H I J K L M N O P Q R S T U V W Z 123M
Subsequent quantitative evaluation of cardiac studies enables the following:• Manual or semi-automatic segmentation of the
inner and outer cardiac walls of the left ventri-cle, and the inner wall of the right ventricle: ED and ES images or the complete cardiac cycle.
• Calculation of ventricular volume, myocardial mass, and functional parameters
• Evaluation of myocardial wall thickness; changes in wall thickness (between the ED and ES phase or during the cardiac cycle) are evalu-ated for each sector
• Viability, perfusion, coronary angio
MR contrast agent –> Contrast agent
MR images The MR image consists of a multitude of image elements, also known as pixels. Pixels are allo-cated to a matrix in a checkered pattern. Every pixel in the image matrix displays a specific gray scale. Viewed as a whole, this gray scale matrix provides the image.

A B C D E F G H I J K L M N O P Q R S T U V W Z 123M
The gray scale of a pixel mirrors the measured signal intensity of the corresponding volume ele-ment (voxel). In turn, the signal intensity of a voxel depends on the respective transverse mag-netization.
MR imaging Images of objects, for example, the human body, are displayed with magnetic resonance using magnetic gradient fields. In practical application, the distribution of protons in the body is dis-played.
The clinically relevant objective of MR imaging is the differentiation between pathological and healthy tissue (image contrast).
MR sensitivity MR physics. Atomic nuclei for MR examinations have to be “MR sensitive”; that is, they must have a nuclear spin. This condition excludes all atomic nuclei with an even number of protons and neu-trons.
Since the hydrogen isotope 1H is the most sen-sitive, it is used as a reference in relationship to
A B C D E F G H I J K L M N O P Q R S T U V W Z 123M
other atom nuclei. Its relative sensitivity is 1 or 100 %.
MR signal MR physics. Electromagnetic signal in the RF range. Caused by the precession of transverse magnetization created by a variable voltage in a receiver coil (dynamo principle). The temporal progression of this voltage is the MR signal.
MR spectroscopy (MRS)
MR application. MR spectroscopy provides the non-invasive measurement of cellular metabolic relationships. An MR spectrum shows the depen-dence of the signal intensity on the chemical shift for a measurement volume (voxel). The con-centration of metabolites contributing to the spectrum can then be inferred.
In MR spectroscopy, the MR signal is measured as a function of time: a rapidly decreasing high-frequency oscillation. Using a Fourier transfor-mation, the oscillation is converted into a display of its frequency component, the spectrum.
In the area of intermediary metabolism, MR spectroscopy is an important method for in-

A B C D E F G H I J K L M N O P Q R S T U V W Z 123M
vitro and in-vivo examination of tissue and organs.
mSENSE MR measurement technique. Further develop-ment of SENSE with auto-calibration and a modi-fied algorithm for image reconstruction.
MTT image Perfusion imaging. An MTT image can be recon-structed for an image displayed. It displays the mean transit time of the contrast agent bolus and enables hemodynamic interferences to be evaluated.
Multi-directional diffusion weighting
–> MDDW
Multi-echo sequences MR measurement technique. Pulse sequence that excites multiple echoes with different degrees of T2 weighting. Signal height reduces with transverse relaxation. This drop in signal can be used to calculate a pure T2 image.
mSENSE:Modified Sensitivity Encoding
MTT:Mean Transit Time

A B C D E F G H I J K L M N O P Q R S T U V W Z 123M
Multi-level MRA MR angiography. For peripheral or whole-body angiography, the multi-level principle (also: Multi-step Angio) simplifies the measurement and reduces the measurement time. The area to be examined is measured at individual sections (levels), during automatic table feed. The data obtained are subsequently combined into an overall image.
Multi-planar reconstruction (MPR)
Post-processing. Enables new images of any orientation to be reconstructed based on a 3D or gapless multi-slice measurement.
Multi-slice imaging MR measurement technique. Variant of sequential imaging. The recovery period of the first slice excited is used to measure additional slices (time-savings). The slices are interleaved.
Multi-step angio –> Multi-level MRA

A B C D E F G H I J K L M N O P Q R S T U V W Z 123M
Multi-venc sequence Phase-contrast angiography, A sequence that is equally sensitive to various flow velocities. Used to acquire wide variations in flow velocity, e.g., in the peripheral arteries.
venc:velocity encoding

A B C D E F G H I J K L M N O P Q R S T U V W Z 123N
NATIVE MR angiography. Images of arteries and veins without contrast agent (native). • NATIVE SPACE: for peripheral MRA; based on a
fast 3D TSE sequence; image data are comput-ed via inline subtraction of two ECG-triggered data records (systole and diastole).NATIVE TrueFISP: for thoracic-abdominal MRA
(e.g., renal arteries). The intrinsic contrast is gen-erated by the inflow of blood with non-saturated spins into a presaturated volume.
Native image Contrast agent study. MR image without the use of contrast agent, for example as a pre-con-trast study.BOLD imaging. Non-activated image (baseline).
Navigator echo MR measurement technique. Additional spin or gradient echoes for detecting changes in object position in a measurement volume, or other changes. Suitable for use with interventional pro-cedures or respiratory gating.

A B C D E F G H I J K L M N O P Q R S T U V W Z 123N
Neuro imaging MR application. General term for brain and ner-vous system applications, such as BOLD imaging.
Noise –> Image noise
Non-selective pulse MR measurement technique. When data are acquired with a non-selective pulse, a longer TR is required for multi-slice measurements or repeated measurements of the same slice. The longer TR is required to ensure that magnetiza-tion between consecutive measurement recovers sufficiently and that the individual measure-ments do not interfere with one another.
Use with 3D volume measurements and presat-uration techniques (e.g., magnetization trans-fer).
Normalization filter Image quality. Equalizes signal intensity when using surface coils. Using the filter, the signal intensity of areas close to the coil is reduced; the signal intensity is increased in areas farther from the coil.
Used primarily with array coils.

A B C D E F G H I J K L M N O P Q R S T U V W Z 123N
Nuclear spin MR physics. Atomic nuclei with an odd number of neutrons and protons have what is called nuclear spin. For MR imaging, only hydrogen pro-tons are used. For MR spectroscopy, other nuclei are used, such as phosphor, fluorine, and carbon.
Number of partitions –> Partitions
Number of slices Measurement parameters. Multiple slices are usually acquired during an MR measurement. The maximum number of slices of a pulse sequence or measurement protocol depends on the repetition time TR.–> Multi-slice imaging

A B C D E F G H I J K L M N O P Q R S T U V W Z 123O
Oblique slice Measurement parameters. Obtained by rotat-ing an orthogonal slice (sagittal, coronal, or transverse) about a coordinate axis in the image plane.
Off-center(Eccentricity)
Slice positioning. Shifting the center of a slice group from the center of the magnetic field within the slice plane.
Opposed-phase image
MR measurement technique. An opposed-phase image is acquired at a time when two components in the tissue (usually fat and water) have opposite phases, that is, the transverse magnetizations of the two components have opposite orientations and partially cancel one another. Cause for the difference in phase is a chemical shift between fat and water protons.
Orthogonal slices Slice positioning. Slices oriented perpendicular to one another. Three basic orientations are available: sagittal, coronal, and transverse (axial)–> Slice orientation

A B C D E F G H I J K L M N O P Q R S T U V W Z 123O
Out-of-phase –> Phase cancellation
Overlap –> Aliasing artifact
Oversampling Measurement parameters. Method for prevent-ing aliasing artifacts.Readout oversampling: Doubling the sampling points in the frequency-encoding direction with-out prolonging the measurement time. The addi-tional part is discarded after reconstruction.Phase oversampling: Measurement data acqui-sition beyond the FoV in the phase-encoding direction. Increases the SNR. The measurement time increases accordingly. 100 % phase over-sampling has the same effect as double the num-ber of acquisitions.

A B C D E F G H I J K L M N O P Q R S T U V W Z 123P
PACE MR measurement technique. During the mea-surement, PACE corrects respiratory and motion artifacts in real time by reducing the offset between the slices. This allows for, e.g., multiple breathhold examinations a well as free breathing during a measurement.–> 1D PACE–> 2D PACE–> 3D PACE
Paradigm BOLD imaging. Planned sequence of the functional measurement, for example: 10 non-activated images (baseline), 10 active images, 2 ignored images.
Parallel acquisition techniques
–> PAT
Parallel imaging –> PAT
Parallel saturation Slice positioning. By saturating areas parallel to the slice plane but outside the slice of interest, blood flowing to the measurement area pro-
PACE:Prospective Acquisition Correction
A B C D E F G H I J K L M N O P Q R S T U V W Z 123P
duces almost no signal at the beginning of the measurement. This eliminates the vascular intraluminal signal, and prevents ghosting in the phase-encoding direction.
This presaturation can be performed on both sides of the slice. Parallel saturation slices shift with the slices of interest, simplifying planning.
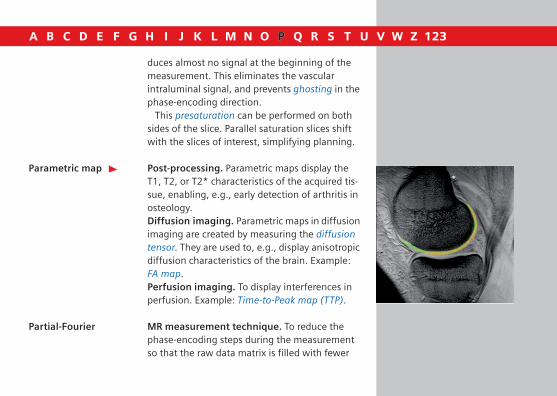
Parametric map Post-processing. Parametric maps display the T1, T2, or T2* characteristics of the acquired tis-sue, enabling, e.g., early detection of arthritis in osteology. Diffusion imaging. Parametric maps in diffusion imaging are created by measuring the diffusion tensor. They are used to, e.g., display anisotropic diffusion characteristics of the brain. Example: FA map.Perfusion imaging. To display interferences in perfusion. Example: Time-to-Peak map (TTP).
Partial-Fourier MR measurement technique. To reduce the phase-encoding steps during the measurement so that the raw data matrix is filled with fewer

A B C D E F G H I J K L M N O P Q R S T U V W Z 123P
rows. Allows for shorter echo times. Special case: Half-Fourier matrix
Partial Parallel Acquisition (PPA)
–> PAT
Partitions 3D imaging. During 3D imaging, entire volumes and not just individual slices are stimulated. A 3D slab comprises multiple gapless partitions The number of partitions corresponds to the number of slices during 2D imaging.
Partition thickness 3D imaging. The effective slice thickness of indi-vidual partitions in a 3D slab is the slab thickness divided by the number of partitions.
Passive shielding MR components. Older magnets were clad in soft iron that acted as flux return and signifi-cantly reduced the stray field. The overall weight of the system was drastically increased.
Today, active shielding is the preferred method.

A B C D E F G H I J K L M N O P Q R S T U V W Z 123P
PAT MR measurement technique. PAT is the generic term for parallel imaging techniques. Other terms for PAT include “Parallel Imaging and Partial Parallel Acquisition”.
Two groups of PAT are differentiated: with the image-based methods (e.g., SENSE, mSENSE), the PAT reconstruction is performed following the Fourier transformation. With the k-space-based methods (e.g., SMASH, GRAPPA), the PAT reconstruction is performed prior to the Fourier transformation.
PAT shortens the measurement time without degrading image resolution. The lower number of measurement lines reduces the signal-to-noise.
A prerequisite for PAT is the use of array coils as well as the calculation of the coil profile of all array coil elements (e.g., via auto-calibration).
The most important advantages of PAT: shorter breathhold times, higher temporal resolution of dynamic measurements and sharper images with echo-planar imaging (by reducing the echo train).
PAT:Parallel acquisition techniques

A B C D E F G H I J K L M N O P Q R S T U V W Z 123P
–> iPAT–> iPAT2
PAT factor Measurement parameters. The PAT factor is a measure of the phase-encoding steps reduced through PAT. Example: for a PAT factor of 2, each second step is skipped. This cuts the measure-ment time in half.
For iPAT2, the PAT factor is the product of the two PAT factors in the phase-encoding and the partitions direction. Example: a PAT factor of 12 comprises a PAT factor of 4 in the phase-encod-ing direction and a PAT factor of 3 in the parti-tions direction.
PBP image –> Percentage of baseline at peak
PC Angio –> Phase-contrast angiography
Peak MR spectroscopy. Theoretically, the frequency display of a pure sine wave is a single spectral line at the point of the resonance frequency. In reality, the spectral line spreads into a blurred

A B C D E F G H I J K L M N O P Q R S T U V W Z 123P
peak. The cause are the spin-spin effects and the field inhomogeneity (magnet and patient).
Peak characteristics: resonance frequency (ν0), peak height (h) peak width at half height (b) (Full Width Half Maximum FWHM), area.
Percentage of Baseline at Peak (PBP)
Perfusion imaging. A percentage of baseline at peak image can be reconstructed for the slice. The gray scale displays the signal change relative to a basic image prior to administering contrast agent.
Perfusion imaging MR application. Technique for evaluating organs and organ areas used frequently together with contrast agent. Areas poorly supplied with blood display a signal change over time. Examples: T1-sensitive perfusion of liver or sella lesions. T2*-sensitive perfusion of a stroke. Frequently used with EPI sequences.
Perfusion can be displayed without a contrast agent by using inversion recovery.

A B C D E F G H I J K L M N O P Q R S T U V W Z 123P
Peripheral angiography
MR application. MR angiography of the periph-eral vascular system; has special requirements:• arterial flow is often pulsating• large volumes have to be measured• images must clearly distinguish between arter-
ies and veinsMost often, 3D gradient echo protocols with
contrast agent are being used. Measurements are performed with tabletop movement in sev-eral stages. They require an optimized timing sequence.
Permanent magnet MR components. Permanent magnets consist of large blocks of magnetic material, usually horse-shoe-shaped. They have a permanent magnetic field. As a result, they do not need to be supplied with energy or cooling (maximum field strength 0.3 Tesla).
Phantom Quality assurance. Synthetic item with known dimensions and measurement characteristics. Usually a container filled with fluid and a built-in plastic structure of various sizes and shapes.

A B C D E F G H I J K L M N O P Q R S T U V W Z 123P
Phantoms are used to test the system and the quality features of imaging systems.
Phase cancellation(chemical shift)
Image quality. Fat and water protons have only slightly different resonance frequencies. This results in phase cycling. After an excitation pulse, the fat and water spins of a 1.0 Tesla magnet are alternatively in and out-of-phase every 3.4 ms. For this reason, the signal intensity of a voxel containing fat and water oscillates with an increasing echo time. The strength of the oscilla-tion depends on the relative proportion of fat and water protons in the tissue. This effect occurs only with gradient echo sequences.
Phase-contrast angiography (PCA)
MR application. Method for displaying vascular flow. With PCA, the phase change of the spins in flowing blood induced by velocity is used to dis-tinguish the blood from stationary tissue. Only flowing spins contribute to the signal. The blood contrast in the image is proportional to the local flow velocity.

A B C D E F G H I J K L M N O P Q R S T U V W Z 123P
2D and 3D PCA protocols have established flow sensitivity for all three spatial directions. This allows the display of various flow velocities.
Applications: slow flow, “bent” vessels with variable flow direction, overview projection images.
This technique is also the basis for flow mea-surements.
Phase encoding MR measurement technique. Method for defin-ing the rows in the measurement matrix. Between the RF excitation pulse and the MR readout signal, a magnetic field gradient is switched briefly, applying a phase shift to the spins from row to row. Phase-encoding steps are required to fully scan the slice depending on the matrix (e.g., 256 or 512). The subsequent Fou-rier transformation allocates the various phas-ings to the respective rows.
Phase-encoding gradient
MR measurement technique. Magnetic field gradient switched in the phase-encoding direc-tion.
A B C D E F G H I J K L M N O P Q R S T U V W Z 123P
Phase-encoding step MR measurement technique. Phase encoding of an MR image requires that there are as many excitations and signal acquisitions as there are image matrix rows (e.g., 256 or 512). The ampli-tude of the phase-encoding gradient changes incrementally from excitation to excitation. For this reason, each row of raw data has different phase information.
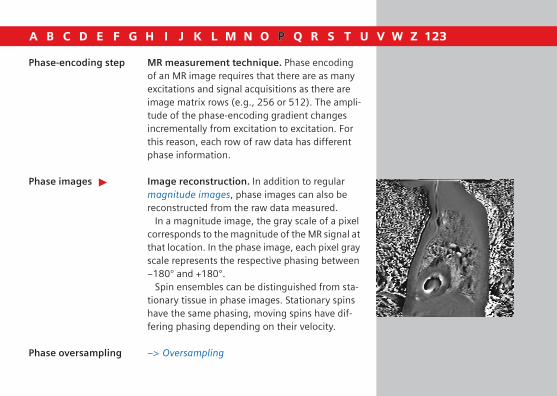
Phase images Image reconstruction. In addition to regular magnitude images, phase images can also be reconstructed from the raw data measured.
In a magnitude image, the gray scale of a pixel corresponds to the magnitude of the MR signal at that location. In the phase image, each pixel gray scale represents the respective phasing between −180° and +180°.
Spin ensembles can be distinguished from sta-tionary tissue in phase images. Stationary spins have the same phasing, moving spins have dif-fering phasing depending on their velocity.
Phase oversampling –> Oversampling

A B C D E F G H I J K L M N O P Q R S T U V W Z 123P
Phase shift MR physics. Loss of phase coherence in precess-ing spins (signal reduction). In most physiologi-cal situations, vascular spins move at variable velocities. Faster flowing spins are subject to a stronger phase shift than slower flowing spins.
Physical gradients –> Gradient coils
Physiologically controlled imaging
MR measurement technique. Physiological movements such as the heartbeat, breathing, blood flow, or fluids generally cause artifacts that make an accurate interpretation of an MR image difficult, if not impossible. Physiologically-con-trolled imaging suppresses these artifacts.–> Cardiac triggering (ECG triggering, pulse triggering), respiratory triggering
Pixel Image quality. Smallest picture element of a dig-ital image. To display the MR image, every pixel in the image matrix contains a specific gray scale.Pixel size = FoV / matrix size
A B C D E F G H I J K L M N O P Q R S T U V W Z 123P
Precession MR physics. Gyration of the rotation axis of a spinning body about another line intersecting it so as to describe a cone.
Precession frequency –> Larmor frequency
Presaturation Image quality. Regional presaturation, frequency-selective presaturation (fat saturation, water saturation) presaturation with inversion pulses (e.g., Dark Blood techniques).
Regional presaturation can be used to reduce the signal from unwanted tissue. For example, to minimize artifacts caused by movement of the thorax. An additional saturation pulse is applied at the beginning of the pulse sequence to satu-rate the spins within the saturation slice.
The saturated region produces almost no signal and appears black in the image.
Proton density MR physics. Number of hydrogen protons per unit of volume (generally: spin density).

A B C D E F G H I J K L M N O P Q R S T U V W Z 123P
Proton density weighting
Image quality. In a proton density-weighted MR image, contrast is affected primarily by the proton density of the tissue to be displayed.
Pseudo gating Physiologically-controlled imaging. Pseudo gating is obtained with a TR corresponding to the RR interval in the cardiac cycle. This application is not intended for cardiac imaging but rather for the prevention of flow artifacts (assuming a sta-ble heart rate).
PSIF sequence MR measurement technique. The PSIF sequence is a time-inverted FISP sequence. It produces a strong T2-weighted contrast in a short measurement time.
Pulse sequence MR measurement technique. Temporal sequence of RF pulse and gradient pulse to excite the volume to be measured, generate the signal, and provide spatial encoding. Each pulse sequence requires a repetition time TR optimized for the respective contrast.
PSIF:FISP read backward

A B C D E F G H I J K L M N O P Q R S T U V W Z 123P
Typical pulse sequences: spin echo, gradient echo, TurboSE, Inversion Recovery, EPI, etc.
Pulse triggering Physiological imaging. Pulse triggering sup-presses motion and flow artifacts, as a result of pulsating blood and fluid. The pulse wave obtained with, e.g., a finger sensor is used as the trigger.
Although pulse sensors are easier to apply than ECG electrodes, they are less accurate and not suitable for cardiac imaging.

A B C D E F G H I J K L M N O P Q R S T U V W Z 123Q
Quadrature coil –> CP coil
Quality assurance Method for tuning the components and parame-ters of an MR system, for determining spatial res-olution, contrast resolution, signal-to-noise ratio, and other quality-relevant parameters.
Quench Super-conductive magnet. Sudden loss of superconductivity of a magnet coil due to a local temperature increase in the magnet. The cryogen used for superconductivity evaporates rapidly, quickly reducing the magnetic field strength.

A B C D E F G H I J K L M N O P Q R S T U V W Z 123R
RADIANT MR mammography. 3D reconstruction similar to ultrasound for breast imaging, generates a 360° view with the nipple as the center.
Radio frequency (RF) MR physics. Frequency required to excite hydro-gen nuclei to resonate. For MR, frequencies in the Megahertz range (MHz) are used, e.g., 63 MHz at 1.5 Tesla. The primary effect of RF magnetic fields on the human body is energy dis-sipation in the form of heat, usually on the sur-face of the body. Energy absorption is an impor-tant value for establishing safety thresholds.–> Specific absorption rate (SAR)
RARE technique MR measurement technique. Fastest Turbo spin-echo technique where a complete echo train of 256 or more echoes is read out after a single excitation pulse. (Single-shot technique TurboSE). Each echo is individually phase-encoded.
Raw data MR measurement technique. The MR measure-ment does not directly obtain the image. Instead
RARE:Rapid Acquisition with Relaxation Enhancement

A B C D E F G H I J K L M N O P Q R S T U V W Z 123R
raw data are generated that are subsequently reconstructed into an image.
Raw data filter Measurement parameters. Raw data can be fil-tered prior to image reconstruction. The Hanning filter is provided with various weightings. The fil-ter is able to reduce edge oscillations, for exam-ple.
Raw data matrix MR measurement technique. As with a holo-gram, every point in the raw data matrix contains part of the information for the complete image. This is why a point in the raw data matrix does not correspond to a point in the image matrix.
The rows arranged about the center of the raw data matrix determine the basic structure and contrast in the image. The outer rows of the raw data matrix provide information regarding the borders and contours of the image, detailed structures, and also determine the resolution.
Using the two-dimensional Fourier transforma-tion, the raw data matrix is converted into the
A B C D E F G H I J K L M N O P Q R S T U V W Z 123R
image matrix. For this reason, raw data rows are also referred to as Fourier lines.
Readout –> Readout direction
Readout bandwidth Measurement parameters. A pulse sequence's received bandwidth in the readout direction.
Readout direction MR measurement technique. The direction in which the MR signal is read out. It corresponds to the direction of frequency encoding.
Receiver bandwidth –> Readout bandwidth
Receiver tuning MR measurement technique. Setting of the receiver dynamic of the analog-to-digital converter (ADC). This is not necessary for many modern systems with large receiver dynamic ranges.
Rectangular FoVRecFoV
Measurement parameters. When the object of interest is oval, a rectangular field of view can be
A B C D E F G H I J K L M N O P Q R S T U V W Z 123R
selected. This applies in particular to examina-tions of the abdominal and spinal regions.
The rectangular FoV can be combined with a reduced measurement matrix. For example, a rectangular FoV is sampled with an adjusted matrix. A rectangular image is obtained with less rows than columns.
The full resolution raw data space is sampled less densely, so resolution is not lost. Measure-ment time is reduced, but so is the signal-to-noise ratio.
Reduced matrix Measurement parameters. When you select fewer lines than columns for the measurement matrix, a reduced matrix results. The high local frequencies are no longer measured. This reduces the measurement time. The lines not measured are filled with zeroes prior to image reconstruction (zero filling). This corresponds to an interpolation in the phase-encoding direction; therefore, a square image is still displayed on screen.

A B C D E F G H I J K L M N O P Q R S T U V W Z 123R
Reference image Post-processing. Selected template for defining reconstruction methods, such as MIP or MPR.
Refocussing –> Rephasing
Region of Interest (RoI)
Post-processing. An RoI is the area in the MR image singled out for evaluation.
Registration Measurement preparation: Prior to an MR examination, each patient has to be regis-tered. The patient data are entered, providing for a clear allocation between the patient and MR image.Interventional imaging: Link between the “real” position and the measured data record.
Matching data from different modalities.
Relaxation MR physics. Dynamic, physical process where a system returns from a state of imbalance to equi-librium.–> Longitudinal relaxation–> Transverse relaxation

A B C D E F G H I J K L M N O P Q R S T U V W Z 123R
Relief artifact Image quality. Relief-like structures along the transitions between tissue with significant differ-ences in fat and water content (e.g., spleen, kid-neys, eye sockets, spine, and spinal disks).
The cause is a chemical shift: the signals of the fat and water protons in a voxel are allocated to different image pixels during image reconstruc-tion. At transitions of fat and water, these incor-rect encodings lead to a higher signal (dark sur-face area) or to an invalid signal (bright areas) in the respective frequency-encoding direction.
Repetition time (TR) Measurement parameters. In general, the time between two excitation pulses. Within the TR interval, signals may be acquired with one or more echo times, or one or more phase encod-ings (depending on the measurement tech-nique). TR is one of the measurement parame-ters that determines contrast. The acquisition time (TA) is directly proportional to TR.
Rephased-Dephased –> Magnitude contrast angiography
TR:Time to Repetition

A B C D E F G H I J K L M N O P Q R S T U V W Z 123R
Rephasing MR physics. Reversal from dephasing; the spins go back into phase. Obtained through a 180° pulse that creates a spin echo, or a gradient pulse in the opposite direction.
Resistive magnet MR components. Resistive magnet. A magnet whose magnetic field is generated using a nor-mally conductive coil system. When used with copper or aluminum conductors, this system cre-ates a maximum field strength of 0.3 Tesla. Dis-advantage: high electric costs.
Resolution –> Image resolution
Resonance Physics. Exchange of energy between two sys-tems at a specific frequency. In musical instru-ments, for example, strings at the same pitch will resonate.
Resonance frequency MR physics. The frequency at which resonance occurs. In MR, this frequency is used for the RF pulse that affects the spin equilibrium, that is, it matches the Larmor frequency.

A B C D E F G H I J K L M N O P Q R S T U V W Z 123R
Respiratory gating Cardiac imaging. Synchronization of measure-ment with the patient's breathing. Diaphragm movement is detected with the navigator echo.
Respiratory triggering Physiologically-controlled imaging. Technique for reducing respiratory artifacts. Data acquisi-tion is synchronized to breathing. A respiratory signal acquired with suitable sensors or MR methods (navigator echo) is used as the trigger signal.
Restore sequence MR measurement technique. The Restore sequence in T2-weighted TurboSE imaging increases the signal of substances with long relaxation times (e.g., CSF). This is realized via the use of a 90° RF pulse (so-called “Restore pulse”) at the end of the echo train of the TurboSE sequence. This rotates the transverse magnetization back in the longitudinal axis, accelerating relaxation of the longitudinal mag-netization. It allows for a shorter TR with compa-rable contrast as well as a reduced measurement time.

A B C D E F G H I J K L M N O P Q R S T U V W Z 123R
Retrospective gating Cardiac imaging. Simultaneous acquisition of untriggered data and the ECG signal. The ECG signal is used during subsequent post-processing to assign the images to the correct phase in the cardiac cycle.
May also be used for pulsatile flow.
REVEAL Diffusion imaging. Diffusion-weighted single-shot technique for differential diagnosis when evaluating lesions in the overall body, especially in the torso.
RF antenna –> RF coils
RF coils MR components. Antennas, called coils in the language of MR, are used to send RF pulses and/or receive MR signals.
As transmitter coils, they should excite the nuclei in the volume of interest as homoge-neously as possible: All nuclei should receive the same excitation.
As receiver coils, they should receive the MR signal with as little noise as possible. The sig-
RF:Radio frequency
A B C D E F G H I J K L M N O P Q R S T U V W Z 123R
nal strength depends on the volume of excitation in the coil and the distance to the object to be measured. The noise, however, depends prima-rily on the size of the coil.
RF pulse –> Excitation pulse
RF shielding Image quality. The radio-frequency pulses used in MR is in the radio frequency range. They have to be shielded for two reasons:• external electromagnetic waves (e.g., radios,
electrical machines) would distort the measure-ment and generate image artifacts
• to avoid interference with other receivers, the RF signals of the system should not extend be-yond the systemRF shielding is provided by installing the mag-
net and receiver coils in a Faraday cage (a space that cannot be penetrated by high-frequency waves). For that purpose, the magnet room is, e.g., shielded with copper and windows are cov-ered with electrically-conductive screens.

A B C D E F G H I J K L M N O P Q R S T U V W Z 123Z
RF spoiling –> Spoiler gradient
RF tuning MR measurement technique. Adjustment of components prior to the measurement, usually automatic.–> Frequency tuning–> Receiver tuning–> Transmitter tuning
Rise time MR measurement technique. The time required by the gradient field to rise from zero to the max-imum value.
Rows MR measurement technique. The phase-encoded portion of the measurement matrix. Frequently, just a row in the image is displayed.–> Columns

A B C D E F G H I J K L M N O P Q R S T U V W Z 123S
Sagittal –> Orthogonal slices
Saturation MR physics. The state in which spins have no net longitudinal or transverse magnetization. It is not possible to obtain an MR signal from saturated tissue.
Saturation recovery (SR)
MR measurement technique. Technique for generating primarily T1-dependent contrast through a series of 90° excitation pulses. Imme-diately after the first pulse, longitudinal magneti-zation is zero because the tissue is saturated. The next 90° pulse is not applied until longitudinal magnetization has partially recovered (recovery).
The recovery time depends on the T1 constant of the tissue.
Saturation slice Slice positioning. Regional presaturation to sup-press undesired signals for specific areas, either within the slice or parallel to it.–> Parallel saturation–> Presaturation–> Traveling sat

A B C D E F G H I J K L M N O P Q R S T U V W Z 123S
Scan 1. Acquiring one or several MR signals after a sin-gle excitation pulse2. Acquiring a complete raw data record
Scan time –> Measurement time
Scout –> Basic image
SE-CSI technique MR spectroscopy. Hybrid procedure based on the spin-echo SVS technique.
Segmented HASTE MR measurement technique. Variant of the standard HASTE technique. With segmented HASTE, half the image information is acquired after the first excitation pulse, and the other half after the second excitation pulse. The raw data, acquired after the first and second excitation pulse, are then interleaved into the raw data matrix. A long repetition time TR is selected to allow the spin system to recover between excita-tion pulses. Any dead time can be used to excite additional slices.
SE-CSI:Spin-Echo Chemical Shift ImagingHASTE:Half-Fourier AcquisitionSingle-Shot TurboSE

A B C D E F G H I J K L M N O P Q R S T U V W Z 123S
Advantage: The length of the multi-echo pulse train is cut in half. HASTE sequences may also be divided into more than 2 segments.
Selective excitation MR measurement technique. Limits excitation to the region selected. Magnetic field gradients are combined with a narrow band RF pulse. Selective excitation is also used with fat and water suppression. Low band RF pulses excite protons bound in fat or water.
SENSE MR measurement technique. Image-based par-allel acquisition technique (PAT). With SENSE, PAT reconstruction is performed after the Fourier transformation.
Sensitivity –> MR sensitivity
Sequence –> Pulse sequence
Sequential multi-slice imaging
MR measurement technique. The slices in the area under examination are measured sequen-
SENSE:Sensitivity Encoding
A B C D E F G H I J K L M N O P Q R S T U V W Z 123S
tially. The slices requested are selected using suitable gradients (selective excitation).
Shielding –> Active shielding–> Magnetic shielding–> Passive shielding–> RF shielding
Shim Quality assurance. Correction of magnetic field inhomogeneities caused by the magnet itself, ferromagnetic objects, or the patient's body. The basic shim usually involves the introduction of small iron pieces in the magnet. The patient-related fine shim is software-controlled and per-formed using a shim coil.–> Active shim–> Global Shim–> Interactive shim–> Local shim–> 3D shim
Shim coils MR components. Coils that create weak addi-tional magnetic fields in various spatial direc-
A B C D E F G H I J K L M N O P Q R S T U V W Z 123S
tions. Used to correct inhomogeneity in the main magnetic field.
Signal –> MR signal
Signal elimination Image quality. Areas in the image that do not generate a signal, that is, they are black. There are different reasons for signal elimination: Metal artifacts, susceptibility artifacts, flow effects, and saturation effects. Flow effects may occur with fast flow when using spin-echo sequences. After half the echo time, the bolus has flown out of the slice completely. Since it is no longer acquired by the slice selective 180° pulse, it no longer produces a spin echo: blood appears black in the image.
Signal-to-noise ratio (SNR)
Image quality. Relationship between the inten-sity of signal and noise. Ways to improve SNR include: • increasing the number of averages• increasing the measurement volume (al-
though spatial resolution degrades)

A B C D E F G H I J K L M N O P Q R S T U V W Z 123S
• using special coils and local coils• smaller bandwidth• shorter echo time• thicker slice
Simultaneous excitations
MR measurement technique. Special averag-ing procedure that excites two slices simulta-neously. This enables, e.g., more slices to be acquired in the same measurement time.
A simultaneous excitation offers the following advantages:• shorter TR with the same number of slices, the
same measurement time, and the same num-ber of concatenations
• double the number of slices with the same signal-to-noise ratio at the same TR and acqui-sition time
Single-shot technique MR measurement technique. All image infor-mation is acquired in a single pulse. The magne-tization of a fully relaxed spin system is used. Each of the subsequent echoes is given a differ-ent phase encoding. Only slightly more than half

A B C D E F G H I J K L M N O P Q R S T U V W Z 123S
the raw data are acquired. The image is obtained through Half-Fourier matrix reconstruction.
Single-shot techniques include: EPI, RARE, HASTE.
Single volume spectroscopy
MR spectroscopy. SVS methods map the meta-bolic information from the Volume of Interest (VoI) in a spectrum. Single volume techniques are advantageous in case of pathological changes that cannot be spatially limited to a few VoIs: to a large extent, local magnetic field inho-mogeneities can be compensated for with a “local volume-sensitive shim”.
Currently, clinical 1H spectroscopy uses single volume techniques based on spin echoes (SE) or stimulated echoes (STEAM).
Slab thickness 3D imaging. The slice thickness of a 3D slab.
Slew rate MR measurement technique. Gradient field increase by unit time (unit: T/m/s)Slew rate = gradient strength/rise time
SVS:Single Volume Spectroscopy

A B C D E F G H I J K L M N O P Q R S T U V W Z 123S
Slice Measurement parameters. Thin, three-dimen-sional cuboid uniquely defined by slice position, FoV, and slice thickness The center plane of the slice is the image plane.
Slice boundary artifact Image quality. Slice boundary artifacts are caused through signal loss at the boundaries between slices (Slab Boundary Artifact, Venetian Blind Artifact). They appear typically during con-ventional 3D multi-slab measurements and lead to oscillations in signal intensity and staircase phenomena along the vessels.
Slice distance Measurement parameters. The separation between the center planes of two sequential slices or 3D slabs.
Slice gap Measurement parameters. The gap between the nearest edges of two adjacent slices. Not to be confused with slice distance.
Slice orientation Measurement parameters. Orthogonal planes are available for use as the basic slice orientation:

A B C D E F G H I J K L M N O P Q R S T U V W Z 123S
• sagittal• coronal• transverse
An oblique or double-oblique slice is obtained by rotating the slice out of the basic orientation.
Slice position Measurement parameters. The position of the slice to be measured within the area under exam-ination.
Slice positioning Graphical positioning of the slices/saturation regions to be acquired in a basic image.
Slice selection MR measurement technique. To display an MR image of the human body, the slice desired has to be selectively excited. For orthogonal slices, a magnetic field gradient is applied per-pendicular to the desired slice plane (slice-selec-tion gradient). Oblique and double-oblique slices are excited by simultaneously applying 2 or 3 gradient fields.

A B C D E F G H I J K L M N O P Q R S T U V W Z 123S
Slice sequence Measurement parameters. For multi-slice mea-surements, the excitation sequence can be selected as needed:• ascending (1, 2, 3, ..., n)• descending (n, n−1, ..., 3, 2, 1)• interleaved (1, 3, 5, ..., 2, 4, 6, ...)• freely defined
Slice shift Measurement parameters. Distance between the center of a slice group and the center of the magnetic field in the slice-selection direction.
Slice thickness Measurement parameters. The thickness set for the slice to be measured. The thicker the slice, the stronger the signal and the better the signal-to-noise ratio. However, spatial resolution drops.
SMASH MR measurement technique. k-space-based method of Parallel Acquisition Technique (PAT) With SMASH, PAT reconstruction is performed prior to the Fourier transformation.
SMASH:Simultaneous Acquisition of Spatial Harmonics

A B C D E F G H I J K L M N O P Q R S T U V W Z 123S
Smearing artifact Image quality. In the case of non-periodic move-ments, such as eye movement, the excited spins may be at a different location in the gradient field at the time of the echo. This results in incor-rect phase encoding. This smears the object in the phase-encoding direction. These artifacts are more discrete for periodic movements (respira-tion, blood flow).
SPACE MR measurement technique. SPACE is a vari-ant of the 3D Turbo spin echo. As compared to a conventional TurboSE sequence, SPACE uses non-selective, short refocussing pulse trains that consist of RF pulses with variable flip angles. This allows for very high turbo factors (> 100) and high sampling efficiency. The results are high-resolution, isotropic images that allow for free reformatting on all levels.
SPAIR MR measurement technique. Robust fat satura-tion for body imaging due to a frequency-selec-tive inversion pulse. The SPAIR technique is an
SPAIR:Spectrally Adiabatic Inversion Recovery

A B C D E F G H I J K L M N O P Q R S T U V W Z 123S
alternative for conventional spectral fat satura-tion and water excitation.
Spatial encoding MR measurement technique. Definition of position and orientation of a slice via the fre-quency and phase-encoding gradient. The loca-tion of MR signals is encoded and reconstructed in subsequent image computations.
Spatial resolution Image quality. To acquire an image with full spa-tial resolution, the FoV, the measurement matrix and the slice thickness have to be considered as well. It is characterized by the voxel size. The smaller the voxel, the higher the spatial resolu-tion and the lower the signal measured.
Special coil –> Local coils
Specific absorption rate (SAR)
Safety. The RF energy absorbed per time unit and per kilogram. Absorption of RF energy can result in warming of the body. Energy absorption is an important value for establishing safety thresholds.
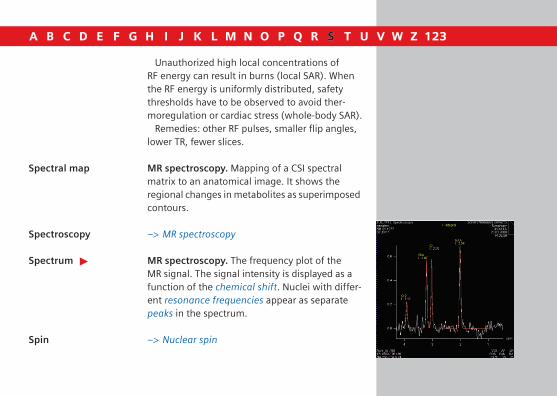
A B C D E F G H I J K L M N O P Q R S T U V W Z 123S
Unauthorized high local concentrations of RF energy can result in burns (local SAR). When the RF energy is uniformly distributed, safety thresholds have to be observed to avoid ther-moregulation or cardiac stress (whole-body SAR).
Remedies: other RF pulses, smaller flip angles, lower TR, fewer slices.
Spectral map MR spectroscopy. Mapping of a CSI spectral matrix to an anatomical image. It shows the regional changes in metabolites as superimposed contours.
Spectroscopy –> MR spectroscopy
Spectrum MR spectroscopy. The frequency plot of the MR signal. The signal intensity is displayed as a function of the chemical shift. Nuclei with differ-ent resonance frequencies appear as separate peaks in the spectrum.
Spin –> Nuclear spin

A B C D E F G H I J K L M N O P Q R S T U V W Z 123S
Spin density –> Proton density
Spin-echo (SE) MR measurement technique. The reappear-ance of an MR signal after the decay of the FID signal. Dephasing of the spins (decay in trans-verse magnetization) is offset through the appli-cation of a 180° inversion pulse. The spins rephase, producing the spin echo at time TE (echo time).
T2* effects (field inhomogeneity, susceptibil-ity) are reversed but not T2 effects.
Spin-echo sequence MR measurement technique. The sequence of an excitation pulse (90°) and refocusing pulse (180°) produces a spin echo. Can be used to gen-erate strong T2-weighted images.
Spin-lattice relaxation –> Longitudinal relaxation
Spin-spin coupling MR spectroscopy. Interaction between MR sensi-tive nuclei in a molecule, resulting in additional splitting of peaks in the spectrum.

A B C D E F G H I J K L M N O P Q R S T U V W Z 123S
Spin-spin relaxation –> Transverse relaxation
Spoiler gradient MR measurement technique. Gradient pulse with sufficient amplitude and/or duration to completely dephase the transverse magnetiza-tion. The spoiler gradient is applied after the echo so that transverse magnetization is destroyed prior to the next excitation pulse.
Used for presaturation and FLASH sequences.
SSD –> Surface shaded display
STEAM technique MR spectroscopy. Single volume method. With the STEAM pulse sequence, 3 slice-selective 90° pulses generate a stimulated echo.
Stimulation Safety. The magnetic field changes quickly when switching high-field gradients. If the electrical fields generated exceed a specific threshold, electrical currents can be induced in the patient's body.
STEAM:Stimulated Echo Acquisition Method

A B C D E F G H I J K L M N O P Q R S T U V W Z 123S
The currents may lead to peripheral nerve stimulation for the patient that may be consid-ered uncomfortable.
This is an important value for establishing safety limits.
STIR sequence MR measurement technique. Inversion recov-ery sequence with a short inversion time Tl, used for fat suppression. TI selection depends on the field strength.
Stray field Safety. Magnetic field outside the magnet that does not contribute to imaging. A specific dis-tance has to be kept between the field and vari-ous devices and patients with cardiac pacemak-ers (e.g., 0.5 mT line).
The stray field is low with permanent magnets because the system is largely self-shielding.
Stripe tagging –> Tagging
Superconductive magnet
MR components. An electromagnet whose strong magnetic field (typically at least 0.5 T) is
STIR:Short TI Inversion Recovery

A B C D E F G H I J K L M N O P Q R S T U V W Z 123S
generated using superconductive coils. The con-ductive wires of the coils are made of a cryogeni-cally cooled Niobium Titanium alloy. Liquid helium is used as the cryogen or liquid nitrogen for pre-cooling.
Superconductivity Physics. Material characteristic of various alloys, which at very low temperatures (close to abso-lute zero) results in a complete loss of electrical resistance. Electrical current can then flow with-out loss.
Surface coil MR components. Special RF receiver coil posi-tioned close to the body to acquire signal from nearby regions. Compared to the body coil, the RF receiver coil has a better signal-to-noise ratio and higher spatial resolution. Surface coils can also be used for simple localization in MR spec-troscopy.
Surface shaded display (SSD)
Post-processing. Three-dimensional display of surfaces via variable threshold values, of e.g., contrast-enhanced vessels.

A B C D E F G H I J K L M N O P Q R S T U V W Z 123S
Susceptibility(Magnetizability)
Physics. Measure for the ability of a material or tissue to be magnetized in an external magnetic field.
Susceptibility artifact
Image quality. Local magnetic field gradients are produced in all transitions between tissues of differing magnetic susceptibility. In transitions between tissue and air-filled spaces (e.g., the temporal bone), areas may be present that show reduced signal or no signal at all.
The effect is stronger with gradient echo sequences, in particular EPI.
Susceptibility contrast Image quality. T2* contrast
Susceptibility-weighted imaging (SWI)
MR measurement technique. Susceptibility-weighted imaging displays venous vessels as well as hemorrhages in the human brain. The SWI technique reacts with sensitivity to local changes in magnetic fields caused by desoxygenated blood or local iron deposits.
SVS method –> Single volume spectroscopy

A B C D E F G H I J K L M N O P Q R S T U V W Z 123S
Swap –> Gradient swap
SWI –> Susceptibility-weighted imaging (SWI)
syngo Common imaging software for all Siemens modalities.
syngo BEAT –> BEAT
syngo BLADE –> BLADE
syngo BRACE –> BRACE
syngo GRACE –> GRACE
syngo MR MR-specific syngo application.
syngo NATIVE –> NATIVE
syngo REVEAL –> REVEAL
syngo SPACE –> SPACE

A B C D E F G H I J K L M N O P Q R S T U V W Z 123S
syngo TimCT –> TimCT
syngo TWIST –> TWIST
syngo VIEWS –> VIEWS

A B C D E F G H I J K L M N O P Q R S T U V W Z 123T
Tagging Grid tagging: Grid of saturation lines across cardiac MR images. Used to view myocardial motion.Stripe tagging: Parallel stripes in the MR image; used to view myocardial motion in primary axis view or four-chamber view.
Targeted MIP –> Localized MIP
Tesla (T) MR physics. SI unit for magnetic field strength. Approximately 20,000 times as strong as the earth's magnetic field (1 Tesla = 10000 Gauss).
Tim (Total imaging matrix)
MR components. The Tim matrix concept allows for whole-body examinations with an FoV of up to 205 cm without repositioning the patient. Pre-requisites for Tim: matrix coils in combination with RF receiver channels.
Example: Tim [76 × 32]: Tim system up to 76 coil elements and 32 RF channels
TimCT MR measurement technique. TimCT (Continu-ous table move) enables measurements of large
A B C D E F G H I J K L M N O P Q R S T U V W Z 123T
examination regions with continuous table move, that is, in one examination step without measurement pauses or repositioning the table “MR as easy as CT”. Continuous scanning in the isocenter of the magnet provides for highest image quality and avoids slice boundary artifacts with multi-levels.
Time-of-flight angiography (ToF)
MR angiography. The time-of-flight angiogra-phy (inflow angiography) visualizes vessels through the flow of non-saturated, fully relaxed blood into the slice which generates a high sig-nal. By comparison, stationary spins are partially saturated and generate a relatively low signal intensity.–> Inflow amplification
Time series (TS) Perfusion imaging. The obtained T2* images are labeled with number and time position in the series. They maybe used in Cine and for statisti-cal evaluations.

A B C D E F G H I J K L M N O P Q R S T U V W Z 123T
Time-to-Peak map (TTP)
Perfusion imaging. A TTP map shows the regional distribution of the time needed to the minimum perfusion signal, either in gray scale or color-coded. It is generated for every slice mea-sured.
TIR sequence –> Turbo inversion recovery
TIRM sequence –> Turbo inversion recovery magnitude
Tissue contrast –> Contrast
t-map BOLD imaging. When evaluated with the t-test, the t-map shows the measurement data of BOLD imaging as strictly functional information. Posi-tive correlations located between stimulation and active brain areals are shown as bright, neg-ative correlates are shown as dark.
ToF-Angio –> Time-of-flight angiography
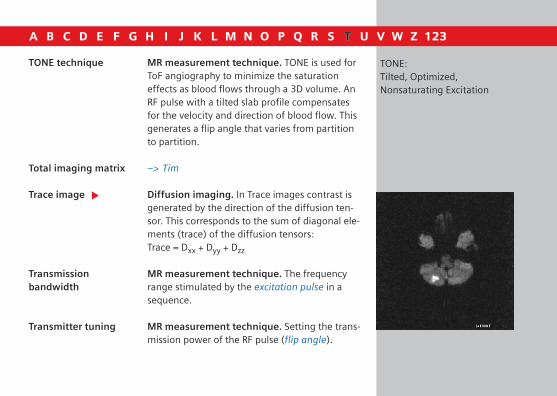
A B C D E F G H I J K L M N O P Q R S T U V W Z 123T
TONE technique MR measurement technique. TONE is used for ToF angiography to minimize the saturation effects as blood flows through a 3D volume. An RF pulse with a tilted slab profile compensates for the velocity and direction of blood flow. This generates a flip angle that varies from partition to partition.
Total imaging matrix –> Tim
Trace image Diffusion imaging. In Trace images contrast is generated by the direction of the diffusion ten-sor. This corresponds to the sum of diagonal ele-ments (trace) of the diffusion tensors:Trace = Dxx + Dyy + Dzz
Transmission bandwidth
MR measurement technique. The frequency range stimulated by the excitation pulse in a sequence.
Transmitter tuning MR measurement technique. Setting the trans-mission power of the RF pulse (flip angle).
TONE:Tilted, Optimized, Nonsaturating Excitation

A B C D E F G H I J K L M N O P Q R S T U V W Z 123T
Transverse –> Orthogonal slices
Transverse magnetization (Mxy)
MR physics. Transverse magnetization Mxy is the component of the macroscopic magnetization vector in the xy-plane; that is, oriented perpen-dicular to the applied magnetic field.
The precession of transverse magnetization induces electrical voltage in a receiver coil that changes over time. The temporal progression of this voltage is the MR signal. After RF excitation, Mxy decays to zero at time constant T2 (ideal) or T2* (real).
Transverse relaxation MR physics. Decay of transverse magnetization through the loss of phase coherence between precessing spins (due to spin exchange); is also known as spin-spin relaxation.
Transverse relaxation time
–> T2 constant
Traveling sat Slice positioning. A presaturation pulse is applied to one side of the slice to reduce the sig-

A B C D E F G H I J K L M N O P Q R S T U V W Z 123T
nal intensity of spins (typically blood) that are about to flow into this side of the slice. This enables arteries or veins to be displayed selec-tively, since the flow is often in the opposite direction (e.g., carotid artery and jugular vein).
The slices are measured sequentially (slice-by-slice). The presaturation pulse retains its position relative to the slice.
Trigger Physiologically-controlled imaging. Reference point in the physiological signal which releases the scan, e.g., the R wave in the ECG signal.
Trigger delay time (TD) ECG triggering. Interval between the trigger and release of the measurement.
Trigger signal Physiologically-controlled imaging. Physiologi-cal signal (ECG signal, finger pulse or respiratory curve) that starts or restarts data acquisition.
TrueFISP MR measurement technique. The TrueFISP gra-dient echo sequence provides the highest signal of all steady state sequences. The contrast is a

A B C D E F G H I J K L M N O P Q R S T U V W Z 123T
function of T1/T2. However, with a short TR and a short TE, the T1 portion remains constant. The images are primarily T2-weighted.
The FISP and PSIF signal are generated simulta-neously. Due to the superposition of both sig-nals, TrueFISP is sensitive to the inhomogeneities in the magnetic field. The images may contain interference stripes. For this reason, TR should be as short as possible, and a shim has to be per-formed.
Truncation artifact Image quality. MR images frequently show peri-odic oscillations parallel to tissue transitions. The artifacts show bands with alternating high and lower signal intensity. All abrupt transitions in tissue are subject to this effect.
The artifact is created through point-by-point sampling of the analog signal. Theoretically, an infinite number of points would have to be sam-pled. In practical application, however, there is a finite number of points: the data are truncated.

A B C D E F G H I J K L M N O P Q R S T U V W Z 123T
t-test BOLD imaging. Statistical evaluation method for BOLD measurements (previously Z-score). Is used to compute the differential image from the mean values of action and non-action images. Today, the t-test is integrated into GLM.
Turbo factor Measurement parameters. Measurement time saved using a TurboSE sequence rather than a conventional spin-echo sequence.
Example: At a turbo factor of 7, the TurboSE sequence measures 7 times faster than a SE sequence with comparable parameters.
TurboFLASH MR measurement technique. With a Turbo-FLASH sequence, the entire raw data matrix is measured in one acquisition only with an ultra-fast gradient echo sequence. The image contrast is modified via preparation pulses.

A B C D E F G H I J K L M N O P Q R S T U V W Z 123T
Turbo gradientspin echo (TurboGSE)
MR measurement technique. With TurboGSE, additional gradient echoes are generated before and after each spin echo. The spin echoes are allocated to the center of the raw data matrix to give pure T2 contrast. The gradient echoes are allocated to the outer segments. A pure T2 con-trast is obtained by filling these segments. Gradi-ent echoes determine mainly the image resolu-tion.
Advantages as compared to TurboSE: they are faster, fat is darker, greater sensitivity to suscepti-bility effects (e.g., bleeding with hemosiderin).
Turbo inversion recovery (TurboIR, TIR)
MR measurement technique. TurboSE sequence with long TEeff to suppress fluids. The TurboIR sequence allows for a true inversion recovery display that shows the arithmetic sign of the signal.
Turbo inversion recovery magnitude (TIRM)
MR measurement technique. Identical to TurboIR, however, with the magnitude image of the signal and appropriate display.

A B C D E F G H I J K L M N O P Q R S T U V W Z 123T
TurboMR angiography
MR angiography. Fast 3D angio techniques; increases speed by a factor of 2 using zero filling, short TR and TE and interpolation techniques in the slice-selection direction.
Turbo spin echo (TurboSE, TSE)
MR measurement technique. TurboSE is a fast multi-echo sequence. Each echo of a pulse train includes a different phase encoding. Within one repetition time TR, raw data rows equal to the number of pulse train echoes are acquired (seg-mented raw data).The turbo factor increases speed, and is fre-quently used to improve resolution.
TWIST MR measurement technique. The TWIST method shortens the measurement time for angiographic examinations even further at high image quality. This is obtained through an irregu-lar sampling of the raw data lines: the center lines increase the sampling rate considerably, increasing the temporal resolution of images. Bolus timing is not required with TWIST. Also consumption of contrast agent is reduced.

A B C D E F G H I J K L M N O P Q R S T U V W Z 123T
T1 constant(Longitudinal relaxation time)
MR physics. Tissue-specific time constant which describes the return of the longitudinal magneti-zation to equilibrium. After time T1, the longitu-dinal magnetization grows back to approx. 63 % of its end value. A tissue parameter that deter-mines contrast.
T1 contrast Image quality. The contrast of a T1-weighted image depends primarily on the various T1 time constants of the different tissue types.
T2 constant(Transverse relaxation time)
MR physics. Tissue-specific time constant that describes the decay of transverse magnetization in an ideal homogeneous magnetic field. After time T2, transverse magnetization has lost 63 % of its original value. A tissue parameter that determines contrast.
T2 contrast Image quality. The contrast of a T2-weighted image depends primarily on the various T2 time constants of the different tissue types.

A B C D E F G H I J K L M N O P Q R S T U V W Z 123T
T2* constant MR physics. Characteristic time constant that describes the decay of transverse magnetization, taking into account the inhomogeneity in static magnetic fields and the human body. T2* is always less than T2.
A B C D E F G H I J K L M N O P Q R S T U V W Z 123U
UTE MR measurement technique. Pulse sequences with echo times (TE) that are 10–200 shorter than the conventional ones. This allows for the display of tissue components with a short T2 (e.g., membranes, compact bone substance) that could appear as dark only due to their small signal portion.
UTE:Ultrashort TE

A B C D E F G H I J K L M N O P Q R S T U V W Z 123V
venc value –> Flow sensitivity
Venetian blind artifact –> Slice boundary artifact
VERSE MR measurement technique. Sequences with time-optimized VERSE pulses improve the slice profile for 3D measurements. This allows for the accelerated 3D imaging of limited volumes with a consistent image contrast across the entire 3D slab.
VIBE sequence MR measurement technique. For reducing the acquisition time. 3D acquisition with a reduced number of slices using interpolation and/or par-tial Fourier techniques, primarily for dynamic contrast-enhanced examinations of the abdo-men.
VIEWS MR mammography. Bilateral 3D measurement technique for the breast with fat saturation or water stimulation.
venc:velocity encoding
VERSE:Variable-Rate Selective Excitation
VIBE:Volume Interpolated Breathhold Examination
VIEWS:Volume Imaging with Enhanced Water Signal

A B C D E F G H I J K L M N O P Q R S T U V W Z 123V
Volume of Interest (VoI)
MR spectroscopy. A VoI is the volume used for measurements or evaluations.
For SVS or hybrid CSI procedures, VoI means the measurement volume that supplies the sig-nal. For SVS, VoI and voxel are identical, but for hybrid CSI the VoI is divided into voxels.
Volume rendering technique
–> 3D VRT
Voxel Imaging. Volume element of the sample to be examined.Voxel size = slice thickness × pixel size–> Spatial resolution
Voxel bleeding MR spectroscopy. Voxel bleeding indicates cross talk of signal intensities from one voxel to an adjacent voxel. Up to 10 % of a signal can appear in an adjacent voxel. These localization artifacts tend to appear in the image during intensity tests. It is reduced by an apodization filter (e.g., Hanning filter).

A B C D E F G H I J K L M N O P Q R S T U V W Z 123V
VRT 3D VRT

A B C D E F G H I J K L M N O P Q R S T U V W Z 123W
Washout effect Image quality. The washout effect can appear perpendicular to the image plane during fast flow. It occurs during spin-echo imaging and sim-ilar procedures. Using a 90° pulse, a bolus is excited within the slice to be measured. If blood flows out of the slice before the subsequent 180° pulse, some or all of the signal is lost. This results in a low signal or no signal at all.
Water image A pure water image only displays the signal from water protons in the image and suppresses the signal from fat protons. Is generated with the Dixon technique, for example.
Water saturation Image quality. Frequency-selective excitation of water, with subsequent dephasing, is used to suppress water signals. This technique is used for MR imaging and spectroscopy.
Water suppression –> Dark-fluid imaging (FLAIR)–> Water saturation
Whisper –> Whisper sequences

A B C D E F G H I J K L M N O P Q R S T U V W Z 123W
Whisper sequences MR measurement technique. Sequences with low-noise gradient pulses.
Width –> Windowing
Windowing Image display. Settings for brightness (center) and contrast (width) in the MR image.
Wrap-around –> Aliasing artifact

A B C D E F G H I J K L M N O P Q R S T U V W Z 123Z
Zero filling MR measurement technique. Interpolation technique for expanding a raw data matrix with zeroes.
ZIP technique Image reconstruction. Interpolation technique in the slice-selection direction for 3D measure-ments. Enables the reconstruction of thinner slices.
Z-score –> t-test

A B C D E F G H I J K L M N O P Q R S T U V W Z 123123
1D PACE MR measurement technique. Fast motion cor-rection in real time, for example, during cardiac imaging. This PACE technique allows the patient to breathe freely during the measurement.
2D PACE MR measurement technique. The PACE tech-nique used in abdominal imaging is based on a local 2D test image for motion detection.
3D imaging MR measurement technique. In 3D imaging the entire measurement volume, the 3D slab, is stim-ulated and not just single slices. Additional phase encoding in the slice-selection direction provides information in this direction.
3D PACE MR measurement technique. Fully automatic technique for motion detection and correction during BOLD measurements. Serves to eliminate motion artifacts.
3D PACE corrects 6 degrees of freedom (3 translations and 3 rotations) in real time.
PACE:Prospective Acquisition Correction
A B C D E F G H I J K L M N O P Q R S T U V W Z 123123
3D shim Quality assurance. 3D shim enables the shim volume to be limited (local shim). A 3D volume (VoI) is defined. The local magnetic field distribu-tion is determined in this volume, resulting in the calculation of the shim currents.
A 3D shim provides for a more precise result than a MAP shim and therefore for a better fat saturation. For spectroscopy, it provides a better starting value for the interactive shim.
3D slab Measurement parameters. Measurement vol-ume stimulated for 3D imaging. The 3D slab is divided into partitions.
3D TurboSE MR measurement technique. As a 3D sequence, TurboSE allows for the acquisition of T2 images with thin slices and practically uniform voxels.
3D VRT Post-processing. 3D display for well-defined imaging of complex anatomies and anatomic relationships, e.g., in contrast angiography. In
VRT:Volume Rendering Technique

A B C D E F G H I J K L M N O P Q R S T U V W Z 123123
addition to color images, a threshold-based seg-mentation of 3D objects is possible.

Abbreviations
ADC Analog-to-Digital ConverterADC Apparent Diffusion CoefficientART Advanced Retrospective TechniqueAS Active ShieldingASL Arterial Spin Labelingb b-valueB Magnetic induction, MR: Magnetic fieldBRACE Breast Acquisition CorrectionB0 Main magnetic fieldB1 Alternating magnetic fieldCE MRA Contrast-Enhanced MR AngiographyCM Contrast agentCNR Contrast-to-Noise RatioCP Circular PolarizationCSF Cerebro-Spinal Fluid, LiquorCSI Chemical Shift ImagingdB/dt Temporal change of he magnetic fieldDTI Diffusion Tensor ImagingEPI Echo-Planar ImagingFA Flip AngleFA Fractional AnisotropyFFT Fourier TransformationFID Free Induction Decay

Abbreviations
FLAIR Fluid Attenuated Inversion RecoveryfMRI Functional Magnetic Resonance ImagingFoV Field of ViewFT Fourier TransformationFWHM Full-Width at Half-Maximum (Peak)GBP Global Bolus PlotGLM General Linear ModelGMR Gradient Motion Rephasing, flow compensationGRACE Generalized Breast Spectroscopy ExamGRAPPA Generalized Autocalibrating Partially Parallel
AcquisitionGRE Gradient EchoGSP Graphical Slice PositioningHz HertzIPA Integrated Panoramic ArrayiPAT Integrated Parallel Acquisition TechniquesIPP Integrated Panoramic PositioningIR Inversion RecoveryIRM inversion Recovery MagnitudeLP Linear PolarizationMDDW Multi-Directional Diffusion WeightingMIP Maximum Intensity ProjectionMPPS Modality Performed Procedure Step

Abbreviations
MPR Multi-Planar ReconstructionMR Magnetic ResonanceMRA MR AngiographyMRI Magnetic Resonance ImagingMRS MR SpectroscopymSENSE Modified Sensitivity EncodingMTC Magnetization Transfer ContrastmT/m Millitesla per meterMTT Mean Transit TimeMxy Transverse magnetizationMZ Longitudinal magnetizationNMR Nuclear Magnetic ResonancePACE Prospective Acquisition CorrectionPAT Parallel Acquisition TechniquesPBP Percentage of Baseline at PeakPCA Phase-Contrast Angiographyppm Parts per millionRARE Rapid Acquisition with Relaxation EnhancementRF Radio FrequencyRoI Region of InterestSAR Specific Absorption RateSE Spin-EchoSENSE Sensitivity Encoding

Abbreviations
SI Système InternationaleSLINKY Sliding Interleaved kySMASH Simultaneous Acquisition of Spatial HarmonicsSNR Signal-to-Noise RatioSPAIR Spectrally Adiabatic Inversion RecoverySPIDER Steady-State Projection Imaging with Dynamic
Echo-Train ReadoutSR Saturation RecoverySSD Surface Shaded DisplaySVS Single Volume SpectroscopySWI Susceptibility-Weighted ImagingT TeslaTA Acquisition timeTD Delay timeTE Echo timeTEeff Effective echo timeTGSE Turbo Gradient Spin-EchoTI Inversion timeTim Total imaging matrixTimCT Tim Continuous Table moveTIR Turbo Inversion RecoveryTIRM Turbo Inversion Recovery MagnitudeTR Repetition time
Abbreviations
TReff Effective repetition timeTSE Turbo Spin-Echo (TurboSE)TTP Time To PeakUTE Ultrashort TEvenc Velocity encodingVERSE Variable-Rate Selective ExcitationVIBE Volume Interpolated Breathhold ExaminationVIEWS Volume Imaging with Enhanced Water SignalVoI Volume of InterestVRT Volume Rendering Technique

Change requests for the MR Glossary
Please send your suggestions per e-mailto [email protected] orper fax to +49 9131 84 8411.
Suggestions -------------------------------------------------------------------
-------------------------------------------------------------------
-------------------------------------------------------------------
-------------------------------------------------------------------
-------------------------------------------------------------------
-------------------------------------------------------------------
-------------------------------------------------------------------
-------------------------------------------------------------------
-------------------------------------------------------------------
-------------------------------------------------------------------
-------------------------------------------------------------------
-------------------------------------------------------------------
-------------------------------------------------------------------
Sender -------------------------------------------------------------------
-------------------------------------------------------------------
-------------------------------------------------------------------


www.siemens.com/medical
Siemens AGWittelsbacherplatz 2D-80333 MuenchenGermany
Contact: Siemens AG Medical Solutions Henkestr. 127 D-91052 Erlangen Germany Telephone: +49 9131 84-0
© Siemens AG 2008Order numberMR-00000.640.02.01.02Printed in Germany01/2008