mr. pratap kumar pradhan, asst. prof., department of civil
TRANSCRIPT

Mr. Pratap Kumar Pradhan, Asst. Prof., Department of Civil Engineering, VSSUT, Burla, Odisha
LECTURE NOTE
ADVANCED SURVEYING
Prepared By Pratap Kumar Pradhan Assistant Professor
Department of Civil engineering
VEER SURENDRA SAI UNIVERSITY OF TECHNOLOGY, BURLA
ODISHA

Mr. Pratap Kumar Pradhan, Asst. Prof., Department of Civil Engineering, VSSUT, Burla, Odisha
Course objectives:
1. To understand the basics and elements of different types of curves on roads and their
Preliminary survey
2. To learn about surveying applications in setting out of curves, buildings, culverts and tunnels
3. To get introduced to different geodetic methods of survey such as triangulation,
trigonometric levelling
4. To learn about errors in measurements and their adjustments in a traverse
5. To get introduced to modern advanced surveying techniques involved such as remote
sensing, Total station, GPS, Photogrammetry etc.
Course Contents:
Module – I (10 Hours)
Application of Theodolite Surveying – Tachometry, Height & distance, Curve setting problems
(Compound, Reverse & Transition), Traversing & Triangulation survey: Principle, Planning &
Methods. Geodesy
Module – II (10 Hours)
Photogrammetric Surveying – Principle, Scale, Numbe r of Photographs, Deduction of distance
& height, Elements of Astronomical survey, Solution of problems dealing with celestial
triangle.
Module – II (12 Hours)
Principles of Remote Sensing & Geographic Information System, Application to Civil
Engineering.
Module – IV (8 Hours)
Electronic distance measurement, Total Station, Global Positioning System.
Text Book:
(1) Surveying – Vol –II – By B.C. Punmia, A K Jain and A K Jain, Laxmi Publishers
(2) Higher Surveying – Vol –II By B.C. Punmia, A K Jain and A K Jain, Laxmi Publishers
Books for Reference:
(3) Surveying – Vol – I – By S.K.Duggal, Tata McGraw Hill Book Co.
(4) Surveying – Vol – II – By S.K. Duggal, Tata McGraw Hill Book Co.
Mr. Pratap Kumar Pradhan, Asst. Prof., Department of Civil Engineering, VSSUT, Burla, Odisha
Definition of Surveying:
Surveying has to do with the determination of the relative spatial location of points on
or near the surface of the earth.
It is the art of measuring horizontal and vertical distances between objects, of measuring
angles between lines, of determining the direction of lines, and of establishing points
by predetermined angular and linear measurements.
Along with the actual survey measurements are the mathematical calculations.
Distances, angles, directions, locations, elevations, areas, and volumes are thus
determined from the data of the survey.
Survey data is portrayed graphically by the construction of maps, profiles, cross
sections, and diagrams.
The importance of the Surveying:
Land surveying is basically an art and science of mapping and measuring land. The entire scope
of profession is wide; it actually boils down to calculate where the land boundaries are situated.
This is very important as without this service, there would not have been railroads, skyscrapers
could not have been erected and neither any individual could have put fences around their yards
for not intruding others land.
Types of Surveying:
Geodetic Surveying:
The type of surveying that takes into account the true shape of the earth. These surveys are of
high precision and extend over large areas.
Plane Surveying:
The type of surveying in which the mean surface of the earth is considered as a plane, or in
which its spheroidal shape is neglected, with regard to horizontal distances and directions.
Module – I (10 Hours)
Application of Theodolite Surveying – Tacheometry, Height & distance, Curve setting
problems (Compound, Reverse & Transition), Traversing & Triangulation survey:
Principle, Planning & Methods. Geodesy

Mr. Pratap Kumar Pradhan, Asst. Prof., Department of Civil Engineering, VSSUT, Burla, Odisha
Theodolite Survey:
A theodolite is a precision instrument for measuring angles in the horizontal and
vertical planes. Theodolites are used mainly for surveying applications, and have been
adapted for specialized purposes such as meteorology and rocket launch.
The theodolite is a complex instrument used mainly for accurate measurement of horizontal
and vertical angle up to 10" or 20" depending upon the least count of the instrument.
Because of its various uses, the theodolite is sometimes known as "Universal Instrument".
Uses of theodolite: Following are the different purpose for which theodolite can be used-
1) Measuring horizontal angle
2) Measuring vertical angle
3) Measuring deflection angle
4) Measuring magnetic bearing
5) Measuring the horizontal distance between two points
6) Finding vertical height of an object
7) Finding difference of elevation between various points
8) Ranging of a line
Types of Theodolite:
Theodolites may be broadly classified into two types-
1) Transit theodolite
2) Non- transit theodolite
3) Vernier Theodolite
4) Glass arc Theodolite
Transit Theodolite: In the transit theodolite, the telescope can be revolved through a complete
revolution about its horizontal axis in a vertical plane.
Non-transit Theodolite: In the non-transit theodolite, the telescope cannot be revolved
through a complete revolution in the vertical plane.

Mr. Pratap Kumar Pradhan, Asst. Prof., Department of Civil Engineering, VSSUT, Burla, Odisha
Vernier Theodolite: In this type of theodolite, venires are provided for reading horizontal
and vertical graduated circles.
Glass arc Theodolite: In this type of theodolite, micrometres are for reading horizontal and
vertical graduated circles.
Different Parts of Theodolite:
a. Vertical Scale (or Vertical Circle): The vertical circle is a full 360° scale. It is mounted
within one of the standards with its centre co-linear with the trunnion axis. It is used to
measure the angle between the line of sight (collimation axis) of the telescope and the
horizontal. This is known as the vertical angle.
b. Telescope: It has the same features as in a level graticule with eyepiece and internal
focussing for the telescope itself. The same precautions for focussing the eyepiece and
eliminating parallax should be applied.
c. Vertical Clamp and Tangent Screw: In order to hold the telescope at a particular vertical
angle a vertical clamp is provided. This is located on one of the standards and its release
will allow free transiting of the telescope. When clamped, the telescope can be slowly
transited using another fine adjustment screw known as the vertical tangent screw.
d. Upper Plate: The upper plate is the base on which the standards and vertical circle are
placed. Rotation or transiting of the upper plate about a vertical (alidade) axis will also
cause the entire standards/telescope assembly to rotate in an identical manner. For the
Mr. Pratap Kumar Pradhan, Asst. Prof., Department of Civil Engineering, VSSUT, Burla, Odisha
instrument to be in correct adjustment it is therefore necessary that the upper plate must be
perpendicular to the alidade axis and parallel to the trunnion axis. Also, before the
instrument is used, the upper plate must be "levelled". This is achieved by adjustment of
three foot screws and observing a precise tube bubble. This bubble is known as the plate
bubble and is placed on the upper plate.
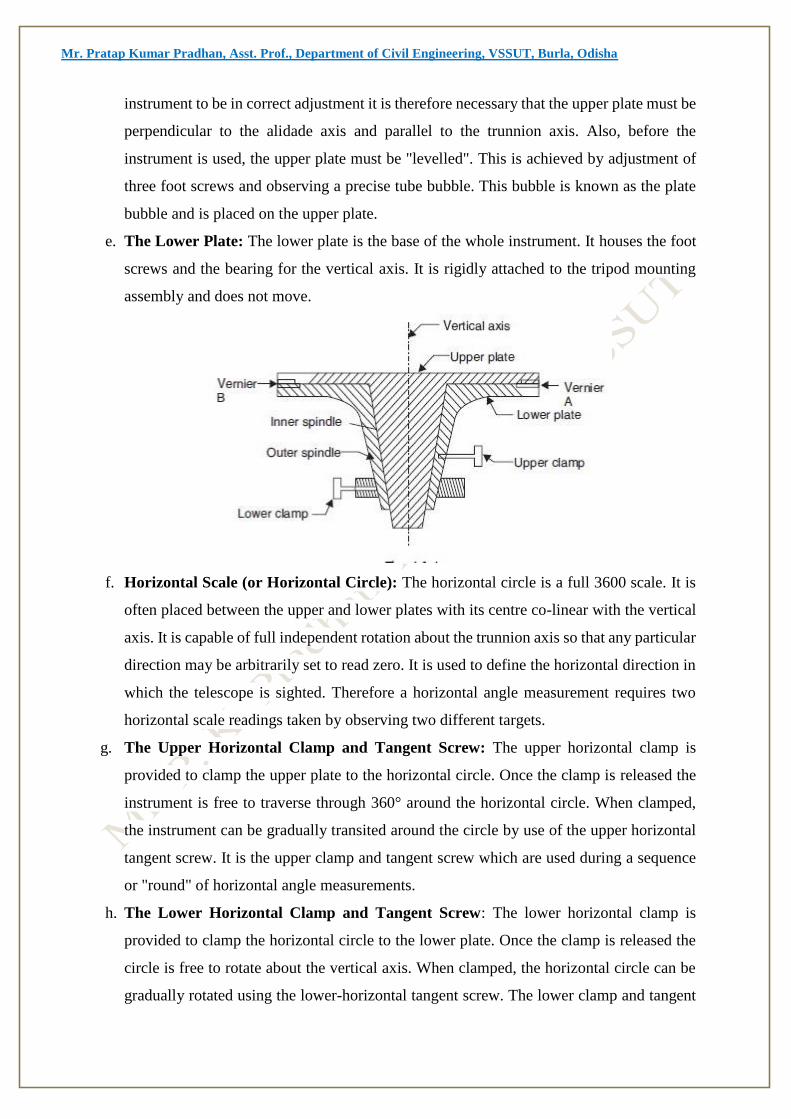
e. The Lower Plate: The lower plate is the base of the whole instrument. It houses the foot
screws and the bearing for the vertical axis. It is rigidly attached to the tripod mounting
assembly and does not move.
f. Horizontal Scale (or Horizontal Circle): The horizontal circle is a full 3600 scale. It is
often placed between the upper and lower plates with its centre co-linear with the vertical
axis. It is capable of full independent rotation about the trunnion axis so that any particular
direction may be arbitrarily set to read zero. It is used to define the horizontal direction in
which the telescope is sighted. Therefore a horizontal angle measurement requires two
horizontal scale readings taken by observing two different targets.
g. The Upper Horizontal Clamp and Tangent Screw: The upper horizontal clamp is
provided to clamp the upper plate to the horizontal circle. Once the clamp is released the
instrument is free to traverse through 360° around the horizontal circle. When clamped,
the instrument can be gradually transited around the circle by use of the upper horizontal
tangent screw. It is the upper clamp and tangent screw which are used during a sequence
or "round" of horizontal angle measurements.
h. The Lower Horizontal Clamp and Tangent Screw: The lower horizontal clamp is
provided to clamp the horizontal circle to the lower plate. Once the clamp is released the
circle is free to rotate about the vertical axis. When clamped, the horizontal circle can be
gradually rotated using the lower-horizontal tangent screw. The lower clamp and tangent

Mr. Pratap Kumar Pradhan, Asst. Prof., Department of Civil Engineering, VSSUT, Burla, Odisha
screw must only be used at the start of a sequence or "round" of horizontal angle
measurements to set the first reading to zero (if so desired).
i. Circle Reading and Optical Micrometer: Modern instruments usually have one eyepiece
for reading both circles. It is usually located on one of the standards. The vertical and
horizontal circles require illumination in order to read them. This is usually provided by
small circular mirrors which can be angled and rotated to reflect maximum light onto the
circles.
j. Index bar or T-frame: The index bar is T shaped and centered on horizontal axis of the
telescope in front of the vertical axis. It carries two vernier of the extremities of its
horizontal arms or limbs called the index arm. The vertical leg called the clip or clipping
screws at its lower extremity. The index arm and the clipping arm are together known as
T-frame.
k. Altitude level: A highly sensitive bubble is used for levelling particularly when taking the
vertical angle observations.
l. Plumb bob: To centre the instrument exactly over a station mark, a plumb bob is suspended from
the hook fitted to the bottom of the central vertical axis.
m. The levelling head: It may consists of circular plates called as upper and lower Parallel
plates. The lower parallel plate has a central aperture through which a plumb bob may be
suspended. The upper parallel plate or tribrach is supported by means of four or three
levelling screws by which the instrument may be levelled.
n. Standards or A-Frame: The frames supporting telescope are in the form of English letter
‘A’. This frame allows telescope to rotate on its trunnion axis in vertical frame. The T-
frame and the clamps are also fixed to this frame.
Important terms related to theodolite survey:
Cantering: The setting of theodolite exactly over a station marked by means of plumb bob is
known as cantering.
Transiting: The method of turning the telescope about its horizontal axis in a vertical plane
through 180' is termed as transiting. In other words, transiting results in a change of face.
Face left: It means that the vertical circle of theodolite is on the left of the observer at the time
of taking reading.
Face right: This refers to the situation when the vertical circle of the instrument is on the right
of the observer when the reading is taken.

Mr. Pratap Kumar Pradhan, Asst. Prof., Department of Civil Engineering, VSSUT, Burla, Odisha
Changing face: The operation of bringing the vertical circle from one side of the observer to
the other is known as changing face.
Swinging the telescope: This indicates turning the telescope in a horizontal plane. It is called
'right swing' when the telescope is turned clockwise and 'left swing' when the telescope is
turned anticlockwise.
Line of collimation: It is an imaginary line passing through the optical center of the objective
glass and its continuation.
Axis of telescope: The axis is an imaginary line passing through the optical center of the object
glass and optical center of eyepiece.
Axis of the bubble tube: It is an imaginary line tangential to longitudinal curve of bubble tube
at its middle point.
Vertical axis: It is the axis of rotation of the telescope in the horizontal plane.
Horizontal axis: It is the axis of rotation of the telescope in the vertical plane.
Temporary adjustment: The setting of the theodolite over a station at the time of taking any
observation is called temporary adjustment.
Permanent adjustment: When the desired relationship between fundamental lines is
disturbed, then some procedures are adopted to establish this relationship. This adjustment is
known as permanent adjustment.
Use of Theodolite:
Theodolite is used for measuring horizontal and vertical angles. For this the theodolite
should be centered on the desired station point, levelled and telescope is focussed. This process
of centering, levelling and focussing is called temporary adjustment of the instrument.
Measurement of Horizontal Angle
The procedure is explained for measuring horizontal angle θ = PQR at station Q

Mr. Pratap Kumar Pradhan, Asst. Prof., Department of Civil Engineering, VSSUT, Burla, Odisha
1. Set the theodolite at Q with vertical circle to the left of the line of sight and complete all
temporary adjustments.
2. Release both upper and lower clamps and turn upper plate to get 0° on the main scale. Then
clamp main screw and using tangent screw get exactly zero reading. At this stage Vernier A
reads 0° and Vernier B reads 180°.
3. Through telescope take line of sight to signal at P and lock the lower clamp. Use tangent
Screw for exact bisection.
4. Release the upper clamp and swing telescope to bisect signal at R. Lock upper clamp and
use tangent screen to get exact bisection of R.
5. Read Vernier’s A and B. The reading of Vernier A gives desired angle PQR directly, while
180° is to be subtracted from the reading of Vernier B to get the angle PQR.
6. Transit (move by 180° in vertical plane) the telescope to make vertical circle to the right of
telescope. Repeat steps 2 to 5 to get two more values for the angle.
7. The average of 4 values found for θ, give the horizontal angle. Two values obtained with
face left and two obtained with face right position of vertical circle are called one set of
readings.
8. If more precision is required the angle may be measured repeatedly. i.e., after step 5, release
lower clamp, sight signal at P, then lock lower clamp, release upper clamp and swing the
telescope to signal at Q. The reading of Vernier A doubles. The angle measured by vernier B
is also doubled. Any number of repetitions may be made and average taken. Similar readings
are then taken with face right also. Finally average angle is found and is taken as desired angle
‘Q’. This is called method of repetition.

Mr. Pratap Kumar Pradhan, Asst. Prof., Department of Civil Engineering, VSSUT, Burla, Odisha
9. There is another method of getting precise horizontal angles. It is called method of
reiteration.
If a number of angles are to be measured from a station this technique is used (see above figure).
With zero reading of vernier A signal at P is sighted exactly and lower clamp and its tangent
screw are locked. Then θ1 is measured by sighting Q and noted. Then θ2, θ3 and θ4 are
measured by unlocking upper clamp and bisecting signals at R, S and P. The angles are
calculated and checked to see that sum is 360º. In each case both verniers are read and similar
process is carried out by changing the face (face left and face right).
Measurement of Vertical Angle
Horizontal sight is taken as zero vertical angle. Angle of elevations are noted as +ve angles and
angle of depression as –ve angles.
To measure vertical angle the following procedure may be followed:
1. Complete all temporary adjustment at the required station.
2. Take up levelling of the instrument with respect to altitude level provided on the A – frame.
This levelling process is similar to that used for levelling dumpy level i.e., first altitude level is
kept parallel to any two levelling screws and operating those two screws bubble is brought to
centre. Then by rotating telescope, level tube is brought at right angles to the original position
and is levelled with the third screw. The procedure is repeated till bubble is centred in both
positions.
3. Then loosen the vertical circle clamp, bisect P and lock the clamp. Read verniers C and D to
get vertical angle. Take the average as the actual vertical angle.
Setting out grades
Finding difference of level.
Prolonging the survey lines

Mr. Pratap Kumar Pradhan, Asst. Prof., Department of Civil Engineering, VSSUT, Burla, Odisha
Axes of Theodolite:
V - Vertical axis
S – Sight axis, collimation axis
H – Horizontal axis (telescope rotary axis)
L – Level axis (the alidade axis)
Theodolite Traversing:
Introduction: A traverse consists of a series of straight lines connecting successive points. The
points defining the ends of the traverse lines are called traverse stations or traverse points.
Distance along the line between successive traverse points is determined either by direct
measurement using a tape or electronic distance measuring (EDM) equipment, or by indirect
measurement using tachometric methods. At each point where the traverse changes direction,
an angular measurement is taken using a theodolite.
Purpose of traverse: It is a convenient, rapid method for establishing horizontal control
particularly when the lines of sights are short due to heavily built up areas where triangulation
and trilateration are not applicable. The purpose includes:
- Property surveys to locate or establish boundaries;
- Supplementary horizontal control for topographic mapping surveys;

Mr. Pratap Kumar Pradhan, Asst. Prof., Department of Civil Engineering, VSSUT, Burla, Odisha
- Location and construction layout surveys for high ways, railway, and other private and public
works;
- Ground control surveys for photogrammetric mapping.
Types of traverse:
Open traverse: It starts at a point of known position and terminates at a point of unknown
position.
Closed traverse: It originates at a point of known position and close on another point of known
horizontal position.
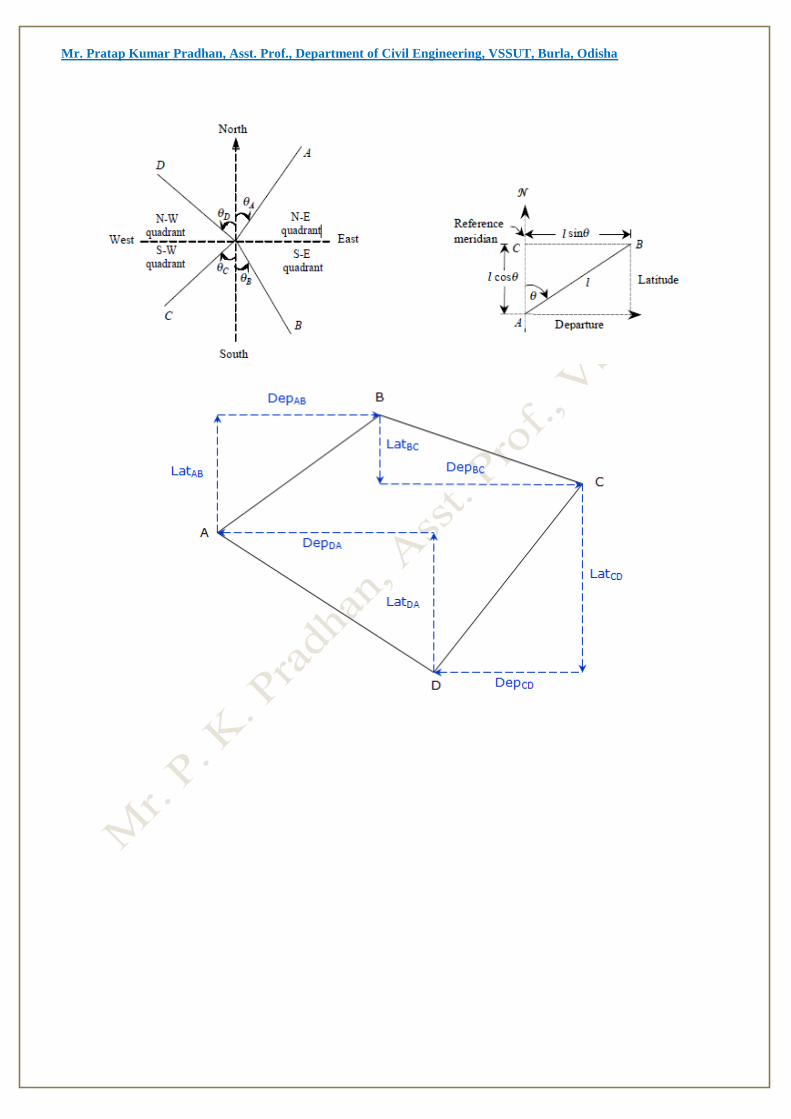
Latitudes and Departures:
Latitude is the north-south component of a line; departure the east-west. North latitudes are
positive, South are negative; similarly East departures are positive, West are negative.
Latitude (Lat) and Departure (Dep) are computed from:
Because a bearing angle never exceeds 90°, the Lat and Dep equations will always return
positive values.
Mr. Pratap Kumar Pradhan, Asst. Prof., Department of Civil Engineering, VSSUT, Burla, Odisha

Mr. Pratap Kumar Pradhan, Asst. Prof., Department of Civil Engineering, VSSUT, Burla, Odisha
Calculation of Closing Error:
In a complete circuit, the sum of North latitudes must be equal to that of South latitudes,
the sum of Easting must be equal to that of Westing, if all the measurements are correct. If not,
the distance between the starting portion and the position obtained by calculation is known as
Closing Error.
Example:-
Let’s assume that the sum of Northing of a traverse exceeds the sum of southing by 1.5m and
that of easting exceeds the sum of westings by 1.8m, then
Resultant Closing error = √ (1.82 +1.52) = 2.34
The closing error is generally expressed as a Fraction i.e,
𝐶𝑙𝑜𝑠𝑖𝑛𝑔 𝐸𝑟𝑟𝑜𝑟
𝑃𝑒𝑟𝑖𝑚𝑒𝑡𝑒𝑟 𝑜𝑓 𝑡ℎ𝑒 𝑇𝑟𝑎𝑣𝑒𝑟𝑠𝑒
Let Perimeter of the Traverse = 1000m
Closing Error = 2.34
1000 =
1
𝑛 or 1 in n
Where n = 1000/2.34
Balancing the Consecutive Co-Ordinates:
The process od adjusting the consecutive coordinates of each line by applying corrections to
them in such a way that algebraic sum of latitudes and departures of closed circuit should be
equal to zero i.e., sum of northing should be equal to the sum of southing and the sum of
westing should exactly equal to the sum of easting is called the Balancing the Consecutive
Co-Ordinates.
In a closed traverse the following conditions must be satisfied:
Departure = D = 0
Latitude = L = 0
If the above conditions are not satisfied, the position A of the originating stations and its
computed position A′ will not be the same as shown in Fig. given below, due to the
observational errors.
The distance AA′ between them is known as the closing error. The closing error is given by
e (D) 2 (L)2

Mr. Pratap Kumar Pradhan, Asst. Prof., Department of Civil Engineering, VSSUT, Burla, Odisha
and its direction or reduced bearing is given by
tanθ = 𝐷 𝐿
The term balancing is generally applied to the operation of adjusting the closing error in a
closed traverse by applying corrections to departures and latitudes.
The following methods are generally used for balancing a traverse:
Bowditch’s method :
CD = D × l 𝑙
CL = L × l 𝑙
Where:
CD & CL = the corrections to the departure and latitude of the line to which the correction
is applied l = the length of the line, and
𝑙 = the sum of the lengths of all the lines of the traverse, i.e., perimeter p.
L = Total error in latitude
D = Total error in departure
Transit rule:
According to this rule, corrections to the latitude of a traverse leg
= Total error in latitude ×Latitude of that traverse leg
Total sum of latitude
CD = D × 𝑑
D
CL = L × l𝐿

Mr. Pratap Kumar Pradhan, Asst. Prof., Department of Civil Engineering, VSSUT, Burla, Odisha
Where,
CD & CL = the corrections to the departure and latitude of the line to which the correction
is applied
l = Latitude of traverse leg
d = Departure of traverse leg
L = arithmetic sum of latitudes
D = arithmetic sum of departures
L = Total error of latitudes (algebraic sum)
D = Total error of departures (algebraic sum)
Balancing the Closing Error graphically:
For rough surveys or traverse of small area, adjustment can also be carried out graphically. In
this method of balancing, the locations and thus the coordinates of the stations are adjusted
directly. Thus, the amount of correction at any station is proportional to its distance from the
initial station.
Let Po Qo Ro So To P' is the graphical plot of a closed-loop traverse PQRSTP. The observed
length and direction of traverse sides are such that it fails to get balanced and is depicted in
its graphical presentation by an amount Po P'.
Thus, the closing error of the traverse is Po P' (Given in Figure below). The error Po P' is to
be distributed to all the sides of the traverse in such a way that the traverse gets closed i.e.,
P' gets coincides with Po in its plot.
This is carried out by shifting the positions of the station graphically. In order to obtain the
length and direction of shifting of the plotted position of stations, first a straight line is
required to be drawn, at some scale, representing the perimeter of the plotted traverse.
In this case, a horizontal line Po P' is drawn (Given in Figure below). Mark the traverse
stations on this line such as Qo, Ro, So and To in such a way that distance between them
represent the length of the traverse sides at the chosen scale.
At the terminating end of the line i.e., at P', a line P' P a is drawn parallel to the correction
for closure and length equal to the amount of error as depicted in the plot of traverse. Now,
join Po to Pa and draw lines parallel to P' Pa at points Qo, Ro, So and To.
The length and direction of Qo Qa, Ro Ra, So Sa and To Ta represent the length and
direction of errors at Qo, Ro, So and To respectively. So, shifting equal to Qo Qa , Ro Ra,
So Sa and To Ta and in the same direction are applied as correction to the positions of

Mr. Pratap Kumar Pradhan, Asst. Prof., Department of Civil Engineering, VSSUT, Burla, Odisha
stations Qo, Ro, So and To respectively. These shifting provide the corrected positions of
the stations as to Qa, Ra, Sa,Ta and Pa. Joining these corrected positions of the stations
provide the adjusted traverse Pa Qa Ra, Sa Ta(Given in Figure below).
Omitted observations:
In a closed traverse if lengths and bearings of all the lines could not be measured due
to certain reasons, the omitted or the missing measurements can be computed provided the
number of such omissions is not more than two. In such cases, there can be no check on the
accuracy of the field work nor can the traverse be balanced. It is because of the fact that all the
errors are thrown into the computed values of the omitted observations.
The omitted quantities are computed using the equations given below:
D = l1 sin 𝜃1 +l2 sin 𝜃2 + ....... + ln sin 𝜃𝑛 = 0
L = l1 cos 𝜃1 +l2 cos 𝜃2 + ....... + ln cos 𝜃𝑛 = 0
So, length of the traverse lines l = √ (D2 L2)
and Departure of the line D = l sin 𝜃1
Latitude of the line L = l cos 𝜃1
Mr. Pratap Kumar Pradhan, Asst. Prof., Department of Civil Engineering, VSSUT, Burla, Odisha
Tacheometric Surveying:
Tacheometric is a branch of surveying in which horizontal and vertical distances are
determined by taking angular observation with an instrument known as a tachometer.
Tacheometric surveying is adopted in rough in rough and difficult terrain where direct levelling
and chaining are either not possible or very tedious.
Tacheometric survey also can be used for Railways, Roadways, and reservoirs etc.
Tacheometric surveying is very rapid, and a reasonable contour map can be prepared for
investigation works within a short time on the basis of such survey.
An ordinary transits theodolite fitted with a stadia diaphragm is generally used for tacheometric
surveying.
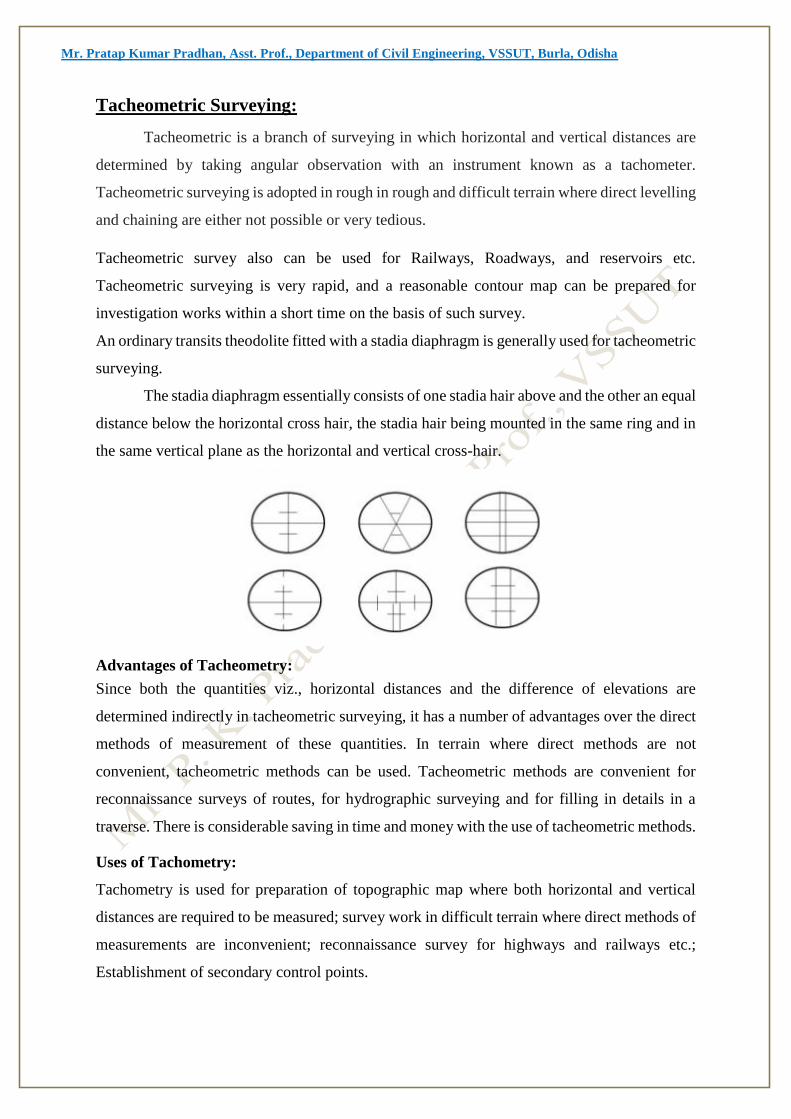
The stadia diaphragm essentially consists of one stadia hair above and the other an equal
distance below the horizontal cross hair, the stadia hair being mounted in the same ring and in
the same vertical plane as the horizontal and vertical cross-hair.
Advantages of Tacheometry:
Since both the quantities viz., horizontal distances and the difference of elevations are
determined indirectly in tacheometric surveying, it has a number of advantages over the direct
methods of measurement of these quantities. In terrain where direct methods are not
convenient, tacheometric methods can be used. Tacheometric methods are convenient for
reconnaissance surveys of routes, for hydrographic surveying and for filling in details in a
traverse. There is considerable saving in time and money with the use of tacheometric methods.
Uses of Tachometry:
Tachometry is used for preparation of topographic map where both horizontal and vertical
distances are required to be measured; survey work in difficult terrain where direct methods of
measurements are inconvenient; reconnaissance survey for highways and railways etc.;
Establishment of secondary control points.

Mr. Pratap Kumar Pradhan, Asst. Prof., Department of Civil Engineering, VSSUT, Burla, Odisha
Difference between Levelling and Stadia Staff Rod:
For short sights of about 100 m or less, an ordinary levelling staff may be used. For
long sights, special staff called stadia rod is generally used. The graduations are in bold type
(face about 50 mm to 150 mm wide and 15 mm to 60 mm thick) and the stadia rod is 3 m to 5
m long. To keep the staff or stadia rod vertical, a small circular spirit level is fitted on its
backside. It is hinged to fold up.
Anallactic Lens:
The basic formula for determination of horizontal distance in stadia tacheometry is
D = 𝐟𝒔
𝒊+ (f +c)
D = Ks + C (Proved after this section)
Due to the presence of the additive constant C, D is not directly proportional to s. This is
accomplished by the introduction of an additional convex lens in the telescope, called an
anallactic lens, placed between the eyepiece and object glass, and at a fixed distance from the
latter. The anallactic lens is provided in external focusing telescope. Its use simplifies the
reduction of observations since the additive constant (f + c) is made zero and the multiplying
constant k is made 100.
Different systems of Tacheometric Measurement The various systems of tacheometric survey may be classified as follows,
The Stadia Method
Fixed Hair Method and
Movable Hair Method
The Tangential System
Subtense Bar System
Stadia systems:
In this systems staff intercepts, at a pair of stadia hairs present at diaphragm, are
considered. This is the more extensively used system of tacheometry particularly for detailed
work, such as those required in engineering surveys. In this system, a tacheometer is first set
up at a station, say P, and a staff is held at station Q, as shown in Figure given below. The
difference of upper hair reading and lower hair reading is called staff intercept s. All the three
hairs including central cross hair are read, and s is determined. Vertical angle, θ, corresponding

Mr. Pratap Kumar Pradhan, Asst. Prof., Department of Civil Engineering, VSSUT, Burla, Odisha
to the central hair is also measured. These measurements enable determination of horizontal
distance between P and Q and their difference in elevation.
The stadia system consists of two methods:
Fixed-hair method and
Movable-hair method
Fixed-hair method:
In this method, stadia hairs are kept at fixed interval and the staff interval or intercept
(corresponding to the stadia hairs) on the levelling staff varies. Staff intercept depends upon

Mr. Pratap Kumar Pradhan, Asst. Prof., Department of Civil Engineering, VSSUT, Burla, Odisha
the distance between the instrument station and the staff. In this method, the distance between
the upper hair and lower hair, i.e. stadia interval i, on the diaphragm of the lens system is fixed.
The staff intercept s, therefore, changes according to the distance D and vertical angle θ.
Movable- hair method:
In this method, the staff interval is kept constant by changing the distance between the
stadia hairs. Targets on the staff are fixed at a known interval and the stadia hairs are adjusted
to bisect the upper target at the upper hair and the lower target at the lower hair. Instruments
used in this method are required to have provision for the measurement of the variable interval
between the stadia hairs. As it is inconvenient to measure the stadia interval accurately, the
movable hair method is rarely used.
Tangential method:
In this method, readings at two different points on a staff are taken against the horizontal
cross hair and corresponding vertical angles are noted. In this system, observations are not
taken on stadia hairs. Instead vertical angles θ1 and θ2 to the two targets fixed on a staff are
recorded shown in the Figure given below. The targets are at a fixed distance s. Vertical angles
θ1, θ2 and staff intercept s enable horizontal distance D and the difference of elevations to be
determined.

Mr. Pratap Kumar Pradhan, Asst. Prof., Department of Civil Engineering, VSSUT, Burla, Odisha
Subtense Bar System:
Subtense bar is a bar of fixed length generally 2 m fitted with two targets at the ends. The
targets are at equal distance apart from the centre. The subtense bar can be fixed on a tripod
stand and is kept horizontal. As shown in Figure given below, angle α subtended by the two
targets at station P is measured by a theodolite. The distance s between the targets and the angle
α enable the distance D between station P and Q to be determined.
Principle of Stadia Method:
The derive distance and elevation formulae for fixed hair method assuming line of sight
as horizontal and considering an external focusing type telescope. In the figure, O is the optical
centre of the object glass. The three stadia hairs are a, b and c and the corresponding readings
on staff are A, B and C. Length of image of AB is ab. The other terms used in this figure are
f = focal length of the object glass,
i = stadia hair interval = ab,
s = staff intercept = AB,
c = distance from O to the vertical axis of the instrument,
d = distance from O to the staff,
d′′ = distance from O to the plane of the diaphragm, and
D = horizontal distance from the vertical axis to the staff.

Mr. Pratap Kumar Pradhan, Asst. Prof., Department of Civil Engineering, VSSUT, Burla, Odisha
From similar Δ, AOB and aOb, we get
𝒅
𝒅′ =
𝒔
𝒊
And from lens formula, 𝟏
𝒇 =
𝟏
𝒅′ +𝟏
𝒅
By combining the two equations, we get
d = 𝐟𝒔
𝒊+ f
Adding c to both the sides, D = 𝐟𝒔
𝒊+ (f +c)
D = Ks + C
Where the constant K is equal to (f /i). It is called Multiplying Constant of the tacheometer
and is generally kept as 100. The constant C is equal to (f + c). It is called Additive Constant
Tangential Method:
The method of tangential tacheometry can be used when staff is held much away from
the instrument making it difficult to read it. This method is useful when the diaphragm does
not have stadia hairs. The staff used in this method is similar to the one employed in movable
hair method. The distance between the target vanes may be 2 m or 3 m. Vertical angles θ1 and
θ2 to the top and bottom targets are measured from the instrument station. The horizontal
distance D and the vertical intercept V are computed from the values of s, θ1 and θ2. Depending

Mr. Pratap Kumar Pradhan, Asst. Prof., Department of Civil Engineering, VSSUT, Burla, Odisha
upon the angles (i.e., angles of elevation or depression), there can be three case. These are
described below.
CASE-I: Both the Angles are of Elevation
When the ground does not permit a horizontal sight, two vertical angles θ1 and θ2 are
measured as shown in Figure.
Now AF = D tan θ1
and BF = D tan θ2
S = AF – BF = D (tan θ1
– tan θ
2 )
D = 𝑆
tan θ1
–
tan θ
2
and V = D × tan θ2
Knowing HI, i.e., the height of the axis of the instrument above datum, the elevation of Q is
given as,
RL of Q = HI + FB − QB
= HI + D. tan θ2
– QB

Mr. Pratap Kumar Pradhan, Asst. Prof., Department of Civil Engineering, VSSUT, Burla, Odisha
CASE-II: Both the Angles are of Depression
From Figure
S = BF – AF
D = 𝑆
tan θ2
–
tan θ
1
and V = D × tan θ1
RL of Q = HI – D tan θ1 – s − QB
CASE-III: One Angle of Elevation and Another Angle of Depression:
Now AF = D tan θ1
and BF = D tan θ2
S = AF +BF = D (tan θ1 +
tan θ2
)
D = 𝑆
tan θ1
+
tan θ
2
and V = D × tan θ2
RL of Q = HI – D. tan θ2
− QB

Mr. Pratap Kumar Pradhan, Asst. Prof., Department of Civil Engineering, VSSUT, Burla, Odisha
CURVES:
The centre line of a road consists of series of straight lines interconnected by curves that are
used to change the alignment, direction, or slope of the road. Those curves that change the
alignment or direction are known as horizontal curves, and those that change the slope are
vertical curves. When a highway changes horizontal direction, making the point where it
changes direction a point of intersection between two straight lines is not feasible. The change
in direction would be too abrupt for the safety of modem, high-speed vehicles. It is therefore
necessary to interpose a curve between the straight lines. The straight lines of a road are called
tangents because the lines are tangent to the curves used to change direction.
Horizontal curves are further classified as circular curves and transition curves.
A curve may be simple, compound, reverse, or spiral (figure 3-l). Compound and reverse
curves are treated as a combination of two or more simple curves, whereas the spiral curve is
based on a varying radius.
Simple circular curve: The simple curve is an arc of a circle. It is the most commonly
used. The radius of the circle determines the “sharpness” of the curve. The larger the
radius, the “flatter” the curve.
Compound Curve: Surveyors often have to use a compound curve because of the terrain.
This curve normally consists of two simple curves curving in the same direction and
joined together.

Mr. Pratap Kumar Pradhan, Asst. Prof., Department of Civil Engineering, VSSUT, Burla, Odisha
Reverse Curve: A reverse curve consists of two simple curves joined together but curving in
opposite directions. For safety reasons, the surveyor should not use this curve unless absolutely
necessary.
Spiral Curve: The spiral is a curve with varying radius used on railroads and some modern
highways. It provides a transition from the tangent to a simple curve or between simple curves
in a compound curve.
Elements of a simple curve:

Mr. Pratap Kumar Pradhan, Asst. Prof., Department of Civil Engineering, VSSUT, Burla, Odisha
From above Figure:
T₁ = P.C.= Point of tangency=Point of curve.
T₂ = P.T.= Second point of tangency.
V or I = P.I. = Point of intersection.
Δ = Deflection angle.
Ø = Intersection angle.
R = Radius of curve.
CD= Mid ordinate (M)
Radius: The radius of the circle of which the curve is an arc, or segment. The radius is always
perpendicular to back and forward tangents.
Point of intersection: The point of intersection is the theoretical location where the two
tangents meet.
Point of tangency (PT): The point of tangency is the point on the forward tangent where the
curve ends.
Intersecting Angle (I): The intersecting angle is the deflection angle at the PI. The surveyor
either computes its value from the preliminary traverse station angles or measures it in the field.
Point of Curvature (PC): The point of curvature is the point where the circular curve begins.
The back tangent is tangent to the curve at this point.
Length of Curve (L): The length of curve is the distance from the PC to the PT measured
along the curve.
Long Chord (LC): The long chord is the chord from the PC to the PT.
Tangent Distance (T): The tangent distance is the distance along the tangents from the PI to
the PC or PT. These distances are equal on a simple curve.
Central Angle (∆): The central angle is the angle formed by two radii drawn from the center
of the circle (0) to midpoint of the curve to the the PC and PT. The central angle is equal in
value to the I angle.
Middle ordinate (M): The middle ordinate is the distance from the midpoint of the curve to
the midpoint of the long chord. The extension of the middle ordinate bisects the central angle.

Mr. Pratap Kumar Pradhan, Asst. Prof., Department of Civil Engineering, VSSUT, Burla, Odisha
Degree of Curve (D): In Great Britain the sharpness of the curve is designated by the radius
of the curve while in India and many countries it is designated by the degree of curvature. There
are two different definitions of degree of curvature:
(i) Arc Definition [Figure (a)]
(ii) Chord Definition. [Figure (b)]
According to arc definition degree of curvature is defined as angle in degrees subtended by an
arc of standard length shown in the figure below. This definition is generally used in highway
practice. The length of standard arc is taken as 30 m. Some people take it as 20 m also.
According to chord definition degree of curvature is defined as angle in degrees
subtended by a chord of standard length shown in the figure below. This definition is
commonly used in railways.
Important Elements of Curve:
A. Length of Curve (l):
The length of the curve (L) = 2𝛑𝐑∆
360
B. Tangent Length (T):
Tangent Length = R tan (∆/𝟐)
C. Length of Long Cord (L):
Length of Long Chord = 2 R sin (∆/𝟐)
D. Mid-ordinate (M): =
The Mid Ordinate = R [1-cos (∆/𝟐)]
E. Apex Distance / External Distance:
The external distance = R [Sec (∆/𝟐) - 1]

Mr. Pratap Kumar Pradhan, Asst. Prof., Department of Civil Engineering, VSSUT, Burla, Odisha
Setting Out of a Simple Circular Curve:
After aligning the road/railway along AA’, when curve is to be inserted, alignment of B’B is
laid on the field by carefully going through the alignment map and field notes given in the
figure below.
By ranging from AA’ and BB’, the vertex point V is determined. Setting a theodolite at V, the
deflection angle is measured carefully. The tangent distance T1 is calculated. Subtracting this
value from chainage of V, chainage of point of curve T1 is found. Adding length of curve to
this chainage of T2 can be easily found. Now pegs are to be fixed along the required curve at
suitable intervals. It is impossible to measure along the curve. Hence, for fixing curve, chord
lengths are taken as curved length. Chord length for peg interval is kept 1/10 th to 1/20 th of
radius of curve. When it is 1/10th of R, the error is 1 in 2500 and if it is 1/20th R, the error is 1
in 10,000. In practice the radius of the curve varies from 200 m to 1000 m. Hence, the chord
length of 20 m is reasonably sufficient. For greater accuracy it may be taken as 10 m. In
practice, pegs are fixed at full chain distances. For example, if 20 m chain is used, chainage of
T1 is 521.4 m and that of T2 is 695.8 m, the pegs are fixed at chainages 540, 560, 580 …, 660,
680 m. Thus, the chord length of first chord is 1.4 m while that of last one is 15.8 m. All
intermediate chords are of 20 m. The first and last peg stations are known as sub-chord station
while the others are full chord stations.
The various methods used for setting curves may be broadly classified as:
(i) Linear methods
(ii) Angular methods.

Mr. Pratap Kumar Pradhan, Asst. Prof., Department of Civil Engineering, VSSUT, Burla, Odisha
Elements of a Compound Curve:
T1tT2 is the compound curve consisting of two arcs of radii R1 and R2 and t1t2 is the common
tangent making deflection angle ∆1 and ∆2 at t1 and t2.
So, ∆ = ∆1 +∆2
Deflection angle ∠ I t1 t2 = ∆1
Deflection angle ∠ I t2 t1 = ∆2
Radius of arc T1t = R1
Radius of arc T2t = R2
Tangent lengths = T1I and T2I
From ∆ I t1 t2 ,
It1
𝑆𝑖𝑛∆2 =
It2
𝑆𝑖𝑛∆1=
t1t2
𝑆𝑖𝑛[180 − (∆1 + ∆2)]
From, above equation we can calculate the term I t1 , I t2 , IT1 and IT2
t1 t2 = R1 tan (∆1/2) + R2 tan (∆2/2)

Mr. Pratap Kumar Pradhan, Asst. Prof., Department of Civil Engineering, VSSUT, Burla, Odisha
Elements of a Reverse Curve:
Let
∆: the angle of deflection
R1: the radius of first circular arc
R2 : the radius of second circular arc.
T1, T2 : the tangent points
C: the point of reverse curvature
E: Point of reverse Curvature
Join T1 andT2 & draw perpendiculars from O1 to O2 as O1F and O2G on it. Again draw O1H
parallel to T1T2 cut the line O2G produced in H.
From ∆ BDI, ∆1 = ∆ +∆2………………………. (1)
From ∆ T1IT2, δ1= ∆ + δ 2 ………………………. (2)
∆ = δ1 – δ2
T1T2 = T1F+FG+GT2
Sin δ1= 𝑇1F
𝑅1
T1F= 𝑅1* Sin δ1 & GT2= 𝑅2* Sin δ2
As O1H is Parallel to FG, FG = O1H

Mr. Pratap Kumar Pradhan, Asst. Prof., Department of Civil Engineering, VSSUT, Burla, Odisha
In ∆ O1HO2 = Sin (∆1 - δ1) = FG
𝑅1+𝑅2
So, T1T2 = 𝑹𝟏* Sin δ1 + 𝑹𝟐* Sin δ2 + [(R1+R2)Sin (∆2- δ2)]
Setting of Compound Curve between Successive Tangents:
Lay out a distance AC from the PI along the back tangent, and set PI1 (as shown in
figure given below).
Continue along the back tangent from PI2 a distance T1, and set PC1.
Sight along the forward tangent with the instrument still at the PI.
Lay out a distance BC from the PI along the forward tangent, and set PI2.
Continue along the forward tangent from PI a distance T2, and set PT2.
Check the location of PI1 and PI2 by either measuring the distance between the two PIs
and comparing the measured distance to the computed length of line AB, or by placing
the instrument at PI1, sighting the PI, and laying off I1. The resulting line-of-sight
should intercept PI2.
Mr. Pratap Kumar Pradhan, Asst. Prof., Department of Civil Engineering, VSSUT, Burla, Odisha
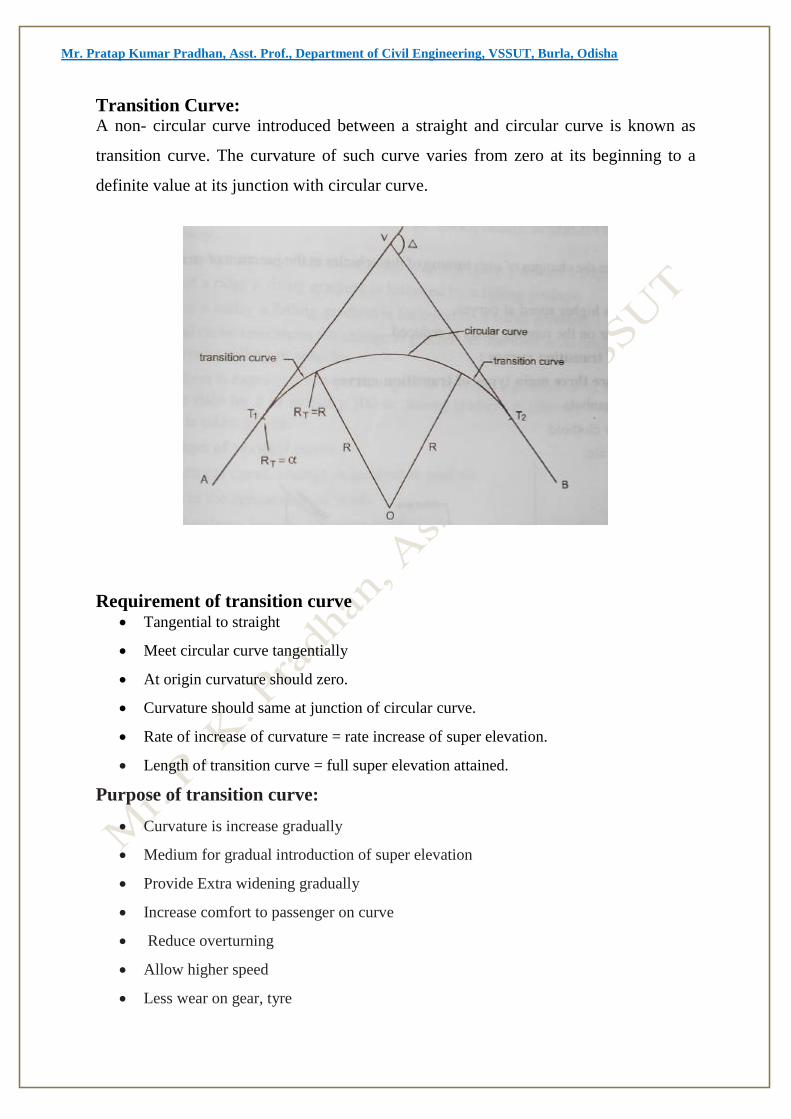
Transition Curve: A non- circular curve introduced between a straight and circular curve is known as
transition curve. The curvature of such curve varies from zero at its beginning to a
definite value at its junction with circular curve.
Requirement of transition curve Tangential to straight
Meet circular curve tangentially
At origin curvature should zero.
Curvature should same at junction of circular curve.
Rate of increase of curvature = rate increase of super elevation.
Length of transition curve = full super elevation attained.
Purpose of transition curve:
Curvature is increase gradually
Medium for gradual introduction of super elevation
Provide Extra widening gradually
Increase comfort to passenger on curve
Reduce overturning
Allow higher speed
Less wear on gear, tyre

Mr. Pratap Kumar Pradhan, Asst. Prof., Department of Civil Engineering, VSSUT, Burla, Odisha
Types of transition curve:
a. Cubic parabola
For railway
b. Spiral or Clothoid
Ideal transition
c. Lemniscates
Used for road
Elements of Transition Curve:
When a transition curve introduced between a straight and circular curve, it have to be
shift inwards by distance “S” from first tangent.
‘D’ is the end point of the transition curve, here it joins with the circular curve. DB is the
extended portion of the circular curve.
Arc BD ≈ CD = RΦs = R×𝐿
2𝑅=
𝐿
2
Shift S bisects the transition curve at C point.
S = AB = EA-EB= y – (R-OE)
= y – (R- Cos Φs)
= y – [2R Sin2 (Φs
2)]

Mr. Pratap Kumar Pradhan, Asst. Prof., Department of Civil Engineering, VSSUT, Burla, Odisha
= y - R(Φs)(Φs)
2
As Φs = L/2R and y= L∗L
6𝑅
So, S = Shift = L2/24R
Triangulation Surveys:
Triangulation is one of the methods of fixing accurate controls. It is based on the
trigonometric proposition that if one side and two angles of a triangle are known, the remaining
sides can be computed. A triangulation system consists of a series of joined or overlapping
triangles in which an occasional side called as base line, is measured and remaining sides are
calculated from the angles measured at the vertices of the triangles, vertices being the control
points are called as triangulation stations.
Applications of Triangulation surveys:
To establish accurate control for plane and geodetic surveys covering large areas,
To establish accurate control for photogrammetric surveys for large areas,
To assist in the determination of the size and shape of the earth,
To determine accurate locations for setting out of civil engineering works such as piers
and abutments of long span bridges, fixing centre line, terminal points and shafts for
long tunnels, measurement of the deformation of dams, etc.
Classification of Triangulation:
The basis of the classification of triangulation figures is the accuracy with which the length and
azimuth of a line of the triangulation are determined. Triangulation systems of different
accuracies depend on the extent and the purpose of the survey. The accepted grades of
triangulation are:
I. First order or Primary Triangulation
II. Second order or Secondary Triangulation
III. Third order or Tertiary Triangulation

Mr. Pratap Kumar Pradhan, Asst. Prof., Department of Civil Engineering, VSSUT, Burla, Odisha
I. First order or Primary Triangulation:
The first order triangulation is of the highest order and is employed either to determine the
earth’s figure or to furnish the most precise control points to which secondary triangulation
may be connected.
The following are the general specifications of the primary triangulation:
Average triangle closure: Less than 1 second
Maximum triangle closure: Not more than 3 seconds
Length of base line: 5 to 15 kilometres
Length of the sides of triangles: 30 to 150 kilometres
II. Second order or Secondary Triangulation:
The secondary triangulation consists of a number of points fixed within the framework of
primary triangulation. The stations are fixed at close intervals so that the sizes triangles formed
are smaller than the primary triangulation.
The general specifications of the secondary triangulation are:
Average triangle closure: 3 sec
Maximum triangle closure: 8 sec
Length of base line: 1.5 to 5 km
Length of sides of triangles: 8 to 65 km
III. Third order or Tertiary Triangulation:
The third-order triangulation consists of a number of points fixed within the framework of
secondary triangulation, and forms the immediate control for detailed engineering and other
surveys. The sizes of the triangles are small and instrument with Moderate precision may be
used.
The general specifications of the secondary triangulation are:
Average triangle closure: 6 sec
Maximum triangle closure: 12 sec
Length of base line: 0.5 to 3 km
Length of sides of triangles: 1.5 to 10 km
Triangulation System:
Four types of systems that have been used are:
I. Chain of single triangles:

Mr. Pratap Kumar Pradhan, Asst. Prof., Department of Civil Engineering, VSSUT, Burla, Odisha
This type of triangulation system doesn't provide the most accurate result.
This type of triangulation system is preferable for long and narrow surveys of low
precision.
There is only one route to compute the unknown side of a triangle. The means of checking
in this system is very limited. That is one for sum of interior angles to 180o & calculation
for the check of base line from trigonometry.
II. Quadrilaterals:
The sides can be computed with different routes as well as different angles & triangles offering
excellent checks for on the computation.
III. Polygons:
When areas are very wide in proportional to their lengths are to be surveyed, polygonal are
used which is very economical.
Triangulation station:
The area to be covered by triangulation scheme must be carefully studied to select the most
suitable positions for the control stations. Existing maps, especially if contoured can be of great
value since the size and shape of triangles formed by the stations can be difficult to visualize
in the field.
The following consideration must be taken in to account for the choice of stations.
1. Every station must be visible from the adjacent stations.

Mr. Pratap Kumar Pradhan, Asst. Prof., Department of Civil Engineering, VSSUT, Burla, Odisha
2. The triangles formed thereby should be well conditioned, that is to say, as nearly equilateral
as possible. No angles should be less than 30°, if possible.
3. The size of the triangles will depend on the configuration of the land, but they should be as
large as possible.
4. The end purpose of the triangulation scheme must be kept in mind. Where choice of station
sites exists, the once most suitable for correction to subsequent traverse and detail survey
should be used.
1. Derive an expression for the horizontal distance of a vertical staff from a tacheometer if the
line of sight of the telescope is horizontal.
2. What are the constants of a tacheometer and how are they determined?
3. Derive expressions for the horizontal distance D and the vertical intercept V when the staff
is (a) vertical, and (b) normal.
4. Differentiate between the fixed-hair method and the movable-hair method. Discuss the
advantages and disadvantages of each method.
5. What is tangential method of tacheometry? What are its advantages and disadvantages over
the stadia method?
6. Discuss the subtense bar method of tacheometric surveying. What are its advantages?
7. The following readings were taken with a tacheometer on to a vertical staff.
Horizontal Distance Stadia Readings
46.20 m 0.780; 1.010; 1.240
51.20 m 1.860; 2.165; 2.470
Calculate the tacheometric constants.
8. Stadia readings were taken with a theodolite on a vertical staff with the telescope inclined
at an angle of depression of 3o
30′. The staff readings were 2.990, 2.055 and 1.120. The
reduced level of the staff station is 100.000m, and the height of the instrument is 1.40 m.
What is the reduced level of the ground at the instrument? Take constants as 100 and
zero.
Question Bank of Theodolite Survey, Tacheometry Survey and Curve
Mr. Pratap Kumar Pradhan, Asst. Prof., Department of Civil Engineering, VSSUT, Burla, Odisha
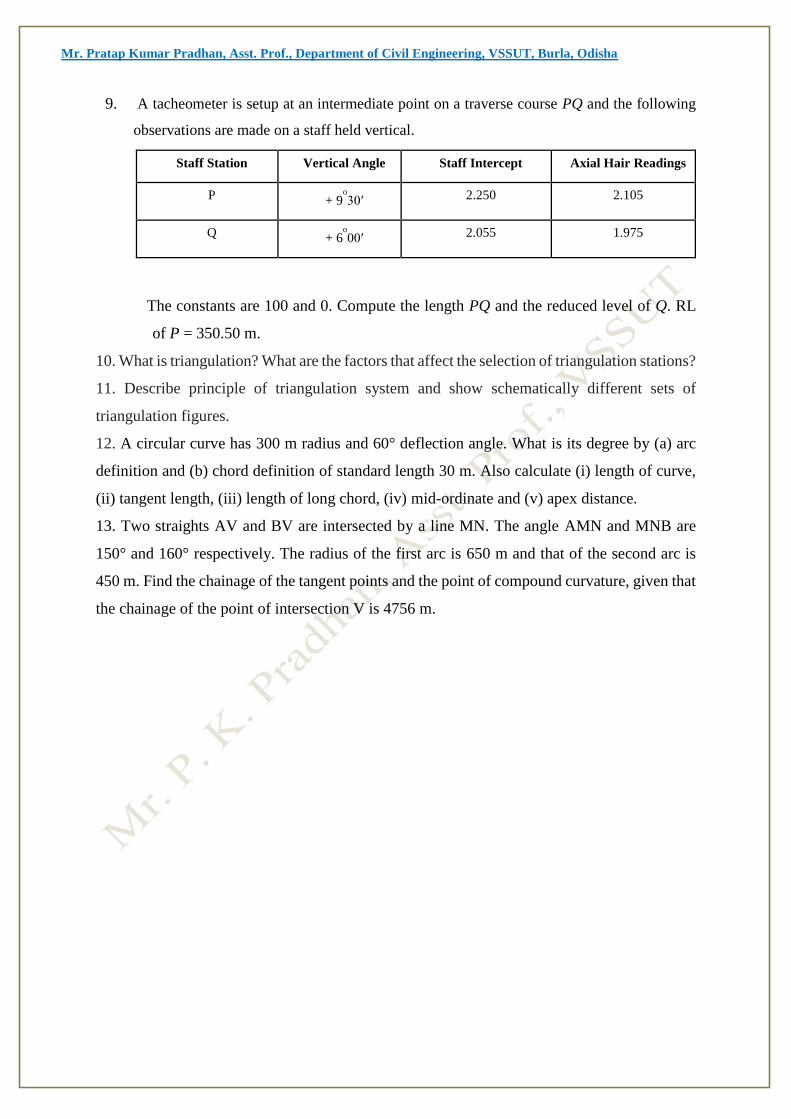
9. A tacheometer is setup at an intermediate point on a traverse course PQ and the following
observations are made on a staff held vertical.
The constants are 100 and 0. Compute the length PQ and the reduced level of Q. RL
of P = 350.50 m.
10. What is triangulation? What are the factors that affect the selection of triangulation stations?
11. Describe principle of triangulation system and show schematically different sets of
triangulation figures.
12. A circular curve has 300 m radius and 60° deflection angle. What is its degree by (a) arc
definition and (b) chord definition of standard length 30 m. Also calculate (i) length of curve,
(ii) tangent length, (iii) length of long chord, (iv) mid-ordinate and (v) apex distance.
13. Two straights AV and BV are intersected by a line MN. The angle AMN and MNB are
150° and 160° respectively. The radius of the first arc is 650 m and that of the second arc is
450 m. Find the chainage of the tangent points and the point of compound curvature, given that
the chainage of the point of intersection V is 4756 m.
Staff Station Vertical Angle Staff Intercept Axial Hair Readings
P + 9o
30′ 2.250 2.105
Q + 6o
00′ 2.055 1.975

Mr. Pratap Kumar Pradhan, Asst. Prof., Department of Civil Engineering, VSSUT, Burla, Odisha
Introduction:
The photogrammetry has been derived from three Greek words:
Photos: means light
Gramma: means something drawn or written
Metron: means to measure
Photo = "Picture“, Grammetry = "Measurement“,
therefore Photogrammetry = “Photo-Measurement”
Objects are measured WITHOUT TOUCHING.
It is a REMOTESENSING technique.
It is a close range method of measuring objects.
It is a 3-dimensional coordinate measuring technique that uses PHOTORAPHS as the
fundamental medium for measurement.
Photogrammetric Surveying:
It is the branch of surveying in which maps are prepared from photographs taken from
ground or air stations. Photographs are also being used for interpretation of geology,
classification of soils, crops, etc.
The art, science, and technology of obtaining reliable information about physical
objects and the environment through process of recording, measuring, and interpreting
photographic images and patterns of recorded radiant electromagnetic energy and
phenomenon.
Originally photogrammetry was considered as the science of analysing only
photographs.
Module – II (10 Hours)
Photogrammetric Surveying – Principle, Scale, Number of Photographs,
Deduction of distance & height, Elements of Astronomical survey,
Solution of problems dealing with celestial triangle.
Mr. Pratap Kumar Pradhan, Asst. Prof., Department of Civil Engineering, VSSUT, Burla, Odisha
Advantages and Disadvantages:
Some advantages of photogrammetry over conventional surveying and mapping methods are:
It provides a permanent photographic record of conditions that existed at the time the
aerial photographs were taken. Since this record has metric characteristics, it is not only
a pictorial record but also an accurate measurable record.
If information has to be re-surveyed or re-evaluated, it is not necessary to perform
expensive field work. The same photographs can be measured again and new
information can be compiled in a very timely fashion. Missing information, such as
inadequate offsets for cross sections, can be remedied easily.
It can provide a large mapped area so alternate line studies can be made with the same
data source can be performed more efficiently and economically then other
conventional methods.
It provides a broad view of the project area, identifying both topographic and cultural
features.
It can be used in locations that are difficult, unsafe, or impossible to access.
Photogrammetry is an ideal surveying method for toxic areas where field work may
compromise the safety of the surveying crew.
An extremely important advantage of photogrammetry is that road surveys can be done
without closing lanes, disturbing traffic or endangering the field crew. Once a road is
photographed, measurement of road features, including elevation data, is done in the
office, not in the field.
Intervisibility between points and unnecessary surveys to extend control to a remote
area of a project are not required. The coordinates of every point in the mapping area
can be determined with no extra effort or cost.
The aerial photographs can be used to convey or describe information to the public,
State and Federal agencies, and other divisions within the Department of
Transportation.
Some disadvantages are:
Weather conditions (winds, clouds, haze etc.) affect the aerial photography process and
the quality of the images.

Mr. Pratap Kumar Pradhan, Asst. Prof., Department of Civil Engineering, VSSUT, Burla, Odisha
Seasonal conditions affect the aerial photographs, i.e., snow cover will obliterate the
targets and give a false ground impression. Therefore, there is only a short time
normally November through March, that is ideal for general purpose aerial
photography. A cleared construction site or a highway that is not obstructed by trees, is
less subjected to this restriction. These types of projects can be flown and photographed
during most of the year.
Hidden grounds caused by man-made objects, such as an overpass and a roof, cannot
be mapped with photogrammetry. Hidden ground problems can be caused by tree
canopy, dense vegetation, or by rugged terrain with sharp slopes. The information
hidden from the camera must be mapped with other surveying methods.
The accuracy of the mapping contours and cross sections depends on flight height and
the accuracy of the field survey.
History of Photogrammetry:
1851: French officer Aime Laussedat develops the first photogrammetrical devices and
methods. He is seen as the initiator of photogrammetry.
1858: The German architect A. Meydenbauer develops photogrammetrical techniques for
the documentation of buildings and installs the first photogrammetric institute in 1885
(Royal Prussian Photogrammetric Institute).
1885: The ancient ruins of Persepolis were the first archaeological object recorded
photogrammetrically.
1889: The first German manual of photogrammetry was published by C. Koppe.
1911: The Austrian Th. Scheimpflug finds a way to create rectified photographs. He is
considered as the initiator of aerial photogrammetry, since he was the first succeeding to
apply the photogrammetrical principles to aerial photographs
1913: The first congress of the ISP (International Society for Photogrammetry) was held
in Vienna.
1980: Due to improvements in computer hardware and software, digital photogrammetry
is gaining more and more importance.
1996: 83 years after its first conference, the ISPRS comes back to Vienna, the town,
where it was founded.

Mr. Pratap Kumar Pradhan, Asst. Prof., Department of Civil Engineering, VSSUT, Burla, Odisha
Classification of Photogrammetry:
Photogrammetry is divided into different categories according to the types of photographs or
sensing system used or the manner of their use as given below:
I. On the basis of orientation of camera axis:
a. Terrestrial or ground photogrammetry
When the photographs are obtained from the ground station with camera axis horizontal
or nearly horizontal
b. Aerial photogrammetry
If the photographs are obtained from an airborne vehicle. The photographs are
called vertical if the camera axis is truly vertical or if the tilt of the camera axis is less
than 3o. If tilt is more than (often given intentionally), the photographs are
called oblique photographs.
II. On the basis of sensor system used:
Following names are popularly used to indicate type of sensor system used:
Radargrammetry: Radar sensor
X-ray photogrammetry: X-ray sensor
Hologrammetry: Holographs
Cine photogrammetry: motion pictures
Infrared or colour photogrammetry: infrared or colour photographs
III. On the basis of principle of recreating geometry:
When single photographs are used with the stereoscopic effect, if any, it is
called Monoscopic Photogrammetry.
If two overlapping photographs are used to generate three dimensional view to create relief
model, it is called Stereo Photogrammetry. It is the most popular and widely used form of
photogrammetry.
IV. On the basis of procedure involved for reducing the data from photographs:
Three types of photogrammetry are possible under this classification:
a. Instrumental or Analogue photogrammetry: It involves photogrammetric
instruments to carry out tasks.

Mr. Pratap Kumar Pradhan, Asst. Prof., Department of Civil Engineering, VSSUT, Burla, Odisha
b. Semi-analytical or analytical: Analytical photogrammetry solves problems by
establishing mathematical relationship between coordinates on photographic image and
real world objects. Semi-analytical approach is hybrid approach using instrumental as
well analytical principles.
c. Digital Photogrammetry or softcopy photogrammetry: It uses digital image
processing principle and analytical photogrammetry tools to carry out photogrammetric
operation on digital imagery.
V. On the basis of platforms on which the sensor is mounted:
If the sensing system is space borne, it is called Space Photogrammetry, Satellite
Photogrammetry or Extra-terrestrial Photogrammetry. Out of various types of the
photogrammetry, the most commonly used forms are Stereo Photogrammetry
utilizing a pair of vertical aerial photographs (stereo pair) or terrestrial photogrammetry
using a terrestrial stereo pair.
Application of Photographic Survey:
Photogrammetry has been used in several areas. The following description give an overview
of various applications areas of photogrammetry
a. Geology: Structural geology, investigation of water resources, analysis of thermal patterns
on earth's surface, geomorphological studies including investigations of shore features.
• Stratigraphic studies
• General geologic applications
• Study of luminescence phenomenon
• Recording and analysis of catastrophic events
• Earthquakes, floods, and eruption.
b. Forestry: Timber inventories, cover maps, acreage studies
c. Agriculture: Soil type, soil conservation, crop planting, crop disease, crop-acreage.
d. Design and construction: Data needed for site and route studies specifically for
alternate schemes for photogrammetry. Used in design and construction of dams,
bridges, transmission lines.
e. Planning of cities and highways: New highway locations, detailed design of
construction contracts, planning of civic improvements.
f. Cadastre: Cadastral problems such as determination of land lines for assessment of
taxes. Large scale cadastral maps are prepared for reapportionment of land.

Mr. Pratap Kumar Pradhan, Asst. Prof., Department of Civil Engineering, VSSUT, Burla, Odisha
g. Environmental Studies:
h. Land-use studies.
i. Urban area mapping.
j. Exploration: To identify and zero down to areas for various exploratory jobs such as
oil or mineral exploration.
k. Military intelligence: Reconnaissance for deployment of forces, planning manoeuvres,
assessing effects of operation, initiating problems related to topography, terrain
conditions or works.
l. Medicine and surgery: Stereoscopic measurements on human body, X-ray
photogrammetry in location of foreign material in body and location and examinations
of fractures and grooves, biostereometrics.
m. Mountains and hilly areas can be surveyed easily.
n. Miscellaneous
Classification of Photographs:
The following paragraphs give details of classification of photographs used in different
applications
A. On the basis of the alignment of optical axis
Vertical: If optical axis of the camera is held in a vertical or nearly vertical position.
Tilted: An unintentional and unavoidable inclination of the optical axis from vertical
produces a tilted photograph.
Oblique: Photograph taken with the optical axis intentionally inclined to the vertical.
Following are different types of oblique photographs:
i. High oblique: Oblique which contains the apparent horizon of the earth.
ii. Low oblique: Apparent horizon does not appear.
iii. Trimetrogon: Combination of a vertical and two oblique photographs in which
the central photo is vertical and side ones are oblique. Mainly used for
reconnaissance.
iv. Convergent: A pair of low obliques taken in sequence along a flight line in
such a manner that both the photographs cover essentially the same area with
their axes tilted at a fixed inclination from the vertical in opposite directions in
the direction of flight line so that the forward exposure of the first station forms
a stereo-pair with the backward exposure of the next station.

Mr. Pratap Kumar Pradhan, Asst. Prof., Department of Civil Engineering, VSSUT, Burla, Odisha
Comparison of photographs
Type of photo Vertical Low oblique High oblique Characteristics Tilt < 3o Horizon does not appear Horizon appears
Coverage Least Less Greatest
Area Rectangular Trapezoidal Trapezoidal
Scale Uniform if flat Decreases from
foreground to
background
Decreases from
foreground to
background
Difference with map Least Less Greatest
Advantage Easiest to map - Economical and
illustrative
B. On the basis of the scale
i. Small scale - 1: 30000 to 1: 250000, used for rigorous mapping of undeveloped
terrain and reconnaissance of vast areas.
ii. Medium scale - 1: 5000 to 1: 30000, used for reconnaissance, preliminary survey
and intelligence purpose.
iii. Large scale - 1: 1000 to 1: 5000, used for engineering survey, exploring mines.
C. On the basis of angle of coverage
The angle of coverage is defined as the angle, the diagonal of the negative format
subtends at the real node of the lens of the apex angle of the cone of rays passing through
the front nodal point of the lens.
Name Coverage angle
Standard or normal angle 60o
Wide angle 90o
Super wide or ultra wide angle
Narrow angle < 60o

Mr. Pratap Kumar Pradhan, Asst. Prof., Department of Civil Engineering, VSSUT, Burla, Odisha
Introductory definitions of Aerial Photogrammetry:
i. Vertical photograph: A photograph taken with the optical axis coinciding with direction
of gravity.
ii. Tilted or near vertical : Photograph taken with optical axis unintentionally tilted from
vertical by a small amount (usually < 3°)
iii. Focal length (f): Distance from front nodal point to the plane of the photograph (from near
nodal point to image plane).
iv. Exposure station (point L) : Position of frontal nodal point at the instant of exposure (L)
v. Flying height (H): Elevation of exposure station above sea level or above selected datum.
vi. Principal point: The point where the perpendicular dropped from the front nodal point
meets/strikes the plane of photograph.
vii. Principal Line: The trace (intersection) of the principal plane upon the photograph; also, the line
on the photograph which passes through the principal point and the nadir point (and the "isocenter").
viii. Tilt: The angle formed between the optical axis of the camera and the plumb line.
ix. Isocentre: The point where the bisector of angle of tilt meets the plane of photograph.
x. Ground Nadir: The point on the ground that is vertically beneath (directly below) the
perspective center of the camera lens.

Mr. Pratap Kumar Pradhan, Asst. Prof., Department of Civil Engineering, VSSUT, Burla, Odisha
xi. Nadir Point or Photographic Nadir: The point on the photograph which corresponds to
the ground nadir. The point at which a vertical line (plumb line) from the perspective center
to the ground nadir intersects the photograph.
xii. Photograph Perpendicular: The perpendicular from the interior perspective center (real
nodal point) to the plane of the photograph.
xiii. Photograph Center: The point on the photograph that is located at the intersection of the
fiducial axes. (The photograph center is sometimes called the "center of collimation.") In a
perfectly adjusted camera, the photograph center and the principal point are identical (i.e.,
unless camera calibration indicates otherwise, the principal point is generally assumed to
coincide with the photography center).
xiv. Scale: The ratio of a distance on a photograph or map to its corresponding distance on the
ground. Although photographic scale varies from point to point (due to relief and/or tilt), it
is usually taken as f/H' . . . where f = focal length and H' = height of camera above mean
ground elevation. Scale may be expressed as a ratio (1:24,000), a fraction (1/24,000), or an
equivalence (1 in. = 2,000 ft.).
xv. Relief Displacement: If a ground object is below (above) the elevation of the ground nadir,
its image will be displaced radially inward (outward) with respect to the nadir point. Relief
displacements may be measured accurately from the photography center if two conditions
are met: (1) the photography is truly vertical (i.e., the nadir and principal points coincide),
and (2) the camera is in perfect adjustment (i.e., the principal point and photograph center
coincide).
xvi. Overlap: The amount by which one photograph covers the same area as covered by another
(customarily expressed as a percentage). The overlap between aerial photographs in the
same flight line is called "end lap," and the overlap between photographs in adjacent,
parallel flight lines is called "side lap."
xvii. Parallax Difference: The difference in the absolute stereoscopic parallaxes of two points
imaged on a pair of photographs. Customarily used to determine the elevation difference
between the two objects.
xviii. Azimuth: The horizontal angle measured clockwise about the ground nadir from a
reference plane (usually the ground-survey north meridian) to the principal plane. (The
azimuth of a photograph is the ground-survey direction of tilt, while swing is the direction
of tilt with respect to the photograph axes).

Mr. Pratap Kumar Pradhan, Asst. Prof., Department of Civil Engineering, VSSUT, Burla, Odisha
Scale of a Vertical Photograph / Scale of Photograph:
CASE-I:
Due to perspective geometry of photographs, the scale of photograph varies as a
function of focal length, flying height, and the reduced level of terrain over a certain
reference datum. In the figure given below, for a vertical photograph,
L = Exposure station
f = Focal length
H = Flying height above datum
h = the height of ground point A above datum.
Point A is imaged as a in the photograph. From the construction and using similar triangles
Loa and LOAA, we can write the following relations:
Mr. Pratap Kumar Pradhan, Asst. Prof., Department of Civil Engineering, VSSUT, Burla, Odisha
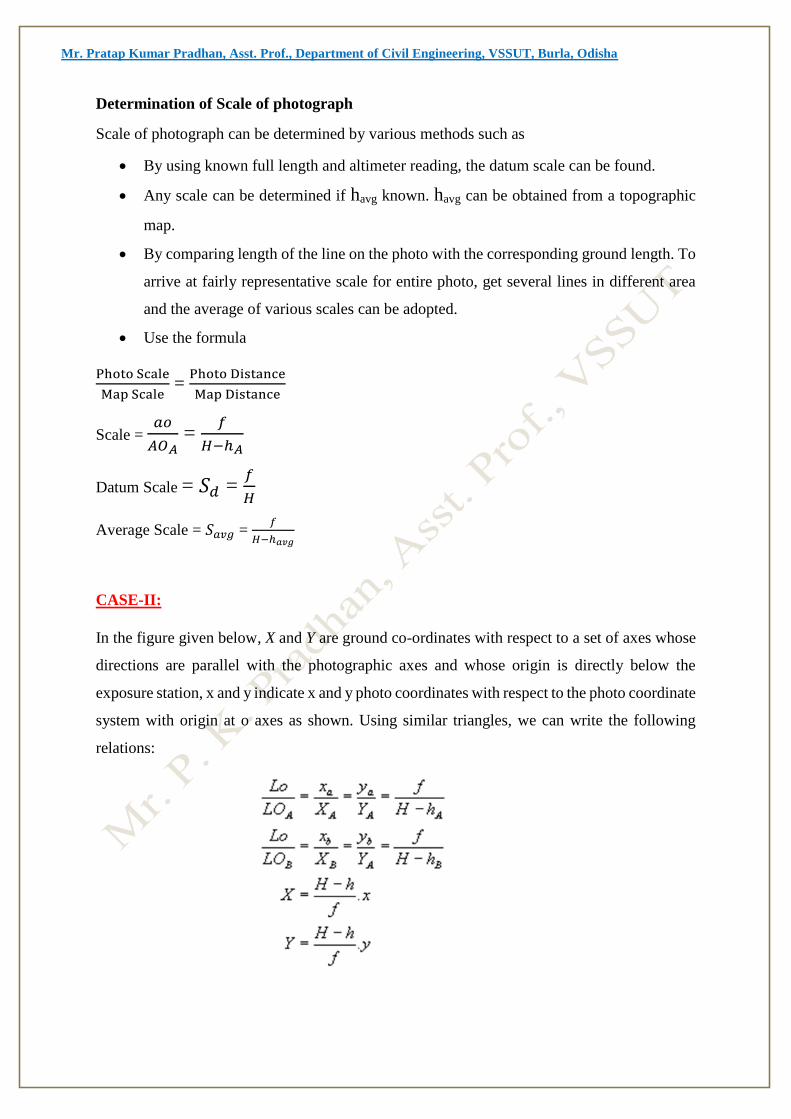
Determination of Scale of photograph
Scale of photograph can be determined by various methods such as
By using known full length and altimeter reading, the datum scale can be found.
Any scale can be determined if havg known. havg can be obtained from a topographic
map.
By comparing length of the line on the photo with the corresponding ground length. To
arrive at fairly representative scale for entire photo, get several lines in different area
and the average of various scales can be adopted.
Use the formula
Photo Scale
Map Scale =
Photo Distance
Map Distance
Scale = 𝑎𝑜
𝐴𝑂𝐴 =
𝑓
𝐻−ℎ𝐴
Datum Scale = 𝑆𝑑 = 𝑓
𝐻
Average Scale = 𝑆𝑎𝑣𝑔 = 𝑓
𝐻−ℎ𝑎𝑣𝑔
CASE-II:
In the figure given below, X and Y are ground co-ordinates with respect to a set of axes whose
directions are parallel with the photographic axes and whose origin is directly below the
exposure station, x and y indicate x and y photo coordinates with respect to the photo coordinate
system with origin at o axes as shown. Using similar triangles, we can write the following
relations:

Mr. Pratap Kumar Pradhan, Asst. Prof., Department of Civil Engineering, VSSUT, Burla, Odisha
In this method, if the ground coordinates of two points, A and B are given (XA, YA) and (XB,
YB), then distance (D) is given by:
Relief displacement on Vertical photographs:
Relief displacement is the radial distance between where an object appears in an image
to where it actually should be according to a Planimetric coordinate system. The images of
ground positions are shifted or displaced due to terrain relief, in the central projection of an
aerial photograph. If a photograph is truly vertical, the displacement of images is in a direction
radial from the photograph centre. This displacement is called the radial displacement due to
relief. Radial displacement due to relief is also responsible for scale differences within any one
photograph, and for this reason a photograph is not an accurate map. Relief displacement is
caused by differences in relative elevation of objects photographed. All objects that extend
above or below a datum plane have their photographic images displaced to a greater or lesser
extent. This displacement occurs always along the line which connects the photo point and the

Mr. Pratap Kumar Pradhan, Asst. Prof., Department of Civil Engineering, VSSUT, Burla, Odisha
nadir and is, therefore termed “radial line displacement”. Or this displacement is always radial
with respect to principal point. It increases with increasing height of the feature and the distance
from nadir.
In figure, L is the perspective center of the camera system. A is the point on ground at
an elevation of h with respect to the datum. a is the image of ground point on photograph. a' is
the location of projected point A' on the datum. These figures indicate that although point A is
vertically above point B, their images are not coinciding and are displaced on photographic
plane due to relief.
•The displacement of the point a on the photograph from its true position, due to height, is
called the height or relief displacement or relief distortion (RD). This distortion is due to the
perspective geometry.
•It can also be noticed form these figures that the relief displacement is radial from nadir point.
In case of vertical photographs, the nadir point and the principal point coincide. Hence, in this
case relief displacement can be considered to be radial from the principal point also. The
following derivation using figure 4(a) provides the magnitude of relief distortion

Mr. Pratap Kumar Pradhan, Asst. Prof., Department of Civil Engineering, VSSUT, Burla, Odisha
Differentiating d with respect to H gives the following equations:
From these equations, the following observations can be made:
1. For a given elevation, RD of a point increases as the distance from principal point
increases.
2. Other things being equal, an increase in H decreases RD of a point. (This point is
important for mosaicing or combining photographs along common features). For the
same reason, for satellite imagery, RD is very small since H is large.
3. If ground point is above datum then RD will be outward or positive; if point below
datum then h has negative sign and RD will be inward or negative.
4. RD is radial from nadir point regardless of unintentional or accidental tilt of the camera.
This is a fundamental concept of photography. It has important implication for photo
rectification (this concept will not be discussed in this course).
5. Large relief displacement is objectionable in pure plannimetric mapping by graphical
methods but advantageous in contouring with stereoplotting instruments. Most
effective way to control RD is to select proper flying height.

Mr. Pratap Kumar Pradhan, Asst. Prof., Department of Civil Engineering, VSSUT, Burla, Odisha
Number of Photographs:
CASE-I: The number of photographs required is calculated by dividing the total area to
be photographed by net area covered by a single photograph.
So,
Let,
A = Total area to be photographed
l = Length of the photograph in the direction of flight
w = Width of the photograph normal to the direction of flight
L = Actual ground length covered by each photograph
W = Actual ground width covered by each photograph
a = Net ground area covered by each photograph
Pl = % of overlap between successive photographs in the direction of flight (expressed as
ratio)
Pw= % of side lap (expressed as ratio)
S = Scale of the photograph = 𝐻 (𝑐𝑚)
𝑓 (𝑐𝑚) =
𝐻𝑒𝑖𝑔ℎ𝑡 𝑎𝑏𝑜𝑣𝑒 𝑡ℎ𝑒 𝑔𝑟𝑜𝑢𝑛𝑑
𝐹𝑜𝑐𝑎𝑙 𝐿𝑒𝑛𝑔𝑡ℎ
L= (1- Pl) ×S×l
W=(1- Pw) ×S×w
a = L×W
So, N = 𝐴
𝑎
Number of Photographs (N) = 𝐴
𝑎
CASE-II: If the rectangular dimensions (length and width) of ground are given, the number of
photographs required are computed by calculating the number of strips and the number of
photographs required in each strip and multiplying two.
Let,
L1 = dimension of the area parallel to the direction of flight
L2 = dimension of the area normal to the direction of flight
N1 = Number of photographs in each strip
Number of Photographs (N) = 𝐴
𝑎

Mr. Pratap Kumar Pradhan, Asst. Prof., Department of Civil Engineering, VSSUT, Burla, Odisha
N2 = Number of strips required
N = Total number of photographs to covered the whole area
Now, net length covered by each photograph = L= (1- Pl) ×S×l
Similarly, net width covered by each photograph = W= (1- Pw) ×S×w
So, N1 = Number of photographs in each strip is given by = L1
𝐿 +1
And, N2 = Number of strips required = L2
𝑊 +1
Field Astronomy:
In a clear night, the sky appears as a vast hollow hemisphere with its interior studded with
innumerable stars. On observing the sky for some duration it appears that the celestial bodies
are revolving around the earth with its centre at the position of the observer. The stars move in
a regular manner and maintain same position relative to each other. Consequently, terrestrial
position or direction defined with reference to celestial body remains absolute for all practical
purposes in plane surveying. Thus, the absolute direction of a line can be determined from the
position / direction of a celestial body.
Astronomical Terms and Definitions:
To observe the positions / direction and movement of the celestial bodies, an imaginary
sphere of infinite radius is conceptualized having its centre at the centre of the earth. The stars
are studded over the inner surface of the sphere and the earth is represented as a point at the
centre. Figure 1 shows a celestial sphere and some principal parameters necessary to
understand astronomical observation and calculations for determination of absolute direction
of a line. The important terms and definitions related to field astronomy are as follows:
Celestial Sphere: An imaginary sphere of infinite radius with the earth at its centre and other
celestial bodies studded on its inside surface is known as celestial sphere.
So, Total number of Photographs = N = N1 × N2

Mr. Pratap Kumar Pradhan, Asst. Prof., Department of Civil Engineering, VSSUT, Burla, Odisha
Zenith, Nadir and Celestial Horizon: If a plumb line through an observer is extended upward,
the imaginary point at which it appears to intersect the celestial sphere is known as Zenith. The
imaginary point at which it appears to intersect downward in the celestial sphere is known as
Nadir (N).
Celestial Horizon. (True or Rational horizon or geocentric horizon): It is the great circle traced
upon the celestial sphere by that plane which is perpendicular to the Zenith-Nadir line, and
which passes through the center of the earth. (Great circle is a section of a sphere when the
cutting plane passes through the center of the sphere).
Great Circle (G.C): The imaginary line of intersection of an infinite plane, passing through
the centre of the earth and the circumference of the celestial sphere is known as great circle.

Mr. Pratap Kumar Pradhan, Asst. Prof., Department of Civil Engineering, VSSUT, Burla, Odisha
Vertical circle: Great circle passing through zenith and nadir is known as vertical circle.
Poles: If the axis of rotation of the earth is imagined to be extended infinitely in both directions,
the points at which it meets the celestial sphere are known as poles. The point of intersection
in the northern hemisphere is known as north celestial pole and that in the southern hemisphere
as south celestial pole.
Equator: The line of intersection of an infinite plane passing through the centre of the earth
and perpendicular to the line joining celestial poles with the celestial sphere.
Hour circle: Great circle passing through celestial poles is known as hour circle, also known
as declination circle.
Meridian: The hour circle passing through observer's zenith and nadir is known as (observer's)
meridian. It represents the North-South direction at observer station.
Altitude (α): The altitude of a celestial body is the angular distance measured along a vertical
circle passing through the body. It is considered positive if the angle measured is above horizon
and below horizon, it is considered as negative.
Azimuth (A): The azimuth of a celestial body is the angular distance measured along the
horizon from the observer's meridian to the foot of the vertical circle passing through the
celestial body.
Declination (δ): The declination of a celestial body is the angular distance measured from the
equator to the celestial body along the arc of an hour circle. It is considered positive in North
direction and negative in South.
Co-declination or Polar Distance (p): It is the angular distance of the heavenly body from
the near pole. It is the complement of the declination. i.e., p = 90° - δ
Ecliptic: The great circle along which the sun appears to move round the earth in a year is
called the ecliptic.
Equinoctial points: The points of intersection of the ecliptic circle with the equatorial circle
are known as equinoctial points. The point at which the sun transits from Southern to Northern

Mr. Pratap Kumar Pradhan, Asst. Prof., Department of Civil Engineering, VSSUT, Burla, Odisha
hemisphere is known as First point of Aeries and from Northern to Southern hemisphere as
First point of Libra.
Right ascension: The right ascension of a celestial body is the angular distance along the arc
of celestial equator measured from the First point of Aeries to the foot of the hour circle. It is
measured from East to West direction i.e., anti-clockwise in Northern hemisphere.
Prime meridian: Reference meridian that passes through the Royal Naval Observatory in
Greenwich, England is known as prime meridian; it is also known as Greenwich meridian.
Longitude (Φ): The longitude of an observer's station is the angular distance measured along
the equator from the prime meridian to the observer's meridian. It varies from zero degrees to
180° E and 0° to 180° W.
Latitude (θ): The latitude of an observer's station is the angular distance measured along the
observer's meridian from the equator to the zenith point. It varies from zero degree to 90° N
and 0° to 90° S.

Mr. Pratap Kumar Pradhan, Asst. Prof., Department of Civil Engineering, VSSUT, Burla, Odisha
Co-latitude (c): The Co-latitude of a place is the angular distance from the zenith to the pole.
It is the complement of the latitude and equal to (90°-θ).
Hour angle (HA): The hour angle of a celestial body is the angle at the equatorial plane
measured westward from meridian to the hour circle passing through the celestial body.
Local hour angle (LHA): The angular distance of a celestial body measured westward from
the point of intersection of the equator and the meridian of the observer to the foot of the hour
circle passing through the celestial body.
Greenwich hour angle (GHA): Angle at the equatorial plane measured westward from the
prime (Greenwich) meridian to the hour circle through the celestial body.
Spherical triangle: Triangle formed by the intersection of three arcs of great circles (on the
surface of the celestial sphere) is known as spherical triangle.

Mr. Pratap Kumar Pradhan, Asst. Prof., Department of Civil Engineering, VSSUT, Burla, Odisha
Spherical triangle:
A spherical triangle is that triangle which is formed upon the surface of the sphere by
intersection of three arcs of great circles and the angles formed by the arcs at the vertices of the
triangle are called the spherical angles of the triangle.
AB, BC and CA are the three arcs of great circles and intersect each other at A, B and C. It is
usual to denote the angles by A, B and C and the sides respectively opposite to them, as a, b

Mr. Pratap Kumar Pradhan, Asst. Prof., Department of Civil Engineering, VSSUT, Burla, Odisha
and c. The sides of spherical triangle are proportional to the angle subtended by them at the
centre of the sphere and are, therefore, expressed in angular measure. Thus, by sin b we mean
the sine of the angle subtended at the centre by the arc AC.
Properties of a spherical triangle
The following are the properties of a spherical triangle:
Any angle is less than two right angles or .
The sum of the three angles is less than six right angles or 3and greater than two
right angles or .
The sum of any two sides is greater than the third.
If the sum of any two sides is equal to two right angles or , the sum of the angles
opposite them is equal to two right angles or .
The smaller angle is opposite the smaller side, and vice versa.
Formulae: The six quantities involved in a spherical triangle are three angles A, B and C and the three
sides a, b and c. Out of these, if three quantities are known, the other three can very easily be
computed by the use of the following formulae in spherical trigonometry.
1. Sine Formula: 𝑆𝑖𝑛 𝑎
𝑆𝑖𝑛 𝐴 =
𝑆𝑖𝑛 𝑏
𝑆𝑖𝑛 𝐵 =
𝑆𝑖𝑛 𝑐
𝑆𝑖𝑛 𝐶
2. Cosine formula = Cos A= 𝐶𝑜𝑠 𝑎−𝐶𝑜𝑠 𝑏. 𝐶𝑜𝑠 𝑐
𝑆𝑖𝑛 𝑏 .𝑆𝑖𝑛 𝑐
Or cos a = cos b cos c + sin b sin c cos A
cos A = - cos B cos C + sin B sin C cos a
3. For Computaion Purposes
Sin 𝐴
2 = √
sin(𝑠−𝑏).𝑠𝑖𝑛(𝑠−𝑐)
𝑠𝑖𝑛𝑏.𝑠𝑖𝑛𝑐
Cos 𝐴
2 = √
sin(𝑠−𝑎).𝑠𝑖𝑛𝑠
𝑠𝑖𝑛𝑏.𝑠𝑖𝑛𝑐
tan 𝐴
2 = √
sin(𝑠−𝑏).𝑠𝑖𝑛(𝑠−𝑐)
𝑠𝑖𝑛𝑠.sin (𝑠−𝑎)
s = 𝑎+𝑏+𝑐
2

Mr. Pratap Kumar Pradhan, Asst. Prof., Department of Civil Engineering, VSSUT, Burla, Odisha
Astronomical Triangle:
The spherical triangle formed by three points i.e., pole, the zenith, and the observed
body is known as Astronomical triangle.
Co-Altitude = 90°- α
Co-latitude = 90°- θ
Co-declination = 90° - δ
H =h = Hour angle
A = Z = Azimuth
Cos A= 𝑆𝑖𝑛 δ
𝐶𝑜𝑠 α . 𝐶𝑜𝑠 θ− 𝑡𝑎𝑛 α. tan θ
Cos H= 𝑆𝑖𝑛 α
𝐶𝑜𝑠δ .𝐶𝑜𝑠θ− 𝑡𝑎𝑛 δ. tan θ

Mr. Pratap Kumar Pradhan, Asst. Prof., Department of Civil Engineering, VSSUT, Burla, Odisha
1. Define the following terms used in aerial Photogrammetry: (1) Oblique Photograph (2)
Exposure station (3) Focal Length (4) Principal Point (5) Nadir Point (6) Isocentre (7)
Swing (8) Tilt (9) Isocentre (10) Overlap (11) Side lap (12) Crab (13) Drift
2. What is relief displacement? Derive an expression for the relief displacement in a
vertical photograph.
3. Explain scale of vertical photograph.
4. What is function of aerial camera? Describe Schematically its Essential Parts.
5. Write short note on (1) Stereoscope (2) Parallax Bar.
6. In a pair of overlapping vertical photographs, the mean distance between two principal
points both of which lie on the datum is 6.375 cm. At the time of photography, the air-
craft was 600 m above the datum. The camera has a focal length of 150 mm. In the
common overlap, a tall chimney 120 m high with its base in the datum surface is
observed. Determine difference of parallax for top and bottom of chimney.
7. The scale of an aerial photography is 1 cm = 100m. The photograph size is 20 cm x 20
cm. Determine the number of photographs required to cover an area 10 km x 10 km, if
the longitudinal lap is 60% and the side lap is 30%.
8. What is meant by scale of vertical photograph? Determine scale of photograph for terrain
lying at elevation of 50 m and 200m if vertical photograph was taken at altitude of 1200
meters. Take focal length of camera as 15 cm.
9. The scale of an aerial photography is 1 cm = 100m. The photograph size is 20 cm x 20
cm. Determine the number of photographs required to cover an area 10 km x 10 km, if
the longitudinal lap is 70% and the side lap is 25%.
10. A line AB measures 11.00 cm on a photograph taken with a camera having a focal
length of 21.5 cm. The same line measures 3 cm on a map drawn to scale of 1/45000.
Calculate the flying height of the aircraft, if the average altitude is 350 m.
11. Calculate the minimum number of photographs to provide a stereoscopic cover for a
fairly level area with the following specifications:
12. List the various types of aerial photographs. How would you measure the photo
coordinates? Explain.
Question Bank of Photogrammetric Surveying and Astronomical Survey

Mr. Pratap Kumar Pradhan, Asst. Prof., Department of Civil Engineering, VSSUT, Burla, Odisha
13. Differentiate between aerial and terrestrial photogrammetry.
14. What is meant by parallex? How you will measure the parallex error? Ellaborate.
15. List the various applications of photogrammetry.
16. The distance on a map between two road intersections in flat terrain measures 12.78 cm.
The distance between the same two points is 9.25 cm on vertical photograph. If the scale
of the map is 1: 24,000, what is the scale of the photograph?
17. Points A and B are at elevations 273 m and 328 m above datum, respectively. The
photographic coordinates of their images on a vertical photograph are:
xa = -68.27 mm xb = -87.44 mm
ya = -32.37 mm yb = 26.81 mm
What is the horizontal length of the line AB if the photo was taken from 3200 meters
above datum with a 21 cm focal length camera?
18. An image of a hilltop is 87.5 mm from the centre of a photograph. The elevation of the
hill is 665 meters and the flight altitude 4660 meters from the same datum. How much
is the image displaced due to elevation of the hill?
19. A vertical photograph was taken with H above datum = 2400 m and f = 210 mm. The
highest, lowest, and average elevation of terrain appearing in the photograph is 1330,
617, and 960 m respectively. Calculate minimum, maximum, and average photographic
scale.
20. Fifteen photographs were taken in a strip each covering an area equal to 25.75 sq. km.
If the longitudinal overlap is 60%, find the total ground area covered by the strip.
21. Find the shortest distance between two places A and B, given that the longitudes of A
and B are 15° 0’ N and 12° 6’ N and their longitudes are 50° 12’ E and 54° 0’ E
respectively. Find also the direction of B on the great circle route.
Radius of earth = 6370 km.
22. Find the shortest distance between a station (29° 52' N, 77° 54' E) at Roorkee and to a
station (28° 34' N, 77° 06' E) at Delhi. Determine the azimuth of the line along which
the direction of the shortest distance to be set out starting from Roorkee.

Mr. Pratap Kumar Pradhan, Asst. Prof., Department of Civil Engineering, VSSUT, Burla, Odisha
Remote sensing:
History:
Indian remote sensing program was initiated in 1970, following the successful
demonstration flights of Bhaskara-1 and Bhaskara-2 satellites launched in 1979 and
1981, India began to develop the indigenous Indian Remote Sensing (IRS) satellite
program to support the national economy in the areas of agriculture, water resources,
forestry and ecology, geology, water sheds, marine fisheries and coastal management
and launched first IRS sat in 1989.
India established the National Natural Resources Management System (NNRMS) for
which the Department of Space (DOS) is the nodal agency, providing operational
remote sensing data services.
With the advent of high-resolution satellites new applications in the areas of urban
sprawl, infrastructure planning and other large scale applications for mapping have
been initiated.
The IRS system is the largest constellation of remote sensing satellites for civilian use
in operation today in the world, with 10 operational satellites. All these are placed in
polar sun synchronous orbit and provide data in a variety of spatial, spectral and
temporal resolutions.
Remote sensing is science of
acquiring,
processing, and
interpreting
Images and related data that are obtained from ground-based, air-or space-borne instruments that
record the interaction between matter (target) and electromagnetic radiation. Remote Sensing:
using electromagnetic spectrum to image the land, ocean, and atmosphere.
Module – III (12 Hours)
Principles of Remote Sensing & Geographic Information System,
Application to Civil Engineering.

Mr. Pratap Kumar Pradhan, Asst. Prof., Department of Civil Engineering, VSSUT, Burla, Odisha
Advantages
It is relatively Inexpensive. The cost of software and data (which often represents a one-
off cost) is less expensive than sending teams of surveyors out into the field.
Current (within reason). One particular problem that the developing world faces is that
data is old or out of date. Satellite imagery can be acquired for free from the last decade
and contemporary data can be acquired fairly inexpensively.
Provides data about large areas.
Provides data about inaccessible areas - or even if they’re not inaccessible, then at least
you don’t have to go there.
Rapid production of maps possible.
Easy to manipulate (relatively!) with computers and derive information for map
production.
Rapid collection of data – much more efficient that ground survey.

Mr. Pratap Kumar Pradhan, Asst. Prof., Department of Civil Engineering, VSSUT, Burla, Odisha
Disadvantages
There will be doubtful and uncertainties of classification related to pixel size. A full
field check will be necessary to resolve ground use in these areas.
Datasets from multiple sources are sometimes difficult to geo reference. Using images
and maps that are drawn in different scales and projections can lead to difficulty
combining them.
The sensor performs a sweep and as such can create errors. i.e., only some of the image
is directly below the sensor and so pixels toward the edge of the image may be distorted.
Objects in the image can be confused or mis-classified. For example, shadows may look
like metalled roads.
To get any level of detailed, current data and to buy specialist RS software can be
expensive.
In some active sensing systems (such as lidar) the sensor and source are moving relative
to each other distortions can creep to the image. This is a form of Doppler effect (the
visual equivalent of a police siren changing pitch as it moves closer or further away
from you).
The interpretation of imagery requires a certain skill level
Needs cross verification with ground (field) survey data
Data from multiple sources may create confusion
Objects can be misclassified or confused
Distortions may occur in an image due to the relative motion of sensor and source
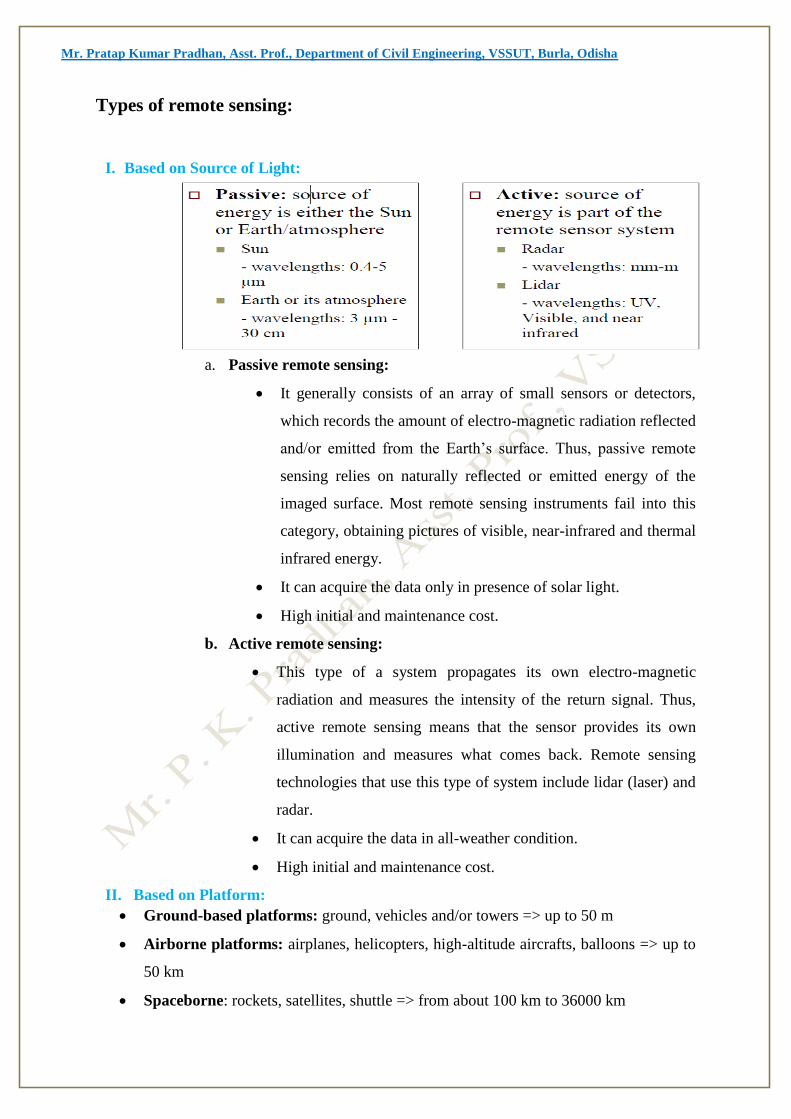
Mr. Pratap Kumar Pradhan, Asst. Prof., Department of Civil Engineering, VSSUT, Burla, Odisha
Types of remote sensing:
I. Based on Source of Light:
a. Passive remote sensing:
It generally consists of an array of small sensors or detectors,
which records the amount of electro-magnetic radiation reflected
and/or emitted from the Earth’s surface. Thus, passive remote
sensing relies on naturally reflected or emitted energy of the
imaged surface. Most remote sensing instruments fail into this
category, obtaining pictures of visible, near-infrared and thermal
infrared energy.
It can acquire the data only in presence of solar light.
High initial and maintenance cost.
b. Active remote sensing:
This type of a system propagates its own electro-magnetic
radiation and measures the intensity of the return signal. Thus,
active remote sensing means that the sensor provides its own
illumination and measures what comes back. Remote sensing
technologies that use this type of system include lidar (laser) and
radar.
It can acquire the data in all-weather condition.
High initial and maintenance cost.
II. Based on Platform:
Ground-based platforms: ground, vehicles and/or towers => up to 50 m
Airborne platforms: airplanes, helicopters, high-altitude aircrafts, balloons => up to
50 km
Spaceborne: rockets, satellites, shuttle => from about 100 km to 36000 km

Mr. Pratap Kumar Pradhan, Asst. Prof., Department of Civil Engineering, VSSUT, Burla, Odisha
Ideal Remote Sensing System:
The basic components of an ideal remote sensing system include:
i. A Uniform Energy Source which provides energy over all wavelengths, at a constant,
known, high level of output
ii. A Non-interfering Atmosphere which will not modify either the energy transmitted
from the source or emitted (or reflected) from the object in any manner.
iii. A Series of Unique Energy/Matter Interactions at the Earth's Surface which generate
reflected and/or emitted signals that are selective with respect to wavelength and also
unique to each object or earth surface feature type.
iv. A Super Sensor which is highly sensitive to all wavelengths. A super sensor would be
simple, reliable, accurate, economical, and requires no power or space. This sensor
yields data on the absolute brightness (or radiance) from a scene as a function of
wavelength.
v. A Real-Time Data Handling System which generates the instance radiance versus
wavelength response and processes into an interpretable format in real time. The data
derived is unique to a particular terrain and hence provide insight into its physical-
chemical-biological state.
vi. Multiple Data Users having knowledge in their respective disciplines and also in
remote sensing data acquisition and analysis techniques. The information collected will
be available to them faster and at less expense. This information will aid the users in
various decision making processes and also further in implementing these decisions.

Mr. Pratap Kumar Pradhan, Asst. Prof., Department of Civil Engineering, VSSUT, Burla, Odisha
[Components of an ideal remote sensing system]
Characteristics of Real Remote Sensing Systems:
Real remote sensing systems employed in general operation and utility have many
shortcomings when compared with an ideal system explained above.
i. Energy Source: The energy sources for real systems are usually non-uniform over
various wavelengths and also vary with time and space. This has major effect on the
passive remote sensing systems. The spectral distribution of reflected sunlight varies
both temporally and spatially. Earth surface materials also emit energy to varying
degrees of efficiency. A real remote sensing system needs calibration for source
characteristics.
ii. The Atmosphere: The atmosphere modifies the spectral distribution and strength of
the energy received or emitted (Fig. 8). The effect of atmospheric interaction varies
with the wavelength associated, sensor used and the sensing application. Calibration is
required to eliminate or compensate these atmospheric effects.
iii. The Energy/Matter Interactions at the Earth's Surface: Remote sensing is based
on the principle that each and every material reflects or emits energy in a unique,
known way. However, spectral signatures may be similar for different material types.
This makes differentiation difficult. Also, the knowledge of most of the energy/matter

Mr. Pratap Kumar Pradhan, Asst. Prof., Department of Civil Engineering, VSSUT, Burla, Odisha
interactions for earth surface features is either at elementary level or even completely
unknown.
iv. The Sensor: Real sensors have fixed limits of spectral sensitivity i.e., they are not
sensitive to all wavelengths. Also, they have limited spatial resolution (efficiency in
recording spatial details). Selection of a sensor requires a trade-off between spatial
resolution and spectral sensitivity. For example, while photographic systems have very
good spatial resolution and poor spectral sensitivity, non-photographic systems have
poor spatial resolution.
v. The Data Handling System: Human intervention is necessary for processing sensor
data; even though machines are also included in data handling. This makes the idea of
real time data handling almost impossible. The amount of data generated by the sensors
far exceeds the data handling capacity.
vi. The Multiple Data Users: The success of any remote sensing mission lies on the user
who ultimately transforms the data into information. This is possible only if the user
understands the problem thoroughly and has a wide knowledge in the data generation.
The user should know how to interpret the data generated and should know how best
to use them.

Mr. Pratap Kumar Pradhan, Asst. Prof., Department of Civil Engineering, VSSUT, Burla, Odisha
Application remote sensing:
The applications of remote sensing summarized below:
Agricultural: Agriculture plays an important role in economies of countries. The
production of food is important to everyone and producing food in a cost-effective
manner is the goal of every farmer and an agricultural agency. The satellites has an
ability to image individual fields, regions and counties on a frequent revisit cycle.
Customers can receive field-based information including crop identification, crop
area determination and crop condition monitoring (health and viability). Satellite
data are employed in precision agriculture to manage and monitor farming practices at
different levels. The data can be used to farm optimization and spatially-enable
management of technical operations. The images can help determine the location and
extent of crop stress and then can be used to develop and implement a spot treatment
plan that optimizes the use of agricultural chemicals. The major agricultural
applications of remote sensing include the following: Vegetation, crop type
classification, crop condition assessment (crop monitoring, damage assessment), crop
yield estimation, soil, mapping of soil characteristics, mapping of soil type, soil erosion,
soil moisture, mapping of soil management practices, compliance monitoring (farming
practices)
Forest mapping: One of the basic applications is forest cover typing and species
identification. Forest cover typing can consist of reconnaissance mapping over a large
area, while species inventories are highly detailed measurements of stand contents and
characteristics (tree type, height, density). Using remote sensing data we can identify
and delineate various forest types that would be difficult and time consuming using
traditional ground surveys. Data is available at various scales and resolutions to satisfy
local or regional demands. Requirements for reconnaissance mapping depend on the
scale of study.
Land cover mapping: is one of the most important and typical applications of remote
sensing data. Land cover corresponds to the physical condition of the ground surface,
for example, forest, grassland, concrete pavement etc., while land use reflects human
activities such as the use of the land, for example, industrial zones, residential zones,
agricultural fields etc Initially the land cover classification system should be
Mr. Pratap Kumar Pradhan, Asst. Prof., Department of Civil Engineering, VSSUT, Burla, Odisha
established, which is usually defined as levels and classes. The level and class should
be designed in consideration of the purpose of use (national, regional or local), the
spatial and spectral resolution of the remote sensing data, user's request and so on.
Assessment and monitoring of vegetation types and their status.
Monitoring and planning of water resources and groundwater exploration.
Geographic information
Urban planning.
Weather and agricultural forecasts and assessment of environment and natural disasters.
Laser film writing and printing.
Satellite imagery can provide the visible boundaries of soil types, while remote sensing
provide for a shallow penetration of soils. Additional physical data can be obtained
from spectral signatures for the soil surfaces.
Remote sensing allows for classification of soils, which can be interpreted from the
remote sensing images and the spectral signatures.

Mr. Pratap Kumar Pradhan, Asst. Prof., Department of Civil Engineering, VSSUT, Burla, Odisha
Geographical Information System (GIS)
Introduction:
A large variety of information systems are available for various applications. Figure given
below describes different types of such systems. This module will focus on Geographical
Information System (GIS), one of the important spatial information systems with a capability
to handle spatial information (information distributed in space).
[Different types of information systems]
Definitions
A powerful set of tools for collecting, storing, retrieving at will, transforming and
displaying spatial data from the real world.
A system for capturing, storing, checking, manipulating, analysing, and displaying data
which are spatially referenced to earth.
An information technology which stores, analyses, and displays both spatial and non-
spatial data.
An automated set of functions that provides professionals with advanced capabilities
for the storage, retrieval, manipulation and display of geographically located data.
An institutional entity, reflecting an organisational structure that integrates technology
with a database, expertise, and continuing financial support over time.

Mr. Pratap Kumar Pradhan, Asst. Prof., Department of Civil Engineering, VSSUT, Burla, Odisha
A decision support system involving the integration of spatially referenced data in a
problem solving environment
An information system that is designed to work with data referenced by spatial or
geographic co-ordinates. In other words, a GIS is both a database system with specific
capabilities for spatially-referenced data, as well as a set of operations for working with
the data. In a sense, a GIS may be thought of as a higher-order map.
A system of hardware and software that links mapped objects with text information that
describes them and provides tools for the storage, retrieval and manipulation of both
types of data.
A system of computer hardware, software and procedures designed to support the
capture, management, manipulation, analysis, and display of spatially referenced data
for solving complex planning and management problems.
A system that contains spatially referenced data that can be analysed and converted to
information for a specific set of purposes, or application. The key feature of a GIS is
the analysis of data to produce new information.
Why GIS is required:
Use of GIS is advocated on account of following observations:
• Poorly maintained geospatial data
• Out of date maps and statistics
• Inaccurate data and information
• Absence of data retrieval service
• Absence of data sharing
• Digital format data is compact and large quantities can be maintained and retrieved at
a greater speed and lesser cost
• Planning scenarios, decision models and interactive process are normal functions of
GIS
• Ability to perform complex spatial analysis rapidly
• Ability to manipulate different types of data efficiently

Mr. Pratap Kumar Pradhan, Asst. Prof., Department of Civil Engineering, VSSUT, Burla, Odisha
Benefits of GIS
• Geospatial data better maintained in a standard format
• Revision and updating easier
• Geospatial data and information easier to search, analyze and represent
• Value added products can be generated
• Geospatial data can be shared and exchanged freely
• Productivity and efficiency of staff is improved
• Saving in time and money
• Better decisions making
GIS Synonyms:

Mr. Pratap Kumar Pradhan, Asst. Prof., Department of Civil Engineering, VSSUT, Burla, Odisha
Data Mode of GIS:
There are two fundamental ways of representing topological data which can be summarised as
follows
Raster Form
Vector Form
Raster Form Vector Form
A representation of the world as a
surface divided into a regular grid of
cells. Raster models are useful for
storing data that varies continuously,
as in an aerial photograph, a satellite
image, a surface of chemical
concentrations, or an elevation
surface.
Simple data structure
Divides the entire area into
rectangular grid cells.
Overlaid is very simple.
The basic symbol is grid cell.
It gives high accuracy.
A representation of the world using
points, lines, and polygons. Vector
models are useful for storing data that
has discrete boundaries, such as
country borders, land parcels, and
streets.
More compact data structure
Divides the entire area into set of line
segments.
Overlaid is very difficult.
The basic symbols are points, lines &
polygons.
It gives less accuracy.
Application of GIS:
1. GIS in Mapping: Mapping is a central function of Geographic Information System, which
provides a visual interpretation of data. GIS store data in database and then represent it visually
in a mapped format. People from different professions use map to communicate. It is not
necessary to be a skilled cartographer to create maps. Google map, Bing map, Yahoo map are
the best example for web based GIS mapping solution.
2. Telecom and Network services: GIS can be a great planning and decision making tool for
telecom industries. GDi GISDATA enables wireless telecommunication organizations to
incorporate geographic data in to the complex network design, planning, optimization,
maintenance and activities. This technology allows telecom to enhance a variety of application
like engineering application, customer relationship management and location based services.
3. Accident Analysis and Hot Spot Analysis: GIS can be used as a key tool to minimize
accident hazard on roads, the existing road network has to be optimized and also the road safety
Mr. Pratap Kumar Pradhan, Asst. Prof., Department of Civil Engineering, VSSUT, Burla, Odisha
measures have to be improved. This can be achieved by proper traffic management. By
identifying the accident locations, remedial measures can be planned by the district
administrations to minimize the accidents in different parts of the world. Rerouting design is
also very convenient using GIS.
4. Urban Planning: GIS technology is used to analyze the urban growth and its direction of
expansion, and to find suitable sites for further urban development. In order to identify the sites
suitable for the urban growth, certain factors have to consider which is: land should have proper
accessibility, land should be more or less flat, land should be vacant or having low usage value
presently and it should have good supply of water.
5. Transportation Planning: GIS can be used in managing transportation and logistical
problems. If transport department is planning for a new railway or a road route then this can
be performed by adding environmental and topographical data into the GIS platform. This
will easily output the best route for the transportation based on the criteria like flattest route,
least damage to habitats and least disturbance from local people. GIS can also help in
monitoring rail systems and road conditions.
6. Environmental Impact Analysis: EIA is an important policy initiative to conserve natural
resources and environment. Many human activities produce potential adverse environmental
effects which include the construction and operation of highways, rail roads, pipelines, airports,
radioactive waste disposal and more. Environmental impact statements are usually required to
contain specific information on the magnitude and characteristics of environmental impact.
The EIA can be carried out efficiently by the help of GIS, by integrating various GIS layers,
assessment of natural features can be performed.
7. Agricultural Applications: GIS can be used to create more effective and efficient farming
techniques. It can also analyze soil data and to determine: what are the best crop to plant?,
where they should go? how to maintain nutrition levels to best benefit crop to plant?. It is fully
integrated and widely accepted for helping government agencies to manage programs that
support farmers and protect the environment. This could increase food production in different
parts of the world so the world food crisis could be avoided.

Mr. Pratap Kumar Pradhan, Asst. Prof., Department of Civil Engineering, VSSUT, Burla, Odisha
8. Disaster Management and Mitigation: Today a well-developed GIS systems are used to
protect the environment. It has become an integrated, well developed and successful tool in
disaster management and mitigation. GIS can help with risk management and analysis by
displaying which areas are likely to be prone to natural or man-made disasters. When such
disasters are identified, preventive measures can be developed.
9. Landslide Hazard Zonation using GIS: Landslide hazard zonation is the process of
ranking different parts of an area according to the degrees of actual or potential hazard from
landslides. The evaluation of landslide hazard is a complex task. It has become possible to
efficiently collect, manipulate and integrate a variety of spatial data such as geological,
structural, surface cover and slope characteristics of an area, which can be used for hazard
zonation. The entire above said layer can well integrate using GIS and weighted analysis is
also helpful to find Landslide prone area. By the help of GIS we can do risk assessment and
can reduce the losses of life and property.
10. Determine land use/land cover changes: Land cover means the feature that is covering
the barren surface .Land use means the area in the surface utilized for particular use. The role
of GIS technology in land use and land cover applications is that we can determine land
use/land cover changes in the different areas. Also it can detect and estimate the changes in the
land use/ land cover pattern within time. It enables to find out sudden changes in land use and
land cover either by natural forces or by other activities like deforestation.
11. Navigation (routing and scheduling): Web-based navigation maps encourage safe
navigation in waterway. Ferry paths and shipping routes are identified for the better routing.
ArcGIS supports safe navigation system and provides accurate topographic and hydrographic
data. Recently DNR, s Coastal Resources Division began the task of locating, documenting,
and cataloging these no historic wrecks with GIS. This division is providing public information
that make citizens awareness of these vessel locations through web map. The web map will be
regularly updated to keep the boating public informed of these coastal hazards to minimize risk
of collision and injury.
12. Flood damage estimation: GIS helps to document the need for federal disaster relief
funds, when appropriate and can be utilized by insurance agencies to assist in assessing
monetary value of property loss. A local government need to map flooding risk areas for
Mr. Pratap Kumar Pradhan, Asst. Prof., Department of Civil Engineering, VSSUT, Burla, Odisha
evaluate the flood potential level in the surrounding area. The damage can be well estimate and
can be shown using digital maps.
13. Natural Resources Management: By the help of GIS technology the agricultural, water
and forest resources can be well maintain and manage. Foresters can easily monitor forest
condition. Agricultural land includes managing crop yield, monitoring crop rotation, and more.
Water is one of the most essential constituents of the environment. GIS is used to analyze
geographic distribution of water resources. They are interrelated, i.e. forest cover reduces the
storm water runoff and tree canopy stores approximately 215,000 tons carbon. GIS is also used
in afforestation.
14. GIS Solutions in Banking Sector: Today rapid development occurs in the banking sector.
So it has become more market driven and market responsive. The success of this sector largely
depends on the ability of a bank to provide customer and market driven services. GIS plays an
important role providing planning, organizing and decision making.
15. Soil Mapping: Soil mapping provides resource information about an area. It helps in
understanding soil suitability for various land use activities. It is essential for preventing
environmental deterioration associated with misuse of land. GIS Helps to identify soil types in
an area and to delineate soil boundaries. It is used for the identification and classification of
soil. Soil map is widely used by the farmers in developed countries to retain soil nutrients and
earn maximum yield.
16. GIS based Digital Taxation: In Local Governments, GIS is used to solve taxation
problems. It is used to maximize the government income. For example, for engineering,
building permits, city development and other municipal needs, GIS is used. Often the data
collected and used by one agency or department can be used by another. Example Orhitec ltd
can supply you with a system to manage property tax on a geographic basis that can work
interactively with the municipal tax collection department. Using GIS we can develop a digital
taxation system.
17. Land Information System: GIS based land acquisition management system will provide
complete information about the land. Land acquisition managements is being used for the past
3 or 4 years only. It would help in assessment, payments for private land with owner details,

Mr. Pratap Kumar Pradhan, Asst. Prof., Department of Civil Engineering, VSSUT, Burla, Odisha
tracking of land allotments and possessions identification and timely resolution of land
acquisition related issues.
18. Surveying: Surveying is the measurement of location of objects on the earth’s surfaces.
Land survey is measuring the distance and angles between different points on the earth surface.
An increasing number of national and governments and regional organizations are using GNSS
measurements. GNSS is used for topographic surveys where a centimeter level accuracy is
provided. These data can be incorporated in the GIS system. GIS tools can be used to estimate
area and also, digital maps can prepared.
19. Wetland Mapping: Wetlands contribute to a healthy environment and retain water during
dry periods, thus keeping the water table high and relatively stable. During the flooding they
act to reduce flood levels and to trap suspended solids and attached nutrients. GIS provide
options for wetland mapping and design projects for wetland conservation quickly with the
help of GIS. Integration with Remote Sensing data helps to complete wetland mapping on
various scale. We can create a wetland digital data bank with spices information using GIS.
20. GIS Applications in Geology: Geologists use GIS in a various applications. The GIS is
used to study geologic features, analyze soils and strata, assess seismic information, and or
create three dimensional (3D) displays of geographic features. GIS can be also used to analyze
rock information characteristics and identifying the best dam site location.
21. Detection of Coal Mine Fires: GIS technology is applied in the area of safe production of
coal mine. Coal mine have developed an information management system, the administrators
can monitor the safe production of coal mine and at the same time improve the abilities to make
decisions. Fire happens frequently in coal mines. So it can assessed spontaneous combustion
risk using GIS tools.(Kun Fang, GIS Network Analysis in Rescue of Coal Mine)
22. Assets Management and Maintenance: GIS helps organizations to gain efficiency even
in the face of finite resources and the need to hold down the cost. Knowing the population at
risk enables planners to determine where to allocate and locate resources more effectively.

Mr. Pratap Kumar Pradhan, Asst. Prof., Department of Civil Engineering, VSSUT, Burla, Odisha
Operations and maintenance staff can deploy enterprise and mobile workforce. GIS build
mobile applications that provide timely information in the field faster and more accurate work
order processing.
23. GIS for Planning and Community Development: GIS helps us to better understand our
world so we can meet global challenges. Today GIS technology is advancing rapidly, providing
many new capabilities and innovations in planning. By applying known part of science and
GIS to solve unknown part, that helps to enhance the quality of life and achieve a better future.
Creating and applying GIS tools and knowledge allow us integrating geographic intelligence
into how we think and behave.
24. GIS in Dairy Industry: Geographic Information System is used in a various application
in the dairy industry, such as distribution of products, production rate, location of shops and
their selling rate. These can be monitored by using GIS system. It can be also possible to
understand the demand of milk and milk products in different region. GIS can prove to be
effective tool for planning and decision making for any dairy industry. These advantages has
added new vistas in the field of dairy farm and management.
25. Tourism Information System: GIS provides a valuable toolbox of techniques and
technologies of wide applicability to the achievement of sustainable tourism development. This
provide an ideal platform tools required to generate a better understanding, and can serve the
needs of tourists. They will get all the information on click, measure distance, find hotels,
restaurant and even navigate to their respective links. Information plays a vital role to tourists
in planning their travel from one place to another, and success of tourism industry. This can
bring many advantages for both tourist and tourism department.
26. Irrigation water management: Water availability for irrigation purposes for any area is
vital for crop production in that region. It needs to be properly and efficiently managed for the
proper utilization of water. To evaluate the irrigation performance, integrated use of satellite
remote sensing and GIS assisted by ground information has been found to be efficient
technique in spatial and time domain for identification of major crops and their conditions, and
determination of their areal extent and yield. Irrigation requirements of crop were determined
by considering the factors such as evapotranspiration, Net Irrigation Requirement, Field
irrigation Requirement, Gross Irrigation Requirement, and month total volume of water
required, by organizing them in GIS environment.

Mr. Pratap Kumar Pradhan, Asst. Prof., Department of Civil Engineering, VSSUT, Burla, Odisha
27. Fire equipment response distance analysis: GIS can be used to evaluate how far (as
measured as via the street network) each portion of the street network is from a firehouse. This
can be useful in evaluating the best location for a new firehouse or in determining how well
the fire services cover particular areas for insurance ratings.(Himachal Pradesh, Development
Report)
28. Worldwide Earthquake Information System: One of the most frightening and
destructive phenomena of nature is the occurrence of an earthquake. There is a need to have
knowledge regarding the trends in earthquake occurrence worldwide. A GIS based user
interface system for querying on earthquake catalogue will be of great help to the earthquake
engineers and seismologists in understanding the behavior pattern of earthquake in spatial and
temporal domain. (A. M. Chandra, S. K. Ghosh Remote Sensing and Geographical Information
System)
29. Volcanic Hazard Identification: Volcanic hazard to human life and environment include
hot avalanches, hot particles gas clouds, lava flows and flooding. Potential volcanic hazard
zone can be recognized by the characteristic historical records of volcanic activities, it can
incorporate with GIS. Thus an impact assessment study on volcanic hazards deals with
economic loss and loss of lives and property in densely populated areas. The GIS based
platforms enables us to find out the damage and rapid response against volcanic activities may
helps to reduce the effect in terms of wealth and health of people.
30. Energy Use Tracking and Planning: GIS is a valuable tool that helps in the planning
organizing and subsequent growth in the energy and utilities industries. The effective
management of energy systems is a complex challenge. GIS has enormous potential for
planning, design and maintenance of facility. Also it provide improved services and that too
cost effectively.

Mr. Pratap Kumar Pradhan, Asst. Prof., Department of Civil Engineering, VSSUT, Burla, Odisha
31. GIS for Fisheries and Ocean Industries: GIS tools add value and the capability to ocean
data. ArcGis is used to determine the spatial data for a fisheries assessment and management
system. It is extensively used in the ocean industry area and we get accurate information
regarding various commercial activities. To enhance minimizing cost for the fishing industry.
Also it can determine the location of illegal fishing operations.
32. Monitor Rangeland Resources: GIS is a valuable tool used to monitor the changes of
rangeland resource and for evaluating its impact on environment, livestock and wild life.
Accurate observation and measurements are to be made to find out the changes in the rangeland
conditions. GIS is also used to monitoring ecological and seasonal rangeland conditions.
33. Reservoir Site Selection: GIS is used to find a suitable site for the dam. GIS tries to find
best location that respect to natural hazards like earthquake and volcanic eruption. For the
finding of dam site selection the factors include economic factors, social considerations,
engineering factors and environmental problems. This all information are layered in the GIS.
34. Forest Fire Hazard Zone Mapping: Forest is one of the important element of the nature.
It plays an important role in the local climate. Forest fires caused extensive damage to our
communities and environmental resource base. GIS can effectively use for the forest fire hazard
zone mapping and also for the loss estimation. GIS also help to capture real time monitoring
of fire prone areas. This is achieved by the help of GNSS and satellite Remote Sensing.
35. Pest Control and Management: Pest control helps in the agricultural production.
Increasing in the rate of pest and weeds can lead to decrease in the crop production. Therefore
GIS plays an important role to map out infested areas. This leads in the development of weed
and pest management plan.
36. Traffic Density Studies: GIS can effectively use for the management of traffic problems.
Today’s population along with the road traffic is increasing exponentially. The advantage of
GIS make it an attractive option to be used to face the emerging traffic problems. By creating
an extensive database that has all the traffic information such as speed data, road geometry,
traffic flow and other spatial data and processing this information will provide us the graphical
bigger picture for the traffic management.

Mr. Pratap Kumar Pradhan, Asst. Prof., Department of Civil Engineering, VSSUT, Burla, Odisha
37. Deforestation: Nowadays forest area is decreasing every year, due to different activities.
GIS is used to indicate the degree of deforestation and vital causes for the deforestation process.
GIS is used to monitor deforestation.
38. Space Utilization: GIS helps managers to organize and spatially visualize space and how
it can best be used. Operational costs can be decreased by more efficiently using space
including managing the moves of personal and assets as well as the storage materials. The 3D
visualization in GIS platforms helps planers to create a feeling of experience like virtual walk
inside the building and rooms before construction.
39. Desertification: Desertification is the land degradation due to climatic variations or human
activities. GIS can provide the information of degraded land which can be managed by
governmental agencies or by the communities themselves. GIS plays a vital role to reduce the
desertification, the local governments are now widely depends on GIS for reducing
desertification. With location based GIS analysis we can find where or which area is suitable
for planting new vegetation and which area for the pipeline construction.
40. Disaster and Business Continuity Planning: Viewing building and locations assets along
with emergency information such as weather patterns, and disaster zones, can provide
organizations the required information to make better decision. GIS provide holistic
understanding of facility status and performance, and brings together department, business
systems, and data source for a comprehensive view into and throughout the organization.
(Faisal I. Al-Shukri, GIS Utilization in Facility Management)
41. GIS for Business: GIS is also used for managing business information based on its
location. GIS can keep a track of where the customers are located, site business, target
marketing campaigns, and optimize sales territories and model retail spending patterns. Such
an added advantage is provided by the GIS to enhance in making companies more competitive
and successful. (Sita Mishra, GIS in Indian Retail Industry-A Strategic Tool)
42. Utilities: The GIS is used for different type of utilities like electricity, telecom and cooking
gas on a daily basis and utilities to help them in mapping, in inventory systems, track
maintenance, monitor regulatory compliance or model distribution analysis, transformer
analysis and load analysis.( Gulzara Mamazhakypova)

Mr. Pratap Kumar Pradhan, Asst. Prof., Department of Civil Engineering, VSSUT, Burla, Odisha
43. Lease Property and Management: Revenue can be increased, operations and
maintenance cost can be reduced when GIS is used to help manage space. Real estate and
property managers can see and make queries about space including its availability, size and
special constraints for the most cost effective use.
44. Development of Public Infrastructure Facilities: GIS has many uses and advantages in
the field of facility management. GIS can be used by facility managers for space management,
visualization and planning, emergency and disaster planning and response. It can be used
throughout the life cycle of a facility from deciding where to build to space planning. Also it
provides facilitate better planning and analysis.(Gulzara Mamazhakypova)
45. GIS for Drainage Problems in Tea Plantation Areas: Drainage problem in tea plantation
differ widely because of its varied nature of physical conditions. Tea crop requires moisture at
adequate levels all times of its growth. Any variation either excess or lack has a direct impact
on the tea yield. This become greatly influenced the productivity of tea. Required some
hydraulic design to solve this problem such as design of drains, checking the adequacy of the
river and classification of water logged areas etc. GIS helps to reduce the water logging by
establishing well developed plans.
46. Collection of Information about Geographic Features: GIS is not simply a computer
system used for making maps. A map is simply the most common way of reporting information
from a GIS database. So these systems are not only for creating maps but also most importantly

Mr. Pratap Kumar Pradhan, Asst. Prof., Department of Civil Engineering, VSSUT, Burla, Odisha
the collection of information about the geographic features such as building, roads, pipes,
streams, ponds and many more that are located in your community.
47. GIS for Public Health: GIS provides the cost effective tool for evaluating interventions
and policies potentially affecting health outcomes. GIS analysis, environmental health data is
also helpful in explaining disease patterns of relationships with social, institutional,
technological and natural environment. It can be understand the complex spatial temporal
relationship between environmental pollution and disease, and identifying exposures to
environmental hazards. GIS can significantly add value to environmental and public health
data.(The application of GIS in environmental health sciences: opportunities and limitations.)
48. Location Identification: This technique is used to find a location for a new retail outlet. It
helps to find out what exists at a particular location. A location can be described in many ways,
using, for instance, name of place, post code, or geographic reference such as longitude or
latitude or X/Y.
49. Knowledge Based System for Defense Purpose: Regular analysis of terrain is essential
for today’s fast paced battlefield. Conventional method of studying paper topographical maps
is being replaced by use of maps in digital form to get terrain information. It is increasingly
being used to derive terrain information from digital images. Which help to the selection of
suitable sites for various military uses more accurate and faster. The uses of GIS provide
information regarding the terrain features which can be useful for planning today’s war
strategies.

Mr. Pratap Kumar Pradhan, Asst. Prof., Department of Civil Engineering, VSSUT, Burla, Odisha
50. Pipeline Route Selection: Pipeline route planning and selection is usually a complex task.
GIS technology is faster, better and more efficient in this complex task. Accurate pipeline route
selection brings about risk and cost reduction as well as better decision making process. GIS
least cost path analysis have been effectively used to determine suitable oil and gas pipeline
routes. An optimal route will minimize reduce economic loss and negative socio-environmental
impacts.
51. Producing Mailing Labels for abutter Notification: Zoning board of appeals hearings or
proposed action by a town or city require notifying abutting property owners. A GIS application
for producing abutter mailing labels enables you to identify abutting property owners are in
different ways. Once the properties are identified this kind of GIS applications can produce
mailing labels and be integrated with a word processing “mail merge .“
52. Site Suitability for Waste Treatment Plant: There is an increasing amount of waste due
to the over population growth. This has negative impact on the environment. With the help of
GIS we can integrate various aspect layers in GIS and can identify which place is suitable for
waste treatment plant. This process will reduce the time and it is cost effective. Also it enhances
the accuracy. It provides a GIS analyst to identify a list of suitable dumping sites for further
investigations. It also provides a digital bank for future monitoring program of the site.

Mr. Pratap Kumar Pradhan, Asst. Prof., Department of Civil Engineering, VSSUT, Burla, Odisha
53. Geologic Mapping: GIS is an effective tool in geological mapping. It becomes easy for
surveyors to create 3D maps of any area with precise and desired scaling. The results provide
accurate measurements, which helps in several field where geological map is required. This is
cost effective and offers more accurate data, there by easing the scaling process when studying
geologic mapping.
54. Environment: The GIS is used every day to help protect the environment. The
environmental professional uses GIS to produce maps, inventory species, measure
environmental impact, or trace pollutants. The environmental applications for GIS are almost
endless. It can be used to monitor the environment and analyze changes.(by S Farog Mostafa)
55. Infrastructure Development: Advancement and availability of technology has set a new
mark for professionals in the infrastructure development area. Now more and more
professionals are seeking help of these technologically smart and improved information
systems like GIS for infrastructure development. Each and every phase of infrastructure life
cycle is greatly affected and enhanced by the enrollment of GIS.
56. Coastal Development and Management: The coastal zone represents varied and highly
productive ecosystem such as mangrove, coral reefs, see grasses and sand dunes. GIS could be
generating data required for macro and micro level planning of coastal zone management. GIS
could be used in creating baseline inventory of mapping and monitoring coastal resources,
selecting sites for brackish water aquaculture, studying coastal land forms.

Mr. Pratap Kumar Pradhan, Asst. Prof., Department of Civil Engineering, VSSUT, Burla, Odisha
57. Crime Analysis: GIS is a necessary tool for crime mapping in law enforcement agencies
worldwide. Crime mapping is a key component of crime analysis. Satellite images can display
important information about criminal activities. The efficiency and the speed of
the GIS analysis will increase the capabilities of crime fighting.
58. River Crossing Site Selection for Bridges: The important geotechnical consideration is
the stability of slope leading down to and up from the water crossing. It is advisable to collect
historical data on erosion and sedimentation. On the basis of these information asses the amount
of river channel contraction, degree of curvature of river bend, nature of bed and bank materials
including the flood flow and the flow depth, all these can be done in GIS within estimated time
and accurately. This information has been often used for river crossing site selection for
bridges.
59. Land Use Changes Associated with Open Cast Strip Mining: Mining is the back bone
of the developing economy of any country. Mapping, monitoring and controlling the impact
caused by the mining activities is necessary so as to understand the character and magnitude of
these hazardous events in an area. The data required to understand the impact of mining from
the environment is coming from different discipline, which need integration in order to arrive
hazard map zonation.
60. Economic Development: GIS technology is a valuable tool used for the economic
development. It helps in site selection, suitability analysis, and for finding the right sites to
locate new business and grow existing ones. Within economic development, GIS is used to
support the emerging trend of economic gardening, a new way to foster local and regional
economic growth by existing small business in the community.( By Ahmed Abukhater,GIS for
Planning and Community Development: Solving Global Challenges)

Mr. Pratap Kumar Pradhan, Asst. Prof., Department of Civil Engineering, VSSUT, Burla, Odisha
61. School Student Walking Distance Analysis: If your community buses students to school,
but only if they lived beyond a certain distance from their school, this can be used to determine
what addresses are eligible for busing.
62. Locating Underground Pipes and Cables: Pipe line and cable location is essential for
leak detection. It can be used to understand your water network, conducting repairs and
adjustments, locating leaks known distance for correlating etc. Pipelines are continually
monitored, check for leak detection and avoid the problem of geo hazards.
63. Coastal Vegetation Mapping and Conservation: Coastal vegetation like Mangroves are
the protectors of coast from natural hazards like tsunami , so that the conservation of these
vegetation are highly important. GIS enable us to map which are having higher density of
vegetation and which area need more vegetated? Integration of these details to coastal zone
mapping helps to identify the area prone to coastal erosion and we can plant more vegetation
to reduce coastal erosion.
64. Regional Planning: Every day, planners use Geographic Information System (GIS)
technology to research, develop, implement, and monitor the progress of their plans. GIS
provides planners, surveyors, and engineers with the tools they need to design and map their
neighborhoods and cities. Planners have the technical expertise, political savvy, and fiscal
understanding to transform a vision of tomorrow into a strategic action plan for today, and they
use GIS to facilitate the decision-making process. (ESRI, GIS Solutions for Urban and
Regional Planning)

Mr. Pratap Kumar Pradhan, Asst. Prof., Department of Civil Engineering, VSSUT, Burla, Odisha
65. GIS for Land Administration: In a number of countries, the separate functions of land
administration are being drawn together through the creation of digital cadastral databases,
with these database they can reuse land for suitable needs ,digital taxation and even utilities are
also easily handle using these database.
66. Snow Cover Mapping and Runoff Prediction: Systematic, periodical and precise snow
cover mapping supported by GIS technology, and the organization of the results in a snow
cover information system forms the basis for a wide range of applications. On the practical
side, these applications are related to the monitoring of seasonal and yearly alterations of the
snow cover under the presently existing climatic conditions, to simulate and forecast runoff, to
map the regional distribution of the water equivalent, and to document the recession process of
the snow cover during the melting period in its relation to geological features.
67. GIS for Wildlife Management: Man made destruction such as habitat loss, pollution,
invasive species introduction, and climate change, are all threats to wildlife health and
biodiversity. GIS technology is an effective tool for managing, analyzing, and visualizing
wildlife data to target areas where international management practices are needed and to
monitor their effectiveness. GIS helps wildlife management professionals examine and
envision.

Mr. Pratap Kumar Pradhan, Asst. Prof., Department of Civil Engineering, VSSUT, Burla, Odisha
1. List out the merits of remote sensing.
2. Write down the disadvantages of remote sensing data.
3. Write short note on the application of remote sensing for costal studies.
4. Write all the advantages and disadvantages of remote sensing.
5. Write the remote sensing applications for water resource mapping.
6. Define GIS. What are the key components of GIS? Write functions of GIS.
7. State the use of GIS in various field.
Electronic Distance Measuring (EDM):
EDMIs were first introduced in 1950's by Geodimeter Inc. Early instruments were large,
heavy, complicated and expensive. Improvements in electronics have given lighter,
simpler, and less expensive instruments. EDM can be manufactured for use with
theodolites (both digital and optical) or as an independent unit. These can be mounted on
standard units or theodolites or can also be tribrach mounted.
The electronic methods depend on the value of velocity of Electromagnetic radiation
(EMR), which itself is dependent upon measurement of distance and time. Hence, there is
no inherent improvement in absolute accuracy by these methods. The advantage is mainly
Question Bank Remote Sensing and GIS
Module – IV (8 Hours)
Electronic distance measurement, Total Station, Global Positioning System.

Mr. Pratap Kumar Pradhan, Asst. Prof., Department of Civil Engineering, VSSUT, Burla, Odisha
functional - precise linear measurement can now be used for longer base lines, field
operations can be simplified and trilateration can replace or augment triangulation.
Principle of EDM:
The general principle involves sending a modulated Electro-magnetic (EM) beam from one
transmitter at the master station to a reflector at the remote station and receiving it back at the
master station. The instrument measures slope distance between transmitter and receiver by
modulating the continuous carrier wave at different frequencies, and then measuring the phase
difference at the master station between the outgoing and the incoming signals. This establishes
the following relationship for a double distance (2D):
Where,
m is unknown integer number of complete wavelengths contained within double distance
Φ is the measured phase difference
λ is modulation wavelength, and
k is constant.

Mr. Pratap Kumar Pradhan, Asst. Prof., Department of Civil Engineering, VSSUT, Burla, Odisha
There are basically two methods of measurement:
I. Pulse techniques: All such measurements incorporate a very precise measurement of time usually expressed
in units of nanoseconds (1x10⁻⁹ s), which a EM wave takes to travel from one station to
another. In this method, a short, intensive pulse radiation is transmitted to a reflector target,
which is immediately transmitted back to the receiver. As shown in Figure given below, the
distance (D) is computed as the velocity of light (V) multiplied by half the time (Δt/2) the
pulse took to travel back to the receiver (D = V x Δt/2).
II. Phase difference techniques
The relationship between wavelength and associated phase difference, which shows that for a
given complete cycle of EM wave, the phase difference can be expressed both in terms of
angular (degrees) and linear (fraction of wavelengths) units. In phase difference method used
by majority of EDMI, the instrument measures the amount δλ by which the reflected signal is
out of phase with the emitted signal.
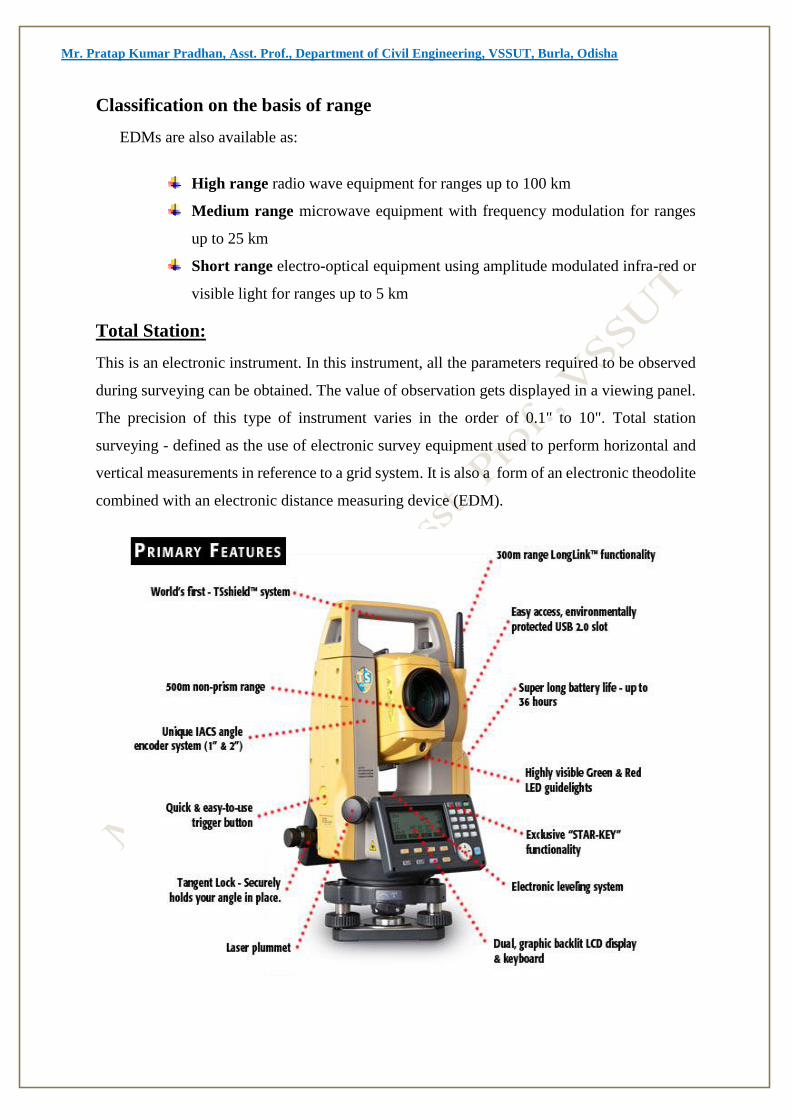
Mr. Pratap Kumar Pradhan, Asst. Prof., Department of Civil Engineering, VSSUT, Burla, Odisha
Classification on the basis of range
EDMs are also available as:
High range radio wave equipment for ranges up to 100 km
Medium range microwave equipment with frequency modulation for ranges
up to 25 km
Short range electro-optical equipment using amplitude modulated infra-red or
visible light for ranges up to 5 km
Total Station:
This is an electronic instrument. In this instrument, all the parameters required to be observed
during surveying can be obtained. The value of observation gets displayed in a viewing panel.
The precision of this type of instrument varies in the order of 0.1" to 10". Total station
surveying - defined as the use of electronic survey equipment used to perform horizontal and
vertical measurements in reference to a grid system. It is also a form of an electronic theodolite
combined with an electronic distance measuring device (EDM).
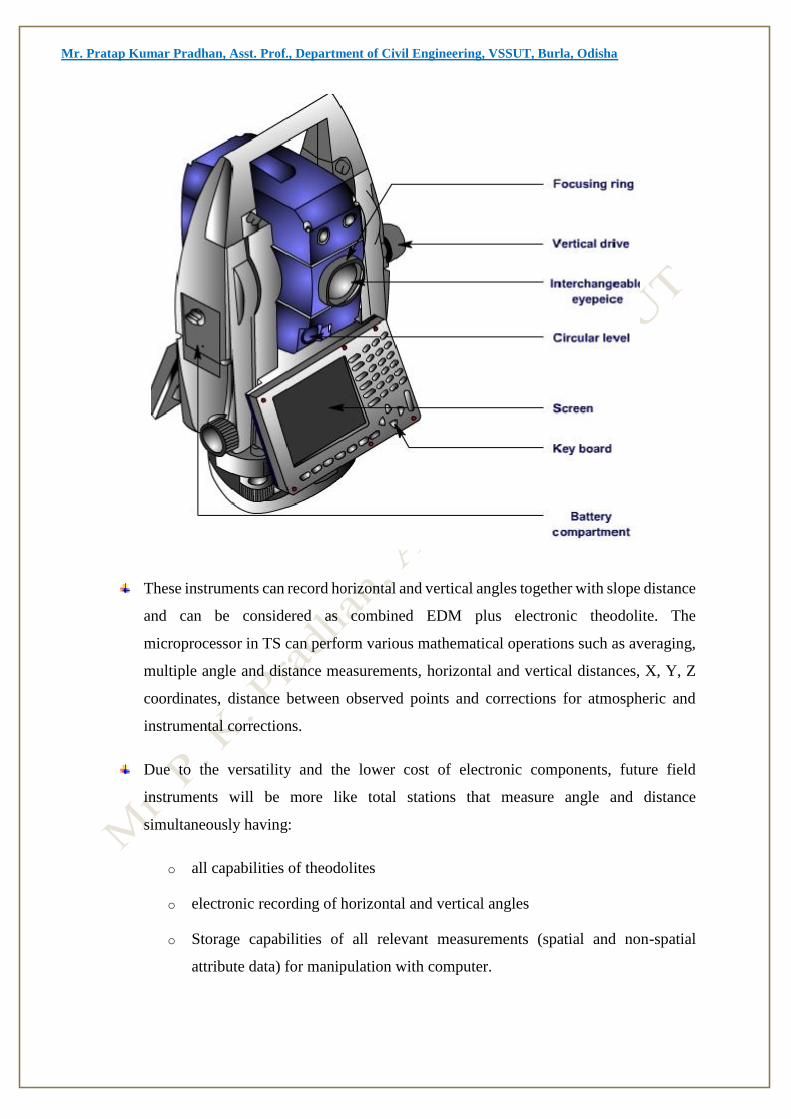
Mr. Pratap Kumar Pradhan, Asst. Prof., Department of Civil Engineering, VSSUT, Burla, Odisha
These instruments can record horizontal and vertical angles together with slope distance
and can be considered as combined EDM plus electronic theodolite. The
microprocessor in TS can perform various mathematical operations such as averaging,
multiple angle and distance measurements, horizontal and vertical distances, X, Y, Z
coordinates, distance between observed points and corrections for atmospheric and
instrumental corrections.
Due to the versatility and the lower cost of electronic components, future field
instruments will be more like total stations that measure angle and distance
simultaneously having:
o all capabilities of theodolites
o electronic recording of horizontal and vertical angles
o Storage capabilities of all relevant measurements (spatial and non-spatial
attribute data) for manipulation with computer.

Mr. Pratap Kumar Pradhan, Asst. Prof., Department of Civil Engineering, VSSUT, Burla, Odisha
Nowadays surveying systems are available which can be use in an integrated manner
with Global Positioning System (GPS). Hence, future theodolites/total stations may
have integrated GPS receivers as part of the measurement unit.
Advantages of Total Station:
Relatively quick collection of information
Multiple surveys can be performed at one set-up location.
Easy to perform distance and horizontal measurements with simultaneous calculation
of project coordinates (Northings, Eastings, and Elevations).
Layout of construction site quickly and efficiently.
Digital design data from CAD programs can be uploaded to data collector.
Daily survey information can also be quickly downloaded into CAD which eliminates
data manipulation time required using conventional survey techniques.
Disadvantages of Total Station:
Vertical elevation accuracy not as accurate as using conventional survey level and rod
technique.
Horizontal coordinates are calculated on a rectangular grid system. However, the real
world should be based on a spheroid and rectangular coordinates must be transformed
to geographic coordinates if projects are large scale.
Examples: highways, large buildings, etc.
As with any computer-based application “Garbage in equals Garbage out”. However,
in the case of inaccurate construction surveys “Garbage in equals lawsuits and
contractors claims for extras.”
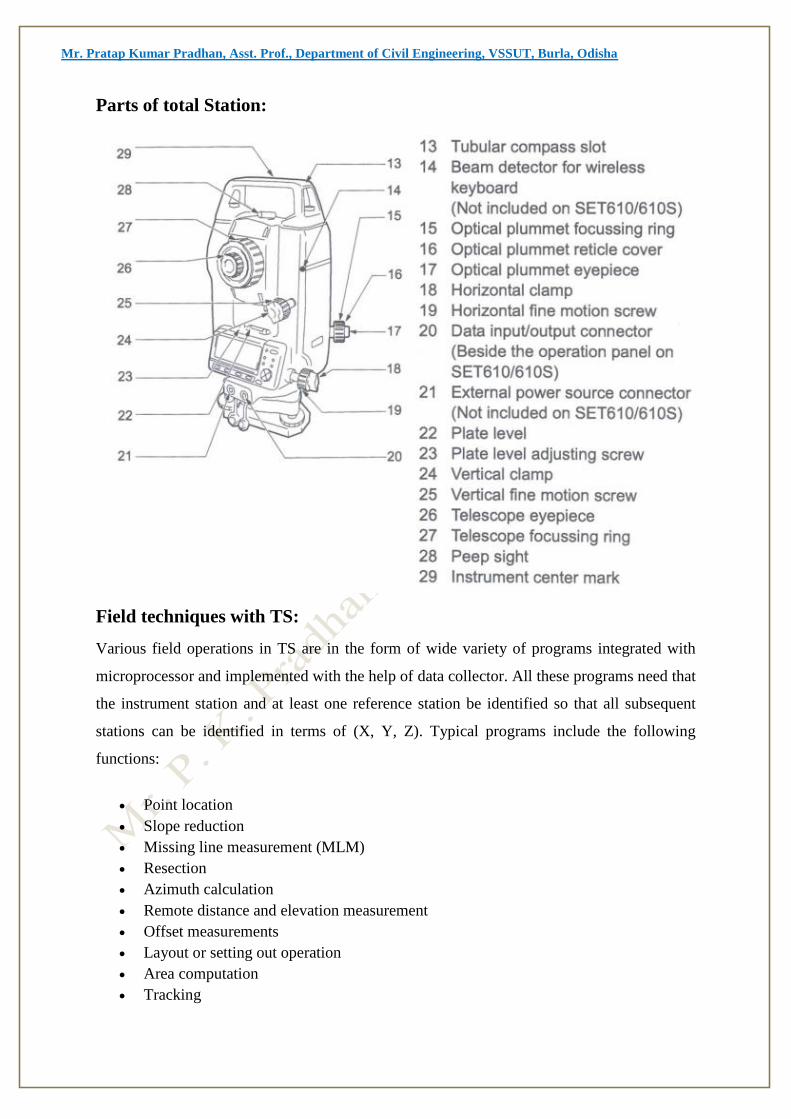
Mr. Pratap Kumar Pradhan, Asst. Prof., Department of Civil Engineering, VSSUT, Burla, Odisha
Parts of total Station:
Field techniques with TS:
Various field operations in TS are in the form of wide variety of programs integrated with
microprocessor and implemented with the help of data collector. All these programs need that
the instrument station and at least one reference station be identified so that all subsequent
stations can be identified in terms of (X, Y, Z). Typical programs include the following
functions:
Point location
Slope reduction
Missing line measurement (MLM)
Resection
Azimuth calculation
Remote distance and elevation measurement
Offset measurements
Layout or setting out operation
Area computation
Tracking

Mr. Pratap Kumar Pradhan, Asst. Prof., Department of Civil Engineering, VSSUT, Burla, Odisha
FUNCTIONS PERFORMED BY TOTAL STATIONS
Total Stations, with their microprocessors, can perform a variety of functions and
computations, depending on how they are programmed. The capabilities vary with different
instruments, but some standard computations include:
Averaging multiple angle and distance measurements.
Correcting electronically measured distances from prism constant, atmospheric
pressure, and temperature.
Making curvature and refraction corrections to elevations determine by
trigonometric levelling.
Reducing slope distances to their horizontal and vertical components.
Calculating point elevations from the vertical distance components
(supplemented with keyboard input of instrument and reflector heights).
Computing coordinates of survey points from horizontal angle and horizontal
distance.
Averages multiple angle measurements.
Averages multiple distance measurements.
Computes horizontal and vertical distances.
Corrections for temp, pressure and humidity.
Computes inverses, polars, resections.
Computes X, Y and Z coordinates.
Applications of Total Station
There are many other facilities available, the total station can be used for the following
purposes.
Detail survey i.e., data collection.
Control Survey (Traverse).
Height measurement (Remove elevation measurement- REM).
Fixing of missing pillars (or) Setting out (or) Stake out.
Resection.
Area calculations, etc.
Remote distance measurement (RDM) or Missing line measurement (MLM).

Mr. Pratap Kumar Pradhan, Asst. Prof., Department of Civil Engineering, VSSUT, Burla, Odisha
Global Positioning System:
History:
The GPS project was launched in the United States in 1973 to overcome the limitations of
previous navigation systems,[11] integrating ideas from several predecessors, including a
number of classified engineering design studies from the 1960s. The U.S. Department of
Defense developed the system, which originally used 24 satellites. It was initially developed
for use by the United States military and became fully operational in 1995. Civilian use was
allowed from the 1980s. Roger L. Easton of the Naval Research Laboratory, Ivan A.
Getting of The Aerospace Corporation, and Bradford Parkinson of the Applied Physics
Laboratory are credited with inventing it.
The design of GPS is based partly on similar ground-based radio-navigation systems, such
as LORAN and the Decca Navigator, developed in the early 1940s.
Introduction:
Official name of GPS is Navigational Satellite Timing And Ranging Global Positioning
System (NAVSTAR GPS)
Global Positioning Systems (GPS) is a form of Global Navigation Satellite System
(GNSS)
GPS is funded and controlled by the U. S. Department of Defense (DOD). While there
are many thousands of civil users of GPS world-wide, the system was designed for and
is operated by the U. S. military.
The GPS receivers convert the satellite's signals into position, velocity, and time
estimates for navigation, positioning, or geodesy.
Four GPS satellite signals are used to compute positions in three dimensions and the
time offset in the receiver clock.
GPS units are becoming smaller and less expensive, there are an expanding number of
applications for GPS. In transportation applications, GPS assists pilots and drivers in
pinpointing their locations and avoiding collisions.
GPS can provide accurate positioning 24 hours a day, anywhere in the world.
Uncorrected positions determined from GPS satellite signals produce accuracies in the

Mr. Pratap Kumar Pradhan, Asst. Prof., Department of Civil Engineering, VSSUT, Burla, Odisha
range of 50 to 100 meters. When using a technique called differential correction, users
can get positions accurate to within 5 meters or less.
Billions and billions of dollars have been invested in creating this technology for
military uses. However, over the past several years, GPS has proven to be a useful tool
in non-military mapping applications as well.
The Term GPS stands for Global Positioning System. The GPS is used to locate a
location with the help of Latitude and Departure. with the help of GPS it’s possible to
locate a point very precisely. GPS consist Of two main ends, the one is the Locating
Sattelites and the other is the Receiver. Most of the people now a days are familier with
GPS due to the huge use of Smart Phones.
Advantages
It helps to survey with many times greater Precision.
It helps to complete a Survey with lesser time and thus helps to cut down the
Completion Period.
It Reduces the Difficulty of taking manual measurements to great extent.
With GPS there is a very less chances of error. And this error may come only due to
the Instrument malfunction.
Disadvantages
The main Disadvantage is that, it requires high initial investments.
To conduct such High End Survey works and to operate such Electronic Equipments
much skilled persons are required.
Application of GPS:
Some of these applications are:
Establishment of high precision zero order Geodetic National Survey Control Network
of GPS stations.
Strengthening, densification and readjustment of existing Primary Control Networks
using GPS stations.
Connecting remote islands to mainland Geodetic Control Networks.
Determination of a precise geoid using GPS data.

Mr. Pratap Kumar Pradhan, Asst. Prof., Department of Civil Engineering, VSSUT, Burla, Odisha
Earth rotation and Polar Motion Studies from GPS data.
Estimating gravity anomalies using GPS.
Marine Geodesy: positioning of oceanic stations, buoys etc.
Earthquake monitoring: Crustal movements of the order of few cm/year can be
monitored using GPS method, thus making GPS most suitable for monitoring
continental drifts, seism tectonic movement, etc.
Vertical Control Network : High accuracy of few mm in heights achievable with GPS
at much less cost and time compared to levelling to make GPS method most suitable
for establishing lower accuracy vertical control networks.
Geophysical positioning, mineral exploration and mining.
Survey control for topographical and cadastral surveys.
Ground control for photogrammetric control surveys and mapping.
Offshore positioning: Shipping, offshore platforms, fishing boats etc.
Instantaneous time transfer over trans-continental distances with accuracies of few
nano seconds.
Space craft tracking: Vector separation between GPS satellites and any other satellites
can be monitored by GPS, e.g., pinpointing the location of LANDSAT etc.
General aircraft navigation, approach to runways, navigation/positioning in remote
areas like deserts, dense jungles, shaded areas of microwave, precise sea navigation,
approach to harbours etc. It is expected that in 1990s most civilian aircrafts, ships,
boats will be fitted with GPS equipment’s and even hikers, boat and car owners, truck
drivers will be using it extensively.,
Military ; Improved weapon delivery accuracies i.e. for missiles etc., for ranging in
artillery, navigation for Army, Navy, Airforce - thus affecting ultimate saving of upto
1billion dollars annually on navigation in U.S.A.
Scientific applications, like studies related to the ionosphere and troposphere,
glaciology, etc.

Mr. Pratap Kumar Pradhan, Asst. Prof., Department of Civil Engineering, VSSUT, Burla, Odisha
1. Explain Ideal Remote Sensing with neat sketch.
2. Write the application of GPS and Total Station.
3. Explain the basic principle of EDM. Write a brief note on Electromagnetic spectrum.
4. Write a short note on Global Positioning System.
5. Illustrate some examples of EDM?
6. The majority of short range EDM equipment measures the difference in phase of
transmitted and reflected light waves on two different frequencies 15 MHz and 150 KHz
in order to obtain the distance. Taking the velocity of light as 3×10⁸ m/s and measures a
distance of 324.63m. Show the computational processes necessary to obtain this distance,
clearly illustrating the phase difference technique.
7. Write the advantages and disadvantages of Total Station.
Question Bank of EDM, Total Station and GPS