mr. steve turek phone: 952-447-6064 wind turbine ... · wind turbine industries corporation (wtic)...
TRANSCRIPT

3933 US Route 11 Cortland, NY 13045 Telephone: (607) 753-6711 Facsimile: (607) 753-1045 www.intertek.com
Page 1 of 54 This report is for the exclusive use of Intertek’s Client and is provided pursuant to the agreement between Intertek and its Client. Intertek’s responsibility and liability are limited to the terms and conditions of the agreement. Intertek assumes no liability to any party, other than to the Client in accordance with the agreement, for any loss, expense or damage occasioned by the use of this report. Only the Client is authorized to permit copying or distribution of this report and then only in its entirety. Any use of the Intertek name or one of its marks for the sale or advertisement of the tested material, product or service must first be approved in writing by Intertek. The observations and test results in this report are relevant only the sample tested. This report by itself does not imply that the material, product or service is or has ever been under an Intertek certification program.
Intertek Testing Services NA, Inc. SD 12.1.2 (11/11/10) Informative
March 30th, 2012 Letter Report No. 100413407CRT-004 Project No. G100413407 Mr. Steve Turek Phone: 952-447-6064 Wind Turbine Industries, Corporation Fax: 952-447-6050 16801 Industrial Cir SE email: [email protected] Prior Lake, MN 55372-3307 Subject: Power performance test report for the Jacobs 31-20 Wind Energy System tested at the Intertek Small
Wind Regional Test Center (RTC). Dear Mr. Turek, This Test Report represents the results of the evaluation and tests of the above referenced equipment under Intertek Project No. G100413407, as part of the NREL Subcontract Agreement No. AEE-0-40878-02, to the requirements contained in the following standard:
AWEA 9.1 Small Wind Turbine Performance and Safety Standard December 2009 IEC 61400-12-1 Wind Turbines - Part 12-1: Power performance measurements of electricity producing wind turbines; December 2005
This investigation was authorized through signed Intertek Quote No. 500304911, dated May 13th, 2011. A production sample was installed at the Intertek RTC on October 25th, 2011. Power performance testing began on December 1st, 2011 and data collection continued through February 29th, 2012. This Test Report completes the power performance testing phase of the Jacobs 31-20 Wind Energy System under Intertek Project No. G100413407. If there are any questions regarding the results contained in this report, or any of the other services offered by Intertek, please do not hesitate to contact the undersigned. Please note, this Test Report on its own does not represent authorization for the use of any Intertek certification marks. Completed test reports for Duration, Acoustics, and Strength and Safety are required to complete the AWEA certification process.
Completed by: Joseph M Spossey Reviewed by: Tom Buchal Title: Project Engineer Title: Senior Staff Engineer
Signature: Signature
Wind Turbine Industries, Corporation Letter Report 100413407CRT-004 March 30th, 2012
Page 2 of 54 Intertek Testing Services NA, Inc. SD 12.1.2 (11/11/10) Informative
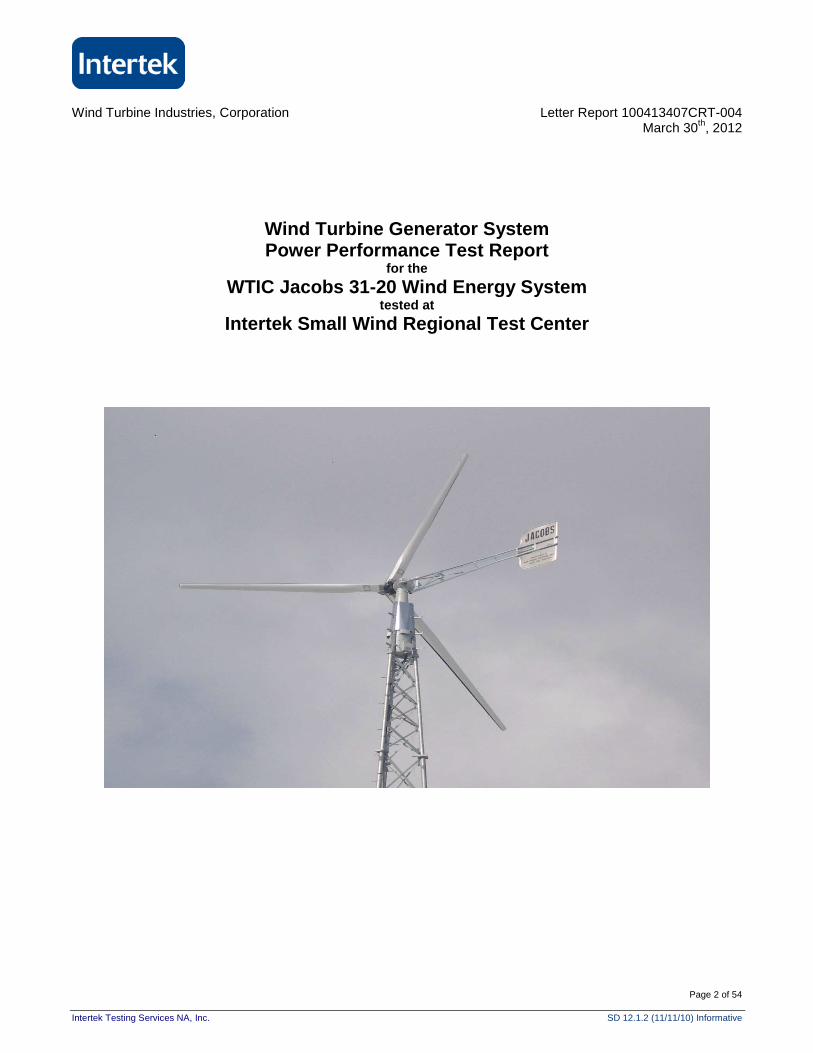
Wind Turbine Generator System Power Performance Test Report
for the
WTIC Jacobs 31-20 Wind Energy System tested at
Intertek Small Wind Regional Test Center

Wind Turbine Industries, Corporation Letter Report 100413407CRT-004 March 30th, 2012
Page 3 of 54 Intertek Testing Services NA, Inc. SD 12.1.2 (11/11/10) Informative
1.0 Background This test is conducted as part of the Department of Energy / National Renewable Energy Laboratory (DOE/NREL) Subcontract Agreement No. AEE-0-40878-02 for the testing of small wind turbines at regional test centers. The Wind Turbine Industries Corporation (WTIC) Jacobs 31-20 Wind Energy System was accepted into this program by Intertek and DOE/NREL. The full scope of type testing and AWEA Certification provided by Intertek for the Jacobs 31-20 horizontal-axis wind turbine is covered by this agreement. This test report is a summary of the results of power performance testing, and is one of four tests to be performed on the Jacobs 31-20 turbine; the other three being duration, safety and function, and acoustics. Results for these other tests are summarized in their respective Test Reports. The Jacobs 31-20 turbine is installed at Test Station #5 at the Intertek RTC in Otisco, NY. The Jacobs 31-20 is designed for grid-connected power delivery, with a maximum power output of 20 kW. It is designed as a Class II upwind turbine, with speed and power control through side furling and a centrifugal variable pitch governor. The blades of the Jacobs 31-20 drive the low speed shaft of an offset hypoid gearbox with 6.1:1 ratio. The gearbox high-speed shaft drives a brushless three-phase AC synchronous generator with outbound exciter. The generator is rated for 40-180 VAC operation up to 25 kVA. Grid interconnect is provided by a Nexus Nex20 inverter, which fully converts the generator output to single phase 240 VAC for connection to a single/split phase grid. The Nex20 inverter is specifically designed for the Jacobs 31-20 Wind Energy System. The test tower and foundation were designed and approved by ROHN Products LLC. NYS Professional Engineer stamped tower and foundation designs were also provided by ROHN Products LLC. The designs were based off of the Subsurface Investigation and Geotechnical Evaluation detailed in Atlantic Testing Laboratories report number CD3119E-01-05-10 for the Intertek RTC. The electrical network at the testing location is single/split phase 120/240 VAC at 60 Hz. Refer to the wiring diagram in Appendix A for additional detail. A summary of the test turbine configuration and manufacturer’s declared ratings can be found in Table 1 below.
2.0 Test Objective The purpose of this test is to quantify the power performance characteristics of the Jacobs 31-20 turbine shown on Page 2, and described in detail in Table 1. These characteristics are primarily defined by the measured power curve, which provides the basis for estimates on Annual Energy Production. The power curve is determined by simultaneous measurements of turbine output power and wind speed for a given period of time. The required database is sufficient to understand the power performance characteristics of the Jacobs 31-20 in real world free-stream airflow.
3.0 Test Summary This test was conducted in accordance with the American Wind Energy Association Small Wind Turbine Performance and Safety Standard dated December, 2009. The power performance test was also conducted in accordance with the first edition of the International Electrotechnical Commission’s (IEC) Wind Turbines - Part 12-1: Power performance measurements of electricity producing wind turbines, IEC 61400-12-1 Annex H dated December, 2005. Hereafter, these testing standards and their procedures are referred to as the “Standards.” Figure 1 is the summary of results from the power performance test conducted on the Jacobs 31-20 turbine. In Figure 1, power is normalized to sea-level air density. The amount of test data analyzed to produce Figure 1 is sufficient to meet the database requirements of the Standards. Table 1 identifies the configuration of the wind turbine system tested for this report. The power measurement equipment used for measurement of electric power consists of both a current transformer and power transducer used to measure current and voltage to determine electric power output in accordance with the Standards. The location of power measurement equipment encompasses the combined consumption and production of the entire turbine system. Refer to Appendix A for wiring diagrams.

Wind Turbine Industries, Corporation Letter Report 100413407CRT-004 March 30th, 2012
Page 4 of 54 Intertek Testing Services NA, Inc. SD 12.1.2 (11/11/10) Informative
Figure 1 - Power curve summary

Wind Turbine Industries, Corporation Letter Report 100413407CRT-004 March 30th, 2012
Page 5 of 54 Intertek Testing Services NA, Inc. SD 12.1.2 (11/11/10) Informative
Turbine manufacturer and address Wind Turbine Industries, Corporation
16801 Industrial Circle S.E. Prior lake, Minnesota 55372
Model 31-20
Gearbox manufacturer Wind Turbine Industries, Corporation
Model: 20kW, Part Number: 60717-900 Serial Number: 03150030
Gearbox specifications Offset hypoid design 6.1:1 gear ratio
Generator manufacturer Winco Inc; Model 20PS4G-27
WTIC Part Number: 395358-000 Serial #: W2148
Generator specifications 20 kW, 40-180 VAC, 0-40 Hz 3-phase, 450-1050 RPM
Inverter manufacturer Nexus
Model #: NEX20 Serial #: 100
Inverter specifications 20 kW, 240 VAC, 60 Hz TUV listed - UL 1741
Rotor diameter 9.4 m (31.0 ft.) – verified by Intertek Hub height 35.9 m (117.0 ft 8.0 in.) Swept area 70.1 m2 (755.0 ft2 ) IEC 61400-2 SWT Class (I, II, III, or IV) II Tower type(s) Lattice Rated electrical power 20.0 kW Cut-in wind speed 4.5 m/s (10.1 mph) Rated wind speed 11.6 m/s (26.0 mph) Survival wind speed 53.6 m/s (120.0 mph) Rotor speed range 175 – 185 rpm Fixed or variable pitch Variable Number of blades 3 Blade tip pitch angle 1°
Blade manufacturer Advanced Aero Technologies. Inc Fiberglass SNs - 310020CGA1849, 310020CGA1854,
310020CGA1852
Control system software Proprietary System, Horner Display unit HON:1.13, Oztek Control Board DSP:1.03
Table 1 – Test turbine configuration and manufacturer’s declared specifications
4.0 Judgments, Exceptions, and Deviations There were no judgments, exceptions, or deviations from the Standards for the purposes of this test report.

Wind Turbine Industries, Corporation Letter Report 100413407CRT-004 March 30th, 2012
Page 6 of 54 Intertek Testing Services NA, Inc. SD 12.1.2 (11/11/10) Informative
5.0 Test Site Description 5.1 Test Site The RTC has class IV winds, and can accommodate turbines that produce 120V or 240V, 60 Hz power. It is on a hilltop, with previous agricultural land use, near the township of Otisco, NY. It was surveyed, analyzed and developed to be a test site for Intertek’s customers. The Jacobs 31-20 is tested at RTC site #5, which has no prominent obstructions in the valid measurement sector, as determined by obstacle assessment in accordance with the Standards. It was determined that site calibration was necessary due to the topographical variation at the RTC. A site calibration was performed in lieu of the terrain assessment due to known topographical variations. The resulting flow correction factors are applied to a contiguous data set for power performance results. The meteorological equipment tower is due south, 23.6 m (77.5 feet) from the turbine, exactly 2.5 times the diameter of the rotor, as recommended in the Standards. All buildings and potential obstacles are identified in the topographical survey map, and were considered during obstacle assessment. 5.2 Measurement Sector Figure 2 below is a topographical survey map that displays the final valid measurement sector resulting from the combination of obstacle assessment and site calibration in accordance with the Standards. Figure 2 also shows the location of the Jacobs 31-20 and its measurement tower (“Met5”). The preliminary obstacle assessment yielded an initial valid measurement sector of 38 – 322 degrees true, but this was cut to a final valid sector of 230 – 260 degrees true as a result of site calibration. Site calibration was required due to the local terrain not satisfying the criteria within the terrain assessment requirements of the Standards. The shaded area displays the excluded wind sector. A circle indicating 20 rotor diameters is also shown on the map. .

Wind Turbine Industries, Corporation Letter Report 100413407CRT-004 March 30th, 2012
Page 7 of 54 Intertek Testing Services NA, Inc. SD 12.1.2 (11/11/10) Informative
Figure 2 – Topographical survey map and final valid measurement sector of the Jacobs 31-20 test turbine

Wind Turbine Industries, Corporation Letter Report 100413407CRT-004 March 30th, 2012
Page 8 of 54 Intertek Testing Services NA, Inc. SD 12.1.2 (11/11/10) Informative
Table 2 below provides detail on obstacles that were determined to be significant as a result of the obstacle assessment. Based upon the results in Table 2, a valid measurement sector of 38 – 322 degrees true was established prior to site calibration.
Invalid Sector Distance Diameter
Equivalent Bearing Start Stop Description Reference
Point (m) (m) (°true) (°true) (°true)
Jacobs 31-20 Jacobs Met 24.0 9.5 360 323 37
INVALID Sector = 323 37
VALID Sector(s) = 38 322 Table 2 – Obstacles relative to the Jacobs 31-20 and meteorological tower locations
Site calibration was required due to the combination of average slope and terrain variations within 20 rotor diameters of the turbine tower. Table 3 below shows the results of the site calibration for the Jacobs 31-20 power performance test, where:
� “Direction” = each 10-degree wind direction bin, in true degrees, considered during site calibration, � “Total Time” = total number of hours of data collected in each wind direction bin, � “Velocity < 8 m/s” = total number of hours where wind speeds are below 8 m/s in each wind direction bin, � “Velocity > 8 m/s” = total number of hours where wind speeds are above 8 m/s in each wind direction bin, � “Turbine Velocity Average” = average wind speed measured at the turbine location in each wind direction
bin, � “Met5 Velocity Average” = average wind speed measured at the meteorological tower location in each
wind direction bin, � “Ratio” = average flow correction factor due to terrain for each wind direction bin (ratio of wind speed at
the wind turbine location divided by the wind speed at the meteorological tower location), � Red text = INVALID sector resulting from obstacle assessment, � Black text = VALID sector resulting from obstacle assessment, and � Blue shade = FINAL VALID sector resulting from site calibration

Wind Turbine Industries, Corporation Letter Report 100413407CRT-004 March 30th, 2012
Page 9 of 54 Intertek Testing Services NA, Inc. SD 12.1.2 (11/11/10) Informative
Direction Direction Average
Total Time
Velocity < 8 m/s
Velocity > 8 m/s
Turbine Velocity Average
Met5 Velocity Average
Average of Ratios
(°true) (°true) (hours) (hours) (hours) (m/s) (m/s)
0-10 2.82 0.33 0.33 0.00 1.77 1.72 1.0368 10-20 14.08 0.15 0.15 0.00 1.03 0.99 1.0647 20-30 24.38 0.07 0.07 0.00 0.75 0.77 0.9791 30-40 34.36 0.03 0.03 0.00 0.85 0.69 1.2271 40-50 46.78 0.02 0.02 0.00 0.64 0.72 0.8827 50-60 55.78 0.32 0.28 0.03 5.53 5.35 1.0405 60-70 66.50 0.70 0.67 0.03 5.62 5.69 0.9896 70-80 75.93 2.47 1.80 0.67 6.33 6.24 1.0172 80-90 85.63 6.17 3.62 2.55 7.04 7.06 1.0027 90-100 94.85 7.65 4.55 3.10 7.06 7.00 1.0125 100-110 104.95 6.55 5.20 1.35 6.29 6.29 1.0065 110-120 115.46 9.52 7.52 2.00 6.61 6.56 1.0104 120-130 124.54 8.15 6.80 1.35 6.24 6.22 1.0043 130-140 135.42 5.32 4.07 1.25 5.93 6.03 0.9869 140-150 145.94 11.18 6.40 4.78 7.07 7.07 1.0013 150-160 154.73 17.78 10.67 7.12 7.16 7.15 1.0029 160-170 164.01 12.13 6.07 6.07 7.63 7.66 0.9981 170-180 173.97 3.90 2.32 1.58 7.02 7.04 1.0006 180-190 185.88 4.17 3.78 0.38 5.51 5.50 1.0074 190-200 195.91 8.98 6.83 2.15 6.59 6.56 1.0085 200-210 204.86 15.27 8.23 7.03 7.56 7.48 1.0156 210-220 215.15 16.72 6.83 9.88 8.26 8.15 1.0180 220-230 225.13 23.70 11.33 12.37 7.83 7.73 1.0177 230-240 235.04 29.23 11.90 17.33 8.45 8.35 1.0137 240-250 245.32 39.53 14.93 24.60 8.49 8.59 0.9915 250-260 254.27 29.12 19.52 9.60 6.93 6.85 1.0168 260-270 264.57 14.03 12.52 1.52 5.60 5.60 1.0069 270-280 274.13 6.32 5.68 0.63 5.26 5.25 1.0096 280-290 284.07 2.42 2.25 0.17 4.58 4.46 1.0358 290-300 293.48 0.63 0.63 0.00 3.72 3.58 1.0496 300-310 305.55 0.27 0.27 0.00 2.82 2.48 1.1327 310-320 314.82 0.53 0.53 0.00 1.68 1.66 1.0245 320-330 324.33 0.55 0.55 0.00 1.80 1.81 1.0050 330-340 334.35 0.68 0.68 0.00 1.48 1.51 0.9854 340-350 345.57 0.52 0.52 0.00 1.96 1.90 1.0392 350-360 355.14 0.45 0.45 0.00 1.93 1.84 1.0669
Table 3 – Site calibration results The combined standard uncertainty of the wind speed ratio at 6 m/s, 10 m/s, and 14 m/s is 0.08198 m/s, 0.06343 m/s, and 0.05359 m/s respectively.

Wind Turbine Industries, Corporation Letter Report 100413407CRT-004 March 30th, 2012
Page 10 of 54 Intertek Testing Services NA, Inc. SD 12.1.2 (11/11/10) Informative
Figure 3 below plots the wind direction bin ratios that resulted from site calibration at the testing location.
Figure 3 - Site calibration ratio binned data. Valid sector from 230 – 260 degrees with respect to true north

Wind Turbine Industries, Corporation Letter Report 100413407CRT-004 March 30th, 2012
Page 11 of 54 Intertek Testing Services NA, Inc. SD 12.1.2 (11/11/10) Informative
6.0 Test Equipment Description Table 4 below shows the equipment that was used during the power performance testing of the Jacobs 31-20. Serial numbers and instrument calibration details are also provided in the table. All instruments were properly calibrated according to the Standards for the duration of power performance testing identified in Figure 1. Calibration certificates are included in Appendix C.
Description Manufacturer/Model Serial # / Asset # Calibration date
Calibration due date
Primary anemometer
Adolf Thies GmbH 4.3351.00.140
05110086 21-Sep-2011 21-Sep-2012
Reference anemometer
Adolf Thies GmbH 4.3351.00.141 05110087 21-Sep-2011 21-Sep-2012
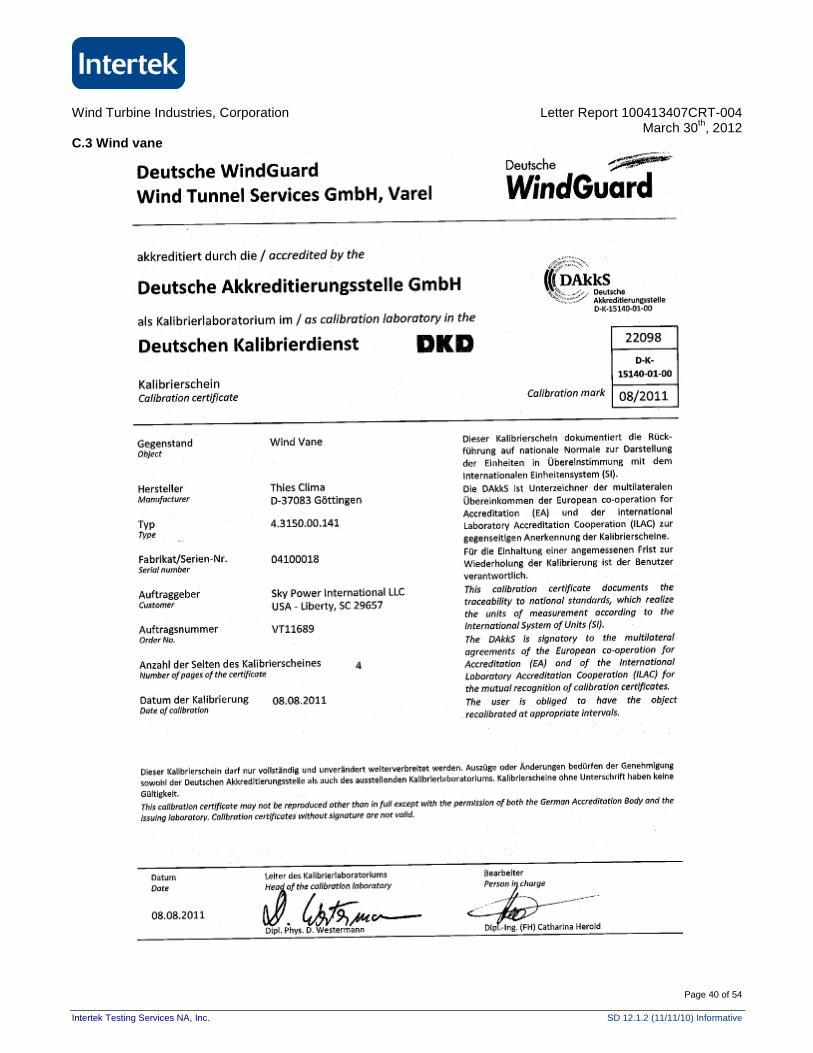
Wind vane Adolf Thies GmbH
4.3150.00.141 04100018 08-Aug-2011 08-Aug-2012
Barometric pressure sensor
Vaisala PTB330
F1420001 12-Aug-2011 12-Aug-2012
Temperature/RH sensor
Adolf Thies GmbH 1.1005.54.241* 85764 12-Aug-2011 12-Aug-2012
Power transducer
Ohio Semitronics DMT-1040EY44
A333** 24-Oct-2011 24-Oct-2012
Current transducer
Ohio Semitronics 13480
A333** 24-Oct-2011 24-Oct-2012
*Model # differs on calibration certificate; the model # listed in this table is correct **Intertek calibration database Asset #; PT and CT calibrated as a system
Table 4 – Equipment used in the power performance test A National Instruments cDAQ-9178 backplane and NI-9203 +/- 20 mA 8-channel current module are used for logging the outputs signals from the sensors in Table 4 above. A proprietary LabVIEW program is used to collect and filter data that is stored in raw and 1 Hz data files on the Intertek RTC site computer. Prior to testing, a signal verification procedure was carried out on the data acquisition system by Intertek to verify the signals of each transducer against recorded values from the LabVIEW program. Table 5 below summarizes the results of the signal verification.

Wind Turbine Industries, Corporation Letter Report 100413407CRT-004 March 30th, 2012
Page 12 of 54 Intertek Testing Services NA, Inc. SD 12.1.2 (11/11/10) Informative
Measurement NI 9203 Channel Injected Signal {mA}
Measured Value {mA}
Offset {mA}
4.000 4.000 0.000 12.000 12.000 0.000 Primary windspeed 0 20.000 20.000 0.000 4.000 4.000 0.000 12.000 12.000 0.000
Reference windspeed
1 20.000 20.000 0.000 4.000 4.000 0.000 12.000 12.000 0.000 Wind direction 2 20.000 20.000 0.000 4.000 4.000 0.000 12.000 12.000 0.000 Relative humidity 3 20.000 20.000 0.000 4.000 4.000 0.000 12.000 12.000 0.000 Temperature 4 20.000 20.000 0.000 4.000 4.000 0.000 12.000 12.000 0.000
Barometric Pressure
5 20.000 20.000 0.000 4.000 4.000 0.000 12.000 12.000 0.000 Output power 6 20.000 20.000 0.000
n/a 7 not used not used n/a Table 5 – Signal verification results
The data acquisition system is located inside the Intertek RTC control building; all signals are measured at this location. This is also the location of the turbine disconnect and grid-tie inverter, and thus is also where power measurements are made. The data is stored on two separate computers at the Intertek RTC, and also stored in the Intertek project file. The power measurement equipment is located inside the control building at an approximate wire run length of 91.4 meters (300 feet); which satisfies the required wire run length in the Standards. Figure 4 displays the arrangement of the meteorological tower with dimensions of instrument locations. The height above ground level to the centreline of the cups of the primary anemometer of 35.87 meters is the same height above ground level as the hub height of the Jacobs 31-20. The reference anemometer and the wind vane are installed at the same height of 33.87 m, and the temperature and pressure sensors are installed at the same height of 21.5 m. No in situ comparison of anemometers was made during this test period. The primary method of anemometer calibration verification of post-test calibration was followed; calibration certificates are found in Appendix C.

Wind Turbine Industries, Corporation Letter Report 100413407CRT-004 March 30th, 2012
Page 13 of 54 Intertek Testing Services NA, Inc. SD 12.1.2 (11/11/10) Informative
Figure 4 – Meteorological tower and instrument locations

Wind Turbine Industries, Corporation Letter Report 100413407CRT-004 March 30th, 2012
Page 14 of 54 Intertek Testing Services NA, Inc. SD 12.1.2 (11/11/10) Informative
7.0 Test Procedure 7.1 Data Collection Measurement procedures and data collection were conducted in accordance with the Standards. Data was sampled at the required rate of 1 Hz. The averaging period for all average, maximum, minimum, and standard deviation values was 1 minute, as required by the Standards. No turbine status signal is provided by the turbine controller; therefore, one was not monitored during this test. Meteorological data and the turbine output power signals were gathered by the NI 9203 module and stored in daily spreadsheet files on the control building computer. The spreadsheet files are where all analysis according to the Standards took place. The data was sorted per binning method described in the Standards based on 1 minute averaging of the measured, contiguous data. Only Database A is reported in this report. This is due to the fact that cut-out behaviour was not observed during the power performance test.
7.2 Data Rejection To ensure that only data obtained during normal operation of the wind turbine are used in the analysis, and to ensure data are not corrupted, selected data sets were excluded from the database under the following circumstances:
� External conditions other than wind speed are out of the operating range of the wind turbine, � Turbine cannot operate because of a turbine fault condition, � Turbine is manually shut down or in a test or maintenance operating mode, � Failure or degradation (i.e. du to icing) of test equipment, � Wind direction outside the measurement sector as defined in section 5.2 above, or � Wind directions outside valid (complete) site calibration sectors as defined in section 5.2 above.
No maintenance was performed on the Jacobs 31-20 during the test period. 7.3 Data Normalization The 1 minute averaged data sets were normalized to sea-level air density, 1.225 kg/m3. A second normalization to site average air density was not required due to the fact that the average air density during the testing period was within the specified range of 0.05 kg/m3 of sea-level air density. The calculated site average air density at the Intertek RTC for the measurement period was 1.205 kg/m3. Air density was determined from measured air temperature and air pressure according to Equation 1 from IEC 61400-12-1. Data normalization was then applied to the measured power output according to Equation 2 from IEC 61400-12-1.

Wind Turbine Industries, Corporation Letter Report 100413407CRT-004 March 30th, 2012
Page 15 of 54 Intertek Testing Services NA, Inc. SD 12.1.2 (11/11/10) Informative
7.4 Determination of results The measured power curve is determined by applying the “method of bins” to the normalized data sets, using 0.5 m/s bins. Average values for wind speed and normalized power output for each bin were determined according to Equations 4 and 5 from IEC 61400-12-1. Annual energy production was estimated by applying the measured power curve to different reference wind speed frequency distributions. A Rayleigh distribution, which is identical to a Weibull distribution with a shape factor of 2, was used to reflect the wind speed frequency distribution. For determination of AEP, the availability of the wind turbine is assumed to be 100%. AEP estimations were made for hub height annual average wind speeds between 4 and 11 m/s according to Equations 6 and 7 from IEC 61400-12-1. The power coefficient, CP, of the wind turbine was determined from the measured power curve according to Equation 7 from IEC 61400-12-1.
8.0 Uncertainty Table 6 below summarizes the Category B uncertainty parameters for the power performance measurements. Total Category B uncertainty is obtained by combining each component’s uncertainty using the root-sum-squared method. Combined uncertainty is the root-sum-squared combination of Category A and Category B uncertainties of power measurements. Final Category A, Category B, and combined uncertainties are presented in Table 7 in section 9 of this report.
Component Uncertainty Source
Power (Inverter)
Voltage transducer N/A
Current transformer 0.3 % Calibration
Power transducer 0.3 % Calibration
Data acquisition 0.66 % Manual
Wind Speed
Anemometer 0.0289 m/s Calibration
Operational Characteristics 0.0866 m/s + 0.866 % IEC 61400-12-1
Terrain effects 0.0516 – 0.0521 m/s* IEC 61400-12-1
Mounting effects 1.00 % Assumption
Data Acquisition 0.66 % Assumption
Temperature
Temperature Sensor 0.052 °C Calibration
Radiation Shielding 0.817 °C Calibration
Mounting Effects 0.284 °C IEC 61400-12-1
Data Acquisition 0.312 °C Manual
Pressure Sensor
Pressure Sensor 0.064 hPa Calibration
Mounting Effects 0.069 hPa IEC 61400-12-1
Data Acquisition 1.871 hPa Manual
Table 6 – Uncertainty values used in the analysis *Range of site calibration uncertainties within the valid measurement sector

Wind Turbine Industries, Corporation Letter Report 100413407CRT-004 March 30th, 2012
Page 16 of 54 Intertek Testing Services NA, Inc. SD 12.1.2 (11/11/10) Informative
9.0 Test Results 9.1 Tabular results Table 7 below shows the normalized and averaged results of the power performance test for the Jacobs 31-20 turbine. No normalization to test site average air density is required due to the site average density being within 0.05 kg/m3 of sea-level air density.
Presentation of data in the measured power curve (d atabase A) Reference air density: 1.225 kg/m 3
Bin Normalized Wind Speed
Power output
Category A Standard
Uncertainty
Category B Standard
Uncertainty
Combined Standard
Uncertainty
(m/s) (m/s) (kW)
Cp Number of 1-Minute Data Sets
(kW) (kW) (kW) 0 0.23 -0.05 -87.11 8 0.00 - -
0.5 0.51 -0.04 -7.74 52 0.00 0.00 0.00 1 1.05 -0.04 -0.88 118 0.00 0.00 0.00
1.5 1.55 -0.04 -0.28 340 0.00 0.00 0.00 2 2.01 -0.04 -0.12 569 0.00 0.00 0.00
2.5 2.50 -0.04 -0.06 648 0.00 0.00 0.00 3 2.99 -0.02 -0.02 607 0.00 0.00 0.00
3.5 3.52 0.03 0.02 615 0.01 0.01 0.01 4 4.00 0.17 0.06 749 0.01 0.03 0.03
4.5 4.51 0.35 0.09 778 0.01 0.05 0.05 5 5.01 0.66 0.12 862 0.01 0.08 0.08
5.5 5.50 1.07 0.15 861 0.02 0.11 0.11 6 5.99 1.60 0.17 830 0.02 0.15 0.15
6.5 6.50 2.19 0.19 812 0.03 0.17 0.17 7 7.00 2.97 0.20 835 0.03 0.23 0.23
7.5 7.51 3.84 0.21 881 0.04 0.27 0.27 8 8.01 4.63 0.21 952 0.04 0.25 0.26
8.5 8.49 5.58 0.21 946 0.05 0.32 0.33 9 9.00 6.67 0.21 815 0.06 0.37 0.38
9.5 9.49 7.91 0.22 698 0.07 0.44 0.45 10 10.00 9.19 0.21 610 0.08 0.46 0.47
10.5 10.50 10.62 0.21 481 0.10 0.55 0.56 11 10.99 12.00 0.21 434 0.11 0.56 0.57
11.5 11.50 13.14 0.20 372 0.11 0.46 0.47 12 11.98 14.48 0.20 360 0.12 0.59 0.60
12.5 12.50 15.72 0.19 311 0.12 0.53 0.54 13 13.00 16.47 0.17 253 0.13 0.36 0.38
13.5 13.49 17.52 0.17 211 0.13 0.51 0.52 14 13.99 18.28 0.16 177 0.13 0.39 0.41
14.5 14.50 18.62 0.14 132 0.14 0.23 0.26 15 14.99 19.06 0.13 130 0.12 0.28 0.30
15.5 15.50 19.20 0.12 122 0.13 0.18 0.22 16 15.98 19.54 0.11 89 0.12 0.25 0.28
16.5 16.49 19.58 0.10 71 0.15 0.17 0.23 17 16.97 19.78 0.09 68 0.11 0.20 0.23
17.5 17.49 19.91 0.09 54 0.10 0.19 0.21 18 17.99 20.00 0.08 57 0.08 0.18 0.20
18.5 18.49 20.03 0.07 42 0.10 0.17 0.20 19 19.06 19.66 0.07 28 0.15 0.26 0.30
19.5 19.44 19.98 0.06 21 0.13 0.31 0.34 20 19.97 19.84 0.06 23 0.12 0.19 0.22
20.5 20.51 20.12 0.05 17 0.16 0.24 0.29 21 21.04 20.18 0.05 12 0.08 0.18 0.20
Table 7 – Jacobs 31-20 performance at sea-level air density; 1.225 kg/m3

Wind Turbine Industries, Corporation Letter Report 100413407CRT-004 March 30th, 2012
Page 17 of 54 Intertek Testing Services NA, Inc. SD 12.1.2 (11/11/10) Informative
Table 8 below summarizes the estimation of expected annual energy production (AEP) at sea-level air density.
Estimated annual energy production, database A (all valid data)
Reference air density: 1.225 kg/m3 Cut-out wind speed: 25.00 m/s
Hub height annual average
wind speed AEP-Measured Standard Uncertainty AEP-
Extrapolated
m/s kWh kWh % kWh
Complete if AEP-Measured is at
least 95% of AEP-Extrapolated
4 7595 599 7.9 7595 Complete 5 16562 1056 6.4 16562 Complete 6 28365 1512 5.3 28376 Complete 7 41528 1887 4.5 41666 Complete 8 54412 2152 4.0 55099 Complete 9 65632 2314 3.5 67628 Complete 10 74358 2388 3.2 78499 Incomplete 11 80350 2396 3.0 87252 Incomplete
Table 8 – Estimated annual energy production of the Jacobs 31-20 at sea-level air density An indication of “incomplete” in the far-right column of Table 8 does not imply that the database for the test is incomplete. “Incomplete” means that AEP-Measured is not within 95% of AEP-extrapolated. AEP-extrapolated is an estimated extrapolation of annual energy production, where:
� AEP-Measured assumes zero power below cut-in wind speed and between the highest valid wind speed bin and cut-out wind speed, and
� AEP-Extrapolated assumes zero power below cut-in wind speed and constant power between the highest valid wind speed bin and cut-out wind speed.

Wind Turbine Industries, Corporation Letter Report 100413407CRT-004 March 30th, 2012
Page 18 of 54 Intertek Testing Services NA, Inc. SD 12.1.2 (11/11/10) Informative
9.2 Graphical results Figure 5 below shows the graphical results of the power performance test for the Jacobs 31-20. The uncertainty of each wind speed bin is shown as error bars on the graph.
Figure 5 – Jacobs 31-20 power curve at sea-level air density; 1.225 kg/m3

Wind Turbine Industries, Corporation Letter Report 100413407CRT-004 March 30th, 2012
Page 19 of 54 Intertek Testing Services NA, Inc. SD 12.1.2 (11/11/10) Informative
Figure 6 below shows the 1 minute output power values for average, maximum, minimum, and standard deviation of sampled data.
Figure 6 - Scatter plot of output power average, maximum, minimum, and standard deviation of 1 Hz data with 1 minute averaging.

Wind Turbine Industries, Corporation Letter Report 100413407CRT-004 March 30th, 2012
Page 20 of 54 Intertek Testing Services NA, Inc. SD 12.1.2 (11/11/10) Informative
Figure 7 below shows the coefficient of performance at sea-level air density.
Figure 7 – Coefficient of performance of the Jacobs 31-20 with swept area of 70.1 m2 at sea-level air density of 1.225 kg/m3

Wind Turbine Industries, Corporation Letter Report 100413407CRT-004 March 30th, 2012
Page 21 of 54 Intertek Testing Services NA, Inc. SD 12.1.2 (11/11/10) Informative
Figure 8 below shows the turbulence intensity as a function of wind speed. The graph shows both sampled data and binned data.
Figure 8 - Wind turbulence intensity as a function of wind speed

Wind Turbine Industries, Corporation Letter Report 100413407CRT-004 March 30th, 2012
Page 22 of 54 Intertek Testing Services NA, Inc. SD 12.1.2 (11/11/10) Informative
Figure 9 below displays both average wind speed measured by the primary anemometer and turbulence intensity as a function of wind direction.
Figure 9 - Wind speed and turbulence intensity as a function of wind direction

Wind Turbine Industries, Corporation Letter Report 100413407CRT-004 March 30th, 2012
Page 23 of 54 Intertek Testing Services NA, Inc. SD 12.1.2 (11/11/10) Informative
A.0 Appendix The following sections can be found within this Appendix:
� A Wiring diagrams
� B Pictures of the valid measurement sector � C Calibration certificates

Wind Turbine Industries, Corporation Letter Report 100413407CRT-004 March 30th, 2012
Page 24 of 54 Intertek Testing Services NA, Inc. SD 12.1.2 (11/11/10) Informative
A Wiring Diagrams A.1 Typical wiring diagram for Jacobs 31-20

Wind Turbine Industries, Corporation Letter Report 100413407CRT-004 March 30th, 2012
Page 25 of 54 Intertek Testing Services NA, Inc. SD 12.1.2 (11/11/10) Informative
A.2 Block diagram of Jacobs 31-20 setup at Intertek RTC

Wind Turbine Industries, Corporation Letter Report 100413407CRT-004 March 30th, 2012
Page 26 of 54 Intertek Testing Services NA, Inc. SD 12.1.2 (11/11/10) Informative
B Pictures of the valid measurement sector B.1 South from Jacobs 31-20 foundation; showing til t-up met mast (Met5) laying on the ground

Wind Turbine Industries, Corporation Letter Report 100413407CRT-004 March 30th, 2012
Page 27 of 54 Intertek Testing Services NA, Inc. SD 12.1.2 (11/11/10) Informative
B.2 South-southwest from Jacobs 31-20 foundation

Wind Turbine Industries, Corporation Letter Report 100413407CRT-004 March 30th, 2012
Page 28 of 54 Intertek Testing Services NA, Inc. SD 12.1.2 (11/11/10) Informative
B.3 West-southwest from the Jacobs 31-20 foundation

Wind Turbine Industries, Corporation Letter Report 100413407CRT-004 March 30th, 2012
Page 29 of 54 Intertek Testing Services NA, Inc. SD 12.1.2 (11/11/10) Informative
B.4 West-northwest from the Jacobs 31-20 foundation

Wind Turbine Industries, Corporation Letter Report 100413407CRT-004 March 30th, 2012
Page 30 of 54 Intertek Testing Services NA, Inc. SD 12.1.2 (11/11/10) Informative
C Calibration certificates C.1 Primary anemometer

Wind Turbine Industries, Corporation Letter Report 100413407CRT-004 March 30th, 2012
Page 31 of 54 Intertek Testing Services NA, Inc. SD 12.1.2 (11/11/10) Informative

Wind Turbine Industries, Corporation Letter Report 100413407CRT-004 March 30th, 2012
Page 32 of 54 Intertek Testing Services NA, Inc. SD 12.1.2 (11/11/10) Informative

Wind Turbine Industries, Corporation Letter Report 100413407CRT-004 March 30th, 2012
Page 33 of 54 Intertek Testing Services NA, Inc. SD 12.1.2 (11/11/10) Informative

Wind Turbine Industries, Corporation Letter Report 100413407CRT-004 March 30th, 2012
Page 34 of 54 Intertek Testing Services NA, Inc. SD 12.1.2 (11/11/10) Informative

Wind Turbine Industries, Corporation Letter Report 100413407CRT-004 March 30th, 2012
Page 35 of 54 Intertek Testing Services NA, Inc. SD 12.1.2 (11/11/10) Informative
C.2 Secondary anemometer

Wind Turbine Industries, Corporation Letter Report 100413407CRT-004 March 30th, 2012
Page 36 of 54 Intertek Testing Services NA, Inc. SD 12.1.2 (11/11/10) Informative

Wind Turbine Industries, Corporation Letter Report 100413407CRT-004 March 30th, 2012
Page 37 of 54 Intertek Testing Services NA, Inc. SD 12.1.2 (11/11/10) Informative

Wind Turbine Industries, Corporation Letter Report 100413407CRT-004 March 30th, 2012
Page 38 of 54 Intertek Testing Services NA, Inc. SD 12.1.2 (11/11/10) Informative

Wind Turbine Industries, Corporation Letter Report 100413407CRT-004 March 30th, 2012
Page 39 of 54 Intertek Testing Services NA, Inc. SD 12.1.2 (11/11/10) Informative
Wind Turbine Industries, Corporation Letter Report 100413407CRT-004 March 30th, 2012
Page 40 of 54 Intertek Testing Services NA, Inc. SD 12.1.2 (11/11/10) Informative
C.3 Wind vane

Wind Turbine Industries, Corporation Letter Report 100413407CRT-004 March 30th, 2012
Page 41 of 54 Intertek Testing Services NA, Inc. SD 12.1.2 (11/11/10) Informative

Wind Turbine Industries, Corporation Letter Report 100413407CRT-004 March 30th, 2012
Page 42 of 54 Intertek Testing Services NA, Inc. SD 12.1.2 (11/11/10) Informative

Wind Turbine Industries, Corporation Letter Report 100413407CRT-004 March 30th, 2012
Page 43 of 54 Intertek Testing Services NA, Inc. SD 12.1.2 (11/11/10) Informative

Wind Turbine Industries, Corporation Letter Report 100413407CRT-004 March 30th, 2012
Page 44 of 54 Intertek Testing Services NA, Inc. SD 12.1.2 (11/11/10) Informative
C.4 Barometric pressure sensor

Wind Turbine Industries, Corporation Letter Report 100413407CRT-004 March 30th, 2012
Page 45 of 54 Intertek Testing Services NA, Inc. SD 12.1.2 (11/11/10) Informative

Wind Turbine Industries, Corporation Letter Report 100413407CRT-004 March 30th, 2012
Page 46 of 54 Intertek Testing Services NA, Inc. SD 12.1.2 (11/11/10) Informative
C.5 Temperature/RH sensor

Wind Turbine Industries, Corporation Letter Report 100413407CRT-004 March 30th, 2012
Page 47 of 54 Intertek Testing Services NA, Inc. SD 12.1.2 (11/11/10) Informative

Wind Turbine Industries, Corporation Letter Report 100413407CRT-004 March 30th, 2012
Page 48 of 54 Intertek Testing Services NA, Inc. SD 12.1.2 (11/11/10) Informative
C.6 Power measurement system

Wind Turbine Industries, Corporation Letter Report 100413407CRT-004 March 30th, 2012
Page 49 of 54 Intertek Testing Services NA, Inc. SD 12.1.2 (11/11/10) Informative

Wind Turbine Industries, Corporation Letter Report 100413407CRT-004 March 30th, 2012
Page 50 of 54 Intertek Testing Services NA, Inc. SD 12.1.2 (11/11/10) Informative
C.7 Post-test primary anemometer calibration

Wind Turbine Industries, Corporation Letter Report 100413407CRT-004 March 30th, 2012
Page 51 of 54 Intertek Testing Services NA, Inc. SD 12.1.2 (11/11/10) Informative

Wind Turbine Industries, Corporation Letter Report 100413407CRT-004 March 30th, 2012
Page 52 of 54 Intertek Testing Services NA, Inc. SD 12.1.2 (11/11/10) Informative

Wind Turbine Industries, Corporation Letter Report 100413407CRT-004 March 30th, 2012
Page 53 of 54 Intertek Testing Services NA, Inc. SD 12.1.2 (11/11/10) Informative

Wind Turbine Industries, Corporation Letter Report 100413407CRT-004 March 30th, 2012
Page 54 of 54 Intertek Testing Services NA, Inc. SD 12.1.2 (11/11/10) Informative