mrf costing model user guide mrf costing model · 2019-05-09 · mrf costing model 3 preface the...
TRANSCRIPT

MRF Costing Model User Guide
MRF Costing Model
Written by: Bob Graham
Entec Consulting Ltd on behalf of WRAP
The Waste & Resources Action Programme The Old Academy, 21 Horse Fair, Banbury, Oxon OX16 0AHTel: 01295 819900 Fax: 01295 819911 www.wrap.org.uk WRAP Helpline: freephone 0808 100 2040 September 2006
The MRF Costing Model provides local authorities and others with a tool to enable better understanding of the total costs of sorting and bulking dry recyclables and the relative costs of different sorting systems.
MRF Costing Model 2
Table of contents
Preface 3
Glossary of terms 5
1. Introduction 7
2. Development of the models 9
3. What is the MRF costing model? 12
4. Incoming material composition 14
5. Marketed materials 23
6. The single stream co-mingled MRF model 25
A. Assumptions 25
B. Incoming materials 25
C. Equipment costs 26
D. Building costs 31
E. Labour costs 34
F. Variable operating costs 37
G. Summary – gross costs 40
H. Estimated revenues and residue 40
I. Summary of costs 41
7. 2-Stream MRF model 43
8. Sample model applications 45
9. Summary 51
Appendix A 53
List of tables and figures Table 5.1 Materials to be marketed 23
Table 8.1 Net processing cost – 25,000 tpa single stream co-mingled MRF 45
Table 8.2 Net processing cost – 85,000 tpa 2 stream MRF 46
Table 8.3 Approximate capital cost of optical sorting equipment 49
Table 8.4 Optical sort vs manual sort costs 49
Figure 6.1 Processing schematic – single stream co-mingled MRF 28
Figure 7.1 Processing schematic – two stream MRF 43
Figure 8.1 Optical sort pay-back period 50

MRF Costing Model 3
Preface
The MRF Costing Model was developed to provide Local Authorities with a tool to enable them to
better understand the total costs (e.g. capital, operating and unit costs per tonne) of sorting and
bulking dry recyclables and the relative costs of different systems. This tool will assist local
authorities and other organisations in the planning and delivery of cost effective collection and
sorting schemes for dry recyclables.
The MRF Costing Model and this report were prepared by Entec Consulting Ltd under contract
to WRAP. Entec Consulting Ltd. is a specialist consultancy established by Bob Graham to provide
advice on a variety of waste management issues.
The MRF Costing Model and User Guide were developed under the direction of a Steering Group
assembled by WRAP. The model and guide have been subject to a comprehensive peer review
process.
Entec and WRAP would like to thank all of the organisations and individuals who provided their
time and information in support of this project.
Project Steering Group
Linda Crichton WRAP
David Dougherty The Dougherty Group, LLC
Ian Fielding Representing the National Association of Waste Disposal Authorities and
North Yorkshire County Council
Nick Francis Senior Manager, ECT Recycling
John Lea Representing Environmental Services Association and Greater Manchester
Waste
Tim Miller WRAP
Julian Parfitt WRAP
David Powlson WRAP

MRF Costing Model 4
Peer Review
Ian Fielding National Association of Waste Disposal Authorities and North Yorkshire
County Council
Robin Kay O.Kay Engineering Services Ltd.
Hans Ouellet CP Manufacturing Inc.
John Simmons PPS Recovery Systems Ltd.
Mike Thomas Southampton City Council
Disclaimer
While steps have been taken to ensure its accuracy, WRAP cannot accept responsibility or be held
liable to any person for any loss or damage arising out of or in connection with this information
being inaccurate, incomplete or misleading. The listing or featuring of a particular product or
company does not constitute an endorsement by WRAP and WRAP cannot guarantee the
performance of individual products or materials. For more detail, please refer to our Terms &
Conditions on our website www.wrap.org.uk.

MRF Costing Model 5
Glossary of terms
Air Classifier
A mechanical device using air currents to separate solid components into "light-fraction" or "heavy-
fraction".
Bag Breaker
A machine used to tear open plastic bags containing recyclables so that the recyclables are
released from the bag and the film can be manually sorted from the recyclables.
Baler
A machine used to compress recyclables into bundles to reduce volume.
Disc Screen (also know as a "star screen")
A series of inclined rotating discs used to separate recyclables based on shape and size. The discs
rotate on a series of axes. Spaces between the individual discs as well as the rows of discs can be
adjusted so as to screen the desired material. Larger, flat materials (e.g. carboard and newspaper)
move up and over the screen in the direction of the rotating discs, while smaller round recyclables
(e.g. cans and plastic bottles) fall between the discs onto a conveyor belt.
Eddy Current Separator
A device which passes a magnetic field through materials, thereby inducing eddy currents in the
non-ferrous metals. The eddy currents counteract the magnetic field and exert a repelling force on
the non-ferrous metals, separating them from the other materials.
Magnetic Separation
A system to remove ferrous metals from other materials. Magnets are used to attract the ferrous
metals and to direct them away from the other recyclables.

MRF Costing Model 6
Materials Recovery Facility (MRF)
A Materials Recovery Facility (MRF) separates co-mingled (recyclable) materials into their individual
material streams and prepares them for sale into the commodity markets.
Metering drum
A large steel drum positioned above an inclined conveyor to level material flow. The drum rotates
in the opposite direction of the materials as they travel up an inclined conveyor.
Old Corrugated Cardboard (OCC)
Bulky cardboard that is typically found in boxes used for shipping and packaging. It is made from 2
strips of cardboard with a “corrugated” strip running through the centre.
Residue
Materials remaining after sorting/processing has been completed. Residue is typically comprised of
unsorted recyclables (e.g. small paper, plastic, etc fractions.) and non-recyclables that are
delivered to the MRF. Residues usually require some form of final disposal.
Source Separation
The separation of specific materials at the point of generation for separate collection. (e.g.
residents source separate recyclables from refuse and set these recyclables out for kerbside
collection).
Trommel Screen
A rotary cylindrical screen, typically inclined at a downward angle that separates materials of
different physical size. Materials that enter the trommel are selectively removed through various
sized holes as they move through the trommel.

MRF Costing Model 7
Introduction
The Materials Recovery Facility (MRF) Costing Model was developed to raise the profile of the
issues surrounding MRF operations and provide relevant information and good practice advice to
Local Authorities (LAs) to enable a better understanding of the role of MRFs in achieving higher
recycling rates and providing sustainable quality materials to reprocessors.
There has been a growing need to develop a processing costing tool that allows the total costs
(e.g. capital, operating, unit costs per tonne) of sorting and bulking dry recyclables to be
determined and to enable direct comparisons to be made between the costs of different
approaches to collecting and sorting dry recyclables.
WRAP supported development of the Kerbside Analysis Tool1 (KAT), which allows local authorities
to assess the infrastructure and costs for a wide range of different kerbside collection systems.
However KAT does not contain detailed fields for post collection sorting and bulking costs. This
MRF Costing Model along with KAT will enable local authorities to understand the total costs of
managing the collection, bulking and sorting of dry recyclables and the relative costs of different
systems. This tool will assist local authorities and other organisations in the planning and delivery
of cost effective collection and sorting schemes for dry recyclables. It is designed to accommodate
typical types of MRFs ranging from smaller facilities with primarily manual sorting to large, highly
automated facilities and to determine the costs of these facilities at different operating/design
capacities.
MRFs will have an increasingly important role to play in the sorting of collected dry recyclates prior
to the onward delivery of the sorted materials to reprocessors. The type and level of sorting
required is determined by the collection system and the range of materials collected at the
kerbside. Advice on collection systems is available under WRAP’s ROTATE programme but the
level of advice available on sorting operations, in particular fully automated MRFs that support the
co-mingled collection of a mix of dry recyclates, requires further development. Recent interest in
the efficiency of sorting operations at MRFs and the quality of recovered materials for reprocessing
has further highlighted the need for good quality guidance on the sorting technologies available
and their performance characteristics, as well as a need for technical advice and guidance on
export classifications for recovered paper in particular. Well designed and operated MRFs add
value to the mixed recyclates through increased levels of sorting (e.g. several grades of paper,
plastics by polymer type, etc), and if appropriate revenue sharing arrangements are in place then
the benefits of additional revenues can be used to offset the costs of collection and sorting.
1 http://www.wrap.org.uk/local_authorities/toolkits_good_practice/kat_gets_a_new.html

MRF Costing Model 8
For reasons that will be explained in more detail later in this guide, it was decided that the MRF
models would be designed not based on the composition and quantities of recyclables presently
collected and processed, but rather on what might be considered the “best practice” standard that
local authorities will likely need to aspire to over the next five years or more in order to meet
higher recycling rates. This would include a broad range of targeted household recyclables from
programmes with above average householder participation and material capture rates.
Whilst few local authorities are likely to operate MRFs, they are involved in procuring services from
private contractors that involve the design, commissioning and operation of MRFs/bulking facilities.
Understanding all stages in the process from collection through to sale of materials to reprocessors
and how responsibility is assigned under contracts is critical. Many local authorities place the
responsibility wholly on the MRF operator/contractor for ensuring material quality and sale to
reprocessors, however many contracts ignore material value resulting in little incentive for the
contractor or the local authority to improve quality.
Furthermore, Waste Collection Authorities (WCAs) often work in isolation from each other, from
the Waste Disposal Authority (WDA) and almost certainly from MRF contractors. Development of
the MRF Costing Model is designed to bring together the various interrelating strands to enable
WRAP to provide high quality advice on sorting as well as collection, covering cost and
performance issues of operating MRFs to the required output standards. This is so that local
authorities are better informed of the bigger picture and the consequences of choosing a particular
path prior to embarking down the procurement route and preparing service specifications.
Development of the MRF Costing Model has been supported by two other projects commissioned
by WRAP2:
A review of MRF practices and operations at relevant facilities in North America, the UK and
Europe
A review of contractual arrangements between UK local authorities and MRF operators/
owners.
2 Reports available on the WRAP website: http://www.wrap.org.uk/local_authorities/

MRF Costing Model 9
2. Development of the models
2.1 Background
Early MRFs in the UK were primarily smaller facilities, designed with basic sorting systems. These
plants met the needs of the initial household collection programmes where most of the sorting
effort took place at the kerbside. In fact, many of the collection programmes were designed with
kerbside sort systems so as to avoid the need to sort and process the recyclables collected.
With the expansion of kerbside collections to more local authority areas and to more households,
together with pressure to collect more materials for recycling authorities began to look at co-
mingling various materials primarily so as to simplify collection operations and increase collection
efficiencies.
Many kerbside sort programmes have evolved into collecting two streams of recyclables: fibres
(e.g. news and PAMs, cardboard, magazines, etc.) and co-mingled containers (e.g. ferrous and
aluminium cans, plastic bottles, etc.). For these schemes, a variety of relatively straightforward
mechanical and manual MRF sorting techniques have been used to process these material
mixtures.
However more co-mingling at the point of collection meant the need for more sophisticated
processing equipment in MRFs. Facilities such as those located in Hampshire, and at Rainham and
Ipswich saw the introduction of various types of trommels and screens that are now standard
processing components used at the initial stages of separating fibre from containers in a fully co-
mingled mixture of all recyclables. More of these larger MRFs are now being designed and
commissioned in the UK.
2.2 Types of MRFs Modelled
Two individual MRF costing models were developed in this project to replicate the two most
popular forms of dry household recyclables collected: one a fully co-mingled (single stream)
mixture and the second, a 2 stream mixture of fibres and containers.

MRF Costing Model 10
The first model “SS MRFs.xls” deals with a fully co-mingled3 incoming stream of dry recyclables.
These materials are typically collected in local authority recycling programmes in a wheeled bin,
box or in a dedicated, one-way recycling sack and are typically delivered to the MRF in a single
compartment of a collection vehicle. The user has the option in the model to designate whether
glass is included in the incoming co-mingled material and whether the material is bagged or loose
(see Section 4.4 for further details on including/not including glass).
The second model “2 Stream MRFs.xls” replicates delivery of two separated streams of
recyclables: fibres and containers. These are typically materials that are sorted kerbside into two
separate collection vehicle compartments. The user has the ability in this MRF model to designate
whether glass is to be included in the container mixture. Since recyclables in this system are
usually set out at the kerbside using multiple boxes or reusable sacks (or a combination of both),
the use of one-way recycling sacks has not been provided as a form of material delivery. This
issue will be addressed in Section 4.
2.3 Bulking Facilities
Many local authorities (often with their Waste Disposal Authority) presently operate or contract
small sorting facilities that involve minimal processing of recyclable materials. Most of these
facilities service collection programmes where extensive sorting is done at the kerbside and the
collected recyclables are delivered to the facility as individual materials (e.g. news and PAMs, cans,
glass, etc.) Consequently, the need for sorting at the facility is minimal and may consist only of
separation of ferrous and aluminium cans, or removal of obvious contaminants once the
recyclables are off-loaded onto a tipping floor. In many cases, these facilities either bulk incoming
recyclables for delivery to more distant reprocessors, or ship recyclables direct to final markets.
There was initial consideration in this project to providing a model to deal with these “bulking”
facilities, however it was decided that this type of facility did not fit the “MRF model” concept.
Bulking facilities are low tech in nature and more often are designed to meet existing site and
building constraints than are “greenfield” MRFs. Furthermore, because of their responsibilities for
civic amenity sites, many local authorities feel more comfortable with the task of designing and
costing a bulking facility, regardless of its size.
3 This fully co-mingled mixture will also be referred to as “single stream” in this report.
MRF Costing Model 11
2.4 MRF Sizes
MRF size is typically characterized by reference to the maximum throughput tonnage that the MRF
is capable of processing. For the purpose of modeling for this project, four MRF sizes were
selected to represent a cross-section of facilities currently operating throughout the UK:
85,000 tpa
50,000 tpa
25,000 tpa, and
10,000 tpa.
These sizes were selected with a view to being not only representative of what is currently in
place, but more importantly, what many authorities are likely to consider as their recycling
programmes expand and mature. As recycling collection infrastructure grows, there is a natural,
progressive move to larger, more county-wide and/or regional processing facilities. This is evident
in the size of MRFs commissioned over the past 5 years or planned in the UK (e.g. Greenwich,
Norfolk, East London Waste Authority, Western Riverside Waste Authority, Alton in Hampshire,
etc.).
2.5 Health and Safety
It has been assumed that the MRF costs developed in these models provide for facilities that
comply with all applicable English Statutes and subordinate legislation, including the Management
(Health and Safety) Regulations 1999, The Supply of Machinery (Safety) Regulations 1992 and all
relevant guidance and codes of practice.

MRF Costing Model 12
3. What is the MRF costing model?
3.1 General
The MRF Costing Model is, in fact, two separate Microsoft ExcelTM 2003 workbooks that identify the
infrastructure required and the associated costs of processing a wide range of target recyclables:
SS MRFs.xls
2 Stream MRFs.xls
The third workbook “Summary Cost Graph.xls” summarises costs for both of the MRF models,
to provide a direct comparison of both systems.
The model is not intended to allow the user to design a MRF. Design of a MRF is very specific to
local needs and therefore difficult to incorporate into a generic model. Rather, this tool is intended,
to the extent possible, to give the user the opportunity to modify a variety of input data to “tailor”
several MRF designs to local conditions, including:
Specific MRF design parameters such as the capacity of the tipping floor and product storage
areas
Operating conditions (hours, shifts, days/wk, etc.)
Selecting whether the incoming recyclables are fully co-mingled (single stream) or separated
(2 stream), whether they are bagged or loose, if glass is included in the mixture or not
Designating which materials are to be baled and which are to be manually sorted
Labour rates for operating and supervisory staff
Designating recovery rates for targeted recyclables
Revenue and shipping costs for materials to be marketed
Miscellaneous other items such as the cost of baling wire, cost per tonne of residue disposal,
the unit cost of constructing the MRF building, local charge rates for electrical consumption,
etc.
The primary intent of the MRF models is to provide local authorities with a costing tool that can be
used in conjunction with the KAT collection model to evaluate various options for collecting and
processing recyclables. By using the model for a MRF of a particular design capacity, the user is
able to identify:
the cost of a 2-stream and a fully co-mingled processing system
the cost of adding glass to the incoming recyclables streams
the additional costs associated with processing bagged recyclables at a fully co-mingled MRF.

MRF Costing Model 13
Each of these can be investigated under a wide range of operating parameters and several
material marketing options. The model is meant to provide “representative” capital and operating
costs for a variety of sizes of MRFs. By changing the variables listed above, the user is able to
assess the resulting changes in resources and costs.
3.2 Setup of the Models
In both of these models, there are two initial spreadsheets that are used for input data: one
dealing with incoming material composition, and the other highlighting various operating and cost
assumptions. The next four spreadsheets contain all of the detailed calculations and information
pertaining to the range of design throughput tonnages selected – 85,000; 50,000; 25,000; and
10,000 tpa. A graph is then provided to summarize the gross and net costs associated with the
MRF design and operation parameters that the user has selected. The last spreadsheet in each
workbook summarizes key resource and cost information for each facility.
3.3 Default Data
In an attempt to make the models as specific and useful as possible, default data have been
minimized. Specific input data have been selected to illustrate how the model operates, but in
most cases, the user has the option of changing these parameters to reflect local conditions. Cells
in the worksheets that require user consideration and input are shaded yellow.

MRF Costing Model 14
4. Incoming material composition
4.1 Background
The initial step in designing any processing facility is identifying how much of what material will
require processing. It is typical that a local authority tendering for its own MRF will specify to the
designer a composition breakdown for recyclables to be processed at the MRF. The majority of
recyclables to be processed in these MRFs originates from the authority’s own recycling
programmes, including recyclables collected through kerbside, estate, bring and civic amenity
sites.
Since the majority of material typically comes from kerbside collection, material composition data
often come from waste audits performed on recyclables collected through the kerbside
programme. This information might then be adjusted to take into account:
additional materials that will be added to the programme in the coming years
any “clean” recyclables from commercial or trade sources (e.g. card, office paper, etc.)
any other recyclables originating from a neighbouring or partner authority.
Obviously, it becomes very difficult to forecast with precision the breakdown of materials to be
processed over the life of the MRF. For this reason, care should be taken to identify how much
flexibility the designer needs to build into the design to allow for new materials to be separated
and marketed. Very often, an authority will indicate:
a list of minimum separation requirements – those separations that are definitely required in
the MRF design
a list of “optional” additional materials to be sorted - these are typically reviewed at the tender
evaluation stage and decisions to include these are often based on the budget constraints
a list of “future” materials that might be added at a later date – in these cases, the designer
might simply provide additional space if available to be able to process these materials.
The primary difficulty in developing MRF models for this project was selecting a representative
composition of incoming materials that represents recyclables collected by a broad range of
authorities throughout the UK. Not only is there great variety in materials collected by authorities
in different geographical locations, but also great variation in the quantities of each material in the
mix, depending on the material arisings and the performance of the individual recycling
programmes.

MRF Costing Model 15
Therefore, it was decided that the focus of selecting both “representative” materials to be included
and the composition of those materials should not necessarily be what is presently collected, but
rather, what might be considered the “best practice” standard that authorities will likely need to
aspire to over the next five years as recycling programmes continue to expand. This would include
a broad range of targeted household recyclables from programmes with above average
householder participation and material capture rates.
4.2 Waste Arisings and Recovery Rates
A number of information sources were researched to identify typical arising data that might be
used in this project. Defra provided a number of individual waste audits (household refuse and
recyclables) that have been performed for various authorities over the past 5 years. Two studies
provided arisings data for Wales4 and for the UK5. Household waste arisings data were generally
similar for major material categories in both studies, and in addition to a percentage breakdown by
material, the UK study also provided a kg/hh/yr material breakdown. This information was
reviewed in conjunction with the Defra audit data as well as two other detailed waste audits, one
for Hampshire and the other for Western Riverside Waste Authority (WRWA) in London. A
breakdown of this information is presented in Appendix A.
The arisings and recycling performance data from these sources were then used to develop
representative recovery rates for use in the MRF costing models. The recommended rates were
developed for six different collection and processing system options, namely:
A: Single stream co-mingled with glass, bagged collection
B: Single stream co-mingled without glass, bagged collection
C: Single stream co-mingled with glass, loose collection (using a wheeled bin or box)
D: Single stream co-mingled without glass, loose collection (using a wheeled bin or box)
E: 2-stream collection (fibres and containers) with glass (using boxes and/or reusable sacks)
F: 2-stream collection (fibres and containers) without glass (using boxes and/or reusable
sacks).
Collection of fibres using (single use) recycling sacks was not deemed a common practice in UK
kerbside programmes and therefore was not included as an option for2-stream collection.
4 Waste Composition Analysis – Guidance for Local Authorities; Entec UK Ltd with Eunomia Research & Consulting Ltd for DEFRA; 2004
5 Analysis of Household Waste Composition; Dr. Julian Parfitt, WRAP; Dec, 2002

MRF Costing Model 16
The projected recovery rates shown for each system represent “best practice” for that type of
programme. The recovery rates are higher than presently experienced in many UK collection
programmes and are meant to reflect recovery rates that local authorities should be aspiring to
achieve. They have been developed with due consideration of the performance of some of the
leading recycling programmes in the UK and refined to project what is considered high level (but
practical) householder participation and material capture rates. Variations in assumed recovery
rates across each of the systems are highlighted in yellow. For instance, glass recovery is higher in
those systems where glass is a designated material (Systems A, C and E).
In addition, experience shows that a fully co-mingled collection system experiences higher
recovery rates than the equivalent 2 stream collection system, primarily because of increased
convenience for the user. For the purposes of this project, it is conservatively projected that
recovery rates for the 2 stream systems are 90% of those for the single stream co-mingled
system. In addition, in the case of 2 stream systems E and F, where collectors have opportunities
to sort visible contaminants from a box, recovery rates of some of these unwanted materials (e.g.
liquid beverage cartons, non-recyclable paper, etc.) have been assumed lower than for those
materials in the fully co-mingled single stream systems, since there is no opportunity in a bag or a
wheeled bin collection to sort out these materials.
These material compositions are used as in-feed to each of the respective MRF designs described
in more detail in following sections. Even though most of the non-recyclables are assumed to be
removed during collection, small quantities are still assumed to be included in the incoming
recyclables stream delivered to the MRF. These materials will form part of the MRF residue stream
requiring ultimate disposal.
4.3 Targeted Materials
Materials that are assumed as targeted materials, that is, materials that local authorities designate
as officially part of their collection scheme and that householders are requested to recycle, are
highlighted in blue in the “Materials” column of Table A1. These include:
Fibre:
News and PAMs
Directories and catalogues
Paper and card packaging

MRF Costing Model 17
Cardboard
Other recyclable paper, including office paper
Containers:
Ferrous food and beverage
Ferrous aerosol cans
Aluminium food and beverage
Aluminium aerosol cans
Clear, green and brown glass bottles and jars
All plastic bottles.
Several other items were considered but not included, such as liquid beverage cartons (laminated
and plastic/foil cartons for orange juice, milk, etc.), textiles and film plastic. Instead, provision has
been allowed in the MRF designs for the addition of one additional fibre sort and one additional
container sort. It was considered that textiles are more appropriately recycled through charity
organizations (Salvation Army, etc.) and that because of the problems associated with sorting film
plastic throughout the MRF, it should not be included as a designated recyclable material. If
textiles are to be included, they are best collected in a plastic carrier bag and removed at a presort
station. Although food wrap, carrier bags, etc. are not designated materials, film sacks such as
those used to contain recyclables during kerbside collection, become designated recyclables if the
user selects to evaluate this option.
In addition to “targeted” recyclables, most collection programmes experience some level of
contamination, that is, additional materials are collected that are not “targeted” recyclables. As
noted previously, in the case of 2 stream systems E and F, where collectors have opportunities to
sort visible contaminants from a box, recovery rates of some of these non-recyclable materials
(e.g. liquid beverage cartons, non-recyclable paper, etc.) have been assumed lower than for those
materials in the single stream systems. Typically, there is no opportunity in a bag or a wheeled bin
collection system to reject ‘non targeted’ materials at the kerbside.
The user is not able to adjust the assumed list of incoming materials or composition in the costing
models, since the equipment design is based on these. Minor variations (e.g. eliminating aerosols
from the mix) will not have any significant impact on the design or the resulting costs, but other
quantity variations may be sufficient magnitude to require changes to the assumed equipment
throughput capacity, thereby changing the size and cost.

MRF Costing Model 18
4.4 Co-mingled Single Stream Collection Systems and the Issue of Including Glass with Paper
The co-mingled single stream debate has continued in the UK for more than 5 years in the same
manner as it has in other countries (such as Canada and the United States) that have seen co-
mingled single stream collection and processing systems grow in popularity. The debate on this
issue was given extra impetus by the development of the European Standard for Recovered Paper
and Board in 2001, implemented in the UK as BS EN 643.
Prior to this time the former UK standard (the UK waste paper grading schedule) listed 11 groups
of recovered paper, with each group being sub-divided in up to 15 grades. Each grade had a full
description of what is, and is not, acceptable, a maximum permissible level of objectionable
materials and full descriptions of both objectionable and prohibited materials.
In generating the new standard, consensus between European countries was difficult for a number
of reasons; some countries, driven by national legislation, wanted to define grades according to
their source or collection systems. The UK did not manage to include an intended differentiation
between hard mixed and soft mixed grades and most significantly there were difficulties in
agreeing levels of objectionable materials. The result was a schedule, agreed by all parties, but in
the main it only dictates the type(s) of paper required, but with nil contamination. In virtually all
cases, nil contamination is not achievable and hence suppliers of recovered paper can only
approach, rather than actually achieve, the specifications set.
This new grading schedule did not lead to any overnight changes in the composition of materials
collected in the UK, but did achieve its objectives of improving clarity where grades are traded
across national borders. However, as suppliers can only approach the specification set then it is
noted in the standard that both: “The description of the standard grades is brief, and for this reason it is recognized that specific deals between buyer and supplier for standard grades with special specifications will be necessary to meet individual requirements…” and, “The criteria for defining the percentage of unusable materials for these grades will be subject to individual mills’ specifications”. The only clearly defined quality requirements in EN 643 are as follows:
a) recovered paper and board originating from multi-material collection systems, containing only
material of a valuable, recyclable nature must be specifically marked;

MRF Costing Model 19
b) recovered paper from refuse sorting stations is not suitable for use in the paper industry;
c) recovered paper and board will, in principle, be supplied with moisture of not more than the
naturally occurring level (10 %).
In summary, EN 643 has been in existence since November 2001 and has aided clarity in cross-
border trading of recovered paper in Europe. It is though, fundamentally, a grading schedule and
not a quality standard, as it only dictates to which name and code recovered papers should be
graded, and does not define the quality of these grades.
With BS EN643 being an absolute standard, the UK paper industry published “A Guide to the
Quality Requirements of Recovered Paper”6, based on its own experience and observations. The
guide outlines the industry’s views on the ability of different paper collection systems to meet its
quality requirements. Although not to be mistaken as the standard itself, the guide has prompted
some concerns among local authorities regarding the ability of current and planned recycling
systems to produce recovered paper and board products of the specified quality. (It should be
noted that a wider European debate on paper quality and recovery is also ongoing. The
Confederation of European Paper Industries, CEPI, has published a strategy discussing the issues
and presenting the views of the European paper industry7. Two other North American studies also
present views on this topic8 9).
6 “A Guide for Those Involved in Paper Recovery and Recycling”; Produced by the Corrugated
Packaging Association, the British Recovered Paper Association, the Independent Waste Paper
Processors Association, and Paperchain (2003). 7 “Strategy on Recycling - The Paper Industry’s Point of View: The Confederation of European
Paper Industries’ Contribution to the Thematic Strategy on Waste Recycling” (2003). 8 “Paper Recycling - Quality is Key to Long-Term Success”; The American Forest and Paper Association; March, 2004
9 “Single Stream – An Investigation into the Interaction Between Single Stream Recycling
Collection Systems and Recycled Paper Manufacturing”; Conservatree for Sonoma County Waste
Management Agency; March, 2003

MRF Costing Model 20
To inform the debate on paper quality in the UK, WRAP commissioned an objective assessment10
of the quality of paper recovered by UK local authorities in relation to the specifications set out in
BS EN 643. An important aim was to establish how the quality of paper consigned to paper
reprocessors by local authorities varies between different collection systems. This study showed
that for 560 paper and board samples collected from 80 different local authorities across the UK,
“for all paper grades, non-fibre contamination was found to be minimal” and that “the widespread
perception of poor quality material arising from kerbside collection systems is incorrect”.
A few trends are evident related to single stream co-mingled recycling:
More local authorities in the UK are implementing single stream co-mingled collection and
processing schemes, with and without including glass as a designated co-mingled material. It
is a trend that seems likely to continue.
Most of these produce a news and PAMs grade of fibre and it appears that most rely on export
markets for this material particularly where glass is a targeted material.
When assessing the cost of single stream co-mingled collections compared to other collection
systems, in particular, kerbside sort schemes the costs of collection and sorting must be
considered.
Single stream co-mingled recycling can result in higher recovery of targeted recyclables but
higher contamination than comparable 2-stream collections.
Technologies continue to improve to separate and process single stream co-mingled
recyclables. As a result, newer MRFs are able to produce grades of paper that meet and, in
fact, exceed those of older MRFs.
As local authority recycling programmes expand, more and more recyclables will be collected
from multi-occupancy households, flats and estates – many of these schemes will collect co-
mingled materials resulting in higher contamination of the MRF in-feed.
Whether to include glass as part of a co-mingled single stream recyclables mixture that includes
paper is a sensitive issue. Glass is a particular concern to paper mills. Most mills will reject loads
of recovered paper for small quantities of this material. It is technically difficult to screen the glass
fragments from the paper as it breaks down into an abrasive powder which causes damage to the
papermaking process.
As a consequence, local authorities should be aware that there are potential market issues both
with implementing single stream co-mingled systems and with including glass as a targeted
material in the co-mingled recyclables. Some UK mills have publicly stated that they will not source
10 “Assessment of Quality Arising from Existing Paper Collection Methods against European Recovered Paper Grades listed in BS EN643”; WRAP; October, 2003.

MRF Costing Model 21
recovered paper from MRFs and would never accept paper that has been collected with glass. The
further consequence of this is that, especially for paper collected with glass, there will be a
reliance on the export market, and in the longer term this too could become limited.
Paper is the material most likely to be contaminated if collected co-mingled either with glass or
other dry recyclates and since paper is one of the weightier materials, it is an important
component of local authority recycling collections contributing both to statutory recycling targets
and landfill diversion targets. A key task facing local authorities, therefore, is to ensure that the
paper collection systems they introduce and manage can meet both quantity and quality
requirements of the reprocessors.
WRAP has taken the view that the MRF models need to provide the user with the ability to identify
associated equipment and operating costs of both of these options (with and without glass), so
that an informed decision can be made.
It is not the purpose of this guide to comment further on details of this debate, but rather to
highlight to the user that the debate continues and to point to pertinent reference material.
4.5 The Issue of Compaction
MRF equipment, for the most part, is designed to sort recyclables based on their inherent size,
shape and weight. With increasing pressure to maximize collection efficiencies and thereby
minimize collection cost increases, more and more collectors are compacting recyclables on
collection or transfer vehicles for delivery to a MRF. Processing complications arise when
recyclables have been over-compacted during collection and transfer.
Experience has shown that recyclables can be compacted to a density of about 2.5 times their
loose density before they become so dense that it becomes difficult to readily separate them.
Excessive compaction leads to cross contamination in MRF products. For instance, if a ferrous can
and aluminium can are squashed together so tightly that they stay together through the initial
sorting process, they will likely be ejected together by the overband magnet. While this may not
be a problem in terms of ferrous contamination, it does result in lost revenue (since aluminium has
a significantly higher value than ferrous). Similarly, a plastic PET bottle crumpled together with a
PVC bottle, depending on the sorting system, will either result in contamination of the PET stream,
or the loss of both bottles to the residue stream.

MRF Costing Model 22
Where co-mingled collection includes glass, the problems detailed in Section 4.4 are further
exacerbated as glass bottles can be crushed thus ensuring that glass fragments will be present in
paper.
MRF operators and collection officers need to be aware of the processing implications of over-
compaction and need to work together to find a balance that suits both parties. Compaction
monitoring can be done through visual examination of material as it is unloaded onto the tipping
floor and/or through periodic monitoring of incoming vehicle loads at the weighbridge (with
maximum payloads assigned to vehicles of a given size). Ultimately, the MRF operator should have
the capability of refusing to receive delivery vehicles that repeatedly refuse to comply with
required density limits.

MRF Costing Model 23
5. Marketed materials
In most cases, a MRF is designed to separate a number of basic products for which market
specifications are known and prices are reasonably stable. These form the core materials
separated in the process. However, each MRF operator has a degree of operating flexibility in
responding to changes in market conditions by varying the quality (and hence the revenue
received) of the individual materials marketed. In addition, modern MRFs are typically designed to
allow for anticipated changes, including new materials to be included in the incoming mix or new
technologies to separate or process materials.
The MRFs in the costing models have been designed to produce three grades of paper and five
types of containers as listed in Table 5.1. When bagged recyclables are delivered, the MRF will be
capable of baling the plastic sacks (as other film is considered contamination). In addition,
conveyor sorting and bunker space has been provided to allow one future sort (e.g. for beverage
cartons, etc.).
Table 5.1: Materials to be Marketed
Material Description Shipping Form
News and PAMs - All white paper, including newspapers,
magazines, catalogues, junk mail,
photocopy paper, etc.
(< 2% objectionable material)
Export quality bales11 or loose
Old Corrugated
Containers (OCC or
Old KLS)
Clean, dry, brown cardboard boxes
(< 2% objectionable material, up to 10%
grey card)
Export quality bales
Mixed paper Clean, dry, mixed paper from various
sources, including cartons, board,
newsprint, magazines and grey card
(< 2% objectionable material)
Export quality bales
PET bottles Mixed or colour sorted (optional) Baled
HDPE bottles Mixed or colour sorted (optional) Baled
Aluminium cans Baled or loose/flattened,
depending on market location
11 Approximately 1.1m x 1.1m x variable length so as to maximize overseas container loading.
MRF Costing Model 24
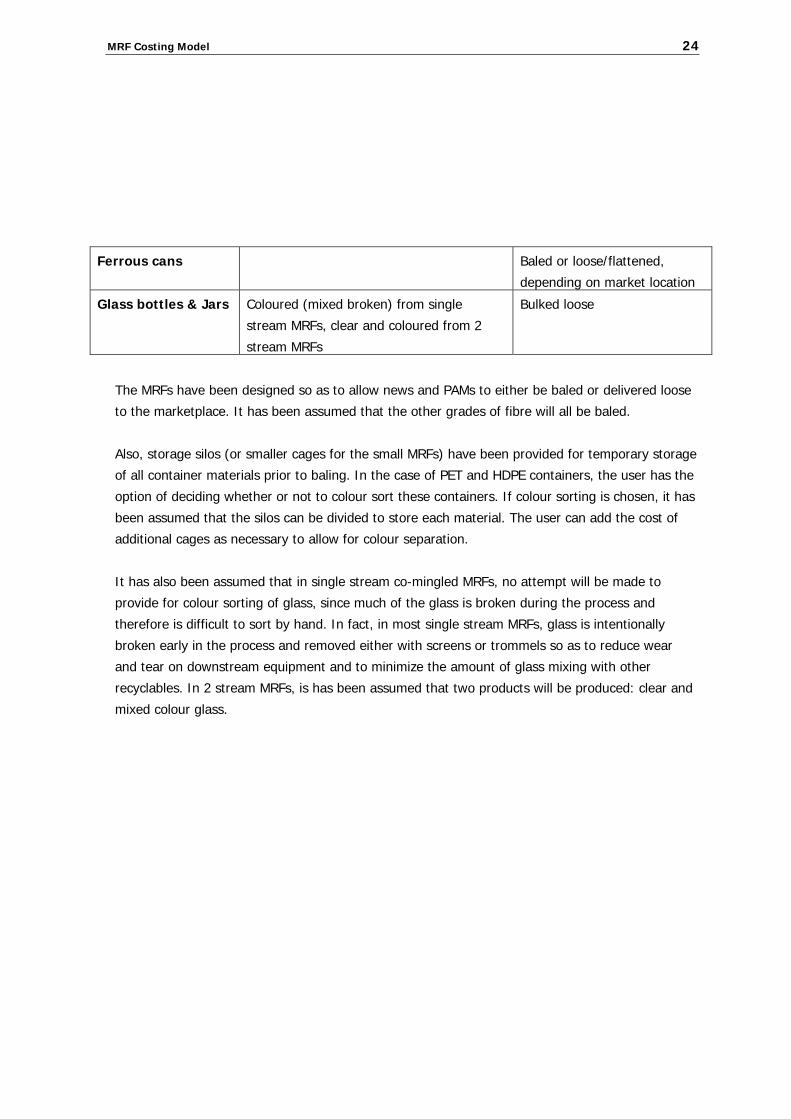
Ferrous cans Baled or loose/flattened,
depending on market location
Glass bottles & Jars Coloured (mixed broken) from single
stream MRFs, clear and coloured from 2
stream MRFs
Bulked loose
The MRFs have been designed so as to allow news and PAMs to either be baled or delivered loose
to the marketplace. It has been assumed that the other grades of fibre will all be baled.
Also, storage silos (or smaller cages for the small MRFs) have been provided for temporary storage
of all container materials prior to baling. In the case of PET and HDPE containers, the user has the
option of deciding whether or not to colour sort these containers. If colour sorting is chosen, it has
been assumed that the silos can be divided to store each material. The user can add the cost of
additional cages as necessary to allow for colour separation.
It has also been assumed that in single stream co-mingled MRFs, no attempt will be made to
provide for colour sorting of glass, since much of the glass is broken during the process and
therefore is difficult to sort by hand. In fact, in most single stream MRFs, glass is intentionally
broken early in the process and removed either with screens or trommels so as to reduce wear
and tear on downstream equipment and to minimize the amount of glass mixing with other
recyclables. In 2 stream MRFs, is has been assumed that two products will be produced: clear and
mixed colour glass.

MRF Costing Model 25
6. The single stream co-mingled MRF model
This section will describe the MRF model design and opportunities for user interface.
For the purpose of discussion here, the description refers to the “85” sheet (referring
to 85,000 tonnes/yr design capacity).
A. Assumptions
The user has the option of selecting one of the four incoming types of single stream co-mingled
delivery systems by entering A, B, C, or D in cell B4. The user should take care to ensure that the
input designation is in caps with no spaces. This defines the composition of materials to be
delivered to the MRF and whether or not the materials are delivered bagged or loose on the
tipping floor.
All of the other input data in this section are linked to the “Assumptions” spreadsheet.
B. Incoming Materials
This is a breakdown of incoming materials delivered to the MRF, based on the type of system
selected above, the design throughput capacity of this MRF (85,000 tpa), and the operating
conditions selected on the “Assumptions” spreadsheet as shown below:
The left-hand set of data in the spreadsheet represents tonnages based on a single shift operation
while the right-hand set refers to maximum throughput on a 2 shift basis. “Effective tonnes/hr” is
MRF Costing Model 26
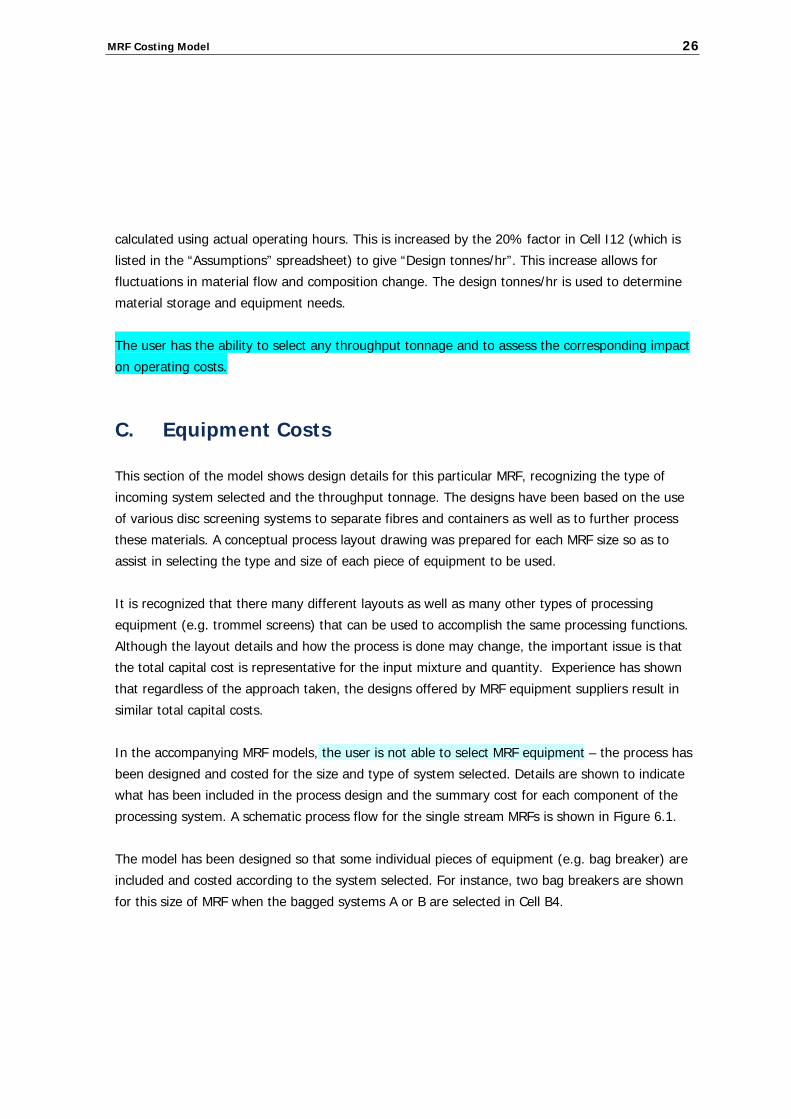
calculated using actual operating hours. This is increased by the 20% factor in Cell I12 (which is
listed in the “Assumptions” spreadsheet) to give “Design tonnes/hr”. This increase allows for
fluctuations in material flow and composition change. The design tonnes/hr is used to determine
material storage and equipment needs.
The user has the ability to select any throughput tonnage and to assess the corresponding impact
on operating costs.
C. Equipment Costs
This section of the model shows design details for this particular MRF, recognizing the type of
incoming system selected and the throughput tonnage. The designs have been based on the use
of various disc screening systems to separate fibres and containers as well as to further process
these materials. A conceptual process layout drawing was prepared for each MRF size so as to
assist in selecting the type and size of each piece of equipment to be used.
It is recognized that there many different layouts as well as many other types of processing
equipment (e.g. trommel screens) that can be used to accomplish the same processing functions.
Although the layout details and how the process is done may change, the important issue is that
the total capital cost is representative for the input mixture and quantity. Experience has shown
that regardless of the approach taken, the designs offered by MRF equipment suppliers result in
similar total capital costs.
In the accompanying MRF models, the user is not able to select MRF equipment – the process has
been designed and costed for the size and type of system selected. Details are shown to indicate
what has been included in the process design and the summary cost for each component of the
processing system. A schematic process flow for the single stream MRFs is shown in Figure 6.1.
The model has been designed so that some individual pieces of equipment (e.g. bag breaker) are
included and costed according to the system selected. For instance, two bag breakers are shown
for this size of MRF when the bagged systems A or B are selected in Cell B4.
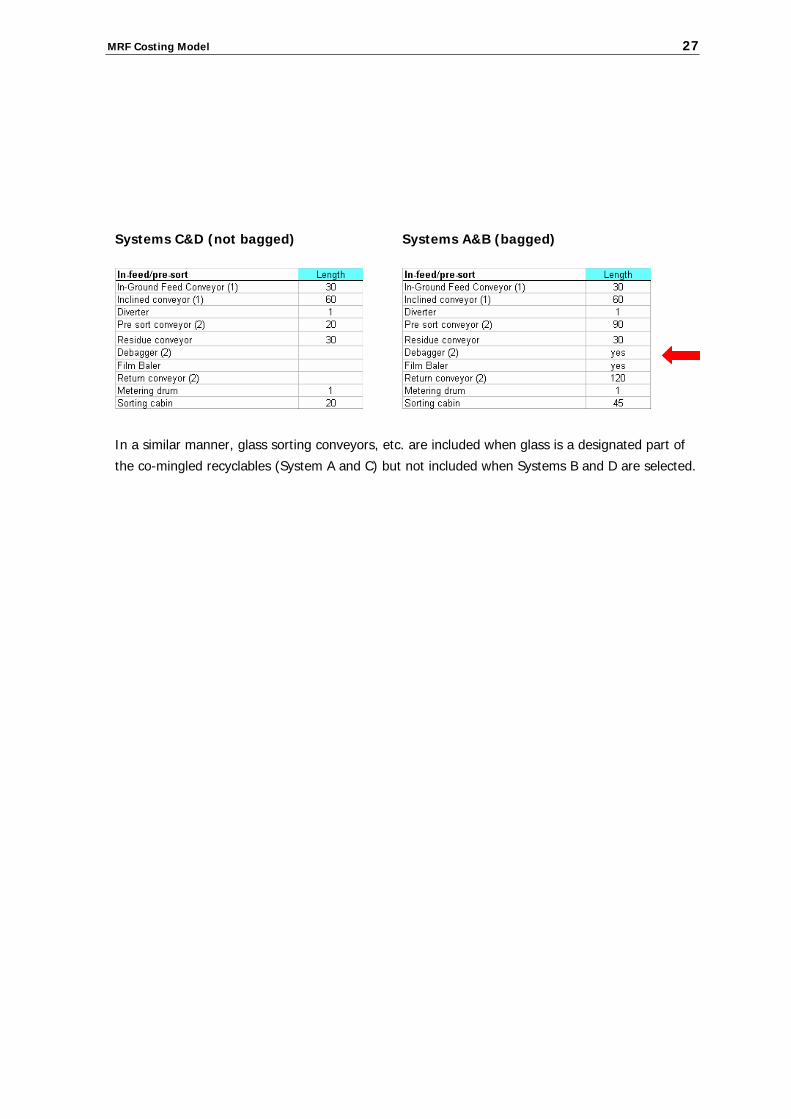
MRF Costing Model 27
Systems C&D (not bagged) Systems A&B (bagged)
In a similar manner, glass sorting conveyors, etc. are included when glass is a designated part of
the co-mingled recyclables (System A and C) but not included when Systems B and D are selected.

MRF Costing Model 28
Figure 6.1: Processing Schematic – Single Stream Co-mingled MRF
In-feed conveyor
Inclined conveyor
Pre-sort Cabin
OCC Screen
Screen (2)
Air classifier
• Film plastic (baler if bagged)
Bag Breaker (?)
• Non-recyclables (residue to compactor)
OCC
Mixed paper Screen
OH Magnet
Fe Natural PET
MixedGlass
Eddy Current
Alum cans
Residue
Fibre Sorting
News & pams
Mixed paper
Containers
News & pams
Fines Screen
“Unders”
“Separation”
Glass Cleanup
Residue
Plastics sorting
Col PET
Natural HDPE
Flattener
Col HDPE

MRF Costing Model 29
Systems B&D (no glass) Systems A&C (with glass)
The user has the ability to update equipment capital costs by including an appropriate inflation
index in Cell I66.
The equipment prices used in the models are indexed to November 2005 when they were
obtained. The user can select what they feel is the most appropriate index (e.g. RPI or Baxter’s) to
represent capital costs increases.
Mobile Plant and Other Equipment
The user can select the type (Cells H161-165), capital cost (Cells K161-165) and number of
individual pieces of mobile plant, roll-off containers and weighbridge equipment (Cells A161-165)
that will be required to operate the MRF.
Representative costs and the number of pieces of equipment required have been included here for
illustration. These requirements have been scaled back for the smaller MRFs (50, 25 and 10)
according to the design and the tonnages to be handled. The user can select to use this if no other

MRF Costing Model 30
data are available (the costs automatically increase with inflation as per the inflation factor
selected) or more appropriate data can be substituted as necessary.
Other Related Costs
The cost of other related items, such as steel for platforms, equipment supports, stairs, etc.
electrical instrumentation and controls, storage bunkers, etc. are itemized here. In most cases,
these are shown as a percentage of the equipment capital costs as itemized on the “Assumptions”
spreadsheet. A provisional sum is shown for “Start-up and Testing”.
This cost is very specific to the requirements that a local authority requests in a tender and the
degree of complexity of the MRF design. Typically, “Start-up and Testing” is comprised of three
phases:
1. Equipment Startup – operation of the equipment without material for 6 hrs for 2 consecutive
days to test equipment speeds, motor current and voltage, etc. and all control functions
2. Initial Operation - 3 consecutive days with material, to demonstrate that the equipment is
capable of “processing” the specified materials at the specified feed rates without overloads, trip
outs, spillage, etc., and
3. Acceptance Test - 5 consecutive days with material to check throughput, recovery rates,
staffing levels and product specifications.
Estimates for the duration and costs of this item have been included for each MRF design. Users
are free to substitute their own cost estimates related to their own requirements as necessary.

MRF Costing Model 31
Equipment Cost Summary
Equipment and related costs are then summarized for each processing component:
D. Building costs
Building requirements are comprised of four components:
1 receiving area (tipping floor)
2 processing area
3 material storage and shipping, and
4 administration area (offices, staff areas, toilets, etc.).
Receiving Area
Receiving area storage requirements are calculated using the selected incoming material tonnages (automatic when selecting the MRF type in cell B4), the densities of the individual materials,
selected average height of the stored materials on the tipping floor and the minimum number of days of storage required in the receiving area. The user can input densities, average storage
height and the number of days required storage in the “Assumptions” spreadsheet.
Minimum Storage Capacity
MRFs designed to process household dry recyclables typically receive these materials during the
daytime hours corresponding to local authority collection schedules. Even when MRFs operate one
shift per day, additional material is required on the tipping floor to allow early morning processing
to continue until collection vehicles arrive. More and more storage capacity is required to

MRF Costing Model 32
accommodate operating hours that are extended beyond those in a single shift. For a two shift
operation (the design premise of the MRFs in the Costing Model), it has been assumed that 2 day’s
storage capacity is required.
The user has the option of selecting both the operating conditions at the MRF and the receiving
area design storage capacity. In addition, a peaking factor has been included in the calculation for
receiving capacity to allow for peak seasonal flow of incoming material. The peaking factor in the
model has initially been set at 0% in the “Assumption” spreadsheet (cell B14). Tipping floor
storage capacity can be reduced if delivery of a steady supply of recyclables can be assured
(transfer from other local authorities).
Material Densities
Estimates of loose densities for all materials included in the incoming dry recyclables mix are
outlined in Column “D” of the “Assumptions” sheet. These values have been taken from a variety
of information sources including in-situ measurements and published density data and the values
used in the KAT model. The user has the ability to substitute values for any of these density
estimates. Incoming tonnages are converted to volume estimates in the receiving area calculation
using the selected densities.
Average Material Height (on the tipping floor)
Collection vehicles delivering recyclables to the MRF off-load onto the tipping floor. A loading
shovel then either moves the material to a “quiet” storage area of the tipping floor, or directs the
recyclables onto the initial feed conveyor for processing. To maximize storage capacity, recyclables
can be stored against properly-designed push walls (often side wall of the building). Calculation of
the required tipping floor area takes into account an average height of recyclables stored on the
tipping floor (cell B16 – “Assumptions” sheet). Designation of this average height must take into
consideration how much of the recyclables are to be stored on the open floor as opposed to
against push walls. An average 2 metres has been selected as the default height in the model,
recognizing that this will result in a conservative (i.e. larger) area calculation. By selecting a
conservative approach, additional tipping floor space will be provided to allow for vehicle unloading
and wheeled loader manoeuvring.

MRF Costing Model 33
Bale Storage Area
Calculations in this section of the model identify:
baling requirements (which materials require baling and the resulting baling throughput
capacity)
the average number of bales produced each day
the average number of bale shipping vehicles required per day, and
the floor space required to store bales for shipping.
The user is able to select which materials are to be baled by indicating “v” in Column B for the
appropriate material as indicated below.
This information is used to determine the required baling throughput (tonnes/hr) for fibre and
containers and hence the baler(s) to be used in the MRF. The selected baler specification(s) is
then used to determine average bale size and weight.
Although the calculation in the model assumes a common bale size for each type of material, some
balers permit variations in bale length. If this is the case, and the user wishes for the model to be
more exact, adjustments will be required in the calculation in Column “G” for individual materials.
The type of vehicle used to transport bales to market and the number of bales per vehicle is
identified in Columns “J” and “K”, respectively. The number of bales required (based on the
number of loads required for storage selected in Cell B16 – “Assumptions” sheet) and the resulting
floor area required (based on how high bales can be stored, as selected in Cell B15 –
“Assumptions” sheet) are then identified. The user can modify these details as desired.

MRF Costing Model 34
Approximate Processing Area
The area required for processing is very specific to the equipment selected and the layout of the
process. To assist in determining the processing area required for each MRF, a variety of operating
MRFs were reviewed to identify their processing areas. These areas are listed in the table at Cell
P275 and were plotted in the accompanying graph. The trendline on this graph was then used to
determine the appropriate processing area required for the MRF sizes in this study. These areas
are automatically entered in Cell D274. The user is free to designate an alternative area in this cell,
or to use the default area shown.
Staff and Administration Area
An allowance has been made in each MRF design for a staff administration area. Typically, this
would include offices, a reception area, a meeting room, toilets, change rooms and a staff
lunchroom. In some of the larger MRFs, additional space is also provided for an education and
training room. The default space allowance in the cost model should be reviewed by the user and
adjusted as necessary based on the particular requirements of the user.
E. Labour costs
The next component of the model determines labour required in the process for sorting
recyclables. The user identifies where positive sorting12 of a material is required by entering a “v”
beside the material in Column C as illustrated below:
12 “positive” sorting refers to a material being removed from a sorting conveyor (usually manually), whereas a negative sorted material refers to material left to fall off the end of a sorting conveyor.

MRF Costing Model 35
Sorting Rates
Based on the quantity of material to be sorted and the sorting rate identified in the “Assumptions”
spreadsheet, the theoretical number of sorters is determined (in Column E). The manual sorting
rates have been compiled from personal observations in a variety of MRFs and from published
industry sources. These rates are meant to be representative of average sorting rates, recognizing
that sorting rates at a given MRF are very dependent on a number of variables, including the
speed of the sorting conveyor, the depth of the material on the conveyor, the design of the sorting
station (position of chutes, height of the conveyor, etc.) and the sorting ability of the sorters
themselves. The user has the ability to substitute alternate sorting rates in the “Assumptions”
spreadsheet.
Manual Selection of Sorter Requirements
The calculation of sorter requirements in Column E identifies portions of sorters required for each
material (e.g. 6.1, 0.3, etc.). The user must select the number of full time equivalent (FTE)
sorters required (in columns “F” and “L”), considering the fractional sorters calculated
and the material being sorted. For instance, in the example shown above in the pre-sort cabin,
7 sorters have been conservatively selected for film removal, where 6.1 were shown as required.
For OCC and residue (0.3 and 0.6 sorters, respectively), 1 FTE sorter is selected, assuming that
sorter will be responsible for removal of both of those materials. In a similar manner, the user is
required to review each of the theoretical sorter requirements and to manually select the number
of sorters to be included. The model uses the manual FTE designations in columns “F” and “L” for
all subsequent cost calculations.
Automated Calculations
A number of automated calculations are imbedded in the model where appropriate. For instance,
the quantity of OCC requiring sorting in both the pre-sort and the fibre sort cabins varies,
depending on whether an OCC screen is used in the selected processing equipment as illustrated
in the schematic below:

MRF Costing Model 36
OCC Screen Not Included OCC Screen Included
100% of OCC
Fibre-Sort
90% of
10% of
0% of OCC in
100% of OCC
Fibre-Sort Cabin
8% of
2% of
90% of
0% of OCC in
Similarly, when the user selects a MRF with incoming bagged recyclables – if a bag breaker is
included in the design, the manual sorting rate for plastic film in the pre-sort cabin is automated to
4000 kg/sorter/hr, but is 2500 kg/sorter/hr if no bag breaker is used (the lower rate takes into
account that the sorter is required to break bags as well as remove the film). Also, when bagged
recyclables are selected, the pre-sort conveyors and cabin are automatically made larger to
accommodate the additional sorters required to remove film plastic.
Similar automated calculations are included for glass. When glass is selected in the incoming
recyclables, provisions are automatically made for additional processing equipment as required for
such as an air classifier, fines screen, sorting conveyors, etc. Also, as indicated below, for the 2
stream MRFs, Cell C308 automatically indicates with a “v” that manual sorting is required when
glass is included.
Notes are included in the individual cells where these automatic calculations are included (e.g.
B289 and B290) to highlight the assumptions to the user.

MRF Costing Model 37
Single Shift and Double Shift
The left side of the table shows sorter requirements for a single shift operation, while the right
side shows sorter requirements for a two shift operation. It should be pointed out that because of
economies of scale, sorter requirements do not exactly double for the two shift system.
Labour Summary
Below the sorter table, a summary of all labour requirements is presented. The number of sorters
and the number of operators for mobile plant (loaders, forklifts, etc.) previously selected are
automatically carried down to this summary. The user can now select the number of other staff
required to operate the MRF as highlighted in the yellow shaded cells illustrated below.
These cells include managers, labourers, administration staff, etc. Benefits (annual leave,
insurance, etc.) are included for all staff, at the rate selected in the “Assumptions” spreadsheet.
F. Variable operating costs
A number of additional costs are associated with operating a MRF. Most of these vary according
to the MRF throughput but some are fixed. These are discussed below.

MRF Costing Model 38
Baling Wire
Baling wire cost is calculated based on those materials selected for baling (described on page 21)
and an average cost of £2.50/tonne baled, as indicated in the “Assumptions” spreadsheet.
Very often, materials such as plastic will require more bale wire per bale than a material like card
(OCC). The cost of baling wire is a function of the number of bales produced, the size of the bale,
the number of ties used per bale, and the type of wire (thickness or “gauge”) used. The cost of
baling wire used as a default in the model is meant to represent an average cost per bale, taking
into account all of these factors. The user can substitute a more appropriate cost if one is
available.
Residue Disposal
The cost of disposing of residue generated from the MRF is calculated using the tipping fee
selected in the “Assumptions” spreadsheet and the annual tonnes requiring disposal. The disposal
cost should include the tipping fee at the disposal site as well as the cost of transport to that site.
The tonnage of residue requiring disposal is calculated and discussed in Section H “Estimated
Revenues and Residue”.
Fuel and Oil
This item accounts for operation of the various forklifts, loading shovels, etc. selected. The costs
shown are provisional allowances and can be modified as necessary to correspond to the
equipment selected.

MRF Costing Model 39
Utilities
Electrical consumption is the largest utility cost incurred in MRF operations. The use of water and
natural gas is minimal. The majority of electrical consumption is used to power the processing
equipment and can be estimated based on the horsepower of the selected equipment and the load
utilization factor. An allowance for annual kWh usage for each size of MRF has been provided in
Cell B354. This is multiplied by the cost of electricity (£0.075/kWh) as identified in the
“Assumptions” spreadsheet.
Insurance and Taxes
A provisional sum has been included in Cell D355 for the cost of site insurance and taxes.
Spare Parts
An inventory of spare parts most frequently required to maintain or repair processing equipment is
normally stored in the MRF. Experience has shown that these parts represent about 2% of the
capital cost of the processing equipment. This percentage is identified in Cell B80 of the
“Assumptions” sheets.
Security
The user has an opportunity to include the cost of any site security in the annual operating cost by
entering this cost estimate in Cell D357. If the MRF is to be sited on a property where security is
already provided, or if security is deemed unnecessary, this item can be disregarded.
Office
An allowance is provided in Cell D358 for miscellaneous supplies such as stationary, safety
equipment, etc.

MRF Costing Model 40
Equipment Maintenance
The annual cost of maintenance, expressed as a percentage of the capital cost of the processing
equipment, is itemized in Cell B81 of the “Assumptions” spreadsheet. This estimate (4%) is
increased by 2% if glass is included, to account for additional maintenance and earlier
replacement of glass-handling conveyor belts.
Business Tax
A space is included to add the cost of business tax, if this is appropriate to the MRF under
consideration. This cost has not been included in the models shown.
G. Summary – gross costs
Each of the major component costs are summarized here, to as to show the total capital and
annual costs (capital and operating) as well as the gross costs per tonne.
H. Estimated revenues and residue
This section compiles estimates of revenues gained from the recyclables to be marketed and
identifies the tonnage of material to be sent for disposal.
Residue
Recovery rates for the targeted recyclables identified in the “Assumptions” spreadsheet are used to
calculate the quantity of each recyclable to be marketed. The remaining tonnage (comprised of
recyclables not recovered and non-recyclables that are in with the recyclables delivered to the
MRF) is identified as residue. Residue is highlighted for both fibre and the containers and then
averaged for all of the incoming material. With the default values used in these models, residue is
14-18% for the single stream MRFs and 7-8% for the 2 stream MRFs.

MRF Costing Model 41
Revenues
Individual prices entered in the “Assumptions” spreadsheet for materials marketed are listed in
Column F. These are prices paid at the market or reprocessor. Users need to identify the cost of
shipping each recyclables material to the market selected and enter this value (expressed as
£/tonne) for each material in Column G. Sales prices for materials will vary according to how the
material is prepared. For instance, prices will differ if fibre is delivered to the market loose or
baled, or if aluminium is flattened or baled.
Users need to check market specifications and prices with markets under consideration to assess
the economics of marketing the recyclables in alternate forms. If baled news and PAMs has been
selected (as described in Section D “Bale Storage Area”), the corresponding market price and
shipping cost for baled news and PAMs needs to be entered in Columns “F” and “G”, respectively.
If it is decided not to bale news and PAMs and to send this material loose to market, the
appropriate market price needs to be entered in Columns “F” and “G”. The model as designed
does not take into account a portion of news and PAMs being baled and a portion sent loose to
market. The user will need to perform a manual calculation to identify the associated revenue for
this option.
In some instances, depending on the arrangement that a MRF operator may negotiate with the
market, the price paid for a material may be at the MRF (i.e. no shipping cost). In these cases, the
user should either enter zero (”0”) for the shipping cost or leave the cells blank.
Net revenues take into account projected revenue from the sale of recyclables. These are also
expressed per tonne of material delivered and per tonne of material marketed.
I. Summary of Costs
At the bottom of each MRF model, costs and key operating details are summarized for use in the
“Summary Cost” spreadsheet in both the SSMRFs.xls and 2Stream MRFs.xls workbooks. This
spreadsheet presents a comparison of this information for each MRF size.
In addition, the spreadsheet entitled “Graph” in each workbook plots both the gross and net costs
for each of the four MRF models, for MRFs operating at full capacity (2 shifts) and at 50% capacity
(1 shift).

MRF Costing Model 42
When comparing costs for each of the four MRF sizes on either the “Summary Cost” or “Graph”
spreadsheets, the user must be careful to ensure that the same type of MRF conditions are
selected for each of the four MRFs. For instance, if comparing single stream co-mingled MRFs, all
MRFs must be operating on the same incoming composition (either “A”, “B”, “C”, or “D”). Also,
users must make sure to manually confirm the number of FTE sorters each time a
change is made to the MRF design or operation.

MRF Costing Model 43
7. 2-Stream MRF model
Components of the 2-stream MRF costing model were developed in the same manner as the single
stream MRF model. A schematic of the process flow for the 2-stream system is shown in Figure
7.1.
Figure 7.1: Processing Schematic for 2-Stream MRF
Container In-feed conveyor
Inclined conveyor
Fines Screen
Air classifier
• Film plastic
• Non-recyclables (residue)
OCC
News & pams
Mixed paper
OH Magnet
Fe
ClearGlass
Residue
Fibre Sorting
Fibre In-feed conveyor
Inclined conveyor
Pre-sort Cabin
OCC Screen
News Screen
Containers
Mixed paper
News & pams
Glass Sorting
Glass Cleanup Residue
Mixed Broken Glass
Natural PET
Eddy Current
Alum cans
Plastics sorting
Col PET
Natural HDPE
Flattener
Col HDPE
MRF Costing Model 44
Each of the two streams (containers and fibres) has their own separate tipping floors and in-feed
conveyor lines. Since screens are used in the larger MRF models, pre-sort facilities are
incorporated. In the smaller MRFs, pre-sorting is done as the first step in sorting fibre.
Two balers are provided in the larger MRFs, with separate conveyor feeds to each baler. In the
smaller MRFs, a single baler feed conveyor system is used to feed a single baler. As for the single
stream designs, a baler bypass is provided to allow for shipping news and PAMs loose to market.
As previously discussed, when glass is included with the incoming recyclables, provisions for
sorting clear glass have been included in the MRF design. Revenue for glass assumes that all other
glass is marketed as mixed broken glass.

MRF Costing Model 45
8. Sample model applications
The primary intent of the MRF models is to provide local authorities with a costing tool that can be
used in conjunction with the KAT collection model to evaluate various options for collecting and
processing recyclables. By using the model for a MRF of a particular design capacity, the user is
able to identify:
the costs of a 2-stream and single stream co-mingled processing system
the cost of adding glass to the incoming recyclables streams
the additional costs associated with processing bagged recyclables at a single stream co-
mingled MRF.
Each of these can be investigated under a wide range of operating parameters and several
material marketing options.
8.1 The Cost of Processing Bagged Recyclables
The following example is provided to show how a user might use the MRF model to identify the
additional cost of processing bagged recyclables. This example will look at a 25,000 tpa single
stream co-mingled MRF without glass for the bagged and loose options (“B” and “D” respectively
in Cell B4 of the 25,000 MRF model).
The following table summarizes net costs for each of the two systems:
Table 8.1: Net Processing Cost – 25,000 tpa Single Stream Co-mingled MRF
Incoming Stream Single Shift (£/tonne) Two Shifts (£/tonne)
Bagged (B) £59 £31
Loose (D) £52 £26
Difference £ 7 £5
The bagged MRF requires a bag breaker, additional pre-sorting for the plastic film, a longer pre-
sort conveyor and sorting cabin and a dedicated film baler. On average, the additional cost of
processing plastic bags in a MRF of this size from a bagged recycling collection programme is
between £5-7/tonne of incoming recyclables, depending on the quantity processed and the
operating conditions.

MRF Costing Model 46
8.2 The Cost of Processing Glass
The model can also be used to identify the processing cost of including glass in the incoming mix
of recyclables to be processed. For an 85,000 tpa 2-Stream MRF, the following costs result for a
glass in (“E”) and glass out (“F”) scenario:
Table 8.2: Net Processing Cost – 85,000 tpa 2-Stream MRF
Incoming Stream Single Shift (£/tonne) Two Shifts (£/tonne)*
Glass in (E) £8 -£4
Glass out (F) £1 -£10
Difference £ 7 £6
* in this model, negative costs (e.g. -£3/tonne) indicate a net revenue
The net cost of processing glass ranges between £7 and £6/tonne of incoming recyclables
processed. The model shows that for a single shift operation, the net cost of processing glass is
about £7/tonne, while for a 2 shift operation, there is a net revenue difference of about £6/tonne.
The user should recognise that each of the MRF models use the incoming tonnages identified in
the “Composition” worksheet. If glass is included in the mixture, as in systems “A”, “C” and “E”,
then the percentage composition of each of the other component materials changes. For instance,
when glass is included in system “A” the percentage of news and PAMs is 20.5%. When glass is
not included (system “B”) the percentage of news and PAMs increases to 24.6% of the overall
mixture. This has a bearing on the models since the number of sorters, material sales revenues,
etc. fluctuate according to the quantity of each component material. In this example, if glass is in
the mixture, the revenue for paper, plastics and other materials falls since the incoming tonnages
of these materials are lower.
By using the model to identify the net cost of processing glass at the MRF, the user can weigh the
additional processing cost against the additional cost of collecting glass in a segregated form.

MRF Costing Model 47
8.3 Co-mingled Single Stream vs 2-Stream Processing
In addition to the two MRF Excel workbooks, there is a worksheet with the title “Summary Cost
Graph.xls”. This contains summary graphs of the gross and net costs of the Single Stream and the
2-Stream MRFs. When using this worksheet, users must ensure that:
all three workbooks are opened at the same time, and
all MRFs in each of the cost models are set up to evaluate the same system e.g. single stream
with glass (“C”) to compare with 2-stream with glass (“E”).
The net MRF Cost graph shows that the cost of processing for a single stream MRF (with glass)
exceeds that of a 2-stream MRF from about £7/tonne (for a 85,000 tpa MRF) to £22/tonne (for a
10,000 tpa MRF), both operating at 100% capacity.
8.4 Optical Sorting
More and more of today’s modern MRFs are incorporating optical sorting technology to replace
manual sorting, primarily for paper, plastics and glass. Although this technology for sorting
recyclables is relatively new to the UK and North America, it has been used in Europe since the
early 1990’s.
Typically, containers are flattened (to reduce rolling) and directed onto a high-speed acceleration
conveyor that is required to spread material out and to reduce the burden depth on the belt.
Ideally, as the material passes under the sensors, there should be separation between each object
on the conveyor belt. This separation allows for accurate identification of the material type and
also reduces the possibility of unwanted material being ejected together with the target materials.
Identification of a container type on the conveyor is typically determined using the near infrared
(NIR) part of the electromagnetic spectrum. Each material absorbs and reflects different amounts
of specific frequencies of the near infrared spectrum and by analyzing the reflected spectrum, the
type of plastic can be determined.
A number of NIR sensors arranged across the width of the machine above the belt analyse the
light reflected from the part of the belt immediately below it. Each object on the conveyor is
identified based on its position and as the targeted materials reach the end of the conveyor, they
are selectively removed from the material flow using directed and controlled compressed air
impulses

MRF Costing Model 48
These sensors generally allow removal of 90-95% of the targeted materials from the mixture
(known as the “hit rate”), but in doing so, also include a certain portion of other non-targeted
materials. The quantity of the targeted materials in the ejected stream is described by its “purity”.
Most sensors are capable of producing a purity rate of 85-90% meaning that 10-15% of the
ejected material is non-targeted material. In most instances, this level of contamination in the
ejected product means that some degree of manual quality control sorting is required before the
material is shipped to market.
There are a number of well known manufacturers of this equipment with a track record in MRF
sorting applications (MSS, Pellenc, TiTech, Binder). The optical sorters and related equipment are
relatively expensive and their use is therefore often easier to justify in larger MRF applications.
Optical sorting equipment has not been included in these MRF models because of the difficulty of
incorporating the wide variety of applications into the model formulae. However, an example of
how to evaluate the economics of such an application is presented below.
Optical sorting of Plastics
The following is an example using system “D” (Single Stream without glass) for the 85,000 tpa
single stream co-mingled MRF. The following are the manual sorting requirements for plastics at
full throughput capacity (2 shifts):
Theoretical Actual
Sorters/day
32432
Material Sorters/day
PET natural 2.6PET coloured 2.0HDPE natural 3.6HDPE coloured 2.1PVC 1.1Other bottles 0.0
Since the greatest number of sorters are required for natural PET (3) and natural HDPE (4), it is
assumed that a dual eject optical sorter will be evaluated to eject these resins13. A schematic of
this system follows and Table 8.3 summarises representative costs for the sorting equipment for
this application.
13 A maximum of two ejected plastic streams is possible with a single optical sorter. More resin separations would require more optical sorters.

MRF Costing Model 49
Natural PET
Natural HDPE
Containers
Other Containers
Table 8.3: Approximate Capital Cost of Optical Sorting Equipment
Dual eject optical sorter £150,000Accelerator conveyor, flattener, conveyors £100,000Associated platforms, supports, conveyors £50,000
Sub total £300,000
Electrical and Mechanical, freight, installation £150,000Contingency (10%) £45,000
Total £495,000
Say £500,000
Both of the ejected plastic streams will require a minimum of 1 sorter for quality control on each
line. A comparison of the system cost of each alternative follows:
Table 8.4: Optical Sort vs Manual Sort Costs
Manual Sort Annual Cost
Natural PET (3 sorters @ £7 x 2000 hrs +27% OH) = £53,340
Natural HDPE (4 sorters @ £7 x 2000 hrs +27% OH) = £71,120
Total Annual Cost £124,460
Optical Sort (£500,000 initial capital cost)
QC sorters (2 sorters @ £7 x 2000 hrs +27% OH) = £35,560
Estimated annual maintenance = £10,000
Total Annual Cost £45,560

MRF Costing Model 50
The annual cost of the manual sorting alternative is £124,460 per year. For the optical sort option,
if the initial capital expenditure (£500,000) is realized in 2006, the additional annual operating cost
thereafter is projected at £45,56014. Figure 8.1 illustrates that the payback period (i.e. the number
of years at which the cumulative costs of the systems are equal) for the optical sorter is less than
7 years.
Figure 8.1:Optical Sort Pay-Back Period
£0
£200,000
£400,000
£600,000
£800,000
£1,000,000
£1,200,000
2006 2007 2008 2009 2010 2011 2012 2013 2014
manual optical
In 2012, the cumulative cost of optically sorting two plastic resins approaches the cumulative cost
of the seven manual sorters. Aside from the cost, there may be other reasons to replace sorters
with automated equipment. These include difficulties in recruiting competent staff, periodic
absenteeism, the cost of training and supervision, etc.
14 This does not include incremental costs for compressed air and power

MRF Costing Model 51
9. Summary
Although the intent of the MRF Costing Model is to provide the user with a tool to identify
representative costs for a variety of MRF sizes and processing options, there are a number of
general observations that can be drawn from using the model:
1 The cost curves for both the single stream co-mingled and the 2-stream MRFs rise
dramatically at lower tonnages and flatten out at higher tonnages with little further
reduction in processing cost per tonne once over around 90,000tpa capacity has been
reached.
Fully co-mingled MRF - cost per tonne
£0
£20
£40
£60
£80
£100
£120
£140
£160
£180
£200
0 10000 20000 30000 40000 50000 60000 70000 80000 90000
Tonnes/yr
Cos
t/to
nne
Gross Cost 50% CapacityGross Cost Full Capacity
This demonstratesthere are economies of scale to be realized by processing more
recyclables at larger MRFs.
2 There is an economic advantage to processing as much tonnage as possible at a MRF. As
shown in the sample chart above, the lowest cost curve for any particular MRF is that
produced when the MRF is operating at full design capacity. Any reduction in throughput
tonnage below that level increases the unit cost of processing. The chart above shows the
impact of operating at 50% capacity (i.e. 1 shift as opposed to 2 shifts).
3 The Costing Model shows that processing costs at a single stream co-mingled MRF are
higher than those at the same capacity 2-stream MRF. The additional gross cost ranges
from £6/tonne (at 85,000 tpa) to £23/tonne (at 10,000 tpa).

MRF Costing Model 52
4 The cost of processing bagged recyclables at a MRF is higher than processing loose
recyclables and ranges from a low of £5/tonne (at 85,000 tpa, full capacity) to £13/tonne
(at 10,000 tpa, 50% capacity).
5 With the assumptions used in the Costing Models, processing glass at full capacity, single
stream co-mingled MRFs adds from £6 to £10/tonne to the processing cost and from
£5/tonne to £10/tonne at full capacity, 2-stream MRFs.

Appendix A
MRF Costing M
Background composition data
odel 53
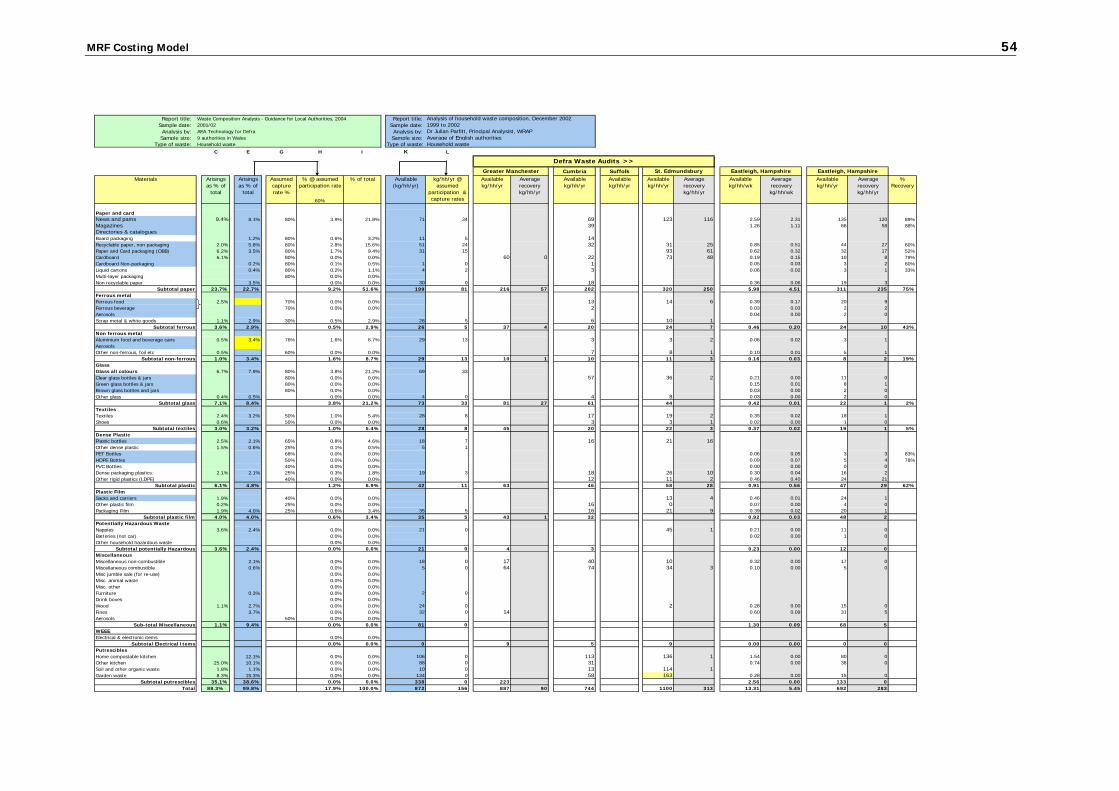
MRF Costing Model 54
Report title: Waste Composition Analysis - Guidance for Local Authorities, 2004 Report title: Sample date: 2001/02 Sample date: Analysis by: AEA Technology for Defra Analysis by: Sample size: 9 authorities in Wales Sample size:
Type of waste: Household waste Type of waste: C E G H I K L
Cumbria Suffolk
60%
Paper and cardNews and pams 9.4% 8.1% 80% 3.9% 21.8% 71 34 69 123 116 2.59 2.31 135 120 89%Magazines 39 1.26 1.11 66 58 88%Directories & cataloguesBoard packaging 1.2% 80% 0.6% 3.2% 11 5 14Recyclable paper, non packaging 2.0% 5.8% 80% 2.8% 15.6% 51 24 32 31 25 0.85 0.51 44 27 60%Paper and Card packaging (OBB) 6.2% 3.5% 80% 1.7% 9.4% 31 15 93 61 0.62 0.32 32 17 52%Cardboard 6.1% 80% 0.0% 0.0% 60 0 22 73 48 0.19 0.15 10 8 79%Cardboard Non-packaging 0.2% 80% 0.1% 0.5% 1 0 1 0.05 0.03 3 2 60%Liquid cartons 0.4% 80% 0.2% 1.1% 4 2 3 0.06 0.02 3 1 33%Multi-layer packaging 80% 0.0% 0.0%Non recyclable paper 3.5% 0.0% 0.0% 30 0 18 0.36 0.06 19 3
Subtotal paper 23.7% 22.7% 9.2% 51.6% 199 81 216 57 202 320 250 5.98 4.51 311 235 75%Ferrous metalFerrous food 2.5% 70% 0.0% 0.0% 13 14 6 0.39 0.17 20 9Ferrous beverage 70% 0.0% 0.0% 2 0.03 0.03 2 2Aerosols 0.04 0.00 2 0Scrap metal & white goods 1.1% 2.9% 30% 0.5% 2.9% 26 5 6 10 1
Subtotal ferrous 3.6% 2.9% 0.5% 2.9% 26 5 37 4 20 24 7 0.46 0.20 24 10 43%Non ferrous metalAluminium food and beverage cans 0.5% 3.4% 76% 1.6% 8.7% 29 13 3 3 2 0.06 0.02 3 1AerosolsOther non-ferrous, foil etc 0.5% 60% 0.0% 0.0% 7 8 1 0.10 0.01 5 1
Subtotal non-ferrous 1.0% 3.4% 1.6% 8.7% 29 13 10 1 10 11 3 0.16 0.03 8 2 19%GlassGlass all colours 6.7% 7.9% 80% 3.8% 21.2% 69 33Clear glass bottles & jars 80% 0.0% 0.0% 57 36 2 0.21 0.00 11 0Green glass bottles & jars 80% 0.0% 0.0% 0.15 0.01 8 1Brown glass bottles and jars 80% 0.0% 0.0% 0.03 0.00 2 0Other glass 0.4% 0.5% 0.0% 0.0% 4 0 4 8 0.03 0.00 2 0
Subtotal glass 7.1% 8.4% 3.8% 21.2% 73 33 81 27 61 44 0.42 0.01 22 1 2%TextilesTextiles 2.4% 3.2% 50% 1.0% 5.4% 28 8 17 19 2 0.35 0.02 18 1Shoes 0.6% 50% 0.0% 0.0% 3 3 1 0.02 0.00 1 0
Subtotal textiles 3.0% 3.2% 1.0% 5.4% 28 8 45 20 22 3 0.37 0.02 19 1 5%Dense PlasticPlastic bottles 2.5% 2.1% 65% 0.8% 4.6% 18 7 16 21 16Other dense plastic 1.5% 0.6% 25% 0.1% 0.5% 5 1PET Bottles 68% 0.0% 0.0% 0.06 0.05 3 3 83%HDPE Bottles 50% 0.0% 0.0% 0.09 0.07 5 4 78%PVC Bottles 40% 0.0% 0.0% 0.00 0.00 0 0Dense packaging plastics 2.1% 2.1% 25% 0.3% 1.8% 19 3 18 26 10 0.30 0.04 16 2Other rigid plastics (LDPE) 40% 0.0% 0.0% 12 11 2 0.46 0.40 24 21
Subtotal plastic 6.1% 4.8% 1.2% 6.9% 42 11 63 46 58 28 0.91 0.56 47 29 62%Plastic FilmSacks and carriers 1.9% 40% 0.0% 0.0% 13 4 0.46 0.01 24 1Other plastic film 0.2% 25% 0.0% 0.0% 16 0 0.07 0.00 4 0Packaging Film 1.9% 4.0% 25% 0.6% 3.4% 35 5 16 21 9 0.39 0.02 20 1
Subtotal plastic film 4.0% 4.0% 0.6% 3.4% 35 5 43 1 32 0.92 0.03 48 2Potentially Hazardous WasteNappies 3.6% 2.4% 0.0% 0.0% 21 0 45 1 0.21 0.00 11 0Batteries (not car) 0.0% 0.0% 0.02 0.00 1 0Other household hazardous waste 0.0% 0.0%
Subtotal potentially Hazardous 3.6% 2.4% 0.0% 0.0% 21 0 4 3 0.23 0.00 12 0MiscellaneousMiscellaneous non-combustible 2.1% 0.0% 0.0% 18 0 17 40 10 0.32 0.00 17 0Miscellaneous combustible 0.6% 0.0% 0.0% 5 0 64 74 34 3 0.10 0.00 5 0Misc jumble sale (for re-use) 0.0% 0.0%Misc. animal waste 0.0% 0.0%Misc. other 0.0% 0.0%Furniture 0.3% 0.0% 0.0% 2 0Drink boxes 0.0% 0.0%Wood 1.1% 2.7% 0.0% 0.0% 24 0 2 0.28 0.00 15 0Fines 3.7% 0.0% 0.0% 32 0 14 0.60 0.09 31 5Aerosols 50% 0.0% 0.0%
Sub-total Miscellaneous 1.1% 9.4% 0.0% 0.0% 81 0 1.30 0.09 68 5WEEEElectrical & electronic items 0.0% 0.0%
Subtotal Electrical Items 0.0% 0.0% 0 9 5 9 0.00 0.00 0 0PutresciblesHome compostable kitchen 12.1% 0.0% 0.0% 106 0 113 136 1 1.54 0.00 80 0Other kitchen 25.0% 10.1% 0.0% 0.0% 88 0 31 0.74 0.00 38 0Soil and other organic waste 1.8% 1.1% 0.0% 0.0% 10 0 13 114 1Garden waste 8.3% 15.3% 0.0% 0.0% 134 0 58 163 0.28 0.00 15 0
Subtotal putrescibles 35.1% 38.6% 0.0% 0.0% 338 0 223 2.56 0.00 133 0Total 88.3% 99.8% 17.9% 100.0% 872 156 887 90 744 1100 313 13.31 5.45 692 283
Arisings as % of
total
kg/hh/yr @ assumed
participation & capture rates
Available (kg/hh/yr)
Greater Manchester% of total
Defra Waste Audits >>St. Edmundsbury
Available kg/hh/yr
Available kg/hh/yr
Average recovery kg/hh/yr
Average recovery kg/hh/yr
Available kg/hh/yr
Available kg/hh/yr
Materials Arisings as % of
total
Assumed capture rate %
% @ assumed participation rate
Available kg/hh/wk
Average recovery kg/hh/wk
% Recovery
Analysis of household waste composition, December 20021999 to 2002Dr Julian Parfitt, Principal Analysist, WRAPAverage of English authoritiesHousehold waste
Eastleigh, HampshireAvailable kg/hh/yr
Average recovery kg/hh/yr
Eastleigh, Hampshire