mri artifacts this presentation is available at: zhuo, j. et al. radiographics 2006;26:275-297,...
TRANSCRIPT
MRI ArtifactsMRI Artifacts
This presentation is available at: This presentation is available at: http://www.radiology.mcg.edu/RadiologyPhysics/http://www.radiology.mcg.edu/RadiologyPhysics/
Zhuo, J. et al. Radiographics 2006;26:275-297, Zhuo, J. et al. Radiographics 2006;26:275-297, AAPM/RSNA Physics Tutorial for Residents: AAPM/RSNA Physics Tutorial for Residents:
MRI Artifacts, Safety and Quality ControlMRI Artifacts, Safety and Quality Control
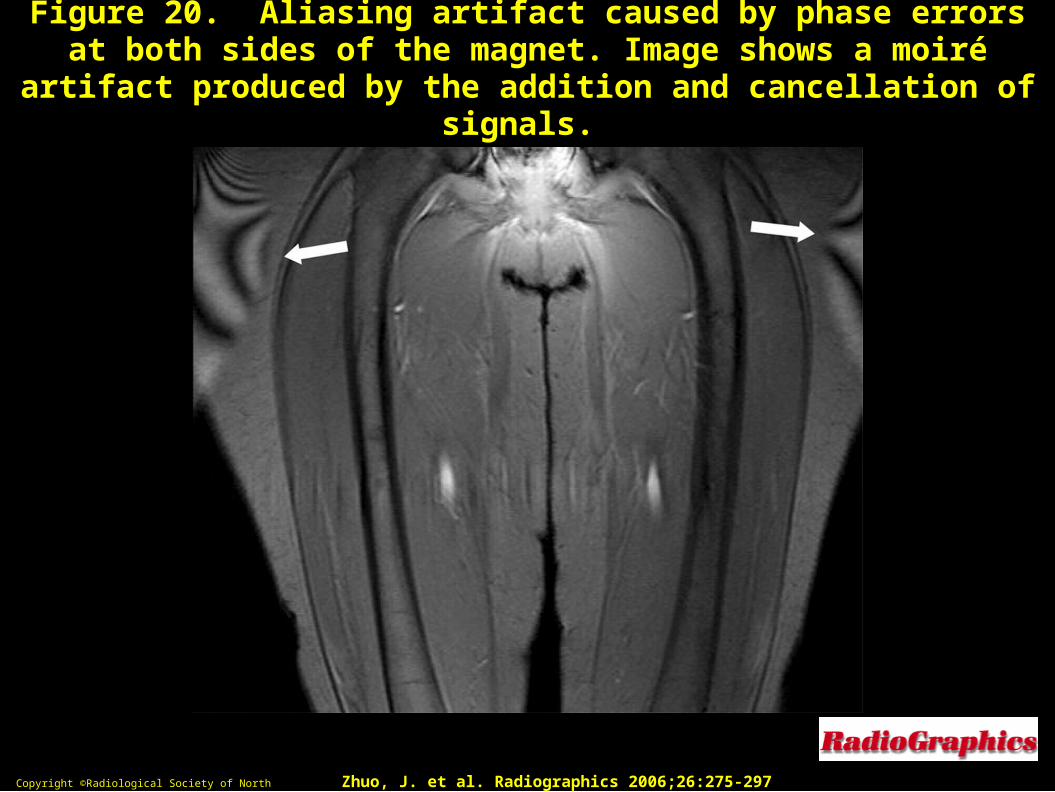
Figure 20. Aliasing artifact caused by phase errors at both sides of the Figure 20. Aliasing artifact caused by phase errors at both sides of the magnet. Image shows a moiré artifact produced by the addition and magnet. Image shows a moiré artifact produced by the addition and
cancellation of signals.cancellation of signals.
Copyright ©Radiological Society of North America, 2006Copyright ©Radiological Society of North America, 2006 Zhuo, J. et al. Radiographics 2006;26:275-297Zhuo, J. et al. Radiographics 2006;26:275-297
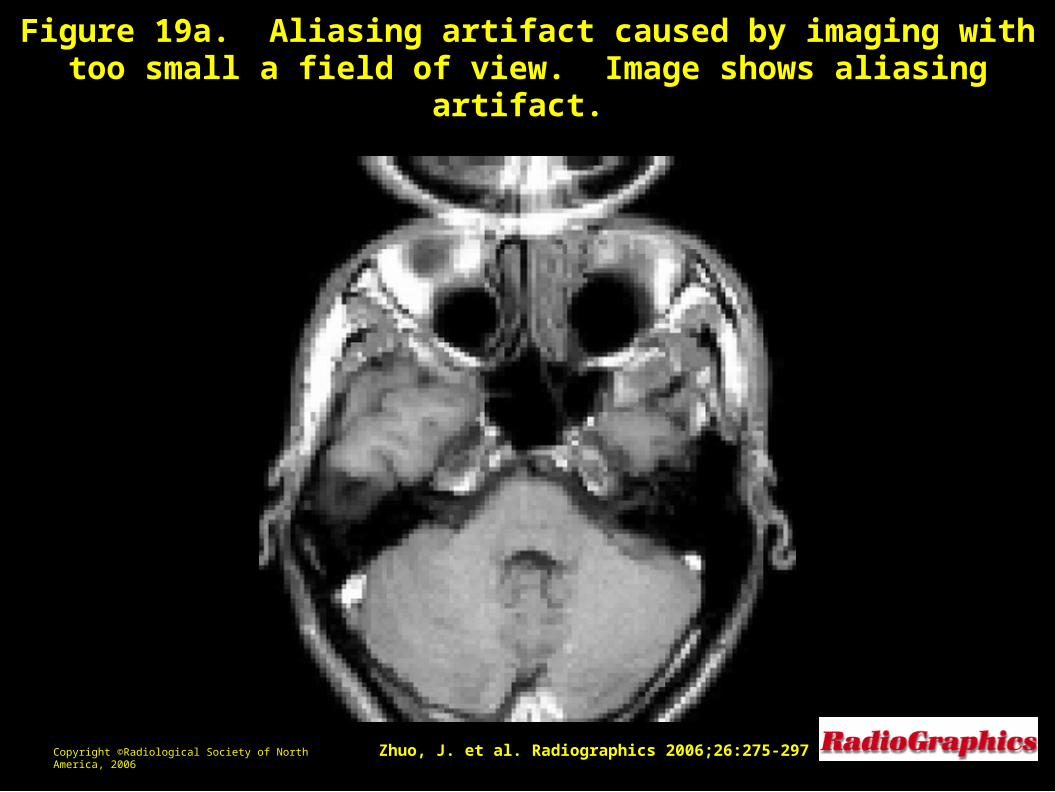
Figure 19a. Aliasing artifact caused by imaging with too small a field of Figure 19a. Aliasing artifact caused by imaging with too small a field of view. Image shows aliasing artifact. view. Image shows aliasing artifact.
Copyright ©Radiological Society of North America, 2006Copyright ©Radiological Society of North America, 2006 Zhuo, J. et al. Radiographics 2006;26:275-297Zhuo, J. et al. Radiographics 2006;26:275-297
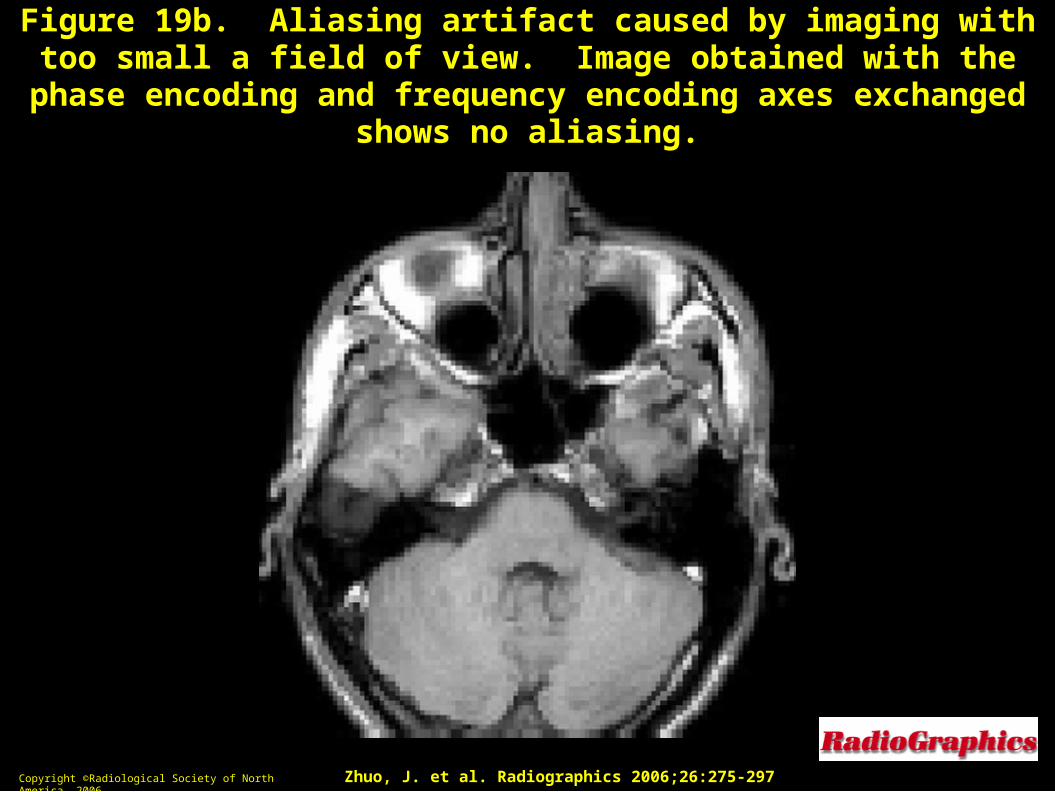
Figure 19b. Aliasing artifact caused by imaging with too small a field of Figure 19b. Aliasing artifact caused by imaging with too small a field of view. Image obtained with the phase encoding and frequency encoding view. Image obtained with the phase encoding and frequency encoding
axes exchanged shows no aliasing.axes exchanged shows no aliasing.
Copyright ©Radiological Society of North America, 2006Copyright ©Radiological Society of North America, 2006 Zhuo, J. et al. Radiographics 2006;26:275-297Zhuo, J. et al. Radiographics 2006;26:275-297
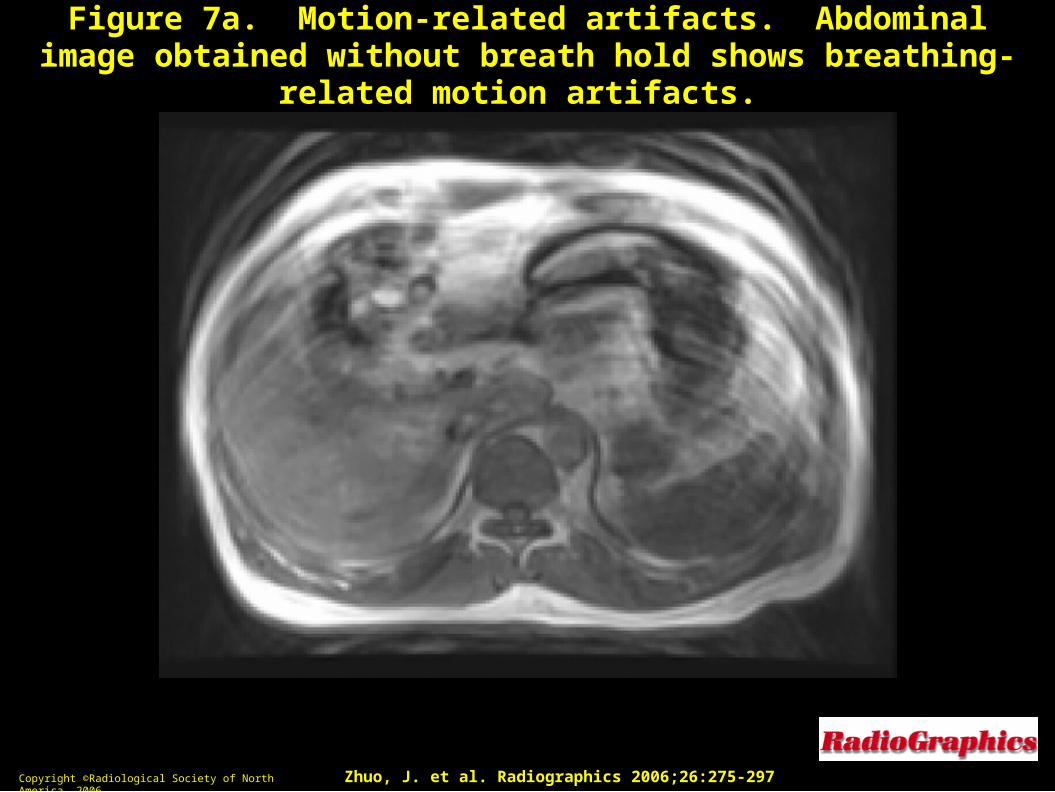
Figure 7a. Motion-related artifacts. Abdominal image obtained without Figure 7a. Motion-related artifacts. Abdominal image obtained without breath hold shows breathing-related motion artifacts. breath hold shows breathing-related motion artifacts.
Copyright ©Radiological Society of North America, 2006Copyright ©Radiological Society of North America, 2006 Zhuo, J. et al. Radiographics 2006;26:275-297Zhuo, J. et al. Radiographics 2006;26:275-297
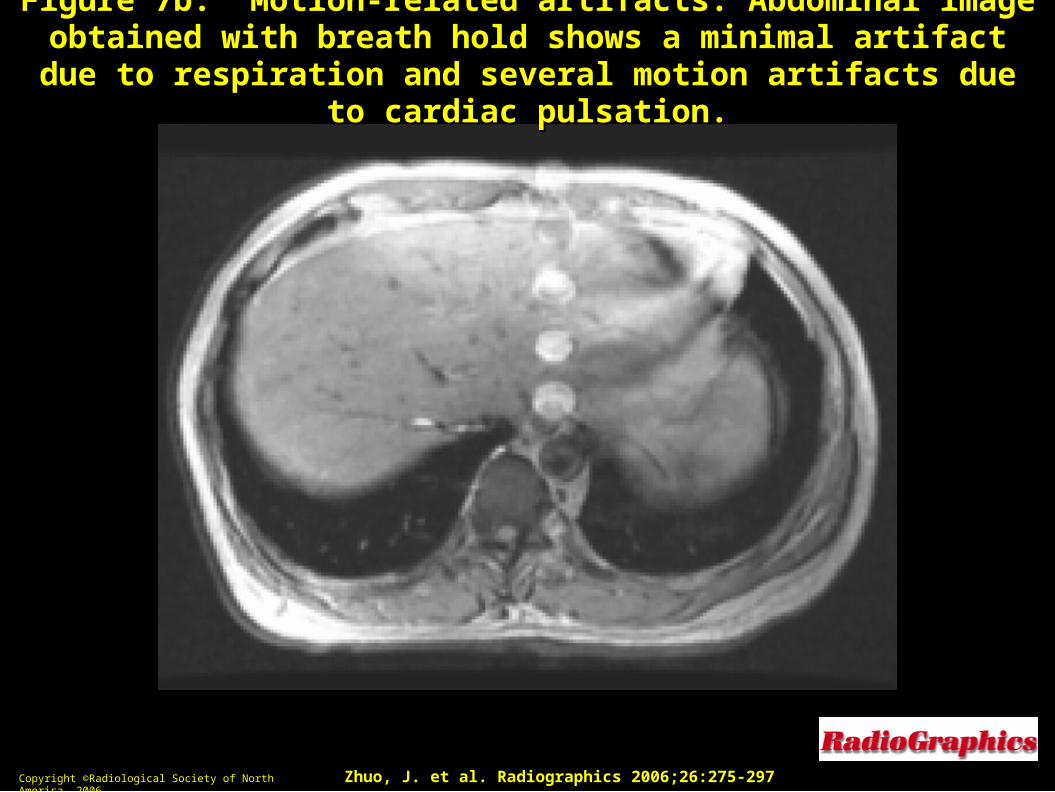
Figure 7b. Motion-related artifacts. Abdominal image obtained with Figure 7b. Motion-related artifacts. Abdominal image obtained with breath hold shows a minimal artifact due to respiration and several breath hold shows a minimal artifact due to respiration and several
motion artifacts due to cardiac pulsation.motion artifacts due to cardiac pulsation.
Copyright ©Radiological Society of North America, 2006Copyright ©Radiological Society of North America, 2006 Zhuo, J. et al. Radiographics 2006;26:275-297Zhuo, J. et al. Radiographics 2006;26:275-297
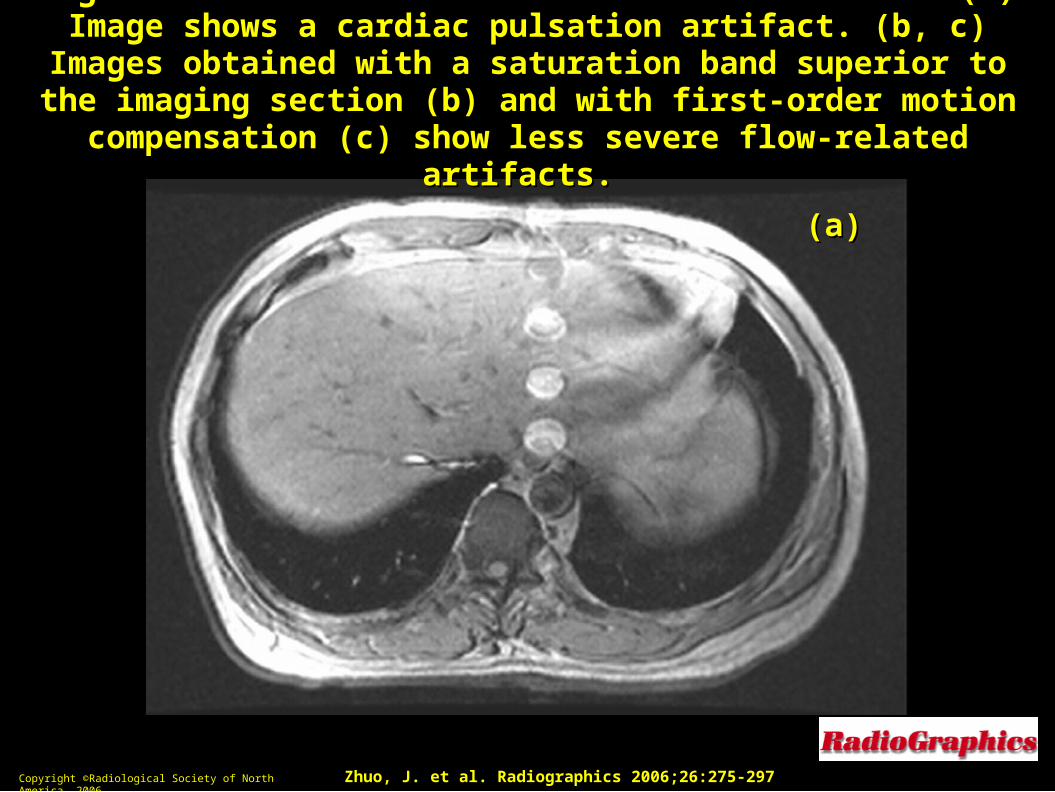
Figure 11a. Control of flow-related artifacts. (a) Image shows a cardiac Figure 11a. Control of flow-related artifacts. (a) Image shows a cardiac pulsation artifact. (b, c) Images obtained with a saturation band superior pulsation artifact. (b, c) Images obtained with a saturation band superior to the imaging section (b) and with first-order motion compensation (c) to the imaging section (b) and with first-order motion compensation (c)
show less severe flow-related artifacts.show less severe flow-related artifacts.
Copyright ©Radiological Society of North America, 2006Copyright ©Radiological Society of North America, 2006 Zhuo, J. et al. Radiographics 2006;26:275-297Zhuo, J. et al. Radiographics 2006;26:275-297
(a)(a)
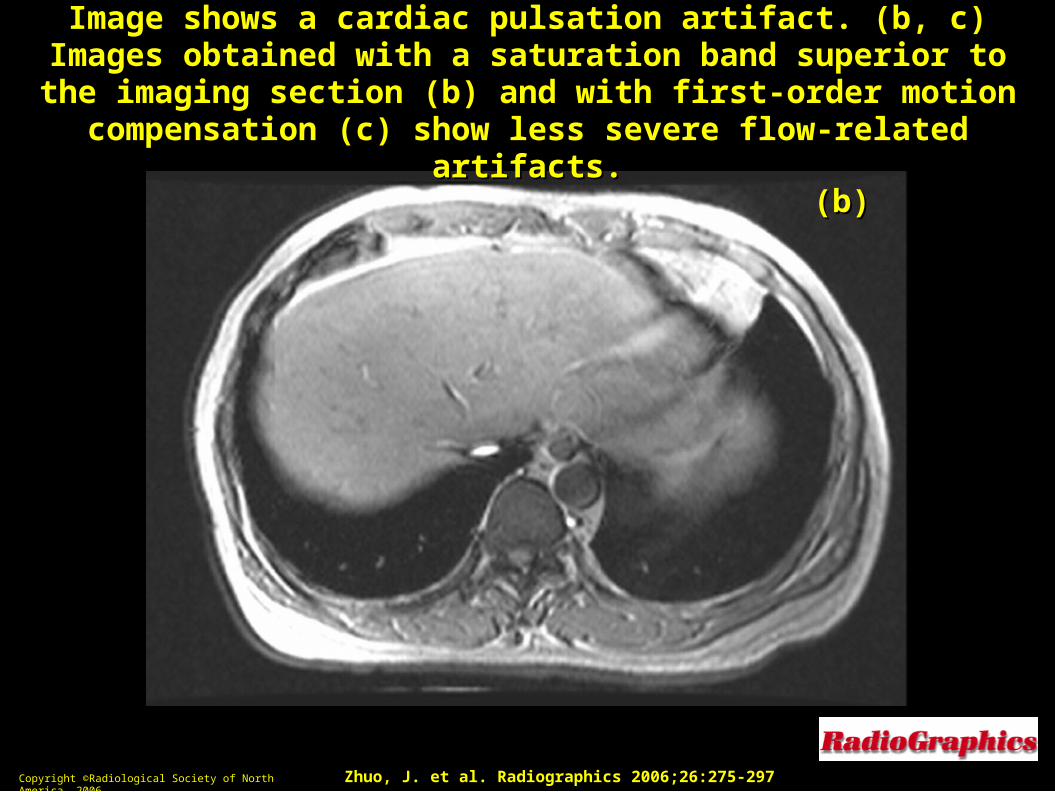
Figure 11b. Control of flow-related artifacts. (a) Image shows a cardiac Figure 11b. Control of flow-related artifacts. (a) Image shows a cardiac pulsation artifact. (b, c) Images obtained with a saturation band superior pulsation artifact. (b, c) Images obtained with a saturation band superior to the imaging section (b) and with first-order motion compensation (c) to the imaging section (b) and with first-order motion compensation (c)
show less severe flow-related artifacts.show less severe flow-related artifacts.
Copyright ©Radiological Society of North America, 2006Copyright ©Radiological Society of North America, 2006 Zhuo, J. et al. Radiographics 2006;26:275-297Zhuo, J. et al. Radiographics 2006;26:275-297
(b)(b)
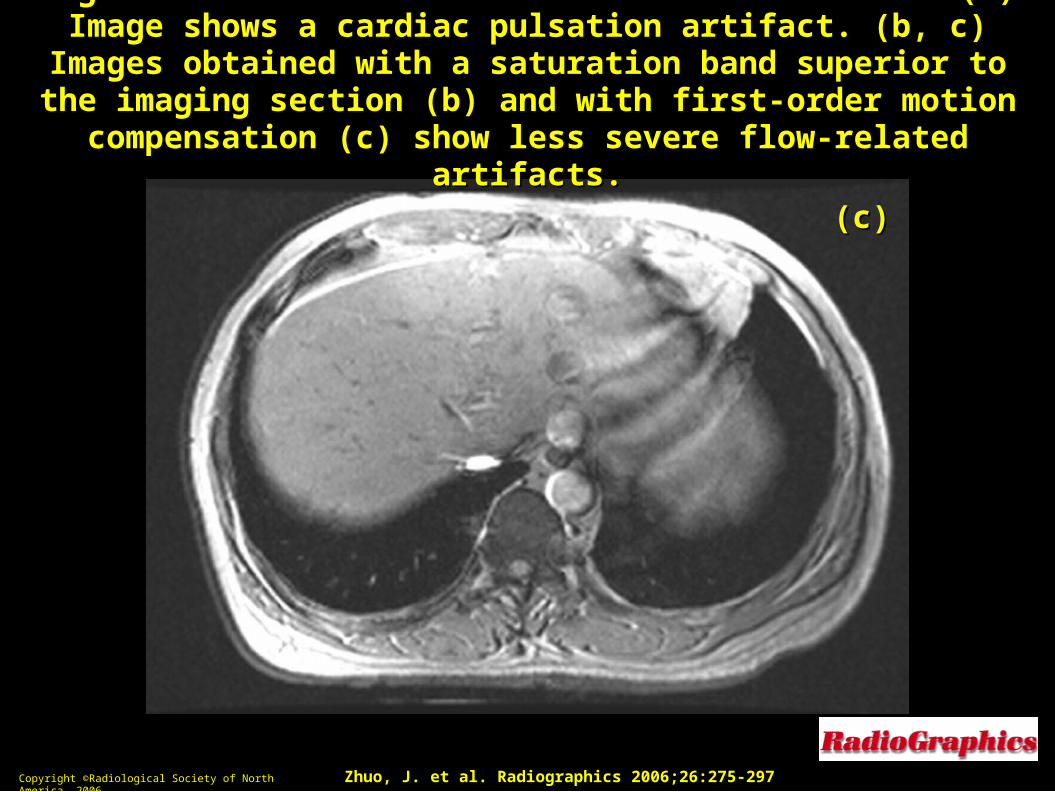
Figure 11c. Control of flow-related artifacts. (a) Image shows a cardiac Figure 11c. Control of flow-related artifacts. (a) Image shows a cardiac pulsation artifact. (b, c) Images obtained with a saturation band superior pulsation artifact. (b, c) Images obtained with a saturation band superior to the imaging section (b) and with first-order motion compensation (c) to the imaging section (b) and with first-order motion compensation (c)
show less severe flow-related artifacts.show less severe flow-related artifacts.
Copyright ©Radiological Society of North America, 2006Copyright ©Radiological Society of North America, 2006 Zhuo, J. et al. Radiographics 2006;26:275-297Zhuo, J. et al. Radiographics 2006;26:275-297
(c)(c)
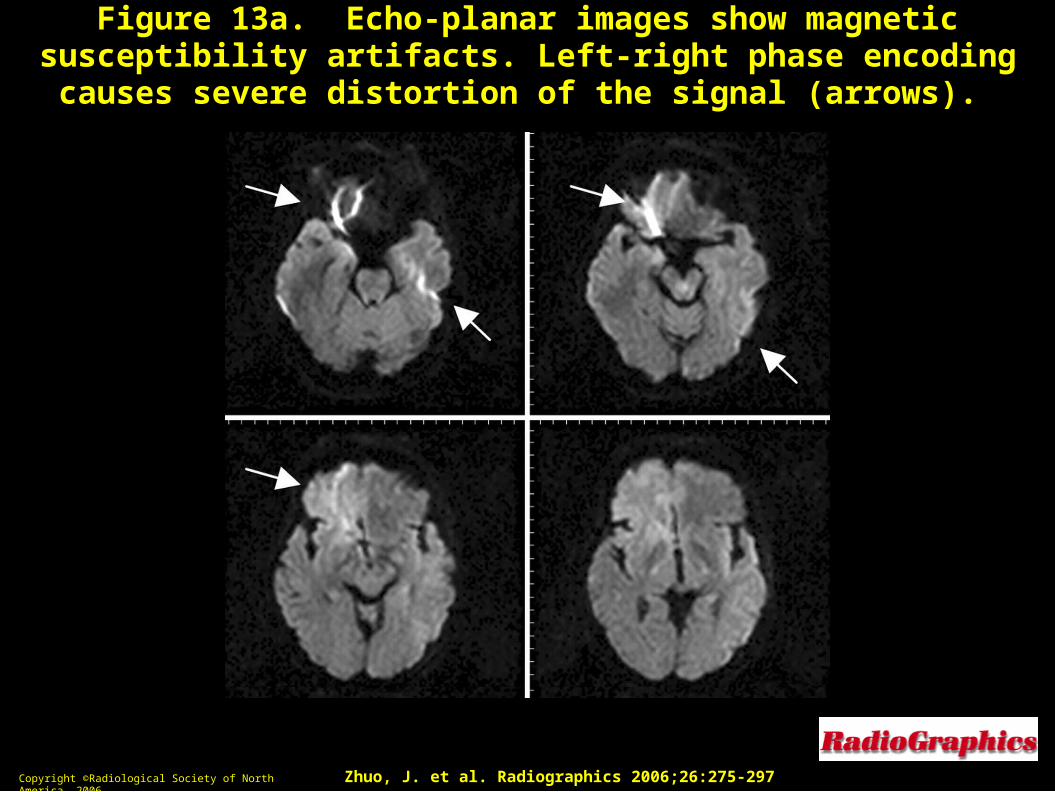
Figure 13a. Echo-planar images show magnetic susceptibility artifacts. Figure 13a. Echo-planar images show magnetic susceptibility artifacts. Left-right phase encoding causes severe distortion of the signal (arrows). Left-right phase encoding causes severe distortion of the signal (arrows).
Copyright ©Radiological Society of North America, 2006Copyright ©Radiological Society of North America, 2006 Zhuo, J. et al. Radiographics 2006;26:275-297Zhuo, J. et al. Radiographics 2006;26:275-297
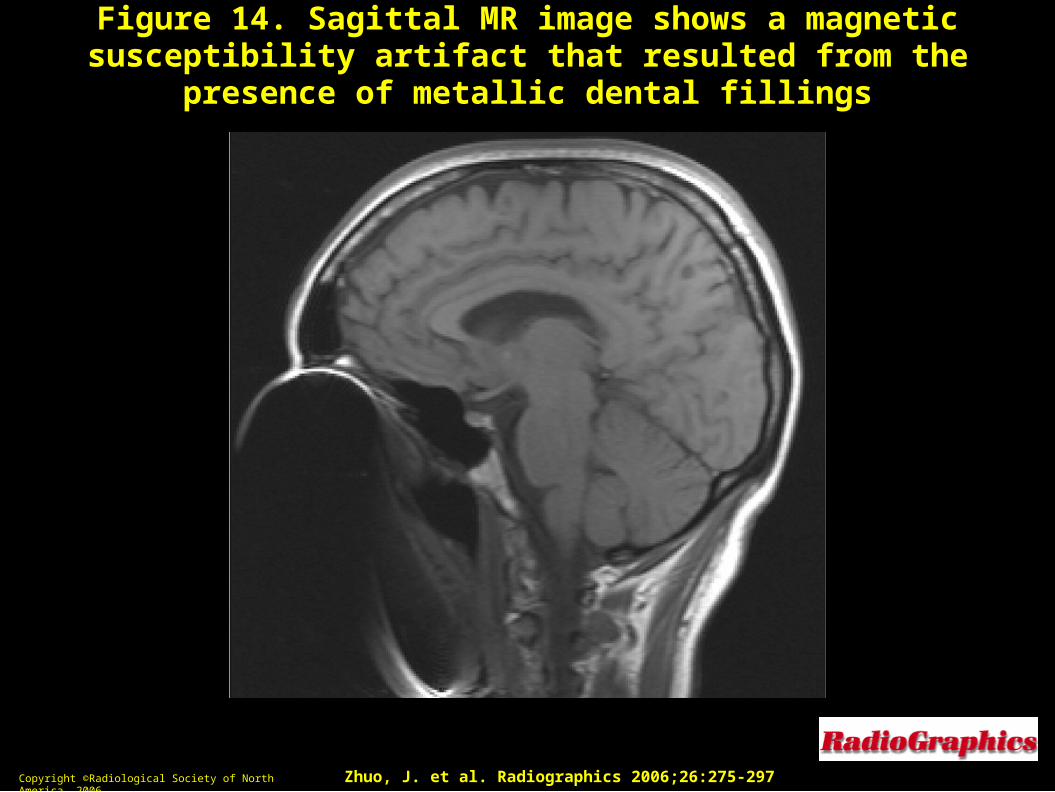
Figure 14. Sagittal MR image shows a magnetic susceptibility artifact that Figure 14. Sagittal MR image shows a magnetic susceptibility artifact that resulted from the presence of metallic dental fillingsresulted from the presence of metallic dental fillings
Copyright ©Radiological Society of North America, 2006Copyright ©Radiological Society of North America, 2006 Zhuo, J. et al. Radiographics 2006;26:275-297Zhuo, J. et al. Radiographics 2006;26:275-297
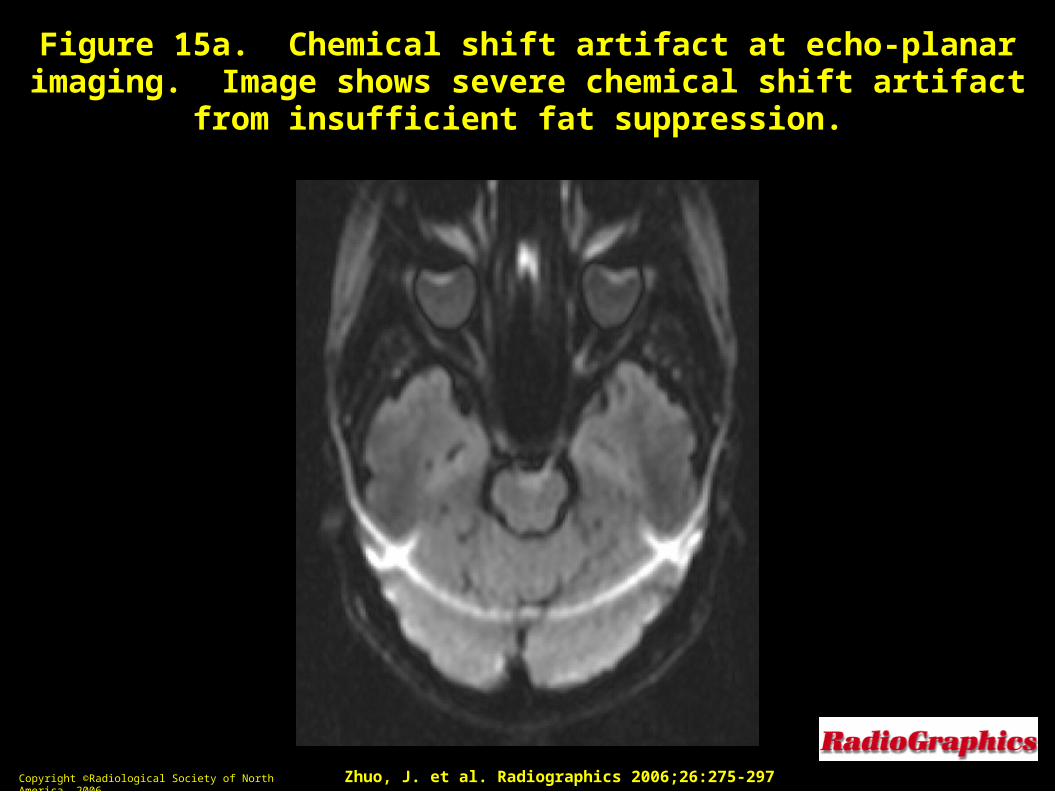
Figure 15a. Chemical shift artifact at echo-planar imaging. Image shows Figure 15a. Chemical shift artifact at echo-planar imaging. Image shows severe chemical shift artifact from insufficient fat suppression. severe chemical shift artifact from insufficient fat suppression.
Copyright ©Radiological Society of North America, 2006Copyright ©Radiological Society of North America, 2006 Zhuo, J. et al. Radiographics 2006;26:275-297Zhuo, J. et al. Radiographics 2006;26:275-297
Copyright ©Radiological Society of North America, 2006Copyright ©Radiological Society of North America, 2006
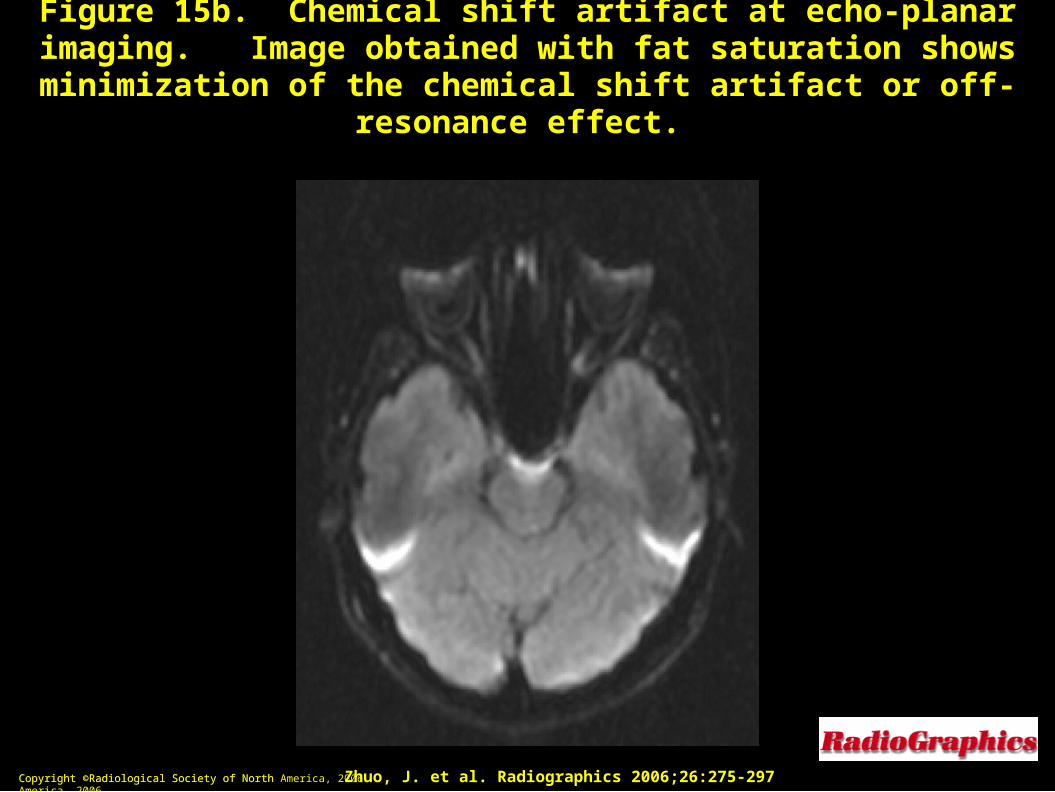
Figure 15b. Chemical shift artifact at echo-planar imaging. Image Figure 15b. Chemical shift artifact at echo-planar imaging. Image obtained with fat saturation shows minimization of the chemical shift obtained with fat saturation shows minimization of the chemical shift
artifact or off-resonance effect.artifact or off-resonance effect.
Copyright ©Radiological Society of North America, 2006Copyright ©Radiological Society of North America, 2006 Zhuo, J. et al. Radiographics 2006;26:275-297Zhuo, J. et al. Radiographics 2006;26:275-297
Copyright ©Radiological Society of North America, 2006Copyright ©Radiological Society of North America, 2006 Zhuo, J. et al. Radiographics 2006;26:275-297Zhuo, J. et al. Radiographics 2006;26:275-297
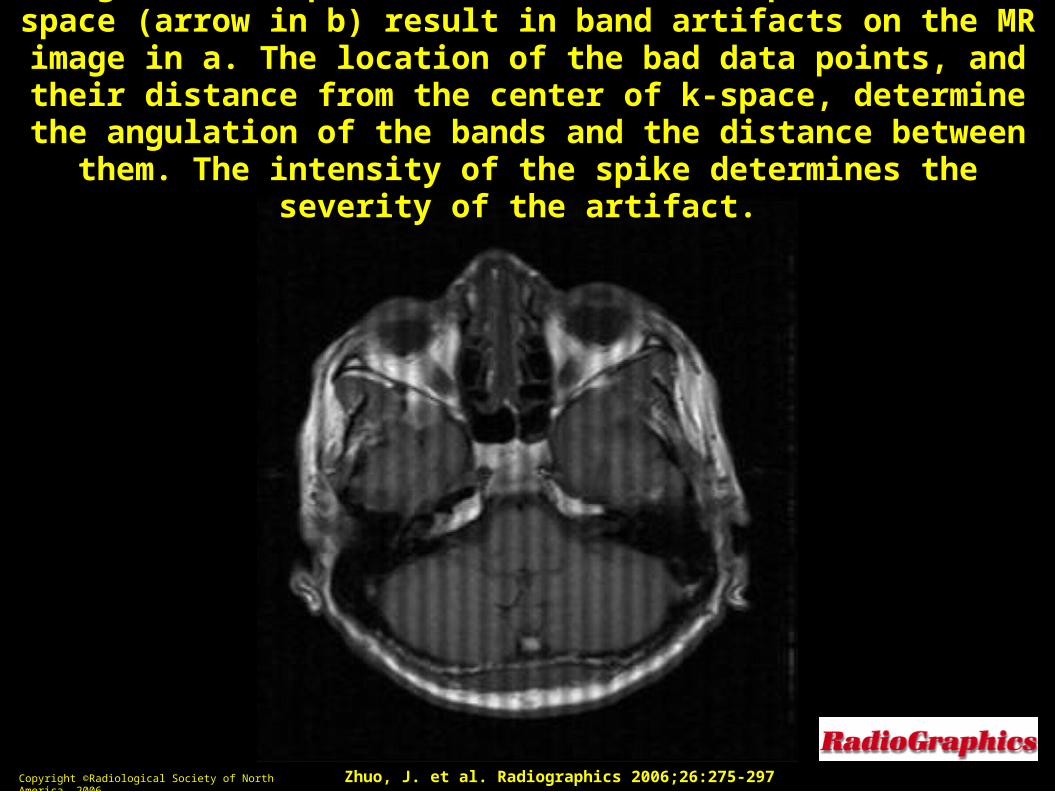
Figure 5a. Spike artifact. Bad data points in k-space (arrow in b) result in Figure 5a. Spike artifact. Bad data points in k-space (arrow in b) result in band artifacts on the MR image in a. The location of the bad data points, band artifacts on the MR image in a. The location of the bad data points, and their distance from the center of k-space, determine the angulation of and their distance from the center of k-space, determine the angulation of
the bands and the distance between them. The intensity of the spike the bands and the distance between them. The intensity of the spike determines the severity of the artifact.determines the severity of the artifact.
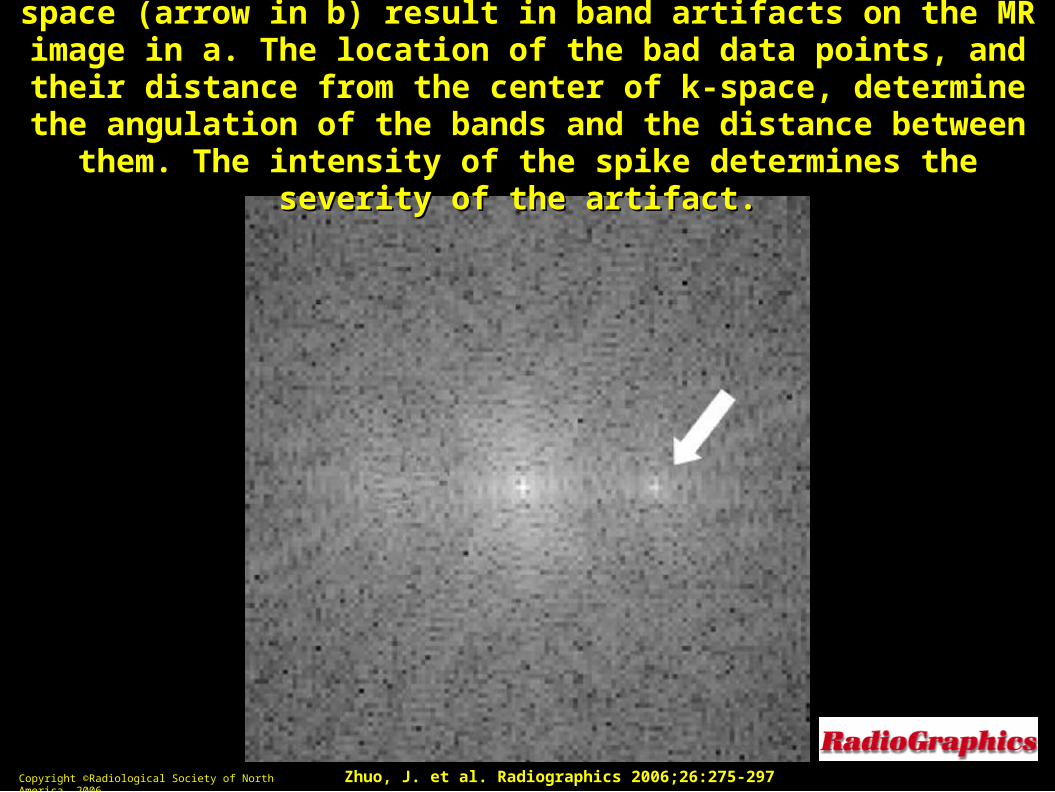
Figure 5b. Spike artifact. Bad data points in k-space (arrow in b) result in Figure 5b. Spike artifact. Bad data points in k-space (arrow in b) result in band artifacts on the MR image in a. The location of the bad data points, band artifacts on the MR image in a. The location of the bad data points, and their distance from the center of k-space, determine the angulation of and their distance from the center of k-space, determine the angulation of
the bands and the distance between them. The intensity of the spike the bands and the distance between them. The intensity of the spike determines the severity of the artifact.determines the severity of the artifact.
Copyright ©Radiological Society of North America, 2006Copyright ©Radiological Society of North America, 2006 Zhuo, J. et al. Radiographics 2006;26:275-297Zhuo, J. et al. Radiographics 2006;26:275-297