mri characteristics of proctitis in crohn’s disease on ... · mri characteristics of proctitis in...
TRANSCRIPT

MRI characteristics of proctitis in Crohn’sdisease on perianal MRI
Charlotte J. Tutein Nolthenius,1,3 Shandra Bipat,1 Banafsche Mearadji,1
Anje M. Spijkerboer,1 Cyriel Y. Ponsioen,2 Alexander D. Montauban van Swijndregt,3
Jaap Stoker1
1Department of Radiology, Academic Medical Center, University of Amsterdam, PO Box 22660, 1100 DD Amsterdam,
The Netherlands2Department of Gastroenterology and Hepatology, Academic Medical Center, University of Amsterdam, PO Box 22700,
1100 DE Amsterdam, The Netherlands3Department of Radiology, OLVG, PO Box 99550, 1090 HM Amsterdam, The Netherlands
Abstract
Purpose: Multiple features have been described forassessing inflammation in Crohn’s disease (CD) in MRenterography, but have not been validated in perianalmagnetic resonance imaging (MRI). Retrospectively, westudied which MRI features are valuable in assessingproctitis.Materials and methods: CD patients (‡18 years) whounderwent colonoscopy (reference standard) and peri-anal fistula MRI within 8 weeks were included. Seven-teen MRI features were blindly scored by three observersand correlated to endoscopy (regression analysis).Reproducibility (multirater kappa, intraclass correlationcoefficient) was determined for all three observer pairs.MRI features were considered relevant when signifi-cantly correlated to endoscopy for ‡2 observers, andreproducibility was ‡0.40 for ‡2 observer pairs.Results: Perianal MRI of 58 CD patients were included.Wall thickness, rectal mural fat, creeping fat, and size ofmesorectal lymph nodes showed a significant correlationwith endoscopy for ‡2 observers (p = 0.000–0.023,p = 0.011–0.172, p = 0.007–0.011 and p = 0.000–0.005, respectively) with a kappa/intraclass correlationcoefficient of ‡0.60 for ‡2 observer pairs. Perimural T2signal and perimural enhancement significantly corre-lated to endoscopy (all p values £0.05) for all threeobservers and the reproducibility was ‡0.40 for ‡2observer pairs. Mural T2 signal and degree and patternof T1 enhancement showed significant correlation to
endoscopy for two observers, but with poor to moderatereproducibility.Conclusion: Wall thickness, mural fat, and mesorectalfeatures (perimural T2 signal, perimural enhancement,creeping fat, and size of mesorectal lymph nodes) hadsignificant correlation to endoscopy and were repro-ducible in diagnosing proctitis. Some established luminalfeatures in MRE were considered not useful.
Key words: Proctitis—Crohn disease—Magneticresonance imaging—Rectum—Inflammatory boweldisease
Magnetic resonance imaging (MRI) of the perianal regionhas proven to be a valuable tool in diagnosing perianalfistulas in patients with Crohn’s disease, with accuraciesreported up to 93% in classifying fistulas and 96% indelineating abscesses [1, 2]. The anatomy and complexityof the fistula tract can precisely be depicted which isimportant for treatment planning [3]. Preoperative MRIhas shown to reveal additional and clinically relevantinformation, thereby reducing recurrence rates after fis-tula surgery [1, 4]. Another important issue in treatmentplanning is the concomitant presence of proctitis. Proctitisis defined as an inflammation of the rectum, approxi-mately 12–15 cm from the dentate line. In the presence ofproctitis, the chance of fistula healing is reduced, andtherefore, a more aggressive medical therapy should bestarted and surgery should be avoided [3, 5, 6].
Extensive research revealed multiple MRI featuresand scoring systems able to accurately assess inflamma-tion in luminal Crohn’s disease [7–9]. These features have
Correspondence to: Charlotte J. Tutein Nolthenius; email: [email protected]
ª The Author(s) 2016. This article is published with
open access at Springerlink.com
Published online: 17 June 2016AbdominalRadiology
Abdom Radiol (2016) 41:1918–1930
DOI: 10.1007/s00261-016-0802-z

been assessed on MR enterography or MR colonogra-phy, and have not been tested in dedicated pelvic MRI,which is limited by a different scan protocol (small FOV,other sequences) and the absence of luminal contrast. Asmany patients with perianal fistulas will undergo a pelvicMRI before start of treatment, diagnosing the presenceand degree of proctitis on this MRI could be of addi-tional value [2, 3].
In our retrospective study, we aimed to identify theMRI features of proctitis on a dedicated pelvic MRI, andto determine the reproducibility of the different MRIfeatures.
Materials and methods
Patients
From January 2001 until February 2014, we searched theendoscopy database (EndoAlpha Documentation,Olympus Nederland BV, Zoeterwoude, The Netherlands)of the Academic Medical Center, Amsterdam, TheNetherlands, for patients (‡18 years of age) with knownCrohn’s disease who underwent a proctoscopy, sigmoi-doscopy, or colonoscopy and who also underwent a ded-icated pelvic MRI according to our standard MRIperianal fistula protocol within either 8 weeks prior to orafter endoscopy. We chose this eight-week interval bal-ancing inclusion versus a satisfactory interval. Patientswere included if the endoscopy report mentioned the rec-tum, either with regard to the diagnosis of proctitis, rectalinflammation, or rectitis orwith regard to no signs of rectalinflammation at all. Patients could only be included once.In that case, the most recent MRI was chosen. For con-sistency, MRIs performed with an endocoil or with anincomplete scan protocol were excluded. Electronic med-ical records were searched by a research fellow (CTN) andrelevant information was noted (time of diagnosis, use ofmedication during the examinations, previous surgery).Patients with change in therapy, eithermedical or surgical,in the period between endoscopy andMRI were excluded.All included MRI scans were blinded and randomlyordered.
The requirement for review by the Medical EthicalCommittee or informed consent was waived because ofthe retrospective nature of this study with pre-existingdata.
Reference standard
With no access to clinical information or MRI scans, weevaluated the endoscopy reports of all included patientsand performed a classification of lesion severity by con-sidering three categories: grade (1) absence of lesions;grade (2) presence of inflammatory lesions withoutulceration, including erythema, oedema, pseudopolyps,and aphthae; and grade (3) presence of superficial ordeep ulcerations [10]. The presence or absence of fistulas
and anal stenosis was also noted. Uncertainties wereresolved by the expert opinion of a gastroenterologist(CY; 20 years of experience), with inflammatory boweldisease as subspecialty, with access to all endoscopicalinformation, including endoscopy images.
MRI protocol
All MRIs were performed at 1.5T (Signa HorizonEchospeed, LX 9.0, General Electric Medical Systems,Milwaukee, WI, USA and MAGNETOM Avanto,Siemens Healthcare, Erlangen, Germany) and at3T (INTERA, Philips Medical Systems, Best, theNetherlands) without bowel preparation, except 4-hfasting. Patients were scanned in supine position using atorso phased-array surface coil. Sagittal, coronal, andtransversal sequences were performed with the coronaland transversal sequences angulated parallel and per-pendicular to the anal canal, respectively. The scanprotocol consisted of T2-weighted Turbo Spin-Echo se-quences in the sagittal, coronal, and transversal planes, afat-suppressed transversal T2-weighted TSE sequenceand a fat-suppressed transversal T1-weighted TSE se-quence after intravenous gadolinium. For a detaileddescription of all MRI parameters see Appendix A.
Observers
All MRI scans were blinded and retrospectively evalu-ated by three abdominal radiologists with different rel-evant experience levels: Observer 1 (BM; abdominalradiologist for 9 years including approximately 500perianal fistula MRIs and 500 MR enterographies) years,observer 2 (AS; radiologist for 20 years includingapproximately 300 perianal fistula MRIs and 300 MRenterographies), and observer 3 (JS; abdominal radiolo-gist for 21 years including approximately 1300 perianalfistula MRIs and 800 MR enterographies). No clinical orendoscopy findings were provided, except for the pres-ence or absence of perianal fistulas. . Before start, theobservers read a document explaining the different MRIfeatures to be evaluated with examples obtained from theprevious literature and cases from a different datasetfollowed by a joined session discussing the features led bya fellow researcher (CTN) and the most experiencedabdominal radiologist (observer 3: JS) (Fig. 1) [7, 11–14].Five example cases from a different dataset were dis-cussed. For evaluation of all cases, a digital question-naire was developed (proctitis.co.nr).
MRI features
Quality of the scan and rectal distention were evaluatedby the most experienced observer as poor (non-diag-nostic), adequate (artifacts, but sufficient diagnosticquality), and good (no artifacts); and none (completely
C. J. Tutein Nolthenius et al.: MRI characteristics of proctitis 1919

collapsed rectum), moderate (some distension but noconvex contours of the rectal wall), and good (convexcontours of the rectal wall) assessed in the least distendedpart of the rectum, respectively. Seventeen MRI features(Table 1) were evaluated by all three readers. Featureswere selected according to MRI features described in theliterature and those used in two published scoring sys-tems on MRI in luminal Crohn’s disease [7, 10, 11].
Definitions of certain features were adapted to beapplicable in perianal MRI (Table 1). Additional itemsaccording to expert opinion were added: enhancement ofperimural fat tissue (see Table 1; Fig. 1 for definition),creeping fat was defined as an increased amount ofperirectal fat tissue and the comb sign as increased vas-cular structures in the perirectal fat, both scored on thesagittal images. The most affected part of the rectum was
Fig. 1. Axial oblique fat-saturated post-contrast T1-weightedimages of four different patients with Crohn’s disease withdifferent degrees of perimural enhancement. A Equivalent tonormal fat tissue. B Minor enhancement. There is blurreddemarcation of the bowel wall with or without mild increase of
perimural fat tissue signal. C Moderate enhancement. In-crease of perimural fat tissue signal but less than nearbyvascular structures. D Marked enhancement. Perimural fattissue signal approaches that of nearby vascular structures.Mesorectal fascia enhancement can be noted.
1920 C. J. Tutein Nolthenius et al.: MRI characteristics of proctitis

Table
1.MRIfeatures,evaluatedin
themost
affectedpart
oftherectum
Wallthicknessin
mm
a
Largestregionallymphnodein
mm
(mesorectal,obturator,iliac,
inguinal)
%ofcircumference
involved
0–25%
26–50%
51–75%
76–100%
MuralT2signalb
Equivalentto
norm
albowel
wall
Minorincrease—
bowel
wallap-
pears
dark
grayonfat-saturated
images
Moderate
increase—bowel
wall
appears
lightgrayonfat-saturated
images
Marked
increase—bowel
wallcon-
tainsareasofwhitehighsignal
approachingthatofnearbyvascu-
larstructures
Perim
uralT2signalb
Equivalentto
norm
alfattissue
Increase
insignalbutnofluid
Smallfluid
rim
(£2mm)
Larger
fluid
rim
(>2mm)
T1enhancementb
Equivalentto
norm
albowel
wall
Minorenhancement—
bowel
wall
signalincreasedbutsignificantly
less
thannearbyvascularstructures
Moderate
enhancement—
bowel
wallsignalincreasedbutsomew
hat
less
thannearbyvascularstructures
Marked
enhancement—
bowel
wall
signalapproaches
thatofnearby
vascularstructures
T1enhancementpatternb
N/A
cHomogeneous
Mucosal
Layered
Enhancementofperim
uralfattissue
Equivalentto
norm
alfattissue
Minorenhancement—
blurred
dem
arcationofthebowel
wall
with/w
ithoutmildincrease
ofper-
imuralfattissuesignal
Moderate
enhancement—
increase
ofperim
uralfattissuesignalbut
less
thannearbyvascularstructures
Marked
enhancement—
perim
ural
fattissuesignalapproaches
thatof
nearbyvascularstructures.
Mesorectalfascia
enhancementcan
benoted
Muralfat
Absent
Present
Ulcersa
Absent
Present
Supralevatoricfistula
Absent
Present
Supralevatoricabscess
Absent
Present
Creepingfat
Absent
Present
Combsign
Absent
Present
aAccordingto
Rim
ola
etal.IB
D2011
bAccordingto
Steward
etalEJR
2012
cN/A
incase
ofenhancementequivalentto
norm
albowel
wall
C. J. Tutein Nolthenius et al.: MRI characteristics of proctitis 1921

evaluated. Shortest axis of the largest lymph node perstation was measured.
Statistical analysis
The maximum number of eligible patients in the giventime period were included, and no sample size calcula-tions were therefore performed. Extension of this timeperiod to earlier period was not desirable, as the MRIprotocol was different before 2001 (use of endocoil) andthereby not reflecting the practice nowadays.
Normality of continuous data was tested by visualassessment of the data. Normally distributed data werepresented with means and SD. For non-normally dis-tributed data, medians with interquartile ranges (IQR)were given.
Interobserver agreement
Several multirater analyses were performed for all fea-tures individually. To test the level of interobserveragreement for the separate MRI features between thethree different pairs of radiologists, the appropriatemeasure was used. For all ordinal data, a weightedkappa coefficient was calculated per two raters. For thebinominal data, a kappa coefficient was used calculatedper two raters. For continuous data, an intraclass cor-relation coefficient was determined per two raters. Bothkappa and intraclass correlation coefficient values wereinterpreted as follows: 0–0.20, poor; 0.20–0.40, fair; 0.40–0.60, moderate; 0.60–0.80, good; 0.80–1.00, very good[15].
Comparison of observers with reference standard
Endoscopical reference standard was dichotomized in theabsence of lesions (grade 0) versus proctitis (grades 1 and2) because of limited size of study population. Associa-tions were tested using regression analyses for ordinal orbinominal MRI parameters. Comparison of continuousMRI parameters and endoscopical reference standardwas performed using the Mann–Whitney U test, as datawere not normally distributed.
Relevant MRI features
MRI features with a significant correlation (p value of£0.05) between the reference standard and at least two ofthree observers, and with a (weighted) kappa/intraclasscorrelation coefficient value of ‡0.60 for at least two ofthree observer pairs, were identified and consideredpotentially relevant in diagnosing proctitis. In post hocanalysis, threshold for the kappa/intraclass correlation inconsidering a relevant feature was changed to ‡0.40,because this concerns an initial study aimed at identify-ing potential relevant features and therefore sufficient
features should be identified to be used in a future vali-dation study.
All statistical analyses were performed with IBMSPSS Statistics version 20.0 for Windows (SPSS, Chica-go, IL, USA) and Vassarstats.com (Richard Lowry,Poughkeepsie, NY, USA).
Results
Patient and MRI characteristics
Between January 2001 and February 2014, 106 Crohn’sdisease patients were extracted from the database whounderwent perianal MRI within 8 weeks of endoscopy(Fig. 2). After exclusion, a total of 58 patients remained(Fig. 2), of which 21 (36%) are male with a mean age of38.7 (SD 12.6) at the time of MRI. The median timebetween MRI and endoscopy was 12 days ([IQR 6–21];range 0–44). Thirty-two (55%) had no signs of proctitisat endoscopy and 26 (45%) had signs of proctitis, ofwhich 19 (33%) had non-ulcerative proctitis and 7 (12%)ulcerative proctitis. Table 2 summarized the demo-graphic and clinical data of patients included in thestudy.
Quality of the MRI scans was considered good in74.1% (43/58) and adequate in 25.9% (15/58). There wasno rectal distention in 43.1% (25/58), moderate disten-tion in 34.5% (20/58), and good distention in 22.4% (13/58).
Interobserver agreement
Agreement between the three observer pairs is presentedin Table 3. For size of mesorectal lymph nodes, theagreement for all three pairs ranged between good andvery good (0.78 and 0.83). Wall thickness, mural fat, andcreeping fat showed good agreement for two of threeobserver pairs (0.70–0.58–0.69, 0.67–0.57–0.64, and0.48–0.69–0.76, respectively). Perimural T2 signal,supralevatoric extension of fistula, and abscess showed atleast moderate agreement (‡0.40) for all the three ob-server pairs. Perimural enhancement and size of inguinallymph nodes showed at least moderate agreement fortwo of three observer pairs (0.46–0.34–0.59 and 0.65–0.38–0.43).
Comparison of observers with reference standard
In Table 4, the comparison of continuous variables(upper part) and ordinal variables (lower part) with thereference standard are presented. Wall thickness wassignificantly smaller for all three observers in patientswithout proctitis than in patients with proctitis (observer1: 6.0 vs. 9.0 mm, p = 0.000; observer 2: 8.0 vs.11.0 mm, p = 0.023; observer 3: 4.0 vs. 10.0 mm,p = 0.000).
1922 C. J. Tutein Nolthenius et al.: MRI characteristics of proctitis

Fig. 2. Flow chart ofsearch in hospitals’ patientdatabase.
Table 2. Demographic characteristics of the study population
Study group Control group
No. (%) of patients 26 (55) 32 (45)Men (%) 13 (50) 8 (25)Women (%) 13 (50) 24 (75)
Age at time of imaging (y), median (IQR) 40 (27–51) 37 (28–47)Disease duration (y), median (IQR) 7 (4–11) 7 (3–21)Days between endoscopy and MRI, median (IQR) 13 (7–23) 11 (4–20)Previous surgery, no. (%) of patients 16 (62) 22 (69)Maintenance therapy, no. (%) of patients 18 (69) 23 (72)
Antitumor necrosis factor, no. (%) of patients 5 (19) 11 (34)Steroids, no. (%) of patients 8 (31) 3 (9)Immunosuppressant, no. (%) of patients 12 (46) 12 (38)5-Aminosalicylic acid medications, no. (%) of patients 1 (4) 7 (22)Vedolizumab, no. (%) of patients 1 (4) 0
Presence of fistula (on MRI)None, no. (%) of patients 3 (12) 8 (25)Simple, no. (%) of patients 11 (42) 16 (50)Complex, no. (%) of patients 12 (46) 8 (25)
Endoscopy diagnosisAbsence of lesions, no. (%) of patients 0 32 (100)Non-ulcerative lesions, no. (%) of patients 7 (27) 0Ulcerations, no. (%) of patients 19 (73) 0
IQR interquartile range
C. J. Tutein Nolthenius et al.: MRI characteristics of proctitis 1923
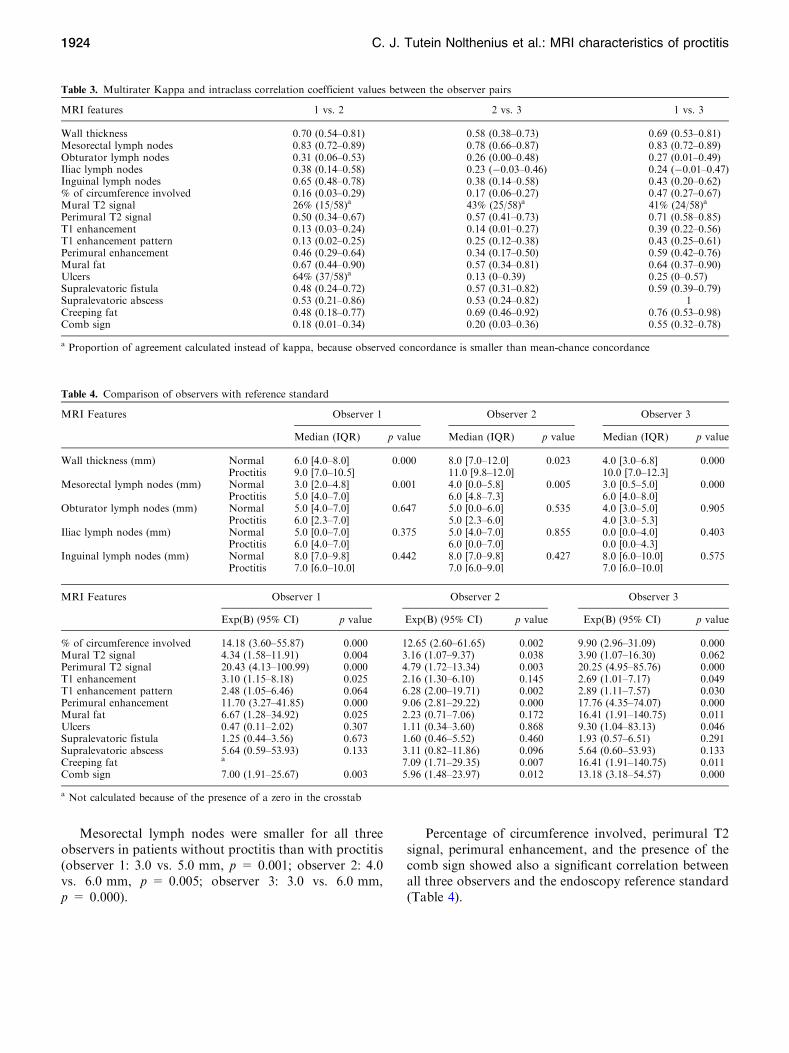
Mesorectal lymph nodes were smaller for all threeobservers in patients without proctitis than with proctitis(observer 1: 3.0 vs. 5.0 mm, p = 0.001; observer 2: 4.0vs. 6.0 mm, p = 0.005; observer 3: 3.0 vs. 6.0 mm,p = 0.000).
Percentage of circumference involved, perimural T2signal, perimural enhancement, and the presence of thecomb sign showed also a significant correlation betweenall three observers and the endoscopy reference standard(Table 4).
Table 3. Multirater Kappa and intraclass correlation coefficient values between the observer pairs
MRI features 1 vs. 2 2 vs. 3 1 vs. 3
Wall thickness 0.70 (0.54–0.81) 0.58 (0.38–0.73) 0.69 (0.53–0.81)Mesorectal lymph nodes 0.83 (0.72–0.89) 0.78 (0.66–0.87) 0.83 (0.72–0.89)Obturator lymph nodes 0.31 (0.06–0.53) 0.26 (0.00–0.48) 0.27 (0.01–0.49)Iliac lymph nodes 0.38 (0.14–0.58) 0.23 (-0.03–0.46) 0.24 (-0.01–0.47)Inguinal lymph nodes 0.65 (0.48–0.78) 0.38 (0.14–0.58) 0.43 (0.20–0.62)% of circumference involved 0.16 (0.03–0.29) 0.17 (0.06–0.27) 0.47 (0.27–0.67)Mural T2 signal 26% (15/58)a 43% (25/58)a 41% (24/58)a
Perimural T2 signal 0.50 (0.34–0.67) 0.57 (0.41–0.73) 0.71 (0.58–0.85)T1 enhancement 0.13 (0.03–0.24) 0.14 (0.01–0.27) 0.39 (0.22–0.56)T1 enhancement pattern 0.13 (0.02–0.25) 0.25 (0.12–0.38) 0.43 (0.25–0.61)Perimural enhancement 0.46 (0.29–0.64) 0.34 (0.17–0.50) 0.59 (0.42–0.76)Mural fat 0.67 (0.44–0.90) 0.57 (0.34–0.81) 0.64 (0.37–0.90)Ulcers 64% (37/58)a 0.13 (0–0.39) 0.25 (0–0.57)Supralevatoric fistula 0.48 (0.24–0.72) 0.57 (0.31–0.82) 0.59 (0.39–0.79)Supralevatoric abscess 0.53 (0.21–0.86) 0.53 (0.24–0.82) 1Creeping fat 0.48 (0.18–0.77) 0.69 (0.46–0.92) 0.76 (0.53–0.98)Comb sign 0.18 (0.01–0.34) 0.20 (0.03–0.36) 0.55 (0.32–0.78)
a Proportion of agreement calculated instead of kappa, because observed concordance is smaller than mean-chance concordance
Table 4. Comparison of observers with reference standard
MRI Features Observer 1 Observer 2 Observer 3
Median (IQR) p value Median (IQR) p value Median (IQR) p value
Wall thickness (mm) Normal 6.0 [4.0–8.0] 0.000 8.0 [7.0–12.0] 0.023 4.0 [3.0–6.8] 0.000Proctitis 9.0 [7.0–10.5] 11.0 [9.8–12.0] 10.0 [7.0–12.3]
Mesorectal lymph nodes (mm) Normal 3.0 [2.0–4.8] 0.001 4.0 [0.0–5.8] 0.005 3.0 [0.5–5.0] 0.000Proctitis 5.0 [4.0–7.0] 6.0 [4.8–7.3] 6.0 [4.0–8.0]
Obturator lymph nodes (mm) Normal 5.0 [4.0–7.0] 0.647 5.0 [0.0–6.0] 0.535 4.0 [3.0–5.0] 0.905Proctitis 6.0 [2.3–7.0] 5.0 [2.3–6.0] 4.0 [3.0–5.3]
Iliac lymph nodes (mm) Normal 5.0 [0.0–7.0] 0.375 5.0 [4.0–7.0] 0.855 0.0 [0.0–4.0] 0.403Proctitis 6.0 [4.0–7.0] 6.0 [0.0–7.0] 0.0 [0.0–4.3]
Inguinal lymph nodes (mm) Normal 8.0 [7.0–9.8] 0.442 8.0 [7.0–9.8] 0.427 8.0 [6.0–10.0] 0.575Proctitis 7.0 [6.0–10.0] 7.0 [6.0–9.0] 7.0 [6.0–10.0]
MRI Features Observer 1 Observer 2 Observer 3
Exp(B) (95% CI) p value Exp(B) (95% CI) p value Exp(B) (95% CI) p value
% of circumference involved 14.18 (3.60–55.87) 0.000 12.65 (2.60–61.65) 0.002 9.90 (2.96–31.09) 0.000Mural T2 signal 4.34 (1.58–11.91) 0.004 3.16 (1.07–9.37) 0.038 3.90 (1.07–16.30) 0.062Perimural T2 signal 20.43 (4.13–100.99) 0.000 4.79 (1.72–13.34) 0.003 20.25 (4.95–85.76) 0.000T1 enhancement 3.10 (1.15–8.18) 0.025 2.16 (1.30–6.10) 0.145 2.69 (1.01–7.17) 0.049T1 enhancement pattern 2.48 (1.05–6.46) 0.064 6.28 (2.00–19.71) 0.002 2.89 (1.11–7.57) 0.030Perimural enhancement 11.70 (3.27–41.85) 0.000 9.06 (2.81–29.22) 0.000 17.76 (4.35–74.07) 0.000Mural fat 6.67 (1.28–34.92) 0.025 2.23 (0.71–7.06) 0.172 16.41 (1.91–140.75) 0.011Ulcers 0.47 (0.11–2.02) 0.307 1.11 (0.34–3.60) 0.868 9.30 (1.04–83.13) 0.046Supralevatoric fistula 1.25 (0.44–3.56) 0.673 1.60 (0.46–5.52) 0.460 1.93 (0.57–6.51) 0.291Supralevatoric abscess 5.64 (0.59–53.93) 0.133 3.11 (0.82–11.86) 0.096 5.64 (0.60–53.93) 0.133Creeping fat a 7.09 (1.71–29.35) 0.007 16.41 (1.91–140.75) 0.011Comb sign 7.00 (1.91–25.67) 0.003 5.96 (1.48–23.97) 0.012 13.18 (3.18–54.57) 0.000
a Not calculated because of the presence of a zero in the crosstab
1924 C. J. Tutein Nolthenius et al.: MRI characteristics of proctitis

Mural T2 signal, T1 enhancement, T1 enhancementpattern, and creeping fat showed a significant correlationfor two of three observers. Ulcers and supralevatoricextension of fistula and abscess did not show a significantcorrelation to the reference standard for all three ob-servers.
Relevant MRI features
Based on predefined criteria, the following MRI featureswere considered most relevant in diagnosing proctitis(Tables 3, 4): wall thickness, size of mesorectal lymphnodes, mural fat, and creeping fat showed a significant
Fig. 3. Sagittal T2-weighted image of two different patientswith Crohn’s disease. A A 25-year-old female with ulcerativeproctitis at endoscopy. The image shows increased amount ofmesorectal fat tissue (creeping fat) and a subtle increase of
perimural vascularity (‘comb sign’) in addition to rectal wallthickening. B A 24-year-old female with no signs of proctitis atendoscopy. There is no increased amount of mesorectal fattissue and the rectum shows no abnormal MRI features.
Fig. 4. A 53-year-old female with Crohn’s disease andulcerative proctitis at endoscopy. A Axial oblique T2-weightedimage shows high mural signal intensity and B low signalintensity on axial oblique fat-saturated T2-weighted image
corresponding tomural fat (arrow).CAxial oblique fat-saturatedpost-contrast T1-weighted images shows moderate enhance-ment of the rectal wall and perimural fat tissue. In addition, wallthickening and multiple mesorectal lymph nodes are present.
C. J. Tutein Nolthenius et al.: MRI characteristics of proctitis 1925

correlation between at least two of three observers andthe endoscopy reference standard, as well as a kappa/intraclass correlation coefficient of ‡0.60 for at least twoof three observer pairs (Figs. 3, 4). In post hoc analysis, akappa/intraclass coefficient threshold of ‡0.40 was con-sidered, which included perimural T2 signal and per-imural enhancement as they showed a moderateinterobserver agreement for two of three observer pairsand a significant correlation with the reference standardfor all three observers (Appendix B) (Fig. 5).
All other features (all other lymph nodes, % of cir-cumference involved, T1 enhancement (pattern), ulcers,supralevatoric fistula, and abscess and comb sign) did
not fulfill our predefined criteria for relevancy. Althoughthe correlation with endoscopy was significant for twoobservers, mural T2 signal and T1 enhancement (pattern)showed poor to moderate agreement.
Discussion
MRI features rectal wall thickness, mesorectal lymphnodes, mural fat, and creeping fat were considered rele-vant in diagnosing proctitis on pelvic MRI, as theyshowed a significant correlation between at least twoobservers and the endoscopy reference standard, and atleast a good interobserver agreement for at least two of
Fig. 5. A 49-year-old female with Crohn’s disease. A Axialoblique T2-weighted image and B axial oblique fat-saturatedT2-weighted image show rectal wall thickening, a markedincrease of T2 signal intensity and a perimural large fluid rim(>2 mm). C Axial oblique fat-saturated post-contrast T1-
weighted images obtained at the same level shows a mod-erate enhancement of the rectal wall and the perimural fattissue. In addition, there is creeping fat and a supralevatoricabscess left anterolateral of the rectum on all three images. DEndoscopy showed ulcerative proctitis.
1926 C. J. Tutein Nolthenius et al.: MRI characteristics of proctitis

three observer pairs. Perimural T2 signal and perimuralenhancement showed a significant correlation for all thethree observers and a moderate interobserver agreementfor at least two of the three observer pairs. Mural T2signal and T1 enhancement degree and pattern showedpoor to moderate reproducibility.
This is to our knowledge, the first study reporting onthe specific MRI features associated with proctitis on adedicated pelvic MRI. Previous research did study rectalinvolvement in Crohn’s disease patients, but this was doneusing MR enterography or MR colonography [8–10]. Nospecific rectal and/or perirectal features were described.Van Assche developed an MRI-based score of perianalCrohn’s disease severity with rectal wall thickening as thesole indicator for rectal inflammation, which can be usedfor evaluationof response to treatment [16, 17].Our resultsconfirmed the correlation between rectal wall thickeningand inflammation; in addition, a moderate to good inter-observer agreement was observed. Most features consid-ered relevant in diagnosing proctitis involved themesorectal fat tissue (Figs. 4, 5). This is in contrast to astudy that showed only fair reproducibility for perimuralfeatures on MR enterography [11]. Crohn’s disease isknown for its transmural inflammation and subsequentperimural involvement. In the rectum, this perimuralinvolvement was often quite prominent. This might berelated to the isolated localization of the rectum sur-rounded bymesorectal fat tissue, where perimural changesare somewhat easier appreciated thanwhenmultiple loopsof bowel are closely aligned. Further, the rectum was notor moderately distended in most cases, which might resultin the perirectal features becoming more apparent. Thisrectal collapse might have led to increased wall thicknessmeasurements. Even so, there was a significant difference
inwall thickness in proctitis versus no proctitis as observedby all three observers. Further research should focus onthe predictive value of the individual MRI features iden-tified in our study, and the clinical use in monitoringtreatment response as a non-invasive alternative to endo-scopy and in case of severe anal stenosis.
In contrast, luminal features already proven to beuseful in establishing disease severity onMRenterography
Fig. 6. A 45-year-old male with Crohn’s disease and nosigns of proctitis at endoscopy. A Axial oblique T2-weightedimage and B axial oblique fat-saturated T2-weighted image
obtained at the same level shows a moderate increase of T2signal intensity of the rectal wall.
Fig. 7. A 43-year-old male with Crohn’s disease and ulcer-ative proctitis at endoscopy. Sagittal T2-weighted imageshows the increased perimural vascularity perpendicular tothe rectum (‘comb sign’) in addition to the wall thickening ofthe entire rectum.
C. J. Tutein Nolthenius et al.: MRI characteristics of proctitis 1927

and MR colonography, for example, T2 signal intensityand T1 enhancement (pattern and degree), were consid-ered not useful in our study [7–9]. In order to decide if acertain feature is considered normal or increased, onemustbe able to compare it to other colonic loops, which werealmost never included in the field of view of the T1-weighted and T2-weighted fat-saturated sequences thatwas only performed in the axial oblique plane. Also, in ourstandard perianal fistula protocol, no T1-weighted pre-contrast images for comparison were performed. For theT2 signal intensity of the rectal wall in almost all cases(normal or proctitis), observers scored the T2 signalintensity of the rectal wall at least as slight, but mostly asmoderately increased (Fig. 6). This suggests that the nor-mal rectal signal intensity is already light gray on T2 fat-saturated images and that the grading scale used forluminal disease was not adequate for the rectum. Fur-thermore, MR enterography and colonography useluminal contrast to obtain bowel distention.
We do not have a balanced explanation for the lack ofcorrelation between the supralevatoric extension of fis-tula and/or abscess and the presence of proctitis as onemight have expected. Only our most experienced ob-server showed a significant correlation for the presence ofulcerations. A limitation for this feature is that in theproctitis group, we combined the patients with non-ulcerative and ulcerative proctitis because of low numberof patients in each group. As the number of ulcerativeproctitis cases was low, a possible correlation in ulcera-tive proctitis might not be identified. Combining ulcera-tive and non-ulcerative proctitis, also prevented us torule on disease severity. For the features ‘presence ofcreeping fat’ and ‘comb sign,’ we had no circumscribeddefinitions or grading, and observers had to score thesefeatures according to their expert opinion rendering itsusceptible for subjectivity. Although the comb sign didshow a significant correlation with endoscopy, theinterobserver agreement was very low for two of threeobserver pairs, probably because of unfamiliarity withthis feature (Fig. 7).
Increased wall thickness is not only seen in the activephase ofCrohn’s disease but also in the chronic stage of thedisease.Also, the presence ofmural fat and creeping fat aresigns of chronic disease. The significant correlation to ac-tive inflammation at endoscopy for these features isinherent to Crohn’s disease with a chronic course ofrelapsing and remitting inflammation, where features ofchronic disease coexist with acute inflammatory changes.
Our study has several limitations. First, endoscopyreports were retrospectively analyzed in order to deter-mine the reference standard. However, only reports withevident mentioning of the rectum were included andevaluated using a predefined clear-cut scoring system [10]and an experienced gastroenterologist was involved.Because of only including patients with mentioning ofthe rectum in the endoscopy report, our patient popu-
lation was subject to selection bias creating a disease-enriched population. Second, the time between the MRIand the endoscopy examination ranged from 0 to44 days. In this time frame disease activity could havebeen altered because of natural course. However, sincewe excluded all patients with change in medical or sur-gical therapy during the time interval, this possibility wasminimized. Third, the use of a kappa/intraclass coeffi-cient value of ‡0.60 would have strengthened our study,but at initial evaluation of our data too little featuresremained. In this first phase of identifying possible rele-vant features, we wanted to include as much features aspossible, in order to make a further selection in a futurevalidation study. Fourth, the introductory session for theobservers regarding the different MRI features was heldby the same expert abdominal radiologist (JS who wasalso one of the readers in this study), which could haveincreased reproducibility. We did not notice higheragreement between the observer pairs including this ex-pert abdominal radiologist than the other observer pair.
In conclusion, for diagnosing proctitis in Crohn’sdisease in perianal MRI, MRI features involving themesorectal tissue, perimural T2 signal, perimural T1enhancement, the presence of creeping fat, and size ofmesorectal lymph nodes were most valuable, as theyshowed a significant correlation with endoscopical find-ings and were reproducible. Established luminal featureslike mural T2 signal and T1 enhancement may be lesshelpful in perianal MRI. In addition, rectal wall thick-ness and presence of mural fat were relevant as well.Future research should focus on these MRI features byvalidating them in a prospective study and for definingthresholds for continuous variables.
Acknowledgments. We would like to thank research nurse Jitteke deJong for her help in performing the search in the hospitals’ patientdatabase and physician A. J. Nederveen for his help in extracting theMRI scan parameters from the DICOM headers.
Compliance with ethical standards
Funding This study received no funding. For none of the authors ofthis manuscript any financial interest is applicable.
Disclosures Professor J. Stoker is a consultant for Robarts. Dr.C.Y.Ponsioen has received unconditional grants from Takeda, served as aconsultant for Takeda and Abbvie, and received speaker’s fees fromTakeda, MSD, Ferring, Dr. Falk, and Abbvie. All other authors, C.J.Tutein Nolthenius, S. Bipat, B. Mearadji, S. Spijkerboer, and A.D.Montauban van Swijndregt, have nothing to disclose.
Informed consent The requirement for review by the Medical EthicalCommittee or informed consent was waived because of the retrospec-tive nature of this study with pre-existing data.
Open Access This article is distributed under the terms of the CreativeCommons Attribution 4.0 International License (http://creativecommons.org/licenses/by/4.0/), which permits unrestricted use, dis-tribution, and reproduction in any medium, provided you give appro-priate credit to the original author(s) and the source, provide a link tothe Creative Commons license, and indicate if changes were made.
1928 C. J. Tutein Nolthenius et al.: MRI characteristics of proctitis

Appendices
Appendix A. Range of MR scan parameters performed on three different MR scanners
SagittalT2-weighted
TSE
CoronalT2-weighted
TSE
AxialT2-weighted
TSE
AxialT2-weighted
TSE with fat sat.
Axial T1-weightedTSE with fat sat. +
iv contrastenhancementa
1.5 T (Siemens, Avanto), 33 MR scansField of view (cm) 300 300/320 220/300 220/300 300–450No. of slices 28–40 25–42 28–45 28–42 28–42Repetition time (ms) 2500–4000 2500–4000 2500–4000 2500–4000 600–718Echo time (ms) 69/70 70–121 70–121 70–121 9,4/11Image matrix 512 9 231-512 9 578 256 9 297-512 9 575 256 9 297-512 9 578 256 9 297-512 9 575 256 9 288-512 9 256Slice thickness (mm) 3/4 3/4 3/4 4 4Slice gap (mm) 0.4 0–0,4 0–0.4 0/0.4 0–0,4NSA 1–3 1/2 1/2 1/2 1–4Flip angle 90/150 90/150 90/150 90/150 90/150
1.5 T (Signa, GE), 20 MR scansField of view (cm) 300 300 300 300 300/450No. of slices 32 32 31/32 28–32 31/32Repetition time (ms) 2500 2500 2500 2500–4500 560/600Echo time (ms) 69/70 71/72 69 69–83 10.8Image matrix 512 9 200 512 9 200 512 9 200 256 9 100 256 9 100Slice thickness (mm) 4 4 4 4 4Slice gap (mm) 0.4 0.4 0.4 0.4 0.4NSA 1 1 1 1 2Flip angle 90 90 90 90 90
3 T (Philips), 5 MR scansField of view (cm) 230–360 240–400 240–400 240–400 300/400No. of slices 30–41 30–37 32–45 35–45 40–45Repetition time (ms) 2689/3000 2689–3000 2689–3000 3000/4626 550–786Echo time (ms) 70–100 70–100 70–100 70/100 10Image matrix 256 9 198-528 9 361 400 9 246-528 9 400 400 9 395-528 9 361 300 9 287-768 9 287 248 9 248-512 9 255Slice thickness (mm) 3/4 3/4 3/4 3/4 3/4Slice gap (mm) 0–1 0/0.3 0/0.3 0/0.3 0/0.3NSA 2/4 1/4 1/4 1/2 1/2Flip angle 90 90 30 90 90
a With the exception of one SENSE dixon post-contrast series: FOV 400, no. of slices 480, TR 0, TE 0, matrix 512x207, slice thickness 1.5, gap 0,averages 1, flip angle 8
Appendix B. Combined results of interobserver agreement and correlation between observers and reference standard
MRI features Significant correlation between observer andreference standard (p £ 0.05)
Kappa or intraclass coefficient‡0.40
Relevant MRI feature
Observer 1 Observer 2 Observer 3 1 vs. 2 2 vs. 3 1 vs. 3
Wall thickness Yes Yes Yes Yes Yes Yes YesMesorectal lymph nodes Yes Yes Yes Yes Yes Yes YesObturator lymph nodes No No No No No No NoIliac lymph nodes No No No No No No NoInguinal lymph nodes No No No Yes No Yes No% of circumference involved Yes Yes Yes No No Yes NoMural T2 signal Yes Yes No No Noa Noa NoPerimural T2 signal Yes Yes Yes Yes Yes Yes YesT1 enhancement Yes No Yes No No No NoT1 enhancement pattern No Yes Yes No No Yes NoPerimural enhancement Yes Yes Yes Yes No Yes YesMural fat Yes No Yes Yes Yes Yes YesUlcers No No Yes Noa No No NoSupralevatoric fistula No No No Yes Yes Yes NoSupralevatoric abscess No No No Yes Yes Yes NoCreeping fat b Yes Yes Yes Yes Yes YesComb sign Yes Yes Yes No No Yes No
a Proportion of agreement calculated, because observed concordance is smaller than mean-chance concordance. Assuming kappa £0.40b Not calculated because of the presence of a zero in the crosstab
C. J. Tutein Nolthenius et al.: MRI characteristics of proctitis 1929

References
1. Beets-Tan RG, Beets GL, van der Hoop AG, et al. (2001) Preop-erative MR imaging of anal fistulas: does it really help the surgeon?Radiology 218(1):75–84
2. Panes J, Bouhnik Y, Reinisch W, et al. (2013) Imaging techniquesfor assessment of inflammatory bowel disease: joint ECCO andESGAR evidence-based consensus guidelines. J Crohn’s Colitis7(7):556–585
3. Gecse K, Khanna R, Stoker J, et al. (2013) Fistulizing Crohn’sdisease: diagnosis and management. United Eur Gastroenterol J1(3):206–213
4. Buchanan GN, Halligan S, Bartram CI, et al. (2004) Clinicalexamination, endosonography, and MR imaging in preoperativeassessment of fistula in ano: comparison with outcome-based ref-erence standard. Radiology 233(3):674–681
5. Schwartz DA, Herdman CR (2004) Review article: the medicaltreatment of Crohn’s perianal fistulas. Aliment Pharmacol Ther19(9):953–967
6. Safar B, Sands D (2007) Perianal Crohn’s disease. Clin ColonRectal Surg 20(4):282–293
7. Steward MJ, Punwani S, Proctor I, et al. (2012) Non-perforatingsmall bowel Crohn’s disease assessed by MRI enterography:derivation and histopathological validation of an MR-basedactivity index. Eur J Radiol 81(9):2080–2088
8. Ajaj WM, Lauenstein TC, Pelster G, et al. (2005) Magnetic reso-nance colonography for the detection of inflammatory diseases ofthe large bowel: quantifying the inflammatory activity. Gut54(2):257–263
9. Rimola J, Rodriguez S, Garcia-Bosch O, et al. (2009) Magneticresonance for assessment of disease activity and severity in ileo-colonic Crohn’s disease. Gut 58(8):1113–1120
10. Rimola J, Ordas I, Rodriguez S, et al. (2011) Magnetic resonanceimaging for evaluation of Crohn’s disease: validation of parametersof severity and quantitative index of activity. Inflamm Bowel Dis17(8):1759–1768
11. Tielbeek JA, Makanyanga JC, Bipat S, et al. (2013) Grading Crohndisease activity withMRI: interobserver variability ofMRI features,MRI scoring of severity, and correlation with Crohn disease endo-scopic index of severity. AJR Am J Roentgenol 201(6):1220–1228
12. Tolan DJ, Greenhalgh R, Zealley IA, Halligan S, Taylor SA (2010)MR enterographic manifestations of small bowel Crohn disease.Radiographics 30(2):367–384
13. Szurowska E, Wypych J, Izycka-Swieszewska E (2007) Perianalfistulas in Crohn’s disease: MRI diagnosis and surgical planning:MRI in fistulazing perianal Crohn’s disease. Abdom Imaging32(6):705–718
14. Horsthuis K, Stoker J (2004) MRI of perianal Crohn’s disease.AJR Am J Roentgenol 183(5):1309–1315
15. Altman DG (1999) Practical statistics for medical research. BocaRaton: Chapman & Hall
16. Van Assche G, Vanbeckevoort D, Bielen D, et al. (2003) Magneticresonance imaging of the effects of infliximab on perianal fistulizingCrohn’s disease. Am J Gastroenterol 98(2):332–339
17. Horsthuis K, Ziech ML, Bipat S, et al. (2011) Evaluation of anMRI-based score of disease activity in perianal fistulizing Crohn’sdisease. Clin Imaging 35(5):360–365
1930 C. J. Tutein Nolthenius et al.: MRI characteristics of proctitis