mrs. gauri salil apte - csir centralncl.csircentral.net/346/1/th1396.pdf · i will never forget the...
TRANSCRIPT

1
Genetic diversity analysis in
Gaultheria fragrantissima Wall. from the
two biodiversity hotspots in India using
molecular markers
A thesis submitted to the University of Pune
for the Degree of
DOCTOR OF PHILOSOPHY
IN
BIOTECHNOLOGY
BY
Mrs. Gauri Salil Apte
Plant Molecular Biology
Division of Biochemical Sciences
National Chemical Laboratory
Pune 411 008 (India)
April 2004

CERTIFICATE
Certified that the work incorporated in the thesis “Genetic diversity
analysis in Gaultheria fragrantissima Wall. from the two
biodiversity hotspots in India using molecular markers” submitted
by Mrs. Gauri Salil Apte was carried out by her under my
supervision. The material obtained from other sources has been duly
acknowledged in the thesis.
Date:
Dr (Mrs) V. S. Gupta
(Research Guide)
2
DECLARATION I hereby declare that the thesis entitled “Genetic diversity
analysis in Gaultheria fragrantissima Wall. from the two biodiversity hotspots in India using molecular markers” submitted for Ph.D degree at University of Pune has not been
submitted by me for a degree at any other University.
Date:
Mrs. Gauri Salil Apte National Chemical Laboratory
Pune 411 008
3

Dedicated to my parents
4

5
Leaf material used for thesis work was
collected with the help of:
Botanical Survey of India
(Western circle, Eastern circle, Southern circle,
Sikkim- Himalayan circle and Northern circle)
Centre for Ecological Sciences, Indian
Institute of Science, Bangalore
and
Tropical Botanic Garden and Research
Institute, Thiruvananthapuram

Contents Acknowledgments 1 List of abbreviations 3 Chapter 1 Review of literature: Two biodiversity hotspots in
India: Their flora, birth, theories of plant migration in these regions and potential of DNA markers in natural plant population analysis.
5
Chapter 2 Genetic diversity analysis of G. fragrantissima from
the two hotspots in India using ISSR primers 29
Chapter 3 Chloroplast and mitochondrial DNA diversity in
G. fragrantissima from the two hotspots in India 47
Chapter 4 Comparative analysis of quantity and quality of oil of
Indian wintergreen from the two hotspots in India 69
Chapter 5 Thesis summary and future directions 83 Bibliography 89 Curriculum Vitae 101
6

Acknowledgements I would like to express my deepest gratitude to Dr. Vidya Gupta for giving me an opportunity to carry out research work under her tutelage. I take this oppurtunity to express my reverence and my sincere regards to her forever. Without her versatile guidance and support, it is unlikely that the thesis would have been completed. I am highly indebted to Dr. P. K. Ranjekar and Dr. A. Pant for their constant encouragement and support. My sincere thanks to Dr. Meena Lagu for her everlasting support and interest in my work. Her energetic nature has always inspired me. I take this opportunity to thank Dr. B. G. Kulkarni, Dr. P. S. N Rao, Dr. M. K. V. Rao (BSI, Pune), Dr. A. Mao (BSI, Shillong), H. S Suresh (IISC, Bangalore) and scientists from TBGRI, Thiruvananthapuram, for their help in collecting plant material required for my thesis work. I am grateful to Dr. S. P Joshi, Dr. Mrs Tambe and Dr. Kalal from OCT, NCL for the help and facilities provided for conducting chemical analysis. My sincere thanks to Dr. Mohini Sainani, Dr. Ashok, Dr. Narendra and Dr. Abhay for their timely help and advice. I would like to express my sincere thanks to Rajesh, Bhushan and Shashi for their invaluable help and advice throughout the tenure of my work. I have learnt a lot from my association with them for which I am deeply indebted. I am grateful to my seniors, Dr. Ramkrishna, Aparna D, Dr. Venkat and Dr. Anjali for various reasons. They set a path and direction to my research during the initial phase. How will I forget the friendship of Archana, Rahul, Ritika and Rekha who have been of constant help and support during difficult times. I have thoroughly enjoyed their marvelous company and will cherish it forever. I will never forget the company of my friends Sadhana, Suvarna, Rashmi, Trupti, Ashwini, Ramya, Neeta, Gayatri, Monali, Sofia and Ram. My deepest thanks to them for their support, love and the wonderful atmosphere provided by them all throughout my research work. This page would be incomplete without mention of my lab mates who extended help throughout the tenure of my work in NCL. Thanks to Ajit, Gauri, Vaiju, Manasi, Radhika, Varsha, Ajay, Suhas, Nana, Sirsha, Sagar, Shalaka, Annirudha, Elan, Juri, Rakhi, Aarohi and Smita (OCT). I am always blessed by wonderful teachers from my school and college and my special thanks to them. All of them have contributed so much in nurturing my academic interest. I am also thankful to Usha, Indira, Satyali, Rohini and Anish for their help and support. A special thanks to Mr Jagtap and also to Mr Karunakaran for the energizing tea which always revitalized me while working long hours. I should not fail to place on record the help given to me by the office staff of the Biochemical Sciences Division and the facilities provided by NCL library. I am thankful to the Council of Scientific and Industrial Research, New Delhi for awarding a research fellowship and the Director, National Chemical Laboratory for permitting me to submit this work in the form of the thesis. Mere words are insufficient for the undying love and everlasting support given by the the four pillars of this thesis, whose special mention is necessary here. These four pillars are my mother, Dr. Vidya Mulay, father, Dr. Pramod Mulay, husband Salil and my dearest son, Soham. Their constant encouragement,
1

patience and faith in me made this thesis a reality. My deepest thanks to them. The thesis would have remained an unfulfilled dream without the support and love of of my brother, Dr. Sanjay Mulay, my sister- in –law, Dr. Arundhati Mulay and my mother- in –law. Their faith in me has always boosted my moral during struggling phase. A special mention of my maternal uncle Dr. Avinash Bhisey (ex Director, CRI, Mumbai) and aunty, Dr. Rajani Bhisey (ex Head Carcinogenesis, CRI, Mumbai) who are my idols and from my childhood I have always dreamt of reaching to the goals that they have set. I would like to acknowledge all my friends, relatives and well-wishers who have helped me at different times but whose names I have been unable to mention here. With this little eulogy, I have tried to express my everlasting gratitude towards all the people who deserve the credit of escalating my career to the height where I stand today. Gauri Apte
2

List of abbreviations
AFLP: Amplified Fragment Length Polymorphism
AMOVA: Analysis of Molecular Variance
B.P: Before Present
bp: base pair
BSI: Botanical Survey of India
CAPS: Cleaved Amplified Polymorphic Sequence
CBD: Convention on Biological Diversity
cpDNA: chloroplast DNA
CTAB: hexadecyl-trimethyl-ammonium bromide
°C: degree celcius
DNA: Deoxy Ribonucleic Acid
dNTPs: Deoxy Ribonucleotide Tri Phosphate
EDTA: Ethylene Diamine Tetra Acetic acid
ESU: Evolutionary Significant Unit
g: gram
GC: Gas Chromatography
h: hour
ha: hectar
Hg: mercury
IAA: Iso-Amyl Alcohol
ISSR: Inter Simple Sequence Repeat
kb: kilobase pair
KCl: Potassium Chloride
kg: kilogram
km2: Square kilometer
µg: microgram
µl: microlitre
µM: micromolar
m: meter
M: molar
MgCl2 : Magnesium Chloride
3

min: minute
ml: milliliter
mm: milimeter
mM: milimolar
MoEF: Ministry of Environment and Forest
MSD: Mean Squared Deviation
mtDNA: mitochondrial DNA
MW: Molecular Weight
mya: million years ago
NaCl : Sodium Chloride
NE: Northeast
ng : nanogram
NTSYSpc: Numerical Taxanomy System
pA: pico ampere
PCO: Principle Coordinate Analysis
PCR: Polymerase Chain Reaction
PIC: Polymorphism Information Content
PPB: Percentage of Polymorphic Bands
RAPD: Random Amplified Polymorphic DNA
RFLP: Restriction Fragment Length Polymorphism
rpm: revolution per minute
s: Second
SSCP: Single Strand Conformational Polymorphism
SSD: Sum of Squared Deviation
SSR: Simple Sequence Repeat
TAE: Tris-acetate EDTA
TBE: Tris-borate-EDTA
TE: Tris-EDTA
Tm: melting temperature
UBC: University of British Columbia
UNEP: United Nations Environment Programme
UPGMA: unweighted pair group method, arithmetic mean
WG: Western Ghats
4

5
Chapter 1
Review of literature

6
Review of literature
Contents 1.0 What is Biodiversity ?
1.1 Biodiversity in India
1.2 History of the tectonic movement of the Indian plate and birth of
the two hotspots 1.2.1 History of the tectonic movement of the Indian plate
1.2.2 Birth of the Great Himalayas and Western Ghats
1.3 Flora in WG and NE region, the two hotspots
1.4 Distribution and migration of plant species between WG and NE
region
1.5 Detection of genetic variation 1.5.1 DNA markers for assessment of genetic variation
1.5.2 Use of various marker systems for population analysis
1.5.3 Molecular markers in plant population biology for planning
conservation strategies
1.6 Gaultheria fragrantissima: A plant under present study
1.7 Genesis of thesis and its organization
5

1.0 What is Biodiversity ? The term biodiversity was coined by an entomologist, Edward O. Wilson in 1986,
in a report for the first American Forum on Biological Diversity, organized by the
National Research Council. Biodiversity can be defined as the array of all interacting,
genetically distinct biological populations and species in a region, the communities that
they comprise and the variety of ecosystems of which they are functioning parts or in
short, biodiversity is the totality of genes, species and ecosystem of a region (Chaudhuri
and Sarkar, 2002). Fig 1.1 shows a representation of biodiversity including the flora,
fauna, other life forms, abiotic factors and their habitat. The three levels of biodiversity
Fig 1.1: Balanced ecosystem
are 1) diversity of genes within a species (genetic diversity), 2) diversity between species
(species diversity) and 3) variability in the habitats occurring within a region (ecosystem
diversity) (Chaudhuri and Sarkar, 2002). Biodiversity is the prime wealth of the earth
and it has contributed in many ways to the development of man. A healthy biodiversity
provides a number of natural services to mankind and that to free of charge! Such
services include ecosystem services (protection of water resources, nutrient storage and
recycling, pollution absorption, etc), biological services (food, medicines, wood
products, ornamental plants, breeding stocks, etc) and social benefits (research,
education, recreation, tourism, cultural values, etc). A rapid increase in human
population and other activities like habitat destruction, extension of agriculture, filling up
of wetlands, conversion of rich biodiversity areas for human settlements and industrial
development, destruction of coastal areas and uncontrolled commercial expansion are
causing destruction of the ecosystem and loss of biodiversity. A majority of biologists
believe that a “mass extinction” of biodiversity is underway. Loss of biodiversity has
serious environmental, economic and social consequences and costs. Every country has a
responsibility to conserve, restore and sustainably use the natural resources within its
6

jurisdiction. For such sustainable use, there is a need to analyze and survey biodiversity
and the first step in doing so is to identify areas of high species diversity and which are
experiencing loss of habitat. These areas are also called as ‘Hotspots’. Myers et al (2000)
have thus identified 25 hotspots all over the globe (Fig 1.2) where 44% of all vascular
plant species and 35% of all species in four vertebrate groups are confined to only 1.4%
of the land surface of the earth. The details of these 25 hotspots are given in Table 1.1
Fig 1.2: 25 Biodiversity hotspots
and they contribute to several habitat types at the global scale; predominant are the
tropical forests, Mediterranean type and islands. Sixteen hotspots are in the tropics which
largely represent developing countries where threats are the greatest and conservation
strategies are the scarcest. Protection of these hotspots is a prime need where only 38%
of them are being protected as parks and reserves, remaining 62% are still to be protected
(Myers et al, 2000). There are approximately 170 countries in the world, and just 12 of
them (Australia, Brazil, China, Colombia, Ecuador, India, Indonesia, Madagascar,
Malaysia, Mexico, Peru and Zaire) contain 70% of our planets biodiversity. For this
reason, these countries are known as ‘Megadiverse’ (Chaudhuri and Sarkar, 2003). These
identified megadiverse countries need to take more efforts to protect their biodiversity
and also its sustainable use. For decades, there have been efforts, to bring people together
from all over the globe in an attempt to fight against the destruction and loss of species
and ecosystem. In 1972, the United Nations Conference on Human Environment
(Stockholm) resolved to establish the United Nations Environment Programme (UNEP).
7
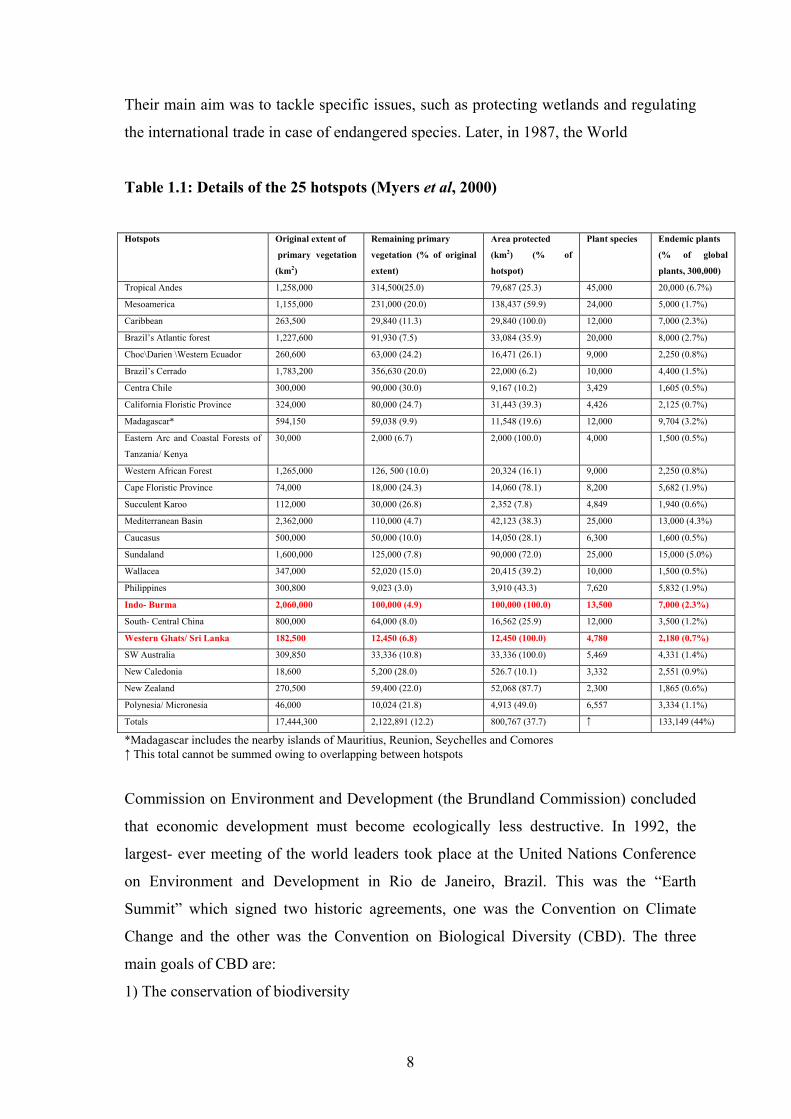
Their main aim was to tackle specific issues, such as protecting wetlands and regulating
the international trade in case of endangered species. Later, in 1987, the World
Table 1.1: Details of the 25 hotspots (Myers et al, 2000)
Hotspots Original extent of
primary vegetation
(km2)
Remaining primary
vegetation (% of original
extent)
Area protected
(km2) (% of
hotspot)
Plant species Endemic plants
(% of global
plants, 300,000)
Tropical Andes 1,258,000 314,500(25.0) 79,687 (25.3) 45,000 20,000 (6.7%)
Mesoamerica 1,155,000 231,000 (20.0) 138,437 (59.9) 24,000 5,000 (1.7%)
Caribbean 263,500 29,840 (11.3) 29,840 (100.0) 12,000 7,000 (2.3%)
Brazil’s Atlantic forest 1,227,600 91,930 (7.5) 33,084 (35.9) 20,000 8,000 (2.7%)
Choc\Darien \Western Ecuador 260,600 63,000 (24.2) 16,471 (26.1) 9,000 2,250 (0.8%)
Brazil’s Cerrado 1,783,200 356,630 (20.0) 22,000 (6.2) 10,000 4,400 (1.5%)
Centra Chile 300,000 90,000 (30.0) 9,167 (10.2) 3,429 1,605 (0.5%)
California Floristic Province 324,000 80,000 (24.7) 31,443 (39.3) 4,426 2,125 (0.7%)
Madagascar* 594,150 59,038 (9.9) 11,548 (19.6) 12,000 9,704 (3.2%)
Eastern Arc and Coastal Forests of
Tanzania/ Kenya
30,000 2,000 (6.7) 2,000 (100.0) 4,000 1,500 (0.5%)
Western African Forest 1,265,000 126, 500 (10.0) 20,324 (16.1) 9,000 2,250 (0.8%)
Cape Floristic Province 74,000 18,000 (24.3) 14,060 (78.1) 8,200 5,682 (1.9%)
Succulent Karoo 112,000 30,000 (26.8) 2,352 (7.8) 4,849 1,940 (0.6%)
Mediterranean Basin 2,362,000 110,000 (4.7) 42,123 (38.3) 25,000 13,000 (4.3%)
Caucasus 500,000 50,000 (10.0) 14,050 (28.1) 6,300 1,600 (0.5%)
Sundaland 1,600,000 125,000 (7.8) 90,000 (72.0) 25,000 15,000 (5.0%)
Wallacea 347,000 52,020 (15.0) 20,415 (39.2) 10,000 1,500 (0.5%)
Philippines 300,800 9,023 (3.0) 3,910 (43.3) 7,620 5,832 (1.9%)
Indo- Burma 2,060,000 100,000 (4.9) 100,000 (100.0) 13,500 7,000 (2.3%)
South- Central China 800,000 64,000 (8.0) 16,562 (25.9) 12,000 3,500 (1.2%)
Western Ghats/ Sri Lanka 182,500 12,450 (6.8) 12,450 (100.0) 4,780 2,180 (0.7%)
SW Australia 309,850 33,336 (10.8) 33,336 (100.0) 5,469 4,331 (1.4%)
New Caledonia 18,600 5,200 (28.0) 526.7 (10.1) 3,332 2,551 (0.9%)
New Zealand 270,500 59,400 (22.0) 52,068 (87.7) 2,300 1,865 (0.6%)
Polynesia/ Micronesia 46,000 10,024 (21.8) 4,913 (49.0) 6,557 3,334 (1.1%)
Totals 17,444,300 2,122,891 (12.2) 800,767 (37.7) ↑ 133,149 (44%)
*Madagascar includes the nearby islands of Mauritius, Reunion, Seychelles and Comores ↑ This total cannot be summed owing to overlapping between hotspots
Commission on Environment and Development (the Brundland Commission) concluded
that economic development must become ecologically less destructive. In 1992, the
largest- ever meeting of the world leaders took place at the United Nations Conference
on Environment and Development in Rio de Janeiro, Brazil. This was the “Earth
Summit” which signed two historic agreements, one was the Convention on Climate
Change and the other was the Convention on Biological Diversity (CBD). The three
main goals of CBD are:
1) The conservation of biodiversity
8

2) Sustainable use of the components of biodiversity, and
3) Sharing the benefits arising from the commercial and other utilization of genetic
resources in a fair and equitable way.
Thus CBD has created a global forum where governments, non- governmental
organizations, academicians, the private sectors, and other interested groups meet and
share ideas and compare strategies. The megadiversity countries of the developing world
are also trying to develop a common plank for their rights, develop a frame work which
will enable them to share experiences, information and maybe even personnel. These 12
megadiversity countries, except Australia, met in February 2003 at Cancun, Mexico to
develop a consortium, a sort of negotiating platform, on environmental issues like
protecting valued biodiversity and traditional knowledge or further even raising funds to
help each other.
1.1 Biodiversity in India India is one of the 12 megadiversity centers of the world. Western Ghats (WG)
and Northeastern Himalayas (NE) constitute 2 hotspots (Fig 1.3) of the 25 biodiversity
hotspots in the world (Myers et al 2000). India has a rich and varied heritage of
biodiversity covering ten biogeographical zones, namely, the trans- Himalayan, the
Himalayan, the Indian desert, the semi- arid zone(s), the Western Ghats, the Deccan
Penninsula, the Gangetic Plain, North- East India and the islands and coasts (Rodgers et
al, 2000). India lies at the junction of the 3 major biogeographic realms, namely, the
Indo- Malayan, the Eurasian and the Afro- tropical. The forests cover an actual area of
63.73 million ha (19.39%) and consists of 37.74 million ha of dense forests, 25.51
million ha of open forest and 0.487 million ha of mangroves, apart from 5.19 million ha
of scrub. It comprises 16 major forest groups accounting for a species diversity of about
1,256 belonging to 245 genera (MoEF, 1999). The endemism of Indian biodiversity is
about 33% of the country’s recorded flora and is concentrated mainly in the Northeast,
Western Ghats, Northwest Himalaya and the Andaman and Nicobar islands. As many as
14 ecoregions lying completely or in part within India figure amongst the Global 200,
which are outstanding examples of the world’s diverse ecosystems based on criteria such
as species richness, species endemism, unique higher taxa, unusual ecological or
evolutionary phenomena and global rarity of major habitat types. This immense
diversity has resulted in the inclusion of the two Indian regions namely, Western Ghats/
9

Fig 1.3: The two hotspots in India
Fig 1.3: Two hotspots in India
Sri Lanka and the Indo- Burma region (covering the Northeastern Himalayas) in the 25
global biodiversity hotspots.
WG is also known as the Malabar rain forest province and is one of the major
tropical evergreen forested regions in India which exhibit enormous plant and animal
diversity. This mountain range is approximately 1,600km long and runs parallel to the
west coast of India from 8°20'N to 21°40'N and 73°E to 77°E (Fig 1.4). The hills rise to
2,800m with an average width of 100km covering an area of approximately 170,000km2,
which includes 12,000km2 of primary vegetation. The WG are estimated to harbor
approximately 5,500 species of flowering plants (Nair and Daniel 1986). According to
Myers et al (2000) they are also home to 2,180 endemic plants, constituting 0.7% of
global plant species. Shola forests (Fig 1.5) occurring above 1500m in the Nilgiri ranges
of the WG represent a unique system of evergreen montane forests, which are almost
invariably confined to sheltered sites, such as valleys, hollows and depressions.
10

Fig 1.4: Western Ghats: Hotspot area marked in yellow (www.nationalgeographic.com)
Fig 1.5: Shola forest : Nilgiri hills
These ‘Sholas’ are the best examples of tropical evergreen forests or tropical rain forests
(Malabar rain forest) and are some of the non- renewable natural resources (Hajra and
Mudgal, 1997). Palynological studies have revealed that these shola forest communities
had been wide spread in the past. They originated through gradual invasion of shrubs and
under trees into grassland, about 35,000 years BP, corresponding in time to the last
11

glaciation in the north and were established about 24,000 years BP. The progressive
recession of sholas had started around 7,000 years BP. Both biotic and climatic factors
not only reduced the sholas but have also created conditions under which the community
has almost completely stopped regeneration outside the sholas (Gupta, 1989).
The Northeastern region of India is a unique transitional zone between the Indian,
Indo- Malayan and Indo- Chinese biogeographical zones as well as the confluence of the
Himalayan region with peninsular India (Rao, 1993). The Northeastern region comprises
the eight states of India (Arunachal Pradesh, Assam, Manipur, Meghalaya, Mizoram,
Nagaland, Tripura and Sikkim). Fig 1.6 shows the representation of temperate forest
from Meghalaya. There are 14 peaks in this region above 8000m and hundreds above
7,000m
Fig 1.6: Forest cover in Shillong
in altitude (www.commonwealthknowledge.net). The region contains about 8,000
species of flowering plants including several representatives of primitive and ancient
angiosperms (Takhtajan, 1969; Rao, 1994) of which 3,500 are endemic. The high
rainfall, moist and cold climate coupled with factors like variable altitude, latitude and
longitude have added to the multiplicity of habitats and thus provide varied
microclimates and ecological niches both for plants and animals. The region is also
recognized as a centre of origin of several cultivated plants. The rise of the Himalayas
not only opened several routes for inflow and outflow of flora from central or west Asia,
or even Europe, to East Asia but also has dynamically influenced the evolutionary
pattern of vegetation in terms of emergence of new taxa and extinction of others.
12

1.2 History of the tectonic movement of the Indian plate and birth of the two hotspots
1.2.1 History of the tectonic movement of the Indian plate
The supercontinent called “Pangea” (Fig 1.7) existed during the Permian period
(270 million years ago). The rest of the globe was all covered by water and this ancestral
ocean was called “Panthalassa”. But this single continent was short- lived and by the
end of Triassic period (180 million years ago) it started splitting into northern and
southern landmasses. The southern landmass was called the Gondwana land and the
northern landmass was called Laurasia. Gondwana land included the present South
America, Africa, Indian and Antarctic continents, while Eurasia and North America were
derived
Fig 1.7: Supercontinent pangea
from Laurasia. Both these landmasses i.e. Gondwana land and Lauraisa started
fragmenting about 120 million years ago. The movement of fragments from Gondwana
land led to the placement of South America, Africa, Australia and Antarctica to their
present position. Laurasia rotated clockwise, Africa drifted north to meet Laurasia
resulting in numerous collisions to form the present Alps of Europe and another collision
created a pinching closure to the east that left the Mediterranean Sea. A north Atlantic
Rift broke Laurasia into two, to form Portugal and Canada and continued along, what is
now the Artic Ocean. The Indian subcontinent broke away from Antarctica and drifted to
north towards Laurasia at the end of the Cretaceous Period (80 million years ago)
(Bourliere, 1980).
13

1.2.2 Birth of the Great Himalayas and Western Ghats
Himalaya is amongst the youngest of mountain chains in the world
(www.gisdevelopement.net). The Himalayan mountain system developed in a series of
stages 30- 50 million years ago. The Himalayan range was created from powerful earth
movements that occurred as the Indian plate collided with the Eurasian continental plate.
As the two plates collided, the sinking ocean floor generated volcanoes in southern Tibet.
By 25 million years ago the fast moving Indian continent (moving at the rate of 15cm/
year) had almost entirely closed over the intervening ocean, squeezing the sediments on
the ocean floor. This ocean, ‘Tethys’ thus completely disappeared. The sediments on the
ocean floor were light weight and instead of sinking along with the plate crumpled into
mountain ranges and Himalaya was born. Fig 1.8 shows the step by step formation of
Himalayas (www.pbs.org).
The Deccan Plateau itself was once part of Gondwana land, evident in relicts of
the ancient southern flora and fauna. After becoming detached from this southern
continent during the Cretaceous period (80 million years ago), it drifted northward to
finally crash into the northern Laurasian continent. After this initial collision, a series
of geological uplifts created the Western Ghats mountain range, with several peaks
higher than 2,000m (www.worldwildlife.org).
14
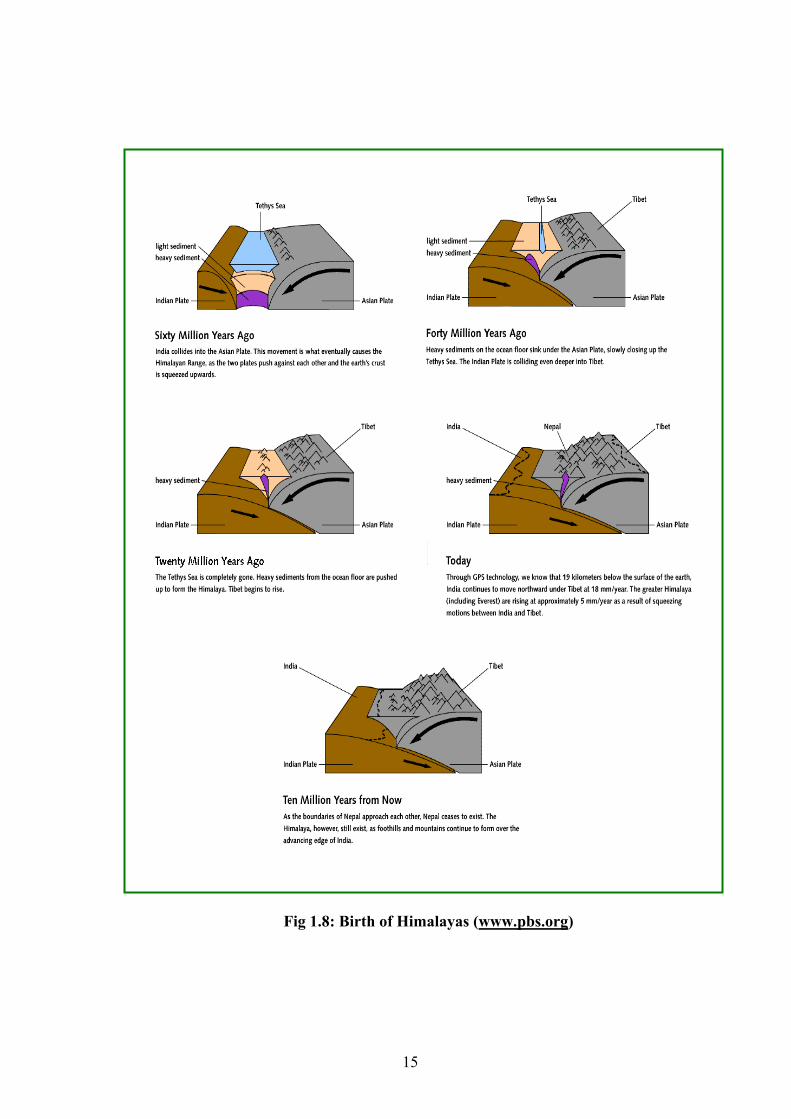
Fig 1.8: Birth of Himalayas (www.pbs.org)
Fig 1.8: Birth of Himalayas (www.pbs.org)
15

1.3 Flora in WG and NE region, the two hotspots It has been reported that 325 families represent 17,000 flowering plants in India
out of which 15% are believed to be under threat. The most dominant families are
Acanthaceae, Asteraceae, Cyperaceae, Euphorbiaceae, Fabaceae, Lamiaceae,
Orchidaceae, Poaceae, Rubiaceae and Urticaceae. Apart from the flowering plants
there are 64 gymnosperms, 1,200 pteridophytes, 2,850 bryophytes, 13,000 fungi and
12,500 algae (Hajra and Mudgal, 1987). Together the two hotspots have 5,150 endemic
plant species, or 20% of the worlds recorded plant species, in only 746,400 km2 or
0.5% of the earths land surface.
In the Himalayan ranges vegetation can be divided into three broad zones:
tropical- subtropical (base to 1,200m), temperate (1,200- 3,600m) and alpine (upto
4,500m) (Singh and Sarkar, 1990). Northeastern Himalayas represent about 8,000
species of flowering plants out of which 3,500 are endemic. In NE region there is high
degree of diversity in orchids, rhododendrons, hedychiums, oaks and bamboos
alongwith large number of plants of medicinal and ethanobotanical values. It is
estimated that out of a total of 800 edible plants in India, more than 300 are found in
NE region. Thus, this region is also called as the ‘centre of origin’ of several cultivated
plants including about 200 wild relatives of cultivated plant species. However,
presently it is recorded that atleast 55 flowering plants endemic to this region are rare.
The pitcher plant (Nepenthes khasiana) has become rare while the Taxol plant (Taxus
wallichiana) has come in the Red Data category due to over exploitation for drug
extraction used in cancer treatment (MoEF, 1999).
The types of forests in WG include thorn forests (300- 800m), deciduous forests
(800- 1,300m) and tropical evergreen montane forests (above 1,500m) (Meher- Homji,
1975). WG or the Malabar province harbours 4,000 species of flowering plants of
which 1,600 are endemic. WG has high degree of diversity in valuable timber species
of families such as Bombacaceae, Clusiaceae, Dipterocarpaceae, Fabaceae and
Lauraceae, alongwith large variety of bamboos, legumes, medicinal plants, spices and
condiments. It is also a rich germplasm centre for a number of wild relatives of
cultivated plants. Nearly 235 species of endemic flowering plants are considered to be
endangered (MoEF, 1999). Overexploitation of Mappia foetida for the anticancer drug
component camptothesin and Renanthera imschortians commonly known as Red
Vanda, a highly threatened species of orchid has been added to the Red Data book
16
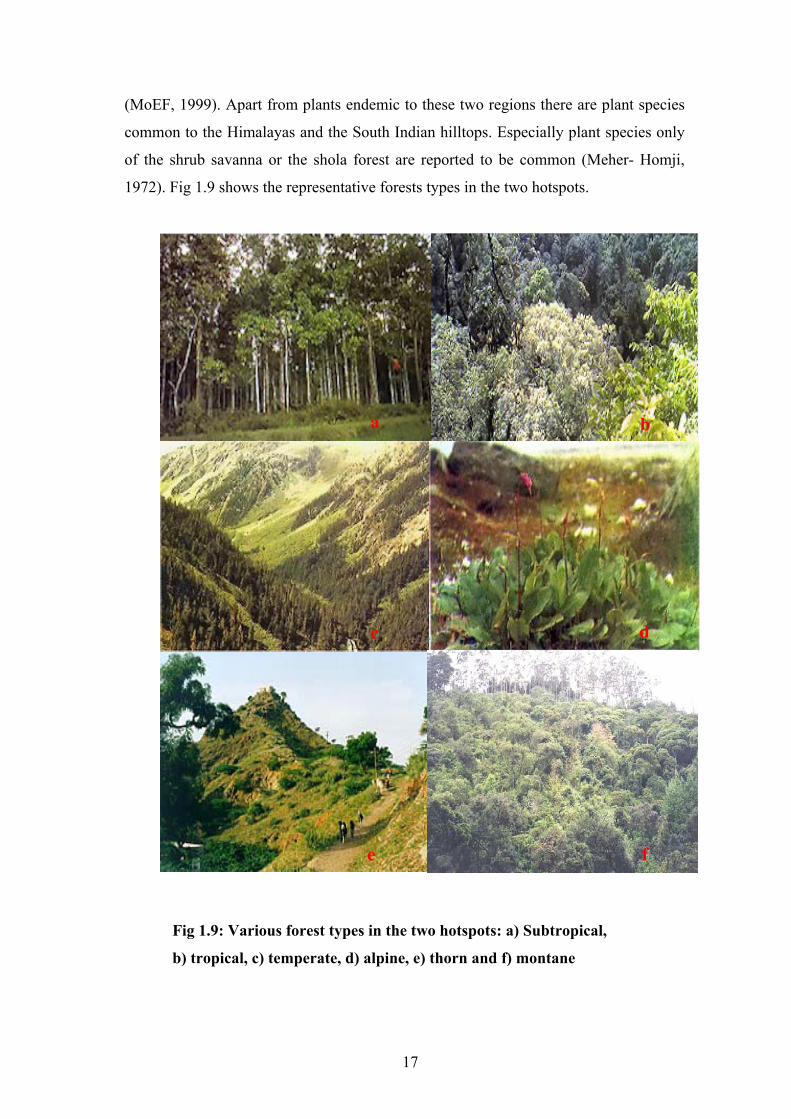
(MoEF, 1999). Apart from plants endemic to these two regions there are plant species
common to the Himalayas and the South Indian hilltops. Especially plant species only
of the shrub savanna or the shola forest are reported to be common (Meher- Homji,
1972). Fig 1.9 shows the representative forests types in the two hotspots.
f e
d c
b a
Fig 1.9: Various forest types in the two hotspots: a) Subtropical,
b) tropical, c) temperate, d) alpine, e) thorn and f) montane
17

India’s ever increasing population has put tremendous pressure on these
ecosystems. In order to increase food production, there is an increase in agricultural
areas leading to reduction in the forests and grasslands (Upadhyay, 1999). In the NE
region a 2,778 km2 area was used for shifting cultivation from 1993 to 1997 and has
caused extensive deforestation. In Meghalaya alone, 295 km2 area has been used for
similar purpose (Upadhyay, 1999). In WG, smaller ranges and deforestation contribute
to isolation of the shola forests. A loss of 25.6% of the total forest area has been noted
in the WG region during the last two to three decades, whereas the dense forest cover
and open forests have decreased by 19.5 and 33.2% of their total occupation,
respectively, due to deforestation and land use (Jha et al, 2000).
1.4 Distribution and migration of plant species between WG and NE region Various theories have been put forth by a number of researchers to explain the
geographical distribution and migration of plant species between the NE and WG
mountain ranges. The most commonly held view for the occurrence of these common
species is that the *Pleistocene glaciation is responsible for pushing the Himalayan
plants southwards and these species are known as the relicts or vestiges of the last ice
age (Medlicot and Blanford, 1879; Burkill, 1924; Hora, 1949; Auden, 1949; Dey, 1949).
Hora (1949) believes that the Vindhya- Satpura trend of hills was the connecting link
that existed in the past between the east and the west. This hypothesis known as the
Satpura Hypothesis is based on: 1) Continuity of the Vindhya- Satpura ranges with the
Assam Himalayas in the east and the Western Ghats in the west. 2) Five to six thousand
feet elevation of the Vindhya- Satpura ranges and of the northern section of the Western
Ghats. 3) Continuity of an ecological belt of mountains with rainfall of about 100 inches
or above and consequently of tropical evergreen forests between Assam Himalayas and
the mountains of Ceylon via the Vindhya- Satpura trend and the Western Ghats and
4) Dispersal of the fauna/ flora from east to the west and the consequent change in
topography necessary therefore (Dilger, 1952).
18

*Pleistocene glaciation and its impact on the Globe:
Various types of paleoclimatic evidence suggest that the climate of Earth has varied over time. Ice ages occur at
regular intervals of 100,000 years with warm interglacial periods lasting 15- 20,000 years as a result of instabilities in
the earth’s climate caused by the Milankovitch cycles (Bennett, 1990). Glaciation is a geological phenomenon in
which massive ice sheets form in the Arctic and Antarctic and advance towards the equator. In the last billion years of
Earth history, glacial periods have started at roughly 925, 800, 680, 450, 330 and 2 million years before present (B.P.).
The last major glacial period began about 2,000,000 years B.P. and is commonly known as the Pleistocene glaciation
or the last Ice Age (www.geog.ouc.bc.ca). Climatic oscillations in the Quaternary have played a major role in changing
the geographical distribution of plant species. The change of geographical distribution has also provided opportunities
for speciation through isolation and hybridization after secondary contact. Quaternary palaeoecology in Europe and
North America has revealed a series of southward range contractions of both plant and animal species during the last
glacial period followed by rapid northward range expansions in the wake of deglaciation.There is no direct information
on the prevalence of the Pleistocene glaciation in Penninsular India but it is a generally accepted fact that increased
glaciation in the Himalaya could have lowered the mean annual temperature of Pennninsula by 5°C to 7°C (Rajguru,
1969) making it favourable to permit some of the animals and plants from the Himalaya to wander south (Pascoe,
1963).
Randhwa (1945) has earlier suggested that a part of India to the north of the
Satpura Trend was, in historical times, very much wetter than it is at present time and
supported a typical wet tropical fauna and flora. However, the ‘Brij’ country which was
covered with luxuriant evergreen tropical forests about 2,000 years ago has now
completely changed. Briggs (1989) further believes the existence of a former wet tropical
belt across India between the eastern Himalayas and the west coast north of Vindhya-
Satpura Trend and this is probably the area that once supplied the connecting link
between the Western Ghats and the Northeastern region of India.
However, Blasco (1970, 1971) is not in favor of the commonly held theory that
Pleistocene glaciation is responsible for pushing the Himalayan flora southwards. He has
followed the views putforth by Hedbergs (1969) for the mountains of East Africa,
wherein direct contact between the various high peaks due to the Pleistocene climatic
changes is ruled out and the intermountain migration through independent long distance
dispersal is suggested. However, Dilger (1952) has pointed out that the distance involved
between the mountains of East Africa is considerably shorter than that between the
Himalayas and the South Indian hills. Furthermore, Meher- Homji (1972) has also
revealed problems associated with long distance dispersal hypothesis based on the
presence of different species of Rhododendron and Mahonia on WG and NE region eg:
Rhododendron arboreum in the Himalaya and R. nilagiricum on the Ceylon highlands;
Berberis- syn. Mahonia nepalensis in the Himalayas and M. leschnaultii in south India.
19

This suggests that the transport has taken place sufficiently earlier to give enough time to
these genera to evolve independently. Apart from such distinct species in WG and NE
region, it is also seen that in certain cases there exists one link species between these two
regions, namely, Symplocos laurina, Pittosporum floribundum, Ardisia solanacea, etc.
(Meher- Homji, 1975). Analysis of such plant species at the genetic level can provide
insight into their migration and distribution.
1.5 Detection of genetic variation A variety of methods exist for the assessment of genetic variation in closely or
distantly related plant species. Traditionally, genetic variation is inferred by
morphological/ phenotypic variation or the growth response of the organism. Many
researchers have also used cytological tools for such studies. Janaki Ammal et al (1950)
studied the genus Rhododendron in detail using chromosome counts and studied its
ploidy. Middleton and Wilcock (1990) carried out chromosomal analysis of 32 taxa in
the Gaultheria group for subgeneric classification. He further studied the leaf and stem
anatomy of many species in the Gaultheria group of genera of tribe Andromedeae and
suggested that these characters would be useful for subgeneric classification (Middleton,
1993). However, it is difficult to tell whether the phenotypic variations are due to
environmental effects or the underlying genetic differences within the plant species.
The use of allozyme technique became widespread in the late 1960’s and
produced a large volume of data on genetic variation in plant species (Loveless and
Hamrick, 1984; Hamrick and Godt, 1989). The primary contribution of allozymes to
plant population biology has come from their utilization as neutral (or nearly neutral)
genetic markers. Allozymes have been employed to characterize patterns of genetic
variation, within and among populations and to examine the process of dispersal and the
patterns of mating that influence levels of genetic differentiation (Brown 1979, Loveless
and Hamrick 1984; Hamrick and Godt 1989; Barrett and Kohn 1991). Hamrick and Godt
(1989) in their review of 322 isozyme studies also concluded that woody plants maintain
more intraspecific variations than other life forms but generally display less variation
between populations. Here are a few examples of the use of allozymes in the study of
plant population genetics: Batista and Sosa (2002) have used allozymes to study
diversity in natural populations of Viola palmensis. They detected no relationship
between genetic differentiation and geographical distances between populations and
suggested an outcrossing insect mediated breeding system. Matolweni et al (2000)
20

studied genetic diversity and gene flow in the morphologically variable rare endemics
Begonia dregei and Begonia homonyma. They suggested a restricted gene flow and the
ancient separation of isolated forest patches. However, the main drawback of allozymes
is their low abundance and low level of polymorphism.
1.5.1 DNA markers for assessment of genetic variation
DNA markers play a very important role and help in studying the genetic
variations in natural populations. They represent nuclear as well as organellar genome
(chloroplast and mitochondrial) and reveal sequence polymorphisms that can be used as
highly informative markers for the structure and dynamics of genomes at the level of
populations and individuals. They measure the genetic diversity at DNA level, can
account for the effects of selection, are environment- independent and are available in an
enormous number. Further, the invention of PCR technology by Saiki et al (1988) and its
technical simplicity made it a very popular technique among researchers. Table 2
summarizes popular marker types and their suitability for various applications in plant
population (within and between) studies in comparison with allozyme markers.
21
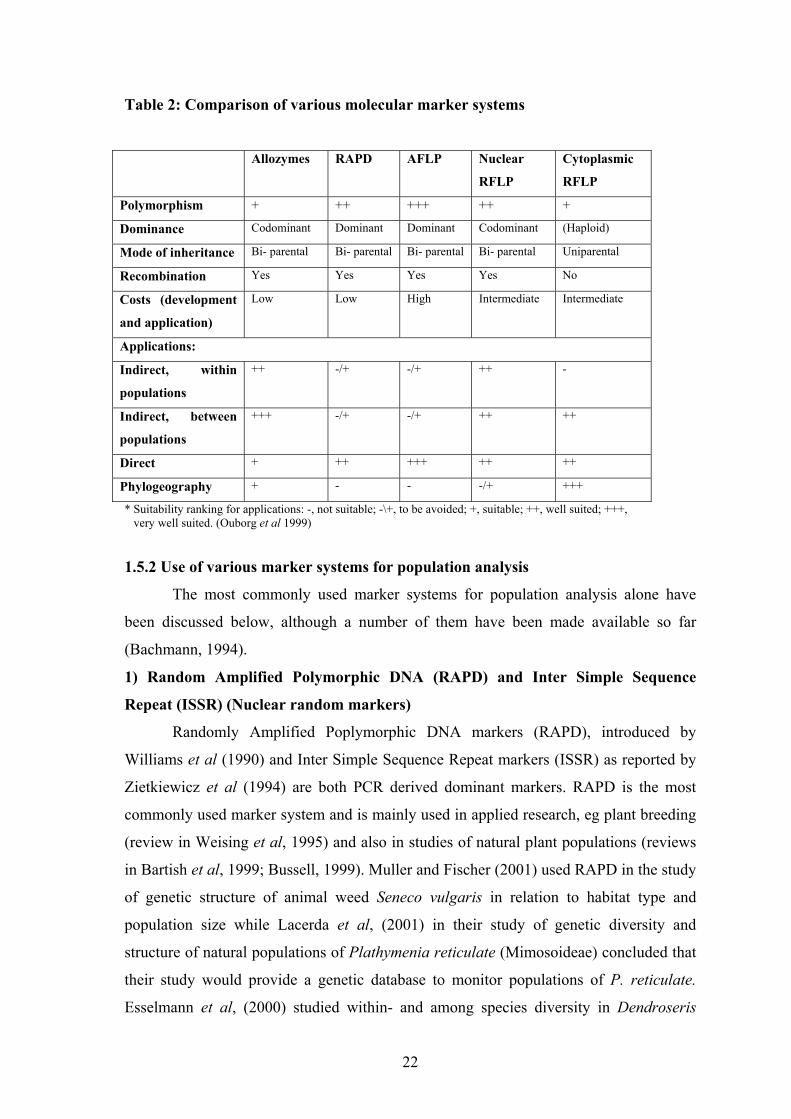
Table 2: Comparison of various molecular marker systems
Allozymes RAPD AFLP Nuclear
RFLP
Cytoplasmic
RFLP
Polymorphism + ++ +++ ++ +
Dominance Codominant Dominant Dominant Codominant (Haploid)
Mode of inheritance Bi- parental Bi- parental Bi- parental Bi- parental Uniparental
Recombination Yes Yes Yes Yes No
Costs (development
and application)
Low Low High Intermediate Intermediate
Applications:
Indirect, within
populations
++ -/+ -/+ ++ -
Indirect, between
populations
+++ -/+ -/+ ++ ++
Direct + ++ +++ ++ ++
Phylogeography + - - -/+ +++
* Suitability ranking for applications: -, not suitable; -\+, to be avoided; +, suitable; ++, well suited; +++, very well suited. (Ouborg et al 1999)
1.5.2 Use of various marker systems for population analysis
The most commonly used marker systems for population analysis alone have
been discussed below, although a number of them have been made available so far
(Bachmann, 1994).
1) Random Amplified Polymorphic DNA (RAPD) and Inter Simple Sequence
Repeat (ISSR) (Nuclear random markers)
Randomly Amplified Poplymorphic DNA markers (RAPD), introduced by
Williams et al (1990) and Inter Simple Sequence Repeat markers (ISSR) as reported by
Zietkiewicz et al (1994) are both PCR derived dominant markers. RAPD is the most
commonly used marker system and is mainly used in applied research, eg plant breeding
(review in Weising et al, 1995) and also in studies of natural plant populations (reviews
in Bartish et al, 1999; Bussell, 1999). Muller and Fischer (2001) used RAPD in the study
of genetic structure of animal weed Seneco vulgaris in relation to habitat type and
population size while Lacerda et al, (2001) in their study of genetic diversity and
structure of natural populations of Plathymenia reticulate (Mimosoideae) concluded that
their study would provide a genetic database to monitor populations of P. reticulate.
Esselmann et al, (2000) studied within- and among species diversity in Dendroseris
22
(Asteracea: Lactuceae) and suggested that RAPD might provide a useful alternative to
allozymes for assessing diversity in rare species.
Culley et al (2001) used both allozymes and ISSR to study population genetic
structure of the Cleistogamous plant species Viola pubescens Aiton (Violaceae) and
inferred high genetic variation, population structuring and mixed mating system.
Camacho and Liston (2001) analysed population structure, genetic diversity and
significance of asexual reproduction in Botrychium pumicola (Ophloglossaceae)
suggesting that the long distance dispersal of gemmmae is a rare event while Wolfe et al
(1998) studied hybridization in natural populations of Penstemon (Scrophulariaceae) and
did not support hybrid origin of P. spectabilis using ISSR markers.
2) Amplified fragment length polymorphism (AFLP)
AFLP is an ingenious combination of RFLP (Restriction Fragment Length
Polymorphism) and PCR (Polymerase Chain Reaction) techniques (Vos et al 1995).
During last few years, there have been a few reports on the use of AFLP in the studies of
natural populations. Gaudeul et al (2000) analyzed genetic diversity in an endangered
alpine plant Eryngium alpinum L. (Apiaceae). Their study showed that although the
endangered species occurred in small isolated populations, contained high genetic
diversity indicating chances of recovery of the species. Mariette et al, (2001) studied
genetic diversity within and among Pinus pinaster populations and suggested very weak
cross species amplification in Pinus genus. Ribeiro et al (2002) studied within and
among population genetic diversity of maritime pine using AFLP and cpSSR and
concluded that gene flow was the predominant force shaping nuclear and chloroplast
genetic variation.
3) Cytoplasmic DNA markers
Chloroplast and mitochondrial genomes are the extranuclear or organellar
genomes which are also exploited for the studies on population structure,
phylogeography and genetic diversity. These organellar genomes are uniparenatally
inherited, are homoplasmic and non recombinant. Availability of intergenic chloroplast
(cp) and mitochondrial (mt)DNA markers (Demesure 1995, Taberlet 1991 and Dumolin-
Lapague, 1997) and use of PCR-RFLP or CAPS technique (Cleaved Amplified
Polymorphic Sequence) have helped researchers to study genetic diversity in natural
populations. Mohanty et al, (2002) analysed chloroplast DNA polymorphism in wild
populations of Prunus spinosa L. and showed incongruency between the phylogeny of
haplotypes and their geographic locations due to intensive seed movements. Palme et al
23

(2003) analysed postglacial recolonization and cpDNA variation of Silver birch.
Johansen and Latta (2003) studied mitochondrial haplotype distribution, seed dispersal
and patterns of postglacial expansion of ponderosa pine where results suggested a small
number of long distance colonists with diffusive dispersal.
1.5.3 Molecular markers in plant population biology for planning conservation
strategies
In order to prevent depletion of biodiversity, it is necessary to understand how the
diversity of life, particularly at the genetic level, is maintained under natural conditions.
Charles Darwin’s theory of evolution by natural selection is predicted upon the existence
of genetic diversity –a major component of biodiversity. With a loss of genetic
variability within a species, the pool of genetic resources for further evolution is
gradually drained (Narain, 2000). The goal of a conservation strategy should therefore,
be to ensure that evolution continues and gene pools are maintained.
In the wake of the Convention on Biological Diversity (Rio de Janeiro, Brazil,
1992), intraspecific variation has increasingly been accepted as a focus for conservation,
an approach consistent with the general aim of maintaining the evolutionary potential of
species. Studies on intraspecific variations can contribute to the development of
conservation strategies, by identifying appropriate units for conservation called as
Evolutionary Significant Units (ESU). DNA based markers can provide wealth of
information in this regard since they provide an unbiased comparison of the adaptations
of plants to their environment, its genetic basis and its effect on evolution. For example,
different cpDNA lineages detected in a variety of European species, such as Oak, Beech
and Alder, could represent ESUs (Newton et al, 2000). Similarly cpDNA haplotypes of
silver birch detected by Palme et al (2003) and Japanese beech identified by Okaura and
Harada (2002) could serve as ESU. Assessments of genetic variation are, therefore, of
key importance to the development of effective conservation strategies.
DNA based markers can provide a wealth of information for the study of plant
evolutionary biology. Molecular markers that can be determined without regard to the
phenotype permit an unbiased comparison of the adaptation of organisms to their
environment, its genetic basis and its effect on evolution. Conservation strategies need
the support of a thorough knowledge of population genetics and population ecology
which can be achieved with the use of molecular markers.
24

1.6 Gaultheria fragrantissima: A plant under present study G. fragrantissima Wall. is found from Nepal to Bhutan at altitudes of 1,800m to
2,500m and also in Burma, Ceylon, Khasia hills, Western Ghats, the Nilgiri hills, the
Palni hills and hills of Travancore at altitudes of over 1,500m (Anonymous, 1956). The
classification of G. fragrantissima is given in the box below.
Classification of G. fragrantissima Wall. (Bentham and Hooker)
Division: Phanerogams
Subdivision: Dicotyledons
Class: Angiosperms
Subclass: Gamopetalae
Series: Heteromerae
Cohort: Ericales
Family: Ericaceae
Subfamily: Ericaceae
Tribe: Andromeda
Genus: Gaultheria
Species: fragrantissima
The genus Gaultheria is named by Kalm after Dr Gaulthier, a physician in Quebec and
the species fragrantissima is described by Wallich, 1820.
Vernacular names of G. fragrantissima are as follows: in Lepcha- Kalomba, in Nepali-
Machino, in Tamil- Kolakkaai, in Kannada- Moolai; Gandhapooram and English/
popular name is Wintergreen.
G. fragrantissima is a stout shrub with lanceolate to ovate leaves of 3 × 1-1.5 inch in
size, placed alternately. They are shortly acute or subobtuse at tip and rhomboid at base
with crenate or serrate margins and are gland dotted. Flowers are white or pinkish and
are closely placed in dense, more or less pubescent racemes which are 1-3 inch long.
Anther cells are each with 2 terminal bristles. Fruits are 1/5 inch in diameter, brown,
hairy, surrounded by deep blue succulent calyx (Fig 1.10 and 1.11) (Clarke, 1882).
25

Fig 1.10: Line diagram of G. fragrantissima
Fig 1.11: a) Habitat, b) shrub,
Uses and properties: The fruit of th
important plant where oil extracted fr
a
c) flowers and d) fruits of G. fragr
is plant is known to be edible. It i
om its leaves is popularly known a
26
b
c
s
d
antissima
s a medicinally
"Oil of Indian
Wintergreen". The oil contains methyl salycilate as the chief constituent which is used as
a prescription for rheumatic arthritis, sciatica, neuralgia and is also used in most of the
proprietary balms, liniments or ointments and is also used as a flovouring agent in tooth
pastes (Chopra, 1932). A similar oil is obtained in large quantities from G. procumbens.
Linn., a plant indigenous to the United States of America and from Betula lenta Linn.
(sweet birch). It has also been discovered in many plants of the families Cupuliferae,
Rosaceae, Polygalaceae, Ericaceae and Leguminosae.
1.7 Genesis of thesis and its organization
Although G. fragrantissima is a medicinally important plant, there is hardly any
information available about the genetic variation in this plant species using molecular
markers. I, therefore undertook studies towards molecular analysis of G. fragrantissima
with the following objectives:
1) To study genetic diversity in G. fragrantissima from the two hotspots, using various
molecular marker systems. This would help in understanding the nature of gene flow, the
presence of haplotypes and to assess different theories on migration and evolution.
3) To study the variation in the yield of oil of wintergreen.
Organization of Thesis
I have organized my thesis into five chapters and the contents of each chapter are as
follows:
Chapter 1: Review of literature.
In this chapter, I have discussed the importance of the two hotspots in respect to
their birth, flora and theories of plant migration. The potential of DNA markers in natural
plant population analysis has also been discussed.
Chapter 2: Genetic diversity analysis of G. fragrantissima from the two hotspots
in India using ISSR markers.
This chapter deals with the study of genetic diversity in Gaultheria
fragrantissima using ISSR markers. This study has given an insight into the genetic
structure, gene flow and geographic distribution of G. fragrantissima in the two hotspots
in India.
Chapter 3: Chloroplast and mitochondrial DNA diversity in G. fragrantissima
from the two hotspots in India.
Chloroplast and mitochondrial DNA diversity of Gaultheria fragrantissima is
detailed in this chapter. This study has identified different chloroplast and mitochondrial
27

haplotypes in G. fragrantissima which help in understanding the phylogeography
(geographic distribution of genetic variation) and evolutionary history of the plant.
Chapter 4: Comparative analysis of quantity and quality of oil of Indian
Wintergreen from the two hotspots in India.
Variations in the yield of oil and methyl salicylate content are studied in relation
to the season of collection of leaves and the geographic location of the plants (Western
Ghats and Northeastern Himalayas). Oil yield from individual plants of NE region has
also been studied in this chapter.
Chapter 5: Thesis summary and future prospects
Here, I have very briefly outlined the summary of the results obtained in the
earlier chapters and discussed the usefulness of both the types of markers viz. nuclear as
well as cytoplasmic.
The bibliographic details and my curriculum vitae are given at the end of the thesis
chapters.
28

29
Genetic G. fragran
hIndia us
Part of the contents
as a ful
Chapter 2
diversity analysis of tissima from the two otspots in ing ISSR markers
of this chapter has been submitted
l length paper to Taxon

30

Genetic diversity analysis of G. fragrantissima from the two
hotspots in India using ISSR markers
Contents 2.1 Abstract
2.2 Introduction
2.3 Materials and methods 2.3.1 Study sites and sampling
2.3.2 DNA isolation
2.3.3 Oligonucleotide primers, PCR amplification and electrophoresis
2.3.3a ISSR primers
2.3.3b Polymerase chain reaction (PCR) amplification and
electrophoresis
2.3.4 Statistical analysis
2.4 Results 2.4.1 Information potential of different ISSR primers in diversity analysis in
G. fragrantissima
2.4.2 Genetic differentiation in G. fragrantissima populations and gene flow
2.4.3 AMOVA and cluster analysis
2.5 Discussion 2.5.1 Genetic diversity clustering and gene flow in the populations in
G. fragrantissima
2.5.2 Application of genetic diversity driven conservation strategies in
G. fragrantissima
29

2.1 Abstract
The present study involves use of Inter Simple Sequence Repeat (ISSR) markers
to analyze genetic diversity of an undershrub, Gaultheria fragrantissima, Wall. collected
from seven populations separated by a minimum aerial distance of 14km, from two plant
diversity hotspots in India, namely Western Ghats (WG) and Northeastern Himalayas
(NE). Sixtyfive ISSR genotypes were identified from sixtysix individuals. The percentage
of polymorphic bands (PPB) ranged from 6.98- 37.98 in seven populations. The total
heterozygosity, HT was 0.505 and was higher than the average heterozygosity that ranged
from 0.147- 0.380. AMOVA was performed to partition the variance between the two
hotspot regions, among populations and among individuals within populations. Within
population variance was higher (15.56%) than among population variance (8.31%) as
seen in outcrossing plant species. Mantel’s Test showed a strong positive correlation
between the genetic and geographic distances. This study has thrown light on the genetic
structure, gene flow and geographic distribution of G. fragrantissima in the two hotspots
in India.
30

2.2 Introduction Gaultheria fragrantissima,Wall. is an outcrossing, insect pollinated plant
(chromosome no. n= 22), that grows at the fringes of shola forest or slopes above 1500 m
altitude (Meher-Homji 1975). It occurs only in the two biodiversity hotspots in India viz.
Western Ghats (WG) also known as the Malabar rainforest and the Northeastern
Himalayas (NE). G. fragrantissima forms a group of plant species along with
Rhododendron arboreum, Eurya nitida, Symplocos laurina, Mahonia leschnaultii, etc.
that are common to both WG and NE regions and belongs to the shrub savanna or shola
forest (Meher- Homji, 1972). Various theories as detailed in Chapter 1 (Review of
literature) have been put forth by different researchers to explain the geographical
distribution and migration of plant species between the NE and WG mountain regions. To
verify these theories on migration, it is necessary to study the plant species common to
both the regions at genetic level.
Availability of a variety of DNA markers during the last few decades has enabled
researchers to use them in population genetic studies of forest plants. Most of such studies
have been carried out using allozymes [in Bromus tectorum (Poaceae), Bartlett et al
(2002); in Calystegia collina (Convolvulaceae), Wolf et al (2000); in Pueraria lobata
(Fabaceae), Pappert et al (2000)] and randomly amplified polymorphic DNA (RAPD)
markers [in Senecio vulgaris (Asteraceae), Muller and Fischer (2001); in Digitalis minor
(Scrophulariaceae), Sales et al (2001); in Plathymenia reticulata (Mimosoideae), Lacerda
et al (2001)]. Inter simple sequence repeat (ISSR) markers is one more class of random
DNA markers exhibiting great potential in such studies of natural populations. These
markers amplify the unique sequence between two inversely oriented, closely spaced
simple sequence repeats (SSRs) of the same type, at several loci simultaneously yielding
a multilocus marker system useful for diversity analysis (Zeitkiewicz et al, 1994). They
rely on the ubiquity of SSRs in eukaryotic genome (Langercrantz et al, 1993) and thus
can be targeted towards particular sequences which are reported to be abundant in that
genome and can overcome the technical difficulties of RFLP and RAPD. Additionally, no
prior sequence information for primer synthesis is required. Their utility in analysis of a
number of cultivated species has already been demonstrated and exploited. For example,
in rice, citrus and oil seed rape by Blair et al (1999), Fang and Rose (1997) and Charters
et al (1996), respectively. Our laboratory has also shown earlier the utilily of these
markers in the analysis of various crop plants like rice, wheat and chickpea. For example
31

Joshi et al (2000) studied genetic diversity and phylogenetic relationship in genus Oryza,
Dholakia et al (2001) analyzed the influence of varied agroclimatic conditions on an
important agronomic character like grain protein content in wheat and Rajesh et al (2001)
used them to study genetic relationship among annual and perennial species of Cicer.
These markers can be used in population genetic studies as they can detect very low
levels of genetic variation (Zietkiewcz et al, 1994). According to Wolfe et al, (1998), they
might have the potential for analyzing biogeographic patterns among populations of a
single plant species. They have been used to study genetic diversity in natural populations
of Primula obconica (Nan et al, 2003), Botrychium pumicola (Camacho and Liston,
2001) and to examine patterns of hybridization and hybrid speciation in Penstermons
(Wolfe et al, 1998). In our laboratory, we have demonstrated use of these markers in
studying genetic diversity in natural populations of Eurya nitida (Bahulikar et al, 2004)
and genetic variations in three montane plant species that are common to the two
hotspots, namely WG and NE region (Deshpande et al, 2001). In the present work I have
analyzed 66 plants of G. fragrantissima from WG and NE region using the ISSR markers.
Such efforts are expected to give an insight in assessing different theories on migration
and evolution and are also useful in designing conservation strategies.
2.3 Materials and methods 2.3.1 Study sites and sampling
G. fragrantissima has disjunct distribution in the areas understudy and the
frequency of its occurrence varies from 8- 30% per km2 (BSI record). Depending on its
density more than 50- 90% of the available plants were collected from each population.
The details of sampling are given in Table 2.1. A total of 66 plants from seven
populations representing the WG and NE region were collected. Number of plants per
population ranged from 5 to 16. Among population distance was not less than 10km as
suggested by Nybom and Bartish (2000). In fact, the minimum distance observed among
populations from Naduvattum and Avalanche was about 14km aerial distance while the
maximum distance was 2325km aerial distance in the populations from Munnar and
Shillong peak road. All the seven populations were collected from over an altitude of
1400m (Table 2.1).
32

Table 2.1: Details of sampling of populations of G. fragrantissima
Region Area of
collection
No. of
plan
ts
Latitude Longitude Altitude
(m)
WG Naduvattum 5 11°28’60N 76°52’60E 1952
Avalanche 16 11°22’0N 76°31’00E 2147
Kotagiri road 10 11°25’60N 76°52’60E 1792
Kodaikanal 10 10°13’0N 77°28’60E 1966
Munnar 6 10°5’60N 77°04’00E 1603
NE Cherapunji road 6 25°26’928N
91°49’101E
1485
Shillong peak
road
13 25°34’0N 91°52’60E 1525
Three populations were collected from the Nilgiri hills, namely Naduvattum,
Avalanche and Kotagiri road whereas Kodaikanal and Munnar were represented by one
population each. In the NE hotspot, Cherapunji road and Shillong peak road were the two
populations representing Meghalaya state. The collection tours were planned and
executed with the help of the Botanical Survey of India (BSI). BSI is a government
organization with regional centers all over the country and is engaged in surveying and
documenting the floral wealth in the country. Prior to collection, the herbarium records
were checked for the identification of collection sites. During the actual sampling, it was
noticed that some of the sites identified earlier were cleared of its vegetation for human
settlements or other human activities. As a result even after extensive exploration only
limited number of plants could be sampled.
2.3.2 DNA isolation
On collection, leaf tissue was packed in polythene bags along with wet cotton
swabs to retain moisture and carried to the laboratory at room temperature and then stored
at –80°C until further use. DNA was extracted using the Sarkosyl method as described by
33

Doyle & Doyle (1987), in which 1% β-mercaptoethanol was additionally used in
extraction buffer. As a first step, leaf tissue was ground in liquid nitrogen to a fine
powder, which was quickly transferred to a tube containing 7.5ml of ice–cold extraction
buffer (0.35M sorbitol, 0.1M Tris-HCl, 5mM EDTA, pH 7.5) per gram of ground tissue.
The tube was briefly shaken and 7.5ml nuclei lysis buffer (2M NaCl, 0.2M Tris-HCl,
50mM EDTA, 2% CTAB, pH 7.5) per gram was quickly added, followed by 3ml of 5%
sarkosyl solution per gram. Sample sets were incubated in 65°C water bath for 20min and
were allowed to cool. 18ml of chloroform: isoamyl alcohol (24:1) was added to each tube.
The tubes were centrifuged at 5000g for 15min. Further, the aqueous layer was removed
and given another chloroform:isoamyl alcohol treatment. The aqueous layer was
transferred to a fresh tube and DNA was precipitated with double volume of chilled
ethanol. The DNA pellet was dried, suspended in 500ml TE buffer (10mM Tris-HCl and
1mM EDTA, pH 8.0). DNA was further purified by adding hexadecyl-trimethyl-
ammonium bromide (CTAB) to a final concentration of 1% followed by chloroform
treatment and precipitation. The DNA was quantified spectrophotometrically at 260/ 280
nm and visually by ethidium bromide staining on 0.8% agarose gel and by comparing
them with commercial DNA samples with known concentrations (Sambrook et al, 1989).
2.3.3 Oligonucleotide primers, PCR amplification and electrophoresis
2.3.3a ISSR primers
A set of 100 ISSR primers was procured from University of British Columbia
(UBC), Vancouver, Canada. These primers were 15- to 22-mer and most of them
comprised di-, tri-, tetra- and pentanucleotide repeat motifs of which dinucleotide repeats
were with 3' or 5' anchors. They were used for initial screening with a few individuals.
Primers that generated good patterns with the representative sample group were further
used with all the individuals.
2.3.3b Polymerase chain reaction (PCR) amplification and electrophoresis
Amplification of 20 ng DNA was performed in 10 mM Tris-HCl (pH 8.3), 50 mM
KCl, 1.5 mM MgCl 2, 0.5 mM spermidine, 2% formamide, 0.1 mM dNTPs, 0.3 µM
primer and 0.8 U Taq DNA polymerase (AmpliTaq, Perkin- Elmer, USA) in 20 µl
reaction for 44 cycles, using Gene Amp PCR System 9700 from PE Applied Biosystems
(Perkin- Elmer, USA). After initial denaturation at 94 °C for 5 min, each cycle comprised
1 min denaturation at 94°C, 45 s annealing at 50°C and 1 min extension at 72°C along
with 7 min extension at 72°C at the end of 44 cycles. Amplification products were
34
electrophoresed on 2% agarose gel using 0.5X TAE (0.02M Tris acetate, 5mM EDTA,
pH 8.0) buffer and visualized with ethidium bromide (0.5µg/ml) staining.
2.3.4 Statistical analysis
To avoid bias in parameter estimation, analysis was restricted to those ISSR loci
that fulfilled the 3/N criterion (observed frequencies were less than 1-[3/N]) where N is
the number of plants (Lynch and Milligan, 1994). The percentage of polymorphic bands
(PPB) and the ISSR genotypes were calculated manually. Polymorphism information
content (PIC) scores were calculated on the basis of the formula, PIC =2× pi qi (Botstein
et al, 1980), where pi is the frequency of the present allele and qi is the frequency of the
null allele. Other parameters that were computed included Nei’s (1973 and 1977)
measures of heterozygosity which includes: a) total heterozygosity, HT, (calculated with
Lynch and Milligan (1994) correction for biallelic dominant markers), HT = 2qi(1-
qi)+Var(qi) where qi is the frequency of the null allele at ith locus in a population; Var(qi)
= (1-x)/ 4N, where x = qi2 and N is the total number of plants, b) mean heterozygosity
within a population (Hs), c) diversity among populations (DST = HT-HS) and d) coefficient
of population differentiation (GST = DST / HT). Gene flow (Nm) or the number of migrants
entering a population in each generation was estimated indirectly using Wright (1931)
formula, Nm = (1-FST/4FST), where FST is the standardized variance among populations
and is considered equivalent to GST (Nei, 1977).
To illustrate relatedness among different individuals and among populations, the
presence-absence matrix of ISSR bands was analyzed using cluster analyses based on the
unweighted pair group method with arithmetic mean (UPGMA). Dendrogram was
constructed with the help of the commercial software package WINBOOT (Yap and
Nelson, 1996) using Jaccard coefficient as this coefficient does not incorporate shared
band absence. Similarity index within population was calculated using WINDIST
programme (Yap and Nelson, 1996).
AMOVA (Analyses of Molecular Variance) (Excoffier et al, 1992) was used to
partition the variance between main geographic regions, among populations and among
individuals within populations using program WIN AMOVA 1.55 provided by Excoffier
et al (1992) (www.anthropologie.unige.ch/ftp/ comp).
Distance matrix was employed for PCO (Principal Co-ordinate) analysis, which
was performed with the help of NTSYS-PC programme version 1.8 (Rohlf, 1989). The
35
Mantel’s test (Mantel, 1967) was applied for correlations between the matrix of genetic
diversity and spatial distance.
2.4 Results 2.4.1: Information potential of different ISSR primers in diversity analysis in
G. fragrantissima
A set of 100 ISSR primers (UBC, Canada) was initially used to analyze DNA
samples of G. fragrantissima. From these, 17 ISSR primers including various
dinucleotide motifs with single or double nucleotide anchors on 3' end that were
polymorphic and gave good banding pattern were selected for the complete set of plants.
Three repetitions were carried out with each primer. As seen from Table 2.1, 47 plants of
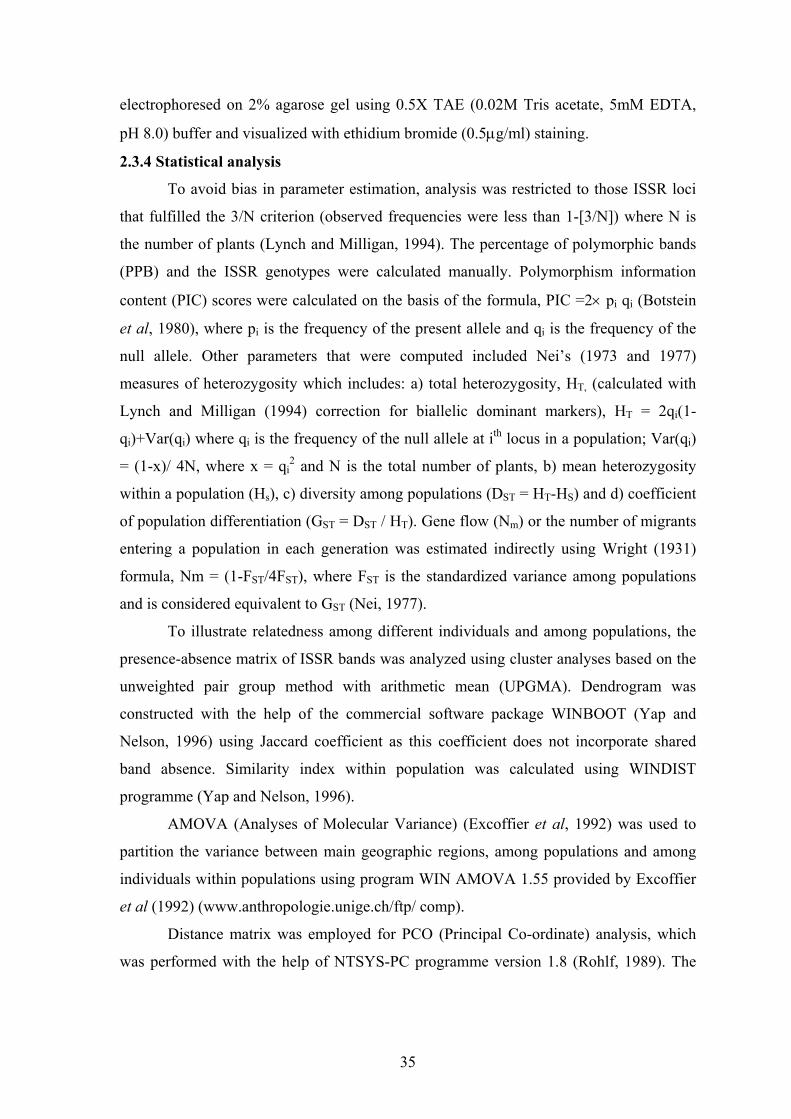
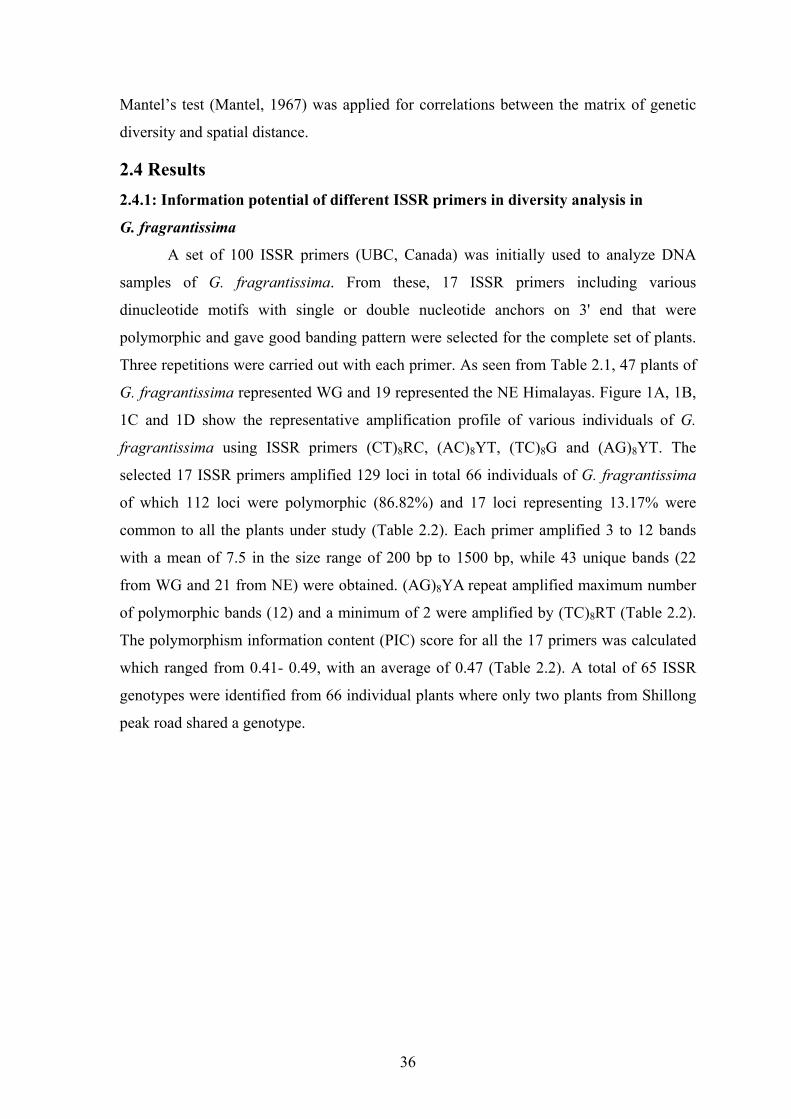
G. fragrantissima represented WG and 19 represented the NE Himalayas. Figure 1A, 1B,
1C and 1D show the representative amplification profile of various individuals of G.
fragrantissima using ISSR primers (CT)8RC, (AC)8YT, (TC)8G and (AG)8YT. The
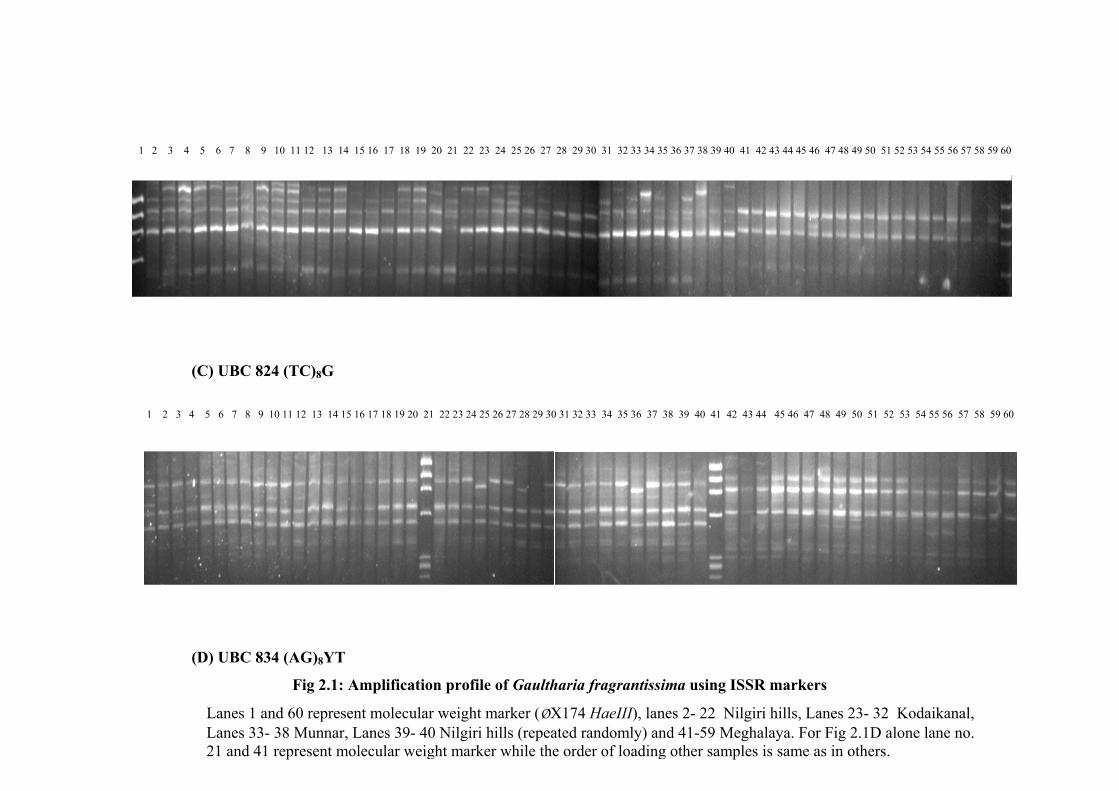
selected 17 ISSR primers amplified 129 loci in total 66 individuals of G. fragrantissima
of which 112 loci were polymorphic (86.82%) and 17 loci representing 13.17% were
common to all the plants under study (Table 2.2). Each primer amplified 3 to 12 bands
with a mean of 7.5 in the size range of 200 bp to 1500 bp, while 43 unique bands (22
from WG and 21 from NE) were obtained. (AG)8YA repeat amplified maximum number
of polymorphic bands (12) and a minimum of 2 were amplified by (TC)8RT (Table 2.2).
The polymorphism information content (PIC) score for all the 17 primers was calculated
which ranged from 0.41- 0.49, with an average of 0.47 (Table 2.2). A total of 65 ISSR
genotypes were identified from 66 individual plants where only two plants from Shillong
peak road shared a genotype.
36

(A) UBC 844 (CT) 8RC
(B) UBC 855 [(AC)8YT]
1 2 3 4 5 6 7 8 9 10 11 12 13 14 15 16 17 18 19 20 21 22 23 24 25 26 27 28 29 30 31 32 33 34 35 36 37 38 39 40 41 42 43 44 45 46 47 48 49 50 51 52 53 54 55 56 57 58 59 60
1 2 3 4 5 6 7 8 9 10 11 12 13 14 15 16 17 18 19 20 21 22 23 24 25 26 27 28 29 30 31 32 33 34 35 36 37 38 39 40 41 42 43 44 45 46 47 48 49 50 51 52 53 54 55 56 57 58 59 60
(B) UBC 855 (AC)8YT
37
1 2 3 4 5 6 7 8 9 10 11 12 13 14 15 16 17 18 19 20 21 22 23 24 25 26 27 28 29 30 31 32 33 34 35 36 37 38 39 40 41 42 43 44 45 46 47 48 49 50 51 52 53 54 55 56 57 58 59 60
(C) UBC 824 (TC)8G
1 2 3 4 5 6 7 8 9 10 11 12 13 14 15 16 17 18 19 20 21 22 23 24 25 26 27 28 29 30 31 32 33 34 35 36 37 38 39 40 41 42 43 44 45 46 47 48 49 50 51 52 53 54 55 56 57 58 59 60
(D) UBC 834 (AG)8YT
Fig 2.1: Amplification profile of Gaultharia fragrantissima using ISSR markers
38
Lanes 1 and 60 represent molecular weight marker (ØX174 HaeIII), lanes 2- 22 Nilgiri hills, Lanes 23- 32 Kodaikanal, Lanes 33- 38 Munnar, Lanes 39- 40 Nilgiri hills (repeated randomly) and 41-59 Meghalaya. For Fig 2.1D alone lane no. 21 and 41 represent molecular weight marker while the order of loading other samples is same as in others.
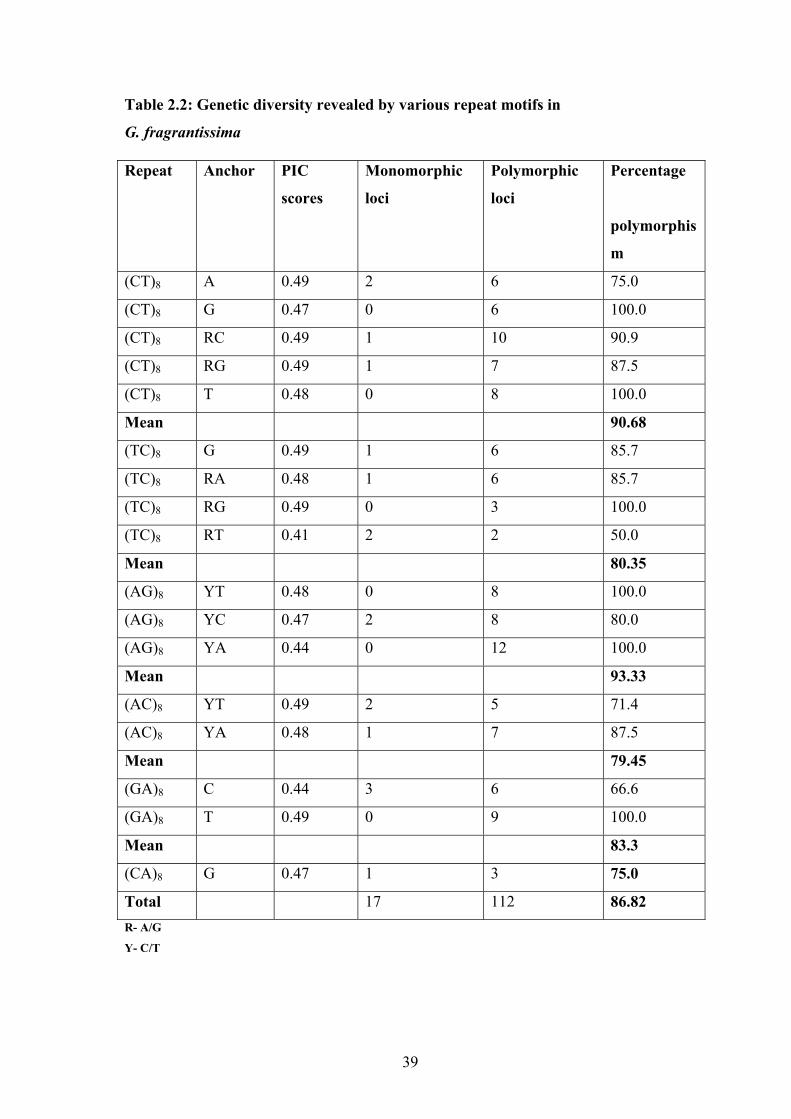
Table 2.2: Genetic diversity revealed by various repeat motifs in
G. fragrantissima
R- A/G
Repeat Anchor PIC
scores
Monomorphic
loci
Polymorphic
loci
Percentage
polymorphis
m
(CT)8 A 0.49 2 6 75.0
(CT)8 G 0.47 0 6 100.0
(CT)8 RC 0.49 1 10 90.9
(CT)8 RG 0.49 1 7 87.5
(CT)8 T 0.48 0 8 100.0
Mean 90.68
(TC)8 G 0.49 1 6 85.7
(TC)8 RA 0.48 1 6 85.7
(TC)8 RG 0.49 0 3 100.0
(TC)8 RT 0.41 2 2 50.0
Mean 80.35
(AG)8 YT 0.48 0 8 100.0
(AG)8 YC 0.47 2 8 80.0
(AG)8 YA 0.44 0 12 100.0
Mean 93.33
(AC)8 YT 0.49 2 5 71.4
(AC)8 YA 0.48 1 7 87.5
Mean 79.45
(GA)8 C 0.44 3 6 66.6
(GA)8 T 0.49 0 9 100.0
Mean 83.3
(CA)8 G 0.47 1 3 75.0
Total 17 112 86.82
Y- C/T
39

2.4.2 Genetic differentiation in G. fragrantissima populations and gene flow
Similarity index within population ranged from a maximum of 0.990 (G f 9A1
and G f 9A3) to a minimum of 0.33 (G f 4J11 and G f 9B6; G f 9B1; G f 9A5) (Table
2.3).The diversity within populations of G. fragrantissima was assessed using various
parameters (Table 2.4). The percentage of polymorphic bands (PPB) for each population
ranged between 6.98- 37.98. Total heterozygosity (HT) was 0.505 while average
heterozygosity (HS) was in the range of 0.147-0.380. The other parameters like average
gene diversity within subpopulations (DST), proportion of genetic diversity (GST) and
gene flow (Nm) were 0.212, 0.419 and 0.346, respectively. Gene flow was also
calculated considering two populations at a time (Table 2.5). It ranged between 0.339 to
0.692 in the five populations from WG and it was 0.143 between the two populations of
NE region. The average gene flow was 0.472 when the aerial distance in km ranged from
14 to 172 whereas it was 0.272 when the aerial distance in km increased from 173 upto
2325.
Table 2.3: Similarity index within different populations G.fragrantissima
Population Maximum Minimum Naduvattum 0.952 (Gf4H4and Gf4C7) 0.882(Gf4C6; Gf4G8 and Gf4A1)
Avalanche 0.947 (Gf4J27 and Gf4J25) 0.794 (Gf4J30 and Gf4J11)
Kotagiri road 0.970 (Gf4M14 and
Gf4M13)
0.873 (Gf4M5 and Gf4M15)
Kodaikanal 0.966 (Gf7E18 and
Gf7E17)
0.83 (Gf7E21and Gf7E13)
Munnar
0.927 (Gf12A7 and Gf
12A3)
0.793 (Gf12A3 and Gf12A1)
Cherapunji
road
0.990 (Gf9A1 and Gf9A3) 0.930 (Gf9A2 and Gf9A6)
Shillong peak 0.989 (Gf9B9and Gf9B11) 0.877(Gf9B7 and Gf9B1)
WG- NE 0.458 (Gf4M11 and
Gf9B5)
0.33 (Gf4J11 and Gf9B6;Gf9B1;
Gf9A5) Gf : Gaultheria fragrantissima, the number after Gf indicates the number given to the location, namely 4 : Nilgiri hills (Naduvattam, Avalanche and Kotagiri road); 7 : Kodaikanal; 9 : Shillong (Cherapunji and Shillong peak road) and 12 :Munnar, the alphabet after the number indicates the name of the respective site followed by the number of the plant.
40

Table 2.4: Various parameters of diversity within populations of
G. fragrantissima
PPB (percentage of polymorphic bands), HT (Total heterozygosity),HS (Average heterozygosity), DST (Average gene diversity), GST (Proportion of genetic diversity), Nm (Gene flow) were calculated as given in Materials and Methods
Naduvattum Avalanche Kotagiri road Kodaikanal Munnar Cherapunji
road
Shillong
peak road
Total
PP 15.50 37.98 24.03 27.91 29.46 6.98 11.63 86.82
HT - - - - - - - 0.505
HS 0.277 0.362 0.305 0.380 0.359 0.147 0.222 -
DST - - - - - - - 0.212
GST - - - - - - - 0.419
Nm - - - - - - - 0.346
Table 2.5: Gene flow calculated among populations considering pairwise
combination
Naduvattam - - - - - - -
Avalanche 0.430 - - - - - -
Kotagiri
road
0.339 0.486 - - - - -
Kodaikanal 0.440 0.692 0.526 - - - -
Munnar 0.425 0.623 0.479 0.681 - - -
Cherapunji
road
0.180 0.253 0.202 0.272 0.250 - -
Shillong
peak road
0.244 0.342 0.272 0.368 0.338 0.143 -
Naduvattum Avalanche Kotagiri
road
Kodaikanal Munnar Cherapunji
road
Shillong
peak road
2.4.3 AMOVA and cluster analysis
The details of AMOVA have been depicted in Table 2.6. A substantial variation
of the order of 76.13% was found between the 2 main distant regions (WG and NE) by
AMOVA. It revealed 15.56 % variance within the individuals when all the 66
41

individuals were considered, which was higher than 8.31 % variance among the seven
populations. Cluster analysis was performed using UPGMA algorithms as well as PCO
approach. Dendrogram drawn using the software WINBOOT (Yap and Nelson, 1996),
showed 2 distinct groups representing NE and WG populations separately with a
similarity of 0.33 between them (Table 2.3). The values at the fork are the bootstrap
values which indicate the robustness of the groups. Within WG the three populations
from Nilgiri hills (Naduvattum, Avalanche and Kotagiri road) formed one group and
those from Kodaikanal and Munnar formed the second group though individuals from
Kodaikanal formed a closer group than the Munnar group. There were only a few
exceptions where Gf12A1 and Gf12A3 from Munnar was placed in Kodaikanal group
and Gf4J30 from Avalanche grouped more closely with Kodaikanal and Munnar group
(Fig 2.2). PCO analysis revealed the same distribution pattern of the population shown
by the dendrogram and confirmed the groups (Fig 2.3). The Mantel’s correlogram
calculated for genetic distance and geographic distance for G. fragrantissima revealed a
strong positive correlation between them (r = 0.938, P<0.001) when all the individuals
were considered together while within WG it was r = 0.6, P <0.001 and within NE it
was r = 0.4, P <0.001.
Table 2.6: Analysis of molecular variance (AMOVA) for the 66 individuals sampled
from 7 populations of G. fragrantissima
Source of variation d.f SSD MSD VC %total
variance
P-value
Among regions (WG and
NE)
1 810.24 810.24 28.47 76.13 < 0.001
Among populations 5 166.60 33.32 3.11 8.31 < 0.001
Within population 59 343.38 5.82 5.82 15.56 < 0.001
d.f. (degree of freedom), SSD (sum of squared deviation), MSD (mean squared deviation), VC (variance component), % Total variance (percentage of total variance contributed by each component), P- value (probability of obtaining a more extreme component estimate by chance alone) as calculated using program WIN AMOVA 1.55 provided by Excoffier et al (1992) (http://anthropologie.unige.ch/ftp/ comp).
42

Western Ghats
Munnar
Figure 2.2: UPGMA phenogram of G. fragrantissima population from WG aregions in India
43
Northeastern
Himalaya
MeghalayaKodaikanal
Nilgiri
nd NE
Gf : Gaultheria fragrantissima, the number after Gf indicates the number given to the location, namely 4: Nilgiri hills(Naduvattum, Avalanche, Kotagiri road ); 7 : Kodaikanal; 12 : Munnar: (populations from Western Ghats) and 9: Meghalaya (Shillong peak, Cherapunji road): (populations from Northeastern Himalaya), the alphabet after the numberindicates the name of the site in the respective location followed by the number of the plant.

Fig 2.3 Representation of PCO analysis for populations of G. fragrantissima
■- Nilgiri hills, ▲- Kodaikanal, •- Munnar, ♦- Meghalaya
2.5 Discussion 2.5.1 Genetic diversity, clustering and gene flow in populations of
G. fragrantissima
The 17 ISSR primers used in the present study gave an average PIC score of 0.47
which is higher as compared to the previously reported PIC scores for dominant
markers where an average value of 0.32 and 0.31 for RAPD markers was reported by Li
and Nelson (2001) and Rana and Bhat (2004), respectively. According to Li and Nelson
(2001) ISSR markers being dominant in nature the highest PIC score of 0.5 can be
obtained. Thus the markers used in the present study are useful for surveying the genetic
diversity in G. fragrantissima populations as higher is the PIC score of a marker, higher
is the probability that it will obtain polymorphism (Rana and Bhat, 2004). Furthermore,
the maximum number of genotypes obtained within each population was equal to the
number of individuals in the same population. Thus, the genotypic diversity (number of
genotypes/ number of individuals) (Wolfe and Randle, 2001) for each population was
1.0, except for Shillong peak road population where it was 0.92 as two individuals
shared a genotype. The total heterozygosity was observed to be 0.505 in G.
44
fragrantissima which was higher as compared to those reported earlier (0.238 in S.
laurina , Deshpande et al, 2001 and 0.290 in Pueraria lobata , Pappert et al, 2000).This
suggests that there is high genetic variation within G. fragrantissima though the plants
from WG and NE regions do not show any distinct morphological variation (personal
observation). However, in case of individual populations, the average heterozygosity
(HS) values for NE region populations were low as compared to HS of WG (Table 2.4).
According to Frankel et al (1995), higher the heterozygosity better is the fitness of
populations, whereas lower the heterozygosity less is the population viability. Thus the
populations from NE region are more homogenous as compared to the populations from
WG.
This was also revealed by cluster analysis (Fig 2.2). The dendrogram clustered
the individuals of G. fragrantissima in distinct groups according to their geographical
regions. Two major clusters were formed, each grouping individuals from WG and NE
regions, respectively. Plants from WG showed genetic similarity in the range of 0.794 to
0.970 while those from NE showed a narrow range between 0.877-0.990 (Table 2.3).
The narrow range of similarity index values seen in NE as compared to WG was in
accordance with the low average heterozygosity values (Table 2.4) in NE plants.
Furthermore, plants from WG grouped according to their specific geographic location
with only a few exceptions as detailed in the results. The PCO analysis (Fig 2.3) showed
similar clustering as that in the dendrogram supporting the grouping of individuals.
Significant positive correlations between genetic and geographic distances using
Mantel's Test (r = 0.938, P <0.001) also supported the dendrogram and PCO analysis.
The GST value (Table 2.4) of G. fragrantissima was higher as compared with
studies by Loveless and Hamrick (1984), Hamrick and Godt (1989) and Heywood
(1991). High GST value indicates differentiation among the populations of G.
fragrantissima. This was supported by the low gene flow (Nm = 0.346) among the
populations indicating effective migration of only one migrant in more than two
generations. Theoretically, gene flow of more than four migrants per generation (Nm >
4) among populations is sufficient to prevent genetic drift causing local genetic
differentiation and therefore, population divergence. Thus the low gene flow might lead
to genetic drift in G. fragrantissima. Furthermore, the gene flow calculated by
considering two populations at a time (Table 2.5) revealed higher gene flow with less
aerial distance and lower gene flow with high aerial distance. The only exception was
45

for the two populations from NE region where the gene flow was 0.143 although the
aerial distance in km was 51. This might suggest that the mechanism of seed dispersal
and pollination is better in WG as compared to that in NE region. Thus the WG
populations have a better chance to avoid local adaptations than NE populations because
of better gene flow in WG.
AMOVA revealed high variation among individuals within populations (15.56 %,
P < 0.001) whereas the variation among populations within the two regions was 8.31 %,
P < 0.001 (Table 2.6). According to Hamrick and Godt (1989), outcrossing species tend
to have 10-20% of the genetic variation among populations while selfing species present
on an average 50% of this variation among populations. Here, among population
variance was low as compared to that with other reported values (13% in Grevillea
scapigera, Rossetto et al, 1995 and 12% in Cordia alliodora a highly outcrossing
species, Chase et al, 1995).
The present study has revealed the status of genetic diversity present in G.
fragrantissima especially from the two hotspots in India which was previously not
studied. Low gene flow, high among population differentiation and clustering of
individuals according to their geographic location indicate the need to plan aggressive
conservation strategies which should aim at preservation of genotypes from maximum
number of populations from the two hotspots covering the entire genetic diversity
available in G. fragrantissima.
46

47
Chloroplast
diversity in G
two h
Part of the contents
as a full leng
Chapter 3
and mitochondrial DNA
. fragrantissima from the
otspots in India
of this chapter has been submitted
th paper to Annals of Botany

48

Chloroplast and mitochondrial DNA diversity in G.fragrantissima from the two hotspots in India
Contents 3.1 Abstract
3.2 Introduction
3.3 Materials and methods 3.3.1 Plant material
3.3.2 DNA isolation, PCR amplification and restriction digestion
3.3.3 Data analysis
3.4 Results 3.4.1 Screening of cpDNA and mtDNA markers for their utility
3.4.2 Haplotypes based on cpDNA analysis
3.4.3 Haplotypes based on mtDNA analysis
3.4.4 Ratio of pollen/seed flow
3.5 Discussion 3.5.1 Distribution of cpDNA haplotypes
3.5.2 Distribution of mtDNA haplotypes
3.5.3 Correlation between cp and mtDNA haplotypes
3.5.4 Contribution of pollen and seed flow to the total gene flow
47

3.1 Abstract Universal primers reported from chloroplast (cp) and mitochondrial (mt) DNA for
intergenic amplification followed by restriction enzyme digestion is a marker system
being used to study diversity in natural populations. The cp and mtDNA diversity in G.
fragrantissima in the present study was also analyzed using PCR- RFLP technique. Nine
cpDNA and seven mtDNA haplotypes were detected in eight populations. None of the
cpDNA haplotypes was shared by all the eight populations. Unlike cpDNA, one mtDNA
haplotype was shared by all the populations and was the most common haplotype with a
frequency of 0.618. Other three mtDNA haplotypes were common to both the hotspots
while three were unique to WG and one to NE region. CpDNA diversity (hT= 0.639) was
higher as compared to mtDNA diversity (hT= 0.582) among the populations. However,
within population diversity was higher in mtDNA (hS= 0.467) than in cpDNA (hS=
0.224). The level of population subdivision for unordered and ordered alleles was much
higher in cpDNA (GST= 0.615; NST= 0.866) as compared to mtDNA (GST= 0.197; NST=
0.252). Also higher value of NST than GST in cpDNA was observed which suggests
phylogeographical organisation of the populations.
48

3.2 Introduction Chloroplast (cp) and mitochondrial (mt) DNA are nonrecombinant (no
recombination occurs and is essentially inherited as a single gene.), homoplasmic (copies
of their DNA within an individual are identical) and highly conserved molecules (Ouborg
et al, 1999). However, mtDNA shows intramolecular recombinations occasionally, due to
the long hairpin like secondary structure (Dumolin- Lapegue, 1998). In angiosperms both
chloroplast (cp) and mitochondrial (mt) DNA show maternal inheritance in most species
(Rebound and Zeyl, 1994). As a consequence, the two organellar genomes are expected to
remain associated, that is, they should behave as if they are completely linked (Schnabel
and Asmussen, 1989) and to give similar information on dispersal and gene flow by
seeds. However, there are reports where cpDNA is biparentally inherited or shows
'paternal leakage' in plants (Rebound and Zeyl 1994). There are a few reports where some
mitochondria from the male parent seem to reach the egg (Chapmann, 1986) and
therefore show paternal leakage. Petit et al (1993) have shown that paternal transmission
rate as low as 1% in cytoplasmic genomes can have a significant effect on their genetic
structures, especially when there is an asymmetry between pollen and seed flow.
According to Birky (1978) if there are very low levels of paternal gene transmission and
recombination, these must be measured, for they may become important over
evolutionary time scale even though they are negligible when one looks at the results of a
single mating. Furthermore, chloroplast DNA evolves four times slowly than nuclear
genome and mitochondrial DNA evolves three times slowly than cpDNA (Wolfe et al,
1987).
Availability of universal intergenic cp and mtDNA markers (Taberlet et al 1991,
Demesure et al 1995 and Dumolin- Lapague et al 1997) and use of the PCR-RFLP (or
CAPS- Cleaved Amplified Polymorphic Sequence) technique have helped researchers to
study the intraspecific variation in various plant species. It is a sensitive technique where,
a noncoding region between two genes in cp/ mt DNA is amplified with available
universal primers followed by restriction digestion of the resultant amplicon. King and
Ferris (1998) used this technique to study cpDNA pylogeography of Alnus glutinosa.
Fineschi et al (2000) studied cpDNA polymorphism in Castanea sativa and revealed that
there was little geographical structure throughout European countries. Mohanty et al
(2003) studied cp and mtDNA haplotypes in Prunus spinosa and showed association
49
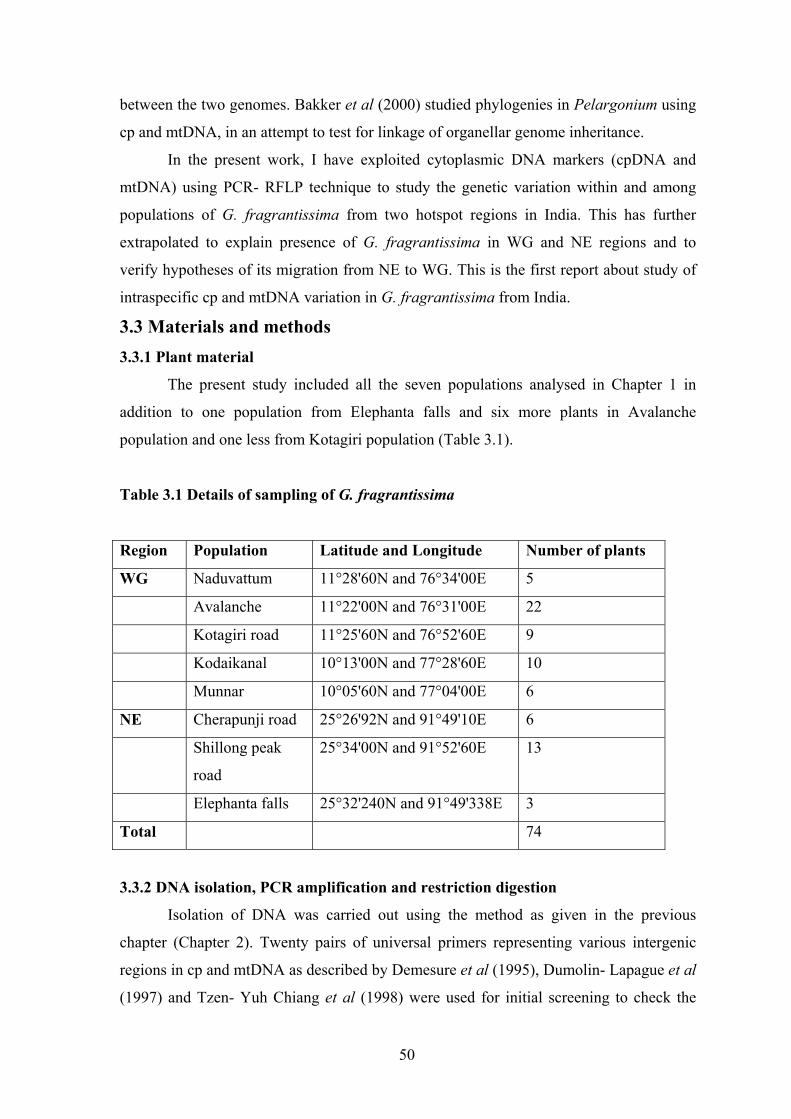
between the two genomes. Bakker et al (2000) studied phylogenies in Pelargonium using
cp and mtDNA, in an attempt to test for linkage of organellar genome inheritance.
In the present work, I have exploited cytoplasmic DNA markers (cpDNA and
mtDNA) using PCR- RFLP technique to study the genetic variation within and among
populations of G. fragrantissima from two hotspot regions in India. This has further
extrapolated to explain presence of G. fragrantissima in WG and NE regions and to
verify hypotheses of its migration from NE to WG. This is the first report about study of
intraspecific cp and mtDNA variation in G. fragrantissima from India.
3.3 Materials and methods 3.3.1 Plant material
The present study included all the seven populations analysed in Chapter 1 in
addition to one population from Elephanta falls and six more plants in Avalanche
population and one less from Kotagiri population (Table 3.1).
Table 3.1 Details of sampling of G. fragrantissima
Region Population Latitude and Longitude Number of plants
WG Naduvattum 11°28'60N and 76°34'00E 5
Avalanche 11°22'00N and 76°31'00E 22
Kotagiri road 11°25'60N and 76°52'60E 9
Kodaikanal 10°13'00N and 77°28'60E 10
Munnar 10°05'60N and 77°04'00E 6
NE Cherapunji road 25°26'92N and 91°49'10E 6
Shillong peak
road
25°34'00N and 91°52'60E 13
Elephanta falls 25°32'240N and 91°49'338E 3
Total 74
3.3.2 DNA isolation, PCR amplification and restriction digestion
Isolation of DNA was carried out using the method as given in the previous
chapter (Chapter 2). Twenty pairs of universal primers representing various intergenic
regions in cp and mtDNA as described by Demesure et al (1995), Dumolin- Lapague et al
(1997) and Tzen- Yuh Chiang et al (1998) were used for initial screening to check the
50
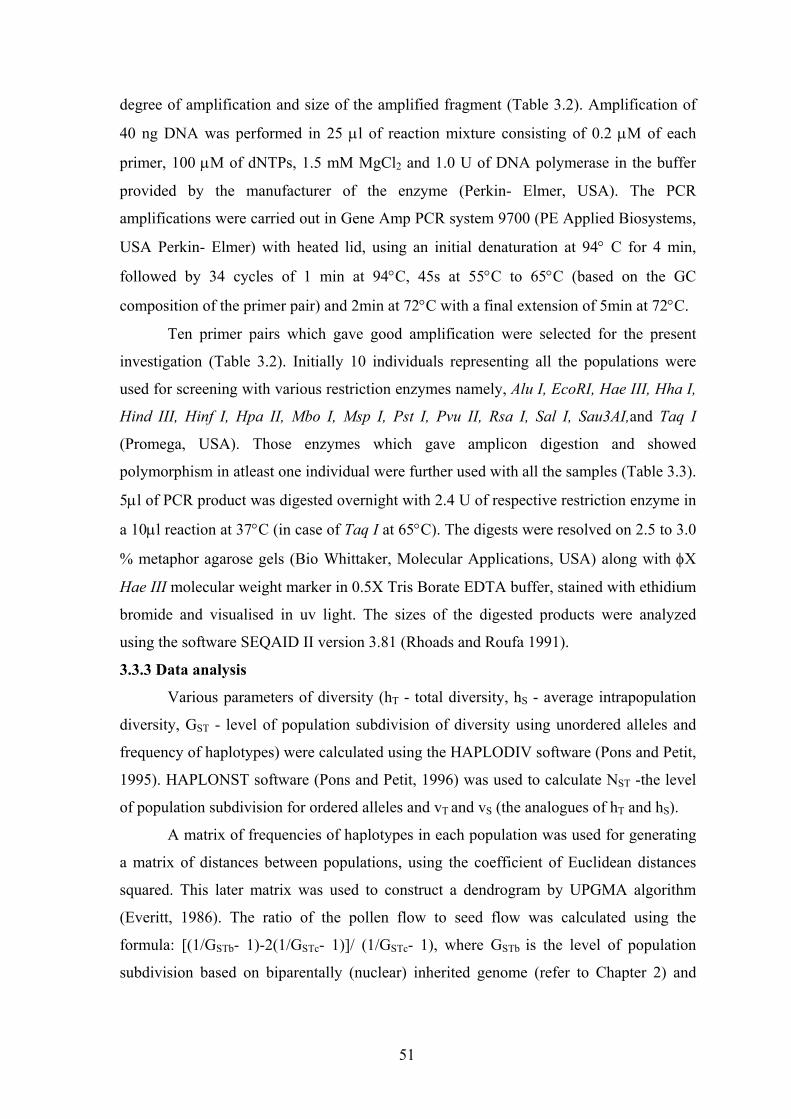
degree of amplification and size of the amplified fragment (Table 3.2). Amplification of
40 ng DNA was performed in 25 µl of reaction mixture consisting of 0.2 µM of each
primer, 100 µM of dNTPs, 1.5 mM MgCl2 and 1.0 U of DNA polymerase in the buffer
provided by the manufacturer of the enzyme (Perkin- Elmer, USA). The PCR
amplifications were carried out in Gene Amp PCR system 9700 (PE Applied Biosystems,
USA Perkin- Elmer) with heated lid, using an initial denaturation at 94° C for 4 min,
followed by 34 cycles of 1 min at 94°C, 45s at 55°C to 65°C (based on the GC
composition of the primer pair) and 2min at 72°C with a final extension of 5min at 72°C.
Ten primer pairs which gave good amplification were selected for the present
investigation (Table 3.2). Initially 10 individuals representing all the populations were
used for screening with various restriction enzymes namely, Alu I, EcoRI, Hae III, Hha I,
Hind III, Hinf I, Hpa II, Mbo I, Msp I, Pst I, Pvu II, Rsa I, Sal I, Sau3AI,and Taq I
(Promega, USA). Those enzymes which gave amplicon digestion and showed
polymorphism in atleast one individual were further used with all the samples (Table 3.3).
5µl of PCR product was digested overnight with 2.4 U of respective restriction enzyme in
a 10µl reaction at 37°C (in case of Taq I at 65°C). The digests were resolved on 2.5 to 3.0
% metaphor agarose gels (Bio Whittaker, Molecular Applications, USA) along with φX
Hae III molecular weight marker in 0.5X Tris Borate EDTA buffer, stained with ethidium
bromide and visualised in uv light. The sizes of the digested products were analyzed
using the software SEQAID II version 3.81 (Rhoads and Roufa 1991).
3.3.3 Data analysis
Various parameters of diversity (hT - total diversity, hS - average intrapopulation
diversity, GST - level of population subdivision of diversity using unordered alleles and
frequency of haplotypes) were calculated using the HAPLODIV software (Pons and Petit,
1995). HAPLONST software (Pons and Petit, 1996) was used to calculate NST -the level
of population subdivision for ordered alleles and vT and vS (the analogues of hT and hS).
A matrix of frequencies of haplotypes in each population was used for generating
a matrix of distances between populations, using the coefficient of Euclidean distances
squared. This later matrix was used to construct a dendrogram by UPGMA algorithm
(Everitt, 1986). The ratio of the pollen flow to seed flow was calculated using the
formula: [(1/GSTb- 1)-2(1/GSTc- 1)]/ (1/GSTc- 1), where GSTb is the level of population
subdivision based on biparentally (nuclear) inherited genome (refer to Chapter 2) and
51
GSTc is the level of population subdivision for cytoplasmically inherited genome (cp/
mtDNA) using unordered alleles (King and Ferris, 1998).
3.4 Results 3.4.1 Screening of cpDNA and mtDNA markers for their utility
Twenty pairs of universal primers of cpDNA and mtDNA were initially screened
to assess the degree of amplification and suitability of amplicons for restriction enzyme
digestion (Table 3.2). Based on the quality of amplification, ten pairs of primers, five
from cpDNA and five from mtDNA were selected for the present study. The amplified
fragments were digested with various tetra- and hexa- cutting restriction enzymes as
detailed in materials and methods and only those combinations which gave polymorphic
restriction patterns were used for the analysis. Thus, finally for the complete study seven
(four from cpDNA and three from mtDNA) polymorphic patterns representing five pairs
of primers and eight populations from the 2 hotspots in India including 74 individuals
were considered (Table 3.3). The size range of polymorphic fragments was between 88
bp to 1431bp. Figure 3.1 shows the size range of various amplicons amplified using the
specific cp and mtDNA primer pairs, namely: trnC- trnD, psbC- trnS, trnS-trnT, nad1B-
nad1C and nad4/1- nad4/2 and used for further restriction enzyme digestion in the present
study. Figures 3.2, 3.3 and 3.4 show the restriction patterns in G. fragrantissima using the
primer pairs trnS- trnT with Hinf I and nad1B- nad1C with Taq I and Alu I, respectively.
52

Table 3.2: Details of primers used for initial screening
Primer pair Genome type Degree of
amplification
Polymorphic
status
trnC- trnD 5'CCAGTTCAAATCTGGGTGTC3'
3'GGGATTGTAGTTCAATTGGT5'
chloroplast ++ polymorphic
psbC- trnS 5'GGTCGTGACCAAGAAACCAC3'
3'GGTTCGAATCCCTCTCTCTC5'
chloroplast ++ polymorphic
trnD- trnT 5'ACCAATTGAACTACAATCCC3'
3'CTACCACTGAGTTAAAAGGG5'
chloroplast NA -
trnS- trnfM 5'GAGAGAGAGGGATTCGAACC3'
3'CATAACCTTGAGGTCACGGG5'
chloroplast ++ monomorphic
psaA- trnS 5'ACTTCTGGTTCCGGCGAACGAA3'
3'AACCACTCGGCCATCTCTCCTA5'
chloroplast More than one
band
-
trnS- trnT 5'CGAGGGTTCGAATCCCTCTC3'
3'AGAGCATCGCATTTGTAATG5'
chloroplast ++ polymorphic
trnM- rbcL 5'TGCTTTCATACGGCGGGAGT3'
3'GCTTTAGTCTCTGTTTGTGG5'
chloroplast + -
trnQ- trnCr 5'GGGACGGAAGGATTCGAACC3'
3'CGACACCCRGATTTGAACTGG5'
chloroplast More than one
band
-
trnRr- rpoC1 5'ATTGCGTCCAATAGGATTTGAA3'
3'GCACAAATTCCRCTTTTTATRGG5'
chloroplast NA -
atpB- rbcL 5'ACATCKARTACKGGACCAATAA3'
3'AACACCAGCTTTRAATCCAA5'
chloroplast ++ monomorphic
nad 1B- nad 1C 5'GCATTACGATCTGCAGCTCA3'
3'GGAGCTCGATTAGTTTCTGC5'
mitochondria ++ polymorphic
53 Contd.
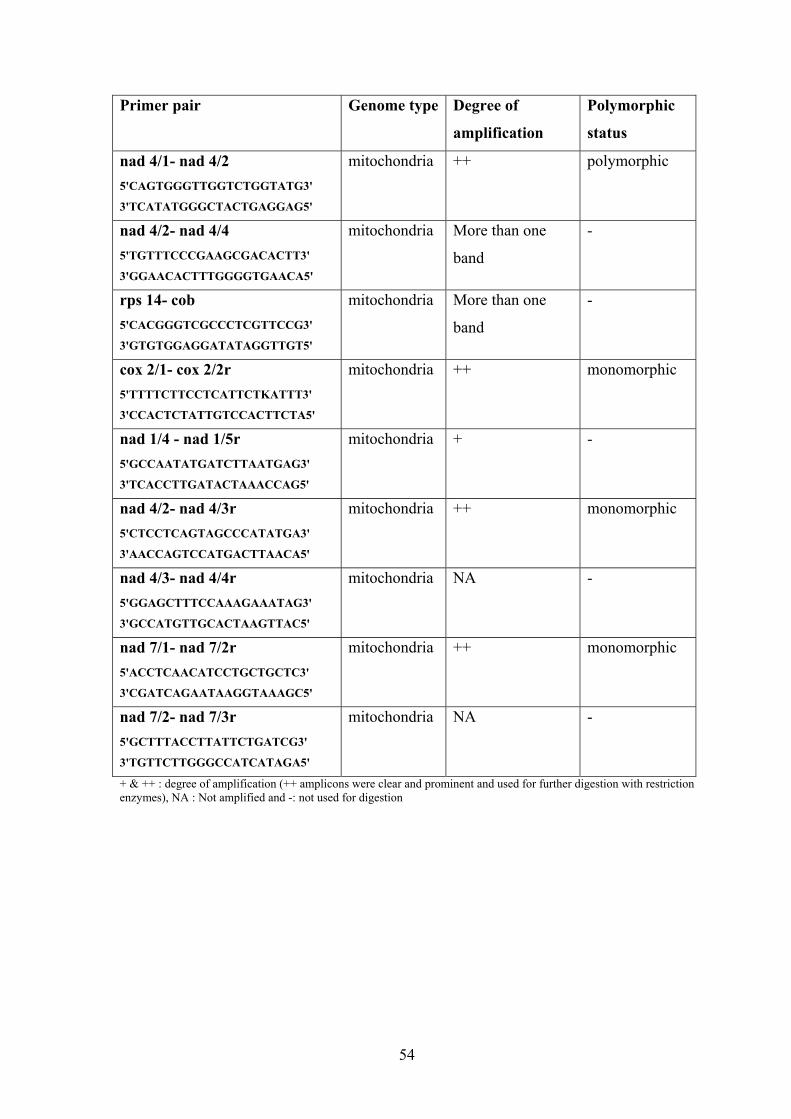
Primer pair Genome type Degree of
amplification
Polymorphic
status
nad 4/1- nad 4/2 5'CAGTGGGTTGGTCTGGTATG3'
3'TCATATGGGCTACTGAGGAG5'
mitochondria ++ polymorphic
nad 4/2- nad 4/4 5'TGTTTCCCGAAGCGACACTT3'
3'GGAACACTTTGGGGTGAACA5'
mitochondria More than one
band
-
rps 14- cob 5'CACGGGTCGCCCTCGTTCCG3'
3'GTGTGGAGGATATAGGTTGT5'
mitochondria More than one
band
-
cox 2/1- cox 2/2r 5'TTTTCTTCCTCATTCTKATTT3'
3'CCACTCTATTGTCCACTTCTA5'
mitochondria ++ monomorphic
nad 1/4 - nad 1/5r 5'GCCAATATGATCTTAATGAG3'
3'TCACCTTGATACTAAACCAG5'
mitochondria + -
nad 4/2- nad 4/3r 5'CTCCTCAGTAGCCCATATGA3'
3'AACCAGTCCATGACTTAACA5'
mitochondria ++ monomorphic
nad 4/3- nad 4/4r 5'GGAGCTTTCCAAAGAAATAG3'
3'GCCATGTTGCACTAAGTTAC5'
mitochondria NA -
nad 7/1- nad 7/2r 5'ACCTCAACATCCTGCTGCTC3'
3'CGATCAGAATAAGGTAAAGC5'
mitochondria ++ monomorphic
nad 7/2- nad 7/3r 5'GCTTTACCTTATTCTGATCG3'
3'TGTTCTTGGGCCATCATAGA5'
mitochondria NA -
+ & ++ : degree of amplification (++ amplicons were clear and prominent and used for further digestion with restriction enzymes), NA : Not amplified and -: not used for digestion
54

Table 3.3: Details of primers, amplification conditions, size of amplified product and
restriction enzymes used in the present study
Genome Primer pair Annealing
temperature
Size (kb) Restriction enzyme
cpDNA trnC- trnD 63° C 3.8 Sau3A I and EcoR I
psbC- trnS 64° C 1.6 TaqI
trnS- trnT 65° C 1.4 Hinf I
mtDNA nad 1B- nad 1C 55° C 1.5 Alu I and Taq I
nad 4/1- nad 4/2 65° C 2.2 EcoR I
2500bp
1500bp
1000bp
5000bp
M 2 3 4 5 6
Fig 3.1: Size range of various amplicons
Lane 1(M): marker (500bp ladder, Biogenei, Bangalore), lane 2- 6: primer pairs used trnC- trnD (3.8kb), psbC- trnS (1.6kb), trnS-trnT (1.4kb), nad1B- nad1C (1.5kb) and nad4/1- nad4/2 (2.2kb), respectively.
55

1 2 3 4 5 6 7 8 9 10 11 12 13 14 15 16 17 18 19 20 21 22 23 24 25 26 27 28 29
Fig3.2a
30 31 32 33 34 35 36 37 38 39 40 41 42 43 44 45 46 47 48 49 50 51 52 53 54 55 56 57 58
Fig 3.2b
59 60 61 62 63 64 65 66 67 68 69 70 71 72 73 74 75 76
Fig 3.2 c Fig 3.2: Representative restriction pattern in G. fragrantissima using primer pair trnS- trnT and Hinf I restriction enzyme. Arrow shows the polymorphic band. Lanes 1, 21, 30, 51, 59 and 76 represent molecular marker (ØX174/ HaeIII). Further order of loading is as follows: Nilgiri hills (36 samples), Kodaikanal (10 samples), Munnar (6 samples), Megahalaya (16 samples) and lanes 20 and 75 loaded randomly with samples from Kodaikanal.
56

1 2 3 4 5 6 7 8 9 10 11 12 13 14 15 16 17 18 19 20 21 22 23 24 25 26 27 28 29
Fig 3.3a
30 31 32 33 34 35 36 37 38 39 40 41 42 43 44 45 46 47 48 49 50 51 52 53 54 55 56 57 58
Fig 3.3b
59 60 61 62 63 64 65 66 67 68 69 70 71 72 73 74 75 76 77 78 79 80 81
Fig 3.3c
Fig 3.3: Representative restriction pattern in G. fragrantissima using primer pair nad1B- nad1C and Alu I restriction enzyme. Arrow shows the polymorphic band. Lanes 1, 21, 30, 51, 59 and 82 represent molecular marker (ØX174/ HaeIII). Further order of loading is as follows: Nilgiri hills (36 samples), Kodaikanal (10 samples), Munnar (6 samples), Megahalaya (21 samples) and lanes 20 and 82 loaded randomly with samples from Kodaikanal.
57
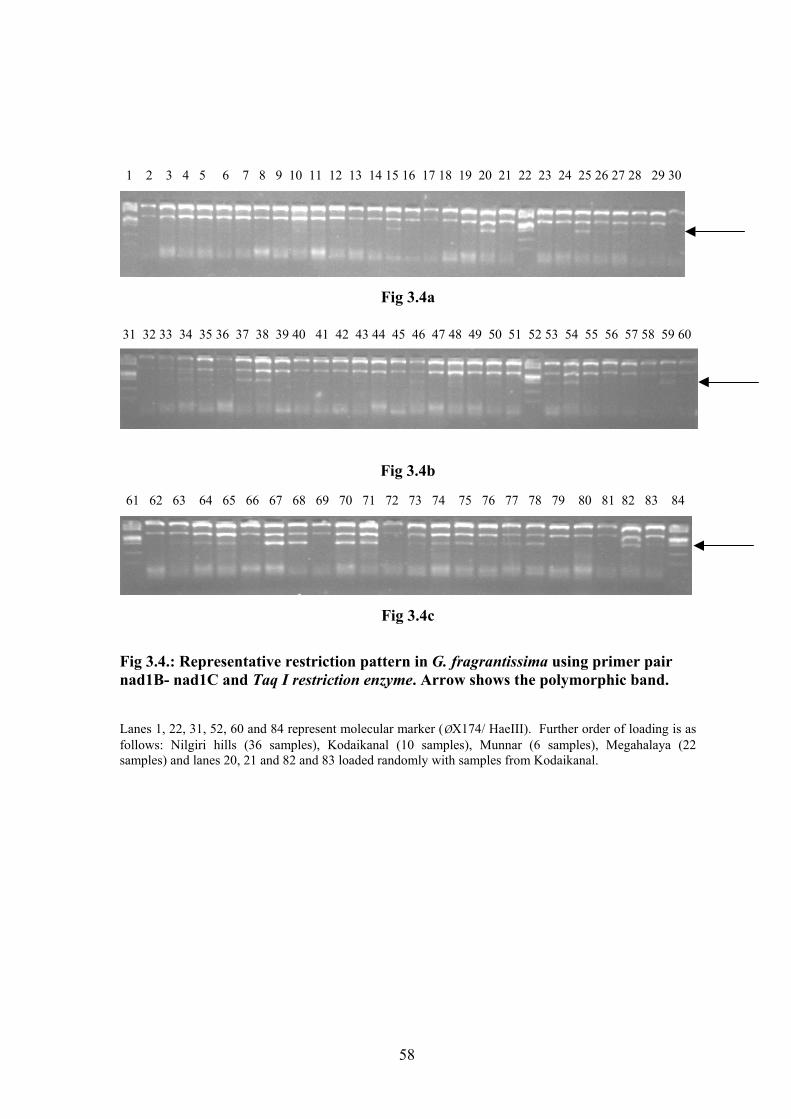
1 2 3 4 5 6 7 8 9 10 11 12 13 14 15 16 17 18 19 20 21 22 23 24 25 26 27 28 29 30
Fig 3.4a
31 32 33 34 35 36 37 38 39 40 41 42 43 44 45 46 47 48 49 50 51 52 53 54 55 56 57 58 59 60
Fig 3.4b
61 62 63 64 65 66 67 68 69 70 71 72 73 74 75 76 77 78 79 80 81 82 83 84
Fig 3.4c
Fig 3.4.: Representative restriction pattern in G. fragrantissima using primer pair nad1B- nad1C and Taq I restriction enzyme. Arrow shows the polymorphic band. Lanes 1, 22, 31, 52, 60 and 84 represent molecular marker (ØX174/ HaeIII). Further order of loading is as follows: Nilgiri hills (36 samples), Kodaikanal (10 samples), Munnar (6 samples), Megahalaya (22 samples) and lanes 20, 21 and 82 and 83 loaded randomly with samples from Kodaikanal.
58

3.4.2 Haplotypes based on cpDNA analysis
Nine haplotypes (CH1 through CH9) based on cpDNA were represented by the
eight populations of G. fragrantissima under present study. Among these, four
populations (Avalanche, Munnar, Cherapunji road and Shillong peak road) revealed more
than one haplotype, four populations (Naduvattum, Kotagiri road, Kodaikanal and
Elephanta falls) depicted only one haplotype while four populations (Avalanche, Munnar,
Cherapunji road and Shillong peak road) showed unique haplotypes within cpDNA
(Table 3.4). No haplotype was shared by all the populations. Both the regions represented
unique haplotypes with maximum of three unique haplotypes within one population of
Shillong peak road from NE region. CH1 showed maximum frequency of 0.566 while
CH5 showed minimum frequency of 0.009 (Table 3.4). Haplotype CH4 with a frequency
of 0.285 was common to the NE region and CH1 was common to WG. CH2 was unique
to Avalanche population while CH3 and CH9 were unique to Munnar population (both
the populations represent WG). CH5, CH6 and CH7 were unique to Shillong peak road
population and CH8 was unique to Cherapunji road population (both the populations
represent NE) (Table 3.4). The genetic diversity parameters based on cpDNA profiles
were determined using HAPLODIV and HAPLONST software programme (Pons and
Petit 1995 and 1996). Total diversity (hT) was observed to be 0.648, average diversity (hS)
was 0.249, and their analogues vT and vS were 0.668 and 0.089, respectively. The level of
population subdivision of diversity using unordered alleles (GST) and using ordered
alleles (NST) was 0.615 and 0.866, respectively (Table 3.6).
In case of cpDNA, the dendrogram drawn using UPGMA algorithm considering
frequencies of individual haplotypes in each population is represented in Fig. 3.5.
Interestingly it shows clustering according to their geographic locations, WG populations
form one group while the NE populations form the other group. In WG cluster
Naduvattum, Kotagiri road and Kodaikanal populations form a close cluster with no
dissimilarity. Population from Avalanche joins this cluster at 0.19 dissimilarity while
Munnar population joins this cluster at 0.41 dissimilarity. In NE region, the Cherapunji
road and Elephanta falls populations join at 0.44 dissimilarity which in turn is joined by
Shillong peak road population at 0.73 dissimilarity.
59
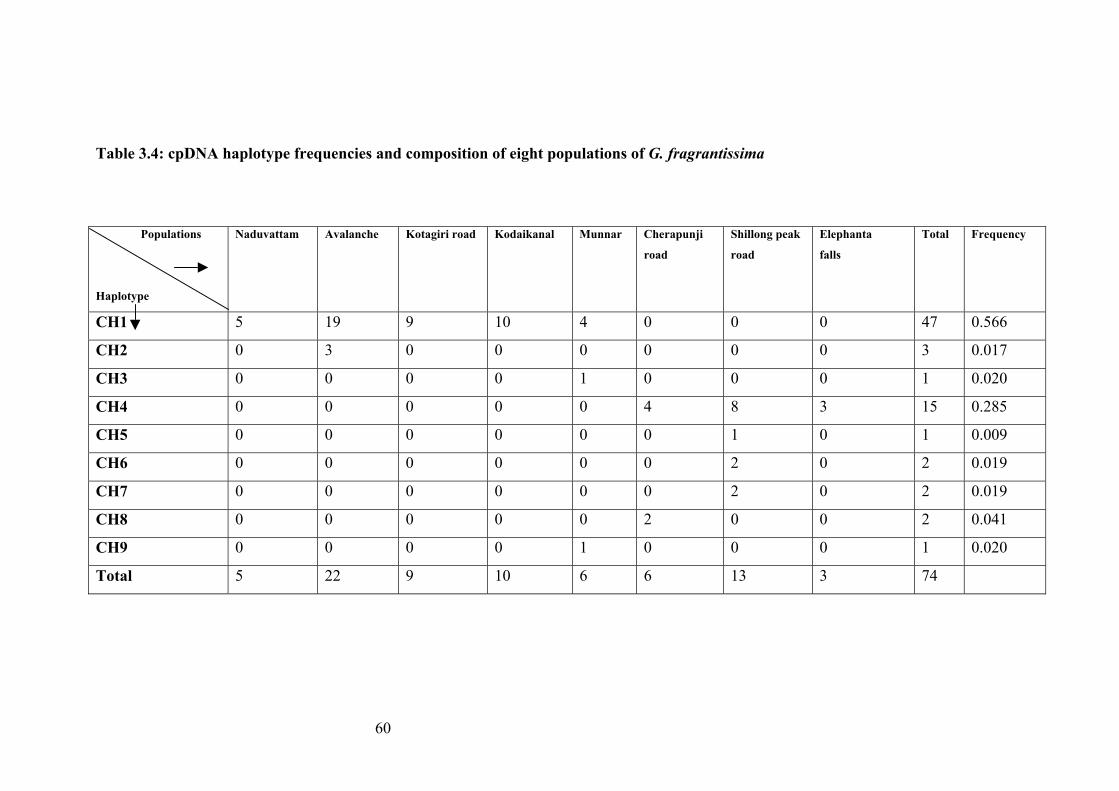
Table 3.4: cpDNA haplotype frequencies and composition of eight populations of G. fragrantissima
Populations
Haplotype
Naduvattam Avalanche Kotagiri road Kodaikanal Munnar Cherapunji
road
Shillong peak
road
Elephanta
falls
Total Frequency
CH1 5 19 9 10 4 0 0 0 47 0.566
CH2 0 3 0 0 0 0 0 0 3 0.017
CH3 0 0 0 0 1 0 0 0 1 0.020
CH4 0 0 0 0 0 4 8 3 15 0.285
CH5 0 0 0 0 0 0 1 0 1 0.009
CH6 0 0 0 0 0 0 2 0 2 0.019
CH7 0 0 0 0 0 0 2 0 2 0.019
CH8 0 0 0 0 0 2 0 0 2 0.041
CH9 0 0 0 0 1 0 0 0 1 0.020
Total 5 22 9 10 6 6 13 3 74
60

3.4.3 Haplotypes based on mtDNA analysis
Based on mtDNA profiles, seven haplotypes (MH1 through MH7) were observed
in all the eight populations together. Six populations from Avalanche, Kotagiri road,
Kodaikanal, Munnar, Cherapunji road and Shillong peak road had two or more than two
haplotypes, two populations Naduvattum and Elephanta falls had only one haplotype
while two populations from Avalanche and Kotagiri road showed unique haplotypes. As
against cpDNA haplotypes, in case of mtDNA, unique haplotypes were distributed only
in the populations from WG. MH1 showed maximum frequency of 0.618 and was the
only haplotype shared by all the populations (Table 3.5). Minimum frequency (0.005)
was shown by MH3 represented uniquely in only Avalanche population. MH2 with a
frequency of 0.22 was common to five populations and MH4 to four populations from
both the regions. MH5 and MH6 with frequencies of 0.027 and 0.013, respectively were
unique to Kotagiri road population. MH7 was common to Cherapunji road and Shillong
peak road populations from NE region (Table 3.5). Based on these patterns the diversity
parameters were calculated. Total heterozygosity hT was 0.582, average heterozygosity hS
was 0.467 and vT and vS were 0.586 and 0.438, respectively. The level of population
subdivision of diversity using unordered alleles (GST) and using ordered alleles (NST) was
0.197 and 0.252, respectively (Table 3.6).
The dendrogram constructed by using mtDNA haplotype frequencies in each
population is represented in Fig 3.6 which reveals some interesting observations. The
Elephanta falls population from NE region groups at 0.21 dissimilarity with other two
populations, namely, Naduvattum and Avalanche from WG. This cluster shows
dissimilarity of 0.45 with populations from Kodaikanal and Munnar of WG, while
Kotagiri road population from WG joins this group at 0.49 dissimilarity. Remaining two
populations from NE, namely Cherapunji road and Shillong peak road form a cluster with
0.23 dissimilarity.
3.4.4 Ratio of pollen to seed flow
Based on the diversity studies carried out using nuclear DNA markers in case of
G. fragrantissima in Chapter 2, GSTb was found to be 0.386. The genetic diversity studies
using cpDNA and mtDNA, GSTc for cpDNA was 0.615, while GSTc for mtDNA was
0.197. These values were used to calculate the ratio of pollen/seed flow which indirectly
gives information on the relative contribution of pollen and seed flow to the total gene
flow (formula as per given in Data analysis). The ratio for cpDNA was 0.56 and for
mtDNA was -1.60, respectively.
61

Table 3.5: mtDNA haplotype frequencies and composition of eight populations of G. fragrantissima
Populations
Haplotype
Naduvattam Avalanche Kotagiri road Kodaikanal Munnar Cherapunji
road
Shillong peak
road
Elephanta
falls
Total Frequency
MH1 5 18 4 7 3 2 2 3 44 0.618
MH2 0 2 0 3 2 3 7 0 17 0.220
MH3 0 1 0 0 0 0 0 0 1 0.005
MH4 0 1 2 0 1 0 2 0 6 0.073
MH5 0 0 2 0 0 0 0 0 2 0.027
MH6 0 0 1 0 0 0 0 0 1 0.013
MH7 0 0 0 0 0 1 2 0 3 0.040
Total 5 22 9 10 6 6 13 3 74
Table 3.6: Analysis of diversity using HAPLODIV and HAPLONST software
Genome hS h G v v NT ST S T ST
CpDNA 0.249 (0.102) 0.648 (0.116) 0.615 (0.120) 0.089 (0.05) 0.668 (0.098) 0.866 (0.078)
MtDNA 0.467 (0.115) 0.582 (0.105) 0.197 (0.087) 0.438 (0.134) 0.586 (0.134) 0.252 (0.068)
Values in parentheses indicate the standard error of the estimates
62
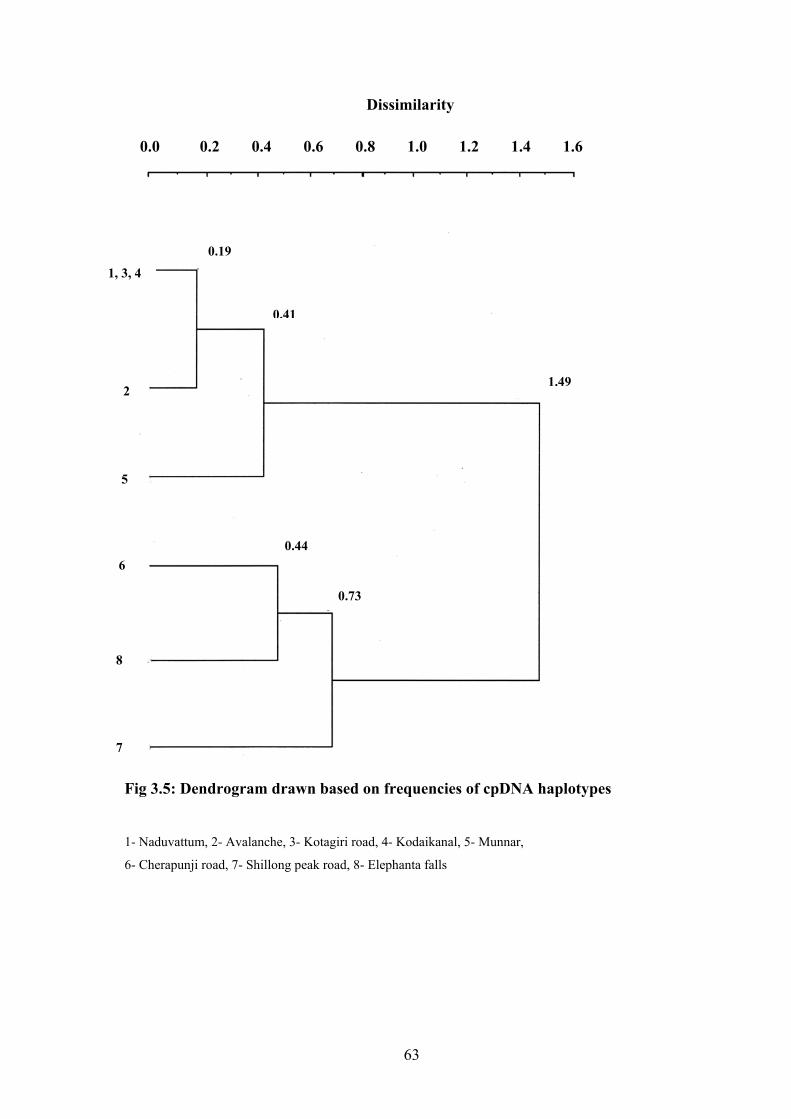
Dissimilarity
0.73
0.44
1.49
0.41
0.19
5
7
8
6
2
1, 3, 4
0.0 0.2 0.4 0.6 0.8 1.0 1.2 1.4 1.6
Fig 3.5: Dendrogram drawn based on frequencies of cpDNA haplotypes
1- Naduvattum, 2- Avalanche, 3- Kotagiri road, 4- Kodaikanal, 5- Munnar,
6- Cherapunji road, 7- Shillong peak road, 8- Elephanta falls
63

Dissimilarity
0.21
0.45
0.49
0.25
0.69
0.23
1
2
8
4
5
3
6
7
0.0 0.1 0.2 0.3 0.4 0.5 0.6 0.7 0.8 0.9
Fig 3.6: Dendrogram drawn based on frequencies of mtDNA haplotypes
1- Naduvattum, 2- Avalanche, 3- Kotagiri road, 4- Kodaikanal, 5- Munnar,
6- Cherapunji road, 7- Shillong peak road, 8- Elephanta falls
64

3.5 Discussion The slow rate of evolution of chloroplast and mitochondrial DNA compared to
nuclear DNA in plants earlier limited its use in population studies at intraspecific level
(Palmer 1987). Both chloroplast and mitochondrial genomes being conserved molecules,
the probability of detecting intraspecific variation was considered to be low. However, a
sensitive technique like PCR-RFLP allows use of sequence specific restriction enzymes
(which are now available in high number) for the digestion of a specific noncoding
amplicon from cp/ mtDNA to detect large number of variations, since atleast 50% of
cpDNA variations are due to small insertions and deletions (indels) (Gielly and Taberlet,
1994). Hence, there are many reports in the last decade on the use of cp- and mtDNA to
study intraspecific variations, population genetics and phylogeographic studies in plants
(Soltis et al 1992, Demesure et al 1996, El Mousadik and Petit 1996, King and Ferris
1998, Newton et al 2000, Bakker et al 2000, Sperisen et al 2001, Mohanty et al 2001 a,b,
2002, 2003 and Palme et al 2003). Use of genetic markers from these organellar
genomes is also a powerful tool for detecting population differentiation because they are
more sensitive to the effects of genetic drift than the nuclear genome (Gugerli et al,
2001). In the present study, PCR-RFLP technique was used to reveal chloroplast and
mitochondrial DNA diversity in the natural populations of G. fragrantissima from the
two hotspots in India.
3.5.1 Distribution of cpDNA haplotypes
In the present study none of the cpDNA haplotypes was shared by all the eight
populations. However, haplotype CH1 was shared by all the populations in WG, while
CH4 was shared by all the populations of NE region. Seven cpDNA haplotypes except
CH1 and CH4 were unique with low frequencies (Table 3.4). They suggest recent
changes in cpDNA of G. fragrantissima, as low frequencies of the unique haplotypes
were reported to reflect their recent origin in case of Prunus also (Mohanty et al 2001).
Total heterozygosity hT (for unordered alleles) and vT (for ordered alleles) were higher
than the corresponding average heterozygosities, hS and vS (Table 3.6). Furthermore the
values for GST (unordered alleles) and NST (ordered alleles) were high (0.615 and 0.866,
respectively) (Values of GST for other plants species are: Prunus avium, 0.29; Prunus
spinosa, 0.19; Argania spinosa, 0.60 and Alnus glutinosa, 0.87; Mohanty et al, 2001 and
2000; El Mousadik and Petit, 1996 and King and Ferris, 1998, respectively and values of
NST are: Prunus spinosa, 0.136 and Prunus avium, 0.33; Mohanty et al, 2000 and 2001,
65

respectively) and NST value was higher than GST value in G. fragrantissima in the present
study. The high values of GST and NST as well as NST value higher than GST are usually
observed for phylogeographically organized populations (Pons and Petit, 1996). The
dendrogram based on cpDNA haplotype frequencies (Fig. 3.4) shows grouping of
populations according to their geographic distribution. This observation is in accordance
with several other plant population studies where cpDNA variation is geographically
structured (Soltis et al, 1992 and Sewell et al, 1996).
3.5.2 Distribution of mtDNA haplotypes
Contrary to cpDNA, one mtDNA haplotype (MH1) was shared by all the eight
populations and had a high frequency and MH2 and MH4 were shared by five and four
populations, respectively (Table 3.5). These mtDNA haplotypes may correspond to the
ancestral type. Three mtDNA haplotypes (MH3, MH5 and MH6) were unique with low
frequency to population from Avalanche and Kotagiri road indicating recent changes in
mtDNA of G. fragrantissima from WG alone since no such unique haplotypes were
observed in NE region. The total mtDNA diversity (hT) was high and a major portion of
it was contributed by within population diversity (hS) (Table 3.6). Similarly, values of vS
and vT were also high. In case of mtDNA the values of population subdivision (GST and
NST) were very low as compared to those in case of cpDNA and there was not much
difference between these values (Table 3.6). This indicates that at the mtDNA level the
populations do not show much differentiation. They are more or less phylogenetically
equivalent and are not yet phylogeographically well structured although some unique
haplotypes at low frequency were observed (Pons and Petit, 1996). Figure 3.5 also shows
that in terms of haplotype relationship, Elephanta falls population from NE region was
closer to Naduvattum and Avalanche populations from WG although more plants need to
be obtained and analyzed from this population. This supported the theory that G.
fragrantissima probably migrated during glaciation from NE to WG and showed
common haplotypes between the two hotspots due to the slow rate of evolution of
mtDNA (12 times slower than nuclear and 3 times slower than cpDNA, Wolfe et al,
1987). On the other hand cpDNA did not show even a single haplotype common between
the two hotspots.
Nine cpDNA haplotypes and seven mtDNA haplotypes were detected from a
total of eight populations indicating relatively higher level of chloroplast DNA variation
than mitochondrial DNA variation in case of G. fragrantissima. This has also reflected
higher hT value for cpDNA than that for mtDNA (Table 3.6). This could be explained on
66
the basis of the three times slower rate of nucleotide substitution in mt DNA than in cp
DNA (Wolfe et al 1987, Palmer 1992). Similar observation was made in case of Prunus
spinosa (Mohanty et al 2003), however, there are also some examples where mt DNA
variation is higher than cpDNA (Laurent et al 1993, Caha et al 1998).
3.5.3 Correlation between cp and mtDNA haplotypes
In G. fragrantissima there were nine cp and seven mtDNA haplotypes observed
as detailed in the results. The most frequent mtDNA haplotypes MH1 and MH2 were
always associated with all the nine cpDNA haplotypes and MH4 was associated with
eight cpDNA haplotypes. However, four mtDNA haplotypes (MH3, MH4, MH5 and
MH6) common to WG and MH7 common to NE were associated with the cpDNA
haplotypes from their respective regions. Therefore, no strict association was seen
between the two genomes. This is in contrast to the observation made in case of Prunus
spinosa (Mohanty et al 2003) where the two mtDNA haplotypes (M1 and M2) were
specifically associated with cpDNA haplotypes with only two cases of dissociation and
in case of Oaks (Dumolin- Lapegue et al, 1998) a congruence of groupings based on cp
and mtDNA was observed with only three cases of uncoupling. This suggests two
possibilities in case of G. fragrantissima that probably there might not be similar pattern
of inheritance for cp and mtDNA. Inheritance patterns of cp and mtDNA in angiosperms
can vary among species (Dumolin- Lapegue et al, 1998) or in cpDNA paternal leakage
may have occurred causing dissociation. However, the second possibility appears to be
rare as there are more cases of dissociation than association.
3.5.4 Contribution of pollen and seed flow to the total gene flow
In the present study, the ratio of pollen/seed flow is less (0.56 for cpDNA and -
1.60 for mtDNA, respectively) as compared to earlier reports where the values are: 1 for
Castanea sativa (Fineschi et al, 2000), 3.4 for Silene alba, 8.9 for Silene vulgaris
(Ouborg et al, 1999), 24 for Pinus contorta, 84 for Fagus sylvatica, 286 for Quercus
robur and 500 for Quercus petrataea which are wind pollinated plants and 23 for Alnus
glutinosa which shows aquatic seed dispersal (King and Ferris, 1998). It is reported that
the ratio is low for tree species characterized by insect pollination or by very efficient
seed dispersal mechanisms (Petit, 1999). G. fragrantissima is an insect pollinated plant
and the seeds are edible thereby facilitating efficient seed dispersal. These together may
lead to low pollen/seed flow ratio. Furthermore the negative ratio for mtDNA suggests
better seed flow than pollen flow compared to that in cpDNA. It is also reported that
ratio of pollen/seed flow decreases with increase in the distance i.e. within population
67

gene flow is mainly pollen mediated while between populations the contribution of seed
and pollen flow to dispersal is more or less the same (Ouborg et al, 1999). In the present
study the populations of G. fragrantissima are from two spatially separated regions
which might also contribute to the low ratio of pollen/seed flow.
68

69
Chapter 4
Comparative analysis of quantity and
quality of oil of Indian Wintergreen
from the two hotspots in India

70

Comparative analysis of quantity and quality of oil of Indian
Wintergreen from the two hotspots in India
Contents 4.1 Abstract
4.2 Introduction
4.3 Materials and methods 4.3.1 Field sampling
4.3.2 Extraction of oil from G. fragrantissima leaves
4.3.3 Conditions used for GC analysis
4.4 Results
4.5 Discussion 4.5.1 Comparison of oil yield from G. fragrantissima and G. procumbens
4.5.2 Effect of genetic and environmental factors on oil yield
69

4.1 Abstract Oil extracted from the leaves of Gaultheria fragrantissima Wall. is similar in its
physical and chemical properties to the oil of Wintergreen obtained from Gaultheria
procumbens, Linn. and Betula lenta, both natives of North America. Comparative
analysis of quantity and quality of Oil of Indian Wintergreen was carried out in the
present study. Significant variation in the yield of oil as well as content of methyl
salicylate was observed in the plants from the two hotspots. The average yield of oil was
1.36% in Northeastern Himalayas (NE) and it was 0.074% in Western Ghats (WG).
Content of methyl salicylate ranged from 98.2- 99.4% and 89.9- 91.3% for plants from
NE region and WG, respectively. Furthermore, within population variation in oil yield
was also observed for plants collected from Cherapunji road and Shillong peak road
populations (populations from NE region) where the yield ranged from 1.10- 1.67% and
1.23- 1.79%, respectively.
70

4.2 Introduction Gaultheria fragrantissima Wall. belongs to family Ericaceae also known as the
Heath family and is a medicinally and economically important plant because of the
presence of an essential oil in its leaves. This volatile oil obtained by steam/water
distillation of its leaves is identical to the oil of Wintergreen, obtained from Gaultheria
procumbens Linn. and Betula lenta, both natives of North America (Anonymous, 1956).
The oil is colourless and possesses an agreeable odour and flavor. Following are the
reported physical properties of the oil from Assam leaves (Anonymous, 1956).
Specific gravity at 16°C 1.185
Optical rotation 0°
Refrative index at 25°C 1.4000
Ester number 362.9
Ester content, calculated 96- 99 %
as methyl salicylate
Solubility at 20°C Clearly soluble in 6- 8 volume of 70% alcohol
Methyl salicylate is the major component (96- 99 %) of the oil and the other compounds
reported are triacontane, an aldehyde or ketone, an alcohol and an ester (Anonymous,
1956). The presence of methyl salicylate as the chief component of oil of Wintergreen
was recognized more than a centuary ago by Procter and Cahours (1844). Methyl
salicylate does not occur in Gaultheria in free form, but as a glycoside. This glycoside
know as gaultherin is a monotropitin which is a conjugate of methyl salicylate with a
disaccharide of glucose and xylose. Methyl salicylate is released from gaultherin after
hydrolysis of the disaccharide also known as primeverose, by an hydrolase known as
gaultherase in plants (Ribnicky et al, 2003) (Fig 4.1). Other compounds reported to be
isolated from the leaves of G. fragrantissima are β- sitosterol, quercetin- 3- galactoside
and ursolic acid (Murthy and Babu, 1972).
71
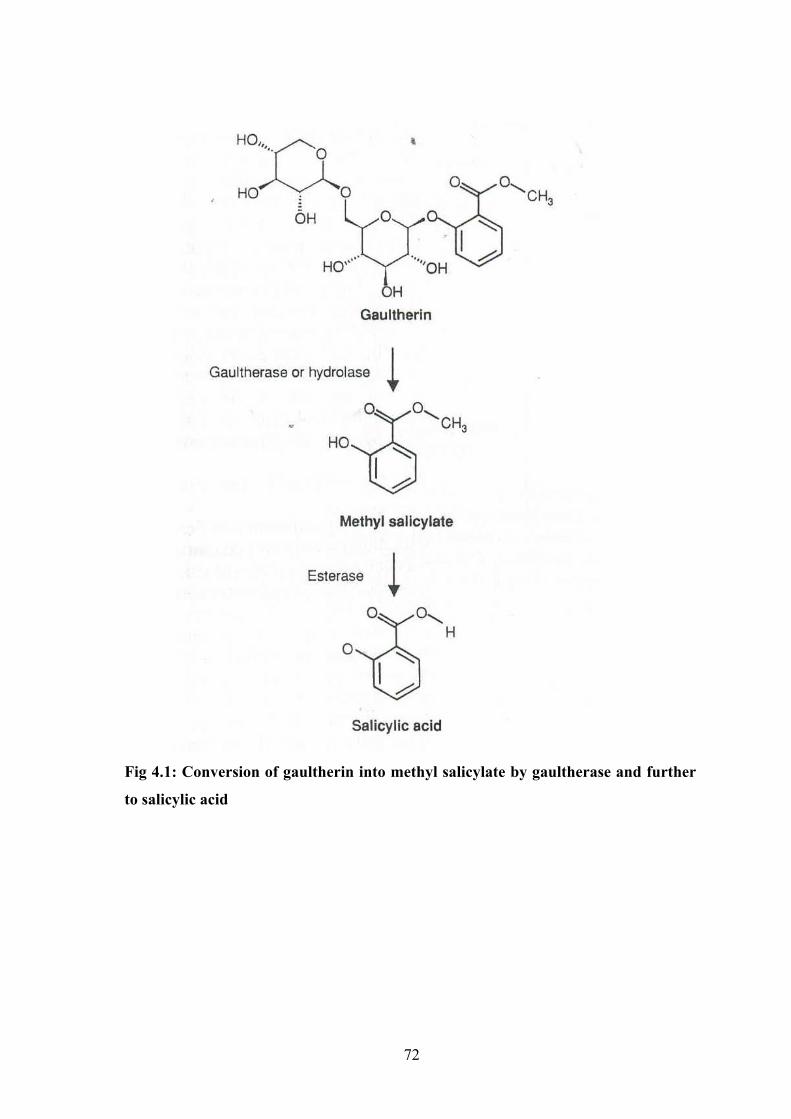
Fig 4.1: Conversion of gaultherin into methyl salicylate by gaultherase and further
to salicylic acid
72

Oil of Gaultheria is a stimulant, carminative and an antiseptic due to the presence
of methyl salicylate. It is applied externally in the form of a liniment or an ointment in
rheumatism, sciatica and neuralgia. External application may cause eruptions. The oil is
also given internally and is best administered in the form of an emulsion. It has
vermicidal action against hookworm. It is a constituent of several insecticidal and insect
– repellent preparations and is used as a flavoring agent in confectionary, soft drinks and
dentifrices. Experiments on tumor- susceptible mice showed that the onset of cancer is
delayed when small amounts of oil of gaultheria are administered (Anonymous, 1956). It
is reported that the synthetic methyl salicylate has largely replaced the natural product
due to its lower cost (Chopra, 1932). However, most of the pharmaceutical companies
manufacturing ayurvedic (ancient alternative medicine in India) pain balms even today,
claim to use the natural product rather than the synthetic methyl salicylate
(www.nutripharm.net, www.sportsbalm.conz/amrutanjan_liquid_balm.htm,). Naturally
occurring gaultherin (conjugate of methyl salicylate and a dissacharide of glucose and
xylose) can be used as a natural substitute for aspirin. Aspirin is used as a painkiller and
in the treatment for heart attacks and strokes, the leading cause of death. It is proposed
that the natural gaultherin may have therapeutic value as a safer and alternative to aspirin
with minimal negative gastric side effects (Ribnicky et al, 2003). β- sitosterol alone and
in combination with similar plant sterols reduce blood levels of cholesterol and is
effective in reducing symptoms of benign prostatic hyperplasia (Lee et al, 1977 and
Berges et al, 1995). Quercetin an antioxidant, has anti cancer properties, help prevent
heart diseases and act as an antihistamine (www.berkleywellness.com). Ursolic acid is
also medicinally active both topically and internally with anti inflammatory, anti tumor
(skin cancer) and anti microbial properties (Reico et al, 1991; Ishida et al, 1990 and
Zaletova et al, 1987). Hence, there is a need to make efforts towards efficient extraction
of oil. In this chapter, I have studied the yield of oil in relation to its season of collection
and also the site of collection (WG and NE region).
4.3 Materials and methods
4.3.1 Field sampling
Leaf tissue was collected from two populations, namely, Naduvattum and
Avalanche representing Western Ghats and one population, namely, Cherapunji road
representing Northeastern Himalayas (leaf tissue from a number of plants for each
population was pooled together). 500g to 1kg of leaf tissue was collected from each of
73

the above mentioned regions during months of February, July and October (Table 4.1).
Later, individual plant tissue was also collected from two populations, namely
Cherapunji road and Shillong peak road from NE region in the month of December.
4.3.2 Extraction of oil from G. fragrantissima leaves
100g of fresh leaves were cut into fine pieces and macerated in 1L round bottom
flask in 200ml water at 49°C (120°F) for 18 hrs in water bath (Anonymous, 1956)
followed by distillation of oil using Dean- Stark assembly (Fig 4.2) for 4- 5 hours till the
milky distillate became clear. Initially the distilled water was milky due to its emulsion
with oil (Fig 4.2a), but as the distillation proceeded it became clear (Fig 4.2b) and the oil
which is heavier than water settled down (Fig 4.2c). Oil was extracted from the distillate
by extracting it with diethyl ether as follows: the distillate was collected in a flask and
equal amount of diethyl ether was added to it. Oil dissolved in diethyl ether and water
formed a separate layer. Water layer was removed using a separating funnel and the
lighter layer of solvent (diethyl ether) was evaporated at 40°C, 100mm of Hg using Rota
vapor R- 114 (Buchi, Switzerland). The yield obtained was dried and weighed. Each
extraction was carried out three times and the yields given in Table 4.1 represent the
average values.
4.3.3 Conditions used for GC analysis
GC- analyses were accomplished using an Agilent 6890N instrument equipped
with HP-5 capillary column (30m × 0.32 mm, 0.25 µm film thickness), working with the
following temperature programme: 50°C to 250°C at the rate of 20°C per min, kept at
250°C for 5min, injector and detector temperatures 250°C, carrier gas nitrogen (2ml/
min), detector FID, split ratio 1: 100, injection of 0.5µl. Methyl salicylate was estimated
quantitatively by comparing its retention time with that of authentic methyl salicylate
(procured from s.d. fine chem., Ltd, Mumbai) which gave a peak of area 99.30% at 7.767
retention time. All the oil samples were analyzed under similar conditions.
74

Fig 4.2a Fig 4.2b Fig 4.2c
Fig 4.2: Dean- Stark assembly used for oil extraction by water distillation. 1: Dean- Stark assembly, 2: Round bottom flsak with leaves macerated in water, 3: Heating mantel, 4: Oil
heavier than water settles down.
4.4 Results Leaf tissue was collected from WG (Nilgiri hills) and NE region (Shillong)
during different months (February, July and October) in the year 2002 and 2003. Leaf
tissue thus collected was pooled together from various plants in the respective regions.
The aim of such a collection was to compare the overall percentage yield of oil from the
plants of the two main hotspots. Percentage oil yield on fresh weight basis (water content
is 53.5% in the leaves) was calculated for all the samples and the results are given in
Table 4.1. Plants from NE region gave higher yield in the range of 1.4 to 1.49% (average
is 1.44%), as compared to the plants from WG where the yield of oil ranged from 0.056-
0.086% (average is 0.072%), irrespective of the month of collection. GC- analysis was
carried out to measure the methyl salicylate content of the oil. Fig 4.3 gives the
representative GC profiles of the standard (synthetic methyl salicylate), wintergreen oil
from NE region and WG collected during July and October. It was also observed that the
content of methyl salicylate varied in the two hotspots. Percentage of methyl salicylate
ranged from 98.2- 99.4% for plants from NE region whereas it ranged from 89.9- 92.3%
for plants from WG (Table 4.1). As shown in Fig 4.3b (i & ii) oil from Shillong shows a
major peak of methyl salicylate at 7.6 retention time. Other peaks detected here are very
75
1
32
4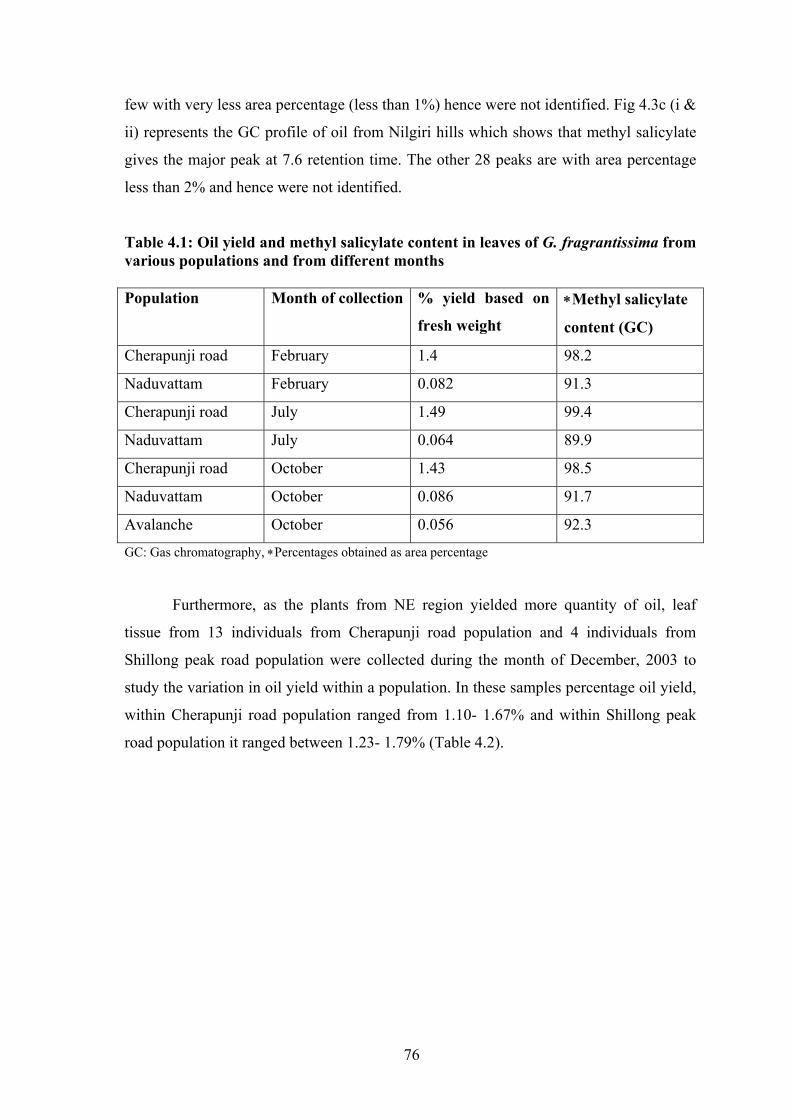
few with very less area percentage (less than 1%) hence were not identified. Fig 4.3c (i &
ii) represents the GC profile of oil from Nilgiri hills which shows that methyl salicylate
gives the major peak at 7.6 retention time. The other 28 peaks are with area percentage
less than 2% and hence were not identified.
Table 4.1: Oil yield and methyl salicylate content in leaves of G. fragrantissima from various populations and from different months Population Month of collection % yield based on
fresh weight
∗Methyl salicylate
content (GC)
Cherapunji road February 1.4 98.2
Naduvattam February 0.082 91.3
Cherapunji road July 1.49 99.4
Naduvattam July 0.064 89.9
Cherapunji road October 1.43 98.5
Naduvattam October 0.086 91.7
Avalanche October 0.056 92.3
GC: Gas chromatography, ∗Percentages obtained as area percentage
Furthermore, as the plants from NE region yielded more quantity of oil, leaf
tissue from 13 individuals from Cherapunji road population and 4 individuals from
Shillong peak road population were collected during the month of December, 2003 to
study the variation in oil yield within a population. In these samples percentage oil yield,
within Cherapunji road population ranged from 1.10- 1.67% and within Shillong peak
road population it ranged between 1.23- 1.79% (Table 4.2).
76
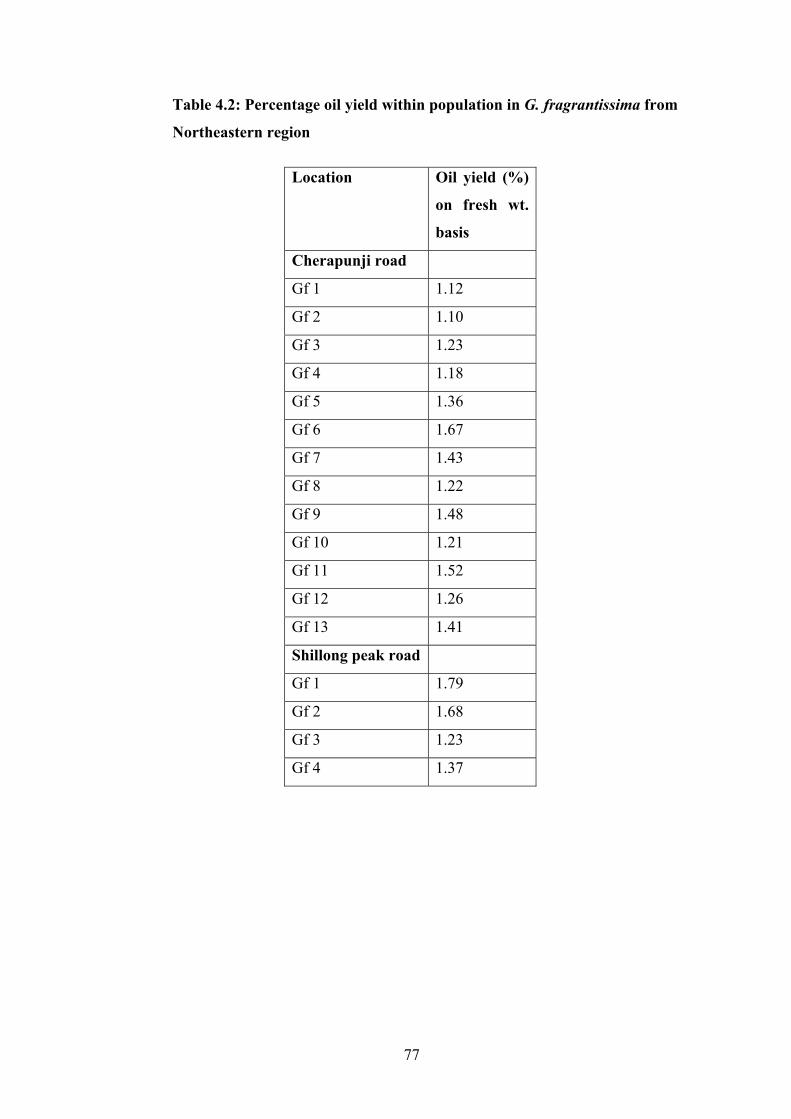
Table 4.2: Percentage oil yield within population in G. fragrantissima from
Northeastern region
Location Oil yield (%)
on fresh wt.
basis
Cherapunji road
Gf 1 1.12
Gf 2 1.10
Gf 3 1.23
Gf 4 1.18
Gf 5 1.36
Gf 6 1.67
Gf 7 1.43
Gf 8 1.22
Gf 9 1.48
Gf 10 1.21
Gf 11 1.52
Gf 12 1.26
Gf 13 1.41
Shillong peak road
Gf 1 1.79
Gf 2 1.68
Gf 3 1.23
Gf 4 1.37
77

Response (pA)
Retention time (min)
Fig 4.3a: GC profile of standard (synthetic methyl salicylate)
Response (pA)
Retention time (min)
[i]
Retention time (min)
Response (pA)
[ii]
Fig 4.3b: GC profile of wintergreen oil from NE region for months
of:i) July and ii) October
78
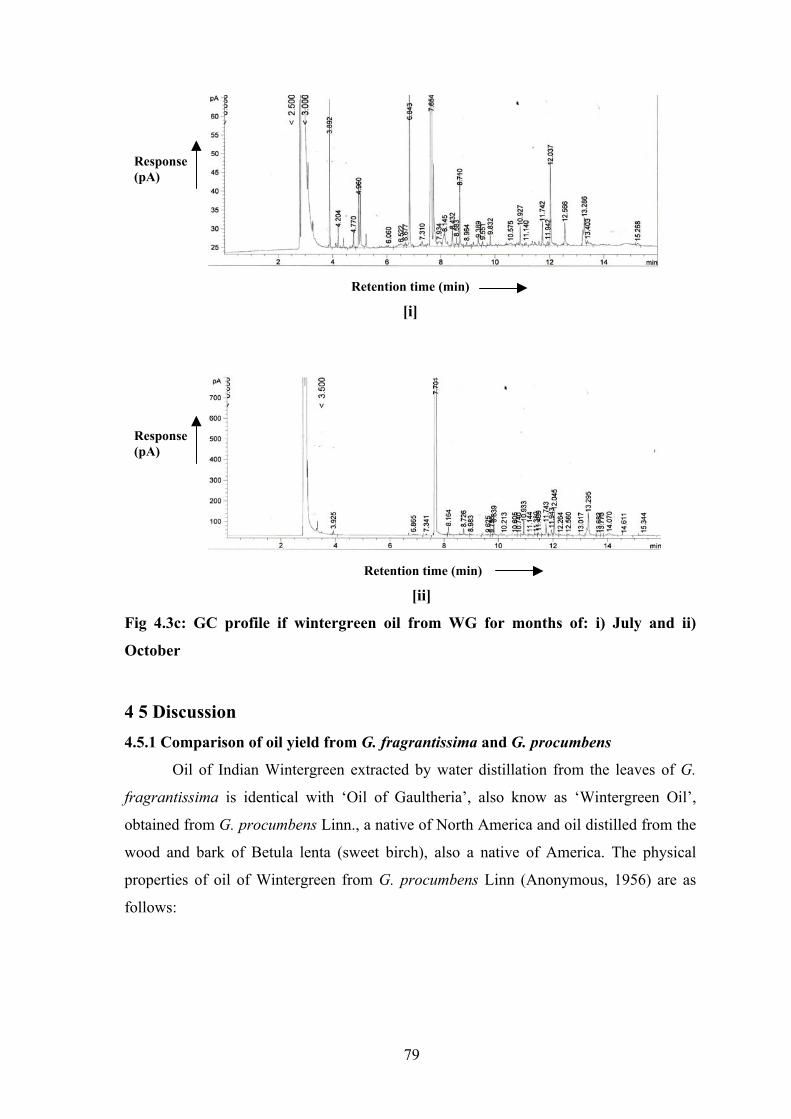
Response (pA)
Retention time (min)
[i]
Response (pA)
Retention time (min)
[ii]
Fig 4.3c: GC profile if wintergreen oil from WG for months of: i) July and ii)
October
4 5 Discussion 4.5.1 Comparison of oil yield from G. fragrantissima and G. procumbens
Oil of Indian Wintergreen extracted by water distillation from the leaves of G.
fragrantissima is identical with ‘Oil of Gaultheria’, also know as ‘Wintergreen Oil’,
obtained from G. procumbens Linn., a native of North America and oil distilled from the
wood and bark of Betula lenta (sweet birch), also a native of America. The physical
properties of oil of Wintergreen from G. procumbens Linn (Anonymous, 1956) are as
follows:
79

Specific gravity at 15°C 1.180- 1.193
Optical rotation -0° 25' to -1° 30'
Refrative index at 20°C 1.535- 1.536
Ester number 354- 365
Ester content, calculated 96- 99 %
as methyl salicylate
Solubility at 20°C Clearly soluble in 6- 8 volume of 70% alcohol
The average yield of oil from G. procumbens Linn. is 0.66% during summer
which gives the highest yield (Anonymous, 1966) and that from sweet birch is 0.2%
(Chopra, 1932) where the distillation process does not include prior maceration of the
leaves. However, if the leaves are macerated prior to distillation the yield increases from
0.66% to 1.30% for G. procumbens Linn. and from 0.2% to 0.41% for Betula lenta. The
yield of oil as earlier reported for G. fragrantissima for the winter season is 0.036% for
plants from Nilgiri hills and 0.65% for plants from Assam ie NE region where the
distillation process does not include prior maceration of the leaves (Chopra, 1932). In the
present study, I have reported an average yield of 1.44% for plants from NE region
during winter and 0.072% for plants from WG during winter where the leaves were
macerated before distillation. Thus the maceration of leaves of G. fragrantissima before
distillation increased the oil yield by two times as compared to the oil yield where
maceration was not done. This suggests that oil yield in G. fragrantissima is as good as
that from G. procumbens Linn. and can be used for commercial exploitation.
4.5.2 Effect of genetic and environmental factors on oil yield
Due to the importance of G. fragrantissima as a medicinal plant there have been a
few reports earlier on oil exraction. It was reported by Adhikary and Bashyal (1985) that
the oil yield showed seasonal variation for plants collected from Nepal. In the present
study no such variation was obtained in the yield of oil for plants collected during
different months (Table 4.1). However, variation in the yield of oil was recorded for
plants from WG and NE region. Plants from NE region yielded more oil than plants from
WG. The two regions are spatially separated by an aerial distance of more than 2000km
with difference in their annual rainfall, climate, soil type, etc (Meher- Homji, 1972).
Thus, the environment might be playing a crucial role in oil yield. It is reported that the
production of secondary metabolites is affected by the environment as well as the
genotype of the plant. Chatwachirawong et al (1999) studied G-E interactions on starch
content from five Cassava genotypes. Their results indicated that there was less seasonal
80

effect on genotypic performance. Doran et al (1995) studied the effect of environment
and genotype on oil yield from the leaves of Eucalyptus camaldulensis and obtained
significant variation in oil yield in the plants collected from their natural habitat in
Zimbabwe. Katerina et al (2001) studied composition of essential oil from Yarrow
(Achillea millefolium) growing in natural habitats of Czech Republic and inferred that
the content and composition of the active substances depended on both, climatic
conditions and individual subspecies. In the present study, it was noted that the content
of methyl salicylate also varied in the two hotspots in India.
Based on the genetic diversity studies using random nuclear markers presented in
Chapter 2, it was observed that the plants of G. fragrantissima clustered according to
their geographic regions (Fig 2.2, Chapter 2). Using cytoplasmic markers (Chapter 3) it
was suggested that plants of G. fragrantissima from NE region probably migrated
towards WG during Pleistocene glaciation. Thus the plants had a common genetic
background before glaciation but after glaciation they started adapting to their local
environment and evolving independently in different climatic conditions. These findings,
together suggest that there might be genetic basis for the difference in the yield of oil and
methyl salicylate content from the two spatially separated hotspots. However, the
possibility of attributing the oil yield difference also to climatic variations in the two
hotspots cannot be ruled out unless the same plants are grown in the two regions and are
used for oil extraction. Similarly, Buben et al (1992) studied the contents and
composition of essential oil in various Thuja species collected from four genomically
different localities in Czechoslovakia during different seasons. They obtained variability
of the main component of the essential oil in these areas. Skoula et al (1999) studied the
genetic diversity in Salvia fruticosa from Crete and its relation with the essential oil
profiles and suggested a genetic basis for the chemical profiles observed. They reported
quantitative changes in the essential oil content and suggested that the microclimate
played an important role in affecting the essential oil content. Thus, both the genetic and
environmental factors might be responsible for oil yield and methyl salicylate content in
G. fragrantissima from the two hotspots in India.
In order to determine the effect of environment/ genetic background on oil
content at a specific location, within population variation in oil yield for plants collected
from Cherapunji road and Shillong peak road populations was also analyzed (Table 4.2)
where the yield of oil ranged from 1.10- 1.67% and 1.23- 1.79%, respectively.
Considerable variation in the oil yield was thus observed in the plants collected from the
81

same populations. This within population variation could be attributed to their genetic
background alone and not to the environment as the individual plants belong to the same
climatic zone. Study using cytoplasmic markers (Chapter 3) inferred that Cherapunji
road and Shillong peak road populations showed more than one cp and mtDNA
haplotypes and also represented unique haplotypes. Furthermore, Shillong peak
population had maximum number of unique cpDNA haplotypes (Table 3.4, Chapter 3).It
would, therefore be interesting to analyze haplotypes of these plants as well as more
plants of the same haplotypes for the correlation of haplotype with oil content if such a
correlation exists. The collections for individual plants from the two populations in NE
region were made recently based on the previous pooled sample data of oil yield and
methyl salicylate content, therefore the genotype analysis of these plants has been
initiated as the next step based on the outcome of the present study.
82
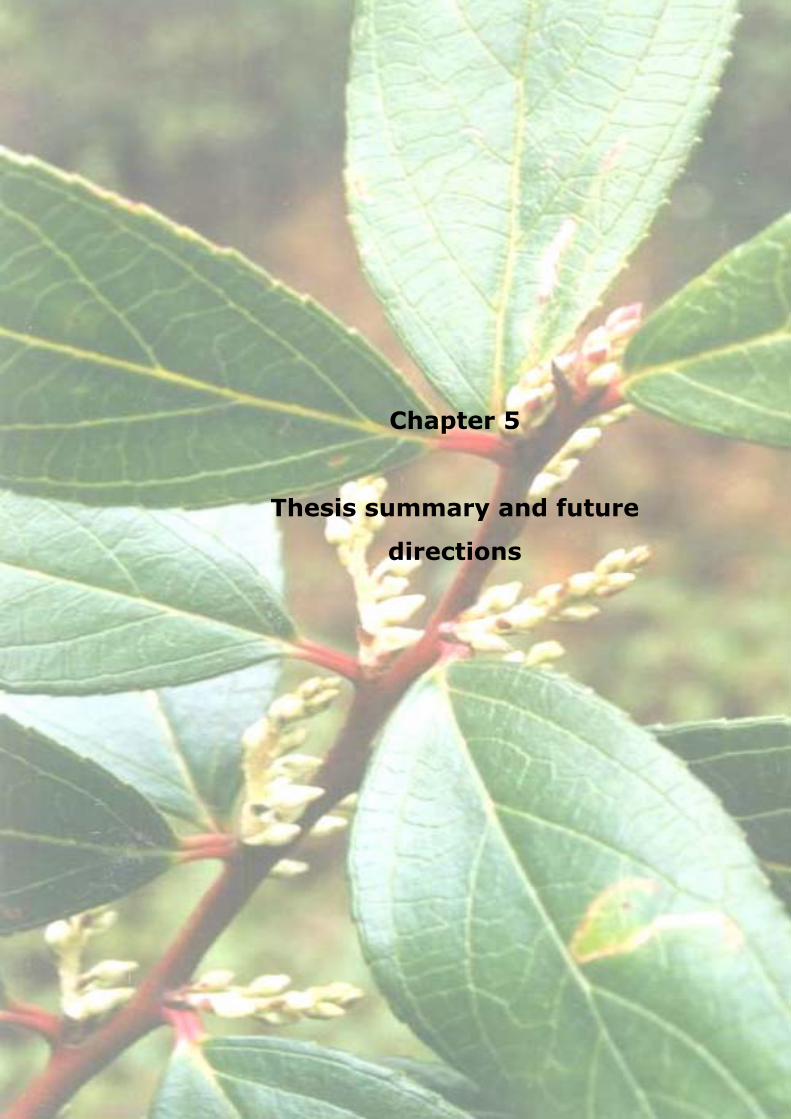
83
Chapter 5
Thesis summary and future
directions

84

Thesis summary
Contents 5.1 Geographic clustering of G. fragrantissima from the two hotspots
based on ISSR markers
5.2 Genetic diversity in G. fragrantissima based on cytoplasmic markers
5.3 Towards biomolecule prospecting
5.4 Assessment of theories on postglacial migration
5.5 Application of genetic diversity driven conservation strategies in
G. fragrantissima
5.6 Future directions
83
In my thesis, I have used both nuclear (ISSR) and cytoplasmic (cp and mtDNA)
markers to study the genetic diversity in an undershrub Gaultheria fragrantissima Wall.
from the two biodiversity hotspots in India, namely Western Ghats (WG) and
Northeastern Himalayas (NE). G. fragrantissima is an insect pollinated, shrub savanna
type of plant growing above 1500m altitude. The two hotspots mentioned above are
among the 25 hotspots recognized all over the globe and are also among the 8 hottest
hotspots (Myers et al, 2000). For the past 4-5 decades researchers have studied the plant
species common to the two hotspots with respect to their morphological characters,
habitat type, endemism, phytogeography, etc (Meher- Homji, 1972 and 1975; MoEF,
1999). However, there are very few reports on the study of the genetic diversity of these
plant species (Jain et al, 2000, Deshpande et al, 2001 and Bahulikar et al, 2004)
Furthermore, there are theories proposed by various researchers regarding the migration
of flora and fauna from NE region towards WG during Pleistocene glaciation (as detailed
in Chapter 1, Review of literature). In the light of this, I used molecular tools to
determine the genetic diversity of one such plant, G. fragrantissima which is, not only
common to the two hotspots, but is also medicinally and economically important plant
due to the presence of methyl salicylate as a major constituent in the oil from its leaves.
5.1 Geographic clustering of G. fragrantissima from the two hotspots based on ISSR
markers
ISSR markers are random nuclear (biparentally inherited genome and hence
transmitted through both seeds and pollen) dominant markers which do not require any
previous sequence information for their synthesis. Such markers are particularly useful
for an initial examination of the genetic diversity in plants. Here, I analyzed seven
populations of G. fragrantissima from the two hotspots in India. ISSR primers with good
PIC score were used in the analysis which obtained percentage polymorphism of 86.82
with a total diversity of 0.505. UPGMA phenogram was developed which clustered the
plants according to their geographic regions. Furthermore, low gene flow among
populations and high among population differentiation were recorded. This indicated that
G. fragrantissima populations might be progressing towards genetic drift.
5.2 Genetic diversity in G. fragrantissima based on cytoplasmic markers
In order to study the phylogeography (geographic distribution of genetic
variation) and evolutionary history of the plant, I used cytoplasmic markers (cp and
mtDNA markers). Cytoplasmic DNA is uniparentally inherited, transmitted exclusively
84

through seeds, is homoplasmic and non recombinant. Here I detected nine cpDNA and
seven mtDNA haplotypes in the eight populations of G fragrantissima from the two
hotspots in India. Interestingly, none of the cpDNA haplotypes was common between the
two hotspots which could be due to the faster rate of evolution in cpDNA as compared to
mtDNA (Wolfe et al, 1987). However, one mtDNA haplotype was shared by all the eight
populations that could be considered as the ancestral haplotype for G fragrantissima. It
was revealed that the cpDNA diversity was higher than mtDNA diversity, however,
within population diversity was higher in mtDNA. The level of population subdivision
for unordered and ordered alleles was higher in cpDNA and NST value was also higher
than GST in cpDNA together suggesting phylogeographic structuring in G.
fragrantissima.
Among the seven haplotypes of mtDNA, two most frequent (MH1 and MH2)
were always associated with all the nine cpDNA haplotypes whileone mtDNA haplotype
(MH4) was associated with eight cpDNA haplotypes. On the other hand, four mtDNA
haplotypes (MH3, MH4, MH5 and MH6) common to WG and MH7 common to NE
were associated with the cpDNA haplotypes from their respective regions. Thus, no strict
association was observed between the two genomes. More cases of dissociation than
association between the cp and mtDNA haplotypes probably suggest different patterns of
inheritance for cp and mtDNA in G. fragrantissima. Low ratio of pollen/seed flow is a
characteristic of plants with insect pollination or efficient seed dispersal and the ratio
decreases with increase in distance (Petit, 1999 and Ouborg et al, 1999). This supports
the result in case of G. fragrantissima where low ratio of pollen to seed flow was
observed.
5.3 Towards biomolecule prospecting
G. fragrantissima Wall. is know for its oil with methyl salicylate as its chief
constituent. This oil is similar in its physical and chemical properties to the Oil of
Wintergreen obtained from G. procumbens, Linn. and Betula lenta, both natives of North
America and hence is known as Oil of Indian Wintergreen. I carried out comparative
analysis of oil yield and methyl salicylate content in G. fragrantissima plants from the
two hotspots in India. Here, I detected variation in oil yield and methyl salicylate content
in the plants from the two hotspots, although no variation in oil yield was observed for
plants collected during different seasons. NE region gave high yield of oil in the range of
1.40- 1.49% and high methyl salicylate content in the range of 98.2- 99.4% as compared
to the plants from WG where oil yield ranged from 0.056- 0.086% and methyl salicylate
85
content ranged from 89.9- 92.3%. Furthermore, within population variation in oil yield
was also observed for plants from Cherapunji road and Shillong peak road populations
where the yield ranged from 1.10- 1.67% and 1.23- 1.79%, respectively. These results
can be further used to study the correlation between oil yield and the individual plant
haplotype. This will help in identifying elite haplotypes giving better oil yield which
need to be conserved.
5.4 Assessment of theories on postglacial migration
It has been well recorded that the pleistocene glaciation was probably responsible
for pushing the Himalayan flora southwards (Burkill 1924; Hora 1949; Auden 1949; Dey
1949). During glaciation the plant species from NE region must have advanced towards
the southern Indian peninsula by stepwise migration and during post glaciation, only the
hardy species might have survived in WG. Plants of temperate shrub savanna type such
as Gaultheria, Mahonia, Rhododendron, etc could survive only at the high altitude
(above 1500m) in WG while only tree species of tropical forest type such as Symplocos,
Pittosporum, Ardisia, Elaeocarpus, etc could survive at lower altitudes (Meher- Homji
1975). Interestingly, in case of Gaultheria only one species, G. fragrantissima is
observed to be common to the two regions although there are 7-8 species of Gaultheria
reported in the NE region (Meher- Homji 1975). There could be two explanations for
this, one that G. fragrantissima was the only species of genus Gaultheria hardy enough
to survive after glaciation in WG at high altitudes. Secondly, the other species might
have migrated very slowly, hence could not reach the high altitudes of WG and therefore,
could not survive after glaciation in WG.
This can be strongly supported by fossil records, however unfortunately, no fossil
record could be obtained in particular for Gaultheria. Gupta (1971) traced the sequence
of vegetation and climatic changes in the Nilgiri hills based on the analysis of fossil
pollen. According to him, montane forests gained dominance about 14000 years ago as
evident from the preponderance of pollen of Gordonia, Elaeocarpus and Euonymus.
After this phase, pollen record showed progressive decline of forest in favour of
grassland. Also a key to the past distribution of the present disjunct taxa of the montane
shrub- savanna Rhododendron, Gaultheria, Mahonia etc was provided by the present
distribution of the montane forest genera like Pittosporum, Symplocos, Elaeocarpus, etc
on lower altitudes (Meher- Homji, 1975). These genera have representation from Sikkim
to Garhwal in the sub- tropical Himalayas; in western India in WG; in Eastern India in
Chota Nagpur and Mahendragiri hills and in Sri Lanka in Southern hilly region (Meher-
86

Homji, 1975). Intensive sampling of G. fragrantissima within India as well as
neighboring countries like Nepal, Burma, Bhutan and Srilanka and their genetic analysis
may lead to a better understanding of the migration pathways and the history of
distribution of G. fragrantissima after the last ice age.
5.5 Application of genetic diversity driven conservation strategies in G.
fragrantissima
The rich biodiversity in the two hotspots is threatened largely due to various
anthropogenic activities due to which there is an ever increasing loss of the forests in
these two hotspots (Upadhyay, 1999 and Jha et al, 2000), hence there is a need to protect
and conserve the threatened forests community. Therefore, the two regions under study,
namely, WG and NE region, have been marked for the overall national strategy of
protecting the ecosystems and safe guarding the genetic diversity. India is a developing
country where threats are the greatest and conservation resources are the scarcest.
Therefore, efforts are needed especially in India, to conserve and maintain genes, species
and ecosystems for the sustainable use and management of biological resources. In the
light of above scenario, genetic diversity directed conservation would be a better
proposition to be adopted in a country like India. Thus an assessment of genetic variation
is a primary step towards this. Precise knowledge of the subdivision of genetic variation
within and among populations will help in identifying the genetically heterogeneous
species which require different conservation strategies as compared to genetically
uniform species (Pons and Petit 1995). Based on my studies, it is possible to select the
populations with common as well as unique genetic backgrounds which need to be
conserved in order to maintain the genetic diversity in G. fragrantissima in India.
5.6 Future directions
I have made a preliminary effort to analyze the diversity in G. fragrantissima
from the two hotspot regions in India based on DNA markers as well as the chemical
markers such as methyl salicylate content. However, more in depth analysis need to be
done in both the cases. Vigorous attempts need to be made to make extensive collections
in the same as well as other areas to have more number of populations in order to have
more reliable estimation of the population structure and genetic diversity. Nucleotide
sequencing of the chloroplast and mitochondrial DNA fragments as well as Single Strand
Conformational Polymorphism (SSCP) analysis if performed, will throw light on the
mutational events in these genomes. Furthermore, use of controlled crosses in the
population will give an idea about the inheritance patterns of these extranuclear genomes
87

since my studies have suggested different inheritance patterns of cp and mtDNA in G.
fragrantissima. Apart from this, the haplotype and oil content correlation needs to be
done for commercial exploitation of G. fragrantissima. Plantation of such elite genotypes
on a very large scale can be attempted for oil extraction in collaboration with the
commercial organizations who have been exploiting G. fragrantissima for their product
preparation. This will save nonselective destruction of natural populations of G.
fragrantissima. Communities and tribals in these areas can be involved in such efforts
which will provide them sustainable occupation and will help in their upliftment.
Conservation of various genotypes can also be achieved through their participation in
such programmes. The present studies performed by me only form the first step towards
such an endeavor.
88

89
Bibliography

90
Adhikary SR and Bashyal BP. 1985. Essential oil from Gaultheria fragrantissima
Wall. J. NPA. 12: 9- 19.
Anonymous. 1956. In: The Wealth of India, A dictionary of Indian Raw Materials
and Industrial Products. Volume 4 (F-G). CSIR, New Delhi. pp 118- 119.
Anonymous. 1966. Indian Pharmacopoeia. The Manager of Publication, Delhi. pp-
456-457.
Auden JB,1949. A geological discussion on the Satpura Hypothesis and Garo-
Rajmahal gap. Proc. Nat. Inst. Sci. India, 8 (15): 315- 340.
Bachmann K, 1994. Molecular markers in plant ecology. New Phytologist. Vol. 126,
3: 403- 418.
Bahulikar RA, Lagu MD, Kulkarni BG, Pandit SS, Suresh HS, Rao MKV, Ranjekar
PK and Gupta VS.2004. Genetic diversity among spatially isolated populations of
Eurya nitida Korth. (Theaceae) based on inter- simple sequence repeats. Curr.
Sci.. 86:824- 831.
Bakker FT, Alastair C, Pankhurst CE, Gibby M. 2000. Mitochondrial and chloroplast
DNA- based phylogeny of Pelargonium (Geraniaceae). Am. J. Bot., 87: 727-
734.
Barrett SC and Kohn JR, 1991. Genetic and evolutionary consequences of small
population size in plants: Implications for conservation, pp 3- 30 in D. A. Falk
and K. E. Holsinger, editors. Genetic and conservation of rare plants. Oxford
University Press, New York, USA.
Bartish IV, Jeppsson N and Nybom H, 1999. Population genetic structure in the
dioecious plant species Hippophae rhamnoides investigated by random amplified
polymorphic DNA (RAPD) markers. Mol. Ecol., 8: 791- 802.
Bartlett I, Novak SJ and Mack RN, 2002. Genetic variation in Bromus tectorum
(Poaceae): Differentiation in the Eastern United States. Am.. J. Bot., 89: 602-612.
Batista F and Sosa P, 2002. Allozyme diversity in natural populations of Viola
palmensis Webb and Berth. (Violaceae) from La Palma (Canary islands):
Implications for conservation genetics. Annals Bot., 90: 725-733.
Bennett KD, 1990. Milankovitch cycles and their effects on species in ecological and
evolutionary time. Paleobiology, 16: 11- 21.
Berges RR, Windeler J, Trampisch HJ. 1995. Randomised, plcebo- controlled,
double- blind clinical trials of beta- sitosterol in patients with benign prostatic
hyperplasia. Lancet. 345: 1529- 32.
89
Birky CW Jr., 1978. Uniparental inheritance of mitochondrial and chloroplast genes:
mechanisms and evolution. Proc. Nat. Acad. Sci., USA. 92: 11331- 11338.
Blair MW, Panaud O, McCouch SR (1999) Inter-simple sequence repeat (ISSR)
amplification for analysis of microsatellite motif frequency and fingerprinting in
rice (Oryza sativa L.).Theor Appl Genet 98: 780-792.
Blasco F. 1970. Aspects of flora and ecology of savannas of the south Indian hills. J
Bombay Nat. Hist. Soc., 50: 522- 534.
Blasco F, 1971. Orophytes of South India and Himalayas. J. Ind. Bot. Soc. 50: 377-
381.
Botstein D, White RL, Skolnick M, and Davis RW, 1980. Construction of genetic
linkage map in man using restriction fragment length polymorphisms. Am. J.
Hum. Genet., 32: 314- 332.
Bourliere F, 1980. The land and wildlife of Eurasia. eds Time- life books, Honkong.
Briggs JC, 1989. The historic biogeography of India: Isolation or contact?. Syt.
Zool., 38(3): 322- 332
Brown AHD, 1979. Enzyme polymorphism in plant populations. Theor. Popul. Bio.
15: 1-42.
Buben I, Karmazin M, Trojankova J and Nova D. 1992. Seasonal variability in the
contents and composition of essential oil in various Thuja species occurring in
Czechoslovakia. Acta. Hort. 306: 200- 203.
Burkill JH, 1924. The botany of the Abor expedition. Records of the Botanical
Survey of India, 10: 420.
Bussell JD, 1999. The distribution of random amplified polymorphic DNA (RAPD)
diversity amongst populations of Isotoma petraea (Lobiliaceae). Mol. Ecol. 8:
775- 789.
Caha CA, Lee DJ, Stubbendieck J, 1998. Organellar genetic diversity in Penstemon
haydenii (Scrophulariaceae): an endangered plant species. Am. J. Bot., 85: 1704-
1709.
Camacho FJ, Liston A, 2001. Population structure and genetic diversity of
Botrychium pumicola (Ophioglossaceae) based on inter-simple sequence repeats
(ISSR). Am. J.Bot. 88: 1065-1070.
Chapmann GP, 1986. Mitochondrial delivery via the male gametophyte and the
prospects for recombination. Pp 61- 68 in SH Mantell, GP Chapmann and PFS
Street, eds. The chondriome. Longman, London.
90

Charters YM, Robertson A, Wilkinson MJ, Ramsay G (1996) PCR analysis of
oilseed rape cultivars using 5'anchored SSR primers. Theor Appl Genet 84: 442-
447.
Chase MR, Boshier DH, and Bawa KS, 1995. Population genetics of Cordia
alliodora (Boraginaceae), a neotropical tree 1. Genetic variation in natural
populations. Am. J. Bot., 82: 468-475.
Chatwachirawong P, Boonseng O and Summatraya A. 1999. The effects of genotype
and GE interaction on starch content of Cassava. Kasetsart J. (Nat. Sci.) 33: 171-
177.
Chaudhuri AB and Sarkar DD, 2002. In: Biodiversity Endangered: Indias threatened
wildlife and medicinal plants. Jodhpur, Scientific Publishers. pp- 359.
Chaudhuri AB and Sarkar DD, 2003. In: Megadiversity conservation: Flora, fauna
and medicinal plants of India’s hotspots. Delhi, Daya Publishing.
Chopra RN, 1932 The medicinal and economic aspects of some Indian medicinal
plants. Patna University Press. pp 174- 177.
Clarke C. B. 1882. In: Hook. f. Flora of British India. Volume 3: 457.
Culley TM and Wolfe AD, 2001. Population genetic structure of the cleistogamous
plant species Viola pubescens Aiton (Violaceae), as indicated by allozyme and
ISSR molecular markers. Heredity, 86: 545-556.
Demesure B, Sodzi N, Petit RJ. 1995. A set of universal primers for amplification of
polymorphic noncoding regions of mitochondrial and chloroplast DNA in plants.
Mol. Ecol., 4: 129- 131.
Demesure B, Comps B, Petit RJ. 1996. Chloroplast DNA phylogeography of
common beech (Fagus sylvatica L.) in Europe. Evolution, 50: 2515- 2520.
Deshpande AU, Apte GS, Bahulikar RA, Lagu MD, Kulkarni BG, Suresh HS, Singh
N, Rao MKV, Gupta VS, Pant A, Ranjekar PK, 2001. Genetic diversity across
the natural populations of three montane plant species from the WG, India
revealed by ISSR repeats. Mol. Ecol. 10: 2397-2408.
Dey AK, 1949. Proc. Nat. Inst. Sci. India, 8 (15): 409- 410.
Dholakia BB, Ammiraju JSS, Santra DK, Singh H, Katti MV, Lagu MD, Tamhankar
SA, RaoVS, Gupta VS, Dhaliwal HS and Ranjekar PK, 2001. Molecular markers
in analysis of protein content using PCR based markers in wheat. Biochem.
Genet., 39: 325- 338.
91

Dilger WC, 1952. The Brij Hypothesis as an explanation for the tropical faunal
similarities between the Western Ghats and the eastern Himalayas, Assam,
Burma and Malaya. Evolution, 6(1): 125-127.
Doran J, Charuhapattana B, Namsavat S and Brophy JJ. 1995. Effects of harvest
time on the leaf and essential oil yield in Eucalyptus camaldulensis. J. of
Essential Oil Res. 7: 627-632.
Doyle JJ and Doyle JL, 1987. A rapid DNA isolation procedure for small amount of
fresh leaf tissue. Phytochem Bull., 19: 11-15.
Dumolin- Lapegue S, Pemonge MH, Petit RJ, 1997. An enlarged set of consensus
primers for the study of organelle DNA in plants. Mol. Ecol., 6: 393- 397.
Dumolin- Lapague S, Pemonge M-H and Petit RJ, 1998. Association between
chloroplast and mitochondrial lineages in oaks. Mol. Biol. Evol. 15(10): 1321-
1331.
El Mousadik, Petit RJ, 1996. Chloroplast DNA phylogeography of the argan tree of
Morocco. Mol. Ecol. 5: 547- 555.
Esselmann EJ, Crawford DJ, Brauner S, Stuessy TF, Anderson GJ and Mario Silva
O, 2000. RAPD marker diversity within and divergence among species of
Dendroseris (Asteraceae: Lactuceae). Am. J. Bot. 87(4): 591- 596.
Everitt BS, 1986. The fascination of statistics: Chapter 4, Numerical approaches to
classification.eds. Brook RJ, Arnold GC, Hassard TH and Pringle RM. Marcel
Dekker, INC. 270 Madison Avenue, New York 10016. pp 51- 64.
Excoffier L, Smouse PE, and Quattro JM, 1992. Analysis of molecular variance
inferred from metric distances among DNA haplotypes: application to human
mitochondrial DNA restriction data. Genetics, 131: 479-491.
Fang DQ, Rose ML (1997) Identification of closely related citrus cultivars with ISSR
markers. Theor Appl Genet 95: 498-417.
Fineschi S, Taurchini D, Villani F and Vendramin GG. 2000. Choroplast DNA
polymorphism reveals little geographical structure in Castanea sativa Mill.
(Fagaceae) throughout southern European countries. Mol. Ecol. 9: 1495- 1503.
Frankel OH, Brown AHD and Burdon JJ (eds.), 1995. The conservation of plant
biodiversity, Cambridge University Press, New York, USA.
Gaudeul M, Taberlet P and Bottraud T, 2000. Genetic diversity in an endangered
alpine plant, Eryngium alpinum L. (Apiaceae), inferred from amplified fragment
length polymorphism markers. Mol. Ecol. 9: 1625- 1637.
92
Gielly L, Taberlet P, 1994. The use of chloroplast DNA to resolve plant phylogenies:
noncoding versus rbcl sequences. Mol. Biol. Evol. 11: 769- 777.
Gugerli F, Senn J, Anzidei M, Madaghiele A, Buchler C, Sperisen C, Vendramin
GG, 2001. Chloroplast microsatellites and mitochondrial nad1 intron 2 sequence
indicate congruent phylogenetic relationships among Swiss stone pine (Pinus
cembra), Siberian stone pine (Pinus sibirica), and Siberian dwarf pine (Pinus
pumila). Mol. Ecol. 10: 1489- 1497.
Gupta HP, 1971. Quaternary vegetational history of Ootacamund, Nilgiris, South
India. 1.Kakathope and Rees Corner. Palacobotanist, 20(1): 74- 90. Luchknow.
Gupta HP, 1989. Sholas in south Indian montane: Past, present and future. InProc.
Symp. ‘ Vistas in Indian Paleobotany’ (eds Jain KP and Tiwari RS). Vol. 38, pp
391- 403.
Hajra, P.K., and Mudgal, V. (eds) 1997. Plant diversity hotspots in India, an
overview. Botanical Survey of India, Calcutta, India.
Hamrick JL and Godt MJW, 1989. Allozymes diversity in plant species. In: A.H.D.
Brown, M.T. Clegg, A.L. Kahler, and B.S. Weir (eds) Plant Population Genetics,
Breeding and Genetic Resources, Sinauer, Sunderland, Massachusetts, USA. pp
43- 63.
Hedbergs O, 1969. Evolution and speciation in tropical high mountain flora. Biol J.
Linn. Soc. 1: 135- 148.
Heywood JS, 1991. Spatial analysis of genetic variation in plant populations. Ann.
Rev. Ecol. Syst., 22: 335- 355.
Clarke CB. In: Flora of British India. 1882. Vol. 3 L. Reeve and Co. Ltd., NR.
Ashford, Kent, England.pp456.
Hora SL, 1949. Satpura Hypothesis of the distribution of the Malayan fauna and flora
to peninsular India. Proc. Nat. Inst. Sci. India, 8 (15): 361- 367.
Ishida M, Okubo T, Koshimizu K, Daito H, Tokuda H, Kin T, Yamamoto T and
Yamazaki N. 1990. Topical preparations containing ursolic acid and/ or oleanolic
acid for prevention of skin cancer. Chem. Abstract. 113: 12173y.
Jain A, Pandit MK, Elahi S, Jain A, Bhaskar A and Kumar V. 2000. Reproductive
behaviour and genetic variability in geographically isolated populations of
Rhododendron arboretum (Ericaceae). Curr. Sci. 9: 1377- 1381.
Janaki Ammal EK, 1950. Polyploidy in the genus Rhododendron. Rhododendron
yearbook, 5: 92- 98.
93
Jha CS, Dutt CBS and Bawa KS, 2000. Deforestation and land use change in
Western Ghats, India. Curr. Sci. 79: 231- 238.
Johansen AD and Latta RG, 2003. Mitochondrial haplotype distribution, seed
dispersal and patterns of postglacial expansion of ponderosa pine. Mol. Ecol. 12:
293- 298.
Joshi SP, Gupta VS, Aggarwal RK, Ranjekar PK, and Brar DS, 2000. Genetic
diversity and phylogenetic relationships as revealed by intersimple sequence
repeat (ISSR) polymorphism in the genus Oryza. Theor. Appl. Genet., 100: 1311-
1320.
Katerina K, Sarka S and Kristina P. SaCas,P: Proceedings of 9th International
Conference of Horticulture. 2001. Vol. 2: 339- 342.
King RA, Ferris C. 1998. Chloroplast DNA phylogeography of Alnus glutinosa (L.)
Gaerth. Mol. Ecol., 7: 1151- 1161.
Lacerda DR, Acedo MDP, Lemos Filho JP, Lavota MB. 2001. Genetic diversity and
structure of natural populations of Plathymenia reticulata (Mimosoideae), a
tropical tree from the Brazilian Cerrado. Am. J.Bot. 10: 1143-1157.
Langercrantz U, Ellegren H, Andersson L, 1993. The abundance of various
polymorphic microsatellite motifs differs between plants and vertebrates. Nucl.
Acids Res. 21: 1111
Laurent V, Risterucci AM, Lanaud C, 1993. Chloroplast and mitochondrial DNA
diversity in Theobroma cacao. Theor. Appl. Genet. 87: 81-88.
Lee Am, Mok HYI, Lee RS. 1977. Plant sterols as cholesterol lowering agents:
clinical trials in patients with hypercholesterolemia and studies of sterol balance.
Atherosclerosis. 28: 325- 338.
Li Z and Nelson RL, 2001. Genetic diversity among soyabean accessions from three
countries measured by RAPDs. Crop Sci., 41: 1337- 1347.
Loveless MD, Hamrick JL, 1984. Ecological determinants of genetic structure in
plant populations. Ann. Rev.Ecol. Syst. 15: 65-95.
Lynch M, and Milligan BG, 1994. Analysis of population genetic structure with
RAPD markers. Mol. Ecol., 3: 91- 99.
Mantel NA, 1967. The detection of disease clustering and a generalized regression
approach. Cancer Res., 27: 209- 220.
94
Mariette S, Chagne D and Lezier C et al, 2001. Genetic diversity within and among
Pinus pinaster populations: comparision between AFLP and microsatellite
markers. Heredity, 86: 469- 479.
Matolweni LO, Balkwill K and McLellan T, 2000. Genetic diversity and gene flow
in the morphologically variable, rare endemics Begonia dregei and Begonia
homonyma (Begoniaceae). Am. J. Bot. 87(3): 431- 439.
Medlicot HB and Blanford WT, 1879. A manual of geology of India. 2 vols.
Calcutta.
Meher- Homji VM, 1972. Himalayan plants of South Indian hills : role of pleistocene
glaciation vs. long distance dispersal. Science and Culture, 38: 8-12.
Meher-Homji VM, 1975. On the montane species of Kodaikanal, South India.
Phytocoenologia, 2: 28-39.
Middleton DJ and Wilcock CC, 1990. Chromosome counts in Gaultheria and related
genera. Edinb. J. Bot., 47(3): 303- 313.
Middleton DJ, 1993. A systematic survey of leaf and stem anatomical characters in
the genus Gaultheria and related genera (Ericaceae). Botanical Journal of the
Linnean Society, 113: 199- 215.
MoEF, 1999. National policy and macrolevel action strategy on biodiversity. New
Delhi: Ministry of Environment and Forests, Government of India.
Mohanty A, Martin JP, Aguinagalde I, 2000. Chloroplast DNA diversity within and
among populations of the allotetraploid Prunus spinosa L. Theor. Appl. Genet.
100: 1304- 1310.
Mohanty A, Martin JP, Aguinagalde I, 2001a. A population genetic analysis of
chloroplast DNA in wild populations of Prunus avium L. in Europe. Heredity, 87:
421- 427.
Mohanty A, Martin JP, Aguinagalde I, 2001b. Chloroplast DNA study in wild
populations and some cultivars of Prunus avium L. Theor. Appl. Genet. 103:
112- 117.
Mohanty A, Martin JP, Aguinagalde I, 2002. Population genetic analysis of European
Prunus spinosa (Rosaceae) using chloroplast DNA markers. Am. J. Bot. 89 (8):
1223- 1228.
Mohanty A, Martin JP, Gonzalez LM, Aguinagalde I, 2003. Association between
chloroplast and mitochondrial DNA haplotypes in Prunus spinosa L. (Rosaceae)
populations across Europe Annals Bot. 92: 749- 755.
95

Muller- Scha Rer H, Fischer M. 2001. Genetic structure of the animal weed Seneco
vulgaris in relation to habitat type and population size. Mol. Ecol. 10: 17-28.
Murthy KS and Babu MR, 1972. Chemical investigation of the leaves of Gaultheria
fragrantissima Wall. The Indian Journal of Pharmacy. 125.
Myers N, Mittermeier RA, Mittermeier CG, da Fonseca GAB, Kent J, 2000.
Biodiversity hotspots for conservation priorities. Nature, 403: 853- 858.
Nair NC, Daniel P, 1986. Florestic diversity of Western Ghats and its conservation: a
review. Proceedings of Indian Academy of Science (Plant Science), Suppl. 127-
163.
Nan P, Shi S, Peng S, Tian C and Zhong Y, 2003. Genetic diversity in Primula
obconica (Primulaceae) from central and south-west China as revealed by ISSR
markers. Annal. Bot., 91: 329- 333.
Narain P, 2000. Genetic diversity- Conservation and assessment. Curr. Sci. 79 (2):
170- 175.
Nei, M. 1973. Analysis of gene diversity in subdivided populations. Proc. Natl. Acad.
Sci. U.S.A. 70: 3321-3323.
Nei, M. 1977. F--Statistics and analysis of gene diversity in sub-divided populations.
Annal. Hum. Genet. 41: 225--233.
Newton AC, Allnutt TR, Gillies ACM, Lowe AJ and Ennos RA, 2000. Molecular
phylogeography, intraspecific variation and the conservation of tropical tree
species. Trends in ecology and evolution, 14: 140- 145.
Nybom, H., and Bartish, I.V. 2000. Effects of life history traits and sampling
strategies on genetic diversity estimates obtained with RAPD markers in plants.
Persp. Pl. Ecol. Evol. Syst. 3/2: 93--114.
Okaura T and Harada K, 2002. Phylogeographical structure revealed by chloroplast
DNA variation in Japanese Beech (Fagus crenata Blume). Heredity, 88: 322-
329.
Ouborg NJ, Piquot Y and Van Groenendael JM, 1999. Population genetics,
molecular markers and the study of dispersal in plants. J. Ecol. 87, 551- 568.
Palme A, Su Q, Rautenberg A, Manni F and Lascoux M, 2003. Postglacial
recolonization and cp DNA variation of silver birch, Betula pendula. Mol. Ecol.
12: 201- 212.
Palmer JD. 1987. Chloroplast DNA evolution and biosystematic uses of chloroplast
DNA variation. Am. Nat. 130: S6- S29.
96

Palmer JD. 1992. Mitochondrial DNA in plant systematics: applications and
limitations. In: Soltis PS, Soltis DE, Doyle W, eds. Mol. Syst. Pl. New York:
Chapman and Hall, pp- 36- 49.
Pappert RA, Hamrick JL and Donovan LA. 2000. Genetic variation in Pueraria
lobata (Fabaceae), an introduced, clonal, invasive plant of the southeastern
United States. Am. J. Bot. 87: 1240--1245.
Pascoe EH. 1963.In: Manual of geology of India and Burma. 3 volumes, Delhi.
Petit RJ, Kremer A and Wagner DB. 1993. Geographic structure of chloroplast DNA
polymorphisms in Europe oaks. Theor. Appl Genet. 87: 122- 128.
Petit RJ. 1999. Diversite Genetique et Historie des Populations d Arbres Forestiers.
Dossier d habilitation a diriger des recherches. Universite de Paris- Sud,
Universite Formation de Recherche Scientifique d Orsay, Paris.
Pons O, Petit RJ. 1995. Estimation, variance and optimal sampling of gene
diversity1. Haploid locus. Theor. Appl. Genet. 90: 462- 470.
Pons O, Petit RJ. 1996. Measuring and testing genetic differentiation with ordered
versus unordered alleles. Genetics 144: 1237- 1245.
Procter and Cahours. 1844. Ann. Chim. Phys. 10: 327.
Rajesh PN, Sant VJ, Gupta VS, Muehlbauer FJand Ranjekar PK.2001. Genetic
relationships among annual and perennial wild species of Cicer using ISSR
polymorphism. Euphytica. 129: 15- 23.
Rajguru SN. 1969. Quaternaria, 11, 241- 253.
Rana, M.K., and Bhat, K.V. 2004. A comparison of AFLP and RAPD markers for
genetic diversity and cultivar identification in cotton. J Pl. Biochem. Biotech. 13:
19-24.
Randhwa MS, 1945. Progressive desiccation of northern India in historical times. J.
Bombay Nat. Hist. Soc., 45: 558.
Randhwa MS. 1945. Progressive desiccation of northern India in historical times. J
Bombay Nat. Hist. Soc. 45: 558.
Rao RR. 1993. Floristic diversity of Eastern Himalayas- A national heritage for
conservation. In:U. Dhar (Ed.), Himalayan Biodiversity, Nainital, pp 139.
Rao RR. 1994. In:Biodiversity in India: Floristic aspects. Dehra Dun: Bishen Singh
mahendra Pal Singh.
Rebound X, and Zeyl C. 1994. Organelle inheritance in plants. Heredity 72: 132-
140.
97
Reico MC, Giner R, Terencio M, Sanz M and Rios J. 1991. Anti inflammatory
activity of Helichrysum stoechas. Plants Medica. 57 (2A56- A57).
Rhoads DD, Roufa DJ. 1991. Shareware program obtained from EMBL, Heidelberg,
Germany (Seqaid 3.81).
Ribeiro MM, Mariette GG, Vendramin AE, Polmion C and Kremer A, 2002.
Comparision of genetic diversity estimates within and among populations of
maritime pine using chloroplast simple- sequence repeat and amplified length
polymorphism data. Mol.Ecol. 11, 869- 877.
Ribnicky DM, Poulev A and Raskin I. 2003. The determination of salicylates in
Gaultheria procumbens for use as a natural aspirin alternative. J. Nutraceuticals,
Func. And Med. Foods. 4: 39- 52.
Rodgers WA, Panwar HS and Mathur VB, 2000. Wildlife protected area network in
India: a review (executive summary) Dehra Dun: Wildlife Institute of India.
44pp.
Rohlf FJ 1989. NTSYS- pc Numerical taxonomy and multivariate analysis system.
Exeter Publishing Company Ltd., Setauket, New York.
Rossetto M, Weaver PK, and Dixan K.W. 1995. Use of RAPD analysis in devising
conservation strategies for the rare and endangered Grevillae scapigerea
(Proteaceae). Mol. Ecol. 4: 321-329.
Saiki RK, Gelfand DH, Stoffel S, Scharf SJ, Higuchi R, Horn GT, Mullis KB and
Erlich HA. 1988. Primer directed enzymatic amplification of DNA with a
thermostable DNA polymerase. Nature. 239: 487- 497.
Sales E, Nebaure SG, Mus M, and Segura J. 2001. Population genetic study in the
Balearic endemic plant species Digitalis minor (Scrophulariaceae) using RAPD
markers. Am.. J. Bot. 88: 1750--1759.
Sambrook J, Fritsch EF and Maniatis T. 1989. In: Molecular cloning: A laboratory
manual (2nd edition) Cold Spring Harbor Laboratory Press. Cold Spring Harbor,
New York.
Schnabel A and Asmussen MA. 1989. Definition and properties of disequilibria
within nuclear- mitochondrial- chloroplast and other nuclear- dicytoplasmic
systems. Genetics. 123: 199- 215.
Sewell MM, Parks CR, Chase MW. 1996. Intraspecific chloroplast DNA variation
and biogeography of north American Liriodendron L. (Magnoliaceae). Evolution
50: 1147- 1154.
98
Singh HP and Sarkar S. 1990. Vegetational dynamics of tertiary Himalaya.
Paleeobotanists. 38: 333- 344.
Skoula M, Hilali IE and Makris M. 1999. Evaluation of genetic diversity of Salvia
fruticosa Mill. Clones using RAPD markers and comparision with essential oil
profiles. Biochem. Syst. Ecol. 27: 559- 568.
Soltis DE, Soltis PS, Kuzoff RK, Tucker TL. 1992. Geographic structuring of
chloroplast DNA genotypes in Tiarella trifoliate (Saxifragaceae). Plant Syst.
Evol. 181: 203- 216.
Sperisen C, Buchler U, Gugerli F, Matayas T, Geburke, Vendramins GG. 2001.
Tandem repeats in plant mitochondrial genomes: application to the analysis of
population differentiation in the conifer Norway spruce. Mol. Ecol. 10: 257- 263.
Taberlet P, Gielly L, Pautou G, Bouvet J. 1991. Universal primers for amplification
of three noncoding regions of chloroplast DNA. Plant Mol. Biol. 17: 1105- 1109.
Takhtajan A. 1969. Flowering plants, origin and dispersal. Edinb.: Tr. Jeffrey.
Tomaru N, Takahashi M, Tsumura Y, Takahashi M, Ohba K. 1998. Intraspecific
variation and phylogeograhic patterns of Fagus crenata (Fagaceae) mitochondrial
DNA. Am. J. Bot. 85(5): 629- 636.
Tzen- Yuh C, Schaal BA, Ching I P. 1998. Universal primers for amplification and
sequencing a noncoding spacer between the atpB and rbcL genes of chloroplast
DNA. Bot. Bullet. Acad. Sinica 39: 245- 250.
Upadhyay RR. 1999. Ecological problems due to shifting cultivation. Curr. Sci. 77:
1246- 1250.
Vos P, Hogers R, Bleeker M, Reijans M, Van de Lee T, Hornes M, Frijters A, Pot J,
Peleman T, Kuiper M and Zabeau M. 1995. Nucl. Acid Res. 23: 4407- 4414.
Wallich. 1820. In Asiat. Res. 13: 397.
Weising K, Nybom H, Wolff K and Meyer W, 1995. DNA fingerprinting in plants
and fungi. CRC press, Boca raton, FL.
Williams JGK, Kubelik AR, Livak KJ, Rafalski JA and Tingey SV. 1990. DNA
polymorphisms amplified by arbitrary primers are useful as genetic markers.
Nucl. Acid Res. 18: 6531- 6535.
Wolf AT, Howe RW, and Hamrick J.L. 2000 Genetic diversity and population
structure of the serpentine endemic Calystegia collina (Convolvulaceae) in
northern California. Am. J. Bot. 87: 1138-1146.
99

Wolfe KH, Li WH, Sharp PM. 1987. Rates of nucleotide substitution vary greatly
among plant mitochondrial, chloroplast and nuclear DNA. Proc.Nat. Acad. Sci.
USA 84: 9054- 9058.
Wolfe AD, Xiang Q and Kephart SR. 1998. Assessing hybridization in natural
populations of Penstemon (Scrophuariaceae) using hypervariable intersimple
sequence repeat (ISSR) basis. Mol. Ecol. 7: 1107-1125.
Wolfe AD, Randle, CP. 2001. Relationships within and among species of the
holoparasitic genus Hyobanche (Orobanchaceae) inferred from ISSR banding
patterns and nucleotide sequences. Syst. Bot. 26: 120- 130.
Wright, S. 1931. Evolution in Mendelian populations. Genetics 16: 97-159.
Yap IV and Nelson R. J. 1996. Winboot: A program for performing bootstrap
analysis for binary data to determine the confidence limits of UPGMA-based
dendrograms. International Rice Research Institute: Discussion paper series
number 14.
Zaletova N, Shchavlinskii A, Tolkachev O, Vichkanov S, Fateeva, Krutikov N,
Yartseva I and Klyuev N. 1987. Preparation of some derivatives of ursolic acid
and their antimicrobial activity. Chemical Ab. 106, 18867e.
Zietkiewicz E, Rafalski A and Labuda D. 1994. Genome fingerprinting by simple
sequence repeat (SSR) anchored polymerase chain reaction amplification.
Genomics, 20: 176- 183.
www.anthropologie.unige.ch/ftp/ comp
www.berkywellness.com
www.commonwealthknowledge.net
www.geog.ouc.bc.ca
www.gisdevelopement.net
www.nationalgeographic.com
www.nutripharm.net
www.pbs.org
www.sportsbalm.conz/amrutanjan_liquid_balm.htm
www.worldwildlife.org
100

101
Curriculum Vitae

102

Mrs. Gauri Apte Personal Details Date of Birth: 26 August 1973 Nationality: Indian Email: [email protected]
Contact Address
c/o Mr. Salil Apte, Mercator, Al Fattan Plaza 8th floor, PO Box no. 686, Dubai, UAE Phone : 971-06-5569121 Mobile: 971-05-4830354
Education B.Sc. (Microbiology) from University of Pune, India, with first class M.Sc. (Microbiology) from University of Pune, India, with first class Ph.D. thesis title: “Genetic diversity analysis in Gaultheria fragrantissima Wall. from the two biodiversity hotspots in India using molecular markers”. Postgraduation dissertation title “Bacterial deterioration of metal working fluids: Studies on aspects of biocide evaluation.” Awards Awarded Senior Research Fellowship by Council of Scientific and Industrial Research, Government of India (CSIR). Presentations and Poster 1) Apte G S, Lagu MD, Ranjekar PK and Gupta VS. Study of chloroplast and
mitochondrial DNA diversity in the natural populations of Gaultheria fragrantissima in the two hotspots in India. 11th New Phytologists Symposium. Plant speciation at Plant Canada, Antagonish. June 26- 28, 2003.
2) Apte G S, Lagu MD, Kulkarni BG, Suresh HS, Rao MKV, Ranjekar PK Gupta
VS. Chloroplast and mitochondrial DNA diversity studies in Gaultheria fragrantissima from the two hotspots in India. IUPAC International Conference on Biodiversity and Natural Products: Chemistry and Medical Applications, New Delhi, January 26- 31, 2004.
3) Attended International conference “ NEEM 2002” in Mumbai.
101
Seminars Presented during Postgraduation 1) Growth of Mosaic virus-free sugarcane plants from Apical meristems.
Reference : Indian Phytopathology (June 1975) 2) Decolourisation of Pulp & paper mill effluent by growth of Aspergillus Niger.
Reference : World Journal of Microbiology & Biotechnology (January 1990) 3) Cytogenetic studies reveal increased genomic damage among ‘Pan Masala’
consumers. Reference : Mutagenesis (November 1990)
4) A fibre optic carbon dioxide sensor for fermentation monitoring.
Reference : Biotechnology (June 1995) Publications 1. Deshpande AU, Apte GS, Bahulikar RA, Lagu MD, Kulkarni BG, Suresh HS,
Singh N, Rao MKV, Gupta VS, Pant A, Ranjekar PK. ( 2001). Genetic diversity across the natural populations of three montane plant species from the WG, India revealed by ISSR repeats. Molecular Ecology 10: 2397-2408.
2. Joshi SP, Bhave SG, Chowdari KV, Apte GS, Dhonukshe BL, Lalitha K, Ranjekar PK and Gupta VS (2001). Use of DNA markers in the prediction of hybrid performance and heterosis for a three- line hybrid system in rice. Biochemical Genetics, 39 (5/6): 179- 200.
3. Deshpande A D, Ramakrishna W, Mulay G P, Gupta V S and RanjekarPK.
(1999). Phylogenetic analysis and molecular evolution of knotted-1 homeobox genes. Theoretical and Applied Genetics 99,1-2:203-209.
4. Deshpande A D, Ramakrishna W, Mulay G P, Gupta V S and Ranjekar P K. (1998). Evolutionary and polymorphic organization of knotted1 homeobox in cereals. Theoretical and Applied Genetics 97:135-140
Publications (Communicated) 1. Apte G S, Bahulikar R A, Lagu MD, Kulkarni BG, Suresh HS, Rao MKV,
Ranjekar PK, Gupta VS. Genetic diversity analysis in Gaultheria fragrantissima from the two hotspots in India using ISSR markers. Communicated to Taxon.
2. Apte G S, Lagu MD, Kulkarni BG, Suresh HS, Rao MKV, Ranjekar PK Gupta
VS. Chloroplast and mitochondrial DNA diversity studies in Gaultheria fragrantissima from the two hotspots in India. Communicated to Annals of Botany.
102