mrsaustinsmathclasssite.files.wordpress.com · web viewa newspaper reporter randomly chooses 100...
TRANSCRIPT
Name: _______________________________Chapter 7 – Test Review
The list shows the top speeds of various land animals.35, 29, 14, 19, 32, 25, 27, 16, 8
1. Make a cumulative frequency table of the data.Scale Frequency Cumulative Frequency
2. Make a stem-and-leaf plot of the data.STEM LEAF
3. Make a line plot of the data.
The list shows the life spans in years of vampire bats in captivity.48, 39, 27, 52, 45, 47, 49, 37
4. Find the mean, median, mode and range of the data. Round you answers to the nearest tenth of a year.

Use the histogram for problems 6-8.
Use the circle graph fro problems 10 and 11.5. Did more people choose purple or
yellow as their favorite color?
6. Out of 100 people surveyed, 35% chose blue as their favorite color. How many people chose blue?
Determine whether each sample may be biased. Explain.7. A newspaper reporter randomly chooses 100 different people walking down the street to
find out their favorite dessert.
8. The first 25 teenagers exiting a clothing store are surveyed to find out what types of clothes teenagers like to buy.
1. How many more students scored between 85 and 94 than between 70 and 79?
2. What is the approximate median final exam score for the students shown in the histogram?
Use the following data to make a box-and whisker plot.9. 33, 38, 43, 30, 29, 40, 51, 27, 42, 23, 31
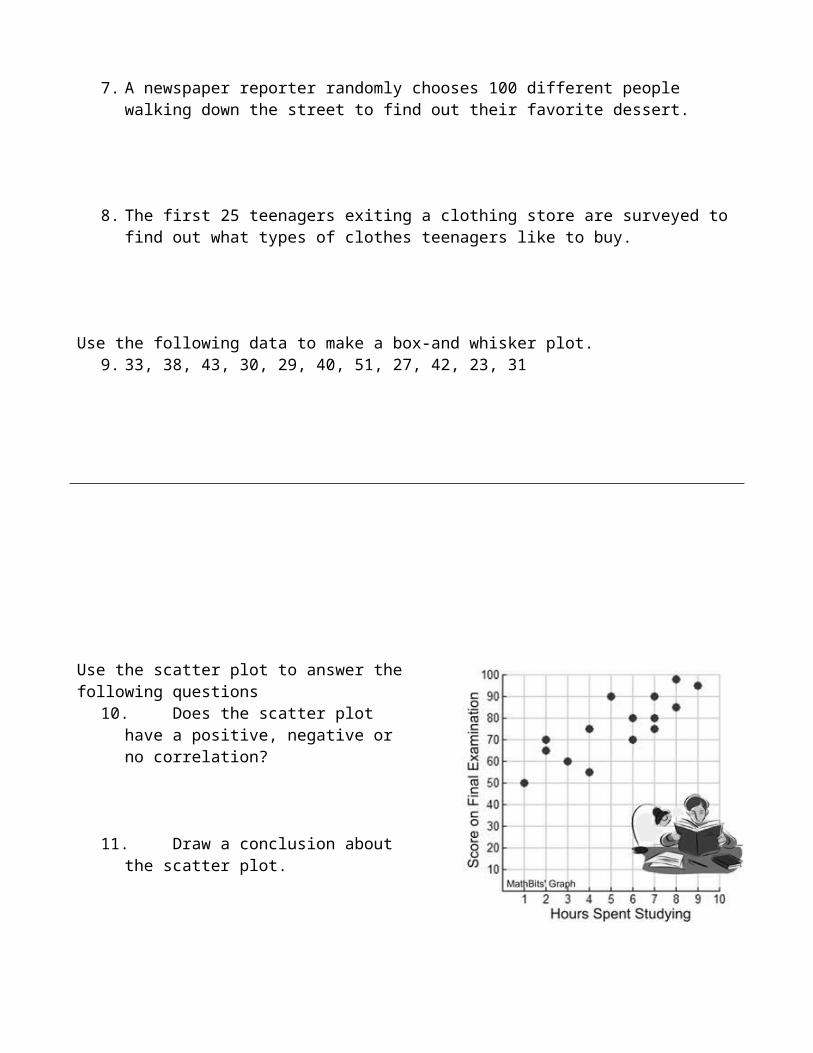
Use the scatter plot to answer the following questions10. Does the scatter plot have a positive,
negative or no correlation?
11. Draw a conclusion about the scatter plot.