mrv requirements from an implementation perspective · •concrete collaborations proposal with...
TRANSCRIPT

MRV requirements from an implementation perspective
Inge Jonckheere FAO Forestry, UN-REDD
21 September 2015 Bonn, Germany

z
FAO Forestry
FAO and its role in REDD+
FAO’s key role in REDD+ readiness is to help countries develop, implement and operationalize their National Forest Monitoring System (NFMS)
FAO also assists countries in conceptualizing and implementing REDD+ activities and in the development of policies and measures
National ownership Alignment with the UNFCCC process Step-wise approach that allows for improvement over time Builds upon existing capacities, available data and systems in place Use of open-source, freely available data and tools as much as possible Strengthening of national capacities (learning-by-doing) No one-fits-all approach: country tailoring is key
Key principles of FAO’s support
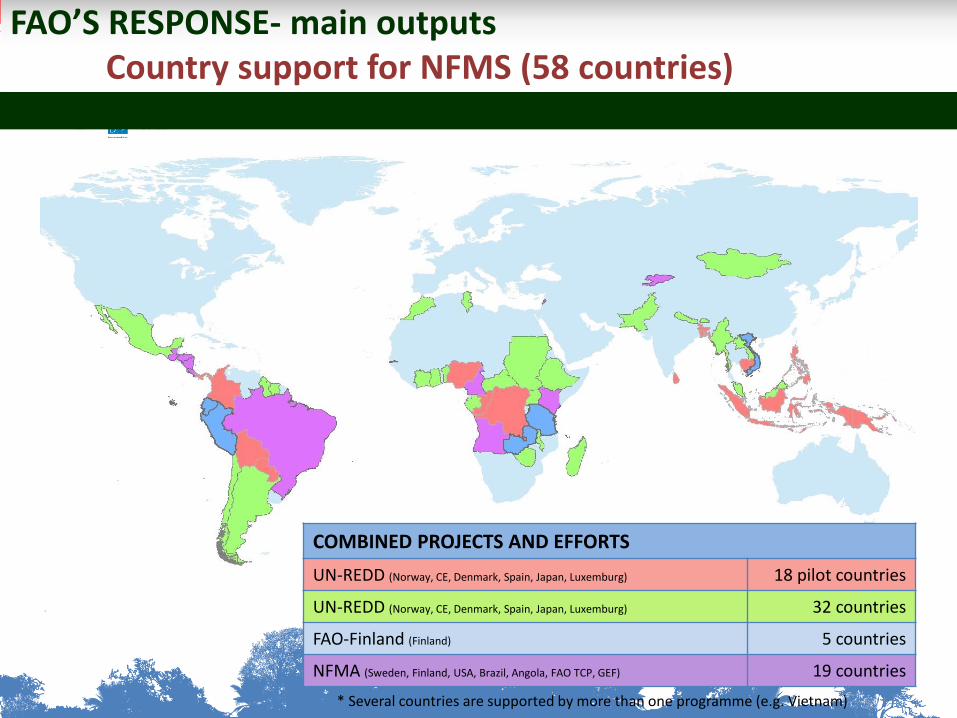
FAO’S RESPONSE- main outputs Country support for NFMS (58 countries)
COMBINED PROJECTS AND EFFORTS
UN-REDD (Norway, CE, Denmark, Spain, Japan, Luxemburg) 18 pilot countries
UN-REDD (Norway, CE, Denmark, Spain, Japan, Luxemburg) 32 countries
FAO-Finland (Finland) 5 countries
NFMA (Sweden, Finland, USA, Brazil, Angola, FAO TCP, GEF) 19 countries
* Several countries are supported by more than one programme (e.g. Vietnam)

A simple concept for calculating emissions
Emissions in CO2 eq. calculated by: – The emissions and removals
estimates through the national GHG inventory can be calculated through
– Collecting Activity Data through a satellite-based land monitoring system
– Using emission factors (e.g default IPCC Tier 1) or gather information to obtain emission factors through the national forest inventory (NFI)

MRV for REDD+
IPCC method for Emission Estimates
Forest carbon stock change data
from a national forest inventory
EMISSION FACTOR
Area change data from satellite
remote sensing
ACTIVITY DATA
2005
Inventory of greenhouse gas emissions from the forest sector
CO2
EMISSIONS ESTIMATE
MEASUREMENT
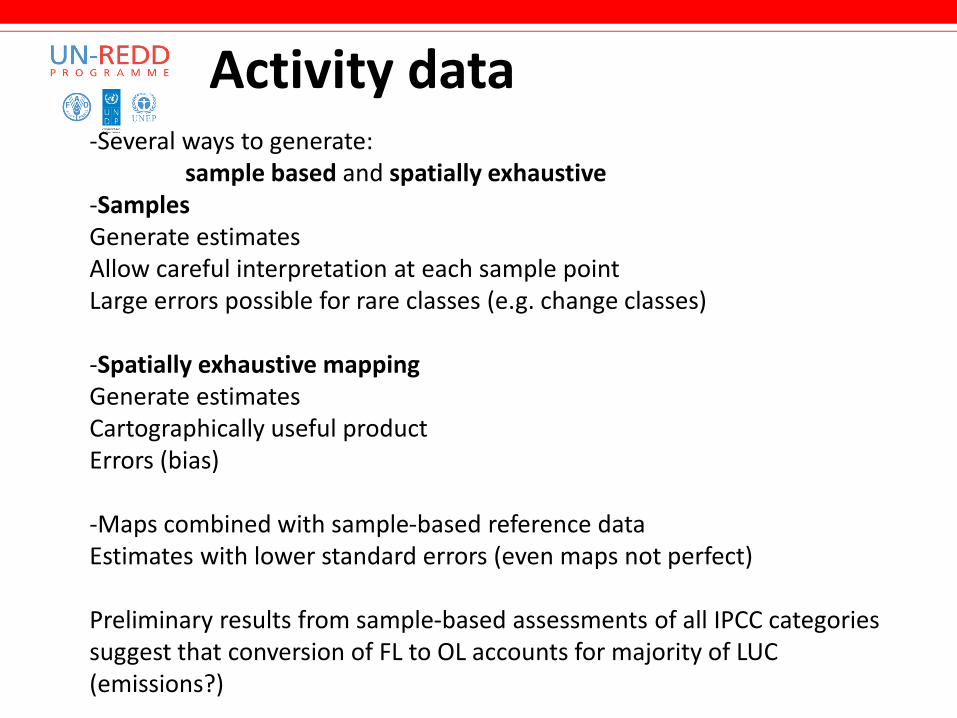
Activity data -Several ways to generate: sample based and spatially exhaustive -Samples Generate estimates Allow careful interpretation at each sample point Large errors possible for rare classes (e.g. change classes) -Spatially exhaustive mapping Generate estimates Cartographically useful product Errors (bias) -Maps combined with sample-based reference data Estimates with lower standard errors (even maps not perfect) Preliminary results from sample-based assessments of all IPCC categories suggest that conversion of FL to OL accounts for majority of LUC (emissions?)

Activity data
Mainly through satellite data for deforestation
No common approach yet for forest degradation, several countries experimenting
Deforestation:
Degradation:
• Medium-resolution imagery (Landsat)
• High-resolution imagery
• Land registry (cadaster)
• High-resolution imagery (RapidEye)
• Testing Landsat-NDVI combination • Timber records or management
plans (volume harvested, species, collateral damage, skid trails, …)
• Fuelwood extraction statistics
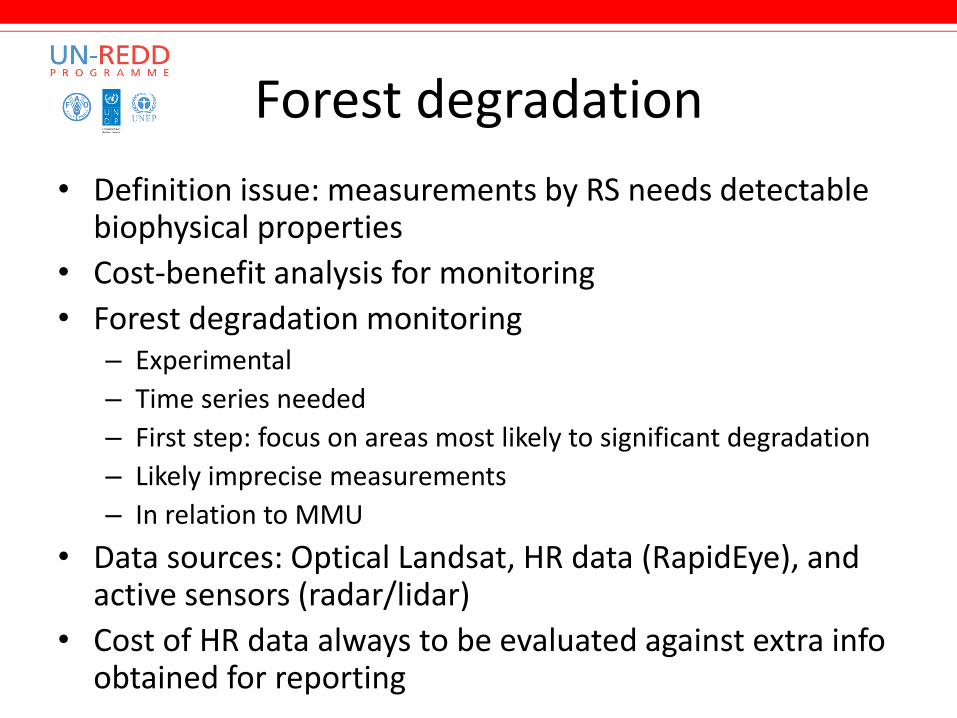
Forest degradation
• Definition issue: measurements by RS needs detectable biophysical properties
• Cost-benefit analysis for monitoring
• Forest degradation monitoring – Experimental
– Time series needed
– First step: focus on areas most likely to significant degradation
– Likely imprecise measurements
– In relation to MMU
• Data sources: Optical Landsat, HR data (RapidEye), and active sensors (radar/lidar)
• Cost of HR data always to be evaluated against extra info obtained for reporting
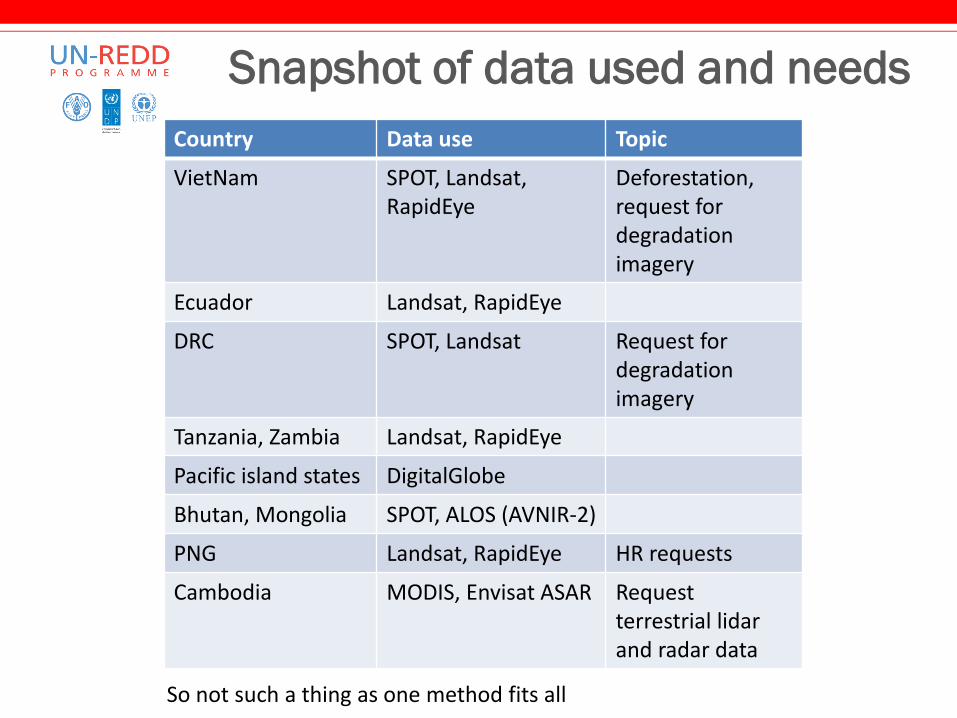
Country Data use Topic
VietNam SPOT, Landsat, RapidEye
Deforestation, request for degradation imagery
Ecuador Landsat, RapidEye
DRC SPOT, Landsat Request for degradation imagery
Tanzania, Zambia Landsat, RapidEye
Pacific island states DigitalGlobe
Bhutan, Mongolia SPOT, ALOS (AVNIR-2)
PNG Landsat, RapidEye HR requests
Cambodia MODIS, Envisat ASAR Request terrestrial lidar and radar data
Snapshot of data used and needs
So not such a thing as one method fits all

Experience in-country
Not promote specific tools/data sets but provide overview of available options
Help governments make informed decisions (World bank Decision tool)
Support country decisions and tailor best available approaches while maintaining consistency and comparability of results
Heavy reliance on complex & costly technology may not be in all developing countries’ best interest
Open source, free software and data set that meet REDD+ requirements are available. If not, new tools can be developed
• Access to technology is quite limited, particularly for remote-sensing technologies and data
• The basics are often missing (e.g. steady electricity, high-speed internet, performing computers, software packages)
– Certain technologies are costly (e.g. HR images, Lidar, commercial software packages), limiting large-scale deployment and sustainability

FAO experience in National Forest Monitoring
• Decades of experiences supporting countries on forest monitoring
• Assist countries to manage & analyse own data
• Country needs and constraints paramount
• Build on experience of best-of-class systems
• Build capacity through automation of key processes:
Methodology and
Design
Database
Customization
Data Entry Data Processing
Data Collection
Reporting
Visualization
Dissemination
Data Extraction
Data Integration
Fig.8: Key processes for the data analysis
Expert consultation & networking
Continuous development and updating of manuals and guidelines
COLLECT CALC
Source: Romeijn et. al. 2012 Assessing capacities of non-Annex I countries for national forest monitoring in the context of REDD+ . Environmental Science and Policy 19–20 (2012) 33–48.
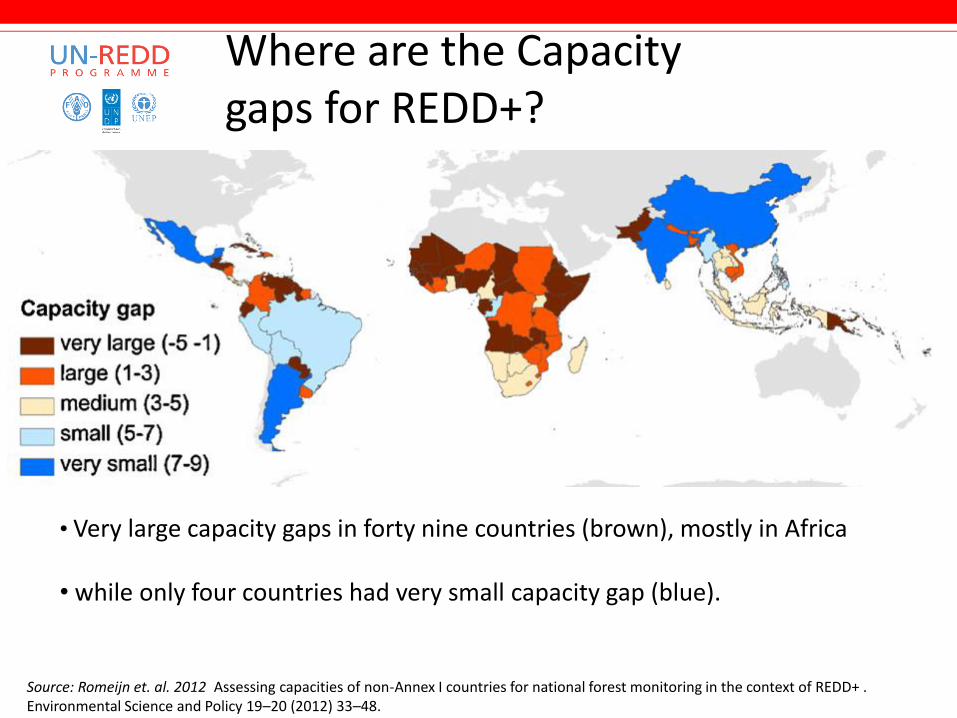
Where are the Capacity gaps for REDD+?
• Very large capacity gaps in forty nine countries (brown), mostly in Africa • while only four countries had very small capacity gap (blue).

Image Processing

FAO Forestry
Open source image processing Linux / Mac / Cygwin compatible Command line Pixel or object-based image analysis Updated regularly Wiki and example exercises www.openforis.org
http://www.fao.org/forestry/fma/openforis/en/
Open Foris Satellite data processing

Problem – Actual Situation
• Data is free but still disaggregated and can be non-intuitive to search, query and download
• Software is free but complicated to maintain
• Computers are cheaper but infrastructure required for high performance processing is challenging for developing nations
• Internet is ubiquitous but many ministry departments have challenges to access

SEPAL Cloud computing structure
(SEPAL)
Main Points • SEPAL is a MRV catalyst
• Allows easy and fast query, access and processing of earth observation data
• Expandable with user inputs
• Efficient processing anywhere in the world
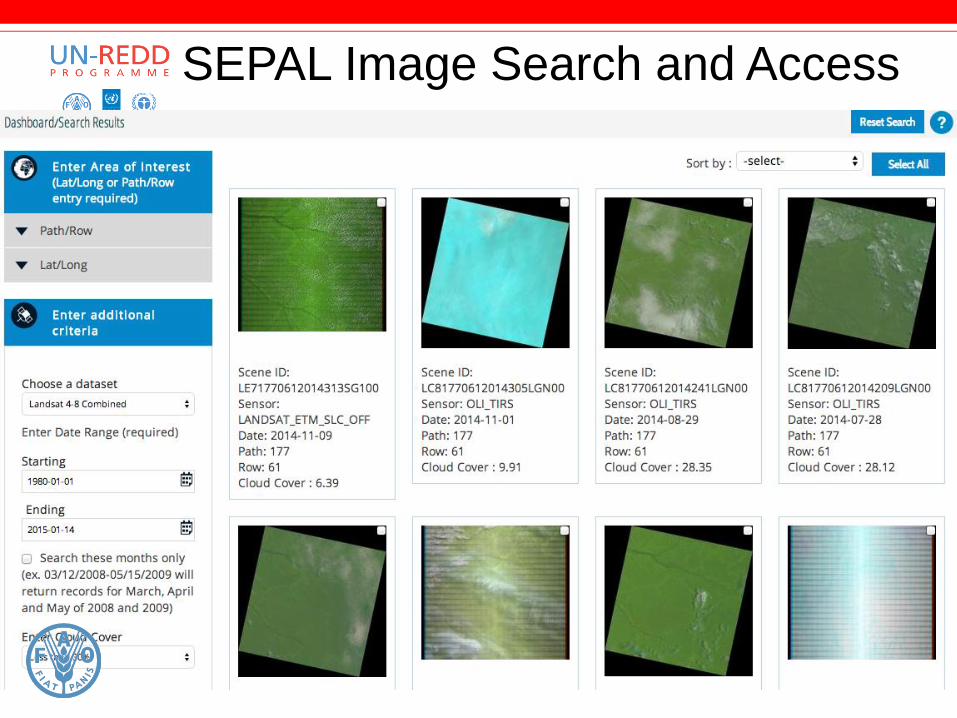
SEPAL Image Search and Access
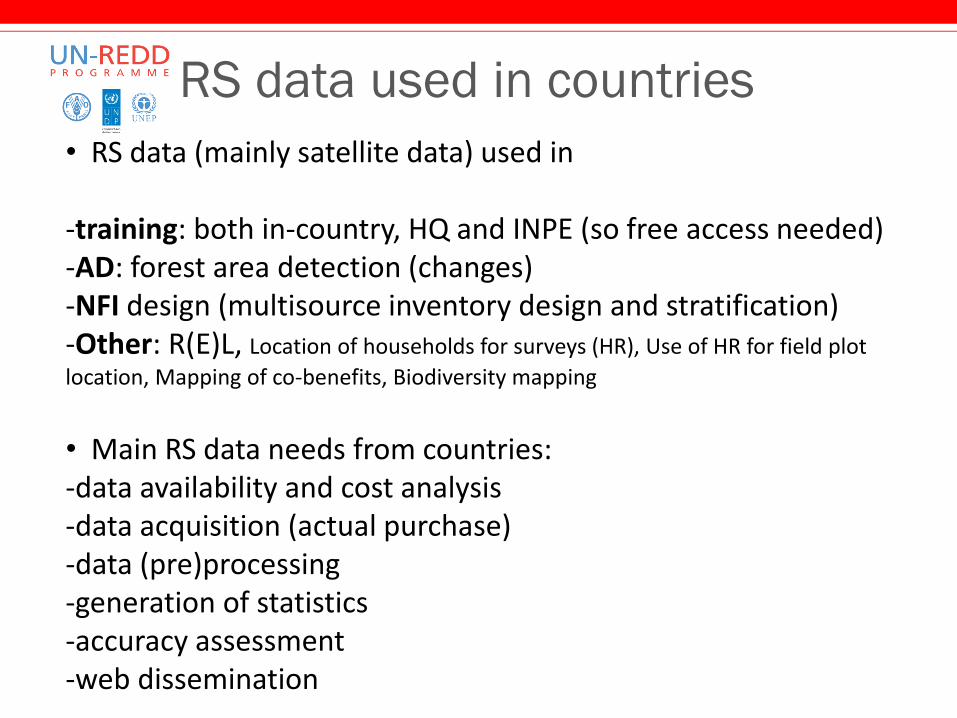
RS data used in countries
• RS data (mainly satellite data) used in
-training: both in-country, HQ and INPE (so free access needed) -AD: forest area detection (changes) -NFI design (multisource inventory design and stratification) -Other: R(E)L, Location of households for surveys (HR), Use of HR for field plot
location, Mapping of co-benefits, Biodiversity mapping
• Main RS data needs from countries: -data availability and cost analysis -data acquisition (actual purchase) -data (pre)processing -generation of statistics -accuracy assessment -web dissemination

RS trainings, technical consultations
and remote support Capacity building
• One or two weeks training in country
• 10 to 20 technical experts from Ministries
• Experts from FAO (FRA, FAO-FIN & UN-REDD, BMU)
• Free available software and open-source tools (TerraAmazon & Open Foris)
Results • Development of methodologies for forest
monitoring adapted to national context and documented in the OpenForis wiki or national report
• National estimate of forest cover and forest
cover change
• Independent national assessment of map accuracy
• Knowledge exchange and network building • Autonomous and sustainable capacities to
manage, process and analyze satellite data
Technical consultations • Remote or in country review and
support to national satellite forest monitoring

RS using MGD document
• Easy-to-understand language and exercices package: no one fits all approach
• Overview methodologies and data requirements for RS using OpenForis and other open source initiatives
• Advantages and disadvantages methodologies
• Use of global products and linkages with other initiatives (WWF, WRI, USAID, Silvacarbon)
• Coordination and collaboration for RS capacity building
• MGD modules developed/under development
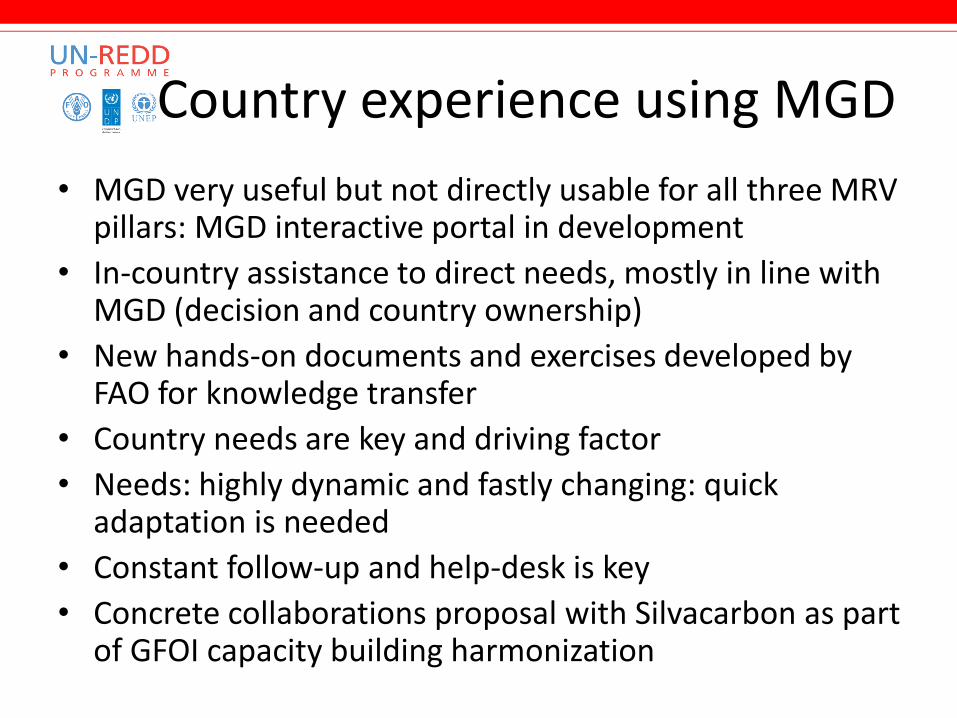
Country experience using MGD
• MGD very useful but not directly usable for all three MRV pillars: MGD interactive portal in development
• In-country assistance to direct needs, mostly in line with MGD (decision and country ownership)
• New hands-on documents and exercises developed by FAO for knowledge transfer
• Country needs are key and driving factor
• Needs: highly dynamic and fastly changing: quick adaptation is needed
• Constant follow-up and help-desk is key
• Concrete collaborations proposal with Silvacarbon as part of GFOI capacity building harmonization

FAO-INPE collaboration TerraAmazon introduced in developing countries:
• Free-of-charge and supported by analysis and programming teams in Brazil (Funcate) and FAO HQ
• Training on software utilities and Brazilian national forest monitoring techniques at INPE CRA Amazonia, Belem, Brazil
• Close collaboration BMU ICI, UN-REDD and INPE – 2015: Plug-ins (LCCS) in TerraAmazon
• Training material for radar training (first training end 2015)
• Follow-up and country implementation in FAO-HQ/country

Use of global data for national use • Hansen data in the REDD+ context :
1) Is available, so countries can use it when there is no other data available; 2) The quality of the data at local scales vary from place to place 3) Countries have the choice to use them as
– a) their national product without modification,
– b) their national product with some modification,
– c) an input to their national product,
– d) a validation dataset for their national product
• FAO Forestry : Landsat data for generating estimates of LCLU change at national scales. The results we get from our assistance to National counterparts should be at least similar in nature to those obtained by Hansen et al. (GFW also), maybe with a bit more focus on land use instead of solely land cover.
• FAO Forestry : quantitative assessments of all products intended for use as activity data inputs. This includes performing accuracy assessments and area adjustments to provide estimates on LC/LU and change.

Accuracy Assessment All maps have errors (bias) we must correct for these
Reference data are required of higher quality than data used to make map;
can be ‘better’ data, or ‘better’ interpretation
Accuracy assessment is NOT about assessing accuracy…per se accuracy is a relative term…what is acceptable?
Purpose is to generate new area estimates which correct for the bias in the map
which can be used alone to generate estimates
which can be used with map to generate ‘better’ estimates
which generate area estimates with confidence intervals
Strong collaboration with GFOI-Silvacarbon (Boston university), MGD component: proposal for online-training and joint workshops
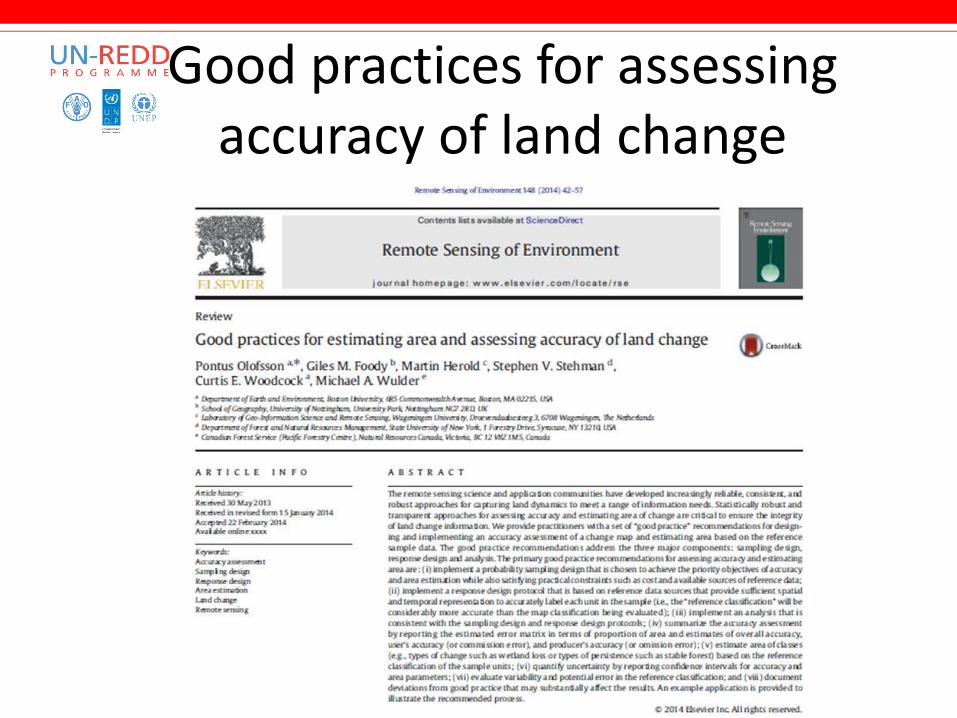
Good practices for assessing accuracy of land change

Current activities of accuracy assessment
• Case studies – Tanzania, Zambia, Democratic Republic of Congo,
Republic of Congo, Kenya, Ecuador, Panama • Practical use cases, ‘cookbook’ methods • UN-REDD FAO guidance document ‘Accuracy
assessment’ for countries • Integrating open source software and methods
– R scripts, Excel Spreadsheets, QGIS instructions
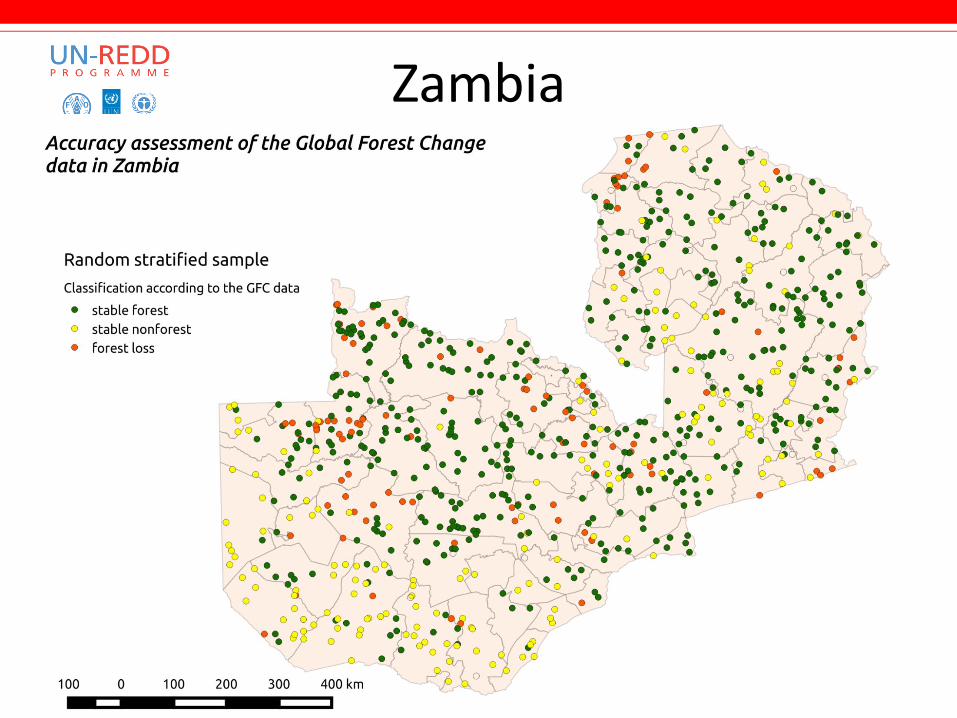
Zambia
28

Zambia
29

Lessons learned • A few dedicated individuals can make all the difference
– Use of international advisors hand-in-hand with national technicians
• Need to see capacity building in broader terms – Training of resilient national institutions and consultants – Mandate of institutions should be clear
• Integration NFI and RS • On-the-job training is key, in-country training
– Trainings are geared towards producing results – Essential to get faster delivery
• Sharing data and data access is crucial and key • Near-real time monitoring for early deforestation/degradation
warning (e.g. Global Forest Watch), not for reporting of AD purposes
• Resilience is often at risk – Easy to develop quickly elements of NFMS, but resilience will be lacking – Long-term commitment is required by government and partners in order
to secure sustainability

Useful supporting materials
UN-REDD: National Forest Monitoring Systems (NFMS):
– Monitoring and Measurement, Reporting and Verification (M & MRV) in the context of REDD+ Activities
UN-REDD: Emerging Approaches to Forest Reference Emission Levels and/or Forest Reference Levels for REDD+ (2013)
Forest reference levels (2015)
– presents examples of REDD+ Forest Reference Emission Levels and/or Forest Reference Levels being developed by countries
GEO – GFOI: Integrating remote-sensing and ground-based observations for estimation of emissions and removals of greenhouse gases in forests. Methods and Guidance from the Global Forest Observation Initiative

Thank You for your attention!
www.fao.org/forestry
www.un-redd.org