ms thesis lakshya mittal
TRANSCRIPT

ANALYSIS OF INCIPIENT DISCHARGE ACTIVITY IN
CRYOGENIC INSULATION STRUCTURES ADOPTING UHF
TECHNIQUE
A THESIS
submitted by
LAKSHYA MITTAL
for the award of the degree
of
MASTER OF SCIENCE
(By Research)
DEPARTMENT OF ELECTRICAL ENGINEERING
INDIAN INSTITUTE OF TECHNOLOGY MADRAS
CHENNAI-600 036, INDIA
JUNE 2015
ii
THESIS CERTIFICATE
This is to certify that the thesis entitled ANALYSIS OF INCIPIENT DISCHARGE
ACTIVITY IN CRYOGENIC INSULATION STRUCTURE ADOPTING UHF
TECHNIQUE, submitted by Lakshya Mittal to the Indian Institute of Technology Madras,
Chennai for the award of the degree of Master of Science (by Research) is a bonafide record
of research work carried out by him under my supervision. The contents of this thesis, in full
or in parts have not been submitted to any other Institute or University for the award of any
degree or diploma.
Research Guide
Place: Chennai Prof. R. SARATHI
Date : Department of Electrical Engineering
Indian Institute of Technology Madras
Chennai 600036, India.

iii
ACKNOWLEDGEMENTS
Foremost, I would like to express my sincere gratitude to my guide Prof. R. Sarathi for his
continuous support at every stage of the program. I feel privileged to have been associated
with him. Productive discussions and comments received from him have shown me the right
way. I am extremely indebted to him for his constant encouragement, unbounded enthusiasm
and interest, which have helped me in all the time of research and have inspired me a lot.
I thank Prof. Harishankar Ramachandran, the Head, Department of Electrical
Engineering, IIT Madras, for all his efforts to make the department a nice place to work.
I also take this opportunity to thank my Graduate Test Committee members Prof. Bharath
Bhikkaji and Prof. M. Manivannan, who monitored this work and provided me with
valuable suggestions regarding my research work.
I would like to express my gratitude to Prof. K. Sethupathi for providing me the facility for
getting Liquid Nitrogen and for motivating and encouraging continuously me towards my
research work.
I would never forget the company, encouragement and co-operation I had from my labmates,
Dr. Aravinth, Kushal Oza, Sugunakar, Merin Sheema, Sahitya, Sri Harsha, Animesh, Rashmi,
Rajkamal, Pavan, Venkatratnam, Vignesh, John, Balaji, Arun Kumar and Satish during my
stay in the laboratory.
It would be a great mistake if I do not mention the staff of High Voltage Laboratory, Mrs.
Malarvizhi, Mr. R. Chandrasekaran, Mr. P. Murugan, Mr. B. Athinarayanan and Mr. Divagar
for extending their valuable support from time to time. I wish to thank Mr. Sasidharan and
other staff members of Low Temperature physics lab for maintaining unbroken supply of
liquid nitrogen for my experiments.
Especially, no words can express my deep sense of gratitude towards my family for their
love, moral encouragement, support and sacrifice which enabled me to complete this course.
I thank all my batch mates who have attended various courses along with me. Finally, I
would like to thank all whose direct and indirect support helped me complete my thesis.
Lakshya Mittal

iv
ABSTRACT
KEYWORDS : liquid nitrogen, treeing, XLPE, cable insulation,barrier effect, Zero span
mode.
Invention of high temperature superconductor has attracted the power equipment
manufacturers and the researchers to design and develop super-conducting power apparatus with
liquid nitrogen (LN2) as insulant as well as a coolant. Incipient discharges in cryogenic power
apparatus can cause catastrophic failure of insulation system. To identify such discharges, it
requires more sophisticated diagnostic measuring techniques. In recent times, UHF technique has
gained importance to identify the partial discharge activity in GIS and in oil filled transformer.
A methodical experimental study was carried out to characterize the UHF signal generated
due to corona/surface discharges (with and without barrier).UHF signals generated at the point of
corona inception and at near point of breakdown were characterized by using spectrum analyser.
The variation in corona inception voltage under harmonic AC voltages with different THDs was
studied. Phase resolved partial discharge studies were carried out to understand the phase at
which discharges occurs when the barrier is present in the electrode gap. Also such analysis were
extended for harmonic voltages. The results form an important contribution by the author and
forms first part of the present study.
The presence of conducting or non conducting defect in solid insulation or formation of any
void in the bulk volume of insulation, under operating stress incipient discharges can occur,
forming treeing, a pre-breakdown structure. Under highly polluted supply voltage, the impact of
tree growth especially under cryogenic temperature, the results are scanty. To identify the
formation of any defects during laying of high voltage cables, AC and DC tests were carried out.
The fundamental issue with the DC test is the formation of space charge in cable insulation and
very low frequency test is identified as an alternative. It is essential to understand the electrical
tree formation in XLPE polymer insulation at low temperature under VLF voltages as well the
rate of failure of XLPE polymer insulation with trees and its growth under VLF voltages. In
addition, it is essential to understand the phase at which the partial discharge occurs under
harmonic and VLF voltages. The frequency contents of UHF signal formed during tree growth
under VLF and harmonic voltages ought to be understood.
Having known all these factors, the author has carried out a methodical experimental study to
understand the following important aspects.

v
(i) To investigate electrical tree growth in XLPE cable insulation at low temperatures under
harmonic voltages with different THD and with VLF voltages. For the purpose of comparison,
treeing studies were carried out with 50 Hz triangular voltage wave. (ii) The shape of electrical
trees formed was categorized by measuring the UHF signal radiated during inception and
propagation. (iii) Failure analysis of cable insulation due to treeing carried out through Weibull
distribution studies (iv) Phase resolved partial discharge studies were carried out (using UHF
signal measured) to understand the phase at which discharges occurs under different voltage
profiles. The analysis of tree growth phenomena in XLPE cable insulation under harmonic AC
voltage forms second part of the study.
To understand treeing phenomena, experimental study is a time consuming and laborious
process. Thus, the author has made an attempt to understand the treeing phenomena through
modelling studies. The author has used COMSOL, to model and compute the electric field
associated with treeing phenomena manifested in the nano composite material. The results of
the study form the third part of the present study.
vi
TABLE OF CONTENTS
Title Page No.
ACKNOWLEDGEMENTS ……………………………………….. iii
ABSTRACT………………………………………………………… iv
TABLE OF CONTENTS ………………………………………….. vi
LIST OF TABLES..………………………………………………... ix
LIST OF FIGURES...……………………………………………… x
ABBREVIATIONS ………………………………………………... xii
CHAPTER 1 INTRODUCTION
1.1 General ……………………………………………………………… 1
1.2 Literature Survey ……………………………………………………. 3
1.3 Problem Formulation ……………………………………………...... 10
1.4 Organisation of The Thesis ...……..………………………………… 11
CHAPTER 2 EXPERIMENTAL AND THEORETICAL STUDIES
2.1 General ……………………………………………………………… 13
2.2 Methods Adopted For Partial Discharge Detection In Cryogenic
Power Apparatus ……………………………………………………. 13
2.3 Experimental Setup …………………………………………………. 14
2.4 Sample Preparation of Barrier Insulation ...…………………………. 18
2.5 Analysis of Discharges Using Ternary Plot ………….……………... 20
2.6 Theoretical Analysis ...………………………………….…………… 20
CHAPTER 3 RESULTS AND DISCUSSION
3.1 General ……………………………….……………………………... 23
3.2 Analysis of Corona Discharge Activity in Liquid Nitrogen (With
and Without barrier in The Electrode Gap) Under AC Voltages
Adopting UHF Technique …………..………………………………. 23
3.2.1 Corona Inception Voltage (CIV) and The Breakdown
Voltage of Electrode Gap with Barrier Insulation …………. 23

vii
Table of Contents (Contd.) Page No.
3.2.2 Analysis of Current Pulse Generated Due to Corona
Discharge ……………………..……………………………. 26
3.2.3 Characteristics of UHF Signals Generated Due to Corona
Discharges ………………..………………………………… 28
3.2.4 Corona Generated UHF Sensor Signal Analysis Using
Spectrum Analyser ……………………………...………….. 29
3.2.5 Analysis of Phase Resolved Partial Discharges
(PRPD)……………………………………………………… 30
3.3 Analysis of Corona Discharge Activity in Liquid Nitrogen Under
Harmonic AC Voltages ……………..………………………………. 32
3.3.1 Variation in Corona Inception Voltage in Liquid Nitrogen
Under Harmonic AC Voltages ……………………………... 32
3.3.2 Analysis of injected current pulse due to corona discharge
activity in presence of harmonic AC voltages ……………... 33
3.3.3 Analysis of UHF Signal Generated Due to Corona
Discharge in Presence of Harmonic AC Voltages …………. 33
3.3.4 Classification of discharges Using Ternary Diagram ……… 34
3.3.5 Analysis of Phase Resolved Partial Discharge (PRPD) …… 35
3.4 Electrical Treeing in Cable Insulation at Liquid Nitrogen
Temperature ………………..……………………………………….. 36
3.4.1 Characterization of Trees Formed Under Harmonic AC
Voltage ……………………………………………………... 36
3.4.2 Life Estimation of XLPE Cable Insulation ...………………. 39
3.4.3 Characterization of UHF Signal ……...……………………. 41
3.4.4 Phase Resolved Partial Discharge Analysis During Tree
Growth Using UHF Signals ……..…………………………. 41
3.5 Modelling of Electrical Trees …….…………………………………. 43
3.5.1 Analysis of Two Dimensional Electric Field Distributions in
insulation structure during tree growth …………………….. 44
CHAPTER 4 CONCLUSIONS
4.1 General ………………………………………...……………………. 48
4.2 Scope of Future Work ………………………………………………. 50

viii
Table of Contents (Contd.) Page No.
REFERENCES ………………………………………………………………………... 52
LIST OF PUBLICATIONS BASED ON THE THESIS ………................................ 63

ix
LIST OF TABLES
Table Title Page No.
2.1 Properties of Clay Particle ………………………………………….. 19
2.2 Electrical Conductivity of materials used in study ………………….. 22
3.1 Variation in Corona Inception Voltage (CIV), Peak to Peak Voltage,
Rise Time of Current Pulse for Positive and Negative Polarity Under
Harmonic AC Voltages With Different THDs in Liquid Nitrogen
Insulation ……………………………………………………………. 32
3.1 The Weibull Distribution Parameter Characteristics Life (α) and
Shape Factor (β) and Peak Factor of Applied AC Voltage ………… 40

x
LIST OF FIGURES
Figure Title Page No.
2.1 Different Methods For Diagnosing PD Measurement ……………… 14
2.2 Typical Photograph of The Experimental Setup ……………………. 16
2.3 Photograph of Cryostat with Test Electrode System ………….……. 16
2.4 Frequency Response of The UHF Sensor ………………..…………. 17
2.5 Geometry of The Model Used For Tree Simulation ……………...... 21
3.1 Variation In Corona Inception Voltage of Liquid Nitrogen Filled
Electrode Gap With Barrier At Different Position ………...………. 24
3.2 Variation In Breakdown Voltage of Liquid Nitrogen Filled
Electrode Gap With Barrier At Different Position .............................. 25
3.3 Typical Photograph Of Breakdown Spot In The Barrier Insulation ... 26
3.4 Typical Current Pulse Injected Due To Corona Discharge (With
Barrier) (a) In Positive Half Cycle (b) In Negative Half Cycle (c)
Typical UHF Signal Formed During Current Injection ...….....…….. 26
3.5 Typical Corona Discharge Generated UHF Sensor Output Signal In
Liquid Nitrogen Insulation (a) And Its FFT (b) (I) Without Barrier
(II) With Barrier …………………………………………………….. 27
3.6 Typical UHF Sensor Signal Measured In Sequence Mode (a) On
Corona Inception (b) At 20 kV…………………………...…………. 28
3.7 Variation In Peak To Peak Voltage Of UHF Sensor Signal
Generated By Corona Discharge (With Barrier) In Liquid Nitrogen
(A) With Barrier At 20 kV (B) With Barrier At Inception (C) Clean
Electrode Gap At 20 kV (D) Clean Electrode Gap At Inception …… 29
3.8 Typical Pulse Sequence Of UHF Sensor Signal Measured Using
Spectrum Analyzer At 1 GHz In Zero-Span Mode (a) At Inception
Measured (b) At Higher Voltage (c) Inception To Breakdown ..…… 30
3.9 Typical PRPD Pattern Formed Due To Corona Discharge (I)
Without Barrier (II) With Barrier (a) At Inception (b) At Higher
Voltage ……………………………………………………………… 31
3.10 Typical current pulse injected due to corona discharge under
harmonic AC voltages in liquid nitrogen insulation (a) In positive
half cycle (b) In negative half cycle (c) Typical UHF signal formed
during current injection ……………………………………………... 33
3.11 FFT analysis of UHF signal generated due to corona discharge
under harmonic AC voltages with different THDs in liquid nitrogen
insulation ……………………………………………………………. 34

xi
List of Figures (Contd.) Page No.
3.12 Typical Ternary diagram obtained due to corona discharge under
harmonic AC voltages with different THDs in liquid nitrogen
insulation ……………………………………………………………. 34
3.13 Typical PRPD pattern formed due to corona discharge (i) 50 Hz (ii)
H=3,THD=4% (iii) H=5,THD=4% (iv) H=7,THD=4% (v)
H=7,THD=40% (a) At inception (b) At higher voltage …………….. 35
3.14 Electrical trees under harmonic AC voltage profiles (a) 50 Hz (b) 2f
(c) 3f (d) 4f (e) 5f (f) 6f (g) 7f (h) 2f (i) 3f (j) 6f (k) 7f (l) 1 Hz (b) to
(g) with 4 % THD and (h) to (k) 40 % THD …...……………………
37
3.15 Weibull Distribution Plot For The Failure Times Of XLPE Cable
Insulation Due to Electrical Trees Under Harmonic AC Voltages (a)
4% THD (b) 40% THD ..............................………………………….
39
3.16 Typical UHF Signal Generated During Tree Growth (a) And Its
Corresponding FFT Analysis (b) (c) FFT Analysis of UHF Signal
Generated During Tree Growth Under Harmonic AC Voltage With
4%THD and (d) 40%THD ………………………..………………… 41
3.17 Phase Resolved Partial Discharge Analysis Using Spectrum
Analyser By Operating In Zero Span Mode (a) 50 Hz (b) 1 Hz …..... 42
3.18 Phase Resolved Partial Discharge Analysis Using Spectrum
Analyser By Operating In Zero Span Mode (a) 2f (b) 3f (c) 4f (d) 5f
(e) 6f (f) 7f (i) 4% THD (ii) 40% THD ............................................... 42
3.19 Distribution of electric field at the time of tree initiation with nano
particles of different conductivity (a) 101 (b) 10
3 (c) 10
5 S/m ……… 44
3.20 Distribution of electric field during tree propagation after (a) 100 (b)
300 (c) 500 and (d) 700 iterations (i) Without nanoparticles (ii) 10
nm (iii) 20 nm (iv) 30 nm (v) 40 nm (vi) 50 nm diameter of
Nanoparticles ………………………………………………………... 45
3.21 Typical Tree Generated In The Presence Of Nano Particles Of
Different Size (a) Without Particle (b) 10 nm (c) 20 nm (d) 30 nm
(e) 40 nm (f) 50 nm Diameter ............………………………………. 46
3.22 Variation In The Number Of Iterations Corresponding With The
Change In Diameter Of Nano Particles ………………………........... 46
3.23 Variation in the velocity of tree propagation with the length of tree .. 47

xii
ABBREVIATIONS
AC Alternating Current
AE Acoustic Emission
CIV Corona Inception Voltage
DC Direct Current
EPR Ethylene Propylene Rubber
FFT Fast Fourier Transform
FRP Fiber Reinforced Polymer
GIS Gas Insulated System
GTEM Gigahertz Transverse Electro Magnetic
HFCT High Frequency Current Transformer
HTS High Temperature Superconductor
HV High Voltage
IEC International Electrotechnical Commission
LN2 Liquid Nitrogen
MMT Montmorillonite
PD Partial Discharge
PF Peak Factor
PDIV Partial Discharge Inception Voltage
PRPD Phase Resolved Partial Discharge
RF Radio Frequency
RMS Root Mean Square
SA Spectrum Analyser
THD Total Harmonic Distortion
tr Rise Time
UHF Ultra High Frequency
VLF Very Low Frequency
Vpp Peak to Peak Voltage
Wt% Weight Percentage
XLPE Cross Linked Polyethylene
1
CHAPTER 1
INTRODUCTION
1.1 GENERAL
The need for bulk power transmission at higher voltages is well understood and the world-over
researchers are now trying to enhance the reliability of transmission and distribution system by
enhancing the reliability of operation of power apparatus by adopting proper maintenance and
condition monitoring strategy, minimizing the power loss in the transmission and distribution system
with optimal power flow in lines etc (M. Hanai et al., 2008). The invention of high temperature
superconductor has attracted the power equipment manufacturers and the researchers to design and
develop super-conducting power apparatus with liquid nitrogen (LN2) as insulant and as a coolant
(Garlick, 1997; Gerhold, 2002; Dai et al., 2007).
The advantages of using liquid nitrogen as insulant in cryogenic power apparatus are the
following.
1. Liquid nitrogen has a higher heat flux of 16 W/cm compared to 0.8 W/cm for liquid
helium.
2. Evaporation heat of liquid nitrogen is 160 KJ/L compared to 2.6 KJ/L for liquid helium.
Therefore, the liquid nitrogen cooling capacity is much better than that of liquid helium.
3. Liquid nitrogen could be handled easily, simpler and cheaper insulation, and low cooling
power needed for refrigeration equipment.
4. The liquid nitrogen is chemically inert and no irreversible compound/ hazardous by-
products forms within the insulation system due to any ageing/discharges.
The major issues in liquid nitrogen filled cryogenic insulation during operation, includes.
Incipient discharge activity due to corona and surface discharges in liquid nitrogen.
Aging of dielectric materials.
Low temperature breakdown of the materials.
Cracks formed in solid insulators due to cool-down and warm-up situations.
Bubbling effects due to the quench of superconductors.
One of the main forms of electrical degradation of insulating materials subjected to high
electrical fields, at normal temperatures, is incipient discharge. Similar phenomenon can occur at

2
cryogenic temperatures (Blaz et al., 2011; Koo et al., 2010). Incipient discharges can occur in
liquids, generating gas-filled bubbles at interfaces between solid and fluid insulations to produce
conducting paths forming tracking (Kraehenbuel et al., 1994). Considerable research work were
carried out to understand incipient discharge activity in liquid nitrogen (as it has low heat of
vaporization and low thermal capacity), in large gaps, under AC voltages (Frayssines et al., 2002).
During corona discharge in liquid nitrogen under AC voltage, bush type discharges occur in negative
half cycle and filamentary type discharges in the positive half cycle (Swaffield et al., 2008). Most
of the studies were carried out under AC voltages. In recent times, harmonics in supply
voltage formed due to non-linear loads in power system networks has high impact on
insulating materials in power apparatus.
Polymers have been used extensively in electrical insulation for cryogenic equipment
because of their high mechanical strength with excellent electrical insulation characteristics (F.
Krahenbuhl et al., 1994; M. Sosnowslu et al., 1985; M. Kosaki et al., 1996). This solid
insulation is used as barrier to enhance the breakdown strength of the medium. One of the
fundamental problems with solid insulating material is the formation of electrical trees from
defect site (conducting/non-conducting defect). Treeing is a carbonaceous process which forms
due to partial discharge activity. This partial discharge activity occurs due to enhancement of
local electric field near the defect site in the bulk volume of insulating material, under normal
operating voltage, which can drastically reduce the useful life of the insulating material (Len. A.
et al.,1992). Treeing studies in XLPE insulating material under AC and DC voltage are well
known in the literature (Fuji et al., 1991; A. Minoda et al., 1997). With the increase in harmonic
pollution (odd and even harmonics with different THD) in the power system network, the
database on tree inception and the dynamics is scanty.
The existing partial discharge (PD) diagnostic methods in cryogenic power equipments
include conventional PD measurement process adopting IEC 60 270, acoustic emission
technique, High Frequency Current Transformer (HFCT) and by optical emission technique.
Recently, it is observed that adoption of UHF technique is a reliable method for identification of
PD in power apparatus, as the inherent characteristics of the process is free from any external
interference. Use of UHF technique for identification of incipient discharges in cryogenic power
apparatus is at infancy stage.
Understanding treeing phenomena in XLPE cable insulation by experimental study is time
consuming and laborious process. It is essential to understand the treeing process by modelling
process through incorporation of various factors that influence the tree growth process.
3
1.2 LITERATURE SURVEY
In recent times, power transmission at high AC/DC voltages has acquired considerable
importance. Partial discharge measurement techniques were developed for the diagnosis of
incipient discharges in conventional power equipments, which operates at high voltages. In the
case of HTS power equipment, there were no evident testing techniques that have been reported
and related works are in their early stages of research and development around the world
(Grabovickic et al., 2005; Hazeyama et al., 2002; James et al., 2007).
LN2 has high dielectric strength but its performance is affected easily with bubble formation,
foreign conducting/non conducting particles and electrode surface conditions (Gerhold, 2002a;
Okubo et al., 1996).
The presence of even a minor defect in the insulation structure, conducting or non-
conducting defect, under normal operating voltages can cause local field enhancement, initiating
partial discharge activity (Hara et al., 2002; Krins et al., 1996).
Partial discharge due to contaminant is one of the major problems in cryogenic insulation.
Also no partial discharge (PD) is allowed in the HTS apparatus since organic insulation
materials are used in its insulation systems and they are easily degraded by PDs (Hara et al.,
2004). Hence it is essential to monitor the incipient discharges generated due to various factors
which include partial discharge due to particle movement, corona discharge and by surface
discharge activity.
It is well known that insertion of a thin insulating barrier in liquid insulation electrode gaps
significantly increases the dielectric strength of the medium (Zougachi et al., 1998; Hyoungku
Kang et al., 2011). However, influence of barrier on the performance of liquid nitrogen
insulation is not fully understood yet.
Y. Yamano et al. (1990) studied the suppression of the negative surface leaders at AC
voltage application in air by setting up the insulating barrier on a test insulator. They have
observed that the barrier can suppress the negative surface leaders and thus improving the AC
flashover strength, when the barrier distance is shorter than the critical value. They have
concluded that the suppression of the negative surface leader results from the interruption of the
propagation of the negative partial discharges by barrier and the reliability of the insulation will
be high when the barrier distance is shorter than the critical value.
F. Topalis et al. and M. Danikas (2005) studied breakdown in air gaps with solid insulating
barrier under impulse voltages and concluded that the best dielectric performance of the

4
arrangement is achieved when the barrier is placed near the high voltage point but never very
close to it. They have suggested that the optimum position to place barrier in electrode gap is
equal to 20% of the gap length. The performance of the insulation is degraded when barrier is
placed near ground points. Furthermore, the material of the barrier is not as important as the
position of barrier.
Jong-man Joung et al. (2003) have studied the influence of barrier and AC surface flashover
strength in liquid nitrogen insulation and have concluded that the breakdown strength of the
liquid nitrogen medium has enhanced drastically.
Paola Caracino et al. (2002) explained in detail that barrier structure would be applied in the
main gap and coil end insulation to improve the Partial Discharge inception and Breakdown
characteristics in liquid nitrogen. The barrier materials selection will be a crucial design
parameter under liquid nitrogen condition.
L.H. Truong et al. (2013a) characterized partial discharges in LN2 under AC voltages by the
means of phase resolved analysis. They have suggested that discharges in a liquid nitrogen/solid
insulation system occur primarily in the first and third quadrant of the applied voltage waveform
due to charge storage effects. Under higher electric stress, Partial Discharge (PD) pulses are also
observed before zero crossing of the waveform. They have observed different PD patterns for
different solid dielectric barriers, indicating the effects of the solid/liquid interface on the
behavior of discharges in point-plane composite systems at cryogenic temperature.
A. Denat et al. (2011) studied conduction and breakdown phenomenon in dielectric liquid
and have concluded that the streamers in liquid occur when the maximum electric field at the
needle tip reaches a certain threshold value, which allows more electrons tunneling into the
liquid and initiates discharges.
Hanaoka et al. (1993) carried out experimental study to understand the influence of ice layer
on pre breakdown current in liquid nitrogen insulation. They have concluded that the presence of
ice at the tip of needle can significantly enhance the corona inception voltage and breakdown
voltage.
Tanaka (1977) studied internal discharges in liquid nitrogen filled cavity under AC voltage.
He observed that with the increase in voltage, incipient discharge occurs. He also observed
luminescence after discharges in liquid nitrogen.

5
J Fleszynski et al. (1980) studied surface discharge characteristics of solid insulating
material in liquid nitrogen and have concluded that rate of discharge propagation is high under
positive polarity compared with that under negative polarity.
Swaffield et al. (2008) studied discharge activities in liquid nitrogen with needle-plane
configuration and have observed filamentary type and bush type discharges in the positive and
negative half cycle of the AC voltage. The multiple discharges of lower magnitudes have also
been observed which occur during negative half cycle.
Takahashi and Ohtsuka (1975) studied corona discharge activity in liquid nitrogen and have
concluded that the corona inception voltage is less with the point negative than positive ones. As
the gap spacing decreases, height and repetition rate of pulses with the point negative increases.
The corona is accompanied by bubbling similar to a spray jet from the point tip. The polarity of
applied voltage doesn’t affect the bubbling phenomenon.
Fleszynski et al. (1979) carried out discharge studies in liquid nitrogen and have observed
different phenomenon under positive and negative polarity of the AC voltage. They have
observed that the channel of pre-breakdown discharges is greatly expanded when the point
electrode is negative. They have concluded that the development of discharge depend on the
density and distribution of the space charge. The breakdown mechanism of liquid nitrogen is a
typical leader mechanism when the polarity of point electrode is positive. The highly ionized
leader carries the point electrode potential deep into the inter electrode space, thus reducing the
value of breakdown voltage.
Goshima et al. (1995) carried out experimental studies to understand the breakdown
characteristics of liquid nitrogen under positive DC and AC voltages and have concluded that the
roughness of the electrode surface has less influence on the breakdown voltage and the electron
emission from rough finished cathode affects the negative breakdown voltage.
The use of non-linear and time varying loads, which have non-linear voltage-current
characteristics, can cause harmonic pollution in the power system network causing distortion to
the AC supply voltage profile (T. H. Ortmeyer et al., 1985; V. E. Wagner et al. 1993).
IEEE 519-1992 (1992) standards indicate the limit of voltage harmonics as 1.5% THD in HV
networks and 2.5 – 5% THDs in medium voltage networks.
Dionise et al. (2010) carried out harmonic analysis in power system network connected with
a mid-frequency welder load and have observed a voltage THD as high as 60.6%.
6
M. Sali Taci et al. (2004) have observed that the non sinusoidal supply voltage to
transformers can enhance the THD of supply voltage to be as high as 44%. They have also
visualized the stress due to harmonic voltages.
Considerable research work has been carried out to understand corona formation in
liquid nitrogen insulation under AC voltages. However, the understanding of the corona
formation in liquid nitrogen under harmonic ac voltages with different THDs, are scanty.
Author has made an attempt to understand the influence of harmonic AC voltages, with different
THDs on the performance of liquid nitrogen insulation adopting the UHF technique, perhaps for
the first time and it is one of the important contributions by the author.
M. Florkowski et al. (2013) investigated the influence of harmonic on partial discharge
behavior. They have observed that compositions of various harmonic superimposed on the
fundamental sinusoidal waveform can have a significant impact on PD intensity and maximum
charge. In consequence, partial discharge pattern, phase, and amplitude distribution are distorted
and influence the derived statistical parameters as well. They have underlined the importance of
the awareness of spectral purity of the applied voltage, especially when the PD measurements
are associated with acceptability criteria and compatibility with the standards.
Polymers have been used extensively in electrical insulation for cryogenic equipments
because of their high mechanical strength with excellent electrical insulation characteristics (F.
Krahenbuhl et al., 1994; M. Kosaki et al., 1996).
M. Sosnowslu et al. (1985) described the development of crosslinked polyethylene (XLPE)
insulation structure for cryogenic high voltage cable. They have observed that XLPE structure
have good electrical and mechanical properties at cryogenic temperatures. They have concluded
that the tree propagation depends upon applied voltage magnitude, conductivity of the discharge
path, and the local electric condition at the point of inception of electrical tree.
Defect free manufacturing of polymer material is one of the major challenges. One of the
fundamental problems with solid insulating material is the formation of electrical trees from the
defect site. Electrical treeing is a carbonaceous process which forms due to partial discharge
activity. Under normal operating voltage, this partial discharge activity occur due to
enhancement of local electric field near the defect in the bulk volume of insulating material,
which can drastically reduce the useful life of the insulating material (Len. A. Dissado et al.,
1992).

7
M. Kosaki et al. (1977) studied treeing of polythene at cryogenic temperature and concluded
that tree inception voltage at low temperature is much higher and nearly equal to the tree
inception under lightning impulse voltage. It is also observed that XLPE cables at low
temperature have higher AC and impulse breakdown strength.
H. Kawamura et al. (1998) studied the influence of space charge on dc tree propagation
using many insulating polymer materials under divergent fields and have concluded that the dc
treeing breakdown phenomena are strongly affected by the space charges.
M. Fujii et al. (1991) investigated fractal dimension of dc trees in poly-methyl-metha
acrylate for both polarities of the needle electrode using the self-correlation function. They have
concluded that the fractal established range is proportional to the tree length for both positive
and negative polarities of the applied voltage. The fractal dimension increases with increasing
inception voltage and saturates at 1.5 to 1.6 for positive polarity. But for negative polarity, the
fractal dimension is nearly constant, x 1.5, as a function of voltage.
A. Minoda et al. (1997) studied DC short-circuit treeing phenomenon and space charge
effect in EPR at cryogenic temperature. They have observed that the short-circuit tree initiation
voltage of EPR at cryogenic temperature is much higher than that at room temperature.
Furthermore, space charge is less problematic at cryogenic temperature than at room temperature
because the charge injection is very limited for DC electrical insulation at cryogenic
temperature.
Treeing studies in XLPE insulating material under AC and DC voltage are well known. With
the increase in harmonic pollution (odd and even harmonics with different total harmonic
distortion) in the power system network, the database of tree inception and dynamics is scanty.
Kanao et. Al. (2009) have observed presence of even harmonics in power system network.
Thus this harmonic AC voltage is visualized by any system connected with such network and it
is essential to know its impact to life of cable insulation due to electrical treeing.
Bozzo et al. (1997) subjected insulating materials to distorted ac voltages using 3rd, 5th and
7th orders separately and studied their degradation and life performance. They have confirmed
that the voltage peak of the waveform and the likelihood of partial discharge inception may be
increased due to composite waveform component.
Montanari et al. (1999a) studied intrinsic ageing of insulating materials due to supply voltage
distortion. It is shown that the ageing is accelerated by peak factor of the voltage waveform but
rms value of voltage and waveform slope also have statistical significance.
8
Montanari et al. (1999b) studied impact of voltage distortion on ageing acceleration in
insulation system. They have concluded that the voltage peak is the main factor for accelerating
the ageing process. Increase in RMS voltage and waveform steepness provides a significant
contribution to ageing acceleration.
Fabiani et al. (2001) studied acceleration in ageing of insulation material under partial
discharge activity due to voltage distortion. They have concluded that the prevailing factor for
the accelerating degradation of insulation systems is the peak of voltage waveform.
Mazzanti et.al (2006) studied the effects of distorted voltage on life of the cable. They have
concluded that both peak factor and shape of waveform play a key role on life reduction of the
cable due to harmonic voltages.
Florkowska et al. (2007) studied the influence of harmonics on mechanism of partial
discharge and ageing processes in epoxy resin insulation. They have concluded that the number,
magnitude and phase location of individual discharges could be influenced due to distortion in
test voltage.
Bahadoorsingh and Rowland (2009) modeled partial discharges due to electrical treeing in
the presence of harmonics and concluded that the power quality can significantly influence the
phase resolved patterns produced by an electrical tree.
Bahadoorsingh and Rowland (2010) have studied partial discharge activities in epoxy resin
during tree growth and reported that the partial discharge activity is enhanced by the presence of
harmonics. Furthermore, the presence of 7th harmonic can be more detrimental to the cable
insulation, indicating that ageing process is accelerated by harmonics in supply voltage.
G. Lupo et al. (2000) carried out experimental and theoretical studies for classification of PD
in a cryogenic cable termination and have observed that under 50 Hz AC voltage, the discharge
occurs near the zero crossing as it is observed at room temperature.
After laying the high voltage cable, to identify the formation of any defects during laying AC
and DC test are carried out. Oyegoke et al. (2003) carried out experimental studies to understand
selectivity of damped AC (DAC) and VLF voltages in after-laying tests of extruded MV cable.
They have indicated that the detection of defects with DAC or VLF voltage can be done at a
lower voltage than with DC. DAC voltage is sensitive in detecting defects that cause a
breakdown due to void discharge, while VLF is sensitive in detecting defects that cause
breakdown directly led by inception of electrical trees.
9
The fundamental problem with the DC test is the formation of space charge in cable
insulation and very low frequency test is identified as an alternative (E. Ildstad et al., 2013).
J. von Neuman (1966) has carried out simulation of electrical tree growth, considering both
the barrier effect and the homocharge influence, and has suggested that both factors are vital in
preventing trees. The simulation is done with the aid of Cellular Automata.
D. Pista et al. (2010) have conducted simulation studies to understand electrical treeing
propagation in nanocomposites using cellular automata. They have concluded that the nanofillers
act as barriers to the propagation of electrical tree. Tree propagation is delayed because electrical
tree is forced to propagate through the interface between the polymer and nanofiller as the
nanofillers are more resistant to partial discharge activity than the polymer. Furthermore, during
interaction with nanofillers, electrical tree loses part of its energy thereby not propagating
further.
R.C.Smith et al. (2008) have presented the hypothesis for the mechanism leading to
improved properties of polymer nanodielectrics. They have suggested that inclusion of
nanoparticles in polymer provides countless scattering obstacles and trap sites in the charge
carriers’ paths, effectively reducing carrier mobility and thus carrier energy. As the result,
voltage required for further charge injection increases due to buildup of homocharge at the
electrodes.
M. Kozako et al. (2005) have conducted experimental study to investigate mechanical,
thermal and electrical characteristics of epoxy/alumina nanocomposites in comparison with
those of an expoxy resin without filler. They concluded that the nanocomposite specimens are
more resistant to partial discharge than the specimen without nanofillers and the electrical
breakdown time is also longer in case of nanocomposites.
G.E.Vardakis and M.G.Danikas (2004) have simulated treeing phenomenon in the case of a
small insulating spherical particle inside a solid insulating material and have concluded that the
presence of such particles inside the dielectric material may be a significant factor for
propagation of electrical tree but not for its initiation.
R. Sarathi and A. Vijaya Saradhi (1999) have modelled electrical tree in a laminated
dielectric structure, considering the influence of permittivity of material on tree growth. They
have concluded that charges accumulate on interface structure and thereby retarding the growth
of electrical tree.
10
1.3 PROBLEM FORMULATION
As discussed earlier, incipient discharges in cryogenic power apparatus can cause
catastrophic failure of insulation system. To identify such discharges, it requires more
sophisticated diagnostic measuring techniques. In recent times, UHF technique has gained
importance to identify the partial discharge activity in GIS and in oil filled transformer. The
author has made an attempt to understand the incipient discharges due to corona and surface
discharges by adopting UHF technique. The present work envisages development in this
direction. In addition, the use of polymer material as barrier insulation in an electrode gap filled
with liquid nitrogen need to be analyzed. Also the variations in corona inception voltage under
harmonic AC voltages in liquid nitrogen need to be analysed. The results of this study form
important part of the present work.
The author has carried out a methodical experimental study to characterize the UHF signal
generated due to corona/surface discharges (with and without barrier). UHF signals generated at
the point of corona inception and at near point of breakdown were characterized by using
spectrum analyser. Phase resolved partial discharge studies were carried out to understand the
phase at which discharges occurs when the barrier is present in the electrode gap. The results
form first part of the present study.
The presence of conducting or non conducting defect in solid insulation or formation of any
void in the bulk volume of insulation, under operating stress can cause incipient discharges,
forming treeing, a pre-breakdown structure. Under highly polluted supply voltage (odd and even
harmonics with different THD) in the power system network, the database on tree inception and
the dynamics is scanty. To identify the formation of defects during laying of high voltage cables,
AC and DC tests were carried out (Oyekoke et al., 2003). The fundamental issue with the DC
test is the formation of space charge in cable insulation and very low frequency test is identified
as an alternative (E. Ildstad et al., 2013). It is essential to understand the electrical tree formation
in XLPE polymer insulation at low temperature as well the rate of failure of XLPE polymer
insulation with trees and its growth under VLF voltages. In addition, it is essential to understand
the phase at which the partial discharge occurs under harmonic and VLF voltages. The
frequency contents of UHF signal formed during tree growth under VLF and harmonic voltages
need to be understood.

11
Having known all these factors, the author has carried out a methodical experimental study
to understand the following important aspects.
(i) To investigate electrical tree growth in XLPE cable insulation at low temperatures under
harmonic voltages with different THD and with VLF voltages. For the purpose of comparison,
treeing studies were carried out with 50 Hz triangular voltage wave. (ii) The shape of electrical
trees formed was categorized by measuring the UHF signal radiated during inception and
propagation. (iii) Failure analysis of cable insulation due to treeing carried out through Weibull
distribution studies. (iv) Phase resolved partial discharge studies were carried out (using UHF
signal measured) to understand the phase at which discharges occurs under different voltage
profiles. The analysis of tree growth phenomena in XLPE cable insulation under harmonic AC
voltage forms second part of the study.
To understand treeing phenomena, carrying out experimental study is time consuming and
laborious process. Thus the author has made an attempt to understand the treeing phenomena
through modelling studies. The author has used COMSOL, to solve the mathematical
formulations for calculating the electric field and to know more about the influence of nano
composite material on treeing phenomena, the results of the study forms third part of the present
study.
1.4 ORGANISATION OF THE THESIS
The first chapter introduces corona discharge activity in liquid nitrogen and the problems due
to electrical treeing in solid insulation. The need for studying corona discharge activity adopting
UHF technique is explained in detail. Upon clearly formulating the problem, the possible
method for identification of incipient discharges in liquid nitrogen due to corona activity and
treeing phenomena in solid/cable insulation has been proposed. The need for theoretical
modelling of electrical treeing is presented. A panoramic view of literature dealing the topic is
reported as completely as possible.
The second chapter deals with experimental and theoretical analysis of the study. The
different PD diagnostics used in cryogenic power apparatus were explained in detail. The details
of the experimental setup used for corona discharge study and for treeing experiments were
explained. The characteristics of UHF sensor used for PD diagnostics were explained. The
methodology adopted for modelling of electrical treeing using COMSOL is explained in detail.

12
In the third chapter, results of experimental studies on corona discharge activity in electrode
gap (with and without barrier) in liquid nitrogen are presented. The influence of harmonics on
electrical tree growth in XLPE cable insulation at liquid nitrogen temperature is presented. In
addition, the important results acquired based on theoretical modelling of trees, are presented.
In the fourth chapter, summary of author’s contribution on analysis of corona discharge
activity and on electrical treeing studies are presented. The last part of the chapter suggest for a
future work on the topic, as an extension of the present study.

13
CHAPTER 2
EXPERIMENTAL AND THEORETICAL STUDIES
2.1 GENERAL
In the present work, two sets of experimental studies were carried out.
1. Understanding corona discharge activity in liquid nitrogen in presence of epoxy
nanocomposites barrier.
2. Understanding treeing phenomenon in solid insulation/ cable insulation.
In this chapter, the details of the experimental setup established in the laboratory for
generating corona discharge activity in LN2 and for treeing studies in XLPE cable insulation at
LN2 temperature, equipments used, experimental techniques adopted for PD measurements and
analysis were detailed. Fundamental aspects on theoretical modelling of electrical trees were
detailed.
2.2 METHODS ADOPTED FOR PARTIAL DISCHARGE DETECTION IN
CRYOGENIC POWER APPARATUS
Incipient discharge is basically a discharge which will not bridge the gap between high
voltage electrode and the ground electrode. This incipient discharge is otherwise called as partial
discharge. The PD formed in the medium can inject current pulse, radiates electromagnetic
waves, ultrasonic waves, light emission, generates vibration, heat and so on. Figure 2.1 shows
the different techniques adopted for measurement of partial discharges in liquid nitrogen filled
cryogenic power apparatus.
The majority of PD detection systems that are used in cryogenic power apparatus includes
Ultra High Frequency (UHF) technique, High Frequency Current Transformer (HFCT), Optical
emission technique, Acoustic Emission (AE) sensors and by IEC 60 270 standard electrical
contact measurement technique.
In recent times, UHF technique is more popular method to identify the formation of incipient
discharges. UHF signals get generated when current pulses are injected with the rise time of a
nanosecond or less. Based on the theory of electromagnetism, signals with short rise time of
nanosecond range can radiate electromagnetic waves up to Ultra High Frequency (UHF) range

14
i.e., 300-3000 MHz. By choosing proper antenna/sensor, it is possible to identify the incipient
discharges in the insulation structure of the power equipments. Also by selecting the proper
bandwidth and having correlation between the UHF signal formed and injected current
magnitude, severity of the discharge could be identified even under online/onsite condition. UHF
technique is the least sensitive method compared to other methods of PD measurement, since
external noise interferences are completely avoided. Also the sensors have no electrical contacts
with operating high voltage system and hence the UHF sensor can be used for online monitoring.
Figure 2.1: Different methods of PD measurement
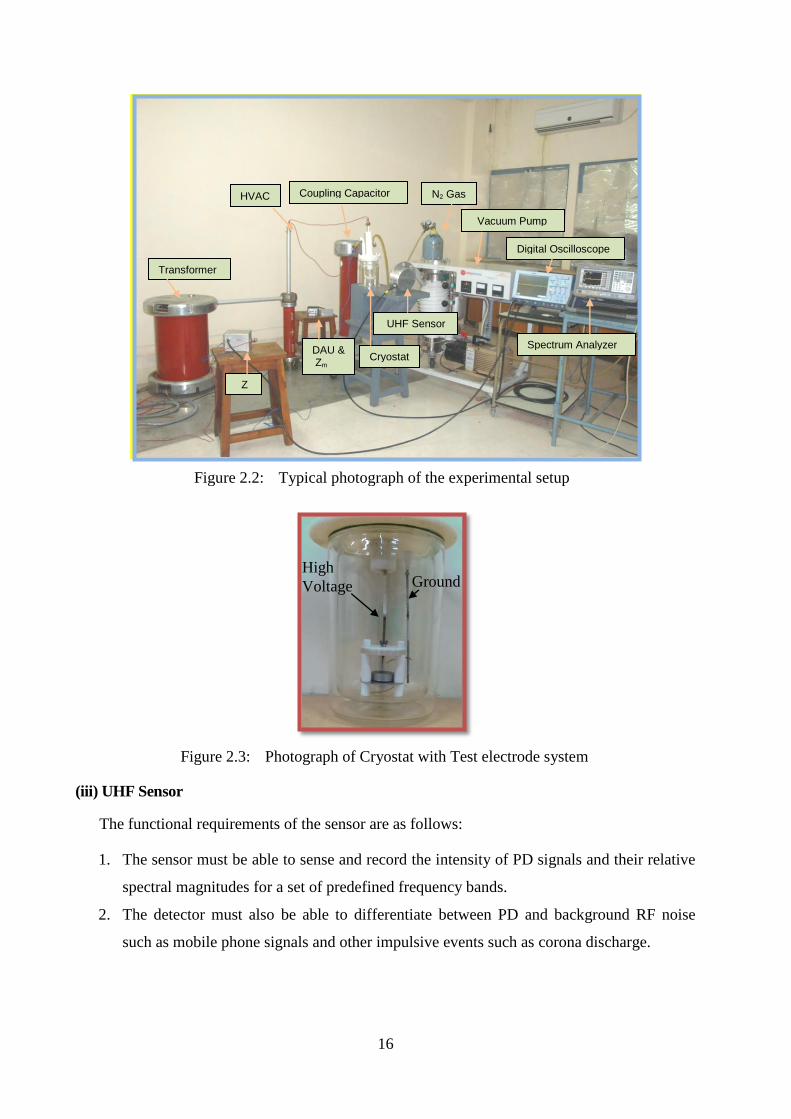
2.3 EXPERIMENTAL SETUP
The experimental setup, in general, can be sectioned into four parts such as the high voltage
source, the liquid nitrogen filled test cell (cryostat), phase resolved partial discharge analyzing
(PRPDA) system and the UHF sensor connected to spectrum analyzer/oscilloscope, respectively.
The typical photograph of the experimental setup and the test cell are shown in figure 2.2 and
figure 2.3.
The experimental setup for corona discharge study and was segmented into four. They are (i)
High AC voltage source, (ii) Test cell for corona studies, (iii) UHF signal measurement unit and
(iv) Partial discharge measurement system.
(i) Generation of high AC voltage
The discharge free test transformer (100 kV, 5kVA ) was used for generating high AC
voltage. Corona inception studies and breakdown studies were carried out independently to

15
avoid impact of any space charge formed due to long duration corona studies. For corona
inception and breakdown voltage studies, the AC voltage was applied at the rate of 300 V/s. The
capacitance divider was used for applied AC voltage measurement.
(ii) Test cell for corona studies
The cryostat used for the study is a double wall bell jar made of Quartz. The gap between the
inner and outer wall is 3mm and was evacuated to medium vacuum level, for thermal stability.
The inner vessel is filled with liquid nitrogen.
In the present work, the cryogenic test cell containing Needle-plane electrode with barrier is
fitted in a cylindrical container, immersed in the liquid nitrogen filled cryostat. Needle-plane
electrode with a gap distance of 10mm was used for carrying out corona discharge studies. The
thin sharp stainless needle electrode with tip radius of 15 µm is a high voltage electrode. The
bottom plane stainless steel electrode with its diameter of 5cm is connected to the ground.
To understand the influence of barrier on corona inception, fiber reinforced epoxy
nanocomposite insulating material is used as barrier material. Fiber reinforced epoxy
nanocomposite is generally used for enhancing the mechanical strength of the material (W.
Dauda et al., 2009). Sarathi et al. (2006) have studied electrical, thermal and mechanical
properties of epoxy nanocomposites and have concluded that 1 wt% Montmorillonite (MMT)
nano clay loaded epoxy resin has good electrical and hydrophobic properties. Thus, in the
present study, the fiber reinforced epoxy nanocomposite is prepared with 1 wt% MMT clay. The
barrier insulation is nearly 1mm thick and diameter of 5cm. The barrier position is always
referenced with respect to the top electrode. The edge grooved fiber glass reinforced epoxy
nanocomposite barrier is positioned in the electrode gap by fitting tight to the cylindrical
container. The liquid nitrogen gets filled between the barrier and the ground electrode through
the edge grooved in the barrier insulation.
The cryogenic test cell with electrode gap immersed into the liquid nitrogen filled in the
inner vessel of the cryostat and the nitrogen gas is circulated gently in the gap between the liquid
nitrogen and the top plate of the cryostat to avoid any moisture formation. On immersion of
cryogenic test cell in liquid nitrogen, thermal bubbles of large and smaller diameters were
observed. Resting time of several minutes was allowed before start of experiments to obtain
stabilized bubble free medium. Corona inception studies and breakdown studies were carried
out independently to avoid impact of any space charge formed due to long duration corona
studies.
16
Figure 2.2: Typical photograph of the experimental setup
Figure 2.3: Photograph of Cryostat with Test electrode system
(iii) UHF Sensor
The functional requirements of the sensor are as follows:
1. The sensor must be able to sense and record the intensity of PD signals and their relative
spectral magnitudes for a set of predefined frequency bands.
2. The detector must also be able to differentiate between PD and background RF noise
such as mobile phone signals and other impulsive events such as corona discharge.
Transformer
Coupling Capacitor
Cryostat
N2 Gas
Vacuum Pump
Spectrum Analyzer
Digital Oscilloscope
DAU & Zm
UHF Sensor
Z
HVAC
High
Voltage Ground
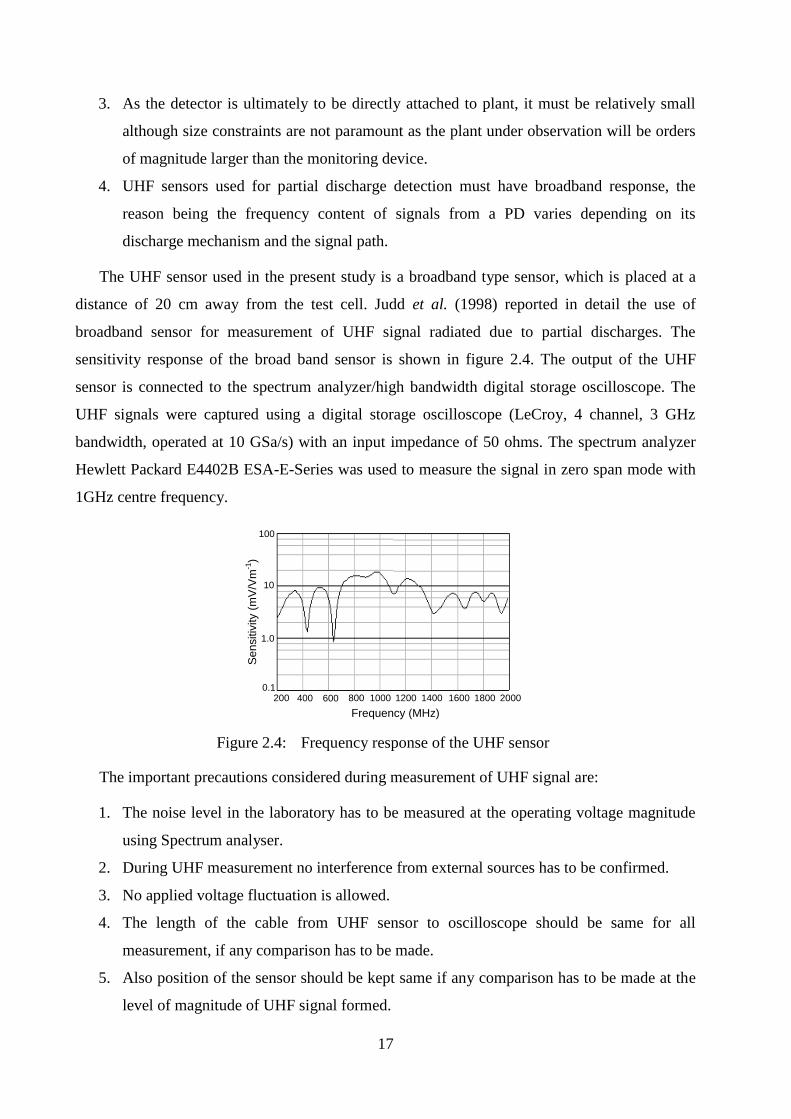
17
3. As the detector is ultimately to be directly attached to plant, it must be relatively small
although size constraints are not paramount as the plant under observation will be orders
of magnitude larger than the monitoring device.
4. UHF sensors used for partial discharge detection must have broadband response, the
reason being the frequency content of signals from a PD varies depending on its
discharge mechanism and the signal path.
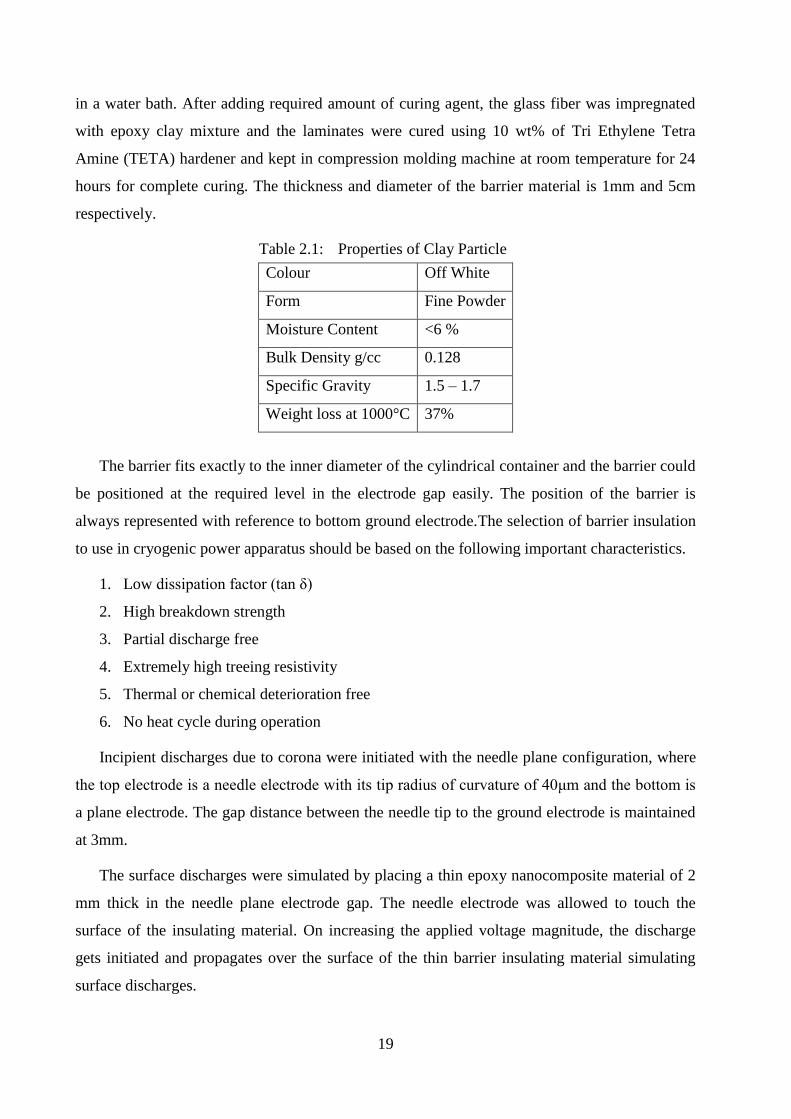
The UHF sensor used in the present study is a broadband type sensor, which is placed at a
distance of 20 cm away from the test cell. Judd et al. (1998) reported in detail the use of
broadband sensor for measurement of UHF signal radiated due to partial discharges. The
sensitivity response of the broad band sensor is shown in figure 2.4. The output of the UHF
sensor is connected to the spectrum analyzer/high bandwidth digital storage oscilloscope. The
UHF signals were captured using a digital storage oscilloscope (LeCroy, 4 channel, 3 GHz
bandwidth, operated at 10 GSa/s) with an input impedance of 50 ohms. The spectrum analyzer
Hewlett Packard E4402B ESA-E-Series was used to measure the signal in zero span mode with
1GHz centre frequency.
100
10
1.0
0.1
Se
nsitiv
ity (
mV
/Vm
-1)
Frequency (MHz)
200 400 600 800 1000 1200 1400 1600 20001800
Figure 2.4: Frequency response of the UHF sensor
The important precautions considered during measurement of UHF signal are:
1. The noise level in the laboratory has to be measured at the operating voltage magnitude
using Spectrum analyser.
2. During UHF measurement no interference from external sources has to be confirmed.
3. No applied voltage fluctuation is allowed.
4. The length of the cable from UHF sensor to oscilloscope should be same for all
measurement, if any comparison has to be made.
5. Also position of the sensor should be kept same if any comparison has to be made at the
level of magnitude of UHF signal formed.

18
6. The input of the oscilloscope has to be operated at 50 ohms matching impedance so that
no reflection occurs and change in the characteristics of measured signal.
7. During measurement of PD under lightning impulse, the connecting cable between the
source and test chamber should free from any discharges.
8. The contact between the source lead and the test cell is properly connected to avoid any
contact discharges.
9. The noise level of the laboratory has to be measured.
(iv) Partial Discharge Measurement System
The phase resolved partial discharge studies were carried out by using an LDIC PD detector.
This circuit was calibrated using a commercial PD calibrator (LDC5/S3) in the range 1 to 5000
pC, to inject known amount of charge. -Q analysis was carried out to understand the occurrence
of discharge in the phase of applied AC voltage. In the present work, the PD magnitude is
measured by measuring the first pulse which is appearing, irrespective of polarity of the applied
voltage, with sensitivity level of 10 pC. The PD currents are measured by connecting a series
impedance of 50 Ω and the potential drop across it is measured through the digital oscilloscope.
The important precautions considered during PRPD measurement in cryogenic power
equipment are:
1. As a first step, it is essential to identify every electrical component in the electrical circuit
should be free from any discharges.
2. PD measurement should be carried out on achieving the preset voltage magnitude.
3. The PD magnitude has to be calibrated before by injecting known magnitude of charge
signal for reference.
4. The leads connecting the circuit should be free from corona/discharges
5. Narrow/wide band PD measurement should be identified.
2.4 SAMPLE PREPARATION OF BARRIER INSULATION
Barrier insulation used in the present work is an epoxy nanocomposite insulating material. In
the present work, mechanical shear mixing technique is adopted to disperse the nano fillers in
epoxy resin. The nano clay filler used in this study was organophillic Montmorillonite clay
(MMT) procured from Southern clay products Inc. (Gonzales, Texas) under the trade name of
Garamite 1958. The Table 2.1 shows the physical properties of Garamite 1958 (Southern clay
products). The shear mixing was carried out for half an hour and then mixed with high frequency
sonicator for one hour. The temperature rise was controlled by carrying out the mixing process
19
in a water bath. After adding required amount of curing agent, the glass fiber was impregnated
with epoxy clay mixture and the laminates were cured using 10 wt% of Tri Ethylene Tetra
Amine (TETA) hardener and kept in compression molding machine at room temperature for 24
hours for complete curing. The thickness and diameter of the barrier material is 1mm and 5cm
respectively.
Table 2.1: Properties of Clay Particle
Colour Off White
Form Fine Powder
Moisture Content <6 %
Bulk Density g/cc 0.128
Specific Gravity 1.5 – 1.7
Weight loss at 1000°C 37%
The barrier fits exactly to the inner diameter of the cylindrical container and the barrier could
be positioned at the required level in the electrode gap easily. The position of the barrier is
always represented with reference to bottom ground electrode.The selection of barrier insulation
to use in cryogenic power apparatus should be based on the following important characteristics.
1. Low dissipation factor (tan δ)
2. High breakdown strength
3. Partial discharge free
4. Extremely high treeing resistivity
5. Thermal or chemical deterioration free
6. No heat cycle during operation
Incipient discharges due to corona were initiated with the needle plane configuration, where
the top electrode is a needle electrode with its tip radius of curvature of 40μm and the bottom is
a plane electrode. The gap distance between the needle tip to the ground electrode is maintained
at 3mm.
The surface discharges were simulated by placing a thin epoxy nanocomposite material of 2
mm thick in the needle plane electrode gap. The needle electrode was allowed to touch the
surface of the insulating material. On increasing the applied voltage magnitude, the discharge
gets initiated and propagates over the surface of the thin barrier insulating material simulating
surface discharges.

20
2.5 ANALYSIS OF DISCHARGES USING TERNARY PLOT
In the present work, to understand the characteristics of the UHF signal formed due to corona
discharge under harmonic AC voltages with different THDs, the partial power analysis was
carried out. The FFT output of the UHF signal, which is the input data for generating the
Ternary plot. Partial Power is calculated by summing the power spectrum in a user specified
range of frequencies, dividing it by the total power. The power spectrum was calculated up to 3
GHz. The partial powers were calculated in three zones (x= (100 kHz –1 GHz), y= (1-2 GHz)
and z= (2-3 GHz)). The triangle coordinates corresponding to normalized energy content were
calculated as follows.
Normalized energy content of x = x/(x+y+z); Normalized energy content of y= y/(x+y+z)
and the normalized energy content of z =z/(x+y+z). This process is identical to the process used
to generate the gas in oil ratio used to plot the Duval’s triangle (Duval et al., 2002).
2.6 THEORETICAL ANALYSIS
There are two important parameter which are needed to be considered in the insulation
design of power apparatus
1. Electrical stress distribution in the bulk volume of insulation
2. Dielectric strength of the material
Recently, polymer nanocomposites have drawn considerable attention because of their
potential to improve electrical, mechanical and thermal properties as compared to neat polymer.
Several physical, chemical and electrical factors can severely influence the insulating capability
of an insulating material. Electrical treeing is one of the main causes for degradation and
breakdown of insulating materials. Credible experimental data base is available on the process of
electrical treeing and subsequent breakdown phenomenon in neat polymer. Studying the
behaviour of electrical trees experimentally is an expensive and time consuming process. Thus a
need of reliable computer simulation study has been felt to produce tree patterns similar to the
experimentally generated tree patterns, keeping in mind the physical model for the initiation and
propagation of dendrite structure.
Significant work has been carried out to understand treeing phenomenon in neat polymers
but the research in the domain of nanocomposites is still in its infancy stage. Thus the author has
attempted to understand electrical treeing phenomenon in nanocomposites, through computer
simulation studies.

21
FEM based software, COMSOL V5, has been used to carry out the electrical treeing studies.
In the present work 2D modelling of electrical trees was attempted. A monolithic dielectric is
considered with a high voltage electrode inserted into it. The bottom surface of the dielectric is
connected to the ground (i.e. zero potential). The two side edges follow Neumann boundary
conditions under steady state condition.
Under steady state condition, the governing equations can be written in classical form as
0. J and 0 E … (2.1)
With electric scalar potential reduced to
0.. 2 … (2.2)
With the homogeneous conductivity the above equation reduces to Laplace equation. The
nano particles are distributed uniformly in the bulk volume of the dielectric as shown in Figure
2.5. In the present work, the nano particles are represented with definite conductivity and the
ratio between conductivity of bulk volume insulation and the nano particle conductivity forced
to be of large number. It has to be metioned that with such large conductivity of nano particle,
the field distribution is not altered in the bulk volume of insulation.
Figure 2.5: Geometry of the model used for tree simulation
A needle plane electrode configuration is used to simulate the local electric field in the
insulating material. In all the simulations, top electrode which is at high potential (30 kV) and
the bottom most layer of dielectric is assigned zero potential. The tip radius of the electrode used
in study is 50nm. The numerical values of electrical conductivity of materials used in simulation
can be found in Table 2.2.

22
Table 2.2: Electrical conductivity of materials used in study
Geometry Electrical Conductivity (S/m)
Top electrode 5.9 × 10⁷
Dielectric 1×10⁻⁴
Nanoparticles 1×10³
In the tree structure the location and direction of tree propagation is chosen at random such
that the probability of propagation is basically a power law P E where is an exponent. In
the present work the value of η is chosen as 1.0. By introducing the probability concepts, one
could equate the actual treeing phenomenon with the simulated tree structure.
The probability of growth of electrical tree can be written as
1
( , )( , ', ')
( , )n
i
E i jP i j i j
E i j
… (2.3)
Where i, j are the co-ordinates.
Once the pre-breakdown occurs, further propagation can be explained by the addition of a
link to the previous structure. The potential at each and every point has to be calculated with the
altered boundary conditions. A very important assumption made, as a first part of study, is that
the potential of the connecting links are the same as that of the top electrode, which means that
there is no potential drop along the discharge path. The tree propagation is terminated as it
reaches the required length.
In actual practice, the tip potential of the tree is not at the same as that of the applied voltage.
The tip potential could be reduced due to discontinuity in the conducting path of the tree or due
to local conditions (pressure and temperature) of tree-incepted zone. Hence, to understand the
influence of potential drop on the tree shape, a separate methodology is formulated and the rate
of tree propagation was analyzed.
23
CHAPTER 3
RESULTS AND DISCUSSION
3.1 GENERAL
This chapter presents the results obtained based on the methodical experimental study and
the theoretical analysis carried out to understand the partial discharge/ incipient discharge
activity in liquid nitrogen medium. Critical assessment of the obtained results has been made and
compared with the available literature in order to accrue important conclusions based on the
study. In general, the results of the study sectionalized in to four major parts.
1. Analysis of corona discharge activity in liquid nitrogen (with and without barrier in
the electrode gap) under AC/harmonic AC voltages adopting UHF technique.
2. Analysis of treeing phenomena in cable insulation at cryogenic temperature under
harmonic AC voltages.
3. Modelling of electrical treeing in composite insulation through COMSOL.
3.2 ANALYSIS OF CORONA DISCHARGE ACTIVITY IN LIQUID NITROGEN (WITH
AND WITHOUT BARRIER IN THE ELECTRODE GAP) UNDER AC VOLTAGES
ADOPTING UHF TECHNIQUE
With the advent of HTSC material, development of superconducting power apparatus, with
liquid nitrogen as insulant, has gained considerable importance. One of the major problems in
liquid nitrogen insulation is the formation of incipient discharges. Especially the corona
discharge activity is a major concern to insulation engineers. The most conventional way of
identifying incipient discharges is by conventional method adopting IEC 60270. The technique
has fundamental limitation for online monitoring. Thus the author has adopted UHF technique
and characterized corona discharge formation in liquid nitrogen (with and without barrier in the
electrode gap) under AC voltage.
3.2.1 Corona inception voltage (CIV) and the breakdown voltage of electrode gap with
barrier insulation
In liquid nitrogen, the breakdown occurs due to different methods and especially through
bubbles, which occur in liquid nitrogen due to any hot spot formation or due to any local
temperature variation or by due to instantaneous injection of high current, which can initiate

24
incipient discharges thereby lowering the breakdown strength. Figure 3.1 shows variation in
corona inception voltage of liquid nitrogen filled electrode gap (with barrier), under AC
voltages. The corona inception voltage was obtained based on the measurement of the first UHF
signal generated by the sensor, due to corona formation. The corona inception voltage is almost
the same (in presence of barrier) and its value is much higher than the clean electrode gap.
Assuming the needle profile is parabolic, the local electric field at the needle tip can be
calculated as (Coelho et al. 1971),
rr
p
p
d
UdE
41ln
2max
… (3.1)
Where, U is the applied voltage, rp is the tip radius, and d is the gap distance between the two
electrodes. Takahashi et al. (1975) have observed that 11 MV/cm is required for discharge
inception in vapour bubble formed in liquid nitrogen. Truong et al. (2013a) observed corona
discharge occurs in liquid nitrogen at 1.5 MV/mm. In the present work, the local electric field at
the needle tip (based on equation 3) is calculated as 0.45 MV/mm, which is much lower than the
corona discharge in liquid nitrogen. The cause for it could be due to the formation of micro
bubbles in the electrode gap. In liquid nitrogen, the bubbles originate from the hot spot zone or
due to any local temperature variation or due to, instantaneous injection of high magnitude of
current in the volume of liquid nitrogen (Kraehenbuel et al., 1994).
Figure 3.1: Variation in corona inception voltage of liquid nitrogen filled electrode gap
with barrier at different position
On application of voltage to the Needle-plane electrode gap, the micro bubbles in the
electrode gap come in contact with the needle electrode during voltage rise. The discharges get

25
initiated in the vapor bubble due to increase in electric field within the bubble. In this process,
the free electrons get injected into the vapour bubble and to the liquid nitrogen due to first
discharge, which thereby enhances the field intensity near the edges of the vapour bubble
forming sustained corona discharge activity. This discharge process cause cold plasma in the
vapour bubble raising local temperature (Denat et al., 2005). The temperature variation near the
electrode tip causes ice formation suppressing continuous corona discharge activity. By
increasing the cryostat pressure, the discharge initiated due to bubbles could be reduced
(Kraehenbuel et al., 1994). Badent et al. (1996) have reported that when hydrostatic pressure of
the liquid is increased the electrical breakdown strength increases but the number and amplitude
of injected current pulses reduces thereby reducing the streamer velocity.
Figure 3.2: Variation in Breakdown Voltage of liquid nitrogen filled electrode gap with
barrier at different position
Figure 3.2 shows breakdown characteristics of the liquid nitrogen filled electrode gap (with
barrier), under AC voltages. The breakdown voltage has increased when the barrier is positioned
near to the high voltage electrode. Topalis et al. (2005) studied breakdown in air gaps with solid
insulating barrier under impulse voltages and have observed highest breakdown strength when
the barrier is placed near 20% away from high voltage electrode. Similar characteristics were
observed in liquid nitrogen with barrier, under AC voltages.
In general, the author opines that, the breakdown characteristics (Figure 3.2) can be
sectionalized as decreasing zone (Zone 1), stabilized zone (Zone 2) and further reduction in
breakdown voltage (zone 3). Jong-man-Joung et al. (2003) have observed similar trend in their
studies. It is also noticed that the breakdown occurs through the barrier when they are near
ground electrode. Typical photograph of breakdown spot in the barrier insulation is shown in

26
Figure 3.3. If the barrier is in proximity to the needle electrode, the discharge glides over the
barrier insulation and from the edge of the barrier insulation to the ground through liquid
nitrogen, the breakdown occurs, causing increased breakdown voltage. No physical surface
damage to the barrier insulation is observed. In author’s opinion, the cause for it could be due to
liquid nitrogen which quenches the heat generated due to discharges thereby no damage occurs
to the solid barrier insulation.
Figure 3.3: Typical photograph of breakdown spot in the barrier insulation
3.2.2 Analysis of current pulse generated due to corona discharge
Figure 3.4 shows typical corona generated current pulse, with barrier in the electrode gap,
under AC voltage (Figure 3.4a and b). Also the typical UHF signal formed during current
injection is shown (Figure 3.4c).
Figure 3.4: Typical current pulse injected due to corona discharge (with barrier) (a) In
positive half cycle (b) In negative half cycle (c) Typical UHF signal formed
during current injection
The current signal injected due to corona discharge in liquid nitrogen insulation, at the point
of its inception and during streamer formation, have rise time, in the negative and positive half
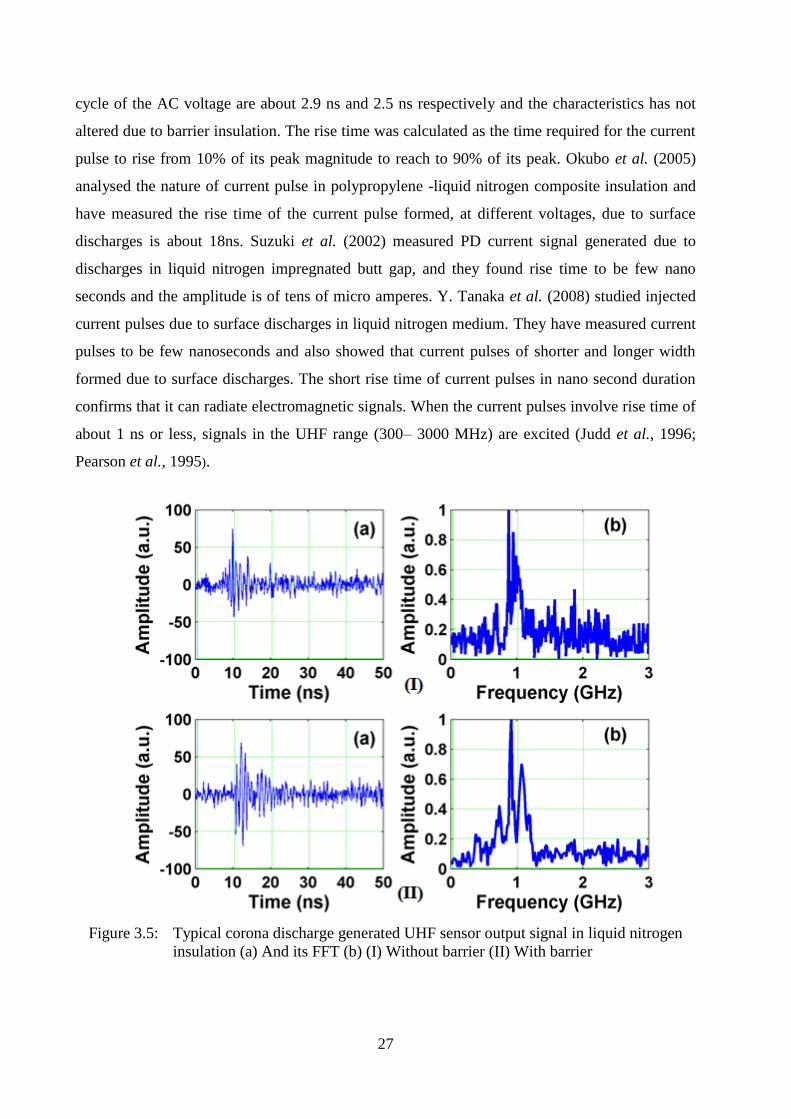
27
cycle of the AC voltage are about 2.9 ns and 2.5 ns respectively and the characteristics has not
altered due to barrier insulation. The rise time was calculated as the time required for the current
pulse to rise from 10% of its peak magnitude to reach to 90% of its peak. Okubo et al. (2005)
analysed the nature of current pulse in polypropylene -liquid nitrogen composite insulation and
have measured the rise time of the current pulse formed, at different voltages, due to surface
discharges is about 18ns. Suzuki et al. (2002) measured PD current signal generated due to
discharges in liquid nitrogen impregnated butt gap, and they found rise time to be few nano
seconds and the amplitude is of tens of micro amperes. Y. Tanaka et al. (2008) studied injected
current pulses due to surface discharges in liquid nitrogen medium. They have measured current
pulses to be few nanoseconds and also showed that current pulses of shorter and longer width
formed due to surface discharges. The short rise time of current pulses in nano second duration
confirms that it can radiate electromagnetic signals. When the current pulses involve rise time of
about 1 ns or less, signals in the UHF range (300– 3000 MHz) are excited (Judd et al., 1996;
Pearson et al., 1995).
Figure 3.5: Typical corona discharge generated UHF sensor output signal in liquid nitrogen
insulation (a) And its FFT (b) (I) Without barrier (II) With barrier

28
In general, it is observed that the results obtained by the author correlates well with the
results of other researchers and could conclude that the PD/ incipient discharge current pulses
generated due to corona discharge in liquid nitrogen have rise time of few ns.
3.2.3 Characteristics of UHF sensor signal generated due to corona discharges
Figure 3.5a shows corona discharge generated UHF sensor output signal and its FFT output
is shown Figure 3.5b, under AC voltages. The UHF signals generated at corona inception
voltage and at higher voltages, in the liquid nitrogen electrode gap (with barrier) have frequency
contents between 0.5 -1.5 GHz.
Figure 3.6: Typical UHF sensor signal measured in sequence mode (a) On corona
inception (b) At 20 kV
Figure 3.6 shows typical UHF signal generated due to corona discharge activity, in sequence
mode. It is clear that low and high magnitude of UHF signal is formed during corona discharge
process. Denat (2005) studied discharge process in liquid nitrogen and reported that discharge
path is a vapor column and by avalanche ionization within the vapor column energy is imparted
to the liquid molecules adjacent to it causing further growth of streamers. He concluded that
filamentary channels propagate in the direction of high electric field and have observed higher
magnitude of injected current during propagation. Beroual et al. (1998) have observed in liquid
insulation that the irregular discharges are the indication of growth of streamer in steps. Hebner
(1988) concluded that increasing the electric field leads to the formation of streamers which are
filamentary in structure. Truong et al. (2013b) used high speed camera images to understand the
discharge process and could conclude that low magnitude discharges occurs when bush type
discharge occurs and on its transition to streamer, high magnitude UHF signal occurs.
Figure 3.7 shows UHF signal magnitude variation on corona inception (with barrier at
different levels in electrode gap) and at and at higher voltages. The magnitude of UHF signal

29
generated on corona inception is high when the barrier is in middle of the electrode gap and at
the same time, its magnitude gets reduced when the applied voltage magnitude is increased. It
could be due to predomination of surface discharge activity with the barrier insulation, where
low magnitude discharges occurs.
Figure 3.7: Variation in peak to peak voltage of UHF sensor signal generated by corona
discharge (with barrier) in liquid nitrogen (A) With barrier at 20 kV (B) With
barrier at inception (C) Clean electrode gap at 20 kV (D) Clean electrode gap at
inception
3.2.4 Corona generated UHF Sensor signal analysis using spectrum analyzer
In recent times, condition monitoring of power apparatus adopting UHF technique has
gained considerable importance to use in GIS and transformers for identification of incipient
discharges. The analysis of UHF signals through spectrum analyser has added advantage to
operate it in full span and zero span mode. The full span analysis can provide the frequency
contents present in the signal and zero span mode can provide signal with particular frequency
content. A spectrum analyzer (SA) performs a Fourier analysis of a (continuous) input signal.
Like a radio receiver it tunes at consecutive frequencies and could measure the amplitude of the
spectral content of the input signal at the tuned frequency. Compared with the broadband
approach, the narrow band UHF method has the advantage that incipient discharge signals can
be distinguished from external signals in a densely occupied UHF frequency spectrum so that
much better signal to noise ratio can be achieved (Feger et al., 1999). Thus a single dominant
frequency measurement is helpful for recording the general dynamics of discharges.
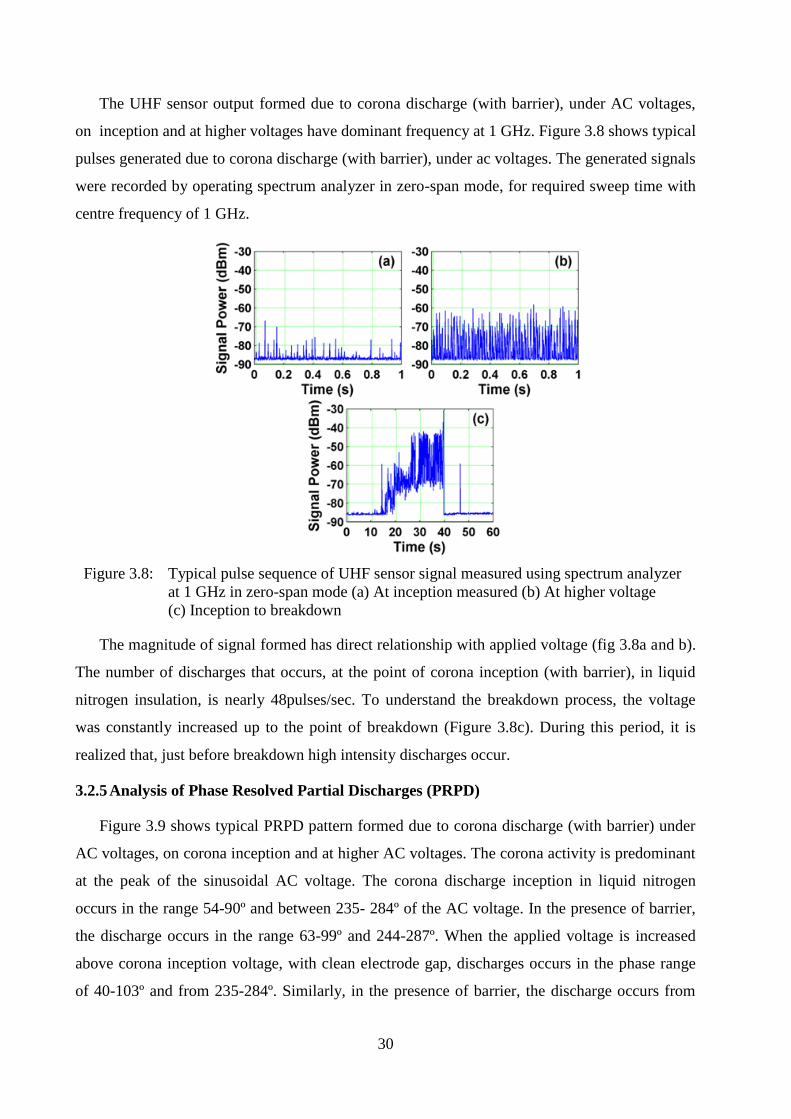
30
The UHF sensor output formed due to corona discharge (with barrier), under AC voltages,
on inception and at higher voltages have dominant frequency at 1 GHz. Figure 3.8 shows typical
pulses generated due to corona discharge (with barrier), under ac voltages. The generated signals
were recorded by operating spectrum analyzer in zero-span mode, for required sweep time with
centre frequency of 1 GHz.
Figure 3.8: Typical pulse sequence of UHF sensor signal measured using spectrum analyzer
at 1 GHz in zero-span mode (a) At inception measured (b) At higher voltage
(c) Inception to breakdown
The magnitude of signal formed has direct relationship with applied voltage (fig 3.8a and b).
The number of discharges that occurs, at the point of corona inception (with barrier), in liquid
nitrogen insulation, is nearly 48pulses/sec. To understand the breakdown process, the voltage
was constantly increased up to the point of breakdown (Figure 3.8c). During this period, it is
realized that, just before breakdown high intensity discharges occur.
3.2.5 Analysis of Phase Resolved Partial Discharges (PRPD)
Figure 3.9 shows typical PRPD pattern formed due to corona discharge (with barrier) under
AC voltages, on corona inception and at higher AC voltages. The corona activity is predominant
at the peak of the sinusoidal AC voltage. The corona discharge inception in liquid nitrogen
occurs in the range 54-90º and between 235- 284º of the AC voltage. In the presence of barrier,
the discharge occurs in the range 63-99º and 244-287º. When the applied voltage is increased
above corona inception voltage, with clean electrode gap, discharges occurs in the phase range
of 40-103º and from 235-284º. Similarly, in the presence of barrier, the discharge occurs from

31
50-130º and for 217-288º. This clearly indicates the phase window at which the corona discharge
occurs (with or without barrier insulation) at the point of inception is less compared with
discharges at higher voltage. Swaffield et al. (2008) concluded that number of discharges that
occurs from cathode top is high but magnitude of discharges is low and the converse with anode
initiated streamers. Takahashi and Ohtsuka (1975) carried out corona study in liquid nitrogen
and have concluded that the corona inception voltage is smaller with the point negative than with
the point positive, and increases as the gap spacing increases. Negative corona pulses are more
frequent but smaller than positive ones. The height and repetition rate of the pulse with the point
negative increase as the gap spacing decreases. The corona is accompanied by bubbling similar
to a spray jet from the point tip. The bubbling formed is independent of the polarity of the
applied voltage. Kurihara et al. (2004) carried out PD study in artificial air filled void in solid
insulator at liquid nitrogen temperature and have concluded that PD magnitude and number of
pulses formed are different at low temperature and at room temperature.
Figure 3.9: Typical PRPD pattern formed due to corona discharge (I) Without barrier (II) With
barrier (a) At Inception (b) At higher voltage
It is well known that formation of ice in liquid nitrogen is one of the major problems and if
any ice forms at the tip of the sharp protrusion in the electrode gap, it can alters the discharge
characteristics. Hanaoka et al. (1993) carried out influence of ice layer on pre breakdown current
in liquid nitrogen. They have concluded that ice present at tip of needle in the needle plane
configuration increases the discharge inception voltage and the breakdown voltage. In the
present work, corona discharge activity predominates at the first stage (Figure 3.9(ii) a) and at
slightly higher voltages surface discharge along with corona activity is observed, causing
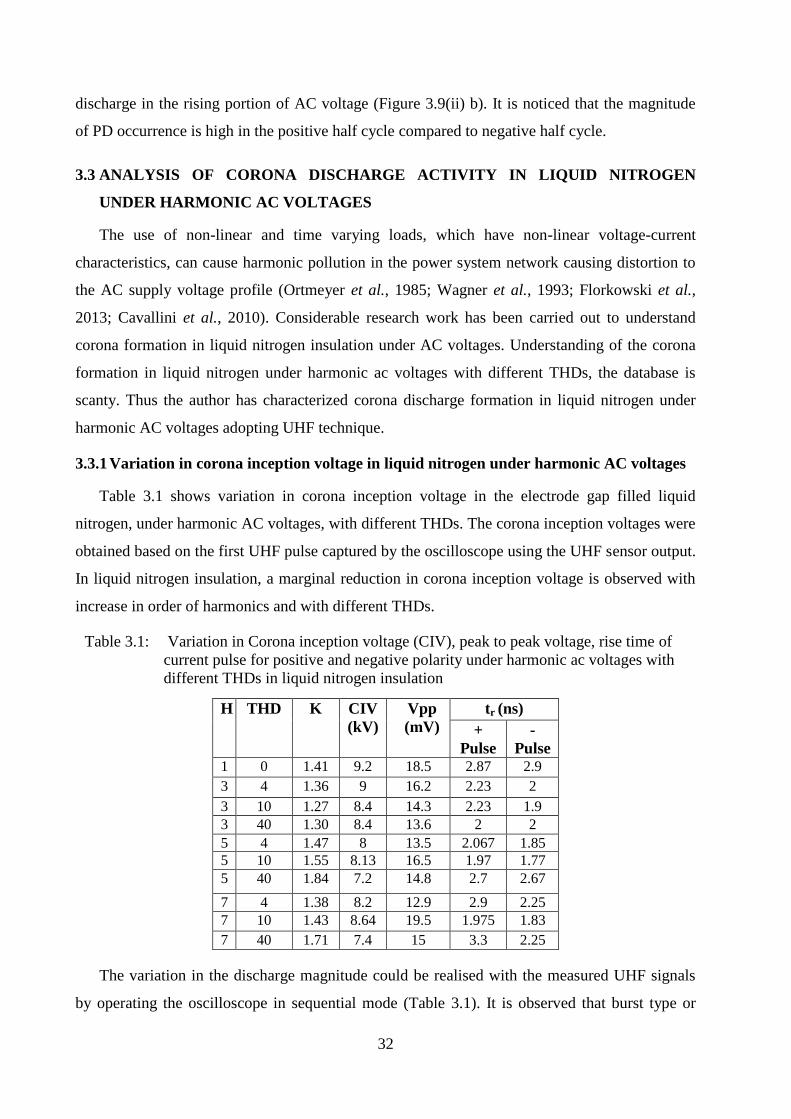
32
discharge in the rising portion of AC voltage (Figure 3.9(ii) b). It is noticed that the magnitude
of PD occurrence is high in the positive half cycle compared to negative half cycle.
3.3 ANALYSIS OF CORONA DISCHARGE ACTIVITY IN LIQUID NITROGEN
UNDER HARMONIC AC VOLTAGES
The use of non-linear and time varying loads, which have non-linear voltage-current
characteristics, can cause harmonic pollution in the power system network causing distortion to
the AC supply voltage profile (Ortmeyer et al., 1985; Wagner et al., 1993; Florkowski et al.,
2013; Cavallini et al., 2010). Considerable research work has been carried out to understand
corona formation in liquid nitrogen insulation under AC voltages. Understanding of the corona
formation in liquid nitrogen under harmonic ac voltages with different THDs, the database is
scanty. Thus the author has characterized corona discharge formation in liquid nitrogen under
harmonic AC voltages adopting UHF technique.
3.3.1 Variation in corona inception voltage in liquid nitrogen under harmonic AC voltages
Table 3.1 shows variation in corona inception voltage in the electrode gap filled liquid
nitrogen, under harmonic AC voltages, with different THDs. The corona inception voltages were
obtained based on the first UHF pulse captured by the oscilloscope using the UHF sensor output.
In liquid nitrogen insulation, a marginal reduction in corona inception voltage is observed with
increase in order of harmonics and with different THDs.
Table 3.1: Variation in Corona inception voltage (CIV), peak to peak voltage, rise time of
current pulse for positive and negative polarity under harmonic ac voltages with
different THDs in liquid nitrogen insulation
H THD K
CIV
(kV)
Vpp
(mV)
tr (ns)
+
Pulse
-
Pulse 1 0 1.41 9.2 18.5 2.87 2.9
3 4 1.36 9 16.2 2.23 2
3 10 1.27 8.4 14.3 2.23 1.9 3 40 1.30 8.4 13.6 2 2
5 4 1.47 8 13.5 2.067 1.85 5 10 1.55 8.13 16.5 1.97 1.77 5 40 1.84 7.2 14.8 2.7 2.67
7 4 1.38 8.2 12.9 2.9 2.25 7 10 1.43 8.64 19.5 1.975 1.83
7 40 1.71 7.4 15 3.3 2.25
The variation in the discharge magnitude could be realised with the measured UHF signals
by operating the oscilloscope in sequential mode (Table 3.1). It is observed that burst type or

33
impulsive type discharge occurs at the point of inception and during propagation. The peak to
peak amplitude of the UHF signal is the magnitude between the highest peak in positive and the
negative half cycle of the UHF signal generated. It is observed (Table 3.1) that UHF signal
magnitude formed at the point of corona inception, is almost constant irrespective of harmonic
AC voltage with different THDs. It is observed that with increase in applied AC voltage, above
corona inception voltage, irrespective of harmonics with different THDs, shows an increase in
UHF signal magnitude.
3.3.2 Analysis of injected current pulse due to corona discharge activity in presence of
harmonic AC voltages
Figure 3.10 shows typical wave shape of the injected current pulse generated due to corona
discharge, in the positive and negative half cycle of the applied AC voltage (Figure 3.10a and b).
Also the typical UHF signal formed during current injection is shown (Figure 3.10c). The shape
of the current signal generated due to corona discharge in liquid nitrogen under harmonic AC
voltages with different THDs is nearly the same. In general, the rise time of the current signal
generated in the negative half cycle is always less than in the positive half cycle. The rise time
was calculated as the time required for the current pulse to rise from 10% to 90% of its peak
magnitude.
Figure 3.10: Typical current pulse injected due to corona discharge under harmonic AC voltages
in liquid nitrogen insulation (a) In positive half cycle (b) In negative half cycle
(c) Typical UHF signal formed during current injection
3.3.3 Analysis of UHF signal generated due to corona discharge in presence of harmonic
AC voltages
Figure 3.11 shows FFTs of the UHF signals generated due to corona discharge activity in
liquid nitrogen under harmonic AC voltages with different THDs. It demonstrates that UHF
signals are generated by corona discharges, under AC voltage, in the liquid nitrogen. Generated
0 10 20 30 40 50Time (ns)
Am
plitu
de (
a.u
)
(c)
(b)
(c)
(b)
(c)
(b)
(a)
(c)

34
signals lie in the frequency range of 0.7- 1.5 GHz. Also the bandwidth of the UHF signals
generated due to corona discharge under harmonic AC voltages with different THDs at the point
of its inception and at higher voltages remains the same.
Figure 3.11: FFT analysis of UHF signal generated due to corona discharge under harmonic AC
voltages with different THDs in liquid nitrogen insulation
3.3.4 Classification of discharges using ternary diagram
Figure 3.12 shows typical ternary diagram obtained for the discharges initiated due to corona
activity under harmonic AC voltages with different THDs. It is observed that there is no change
in location in the ternary plot with UHF signals obtained due to corona discharges. This clearly
indicates that irrespective of level of harmonics with different THDs, the characteristics of UHF
signal formed due to corona activity under harmonic AC voltages with different THDs are the
same.
Figure 3.12: Typical Ternary diagram obtained due to corona discharge under harmonic AC
voltages with different THDs in liquid nitrogen insulation
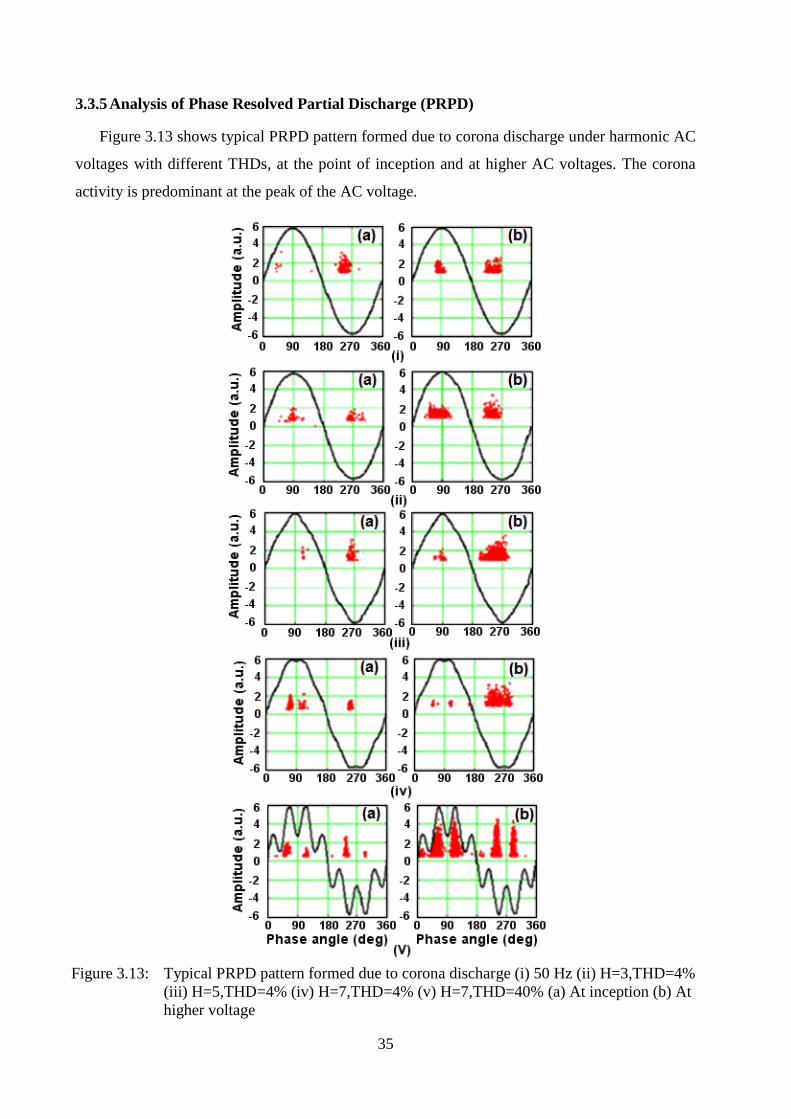
35
3.3.5 Analysis of Phase Resolved Partial Discharge (PRPD)
Figure 3.13 shows typical PRPD pattern formed due to corona discharge under harmonic AC
voltages with different THDs, at the point of inception and at higher AC voltages. The corona
activity is predominant at the peak of the AC voltage.
Figure 3.13: Typical PRPD pattern formed due to corona discharge (i) 50 Hz (ii) H=3,THD=4%
(iii) H=5,THD=4% (iv) H=7,THD=4% (v) H=7,THD=40% (a) At inception (b) At
higher voltage

36
It is observed that corona discharge inception in liquid nitrogen occurs in the range 37-55º
and between 229- 266º in the positive and negative half cycle of the AC voltage respectively.
When the applied voltage is increased, corona discharge occurs in the phase range of 73-100º
and from 219-270º, of the applied AC voltage. In the presence of harmonics, the phase at which
the corona inception occurs depends on the rate of rise of voltage than the peak of the applied
AC voltage. It was observed that when the applied voltage magnitude is increased much above
the corona inception voltage, low magnitude discharges occurs at the rising portion and high
magnitude discharges occurs at the peak of the applied voltage.
3.4 ELECTRICAL TREEING IN CABLE INSULATION AT LIQUID NITROGEN
TEMPERATURE
One of the mechanisms by which the solid insulating material can fail, is due to electrical
treeing. The influence of ambient temperature on tree inception and propagation is known to
some extend under AC voltages. In recent times, with the increase in non-linear load the supply
voltage gets polluted and the cryogenic equipment connected with the system gets subjected to
the polluted supply voltage. Thus it is essential to understand the fundamental aspects of treeing
phenomena in solid insulation (XLPE material) under harmonic AC voltage, which forms third
part of the present study.
3.4.1 Characterization of Trees formed under harmonic AC voltage
Figure 3.14 shows typical electrical tree structure formed in XLPE cable insulation
immersed in liquid nitrogen under harmonic AC voltages. The shape of electrical trees formed
under different voltage profiles depends basically on the local electric field near the tree
inception zone/defect site. Mason (1955) suggested the local electric field (Emax) at the needle tip
electrode as
r
dr
UdE
41ln
2max … (3.2)
Where, r is the radius of curvature of the high voltage needle electrode, d is the gap distance
between the needle tip and the ground electrode and U is the magnitude of the applied AC
voltage. Thus, on application of high voltage to the needle electrode, the local electric field at
the tip of the needle/defect site enhances and if the local electric field is sufficiently higher than
breakdown strength of the material, incipient discharge occurs. It is observed that an intrinsic
type or a fibrillar type tree form under AC / harmonic AC voltage. Kosaki et al. (1996) observed
that tree inception voltage in XLPE cable insulation, at low temperature, is much higher than the
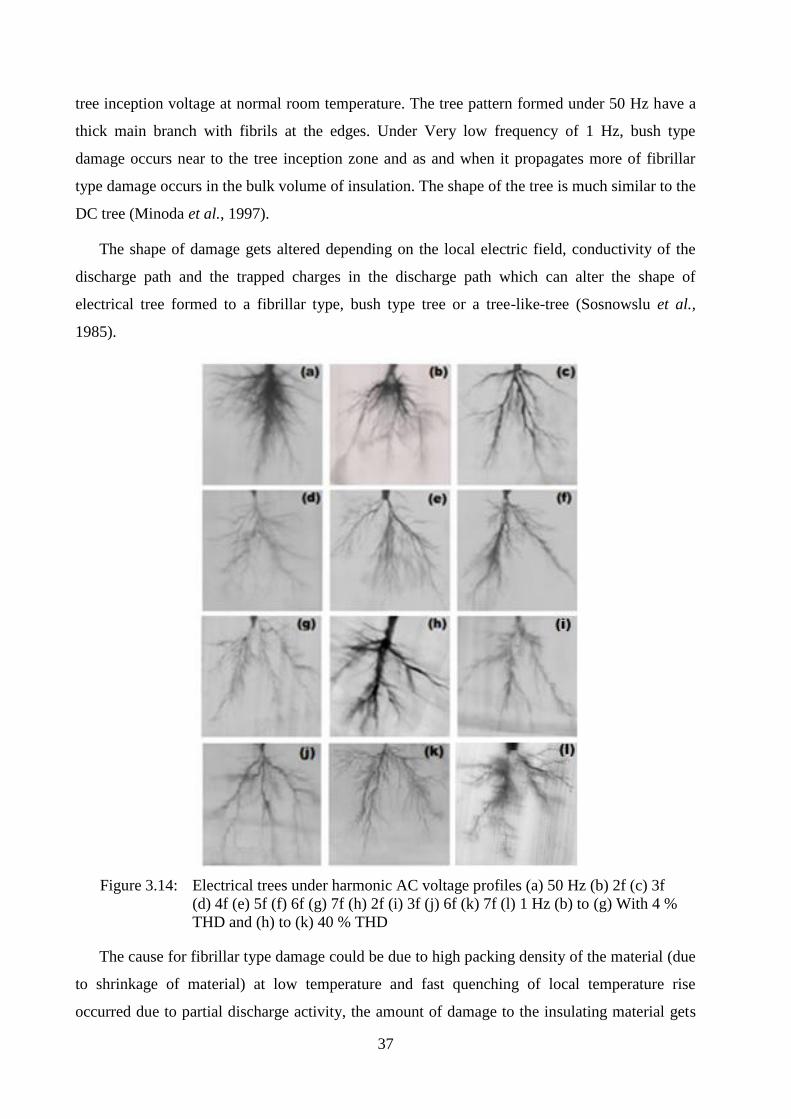
37
tree inception voltage at normal room temperature. The tree pattern formed under 50 Hz have a
thick main branch with fibrils at the edges. Under Very low frequency of 1 Hz, bush type
damage occurs near to the tree inception zone and as and when it propagates more of fibrillar
type damage occurs in the bulk volume of insulation. The shape of the tree is much similar to the
DC tree (Minoda et al., 1997).
The shape of damage gets altered depending on the local electric field, conductivity of the
discharge path and the trapped charges in the discharge path which can alter the shape of
electrical tree formed to a fibrillar type, bush type tree or a tree-like-tree (Sosnowslu et al.,
1985).
Figure 3.14: Electrical trees under harmonic AC voltage profiles (a) 50 Hz (b) 2f (c) 3f
(d) 4f (e) 5f (f) 6f (g) 7f (h) 2f (i) 3f (j) 6f (k) 7f (l) 1 Hz (b) to (g) With 4 %
THD and (h) to (k) 40 % THD
The cause for fibrillar type damage could be due to high packing density of the material (due
to shrinkage of material) at low temperature and fast quenching of local temperature rise
occurred due to partial discharge activity, the amount of damage to the insulating material gets

38
reduced thereby forming thin fibrillar type damage than voluminous damage that occurs in same
material at room temperature (Sarathi et al., 2012). It is also observed with higher order
harmonics with increased THD, the diameter of the main branch is reduced and more of fibrillar
type structure forms.
Since the level of carbonization is less, the tree growth mostly depends on the local electric
field at the edges of the tree than the treed zone. Densley (1979) studied the tree growth in XLPE
insulation at room temperature and has concluded that under AC voltage, mostly bush type of
trees are formed and the trapped charges alters the shape of the trees. Sometimes the charges are
also injected into the insulation structure through the defect formed zone-enhancing field at one
point causing further enlargement of the channel resulting in “Tree-like” tree structure.
Otherwise local discharges will occur causing increased diameter of the damaged zone forming
“Bush-type” of electrical tree. Some author (Olyphant, 1963) suggested that channel propagation
will continue provided there is a critical energy stored at the tip of the channel allowing
degradation of the material by discharges. If there is no sufficient energy, the channel will stop
growing and discharge will recur in the main branches forming a Bush-type tree structure.
The author’s opinion based on the experimental study is that, stressing the insulation ( at
room temperature) at higher voltages will result in formation of Tree-like tree structures and in
turn at lower voltages, local damage will cause formation of Bush-type of tree structures. Also it
is observed from the experimental study that, under low voltages, the unfailed samples were
found to have tree structures. Whereas, in the specimens stressed at high voltage magnitudes, no
clear cut tree structures were noticed. This is due to the injected charges which cause local
reaction at some point surrounding the pin electrode, initiating the tree to form quickly and reach
the ground electrode causing breakdown. Whereas at the low voltage magnitude, the injected
electrons will not attain sufficient energy to cause cleavage of material and only local discharge
will occur increasing the diameter of the defect. This allows us to conclude that even the damage
is voluminous, Bush-type tree structures is less dangerous compared to Tree-like tree structures,
where the rate of propagation is aided by the applied voltage. At low temperature, the inception
voltage is high and even the rate of propagation is very much reduced under AC voltage. More
than that, the shape of electrical tree formed is almost bush type of tree under AC voltages,
irrespective of applied AC voltage magnitude, which is much different from room temperature,
generated electrical trees.

39
3.4.2 Life Estimation of XLPE cable Insulation
The life of insulation material could be assessed by certain statistical techniques. Normally,
the life of insulation is estimated by obtaining failure time from a specified number of samples.
Repeating the test several times with identical specimens usually yields greatly varying values of
failure times. It has been identified earlier that life of insulation structure could be estimated
using Weibull distribution. The experimental data are used to estimate the parameters of the
distribution.
Failure analysis of XLPE cable insulation due to electrical treeing was studied through
Weibull probability distribution. Treeing studies were carried out with 20 specimens and their
failure times were observed for the first 10 failures and the remaining samples were used for
observing the shape of the tree formed.
It is well established that the two parameter (scale parameter (α) and shape parameter (β))
Weibull probability distribution function is used for understanding the failure analysis of
insulating material and the function is written as (Nelson et al., 1982)
ttF exp1
… (3.3)
Where F(t) is the ratio of specimens which fail in time ‘t’. The scale parameter (α) indicates the
time required for 63.2% of specimen fails.
Figure 3.15: Weibull distribution plot for the failure times of XLPE cable insulation due to
electrical trees under harmonic AC voltages (a) 4% THD (b) 40% THD
Figure 3.15 shows Weibull plot of failure times of XLPE cable specimen failure due to
electrical tree under harmonic AC voltages. Table 3.1 shows the Weibull distribution parameters
obtained from the failure times of XLPE cable insulation due to electrical treeing. A reduction in

40
characteristic life (α) of cable insulation failure due to electrical trees is observed with increase
in order of harmonics and THDs. Nguyen et al., studied breakdown characteristics of kapton
layers at low temperatures and have observed that Weibull shape parameter reduces with
increase in number of layers of the film. The cause for it is due to formation of bubbles in the
layers and contaminants in bulk insulation [22]. Bahadoorsingh et al., have analysed failure
characteristics of XLPE cable insulation due to treeing under AC voltages through Weibull
studies. They have reported that an increase in value of β is an indication of increase in failure
time of the insulating material due to treeing. Similar characteristics were observed with XLPE
cable insulation failure due to treeing under harmonic AC voltage, with cable insulation at liquid
nitrogen temperature.
Table 3.2: Shows the Weibull distribution parameter characteristics life (α) and shape
factor (β) and peak factor of applied AC voltage
K %
THD
(α) (β) Peak
Factor
f (50 Hz) - 95.46 1.523 1.41
2f 4 287.34 1.758 1.41
3f 4 81.39 2.925 1.35
4f 4 33.31 2.065 1.42
5f 4 35.72 2.471 1.46
6f 4 67.80 2.478 1.44
7f 4 154.61 1.569 1.37
2f 40 48.37 2.630 1.59
3f 40 89.10 1.407 1.30
4f 40 32.18 3.013 1.75
5f 40 29.24 1.495 1.83
6f 40 36.59 2.105 1.79
7f 40 17.79 3.148 1.71
1 Hz* - 1462.6 2.829 1.41
* applied voltage 14 kV
Failure time due to treeing is high under 2nd and 7th harmonic AC voltage with 4% THD. It
is also noticed that failure times is reduced to one third with fourth and fifth harmonic voltage
compared with 50 Hz AC voltage. For harmonics with higher THD’s, the failure times are nearly
the same. Florkowski et al. (1997) have clearly indicated that partial discharge activity has high

41
dependency on applied voltage wave shape. Thus, the results of the study indicate that on
inception of electrical tree, the rate of change of voltage, and the peak factor of the applied AC
voltage alter the number of partial discharge occurrences near the treed zone; thereby varying
time to failure of cable insulation due to treeing. It is also observed (Table 3.2) that higher the
peak-factor of the harmonic AC voltage, shorter the life of insulating material due to treeing.
3.4.3 Characterization of UHF signal
Figure 3.16a and b shows typical time domain and frequency domain analysis of UHF signal
generated during tree growth in XLPE cable insulation at low temperature. Fig. 3.16c and d
shows the typical FFT analysis of the UHF signal formed during the tree growth under harmonic
AC voltages with 4% and 40% THDs respectively. The frequency content of the UHF signal
formed during tree propagation in XLPE cable insulation at low temperature lies in the range 0.5
– 1.5 GHz. Sarathi et al. (2012) studied treeing phenomena in XLPE cable insulation under odd
harmonic voltages and have observed frequency content of UHF signal in the same range but the
shape of tree formed are different. The characteristics of the UHF signal formed during tree
growth in XLPE cable insulation at low temperature, under harmonic voltages and at VLF
voltage are the same.
Figure 3.16: Typical UHF signal generated during tree growth (a) and its corresponding FFT
analysis (b) (c) FFT analysis of UHF signal generated during tree growth under
harmonic AC voltage with 4%THD and (d) 40%THD
3.4.4 Phase analysis of discharges during tree growth using UHF signals
UHF signal formed during tree growth have dominant frequency of 1 GHz and hence the
spectrum analyser was operated in zero span mode with 1 GHz component. The typical spectrum

42
obtained during tree growth along with indicating phase of the supply voltage at which discharge
occurs, is shown in Figure 3.17.
Figure 3.17: Phase resolved partial discharge analysis using spectrum analyser by operating
in Zero Span mode (a) 50 Hz (b) 1 Hz
(i) (ii)
Figure 3.18: Phase resolved partial discharge analysis using spectrum analyser by operating
in Zero Span mode (a) 2f (b) 3f (c) 4f (d) 5f (e) 6f (f) 7f (i) 4% THD (ii) 40%
THD
It is shown that, under 50 Hz AC voltage, the discharges occur near the zero crossing (Figure
3.17a) as it is observed at room temperature (Suwarno et al., 1996; G. Lupo et al., 2000). Under
very low frequency voltages, especially under 1.0 Hz, discharges occur at the peak of the AC
voltage (Fig. 3.17b).Under harmonic AC voltages, with lower THDs, the discharges occur at the
raising portion of the applied voltage than at the peak of the AC voltage (Figure 3.18). It can also
be realized that irrespective of harmonics voltage with different THDs, the discharges occur
when the rate of rise of voltage is high. The characteristics are much similar to electrical trees

43
generated under harmonic voltages at room temperature (Sarathi et al., 2012). Florkowska et al.
(2006) studied partial discharge activity with stator bar thermoset insulation under standard and
non standard voltage profiles. Partial discharge (PD) pulse phase density shows good correlation
with applied voltage slew-rate as reported in their work.
Suwarno et al. (1995) have showed that the magnitude of PD number increases with applied
voltage. It is observed that, the number of discharges that occur with harmonic voltages (with
higher THDs) is much high than under 50 Hz AC voltages.
3.5 MODELLING OF ELECTRICAL TREES
In recent times, with the increase in operating voltage magnitude, it has become essential to
design and develop insulating material with higher operating stress. There are various factors
which can influence the formation of electrical trees. Simulating the experimental condition is a
major drawback and carrying out experiments requires longer time and more than that it requires
sophisticated equipments to visualise the treed zone. Hence modelling is important and it can
help us to incorporate mathematical formalism for the physical phenomena to understand the
dynamics of the treed structure. The literature on modeling of treeing phenomenon in
nanocomposites material is scanty. Hence the author has made an attempt to model the tree
growth with nano particle dispersion in base insulating material. The author has used COMSOL
has been used to calculate the local electric fields.
In the present work, the influence of the diameter of nanofillers on electrical tree propagation
in nanocomposites is studied. The diameter of nanofillers is varied from 10nm to 50 nm and the
total number of steps required for tree to reach the ground electrode is calculated to understand
propagation rate of electrical tree.
First Niemeyer et al., (1984) modeled the gaseous discharge patterns by adopting statistical
techniques (NPW model). Following NPW model, Wiesmann and Zeller (1986), introduced the
WZ model for the study of growth dynamics of electrical tree in solid insulation. The WZ model
indicates that the local electric field determines the shape of the tree. Later by adopting WZ
model, Barclay et al. (1990) studied the chaotic behavior of electrical trees using fractal
geometry studies. They have concluded that the field exponent η decide the size and shape of
tree. Increasing the value of exponent η in the model simulates intrinsic type breakdown pattern
with few side branches. Kudo (1998) simulated the electrical tree patterns and classified the tree
patterns based on fractal dimension.
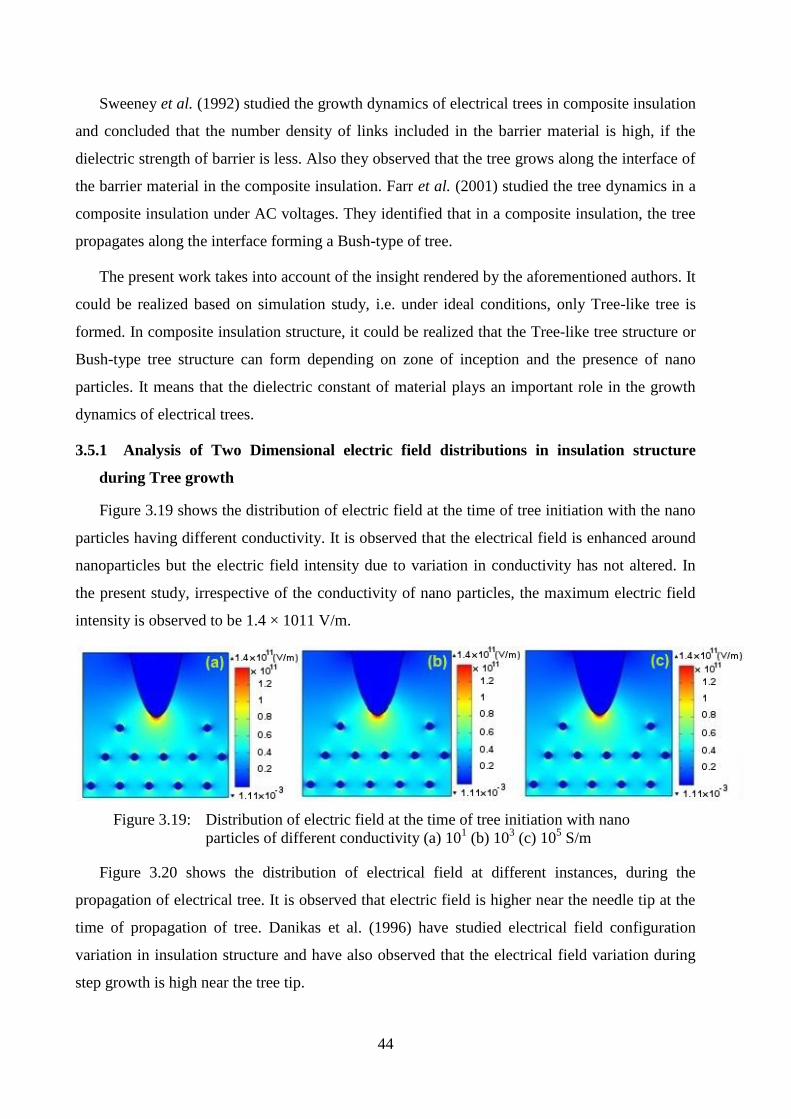
44
Sweeney et al. (1992) studied the growth dynamics of electrical trees in composite insulation
and concluded that the number density of links included in the barrier material is high, if the
dielectric strength of barrier is less. Also they observed that the tree grows along the interface of
the barrier material in the composite insulation. Farr et al. (2001) studied the tree dynamics in a
composite insulation under AC voltages. They identified that in a composite insulation, the tree
propagates along the interface forming a Bush-type of tree.
The present work takes into account of the insight rendered by the aforementioned authors. It
could be realized based on simulation study, i.e. under ideal conditions, only Tree-like tree is
formed. In composite insulation structure, it could be realized that the Tree-like tree structure or
Bush-type tree structure can form depending on zone of inception and the presence of nano
particles. It means that the dielectric constant of material plays an important role in the growth
dynamics of electrical trees.
3.5.1 Analysis of Two Dimensional electric field distributions in insulation structure
during Tree growth
Figure 3.19 shows the distribution of electric field at the time of tree initiation with the nano
particles having different conductivity. It is observed that the electrical field is enhanced around
nanoparticles but the electric field intensity due to variation in conductivity has not altered. In
the present study, irrespective of the conductivity of nano particles, the maximum electric field
intensity is observed to be 1.4 × 10¹¹ V/m.
Figure 3.19: Distribution of electric field at the time of tree initiation with nano
particles of different conductivity (a) 101 (b) 10
3 (c) 10
5 S/m
Figure 3.20 shows the distribution of electrical field at different instances, during the
propagation of electrical tree. It is observed that electric field is higher near the needle tip at the
time of propagation of tree. Danikas et al. (1996) have studied electrical field configuration
variation in insulation structure and have also observed that the electrical field variation during
step growth is high near the tree tip.

45
Figure 3.20: Distribution of electric field during tree propagation after (a) 100 (b) 300
(c) 500 and (d) 700 iterations (i) Without nanoparticles (ii) 10 nm (iii) 20 nm
(iv) 30 nm (v) 40 nm (vi) 50 nm diameter of Nanoparticles
Figure 3.21 shows patterns of electrical tree generated under the change of the diameter of
nano particle. It is clear from Figure 3.19 that in case of neat polymer, direct tree channel
propagates towards the ground electrode but in the case of nanocomposites the degree of
branching is comparatively high, clearly indicating the difference in the mechanism of tree
propagation in case of nanocomposites. Also the degree of branching increase with the increase

46
in the diameter of the nano particles and tree propagates through multiple channels when
diameter of nanoparticles is higher or equal to 30nm.
Figure 3.21: Typical tree generated in the presence of nano particles of different size
(a) Without nanoparticle (b) 10 nm (c) 20 nm (d) 30 nm (e) 40 nm (f) 50
nm diameter of nanoparticle
The comparison of treeing propagation rate with nano particles of various diameters is done
on the basis of number of iterations required for tree to reach the ground electrode. Figure 3.22
shows the variation of number of iterations with change in diameter of nano particles.
Figure 3.22: Variation in the number of iterations corresponding with the change in
diameter of nano particles
It is clear from Figure 3.22 that the number of iterations is high when fillers are present in
the dielectric, which clearly indicates that electrical trees have lower propagation rate in case of
nanocomposites as compared to neat polymer. The slow propagation rate in nanocomposites
10 20 30 40 50600
700
800
900
1000
1100
Nu
mb
er
of
Ite
rati
on
s
Diameter of Nano Particles
With fillers
Without fillers

47
may be because of the enhanced local conductivity in the region around each nanoparticle,
which provides mechanism for redistribution of charge around the nanoparticle and thus slowing
the propagation of electrical tree.
Figure 3.23: Variation in the velocity of tree propagation with the length of tree
Figure 3.23 shows the variation in the velocity of tree propagation. Irrespective of size and
the presence of nano particles in polymers, a sharp rise in the velocity of tree propagation is
observed near the point of breakdown. It is also observed that in case of neat polymer, the
velocity of tree propagation is constant till the tree grows to 416 nm in length, while in case of
nanocomposites, a reduction in the velocity of tree propagation is observed for 416 nm of tree
growth. It is also evident from the Figure 3.22 and Figure 2.23 that the tree propagation is
significantly delayed when diameter of nanofillers is greater than or equal to 30 nm. The
possible reason for this delay may be the reduction in inter particle distance. As the diameter of
nanoparticle increases, the inter particle distance decreases, which makes the propagation of tree
more difficult and delays the process as a result. M.G. Danikas and T. Tanaka (2009) have
discussed in detail about electrical treeing and breakdown phenomenon in nanocomposites. They
have shown experimental evidence of the obstruction created by the nanoparticles to electrical
tree propagation and have observed zig-zag tree path because of this obstruction, delaying the
tree growth. They have also stated that the decrease in inter particle distance has positive effect
on tree delay to reach to the ground electrode. Also it is noticed that when the tree reaches near
to ground electrode, the rate of propagation is high.
48
CHAPTER 4
CONCLUSIONS
4.1 GENERAL
This chapter presents the results obtained based on the methodical experimental study and
the theoretical analysis carried out to understand incipient discharges in cryogenic insulation
structure. The results obtained are thoroughly analyzed and the interpretation is made on
comparison with the earlier work carried out by other researchers. The important conclusions
arrived at based on the present study are narrated in this chapter.
In general, the conclusions were broadly classified under following sections
(i) Analysis of corona discharge activity in liquid nitrogen (with and without barrier in the
electrode gap) under AC/harmonics AC voltages adopting UHF technique.
(ii) Analysis of corona discharge activity in liquid nitrogen under harmonic AC voltages.
(iii) Analysis of treeing phenomena in cable insulation at cryogenic temperature under
harmonic AC voltages.
(iv) Modelling of electrical treeing in composite insulation through Comsol.
It is well known that most of the studies on corona activity in liquid nitrogen are based on
conventional partial discharge measurement studies. In the present work, the author has made an
attempt to understand corona activity in liquid nitrogen in presence of barrier in the electrode
gap and the important conclusions are narrated below.
1. In short electrode gap with liquid nitrogen as insulant, irrespective of position of barrier,
the corona inception voltage is almost the same and its value is much higher than the
clean electrode gap. Also, the breakdown voltage has increased when the barrier is
positioned near to the high voltage electrode. It is also noticed that the breakdown occurs
through the barrier when they are placed near ground electrode.
2. No variation in corona inception voltage is observed with increase in harmonic voltages
with different THD’s. The magnitude of UHF signal formed at the point of corona
inception, irrespective of harmonics AC/harmonics AC voltages, is nearly the same.
3. The current signal injected due to corona discharge in liquid nitrogen insulation, at the
point of its inception and during streamer formation, have rise time, in the negative and

49
positive cycle of the AC voltage are about 2.9 ns and 2.5ns respectively and the
characteristics has not altered due to barrier insulation.
4. The UHF signals generated by corona discharges under AC/harmonics AC voltages, on
corona inception and at higher voltages, in the liquid nitrogen electrode gap (with barrier)
have frequency contents between 0.5 -1.5 GHz.
5. The magnitude of UHF signal generated on corona inception and at higher voltages (not
at point of near breakdown) shows inverse relationship.
6. Zero span analysis indicates number of discharges that occur per sec in electrode gap
(with barrier), at the point of corona inception is almost the same.
7. PRPD pattern formed due to corona discharges indicates that phase window at which
corona discharge occurs became narrow with barrier in the electrode gap. Also, the phase
window the corona discharge occurs (with or without barrier insulation) at the point of
inception is less compared with discharges at higher voltage.
8. Ternary diagram clearly indicates that UHF signal generated under harmonic AC
voltages, due to corona discharges in liquid nitrogen, its location has not altered.
9. Phase resolved partial discharge studies clearly shows that corona activity in liquid
nitrogen is predominant when the rate of rise of supply voltage is high.
Electrical treeing is one of the major problems in solid insulating material. The tree growth
in XLPE cable insulation at liquid nitrogen temperature especially under harmonic AC voltage,
is scanty. The author has carried out a methodical experimental study and the important
conclusions arrived at based on the present study are the following.
10. Fibrillar type electrical tree forms in XLPE cable immersed in liquid nitrogen specimen
under 50 Hz AC and harmonic AC voltages.
11. Presence of fourth and fifth harmonics in supply voltage can reduce the life of cable
insulation due to treeing.
12. The applied voltage wave shape and its peak factor impart high influence on life of cable
insulation due to treeing.
13. The frequency content of the UHF signals formed during tree growth in liquid nitrogen
immersed XLPE cable lies in the range of 0.5-1.5 GHz.

50
14. PRPD pattern obtained using spectrum analyser indicates that during tree growth, under
50 Hz AC voltage, discharges occur near zero crossing. Similarly under harmonic AC
voltages, discharges predominate when the rate of rise of voltage is high. Under very low
frequency voltages (1 Hz), the discharges occur at the peak of AC voltage.
It is well known that studying the characteristics of electrical trees in an insulation structure
in laboratory is a cumbersome and time consuming process. Hence, it is essential to model the
electrical trees and the important parameters governing the growth process ought to be identified
and analyzed. Based on the present study, the following important conclusions could be arrived
at.
15. It is observed that simulated electrical trees are much similar to the experimentally
generated tree structures.
16. In homogeneous insulation structure, it is observed, tree-like trees and bush-type trees are
formed by simulation.
17. The rate of tree propagation of the electrical trees is high at the time of inception and
then the growth is limited
18. The presence of nano particles in polymers can significantly delay tree propagation and the
breakdown.
19. In case of neat polymer the tree channel propagates towards the ground electrode. While in
case of nanocomposites with large diameter of nanoparticles, multiple tree channels
propagate towards ground electrode thereby enhancing the breakdown process.
20. Volume of damage and branching from the main tree channel is higher in case of
nanocomposites.
21. Inter particle distance can significantly influence the treeing phenomenon and process of
breakdown. Breakdown process is delayed when the inter particle distance decreases.
4.2 SCOPE OF THE FUTURE WORK
Identification of incipient discharges is one of the major challenges in liquid nitrogen. Most
of the studies carried out by researchers have restricted with PD identification with one type of
defect, under AC voltage. An attempt has to be made to understand the PD activity with multiple
defect and localization and classification need to be carried out using non-intrusive type sensor
signals.
51
To enhance the reliability of insulation in cryogenic power apparatus, it is essential to adopt
modern sensor and communication techniques and monitor the condition of the insulating
material during operation.
52
REFERENCES
1. Badent, A., Kist, K., Schwab, A.J., Beroual, A., Chadband, W.G., Danikas, M., Sierota,
A.B., Torshin, Y. and Zahn, M. (1996) Preliminary report for the IEEE DEIS liquid
dielectrics committee international study group on streamer propagation in liquids,
Proceedings of 12th International Conference on Dielectric Liquids (ICDL), 375-378.
2. Bahadoorsingh, S. and Rowland, S. (2009) Modeling of Partial Discharges in the presence
of harmonics. IEEE Conference on Electrical Insulation and Dielectric Phenomena,
Virginia Beach, USA, 384-387.
3. Bahadoorsingh, S. and Rowland, S. (2010) Investigating the impact of harmonics on the
breakdown of epoxy resin through electrical tree growth. IEEE Transactions on Dielectrics
and Electrical Insulation, 17 (5), 1576-1584.
4. Barclay, A. L., Sweeney, P.J., Dissado, L.A. and Stevens, G.C. (1990) Stochastic
modelling of electrical treeing: fractal and statistical characteristics, Journal Phys-D,
Applied Physics, 23, 1536.
5. Beroual, A., Zahn, M., Badent, A., Kist, K., Schwabe, A.J., Yamashita, H., Kamazawa,
K., Danikas, M.G., Chadband, W.D. and Torshin, Y. (1998) Propagation and structure of
streamers in liquid dielectrics, IEEE Electrical Insulation Magazine, 14 (2), 6-17.
6. Blaz, M. and Kurrat, M. (2011) Influence of Bubble Formation on the Dielectric Behavior
of Liquid Nitrogen”, IEEE Transaction on Applied Superconductivity, 21(3), 1896-1899.
7. Bozzo, R., Gemme, C., Guastavino, F. and Montanari, G.C. (1997) Investigation of
aging rate in polymer films subjected to surface discharges under distorted voltage.
Proceedings of IEEE Conference on Electrical Insulation and Dielectric Phenomena,
Minneapolis, MN, 2, 435-438.
8. Cavallini, A., Fabiani, D. and Montanari, G. C. (2010) Power electronics and electrical
insulation systems; Part 1: Phenomenology overview, IEEE Electrical Insulation Magazine,
26(3), 7–15.

53
9. Coelho, R. and Debeau, J. (1971) Properties of the tip-plane configuration, J Phys. D:
Applied Physics, 4(9), 1266-1280.
10. Dai, S.T., Lin, L.Z., Lin, Y.B., Gao, Z.Y., Fang, Y.F., Gong, L.H., Teng, Y.P., Zhang,
F.Y., Xu, X., Li, G., Li, L.F. and Xiao, L.Y. (2007) The three phase 75m long HTS power
cable, Cryogenics, 47 (7), 402-405.
11. Danikas, M. G., and Tanaka, T. (2009) Nanocomposites- A review of electrical treeing
and breakdown, Electrical Insulation Magazine, 25 (4), 19-25.
12. Danikas, M. G., Karafyllidis, I., Thanailakis, A. And Bruning, A.M. (1996) Simulation
of electrical tree growth in solid dielectrics containing voids of arbitrary shape, Model
Simulation Matter Science Eng., 4, 532-552.
13. Dauda, W., Harald E.N. Bersee, Stephen J. Picken and Adriaan Beukers (2009)
Layered silicates nanocomposite matrix for improved fiber reinforced composites properties,
Composites Science and Technology, 69 (14), 2285–2292.
14. Denat, A. (2005) High field conduction and pre-breakdown phenomena in dielectric liquids,
IEEE International Conference on Dielectric Liquids (ICDL), Grenoble, France, 57-62.
15. Denat, A., (2011) Conduction and breakdown initiation in dielectric liquids, IEEE Int’l.
Conference on Dielectric Liquids (ICDL), Grenoble, France, 1-11.
16. Denat, A., Jomni, F., Aitken, F. and Bonifaci, N. (2002), Thermally and Electrically
Induced Bubbles in Liquid Argon and Nitrogen, IEEE Transactions on Dielectrics and
Electrical Insulation, 9(1), 17-22.
17. Densley (1979) An Investigation into the Growth of Electrical Trees in XLPE Cable
Insulation, IEEE Transactions on Dielectrics and Electrical Insulation, 14(3), 148-158.
18. Dionise, T.J., Lorch. V. (2010) Voltage distortion on an electrical distribution system,
IEEE Industry application magazine, 16 (2), 48-55.
19. Dissado, Len. A. and Fothergill, J.C. (1992) Electrical degradation and breakdown in
polymers, IEE materials and devices series 9, Peter peregrines Ltd, London, UK.

54
20. Duval, M. (2002) A Review of faults detectable by Gas in oil analysis in transformers,
IEEE Electrical Insulation Magazine, 18(3), 8-17.
21. Fabiani, D. and Montanari, G.C. (2001) The effect of voltage distortion on ageing
acceleration of insulation systems under Partial Discharge activity. IEEE Electrical
Insulation Magazine, 17 (3), 24-33.
22. Farr, T., Vogelsang, R., Frohlich, K. (2001) A new deterministic model for tree growth in
polymers with barriers, Proceedings of Annual Report Conference on Electrical Insulation
and Dielectric Phenomena, Kitchener, 673-676.
23. Feger, R., Feser, K., and Pietsch, R. (1999) Partial discharge classification in GIS using
the narrow-band UHF method, Proceedings of IEE 11th
International Symposium on High-
Voltage Engineering (ISH 99), London, 5, 33-36.
24. Fleszynski, J. and Zelek, A. (1980) Dynamics of the development of surface discharges in
liquid nitrogen, Cryogenics, 20 (11), 648-650.
25. Fleszynski, J., Zelek, A. and Skowronski, J.I. (1979) Development of discharges in liquid
nitrogen in non uniform electrical field, Journal of Electrostatics, 7, 39-46.
26. Florkowska, B. and P. Zydron (2006) Analysis of conditions of partial discharges
inception and development at non-sinusoidal testing voltages, Conference on Electrical
Insulation and Dielectric Phenomena, Kansas City, MO, 648 – 651.
27. Florkowska, B., M. Florkowski, and P. Zydron (2007) The role of harmonic components
on Partial Discharge mechanism and degradation processes in epoxy resin Insulation,
International Conference on Solid Dielectrics, Winchester, UK, 8-13.
28. Florkowski, M. (1997) Influence of high voltage harmonics on partial discharge patterns,
Proceedings Of the 5th International conference on properties and application of dielectric
materials, 03P27, Seoul, Korea.
29. Florkowski, M. Florkowska, B., Furgał, J. and Zydron, P. (2013) Impact of high voltage
harmonics on interpretation of Partial Discharge patterns, IEEE Transactions on Dielectrics
and Electrical Insulation, 20(6), 2009–2016.

55
30. Frayssines, P. E., Lesaint, O., Bonifaci, N., Denat, A., Lelaidier, S. and Devaux, F.
(2002) Prebreakdown phenomena at high voltage in liquid nitrogen and comparison with
mineral oil, IEEE Transactions on Dielectrics and Electrical Insulation, 9(6), 899-909.
31. Frayssines, P.E., Lesaint, O., Bonifaci, N., Denat, A. And Devaux, F. (2003)
Prebreakdown and breakdown phenomena under uniform field in liquid nitrogen and
comparison with mineral oil, IEEE Transactions on Dielectrics and Electrical Insulation, 10
(6), 970-976.
32. Fujii, M., Watanabe, M., Kitani, I. And Yoshino, K. (1991) Fractal characteristics of DC
trees in polymethylmetha acrlate, IEEE Transactions on Dielectrics and Electrical
Insulation, 26(6), 1159-1162.
33. Garlick, W. G. (1997) Power system applications of high temperature superconductors,
Cryogenics, 37(10), 649-652.
34. Gerhold, J. (1998b) Properties of cryogenic insulants, Cryogenics, 38(11), 1063-1081.
35. Gerhold, J. (2002a) Cryogenic liquids––a prospective insulation basis for future power
equipment, IEEE Transactions on Dielectrics and Electrical Insulation, 9(1), 68-75.
36. Gerhold, J. (2002b) Potential of cryogenic liquids for future power equipment insulation in
the medium High Voltage range, IEEE Transactions on Dielectrics and Electrical
Insulation, 9(6), 878-890.
37. Gerhold, J. and Tanaka, T. (1998a) Cryogenic electrical insulation of superconducting
power transmission lines: transfer of experience learned from metal superconductors to high
critical temperature superconductors, Cryogenics, 38, 1173–1188.
38. Goshima, H., Hayakawa, N., Hikita, M., Okubo, H. And Uchida, K. (1995) area and
volume effects on breakdown strength in liquid nitrogen, IEEE Transactions on Dielectrics
and Electrical Insulation, 2(3), 376-384.
39. Grabovickic R., James, D.R., Sauers, I, Ellis, A.R., Irwin, P.C., Weeber, K., Li, L., and
Gadre, A.D. (2005) Measurements of temperature dependence of partial discharge in air
gaps between insulated Bi-Sr-Ca-Cu-O Tapes, IEEE Transactions on Applied Super
Conductivity, 15(2), 3668-3681.

56
40. Hanai, M., Kojima, H., Hayakawa, N. and Shinoda, K. (2008) Integration of asset
management and smart grid with intelligent grid management system, IEEE Transactions on
Dielectrics and Electrical Insulation, 15(3), 2195-2202.
41. Hanaoka, R., Ishibashi, R., Usui, Y. And Inagaki, D. (1993) Effect of ice attached to
electrode on pre-breakdown current in liquid nitrogen, Proceedings of IEEE 11th
International Conference on Conduction and Breakdown in Dielectric Liquids (ICDL),
Baden-Dattwil, 426-430.
42. Hara, M., and Okubo, H. (1998) Electrical insulation characteristics of superconducting
power apparatus. Cryogenics, 38(11), 1083–1093.
43. Hara, M., Kurihara, T., Nishioka, T., Suehiro, J. and Okamoto, H. (2004)
Determination method of equivalent insulation test voltage at room temperature for high
temperature superconducting power apparatus with coil structure, Cryogenics, 44(4), 229-
239.
44. Hara, M., Suehiro, J., Maeda, H. And Nakashima, H. (2002) DC pre-breakdown
phenomena and breakdown characteristics in the presence of conducting particles in liquid
nitrogen, IEEE Transactions on Dielectrics and Electrical Insulation, 9(1), 23-30.
45. Hazeyama, M., Kobayashi, T., Hayakawa, N., Honjo, S., Masuda, T. and Okubo, H.
(2002) Partial Discharge inception characteristic under butt gap condition in liquid
nitrogen/PPLP composite insulation system for High Temperature Superconducting Cable,
IEEE Transactions on Dielectrics and Electrical Insulation, 9(6), 939-944.
46. Hebner (1988) Measurement of electrical breakdown in liquids, The Liquid State and Its
Electrical Properties NATO ASI Series, 193, 519-537.
47. Hyoungku Kang, Jin Bae Na, Yoon Do Chung, and Tae Kuk Ko (2011) Experimental
study on the Barrier Effects in Gaseous Helium for the Insulation Design of a High Voltage
SFCL, IEEE Transactions on Applied Super conductivity, 21(3), 1328-1331.
48. IEEE 519, IEEE recommended practice and requirements for harmonic control in electric
power, 1992.
57
49. Ildstad, E., Fauskanger, K. And Holto, J.J. (2013) Electrical treeing from needle implants
in XLPE during very low frequency (VLF) voltage testing, Bologna, IEEE International
conference on Solid dielectrics (ICSD), 800-803.
50. James, D. R., Sauers, I., Ellis, A.R., Tuncer, E., Tekletsadik, K. And Hazelton, D.W.
(2007) Breakdown and Partial Discharge measurements of some commonly used dielectric
materials in liquid nitrogen for HTS applications, IEEE Transactions on Applied
Superconductivity, 17(2), 1513-1516.
51. Jong-Man Joung, Seung-Myeong Baek, Hae-Jong Kim and Sang-Hyun Kim (2003) AC
surface flashover strength and barrier effect of LN2 for HTS transformer with simulated
electrode, Cryogenics, 43, 637-641.
52. Judd, M. D., Farish, O. and Hampton, B.F. (1996) The Excitation of UHF signals by
partial discharges in GIS. IEEE Transactions on Dielectrics and Electrical insulation, 3(2),
213-228.
53. Judd, M.D. and Farish, O. (1998) A pulsed GTEM system for UHF sensor calibration”,
IEEE transaction Instrument and measurement, 47(4), 875-880.
54. Kanao, Hayashi, Y. and Matsuki, J. (2009) Analysis of even harmonics generation in an
isolated electric power system, Electrical Engineering in Japan, 167(2), 56-63.
55. Kawamura, H. and Nawata, M. (1998) DC electrical treeing phenomenon and space
charge, IEEE Transactions on Dielectrics and Electrical insulation, 5(5), 741-747.
56. Koo, J. Y., Lee, S.H., Lee, Y.J. and Lee, B.W. (2010), Investigation of partial discharge
phenomena in HTS transformer adopting different types of sensors, Physica-C
(superconductivity and its applications), 470, 1684-1690.
57. Kosaki, M. (1996) Research and development of electrical insulation of superconducting
cables by extruded polymers, IEEE electrical insulating magazine, 12(5), 17-24.
58. Kozako, M., Yamano, S., Kido, R., Ohki, Y., Kohtoh, M., Okabe, S., Tanaka, T. (2005)
Preparation and preliminary characteristics evaluation of epoxy/alumina nanocomposites,
International symposium on electrical insulating materials, 231-234.

58
59. Krahenbuhl, F., Bernstein, B., Danikas, M. G., Densley, J., Kadotani, K., Kahle, M.,
Kosaki, M., Mitsui, H., Nagao, M., Smit, J. J. and Tanaka, T. (1994) Properties of
electrical insulation materials at cryogenic temperatures: A literature review, IEEE
electrical insulation magazine, 10(4), 10-22.
60. Krins, M., Borsi, H. and Gockenbach, E. (1996) Influence of carbon particles on the
breakdown voltage of transformer oil. Proceedings of 12th IEEE International Conference
on Conduction and Breakdown in Dielectric Liquids (ICDL), Rome, Italy, July, 296-299.
61. Kudo, K. (1998) Fractal analysis of electrical trees, IEEE Transactions on Dielectrics and
Electrical Insulation, 5(5), 713-727.
62. Kuffel, E., Zaengl, W.S. and Kuffel, J., High Voltage Engineering: Fundamentals,
Elsevier, Second Edition, 2005.
63. Kurihara, T., Suehiro, J. and Hara, M. (2004) Observation of residual surface charge
distribution inside an artificial air-filled void due to Partial Discharge activities at room and
liquid nitrogen temperatures, Proceedings of the 2004 IEEE International Conference on
Solid Dielectrics (ICSD),Toulouse, France, 1, 308-311.
64. Lupo, G., Petrarca, C., Egiziano, L., Tucci, V. And Vitelli, M. (2000) Interpretation and
classification of PD in a HV cryogenic cable termination, IEEE Transaction on Dielectrics
and Electrical insulation, 7(1), 71-77.
65. Mason, J. H. (1955) Breakdown of solid dielectrics in divergent fields, Proc. IEE, 100,
Part. C, 254-263.
66. Mazzanti, G., Gaetano Passarelli, Russo, A. and Verde, P. (2006) The effects of voltage
waveform factors on cable life estimation using measured distorted voltages, IEEE Power
Engineering Society General Summer Meeting, Quebec, Canada, 1-8.
67. Minoda, A., Nagao, M. and Kosaki M. (1997) DC short circuit treeing phenomenon and
space charge effect in ERP at cryogenic temperature, Proceedings of 5th Int conf. on
properties and applications of dielectric materials, 1, 426-429.

59
68. Montanari G. C. and Fabiani, D. (1999b) Searching for the factors which affect self-
healing capacitor degradation under non-sinusoidal voltage. IEEE Transactions on
Dielectrics and Electrical Insulation, 6(3), 319-325.
69. Montanari, G. C. and Fabiani, D. (1999a) The effect of non-sinusoidal voltage on intrinsic
aging of cable and capacitor insulating materials. IEEE Transactions on Dielectrics and
Electrical Insulation, 6(6), 798 – 802.
70. Nelson, W., (1982) Applied life data analysis, John Wiley and Sons, New York. USA.
71. Okubo, H., and Hayakawa, N. (2005) A novel technique for Partial Discharge and
breakdown investigation based on current pulse waveform analysis, IEEE transaction on
Dielectric and Electrical Insulation, 12(4), 736-744.
72. Okubo, H., Hikita, M., Goshima, H., Sakakibara, H., and Hayakawa, N. (1996) High
Voltage insulation performance of cryogenic liquids for superconducting power apparatus,
IEEE Transactions on Power Delivery, 11(3), 1400-1406.
73. Olyphant (1963) Breakdown by Treeing in Epoxy Resins, IEEE Trans. Power Applied
System, 82(69), 1106–1112.
74. Ortmeyer, T. H., Chakravarthi, K.R. and Mahmoud, A. A. (1985) The effects of power
system harmonics on power system equipment and loads, IEEE Transaction Power
Application System, 104(9), 2555–2563.
75. Oyegoke, Bolarin, Hyvonen, P., M.Aro and Gao Ning (2003) Selectivity of damped AC
(DAC) and VLF voltages in after-laying tests of extruded MV cable systems, IEEE
transaction on Dielectric and Electrical Insulation, 10(5), 874- 882.
76. Paola Caracino, Martin Lakner, Hitoshi Okubo, Ole Tonnesen, and Bernd Wacker
(2002) Superconducting and insulating materials for HTS power applications, CIGRE, Paris,
Paper: 15-405.
77. Pearson, J. S., Farish, O., Hampton, B. F., Judd, M. D., Templeton, D., Pryor, B. W.
and Welch, I. M. (1995) Partial discharge diagnostics for gas insulated substations, IEEE
Transactions on Dielectrics and Electrical Insulation, 2(5), 893-905.
60
78. Pista, D., Vardakis, G., Danikas, M.G., Kozako, M. (2010) Electrical treeing propagation
in nanocomposites and the role of nanofillers: simulation with the aid of cellular automata,
Journal of Electrical Engineering, 61(2), 125-128.
79. Sarathi, R., and A. Vijaya Saradhi (1999) Modelling and characterization of electrical
trees in a laminated dielectric structure, conference on Electrical Insulation and Dielectric
Phenomena, Austin, Texas, 622-625.
80. Sarathi, R., Arya Nandini and Tanaka, T., (2012) Understanding electrical treeing
phenomena in XLPE cable insulation adopting UHF technique under harmonic AC voltages,
IEEE transaction on dielectric and electrical insulation, 9(3), 903-909.
81. Sarathi, R., R.K. Sahu, Rajeshkumar, P. and Tanaka, T. (2006) Understanding the
electrical and mechanical properties of epoxy nanocomposites-a physico-chemical
approach, IEEJ Transaction on Fundamentals and materials, 126(11), 1112-1120.
82. Smith, R. C., Liang, C., Landry, M., Nelson, J. K. and Schadler, L. S. (2008) The
mechanism leading to the useful electrical properties of polymer nanodielectric, IEEE
Transaction on Dielectric and Electrical Insulation, 15(1), 187-196.
83. Sosnowslu, M., Bahder, G. and Eager. Jr. G. S. (1985) Development of cross-linked
polyethylene insulated cable for cryogenic operation, EPRI Rept. EL-3970, Electric Power
Research Institute.
84. Southern clay products, Inc., Technical data: http://www.scprod.com.
85. Suwarno, Suzioki, Y., Mizutani, T. and Uchida, K. (1995) Effect of frequency and
applied voltage on electrical treeing discharges”, International conf on conduction and
breakdown in solid dielectrics, Leicester, 366-370.
86. Suwarno, Suzuoki, Y., Komori, F. and Mizutani, T. (1996) Partial Discharge due to
Electrical Treeing in polymers, J. Physics D. Applied Phys., 29, 2922-2931.
87. Suzuki, H., Takahashi, T., Okamoto, T., Akita, S., Ozawa, Y. (2002) Electrical
insulation characteristics of cold dielectric high temperature superconducting cable, IEEE
Transactions on Dielectrics and Electrical Insulation, 9(6), 952-957.

61
88. Swaffield, D. J., Lewin, P. L., Chen, G. And Swingler, S. G. (2008) Partial Discharge
characterization of streamers in liquid nitrogen under applied AC voltages, IEEE
transaction on Dielectric and Electrical Insulation, 15(3), 635-646.
89. Sweeney, P.J.J., Dissado, L.A. and Cooper, J.M. (1992) Simulation of the effect of
barriers upon electrical tree propagation, Journal of Physics D: Appl. Physics, 25(1), 113.
90. Taci. M.S.and Domijan. A. (2004) The effect of linear and nonlinear operation modes in
transformers, 11th International conference on Harmonics and Quality of Power, New
York, USA, 244-249.
91. Takahashi, Y. and Ohtsuka, K. (1975) Corona discharges and bubbling in liquid nitrogen,
Journal of Physics D: Applied Physics, 8(2), 165-169.
92. Tanaka, T. (1977) Initiation of Internal discharges in a Liquid-Nitrogen-filled Cavity, IEEE
Transactions on Electrical Insulation, 12(1), 35-39. 101.
93. Tanaka, Y., Nakamura, E., Murakami, Y., Yamada, S. and Nagao, M. (2008)
Identification of surface discharge based on discharge current waveform in composite
insulation system of liquid nitrogen and solid insulator, Proceedings of 2008 International
Symposium on Electrical Insulating Materials, September 7-11, Yokkaichi, Mie, Japan,
135-138.
94. Tenbohlen, S., Denissov, D., Hoek, S. M., and Markalous, S. M. (2008) Partial Discharge
measurement in the Ultra High frequency (UHF) range, IEEE Transactions on Dielectrics
and Electrical Insulation, 15(6), 1544-1552.
95. Topalis, F. and Danikas (2005) Breakdown in air gaps with solid insulating barrier under
impulse voltage stress, Facta Universitatis-series: Electronics and Energetics, 18(1), 87-
104.
96. Truong, L.H., Lewin, P.L. (2013a) Phase resolved partial discharges in liquid nitrogen
under AC votlages, IEEE transaction on Dielectric and Electrical Insulation, 20(6), 2179-
2187.

62
97. Truong, L.H., Lewin, P.L. and Judd, M.D. (2013b) Characterisation of streamers in liquid
nitrogen under AC voltages using UHF techniques, IEEE transaction on Dielectric and
Electrical Insulation, 21(6), 1109-1117.
98. Van-Dung Nguyen, Jong-Man Joung, Seung-Myeong Baek, Chang-Hwa Lee and Sang-
Hyun Kim (2005) Ageing characteristics of cryogenic insulator for development of HTS
transformer, Cryogenics, 45(1), 57-63.
99. Von Neuman, J. (1966) Theory of Self-Producing automata, A.W. Burks, Ed. Urbana, IL:
University of Illinois Press.
100. Wagner, V. E., Balda, J. C., Griffith, D. C., McEachern, A., Barnes, T. M., Hartmann,
D. P., Phileggi, D. J., Emannuel, A. E., Horton, W. F., Reid, W. E., Ferraro, R. J., and
Jewell, W. T. (1993) Effects of harmonics on equipment, IEEE Transaction Power
Delivery, 8 (2), 672–680.
101. Wiesmann and Zeller (1986), A fractal model of dielectric breakdown and pre breakdown
in solid dielectrics, Journal Applied Physics, 60, 1770.
102. Yamano, Y., Takahashi, Y., kobayashi, S. (1990) Improving insulator reliability with
insulating barriers, IEEE transaction on Dielectric and Electrical Insulation, 25(6), 1174-
1179.
103. Zouaghi and Beroual, A. (1998) Barrier effect on the dielectric strength of oil gaps under
DC voltages, Arlington, VA, IEEE Int. Symposium on electrical insulation, 640643.

63
LIST OF PUBLICATIONS BASED ON THE THESIS
I. REFEREED JOURNALS
1. Mittal, Lakshya, Sarathi, R., and Sethupathi, K., Electrical Treeing in XLPE cable insulation
at cryogenic temperature under harmonic AC voltages. Cryogenics (Accepted for publication).
II. PRESENTATIONS IN CONFERENCES
1. Sarathi, R. and Mittal, L., Understanding corona discharge activity in liquid nitrogen under
harmonic AC voltages adopting UHF technique. Proceedings of the 2014 International
Symposium on Electrical Insulation Materials (ISEIM 2014), Niigata, Japan, June 1-5, pp. 164-
167.