ms thesis presentation_ hafez
TRANSCRIPT
Title: Decomposer metabolism and litterdecomposition rate as a function of climate andelemental stoichiometry in terrestrial and aquatic
ecosystems
Master’s Thesis Presentation:
ecosystems
Presented by:
Mohammad Hafez Ahmed
Supervisor: Dr. Stefano Manzoni
Examiner: Dr. Steve W. Lyon
Department of Physical Geography, Stockholm University
Date: 12 May, 2016
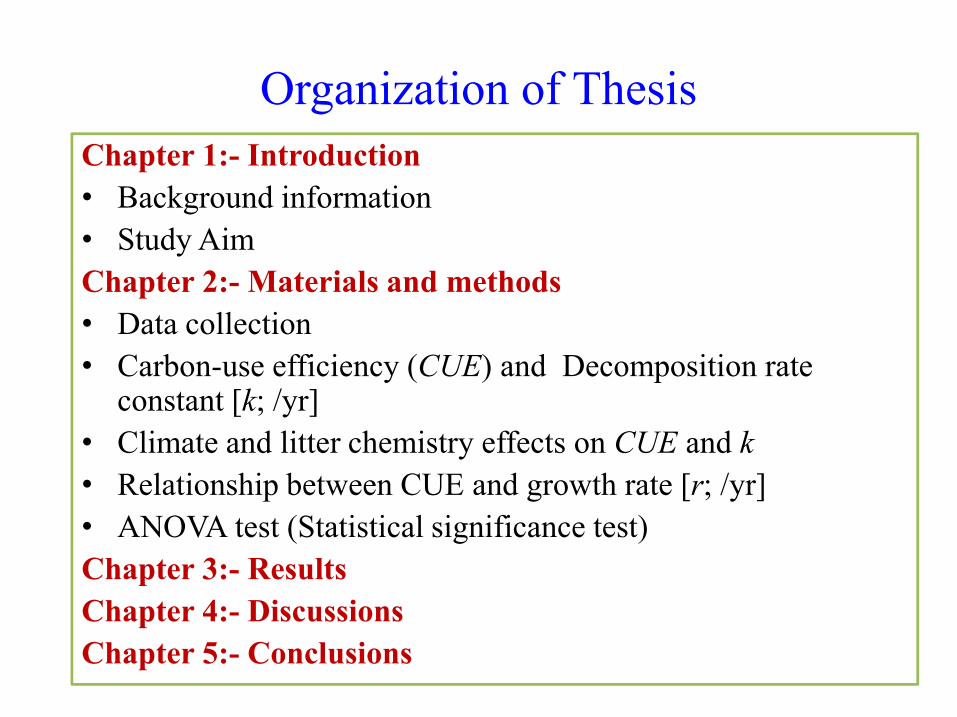
Organization of Thesis
Chapter 1:- Introduction
• Background information
• Study Aim
Chapter 2:- Materials and methods
• Data collection
• Carbon-use efficiency (CUE) and Decomposition rate • Carbon-use efficiency (CUE) and Decomposition rate constant [k; /yr]
• Climate and litter chemistry effects on CUE and k
• Relationship between CUE and growth rate [r; /yr]
• ANOVA test (Statistical significance test)
Chapter 3:- Results
Chapter 4:- Discussions
Chapter 5:- Conclusions
Background information (continue).
Litter decomposition:Important for carbon-nutrient cycling and plant
productivity (Hobbie et al. 2013).
Decomposition: Physical and chemical changes oflitters.litters.
Decomposer metabolism:• All biochemical reactions (catabolism and anabolism)
involved to maintain cell growth of organisms.• Carbon-use efficiency (CUE) is the ratio of
microbial growth over carbon uptake (Manzoni et al, 2012).
Decomposition rate constant [k; /yr]:• Relative mass loss rate per unit of time
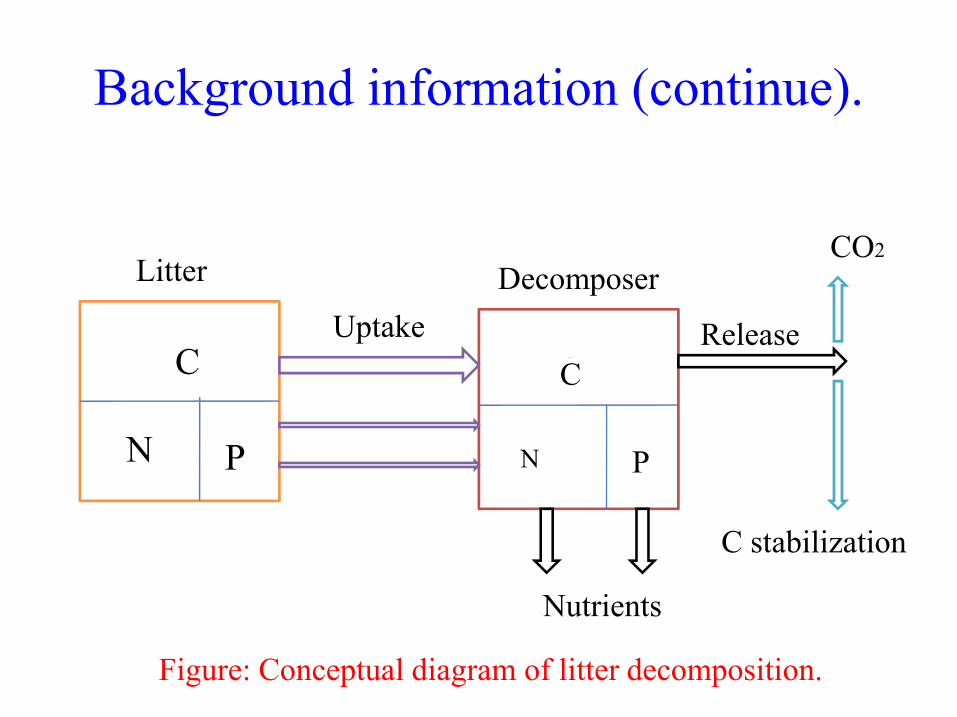
Background information (continue).
CC C
Litter Decomposer
Uptake Release
CO2
C
N P
C C
N P
C stabilization
Nutrients
Figure: Conceptual diagram of litter decomposition.
Study aim
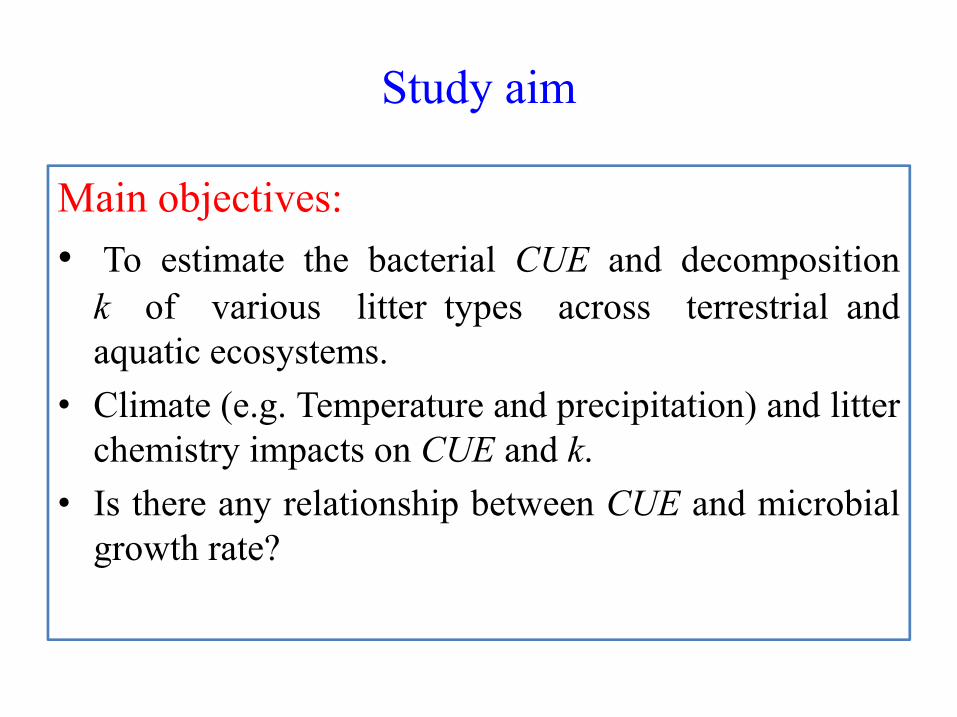
Main objectives:
• To estimate the bacterial CUE and decomposition
k of various litter types across terrestrial andaquatic ecosystems.aquatic ecosystems.
• Climate (e.g. Temperature and precipitation) and litterchemistry impacts on CUE and k.
• Is there any relationship between CUE and microbialgrowth rate?
Materials and methods
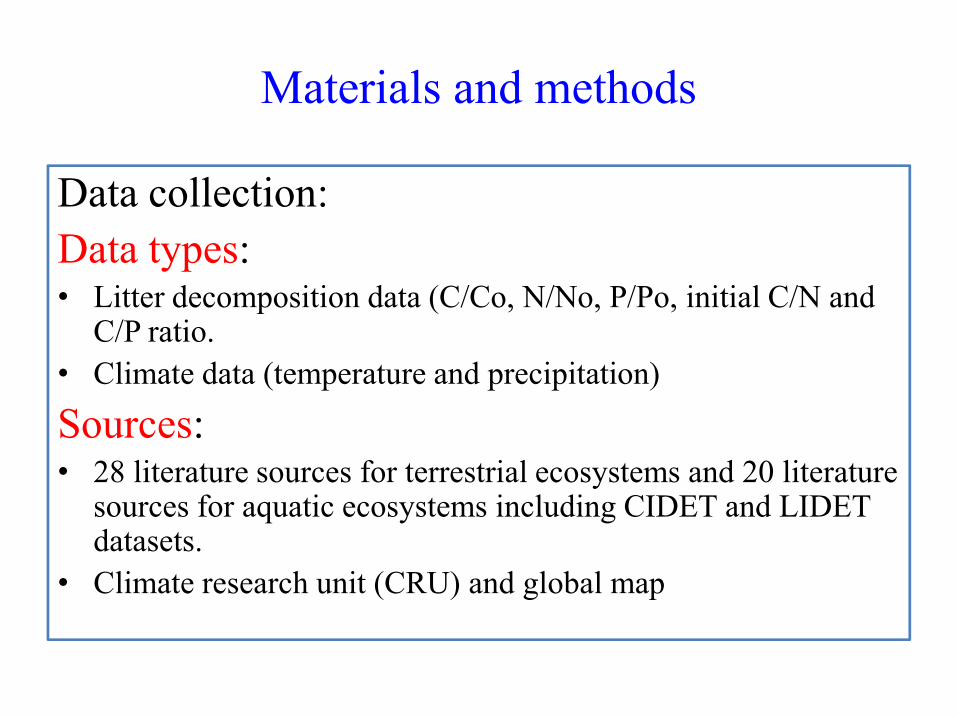
Data collection:
Data types:• Litter decomposition data (C/Co, N/No, P/Po, initial C/N and
C/P ratio.
• Climate data (temperature and precipitation)• Climate data (temperature and precipitation)
Sources:• 28 literature sources for terrestrial ecosystems and 20 literature
sources for aquatic ecosystems including CIDET and LIDET datasets.
• Climate research unit (CRU) and global map
Materials and methods (continue)....
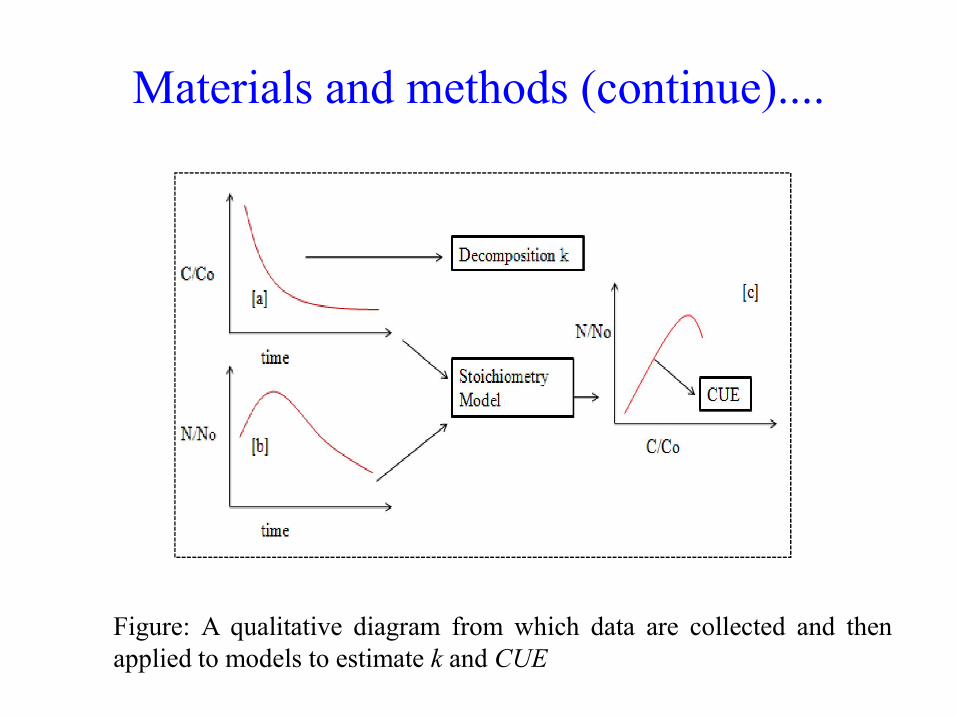
Figure: A qualitative diagram from which data are collected and thenapplied to models to estimate k and CUE
Materials and methods (continue)....
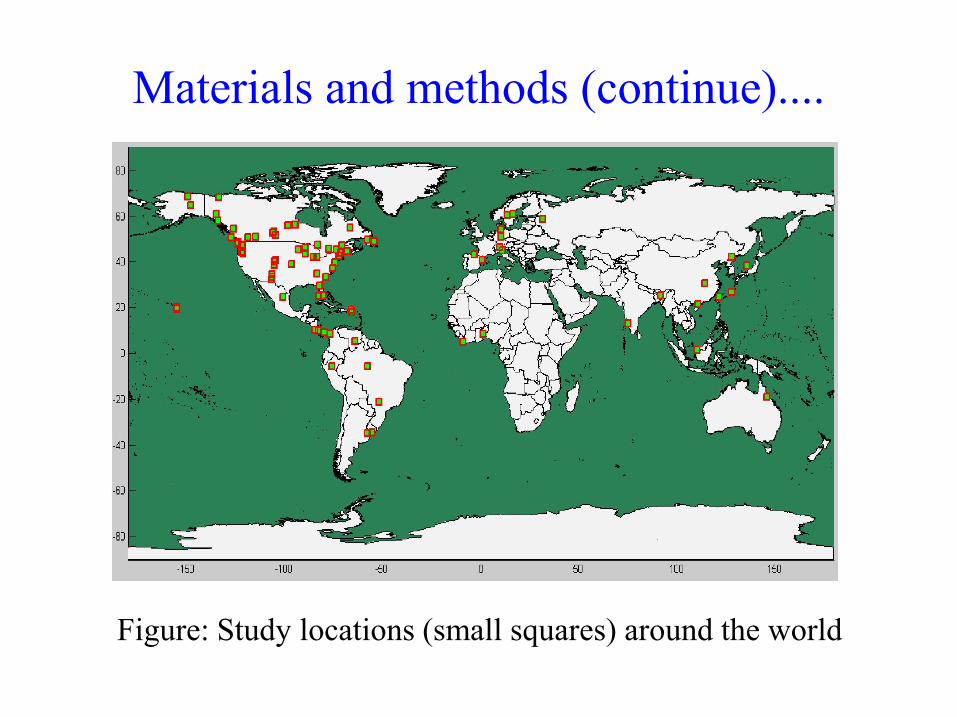
Figure: Study locations (small squares) around the world
Materials and methods (continue)....
)1.......(]
)(
)(1[
)(
)()( 1
10,0,e
B
N
B
N
c
N
CN
C
N
CN
C
ccn
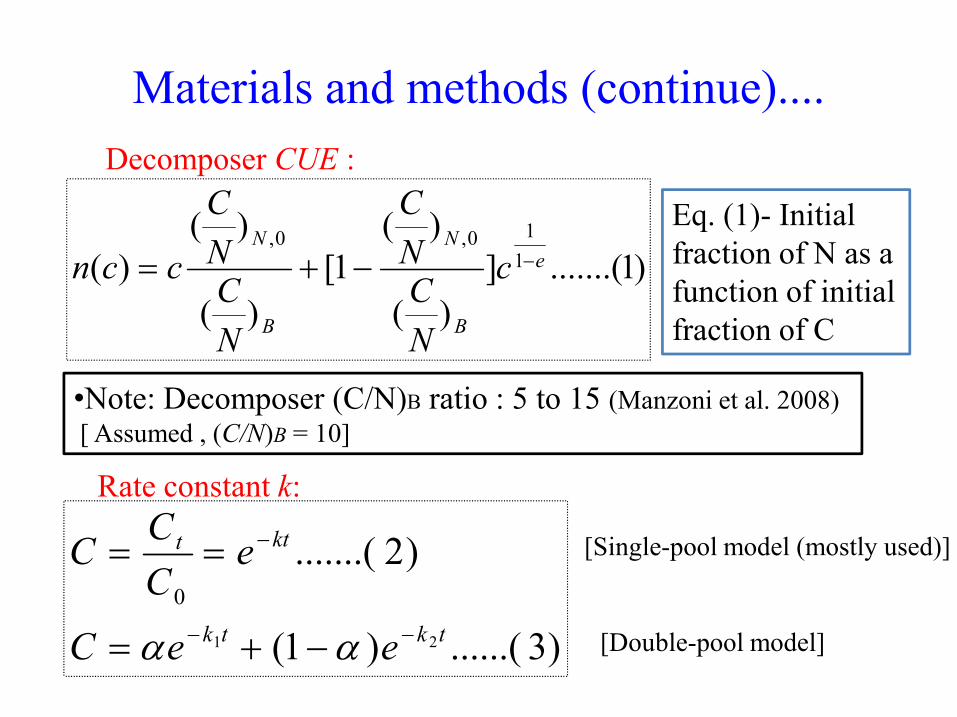
Decomposer CUE :
Eq. (1)- Initial fraction of N as a function of initial fraction of CNN
Rate constant k:
)3......()1(
)2.......(
21
0
tktk
ktt
eeC
eC
CC
•Note: Decomposer (C/N)B ratio : 5 to 15 (Manzoni et al. 2008)[ Assumed , (C/N)B = 10]
[Single-pool model (mostly used)]
[Double-pool model]
Materials and methods (continue)....
)5.....(ln)1
)(()ln(
)4.......(
ATR
ECUE
RT
E
AeCUE
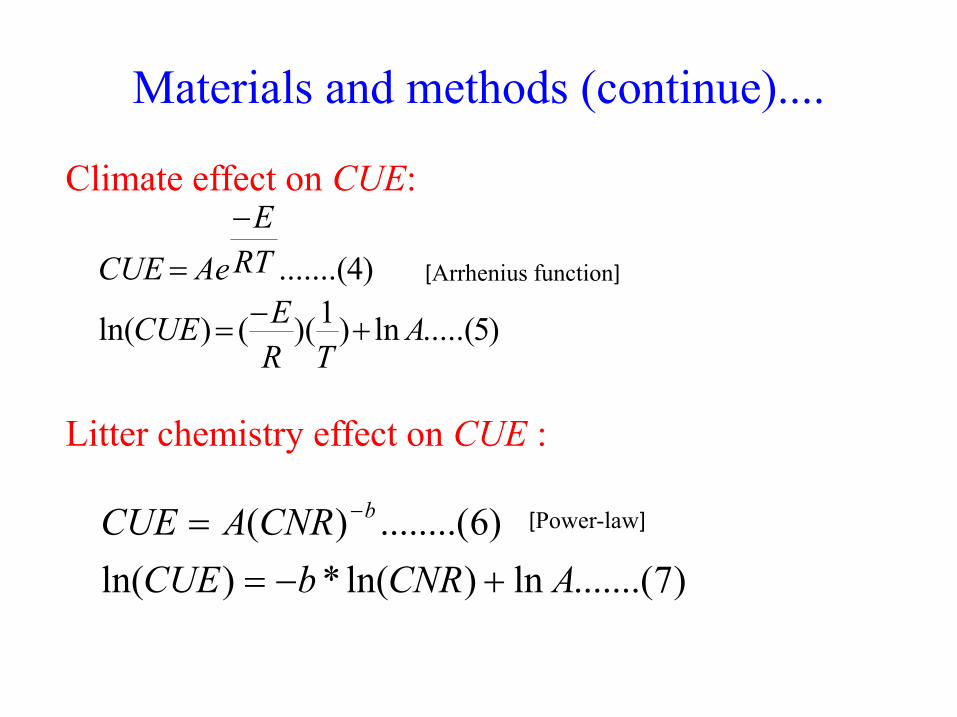
Climate effect on CUE:
[Arrhenius function]
TR
Litter chemistry effect on CUE :
)7.......(ln)ln(*)ln(
)6........()(
ACNRbCUE
CNRACUE b
[Power-law]
Materials and methods (continue)....
1
)8.......(
E
RT
E
Aek
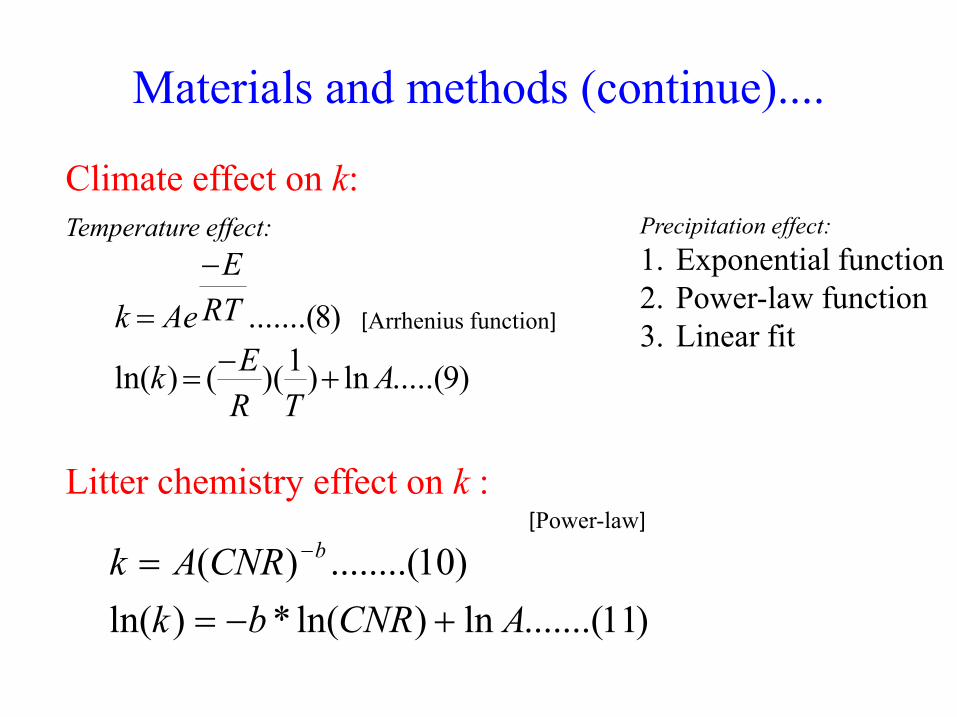
Climate effect on k:
[Arrhenius function]
Temperature effect: Precipitation effect:
1. Exponential function2. Power-law function3. Linear fit
)9.....(ln)1
)(()ln( ATR
Ek
Litter chemistry effect on k :
)11.......(ln)ln(*)ln(
)10........()(
ACNRbk
CNRAk b
[Power-law]
Materials and methods (continue)....
)13)....((*)(*
)12......(11
LCCUE
kr
GYr
m
CUE
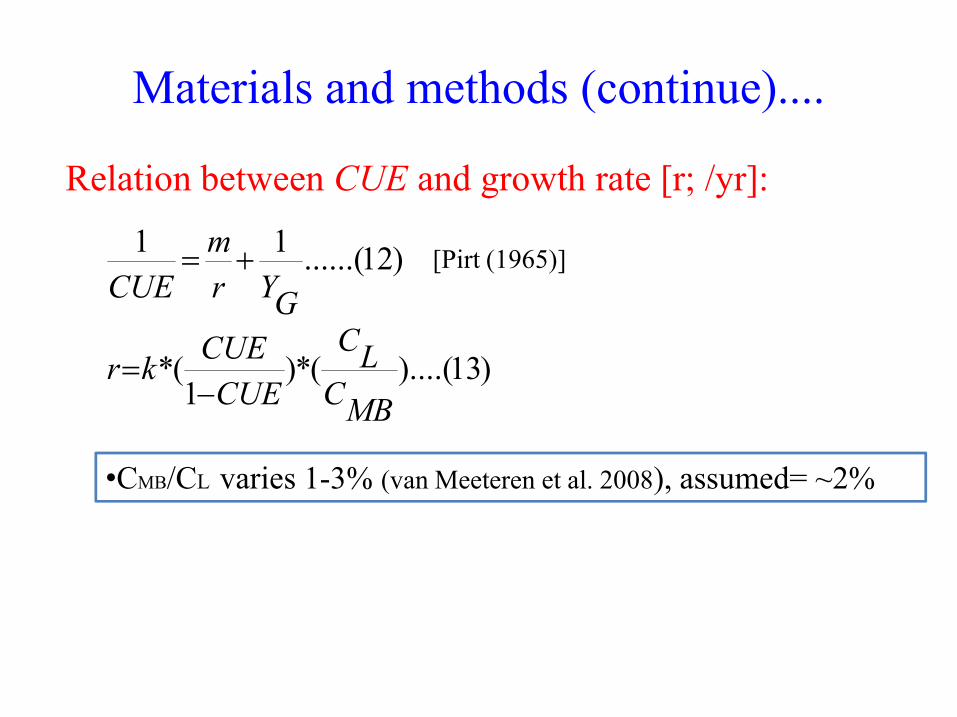
Relation between CUE and growth rate [r; /yr]:
[Pirt (1965)]
)13)....((*)1
(*
MBC
LC
CUE
CUEkr
•CMB/CL varies 1-3% (van Meeteren et al. 2008), assumed= ~2%
Materials and methods (continue).
ANOVA test: statistical significance test
Results and discussions
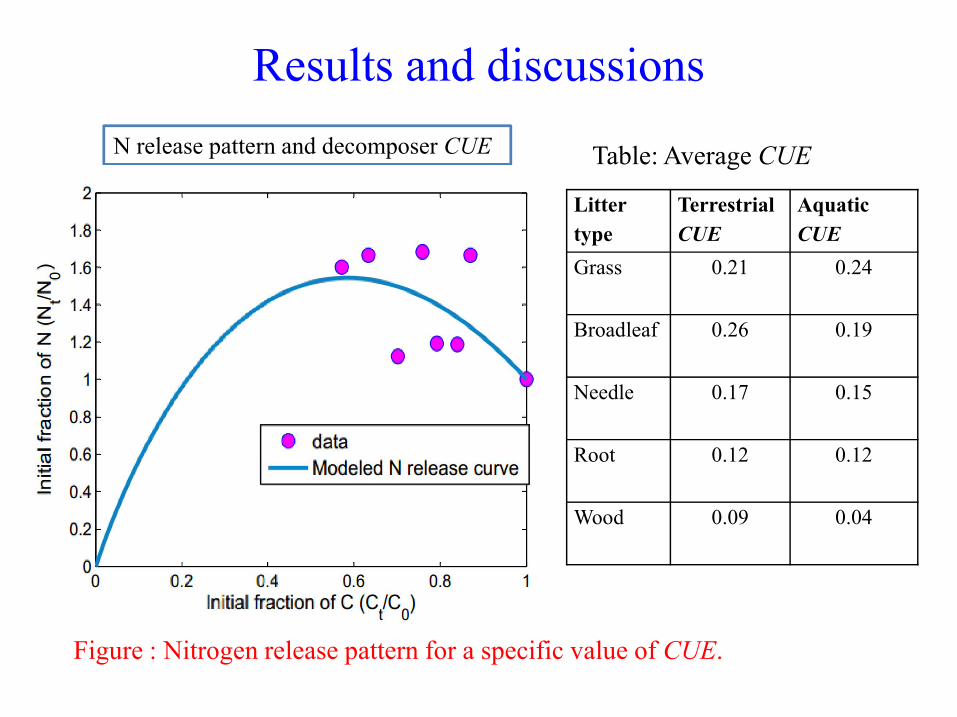
N release pattern and decomposer CUE
Litter
type
Terrestrial
CUE
Aquatic
CUE
Grass 0.21 0.24
Broadleaf 0.26 0.19
Table: Average CUE
Figure : Nitrogen release pattern for a specific value of CUE.
Needle 0.17 0.15
Root 0.12 0.12
Wood 0.09 0.04
Results and discussions (continue)...
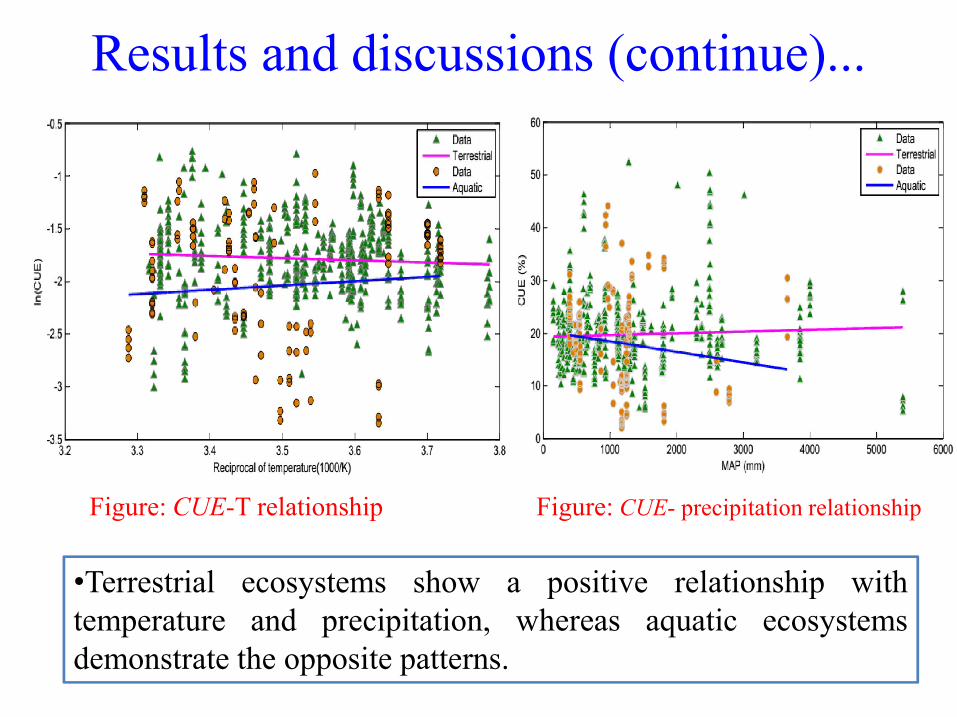
Figure: CUE-T relationship Figure: CUE- precipitation relationship
•Terrestrial ecosystems show a positive relationship withtemperature and precipitation, whereas aquatic ecosystemsdemonstrate the opposite patterns.
Results and discussions (continue)...
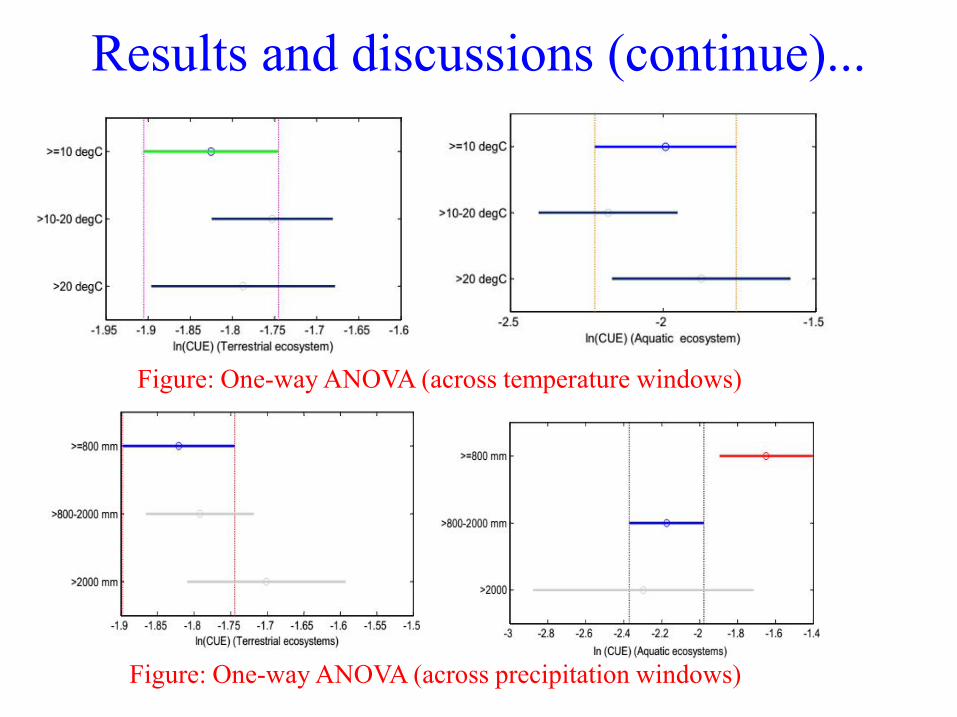
Figure: One-way ANOVA (across temperature windows)
Figure: One-way ANOVA (across precipitation windows)
Results and discussions (continue)...
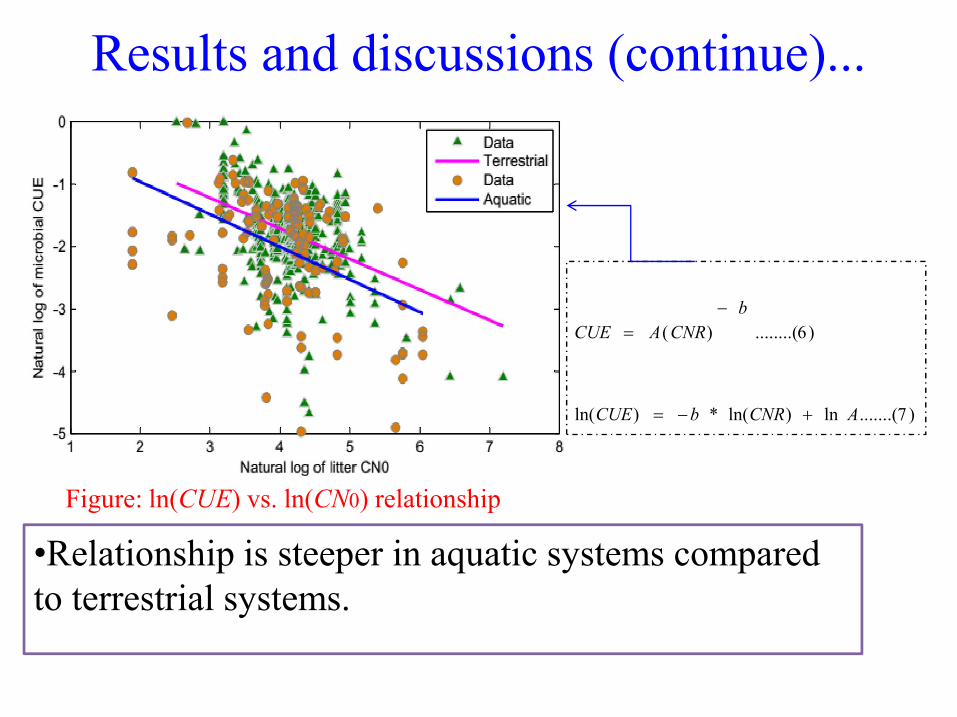
)6........()(
b
CNRACUE
Figure: ln(CUE) vs. ln(CN0) relationship
•Relationship is steeper in aquatic systems compared to terrestrial systems.
)7.......(ln)ln(*)ln( ACNRbCUE
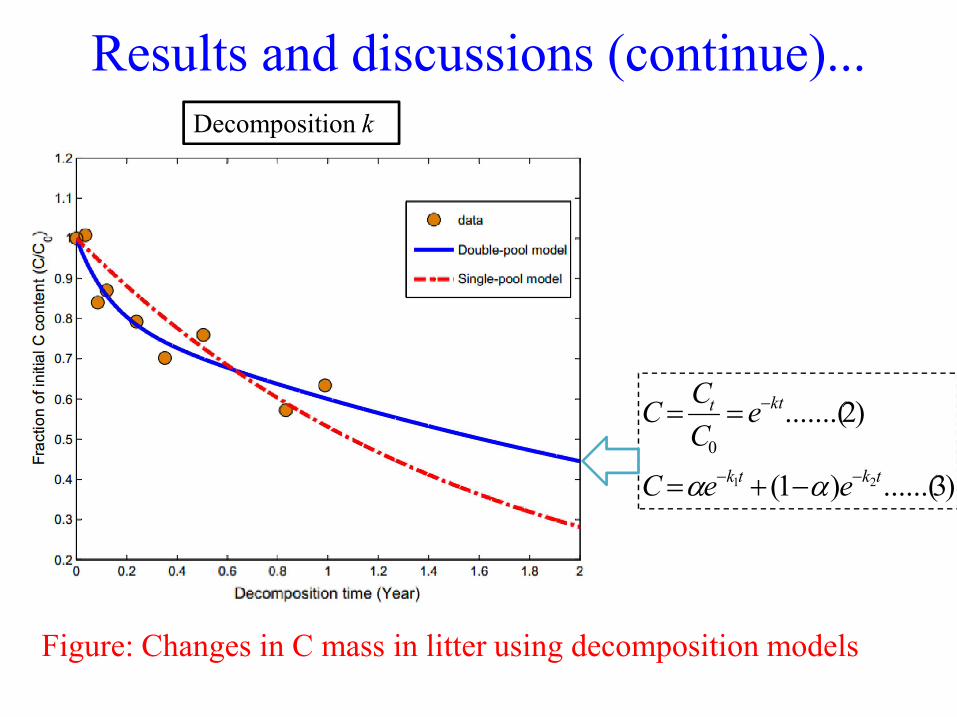
Results and discussions (continue)...Decomposition k
Figure: Changes in C mass in litter using decomposition models
)3......()1(
)2.......(
21
0
tktk
ktt
eeC
eC
CC
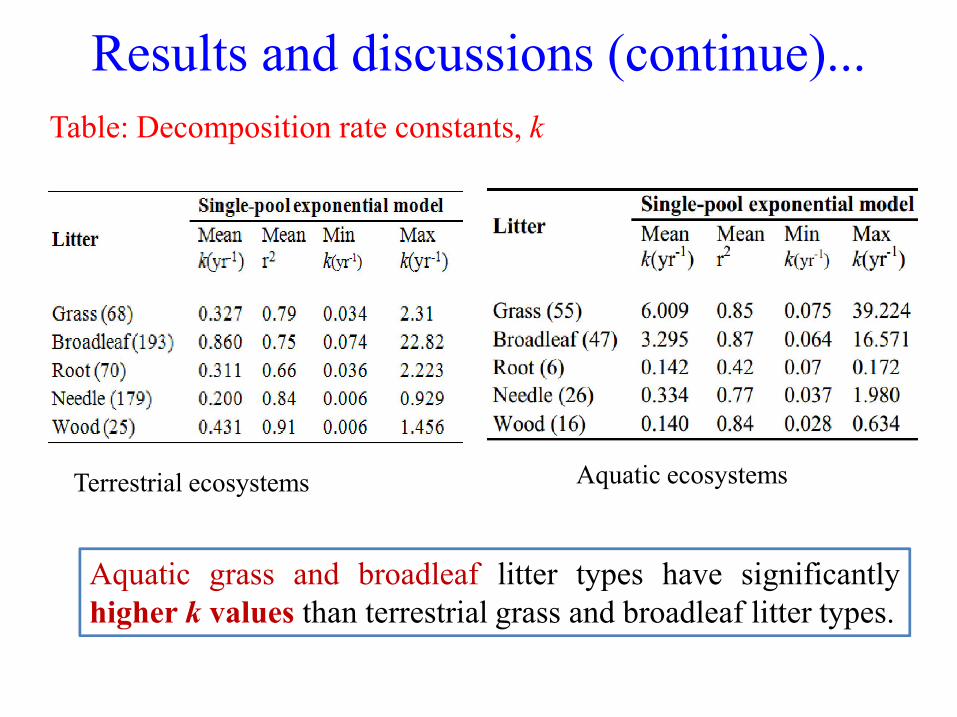
Results and discussions (continue)...
Table: Decomposition rate constants, k
Terrestrial ecosystems Aquatic ecosystems
Aquatic grass and broadleaf litter types have significantlyhigher k values than terrestrial grass and broadleaf litter types.
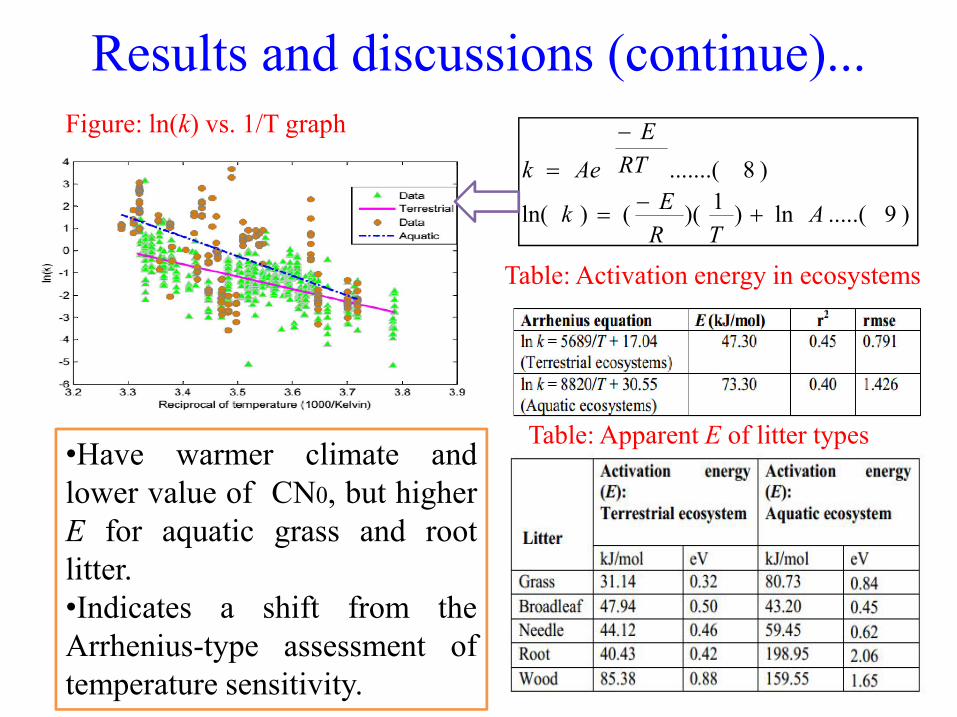
Results and discussions (continue)...Figure: ln(k) vs. 1/T graph
Table: Activation energy in ecosystems
)9.....(ln)1
)(()ln(
)8.......(
ATR
Ek
RT
E
Aek
•Have warmer climate andlower value of CN0, but higherE for aquatic grass and rootlitter.•Indicates a shift from theArrhenius-type assessment oftemperature sensitivity.
Table: Apparent E of litter types
Results and discussions (continue)...
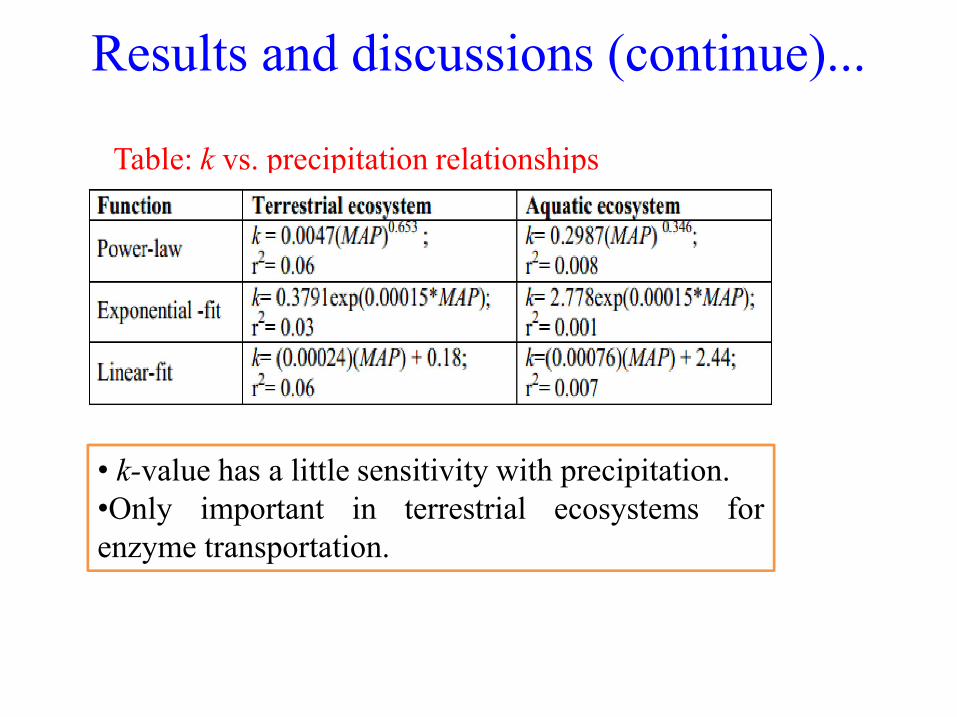
Table: k vs. precipitation relationships
• k-value has a little sensitivity with precipitation.•Only important in terrestrial ecosystems forenzyme transportation.
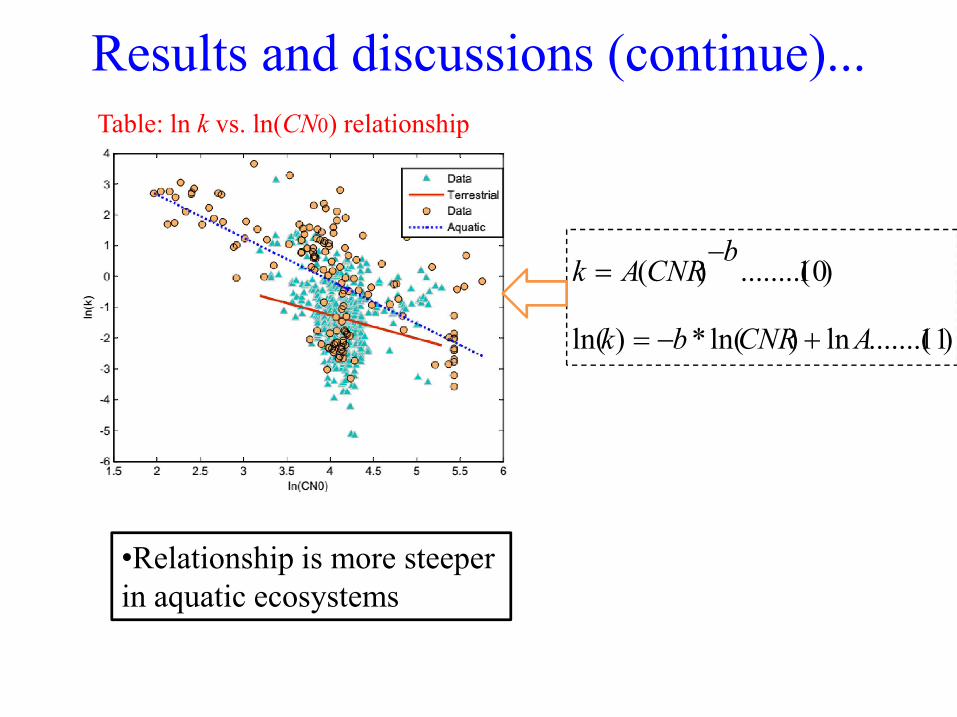
Results and discussions (continue)...Table: ln k vs. ln(CN0) relationship
)11.......(ln)ln(*)ln(
)10........()(
ACNRbk
bCNRAk
•Relationship is more steeper in aquatic ecosystems
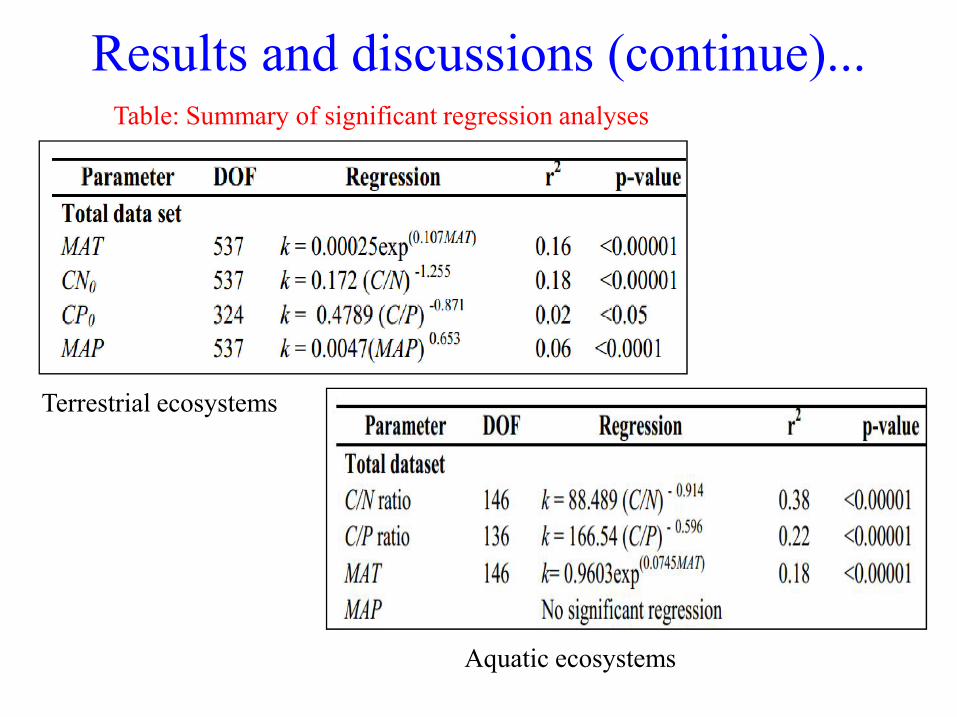
Results and discussions (continue)...Table: Summary of significant regression analyses
Terrestrial ecosystems
Aquatic ecosystems
Results and discussions (continue)...
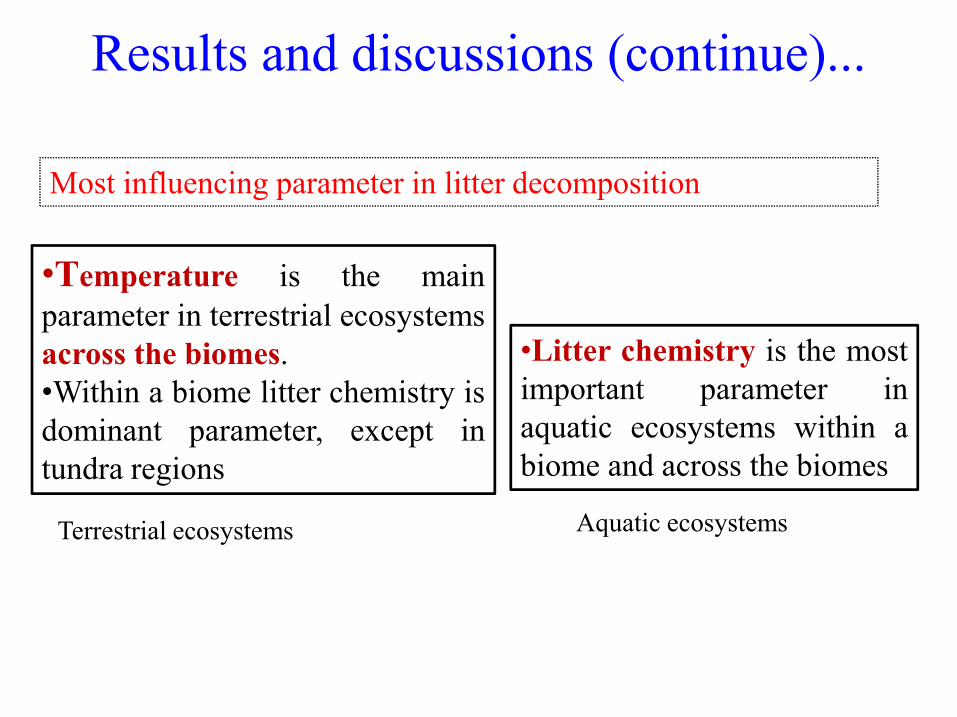
Most influencing parameter in litter decomposition
•Temperature is the mainparameter in terrestrial ecosystemsacross the biomes. •Litter chemistry is the mostacross the biomes.•Within a biome litter chemistry isdominant parameter, except intundra regions
•Litter chemistry is the mostimportant parameter inaquatic ecosystems within abiome and across the biomes
Terrestrial ecosystems Aquatic ecosystems
Results and discussions (continue).
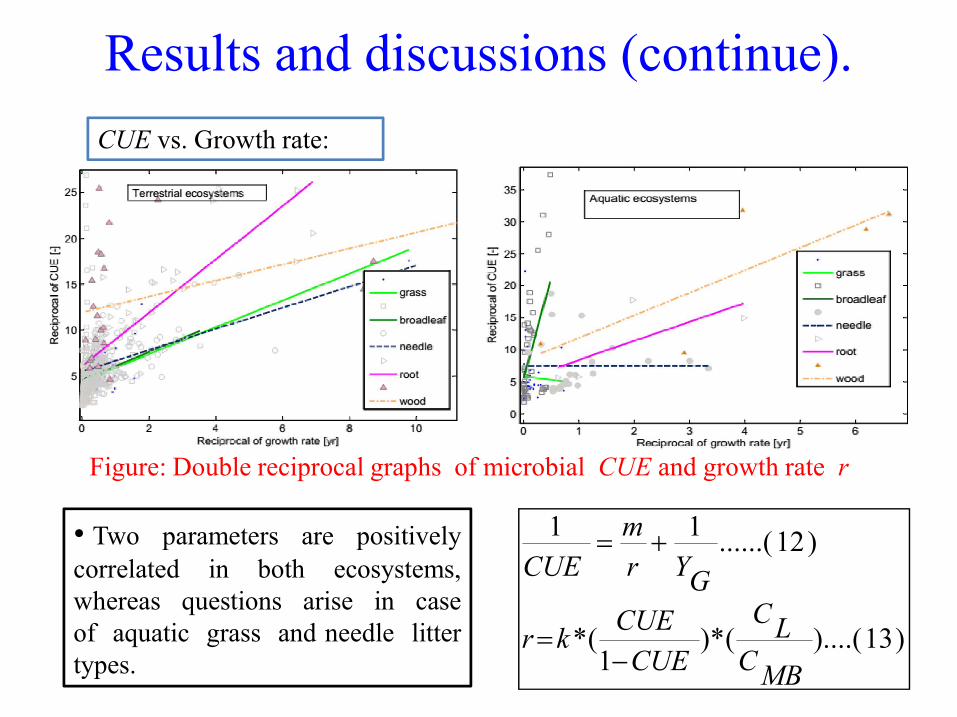
CUE vs. Growth rate:
Figure: Double reciprocal graphs of microbial CUE and growth rate r
• Two parameters are positivelycorrelated in both ecosystems,whereas questions arise in caseof aquatic grass and needle littertypes.
)13)....((*)1
(*
)12......(11
MBC
LC
CUE
CUEkr
GYr
m
CUE
Conclusions
• Temperature and precipitation do not matter for CUEin both ecosystems.
• CUE decreases with increased CN0 of litter in bothecosystems.
• Temperature is the main predicting parameter of• Temperature is the main predicting parameter oflitter decomposition in terrestrial ecosystems at thelarger scale. In contrast, litter chemistry is ofprimary importance in aquatic ecosystems.
• Microbial growth rate is positively correlated withCUE

Thank you for listening !!!
Questions? Questions?