msc. thesis the influence of absenteeism on the turkish
TRANSCRIPT
MSc. Thesis
The influence of absenteeism on the Turkish hazelnut sector
A study about the influence on agricultural policies, productivity of agricultural
land, and output of the hazelnut sector in Turkey
Lisanne de Wit 891010-966-040 Master International Development Studies Wageningen University and Research Centre, Development Economics Group Supervisor: Dr. Kees Burger April, 2014

2
3
Abstract With agricultural policies the Turkish government wants to decrease the hazelnut production area
and total output of the sector. The purpose of this study was to investigate the influence of
absenteeism among hazelnut farmers on the low effectiveness of current agricultural policies, low
productivity in and high output of the hazelnut sector in Turkey. Qualitative and quantitative data is
collected in Samsun province. Structured and semi-structured interviews are conducted. Economic
behaviour models and investment decision models are used for analysis. The analysis is twofold;
farmers’ constraints of making use of the policies and different income generating activities of the
farmers are compared. Because of fixed costs and irreversibility of investments in tree crops, tree
crop farmers are less reactive to trends in the market. The hazelnut crop was found to be less
profitable then other crops in the research area. Though the government policies include (financial)
incentives, it is found that little farmers uproot their hazelnut orchards and invest in other crops. The
analysis suggests that the main reason is that the financial constraints for resident farmers and
labour constraints for absentee farmers for investment are not met. Different from the past, the
Turkish government currently does not intervene in the market with support prices and buying
excess stocks. If the government continues this policy it is argued to diminish total output of
hazelnuts. Due to lower profitability of productivity increasing activities, productivity of hazelnut
orchards will decrease. Only if farmers are able to bear the investment, the second reaction is
suggested to be uprooting and starting with production of other crops. The last conclusion is that
because of excess stocks in the market the government currently has no incentive to stimulate
improved productivity.
4
Acknowledgements Without the help of many people this thesis would not have been established. First a special thanks
to Mr. Osman Kılıς and Mr. Uğur Başer, without whom this research would never have been possible.
I would like to show you my appreciation and gratitude for all the help you gave me and the many
nice moments we shared in Samsun. Also, I would like to thank Mr. Kees Burger for the good
cooperation and all the useful comments while supervising my thesis and internship research.
A special thanks also for the employees of the Ministry of Agriculture in Samsun and Çarşamba who
were very welcoming and helped me with making appointments and also provided a lot of
information. Mrs. Aysel Altay, Mr. Gürsel Balçi, Mrs. Nuray Yükselen Yılmaz, Mr. Osman Akman, Mrs.
Yeliz Özturan Akman and all the other employees for all the generous support.
I would like to thank all the farmers responding to the questionnaires and the experts who were
willing to have me for interviews. In Samsun province these were Mr. İsmail Güngör, Mr. Orhan
Demirsoy, Mr. Fatih Güngör, Mrs. Tülay Dalgiç, Mrs. Filiz Akçay Terekçi, Mrs. Hülya Hociyunuz, Mrs.
Yeliz Gemrik, Mr. Özgür Özcelik, Mr. Mehmet Emin Doğan, Mr. Mehmet Öztürk, Mr. Mehmet
Bozoğlu, Mrs. Nuray Akbulut, Mr. Bayram Ay, Mrs. Olgunay Şahinoğlu, Mr. Yaşar İleri, and in Keşap
Mr. Mustafa Şahin, Mrs. Fatma Tozoğlu, and Mrs. Sevda Yilmaz. You have taught me a lot about
agriculture in the area.
Lastly I would like to thank all the warm people I met in Turkey, among which Canan, Maira, Umut,
Ezgi, Serap, Eda, Bekir, Evan, Cath, everyone from Otel Altay and the Dilmer language institute: I am
glad that I can call you my friends now.
Çok teşekkür ederim!
5
Abbreviations ASCU Agricultural Sales Co-operatives Union Da Decares DFIF Support and Price Stabilisation Fund ETTP Expected Total Physical Product HASCU Hazelnut Agricultural Sales Co-operatives Union (Fıskobırlık) Hrs Hours Kg Kilogram LFPR Labour Force Participation Rate MOA Ministry of Food, Agriculture and Livestock MOAS Ministry of Food, Agriculture and Livestock in Samsun MPP Marginal Physical Product SEE State Economic Enterprise SPO State Planning Organisation TL Turkish Lira TMO Toprak Mahsulleri Ofisi’nin TTP Total physical product TÜIK Turkish Statistical Institute
Turkish Translations Agricultural Chambers Ziraat Odası Area Based Income Support Alan Bazlı Gelir Desteği Area Based Support Payment Alan Bazlı Destekleme Ödemesi Cold storage Soğuk Hava Deposu
Compensation Payment Telafi Edici Ödeme Direct Income Support Doğrudan Gelir Desteği (DGD) Support and Price Stabilisation Fund Destekleme ve Fıyat Istıkrar Fonundan
6
Contents
Abstract ............................................................................................................................................... 3
Acknowledgements ............................................................................................................................. 4
Abbreviations ...................................................................................................................................... 5
Turkish Translations ............................................................................................................................ 5
Chapter 1 Introduction ............................................................................................................................ 8
1.1 Turkey as Hazelnut Producing Country ......................................................................................... 8
1.2 Hazelnut Related Agricultural Policies in Turkey ......................................................................... 10
1.2.1 Price support and input subsidies ........................................................................................ 10
1.2.2 Direct Income Support ......................................................................................................... 10
1.2.3 Restrictions on Planted Area & Payments for Alternative Crops ......................................... 10
1.3 Migrating Farmers in the Turkish Black Sea region ..................................................................... 11
1.3.1 Migration from Turkey ......................................................................................................... 11
1.3.2 Migration in Turkey .............................................................................................................. 11
1.4 Characterisation of Absentee Farmers in Turkey ........................................................................ 14
1.5 Conceptualization of Absentee Farmers ..................................................................................... 14
1.5.1 Migration, Absenteeism & Off-site farming ......................................................................... 14
1.5.2 Characterizing the Turkish hazelnut farmers beyond Migration ......................................... 15
1.6 Literature Analysis Relationship Migration and Agriculture ....................................................... 16
1.7 Chapter outline ............................................................................................................................ 17
Chapter 2 Methodology ........................................................................................................................ 18
2.1 Research Methods ....................................................................................................................... 18
2.2 Data Collection ............................................................................................................................ 18
2.3 Research Area .............................................................................................................................. 19
Chapter 3 Conceptual Framework ........................................................................................................ 21
3.1 Neoclassical economic theory of farm production ..................................................................... 21
3.2 Chayanov’s farm household model & related theories .............................................................. 22
3.3 Model Used For this Study .......................................................................................................... 24
3.4 Input and output relationships .................................................................................................... 25
3.4.1 Product-product relationship ............................................................................................... 25
3.4.2 Factor-factor relationship ..................................................................................................... 26
3.5 Consequences of Investment ...................................................................................................... 27
Chapter 4 – Intensive vs. Extensive Hazelnut production ..................................................................... 29
7
4.1 Characteristics of Hazelnut Production ....................................................................................... 29
4.1.1 General introduction to the crop ......................................................................................... 29
4.1.2 Agricultural Practices ............................................................................................................ 31
4.2 Decision to perform farm activities ............................................................................................. 33
4.3 Optimal production outcomes .................................................................................................... 36
4.3.1 Practices creating high output.............................................................................................. 36
4.3.2 Absentee farmers reaching high output levels .................................................................... 37
Chapter 5 Alternative Income Sources .................................................................................................. 42
5.1 Crop division ................................................................................................................................ 42
5.2 Analysis Alternative Income Options .......................................................................................... 42
5.2.1 Off-farm income ................................................................................................................... 42
5.2.2 Comparison of crop characteristics ...................................................................................... 43
5.2.3 Selling land ........................................................................................................................... 49
Chapter 6 Relationship between absenteeism and hazelnut policies .................................................. 50
6.1 Current policies ........................................................................................................................... 50
6.2 Additional Supports ..................................................................................................................... 57
6.3 Potential new policies ................................................................................................................. 57
Chapter 7 Discussion ............................................................................................................................. 59
Chapter 8 Conclusions ........................................................................................................................... 60
References ......................................................................................................................................... 62
Appendices ........................................................................................................................................ 66
Endnotes ............................................................................................................................................ 72
8
Chapter 1 Introduction When people think of hazelnuts, they think of Turkey. Approximately 75 percent of all hazelnuts
worldwide are produced in the country. But while total production is high, productivity is low
compared to other production areas. Traditionally the Turkish government has a lot of influence in
the sector. Also, many farmers combine their hazelnut production with other income gaining
activities. A considerable part of the hazelnut farmers can be referred to as ‘absentee farmers’ and
do not live close to their orchards. The government currently wants farmers to uproot their hazelnut
orchards on good quality agricultural land, but uptake and thus effectiveness among farmers is low.
In this thesis the question is raised what the relationship is between the characteristics of the sector,
the low uptake of the uprooting policy and the high total production and low productivity found. It
specifically addresses the influence of absenteeism by asking the following question:
“Does the high prevalence of absenteeism provide an explanation for the
effectiveness of current agricultural policies, the existence of low productivity
of agricultural land and high output of hazelnuts in Turkey?”
This introduction provides information about Turkey’s position as hazelnut producing county in the
world, and introduces the characteristics of the sector in Turkey. How Turkey gained this position is
briefly introduced by discussing the agricultural policies related to hazelnut production. Furthermore,
this chapter introduces other ‘forces’ explaining the current situation in the Turkish agricultural
sector, such as the large emigration flow during the ‘1960s. Lastly, the farmers being the topic of this
thesis -the absentee hazelnut farmers-, and their position in hazelnut production are introduced.
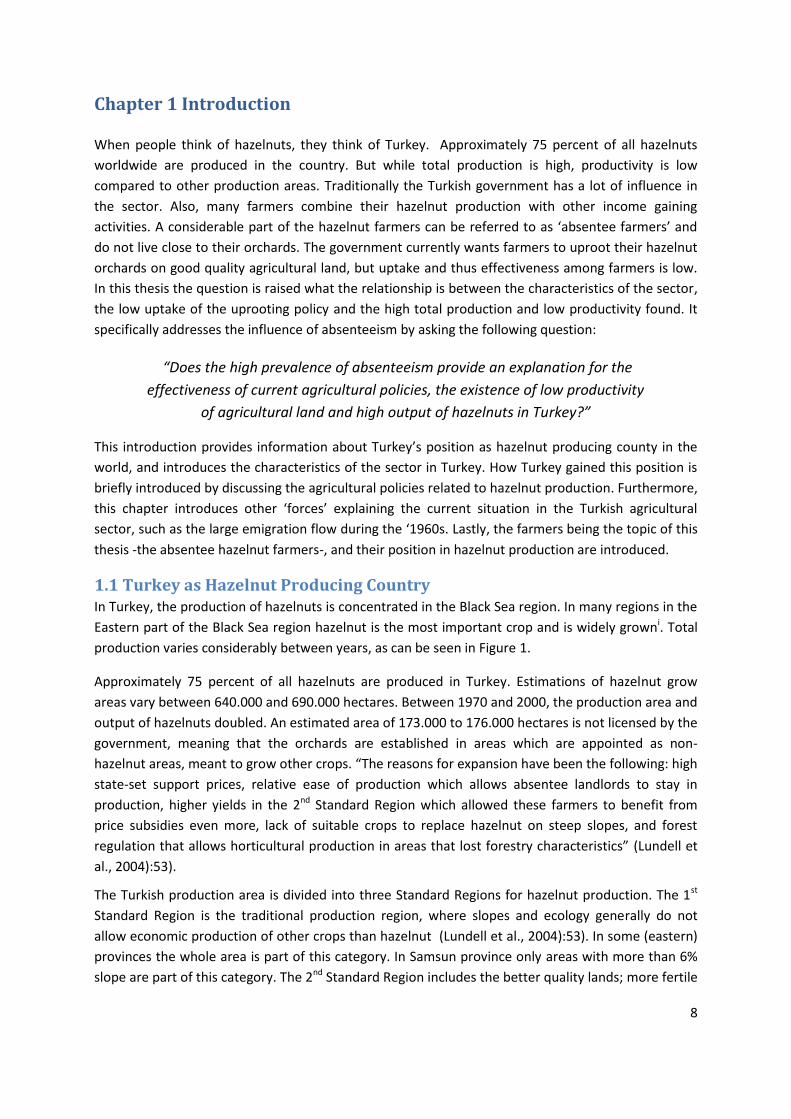
1.1 Turkey as Hazelnut Producing Country In Turkey, the production of hazelnuts is concentrated in the Black Sea region. In many regions in the
Eastern part of the Black Sea region hazelnut is the most important crop and is widely growni. Total
production varies considerably between years, as can be seen in Figure 1.
Approximately 75 percent of all hazelnuts are produced in Turkey. Estimations of hazelnut grow
areas vary between 640.000 and 690.000 hectares. Between 1970 and 2000, the production area and
output of hazelnuts doubled. An estimated area of 173.000 to 176.000 hectares is not licensed by the
government, meaning that the orchards are established in areas which are appointed as non-
hazelnut areas, meant to grow other crops. “The reasons for expansion have been the following: high
state-set support prices, relative ease of production which allows absentee landlords to stay in
production, higher yields in the 2nd Standard Region which allowed these farmers to benefit from
price subsidies even more, lack of suitable crops to replace hazelnut on steep slopes, and forest
regulation that allows horticultural production in areas that lost forestry characteristics” (Lundell et
al., 2004):53).
The Turkish production area is divided into three Standard Regions for hazelnut production. The 1st
Standard Region is the traditional production region, where slopes and ecology generally do not
allow economic production of other crops than hazelnut (Lundell et al., 2004):53). In some (eastern)
provinces the whole area is part of this category. In Samsun province only areas with more than 6%
slope are part of this category. The 2nd Standard Region includes the better quality lands; more fertile
9
and flatter lowlands (GAIN, 2009):8, (Lundell et al., 2004), (Gönenç et al., 2006). There is also the 3rd
Standard Region which is scattered around the country and has developed for local consumption. It
covers only % 0.6-%0.9 of the total hazelnut area” (Lundell et al., 2004):53).
Figure 1: Total hazelnut production in Turkey (in tons)
Currently Turkey faces a large production area and overproduction of hazelnuts, which has been
covered by the government for years by buying the excessive stockii. Therefore, the farmers felt
relatively little of the issues related to overproduction.
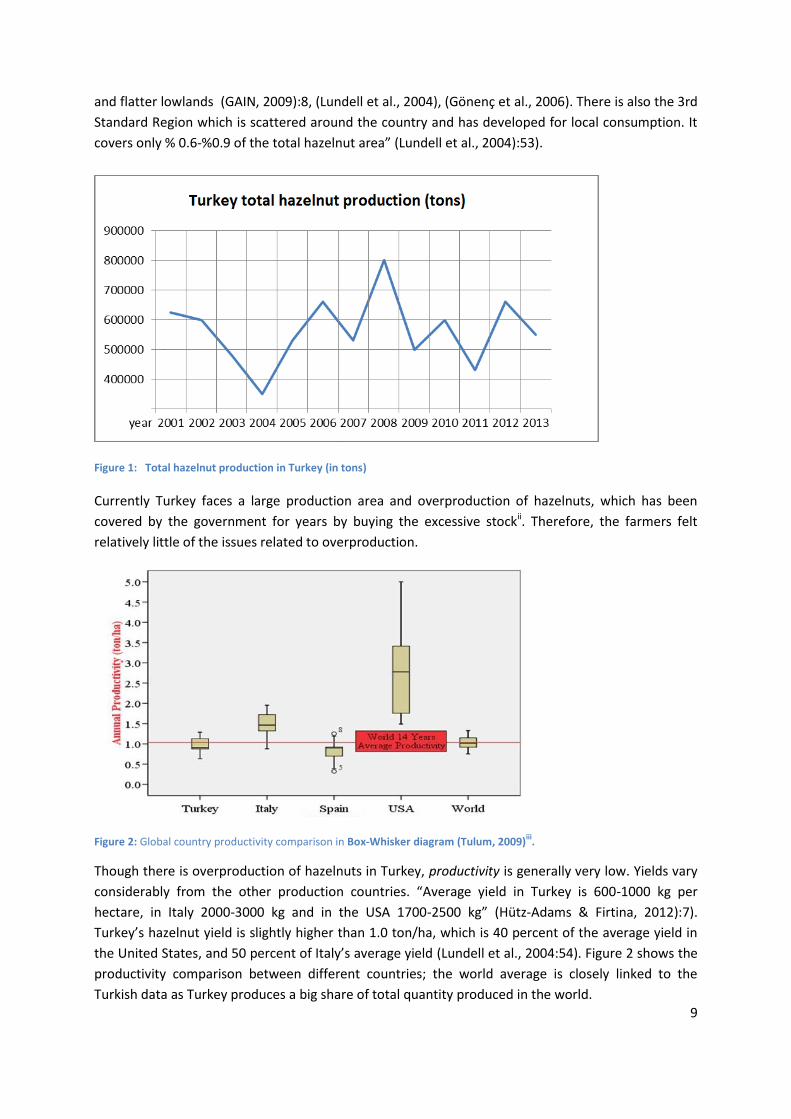
Figure 2: Global country productivity comparison in Box-Whisker diagram (Tulum, 2009)iii
.
Though there is overproduction of hazelnuts in Turkey, productivity is generally very low. Yields vary
considerably from the other production countries. “Average yield in Turkey is 600-1000 kg per
hectare, in Italy 2000-3000 kg and in the USA 1700-2500 kg” (Hütz-Adams & Firtina, 2012):7).
Turkey’s hazelnut yield is slightly higher than 1.0 ton/ha, which is 40 percent of the average yield in
the United States, and 50 percent of Italy’s average yield (Lundell et al., 2004:54). Figure 2 shows the
productivity comparison between different countries; the world average is closely linked to the
Turkish data as Turkey produces a big share of total quantity produced in the world.
10
Reasons for the low yields in Turkey are the prevalence of old and underproductive shrubs, too close
planting, bad soil conditions, soil erosion, limited availability of necessary inputs and care (Lundell et
al., 2004:54, (Hütz-Adams & Firtina, 2012:7).
1.2 Hazelnut Related Agricultural Policies in Turkey The Turkish hazelnut sector has a long history of government support, the major policies which have
been in place are: price support and input subsidies, direct income support, restrictions on planted
area combined with payments for alternative crops, and high border protection (Burrell & Kurzweil,
2007), (Yavuz, Birinci, Peker, & Atsan, 2003), (Kayalak & Özçelik, 2012). For more information on the
historical policies and trends in the sector please be referred to Appendix A.
1.2.1 Price support and input subsidies
In 1964 the government started to support prices to encourage hazelnut production, raise producers’
incomes and prevent soil erosion as outcome of production (Secer, 2008). Output (hazelnut) price
support and input subsidies for fertilizers and pesticides were provided, which ended up is a vicious
circle. “Excessive high support prices spurred output growth, which has put significant downward
pressure on world market prices. This increased the political pressure to maintain high support prices
and significant state purchases (roughly 150,000 tons annually which are never released into the
market), which have cost the government over $2 billion over the past ten years” (Lundell et al.,
2004):51). Currently the government has officially stopped with this policy. Turkey still has a
monopoly position in the hazelnut sector, the prices in the world market are strongly linked to the
fluctuations in the Turkish sector. This has the advantage that prices follow Turkey’s output; which
can level profits for Turkish farmers. The price policies has distorted this balance, the combination of
a monopoly position and excessive production is inefficient. Though being in a monopoly position,
Turkey is not free from competition. Though still marginal, there are trends that buyers develop
hazelnut orchards in other countries in order to become less dependent on the Turkish market. Also,
for some manufactured products almonds are competing with hazelnuts.
1.2.2 Direct Income Support
In 1999 the World Bank and International Monetary Fund put pressure on Turkey to reduce the
government intervention on hazelnut prices. In 2000 the large agricultural policy reform program
called ‘ARİP’ (Agriculture Reform Implementation Project) was introduced. Instead of price support,
now direct income support was provided; not product based but area based. Until this date, there
were and are no rules about the destination of the money. As will be shown later, the payments can
be a great share of farmers’ hazelnut incomes.
1.2.3 Restrictions on Planted Area & Payments for Alternative Crops
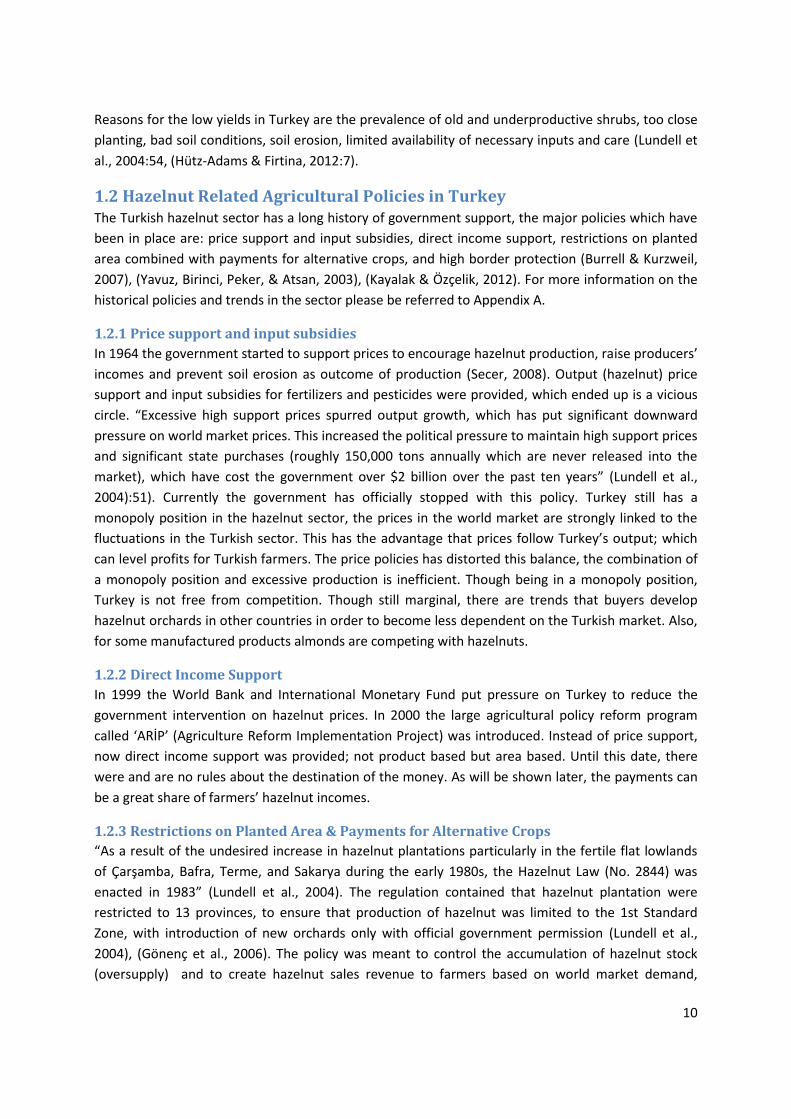
“As a result of the undesired increase in hazelnut plantations particularly in the fertile flat lowlands
of Çarşamba, Bafra, Terme, and Sakarya during the early 1980s, the Hazelnut Law (No. 2844) was
enacted in 1983” (Lundell et al., 2004). The regulation contained that hazelnut plantation were
restricted to 13 provinces, to ensure that production of hazelnut was limited to the 1st Standard
Zone, with introduction of new orchards only with official government permission (Lundell et al.,
2004), (Gönenç et al., 2006). The policy was meant to control the accumulation of hazelnut stock
(oversupply) and to create hazelnut sales revenue to farmers based on world market demand,
11
instead of on government subsidies (Lundell et al., 2004), by “reducing the comparative profitability
of hazelnut, inducing farmers to switch to other crops” (Lundell et al., 2004). In 2001 the list of
allowed production areas was updated. Also, another decree was introduced, that included
payments to farmers in illegal areas for uprooting existing hazelnut trees and switching to alternative
crops (Lundell et al., 2004). Despite this regulation and compensation payments, hazelnut production
continued in forbidden areas (Yavuz et al., 2003):2, (Secer, 2008):1557).
Figure 3: Support - and export prices and Net Income calculations, Source: World Bank, 2004:58
1.3 Migrating Farmers in the Turkish Black Sea region For many (small scale) farmers the income from the hazelnut harvest is often only an additional
income next to their main income source (Gönenç, et al. (2006:21). Apart from the harvesting period
these farmers can and do not spend much time in their orchard. In the research area1 it is found that
these farmers are one group whose orchards do not reach maximum productivity levels. Some of
them live in other cities in Turkey such as Ankara or Istanbul, while others settled in other countries.
The migration background and some figures on these absentee farmers are provided here.
1.3.1 Migration from Turkey
Turkey is among the world's leading labour-sending nations, with 3.5 million ‘Turkish-born persons’
living abroad in 2006, most of them in Germany (Escobar, Hailbronner, Martin, & Meza, 2006):707-
708). Most of the Turkish emigrants originate from Central Anatolia and Black Sea regions (the
research area) (Adaman & Kaya, 2012):8). After guest worker programs ended, workers stayed
abroad and family members joined. Many of them still own land in Turkey, and return every year.
For more background information please see Appendix B.
1.3.2 Migration in Turkey
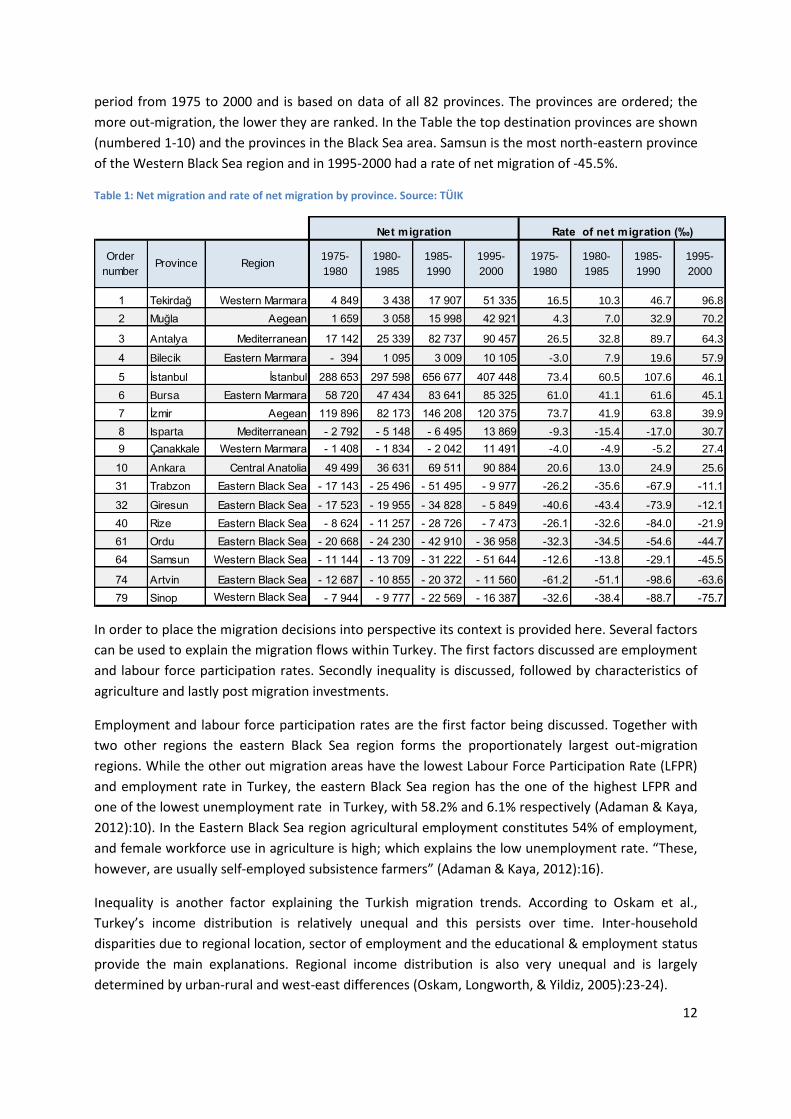
Not only emigration has occurred, but also migration within the country. This paragraph provides
data about this trend and underlying factors. Latest information and definitions used can be found in
Appendix C. Picture 1 shows the regional divisions and Table 1 provides the migration data for the
1 The research area is defined in chapter 2.
12
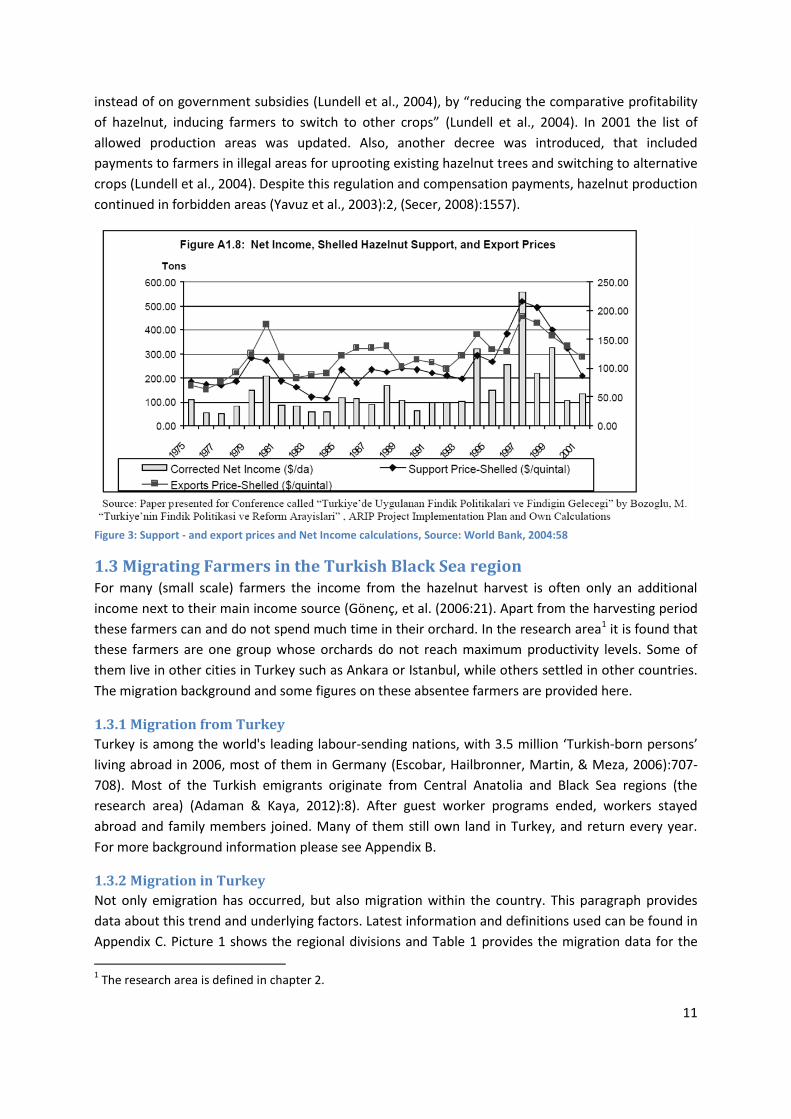
period from 1975 to 2000 and is based on data of all 82 provinces. The provinces are ordered; the
more out-migration, the lower they are ranked. In the Table the top destination provinces are shown
(numbered 1-10) and the provinces in the Black Sea area. Samsun is the most north-eastern province
of the Western Black Sea region and in 1995-2000 had a rate of net migration of -45.5%.
Table 1: Net migration and rate of net migration by province. Source: TÜIK
In order to place the migration decisions into perspective its context is provided here. Several factors
can be used to explain the migration flows within Turkey. The first factors discussed are employment
and labour force participation rates. Secondly inequality is discussed, followed by characteristics of
agriculture and lastly post migration investments.
Employment and labour force participation rates are the first factor being discussed. Together with
two other regions the eastern Black Sea region forms the proportionately largest out-migration
regions. While the other out migration areas have the lowest Labour Force Participation Rate (LFPR)
and employment rate in Turkey, the eastern Black Sea region has the one of the highest LFPR and
one of the lowest unemployment rate in Turkey, with 58.2% and 6.1% respectively (Adaman & Kaya,
2012):10). In the Eastern Black Sea region agricultural employment constitutes 54% of employment,
and female workforce use in agriculture is high; which explains the low unemployment rate. “These,
however, are usually self-employed subsistence farmers” (Adaman & Kaya, 2012):16).
Inequality is another factor explaining the Turkish migration trends. According to Oskam et al.,
Turkey’s income distribution is relatively unequal and this persists over time. Inter-household
disparities due to regional location, sector of employment and the educational & employment status
provide the main explanations. Regional income distribution is also very unequal and is largely
determined by urban-rural and west-east differences (Oskam, Longworth, & Yildiz, 2005):23-24).
1 Tekirdağ Western Marmara 4 849 3 438 17 907 51 335 16.5 10.3 46.7 96.8
2 Muğla Aegean 1 659 3 058 15 998 42 921 4.3 7.0 32.9 70.2
3 Antalya Mediterranean 17 142 25 339 82 737 90 457 26.5 32.8 89.7 64.3
4 Bilecik Eastern Marmara - 394 1 095 3 009 10 105 -3.0 7.9 19.6 57.9
5 İstanbul İstanbul 288 653 297 598 656 677 407 448 73.4 60.5 107.6 46.1
6 Bursa Eastern Marmara 58 720 47 434 83 641 85 325 61.0 41.1 61.6 45.1
7 İzmir Aegean 119 896 82 173 146 208 120 375 73.7 41.9 63.8 39.9
8 Isparta Mediterranean - 2 792 - 5 148 - 6 495 13 869 -9.3 -15.4 -17.0 30.7
9 Çanakkale Western Marmara - 1 408 - 1 834 - 2 042 11 491 -4.0 -4.9 -5.2 27.4
10 Ankara Central Anatolia 49 499 36 631 69 511 90 884 20.6 13.0 24.9 25.6
31 Trabzon Eastern Black Sea - 17 143 - 25 496 - 51 495 - 9 977 -26.2 -35.6 -67.9 -11.1
32 Giresun Eastern Black Sea - 17 523 - 19 955 - 34 828 - 5 849 -40.6 -43.4 -73.9 -12.1
40 Rize Eastern Black Sea - 8 624 - 11 257 - 28 726 - 7 473 -26.1 -32.6 -84.0 -21.9
61 Ordu Eastern Black Sea - 20 668 - 24 230 - 42 910 - 36 958 -32.3 -34.5 -54.6 -44.7
64 Samsun Western Black Sea - 11 144 - 13 709 - 31 222 - 51 644 -12.6 -13.8 -29.1 -45.5
74 Artvin Eastern Black Sea - 12 687 - 10 855 - 20 372 - 11 560 -61.2 -51.1 -98.6 -63.6
79 Sinop Western Black Sea - 7 944 - 9 777 - 22 569 - 16 387 -32.6 -38.4 -88.7 -75.7
Net migration Rate of net migration (‰)
1975-
1980
1980-
1985
1985-
1990
1995-
2000
1980-
1985
1985-
1990
1995-
2000
Order
numberProvince Region
1975-
1980
13
Picture 1: Map of Turkey and NUTS 1 Level Regions. Source: (Adaman & Kaya, 2012:61)
Not only differences in income, but also productivity differences between provinces are growing over
time (Worldbank, 2000):11), resulting in increasing regional inequality at province level. As a result,
Turkish provinces are diverging: richer provinces are getting richer, while poor countries are falling
further behind. According to (SPO, 2000):23-24), the main driving forces are fast structural change as
a result of migration from rural to urban areas, and the increasing capital use mainly in Western
Turkey (Oskam et al., 2005):21). Here migration is both the reason and the outcome; a circle of
influence can be observed. Appendix D includes an overview of GDP per capita for several cities in
Turkey. Though some exceptions occur (such as Adana), the map shows overlap with the map of
Turkey; the more to the right in the figure, the more the city is located in the (south) east.
Though nearly all Turkey’s development plans have focused on reducing regional development
disparities, many have not reached their goals (SPO, 2001):73). “Regional income inequalities arise
mainly because of differences in types of economic activities pursued, together with differences in
productivity between sectors. For instance, poorer regions generally have bigger share of their
resources employed in agriculture, where productivity is usually lower (Worldbank, 2000):12). It is
clear that improving the productivity of agriculture would improve the situation of underdeveloped
regions” (Oskam et al., 2005):20).
Small plots & low productivity of agricultural lands can both be reasons for and outcomes of
migration. Being the central theme of this thesis, it will be discussed more in depth in the coming
chapters. A large number of farms in Turkey are small, with less than 5 hectares of land, and lack the
capital for expansion (Temel, 2005):48). Concerning hazelnut orchards; most eastern producers have
small orchards of around one to 2.5 hectares, and use hazelnut production for supplementary
income, while western producers have larger orchards (10-15 hectares) (Longworth, 2005):70-71).
One of the reasons for the small farms in Turkey is the land fragmentation which fits in the
inheritance traditions. “The absence or poor functioning of land institutions [is one of the] factors
behind this fragmentation. Among the institutions blamed are inheritance and property laws,
commercial laws in the rural context, the arrangements for leasing and distributing state land to
farmers, land use policies, and the complex structure of agricultural infrastructure organisations”
(Temel, 2005):39-41). The second reason posed is the farmers’ “emotional attachment to their land is
also a factor contributing to fragmentation; such attachment is likely to make farmers reluctant to
accept new tenure arrangements, even if these arrangements are economically beneficial” (Temel,
2005):39-41).
14
The changed preferences of returned migrants are a fourth factor explaining the migration flow in
Turkey. Martin has described this as follows: “the most concrete negative effect of migration may be
the inequality fostered by the preferences of many migrants to invest at least part of their savings in
urban areas. Almost all successful returned migrants bought apartments in a nearby urban area, and
several mayors noted that before emigration broadened horizons, local people who obtained
additional money tended to invest locally. Although Turkey has been urbanising since the 1960s,
migration clearly increased the lure of urban areas as preferred places to live and invest, further
spurring rural to urban migration” (1991):53).
1.4 Characterisation of Absentee Farmers in Turkey After explaining the background of the situation in previous subchapters, this subchapter focuses on
the farmers who are the topic of this research; the absentee farmers. In the research area, different
officials of the local governments have estimated the percentage of absentee farmers to be up to
50% of the total number of hazelnut farmers. Unfortunately no official data were present. As no
official numbers are present, the influence of the absentee farmers on the market situation in the
total hazelnut sector cannot be determined. But, the influence of absenteeism on farm decisions,
productivity, and policy adoption of individual farms can be studied; which is done in this research.
These insights are used as possible explanations for wider trends in the hazelnut sector.
But, why can absenteeism make a difference? Firstly, farmers who are not present are less able to
apply inputs to the orchards, in order to increase yields. Also, they are themselves not able to
physically observe diseases or other unfavourable circumstances, or to quickly react on them. Lastly,
absenteeism is not beneficial for marketing the product, as farmers are less able to quickly react on
changing market circumstances, such as the prices which are very variable in the hazelnut market.
The question is how this situation influences the situation on the farm, and how farmers react to this.
In literature many cases are found of absent landlords, farmers who own farm land, but do not spend
much of their time on on-farm activities. In many cases these farmers make use of farm managers
(who can make farm decisions and can do maintenance work)iv. This behaviour is not much found in
the research area; instead of making use of labour input of other persons, the farmers prefer to use
little inputs and to manage their farms by extensive systems. This means that labour input is not
provided on a regular but on an occasional basis.
1.5 Conceptualization of Absentee Farmers
1.5.1 Migration, Absenteeism & Off-site farming
In the research area absentee farmers can be found that combine farming with other types of gaining
income far away from the place of the farm. If this observation is compared with literature, it can be
found that this was conceived as a rather abnormal way of farming; most often farmers are seen as
strongly linked to the location and farm (Cheshire, Willing, & Skrbiš, 2013):1). Some researchers have
focused attention on migratory trends among farming and rural populationsv, however, what is rarely
considered to date is that mobility has become a regular and routine component of farm life, rather
than being ‘disruptive of the fixed and settled status quo’ (Halfacree & Rivera, 2012):94), Cheshire,
Willing & Skrbiš (2013):3). Bakewell (Bakewell, 2008):1351) has described the same trend in
literature linking migration and development. Though migration is not always seen as a negative
thing anymorevi, the current view of a vicious circle in which migration contributes to development
15
“operates on the assumption that the normal and desired state for human beings is to be sedentary”
(Bakewell, 2008):1350). This study will not address the impact of migration other than on agricultural
production land. For example, the occurrence of a ‘brain drain’ or the impact of remittancesvii on the
country of origin or on migrants’ families will not be discussed.
Absentee farmers in Turkey are partly connected to place and farming. They are not fully connected,
because most of the year they are not physically present at the place where their farm is located.
They are not completely disconnected, as they still have some land which is used for farming.
Therefore absentee farmers are conceptualized as follows: people who own and cultivate agricultural
land, but who are not able to be physically present year round. The number of agricultural activities
executed is not included, as this can show considerable variation between absentee farmers. Also,
these activities can be performed by others (for example hired workers) and thus absenteeism does
not have to influence output. The last part contains ability to be present instead of presence because
many crops do not request agricultural activity during the whole year. When only looking at presence
it would be very difficult to make a distinction between those farmers who are not able to visit their
farms on regular basis, and those who are able but do not do it because the crops grown do not
require this investment. Similar to the article of Ishemo, Semple, and Thomas-Hope (2006), both
farmers who live abroad or elsewhere in the country are here referred to as absent farmers.
1.5.2 Characterizing the Turkish hazelnut farmers beyond Migration
In order to understand the absentee farmers not only their migration characteristics have to be
described, but also their other characteristics. It was found impossible and irrelevant for the
construction of the economic decision making models to answer the question whether farmers in the
research area should be referred to as peasants or commercial family farmers (based on definitions
in literature). Therefore this section only compares the farmers in the research area with peasant
literature in order to get a better understanding of the hazelnut farmers.
Concerning engagement in markets, Crabtree concludes that peasants have to be viewed as ‘an
integral part of the overall economic system’ (Crabtree, 2002):13). Ellis points out peasants work in
imperfect markets and commercial family farmers work in ‘fully developed product and factor
markets’ (Ellis, 1993):10). These can exist next to each other because market failure is household
specific instead of commodity specific. This means that some farmers in an area can observe market
failures, while others do not (Dejanvry, Fafchamps, & Sadoulet, 1991):1401).
Both peasants and commercial family farmers can be engaged in cash crop production or derive a
significant share of farm consumption from non-farm income earning activities (Ellis, 1993):9), as
farmers in the research area do. This links with the last part of the definition of peasants; the
engagement in input and output markets, which is only partial. Partial engagement can probably be
best explained by the logics used in the article of Dejanvry et al. (1991): farmers can decide whether
they use their land for growing food or cash crops, depending on the attractiveness of the crop. In
times that growing cash crops is not very lucrative, farmers can step out of the market and grow
crops for own consumption. This system is not much found in the research area, as farmers growing
tree crops are less flexible in following the market. But, they do show their partial engagement in the
market in another way; by having multiple sources on income. The potential importance of off-farm
income activities is noticed both by (Holden, 1993):243-244) and (Ellis, 1993):4).
16
It can be concluded that on some points the situation in the Turkish hazelnut area fits the description
of markets where peasants are said to find themselves in, while on other points the markets seemed
to have developed further towards competitive and developed markets. Some factors are discussed
here; credit-, inputs-, technology and information-, land markets and presence of price information.
The credit and land markets seem to fit the peasant market situation best; farmers mostly get credit
from traders. Also, some have to sell their hazelnuts directly after the harvest because of money
needs, while prices are low. Getting land by inheritance is far more common than open market
transactions. Entry and exit are possible, but are not most common. Inputs are much available from
different sources, information on new technologies is provided by government extension officers.
Information on prices are widely available. Stock markets are present in different villages and
farmers have different selling option with own prices and systems. On these points the overall sector
seems to fit the market of commercial family farms better.
1.6 Literature Analysis Relationship Migration and Agriculture In this subchapter the current literature on the relation of absenteeism and farm decisions &
productivity is described. As no literature is found on absentee farmers in Turkey, this analysis is
based on researches in other parts of the world, such as the Caribbean and India. Economic studies
on labour migration come together in the New Economics of Labour Migration2. This research starts
from the point where the decision of (labour) migration is already made by farmers and thus does
not make use of these studies. Some articles are found on the influence of absenteeism, among
which (Bakker and van Doorn (2009); Kung, Wu, and Wu (2012); Theobald (2001)), though for
different fields of study. Much of the literature focuses on absent landlords, who often have labour
agreements for their farms such as maintenance contractsviii. Mbonile (2003) studied the effects of
absenteeism in Tanzania but unfortunately did not calculate financial effects. Saxena (1992), though
referring to ‘off-site’ farmers, studied the decisions made and underlying motivations in relation to
growing Eucalyptus trees in India. Though not providing a definition of ‘off-site’ farmers, from the
text it can be understood that these farmers often have increased off-farm investment options, after
which less energy can be spend on farm activities.
Ishemo et al. (2006) study the relationship between the endurance of small scale farming as a result
of household migration decisions in Jamaica. The difference with this research is that the area they
studied is mainly characterized by return migration, making it less applicable to this research. Their
literature study on the impact of population mobility on agriculture can provide some additional
insights in discussions in literature. It shows that there are two main perspectives on this topic.
Ishemo et al. (2006) summarise that the first perspective focuses on the negative aspects of
migration. Writers from this perspective have argued that migration results in reduction in the size of
community labour forces. This, in turn, affects the productive capacity of those remaining behind,
resulting in poorly maintained land and gradual deterioration of the agricultural infrastructure.
Money obtained from remittances is used to purchase food rather than cultivating it (2006):318),
thus food self-sufficiency is decreased. Whether this is good or bad is a subjective notion, though.
Opposing views are that migration can have positive outcomes for agriculture as well. (Thomas-Hope
2 For an introduction please see (Stark & Bloom, 1985).
17
(1993)) has found this in the Caribbean households. She noted that the capital received makes a
major positive contribution to development because incomes are used to support local production as
well as consumption. Nevertheless, she noted that negative impacts are experienced in situations
where there is persistent dependency on external funds, or where absenteeism occurs for an
extended period of time. In both situations, agricultural lands become idle and this undermines
agriculture and the development process in local communities” (Ishemo et al., 2006): 318-319).
Pastor (1985) also noted that the impacts of migration on agriculture are location specific, differing
from country to country and from area to area within a single country” (Ishemo et al., 2006):319).
From this finding it is concluded that not only the studied factors (migration and agricultural
decisions and productivity) should be studied, but also other trends or factors in the hazelnut sector.
Therefore the relationship with agricultural policies in Turkey is studied as well.
Saxena offers a characterization of farmers growing Eucalyptus trees in Uttar Pradesh, India. Here a
tree planting stimulation project was extremely well adopted in regions characterized by
commercialised agriculture and risen of agricultural productivity. “These changes impelled
landowners to adopt strategies which saved family labour and supervision time in cultivation. Many
'off-site' farmers, and such 'on-site' farmers who had a high ratio of owned land to male members in
the family, resorted to tree farming (...)this paper argues that woodlot planting of eucalyptus
emerged as an attractive option for landowners facing management and labour problems in western
U.P., as tree farming allowed saving in family labour time and permitted greater flexibility in the
timing of operations” (Saxena, 1992):159). As this article only includes one type of tree crop, which is
also no fruits bearing crop, the conclusions cannot be compared in the comparison of fruit crops in
the research area.
1.7 Chapter outline In Chapter 2 the methodology of this research can be found. Chapter 3 contains the conceptual
framework used for this thesis. In Chapter 4 a comparison is made between intensive and extensive
agricultural practices. Characteristics of the hazelnut crop and related production methods are
elaborated upon. This chapter concludes with a description of how absentee farmers would have to
manage their farms in order to reach high productivity levels. Chapter 5 compares the different
income options of hazelnut farmers. Chapter 6 contents the current (agricultural) policies related to
hazelnut production. The impact of agricultural policies on both absentee and resident farmers is
discussed. Also, the influence of absenteeism on the effectiveness of current policies is studied. In
Chapter 7 the discussion of this research is provided. Chapter 8 closes with the conclusion.
18
Chapter 2 Methodology In this chapter the methodology of this research is discussed. The first subchapter describes the
methods selected and underlying motivations. Subchapter 2 describes how data was collected. The
last subchapter provides an introduction to the research area.
2.1 Research Methods In this research a combination of methods is used in order to answer the research question. By using
these methods, relationships between trends in the hazelnut sector and decisions of individual farms
can be understood.
(1) Absentee farmers’ decisions are analyzed by using an economic production models. The models
are used to explain the economic side of the decisions made by absentee farmers. With these models
expectations about decisions and reactions to policies or market conditions are developed.
(2) Production methods and productivity are compared with outcomes of a specific group of resident
hazelnut farmers in Keşap who are reaching high production outcomes. This is done in order to
understand what it would take absentee hazelnut farmers to reach high hazelnut output/yield levels.
As no productivity data were collected specifically for absentee farmers, it is not possible to compare
their productivity levels to averages in the area. Instead, considerations can be made by comparing
information on production averages with a very productive hazelnut production group in the
neighbouring hazelnut production areas. This is done under the assumption that absentee farmers
have yield being lower or equal than resident farmers in the research area.
(3) The hazelnut crop investment is compared with other investment possibilities for the farmers in
order to put the current decisions into perspective. Other options are determined and their
attractiveness to absentee farmers are discussed.
(4) The decisions and characteristics of the absentee farmers are compared with policies affecting
Turkish hazelnut farmers with the same purpose of the third method: in order to put the decisions
into perspectives. By including historical policies, the background of the situation can be understood
and used to improve the understanding of the current situation and effects of current policies.
During the research no data was collected on risk attitudes. Therefore, no precise assumptions could
be made concerning the attitudes towards risk in the research areaix. Therefore it is decided to follow
the methodology used by Holden (1993). “In the absence of such studies, the observed behaviour in
the more general studies and that found in the studies of peasants’ attitudes towards risk elsewhere,
was made use of” (Holden, 1993):252).
2.2 Data Collection Data is collected by three methods; a literature study, semi-structured interviews with government
officials and extension officers and structured interviews with farmers.
The literature study is executed for two reasons. The part of the literature study done before data
collection in the research area is performed in order to prepare the research; to collect background
data, comparable cases and theoretical background. After data collection, a second and more
19
elaborative literature is used to compare the situation found in Turkey with literature on the topic.
This part provides the main conclusions of the research.
Semi-structured interviews are performed with government officials and extension officers. This part
of data collection focused on collecting background data and data on the various investment options.
Three different groups are interviewed; local officers of the Ministry of Agriculture to collect data on
production averages of different crops in the region, prices of these crops through years and
information on current agricultural policies. In addition, this group was asked for characterizing the
farmers in the area. Extension officers and producer group representatives were interviewed about
market incentives and marketing channels of different crops and about risk and uncertainty of
growing the crops in the research area. Lastly, university researchers were interviewed to receive
information about the hazelnut sector in general. The benefit of semi-structured interviews is that
one can probe for in-depth details, because there is room for clarification, for example about implicit
assumptions from the respondent (Drever, 1995) or researcher.
Structured interviews are performed with farmers on time allocated to different crops. This part of
the research is executed to measure the attractiveness of different crops (investments) to farmers
under the conditions found in the research area. Some crops can be profitable to grow under one
condition, while not being attractive at all to grow under other conditions. With this method, it is
assured that the outcomes of the investment options fit the conditions in the research area. Data is
collected on the investments that have to be made on different crops, time that has to be spent and
other factors influencing crop preferences. The different tree crops are represented in order to be
able to compare the attractiveness of these crops to farmers. Due to time limits annual crops were
not included. Two methods were used for reaching the farmers. The first method was using the
contacts of the local department of the Ministry of Agriculture in Çarşamba and Terme. The
advantage of this method is that farmers are willing to cooperate; a drawback is that the
respondents can be less representative for the whole research population because the group having
good contact with the government can be different from the whole farmer population. The second
method was visiting the weekly markets in Terme and Çarşamba, where many farmers come
together. These occasions were used to collect information with short questionnaires. The
advantages are the number of farmers reached and the fact that there is less selection (no
invitations), potentially providing a more representative image of the whole farmer population. The
advantage of using structured interviews is that the data can be compared as all respondents have
replied to the same questions.
2.3 Research Area This subchapter introduces the research area and explains why this area is selected.
Approximately 60% of the Turkish hazelnuts are grown in the Eastern Black Sea region (in regions 9-
13 on Picture 2 below). Ordu and Giresun are the main production regions here. As the research was
executed in cooperation with Mr. Kılıς, Associate Professor at the Ondokuz Mayıs University in
Samsun, Samsun was selected as the research base. The province of Samsun is indicated with (8.) on
the map (see Picture 2), and is located right next to Ordu province.
20
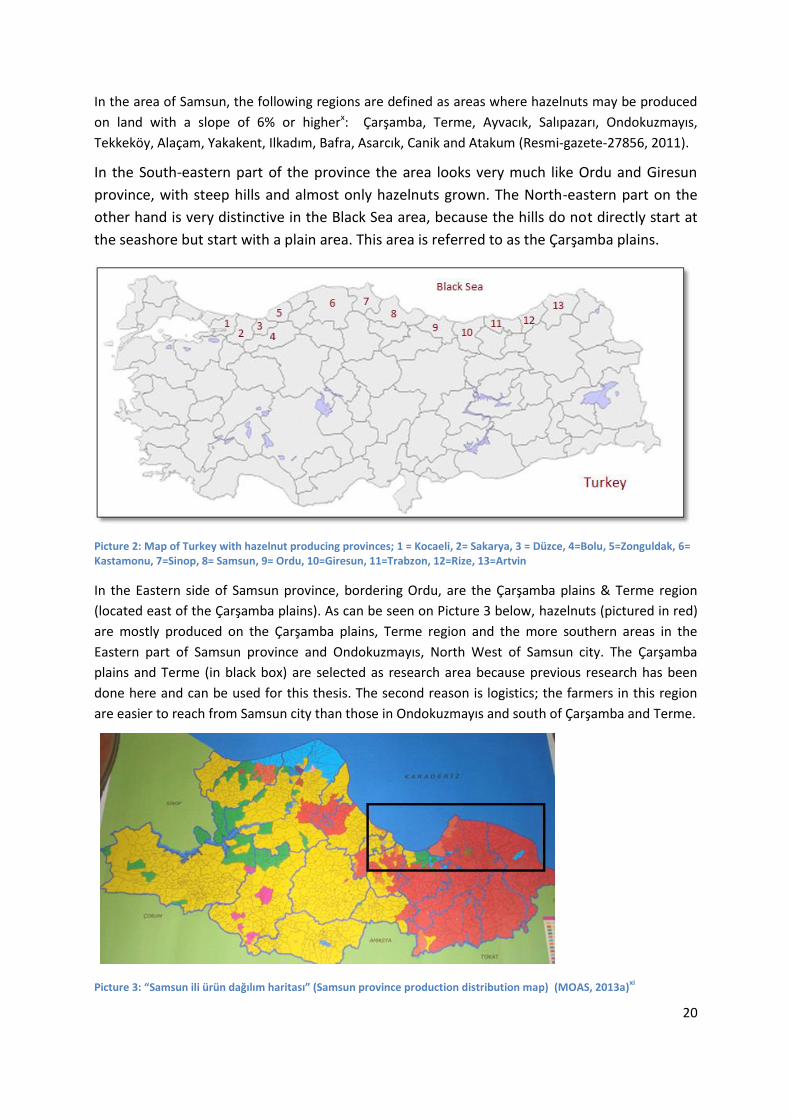
In the area of Samsun, the following regions are defined as areas where hazelnuts may be produced
on land with a slope of 6% or higherx: Çarşamba, Terme, Ayvacık, Salıpazarı, Ondokuzmayıs,
Tekkeköy, Alaçam, Yakakent, Ilkadım, Bafra, Asarcık, Canik and Atakum (Resmi-gazete-27856, 2011).
In the South-eastern part of the province the area looks very much like Ordu and Giresun
province, with steep hills and almost only hazelnuts grown. The North-eastern part on the
other hand is very distinctive in the Black Sea area, because the hills do not directly start at
the seashore but start with a plain area. This area is referred to as the Çarşamba plains.
Picture 2: Map of Turkey with hazelnut producing provinces; 1 = Kocaeli, 2= Sakarya, 3 = Düzce, 4=Bolu, 5=Zonguldak, 6= Kastamonu, 7=Sinop, 8= Samsun, 9= Ordu, 10=Giresun, 11=Trabzon, 12=Rize, 13=Artvin
In the Eastern side of Samsun province, bordering Ordu, are the Çarşamba plains & Terme region
(located east of the Çarşamba plains). As can be seen on Picture 3 below, hazelnuts (pictured in red)
are mostly produced on the Çarşamba plains, Terme region and the more southern areas in the
Eastern part of Samsun province and Ondokuzmayıs, North West of Samsun city. The Çarşamba
plains and Terme (in black box) are selected as research area because previous research has been
done here and can be used for this thesis. The second reason is logistics; the farmers in this region
are easier to reach from Samsun city than those in Ondokuzmayıs and south of Çarşamba and Terme.
Picture 3: “Samsun ili ürün dağılım haritası” (Samsun province production distribution map) (MOAS, 2013a)xi
21
Chapter 3 Conceptual Framework In this chapter a model is constructed by which the economic behaviour shown by (absentee)
farmers in the research area can be explained. As is shown in Chapter 1, farmers and markets in the
research area sometimes fit the definitions of peasants and sometimes they do not. The economic
behaviour model is largely based on models explaining peasants’ behaviour. Therefore the question
is raised whether it is problematic that the farmers in the research area do not fully fit in the
definition of peasants. It is concluded that for the model this does not have much implications as
many assumptions focus on the market situation fitting the situation in the research area, for
example on land of labour markets.
3.1 Neoclassical economic theory of farm production “[The neoclassical economic theory of farm production] begins with the farmer as an individual
decision maker concerned with questions such as how much labour to devote to the cultivation of
each crop, whether or not to use purchased inputs, which crops to grow in which fields, and so on. It
thus centres on the idea that farmers can vary the level and kind of farm inputs and outputs” (Ellis,
1993):17). The theory includes three points of possible variation which are all relationships between
farm inputs and outputs: the so-called factor-production relationship (output levels corresponding to
different levels of variable inputs), the factor-factor relationship (showing the way the farmer
combines its inputs in order to create a specific output), and the product-product relationship
(reflecting the cropping decision with a given set of inputs) (Ellis, 1993):17-18).
Some parts theory addressed by Ellis (1993):18) make the theory less usable for explaining peasants’
behaviour. The first one is that the theory solely focuses on short term profit maximisation and
therefore ignores the consumption decisions of farmers. Secondly, there is no room for different
goals within a household; the theory starts from one decision maker. Thirdly, it is assumed that
markets work optimally. The most important aspect for this research is that non-farm (income)
activities are not included. The model focuses on the optimal farm situation, while this is not the goal
of many Turkish farmers. Allocation of inputs is therefore solely focused on the farm, while this is
unworkable when farmers also want to allocate their resources to other sources of income or also
have other goals in life than solely farm optimisation, as will be discussed later. The theory does
explain well how the resources put aside for the farm income can be used optimally.
To stress the importance of the first point the following citation is used: “H.N. Barnum and L. Squire
(1979) (...) showed that the signs of the response elasticities for own consumption of farm
production, consumption of market goods and consumption of leisure all changed when
consumption was examined alone, compared to when the production and consumption parts of the
model were allowed to interact. This was a useful analysis because it demonstrated the importance
of considering the production and consumption aspects of farm-household behaviour
simultaneously” (Low, 1986):31).
22
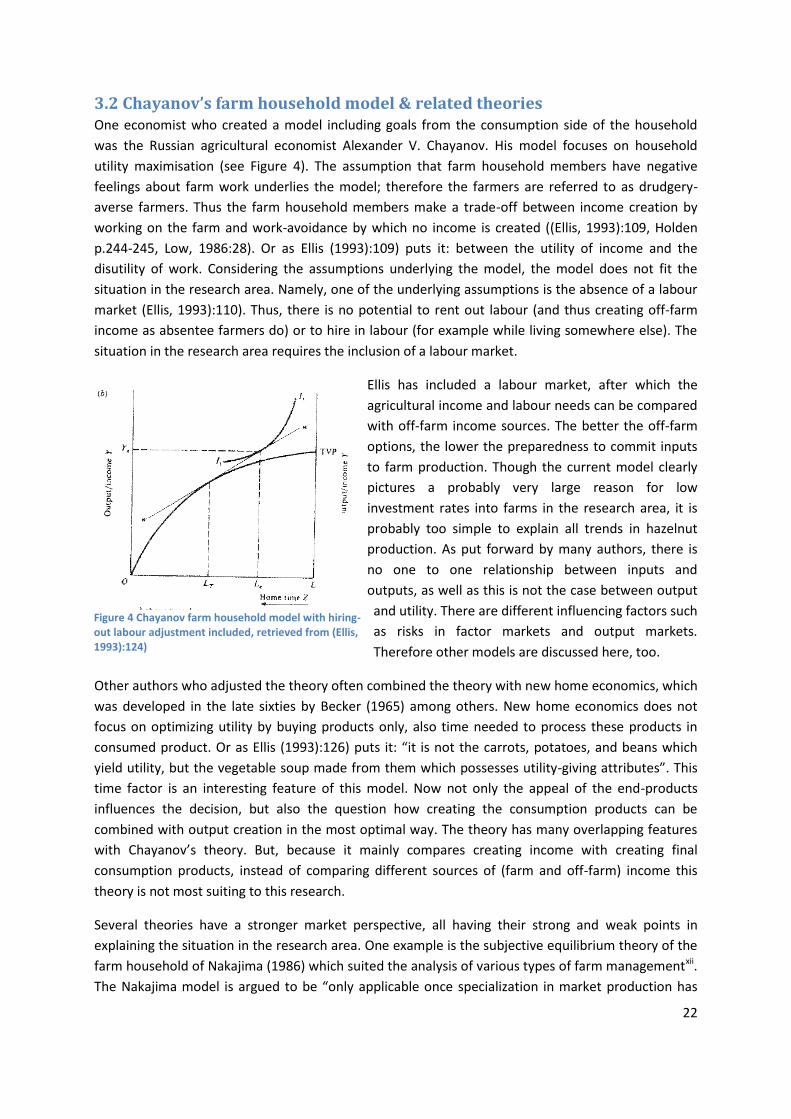
3.2 Chayanov’s farm household model & related theories One economist who created a model including goals from the consumption side of the household
was the Russian agricultural economist Alexander V. Chayanov. His model focuses on household
utility maximisation (see Figure 4). The assumption that farm household members have negative
feelings about farm work underlies the model; therefore the farmers are referred to as drudgery-
averse farmers. Thus the farm household members make a trade-off between income creation by
working on the farm and work-avoidance by which no income is created ((Ellis, 1993):109, Holden
p.244-245, Low, 1986:28). Or as Ellis (1993):109) puts it: between the utility of income and the
disutility of work. Considering the assumptions underlying the model, the model does not fit the
situation in the research area. Namely, one of the underlying assumptions is the absence of a labour
market (Ellis, 1993):110). Thus, there is no potential to rent out labour (and thus creating off-farm
income as absentee farmers do) or to hire in labour (for example while living somewhere else). The
situation in the research area requires the inclusion of a labour market.
Ellis has included a labour market, after which the
agricultural income and labour needs can be compared
with off-farm income sources. The better the off-farm
options, the lower the preparedness to commit inputs
to farm production. Though the current model clearly
pictures a probably very large reason for low
investment rates into farms in the research area, it is
probably too simple to explain all trends in hazelnut
production. As put forward by many authors, there is
no one to one relationship between inputs and
outputs, as well as this is not the case between output
and utility. There are different influencing factors such
as risks in factor markets and output markets.
Therefore other models are discussed here, too.
Other authors who adjusted the theory often combined the theory with new home economics, which
was developed in the late sixties by Becker (1965) among others. New home economics does not
focus on optimizing utility by buying products only, also time needed to process these products in
consumed product. Or as Ellis (1993):126) puts it: “it is not the carrots, potatoes, and beans which
yield utility, but the vegetable soup made from them which possesses utility-giving attributes”. This
time factor is an interesting feature of this model. Now not only the appeal of the end-products
influences the decision, but also the question how creating the consumption products can be
combined with output creation in the most optimal way. The theory has many overlapping features
with Chayanov’s theory. But, because it mainly compares creating income with creating final
consumption products, instead of comparing different sources of (farm and off-farm) income this
theory is not most suiting to this research.
Several theories have a stronger market perspective, all having their strong and weak points in
explaining the situation in the research area. One example is the subjective equilibrium theory of the
farm household of Nakajima (1986) which suited the analysis of various types of farm managementxii.
The Nakajima model is argued to be “only applicable once specialization in market production has
Figure 4 Chayanov farm household model with hiring-out labour adjustment included, retrieved from (Ellis, 1993):124)
23
developed to the extent that wage labour or cash cropping provides a more rewarding means of
acquiring the essentials of life than self-sufficient production” (Low, 1986)31-32). Because of the
large share of cash crop production and absentee farmers who prefer to do wage labour this seems
to be the case in the research area. Though the model of Low (1986) includes some strong aspects
such as risk, it is not used because it is less applicable to cash crop producersxiii.
In the Nakajima model all farm production is sold. In this case of many farmers in the research area
this assumption is not problematic. In later versions of the model own consumption was
incorporated, for example by Krishna(1970) and H.N. Barnum and L. Squire (1979) (Low, 1986):32).
Barnum and Squire use the assumption that first own consumption needs are met first, after which
the rest of the produce is sold, therefore not making a distinction between a selling and buying price.
Low argues that this assumption can be problematic in the situation of deficit (food) producers who
purchase a part of their food requirements. By introducing a difference between the selling and
purchasing price, the motivation of producing the own food becomes more visible, as the (higher)
purchase price does not have to be paid. This reasoning is not included in the Barnum Squire model.
The additional of Low surely is an improvement to the model of Barnum Squire. Though, for this
research the Barnum Squire assumption (or: method) is not problematic, as farmers in the research
mainly produce pure cash crops such as hazelnuts and fruits. Of course farmers can consume some of
their harvest, but the products are not used as staple food solving consumption requirements.
In both the models of Nakajima (1986) and H.N. Barnum and L. Squire (1979) land area is fixed at the
household level (as opposed to the Low model), thus resulting in diminishing returns to labour. This
assumption suits the situation in the research area. In the research area land is often received
through inheritance, and thus stays within the family. Orchards were found for sale in the research
area, but farmers often have capital constraints troubling buying new land. Potential new farm land
(fallow and nature) is scarce, which seems to be less the case in the area as described by Low (1986)
and Holden (1993). The latter will be introduced now.
Uncertainty and behaviour towards risk are ignored in the H.N. Barnum and L. Squire (1979) model.
As hazelnut yields show high yearly variations and some other crops are relatively new in the area,
risk is understood to play an important role in farming decisions in the research area. Therefore, on
this point the model does not fit the situation in the research area best. The Holden (1993) model
includes interesting aspects which are considered an improvement for the (H.N. Barnum & L.
Squire) model in relation to the situation in the research area. This model extends the before
mentioned modelsxiv by the inclusion of risk/uncertainty and seasonality (Holden, 1993):246). The
Holden model includes a distinction between (household) productionxv and maintenance activities,
for the last group of activities risk and uncertainty can be ignored due to the ‘relatively immediate
utility’ (Holden, 1993):246). One aspect of the model which is particularly interesting is the inclusion
of expected production and expected marginal production. “The expected utility of expected
marginal production then represents what the household trades off against the marginal disutility of
labour. Implicit in the utility function are time preferences and preferences towards risk/uncertainty”
(Holden, 1993):246-247). In the case of hazelnut production, a lot of variation in yields between years
and production areas occurs, due to the dependency on weather conditions. As labour input
decisions cannot be made in short time periods (for example because there is no day labour market
available providing secure income), these decisions have to be made based on expectations of
24
output instead of clear projections. Also the nature of agriculture paves the way for this way of
decision making. For example in the case of hazelnut production, farmers can decide to spend time
on winter pruning, increasing yields per shrub. If the whole harvest fails due to late frost (occurring in
spring), it might have been more profitable to spend this time on other income generating activities.
Another feature of the Holden model making it interesting for the analysis of farmers’ decisions in
this study is the inclusion of seasonality. “The inclusion of seasonality in the model implies that there
will be a new subjective equilibrium in every time interval” (Holden, 1993):247). Each period with
homogeneous conditions can be considered one time intervalxvi.
3.3 Model Used For this Study The household is used as the unit of analysis, as most farms found in the research area can be
referred to as family farms. In this way production and consumption decisions are combined,
differentiating peasants from firm enterprises. Secondly, focusing on the household instead of on the
farm provides room for looking at the optimal total income for the household instead of only taking
farm income into consideration. Lastly, there is room for individual motives from people within the
household. This makes the decisions ‘more human’; households do not only want to maximize profits
(for example), but also want to improve the quality of life; for example by spending time and money
on leisure, or money on luxury goods instead of only on food and farm inputs. As there are many
family farmers in the research area, the definition fits on this point. In the model used for this thesis,
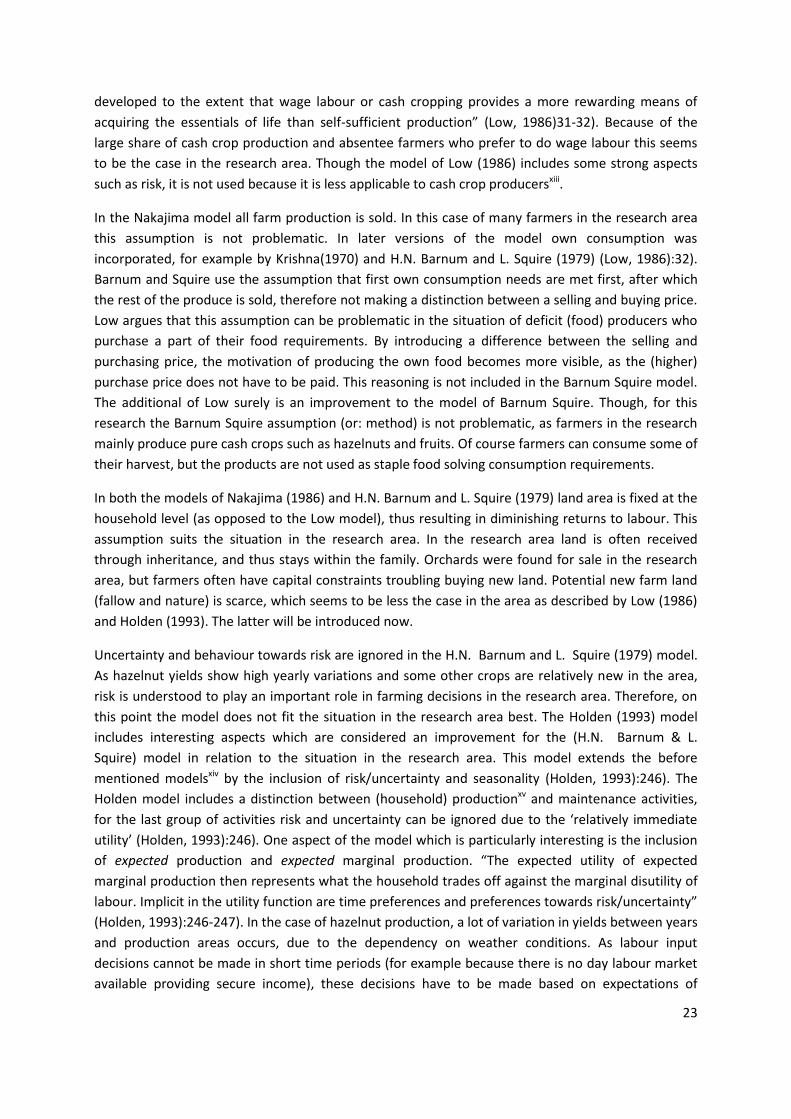
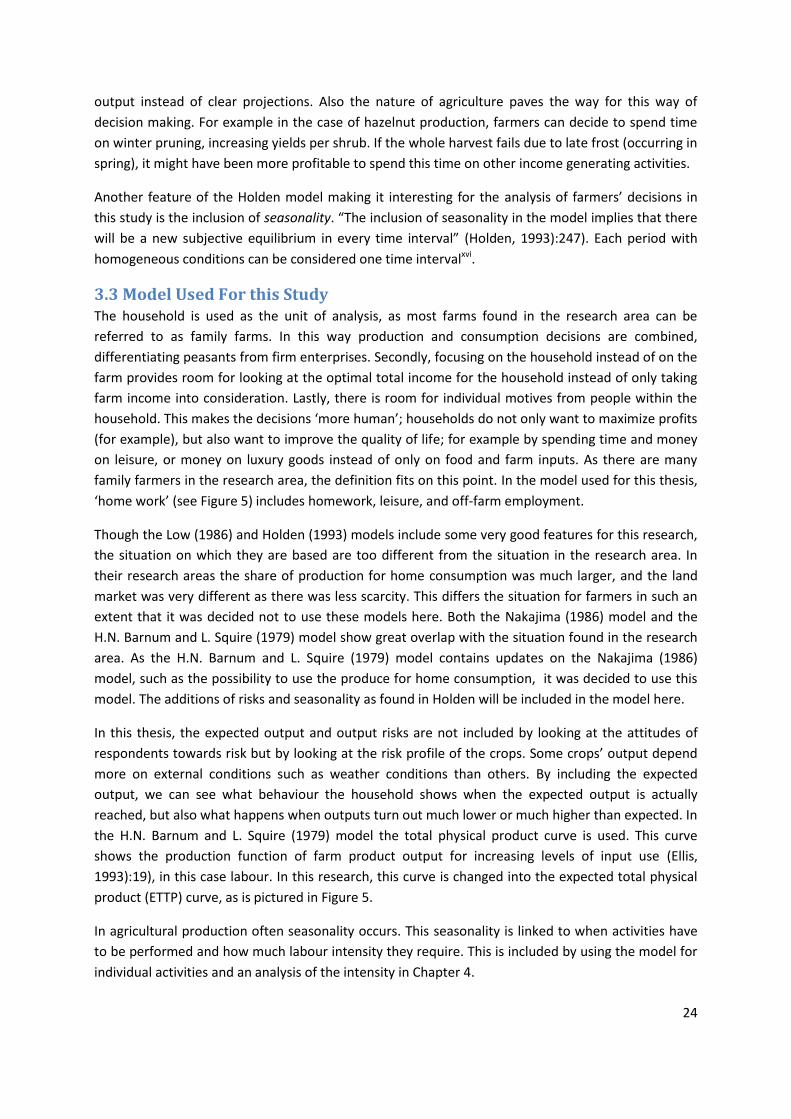
‘home work’ (see Figure 5) includes homework, leisure, and off-farm employment.
Though the Low (1986) and Holden (1993) models include some very good features for this research,
the situation on which they are based are too different from the situation in the research area. In
their research areas the share of production for home consumption was much larger, and the land
market was very different as there was less scarcity. This differs the situation for farmers in such an
extent that it was decided not to use these models here. Both the Nakajima (1986) model and the
H.N. Barnum and L. Squire (1979) model show great overlap with the situation found in the research
area. As the H.N. Barnum and L. Squire (1979) model contains updates on the Nakajima (1986)
model, such as the possibility to use the produce for home consumption, it was decided to use this
model. The additions of risks and seasonality as found in Holden will be included in the model here.
In this thesis, the expected output and output risks are not included by looking at the attitudes of
respondents towards risk but by looking at the risk profile of the crops. Some crops’ output depend
more on external conditions such as weather conditions than others. By including the expected
output, we can see what behaviour the household shows when the expected output is actually
reached, but also what happens when outputs turn out much lower or much higher than expected. In
the H.N. Barnum and L. Squire (1979) model the total physical product curve is used. This curve
shows the production function of farm product output for increasing levels of input use (Ellis,
1993):19), in this case labour. In this research, this curve is changed into the expected total physical
product (ETTP) curve, as is pictured in Figure 5.
In agricultural production often seasonality occurs. This seasonality is linked to when activities have
to be performed and how much labour intensity they require. This is included by using the model for
individual activities and an analysis of the intensity in Chapter 4.
25
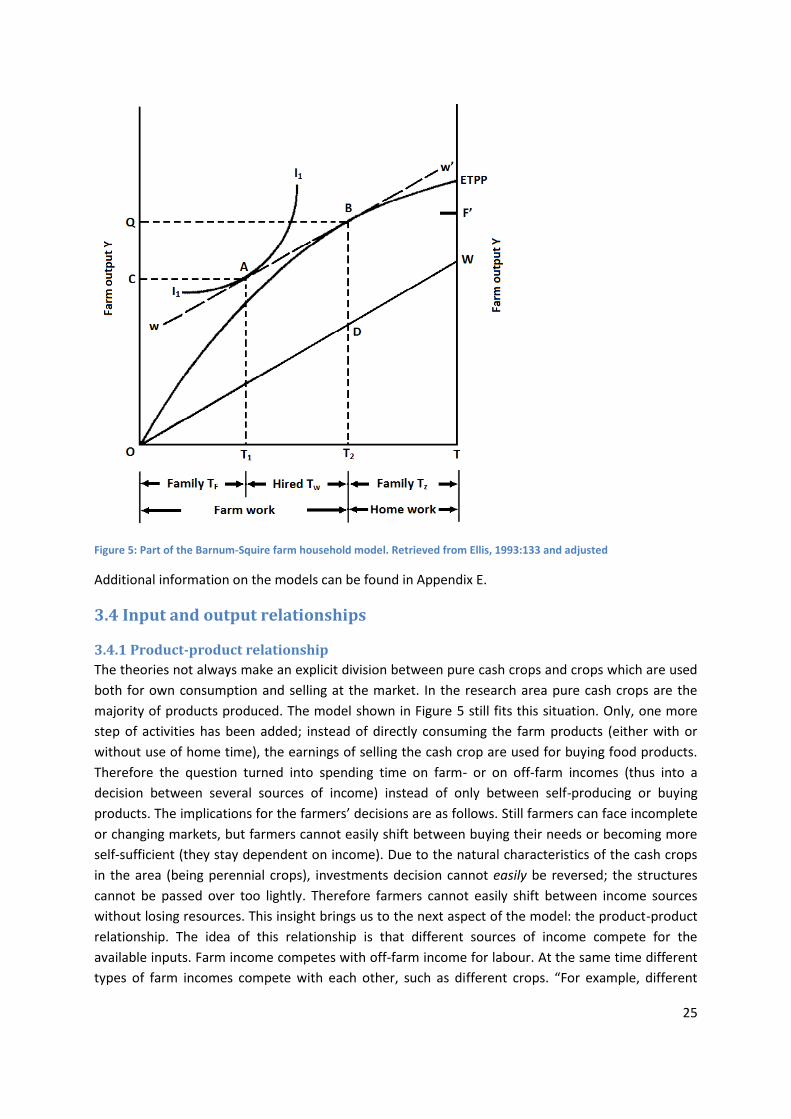
Figure 5: Part of the Barnum-Squire farm household model. Retrieved from Ellis, 1993:133 and adjusted
Additional information on the models can be found in Appendix E.
3.4 Input and output relationships
3.4.1 Product-product relationship
The theories not always make an explicit division between pure cash crops and crops which are used
both for own consumption and selling at the market. In the research area pure cash crops are the
majority of products produced. The model shown in Figure 5 still fits this situation. Only, one more
step of activities has been added; instead of directly consuming the farm products (either with or
without use of home time), the earnings of selling the cash crop are used for buying food products.
Therefore the question turned into spending time on farm- or on off-farm incomes (thus into a
decision between several sources of income) instead of only between self-producing or buying
products. The implications for the farmers’ decisions are as follows. Still farmers can face incomplete
or changing markets, but farmers cannot easily shift between buying their needs or becoming more
self-sufficient (they stay dependent on income). Due to the natural characteristics of the cash crops
in the area (being perennial crops), investments decision cannot easily be reversed; the structures
cannot be passed over too lightly. Therefore farmers cannot easily shift between income sources
without losing resources. This insight brings us to the next aspect of the model: the product-product
relationship. The idea of this relationship is that different sources of income compete for the
available inputs. Farm income competes with off-farm income for labour. At the same time different
types of farm incomes compete with each other, such as different crops. “For example, different
26
annual or perennial crops grown in pure stands compete with each other for a fixed resource of a
given quality of land. Two crops which ripen in the same month of the year would compete at
harvest time for a fixed labour resource, and so on”(Ellis, 1993):33). Leisure and maintenance
activities additionally compete for time with the activities requiring labour. The optimal economical
choice between activities is based on the ratio of output prices (Ellis, 1993): 35).
Actually, the models described above mainly focus on this relationship; finding the most interesting
combination of income, leisure and maintenance activities, with a given factor labour (time)
available. On farms this decision is not only made for the input labour, but also for other inputs
which are introduced in the next subchapter. As the input labour is the most distinctive input when it
concerns absentee farmers, this economic model used is based on this input. In the following
chapters other inputs are also discussed if relevant.
3.4.2 Factor-factor relationship
The factor-factor relationship discussed here follows the same principle as the product-product
relationship. It looks at the optimal combination of inputs producing a fixed level of outputs. The
underlying idea is that any production function which is based on two or more inputs “contains the
possibility that a given level of output could be produced with more than one combination of input”
(Ellis, 1993):29). Before the features of the factor-factor relationship of relevance for this research
are provided, a short introduction to the main resources in economic thinking is provided.
- Land. Humans can only be defined as farmers if they have access to the resource land. “An
important attribute of peasants worldwide is the significance of non-market criteria in the
allocation of land. In many peasant societies families have complex traditional rights of
access to land which prevail over and constrain the operation of freehold land markets. (...)
In peasant society land is more than just another factor of production which has its price”
(Ellis, 1993):8). This characterization fits the situation in the research area.
- Labour. “It is widely agreed that strong reliance on family labour is a defining economic
characteristic of peasants. (...) This feature does not rule out the use of hired labour in say,
peak periods of harvesting; nor the sale by members of the farm household of their own
labour outside the farm on an ad hoc basis; indeed for some peasant families this may be
essential for survival. The predominance of family labour in production also has an effect on
the working of labour markets in peasant communities, since various subjective criteria
peculiar to individual households are likely to influence both the supply and demand for
wage labour in the wider market” (Ellis, 1993):8).
- Capital. “Command over capital and its accumulation is a central attribute of capitalist
production, as also is the notion of a rate of return on capital in the form of profit” (Ellis,
1993):9). This is difficult to link with household production because both production and
consumption occurs. Also inputs can be used both purposes. “The absence of a systematic
category of rate of return to capital in such cases further distinguishes peasant households
from capitalist enterprises” (Ellis, 1993):9).
From this subchapter it should be clear that famers can make different decisions concerning how to
use their input factors. The main difference between absentee farmers and other farmers is how
they make use of their resources; how they allocate them between different income generating
27
activities. Absentee farmers have decided to spend their labour on off-farm incomes. Thereafter
farmers have two options for increasing their yields if they would want to; (1) get their resource
labour by other means, for example by hiring labour, or (2) by increasing the use of other inputs.
These options will be discussed further in the next chapter.
A second important understanding is that farmers do not have room for a 100% free decision
concerning all their inputs. The reason is that not all inputs suit all income generating activities. For
example the use of the factor land is relatively inflexible, especially when they cultivate tree crops. Of
course, they can decide to let their land lie fallow, but in this way they receive no benefits from this
resource at all. Therefore the insight that not all “not all outputs necessarily compete for all
resources” (Ellis, 1993):33) is important for this thesis.
3.5 Consequences of Investment The theoretical framework suits the question which activities the farmers decide to perform and how
much time they want to spend on it. What it does not include is the question whether farmers are
willing to invest in starting up new activities. This subchapter focuses on this topic and is based on
the theory as used by Ruth Vargas Hill who has studied the investment and abandonment decision of
Ugandan coffee farmers. Her study is distinctive from other studies on investing in tree crops
because the models allows for uncertainty and irreversibility (Hill, 2010):1067).
The rationale of the article is introduced now. “The article applies models of irreversible investment
under uncertainty to understand the investment and abandonment behaviour of poor rural
households. It considers a household’s decision to invest in or abandon a relatively profitable
production activity in which it is already engaged” (Hill, 2010):1065). The article is based on the idea
that “the decision to invest in or out of a production activity has long-term implications for a
household’s income and consumption fortunes” (Hill, 2010):1065). The Hill article focuses on coffee-
farming households in Uganda, which has shown much overlap with hazelnut production in the
research area. Hill describes that coffee plants also yield little until their third year and thereafter
stay productive for thirty to forty years, making it an investment decision. Also, the crop is relatively
profitable, but investing in the crop is risky. The reasons for the riskiness are different between the
two crops; for coffee Hill stresses the price volatility and the tree’s susceptibility to disease. As the
world market price of hazelnuts is much linked to the Turkish production, this factor provides less
risk to the Turkish farmers than the coffee producers in Uganda. Also, where prices in the hazelnut
market show yearly fluctuations, the price changes in the coffee sector seem to be over a longer
period as the next paragraph shows. Diseases also bring risks to the hazelnut farmers, next to the
weather conditions (which are of most influence).
Option to delay
An interesting aspect of the article is the introduction of the ‘incentive to delay’. According to Hill,
the option value to waiting “is present whenever there is any degree of irreversibility” (Hill, 2010)
:1067). As Abel and Eberly (1994) have noticed, the case of coffee (and hazelnut) investment can be
better described as “one of costly reversibility rather than strict irreversibility” (Hill, 2010):1067).
Both investment and abandonment carry an option value. In case of abandonment; after trees are
abandoned, the option to (dis)invest later is lost. “The tree has no value when it is removed (there is
no second hand market for coffee trees) and there is no way to recoup the opportunity cost of land
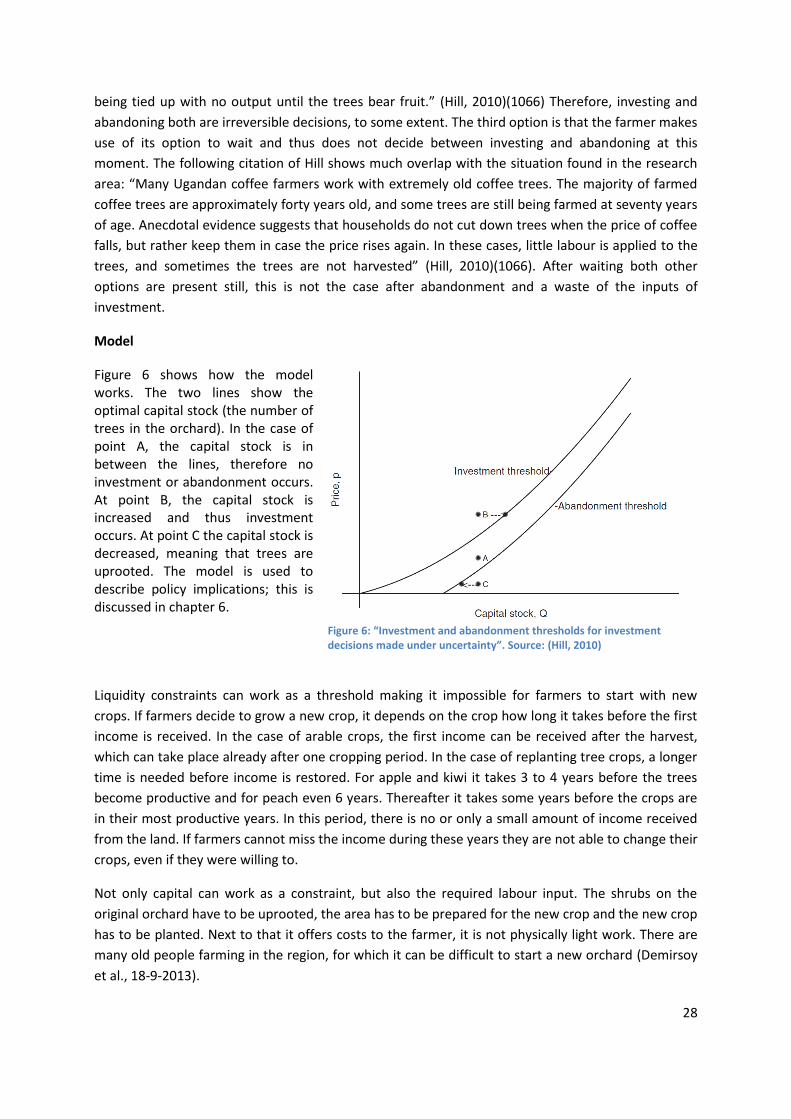
28
being tied up with no output until the trees bear fruit.” (Hill, 2010)(1066) Therefore, investing and
abandoning both are irreversible decisions, to some extent. The third option is that the farmer makes
use of its option to wait and thus does not decide between investing and abandoning at this
moment. The following citation of Hill shows much overlap with the situation found in the research
area: “Many Ugandan coffee farmers work with extremely old coffee trees. The majority of farmed
coffee trees are approximately forty years old, and some trees are still being farmed at seventy years
of age. Anecdotal evidence suggests that households do not cut down trees when the price of coffee
falls, but rather keep them in case the price rises again. In these cases, little labour is applied to the
trees, and sometimes the trees are not harvested” (Hill, 2010)(1066). After waiting both other
options are present still, this is not the case after abandonment and a waste of the inputs of
investment.
Model
Figure 6 shows how the model works. The two lines show the optimal capital stock (the number of trees in the orchard). In the case of point A, the capital stock is in between the lines, therefore no investment or abandonment occurs. At point B, the capital stock is increased and thus investment occurs. At point C the capital stock is decreased, meaning that trees are uprooted. The model is used to describe policy implications; this is discussed in chapter 6.
Figure 6: “Investment and abandonment thresholds for investment decisions made under uncertainty”. Source: (Hill, 2010)
Liquidity constraints can work as a threshold making it impossible for farmers to start with new
crops. If farmers decide to grow a new crop, it depends on the crop how long it takes before the first
income is received. In the case of arable crops, the first income can be received after the harvest,
which can take place already after one cropping period. In the case of replanting tree crops, a longer
time is needed before income is restored. For apple and kiwi it takes 3 to 4 years before the trees
become productive and for peach even 6 years. Thereafter it takes some years before the crops are
in their most productive years. In this period, there is no or only a small amount of income received
from the land. If farmers cannot miss the income during these years they are not able to change their
crops, even if they were willing to.
Not only capital can work as a constraint, but also the required labour input. The shrubs on the
original orchard have to be uprooted, the area has to be prepared for the new crop and the new crop
has to be planted. Next to that it offers costs to the farmer, it is not physically light work. There are
many old people farming in the region, for which it can be difficult to start a new orchard (Demirsoy
et al., 18-9-2013).
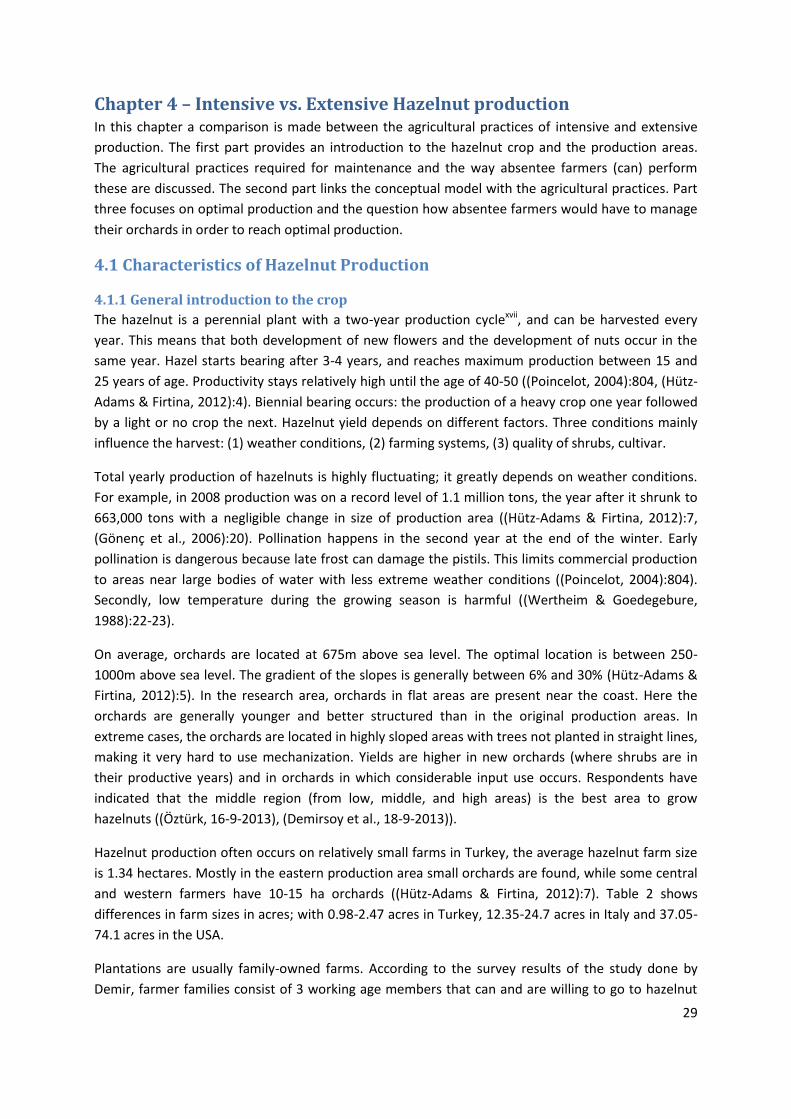
29
Chapter 4 – Intensive vs. Extensive Hazelnut production In this chapter a comparison is made between the agricultural practices of intensive and extensive
production. The first part provides an introduction to the hazelnut crop and the production areas.
The agricultural practices required for maintenance and the way absentee farmers (can) perform
these are discussed. The second part links the conceptual model with the agricultural practices. Part
three focuses on optimal production and the question how absentee farmers would have to manage
their orchards in order to reach optimal production.
4.1 Characteristics of Hazelnut Production
4.1.1 General introduction to the crop
The hazelnut is a perennial plant with a two-year production cyclexvii, and can be harvested every
year. This means that both development of new flowers and the development of nuts occur in the
same year. Hazel starts bearing after 3-4 years, and reaches maximum production between 15 and
25 years of age. Productivity stays relatively high until the age of 40-50 ((Poincelot, 2004):804, (Hütz-
Adams & Firtina, 2012):4). Biennial bearing occurs: the production of a heavy crop one year followed
by a light or no crop the next. Hazelnut yield depends on different factors. Three conditions mainly
influence the harvest: (1) weather conditions, (2) farming systems, (3) quality of shrubs, cultivar.
Total yearly production of hazelnuts is highly fluctuating; it greatly depends on weather conditions.
For example, in 2008 production was on a record level of 1.1 million tons, the year after it shrunk to
663,000 tons with a negligible change in size of production area ((Hütz-Adams & Firtina, 2012):7,
(Gönenç et al., 2006):20). Pollination happens in the second year at the end of the winter. Early
pollination is dangerous because late frost can damage the pistils. This limits commercial production
to areas near large bodies of water with less extreme weather conditions ((Poincelot, 2004):804).
Secondly, low temperature during the growing season is harmful ((Wertheim & Goedegebure,
1988):22-23).
On average, orchards are located at 675m above sea level. The optimal location is between 250-
1000m above sea level. The gradient of the slopes is generally between 6% and 30% (Hütz-Adams &
Firtina, 2012):5). In the research area, orchards in flat areas are present near the coast. Here the
orchards are generally younger and better structured than in the original production areas. In
extreme cases, the orchards are located in highly sloped areas with trees not planted in straight lines,
making it very hard to use mechanization. Yields are higher in new orchards (where shrubs are in
their productive years) and in orchards in which considerable input use occurs. Respondents have
indicated that the middle region (from low, middle, and high areas) is the best area to grow
hazelnuts ((Öztürk, 16-9-2013), (Demirsoy et al., 18-9-2013)).
Hazelnut production often occurs on relatively small farms in Turkey, the average hazelnut farm size
is 1.34 hectares. Mostly in the eastern production area small orchards are found, while some central
and western farmers have 10-15 ha orchards ((Hütz-Adams & Firtina, 2012):7). Table 2 shows
differences in farm sizes in acres; with 0.98-2.47 acres in Turkey, 12.35-24.7 acres in Italy and 37.05-
74.1 acres in the USA.
Plantations are usually family-owned farms. According to the survey results of the study done by
Demir, farmer families consist of 3 working age members that can and are willing to go to hazelnut
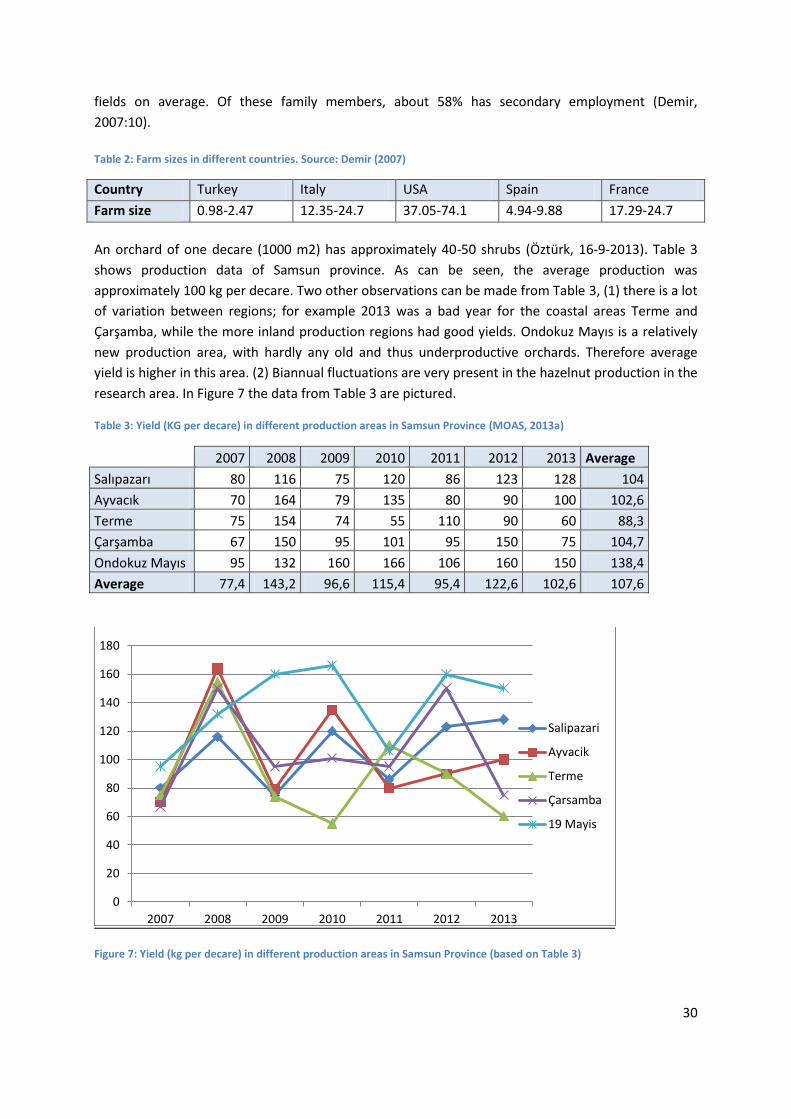
30
fields on average. Of these family members, about 58% has secondary employment (Demir,
2007:10).
Table 2: Farm sizes in different countries. Source: Demir (2007)
Country Turkey Italy USA Spain France
Farm size 0.98-2.47 12.35-24.7 37.05-74.1 4.94-9.88 17.29-24.7
An orchard of one decare (1000 m2) has approximately 40-50 shrubs (Öztürk, 16-9-2013). Table 3
shows production data of Samsun province. As can be seen, the average production was
approximately 100 kg per decare. Two other observations can be made from Table 3, (1) there is a lot
of variation between regions; for example 2013 was a bad year for the coastal areas Terme and
Çarşamba, while the more inland production regions had good yields. Ondokuz Mayıs is a relatively
new production area, with hardly any old and thus underproductive orchards. Therefore average
yield is higher in this area. (2) Biannual fluctuations are very present in the hazelnut production in the
research area. In Figure 7 the data from Table 3 are pictured.
Table 3: Yield (KG per decare) in different production areas in Samsun Province (MOAS, 2013a)
2007 2008 2009 2010 2011 2012 2013 Average
Salıpazarı 80 116 75 120 86 123 128 104
Ayvacık 70 164 79 135 80 90 100 102,6
Terme 75 154 74 55 110 90 60 88,3
Çarşamba 67 150 95 101 95 150 75 104,7
Ondokuz Mayıs 95 132 160 166 106 160 150 138,4
Average 77,4 143,2 96,6 115,4 95,4 122,6 102,6 107,6
Figure 7: Yield (kg per decare) in different production areas in Samsun Province (based on Table 3)
0
20
40
60
80
100
120
140
160
180
2007 2008 2009 2010 2011 2012 2013
Salipazari
Ayvacik
Terme
Çarsamba
19 Mayis
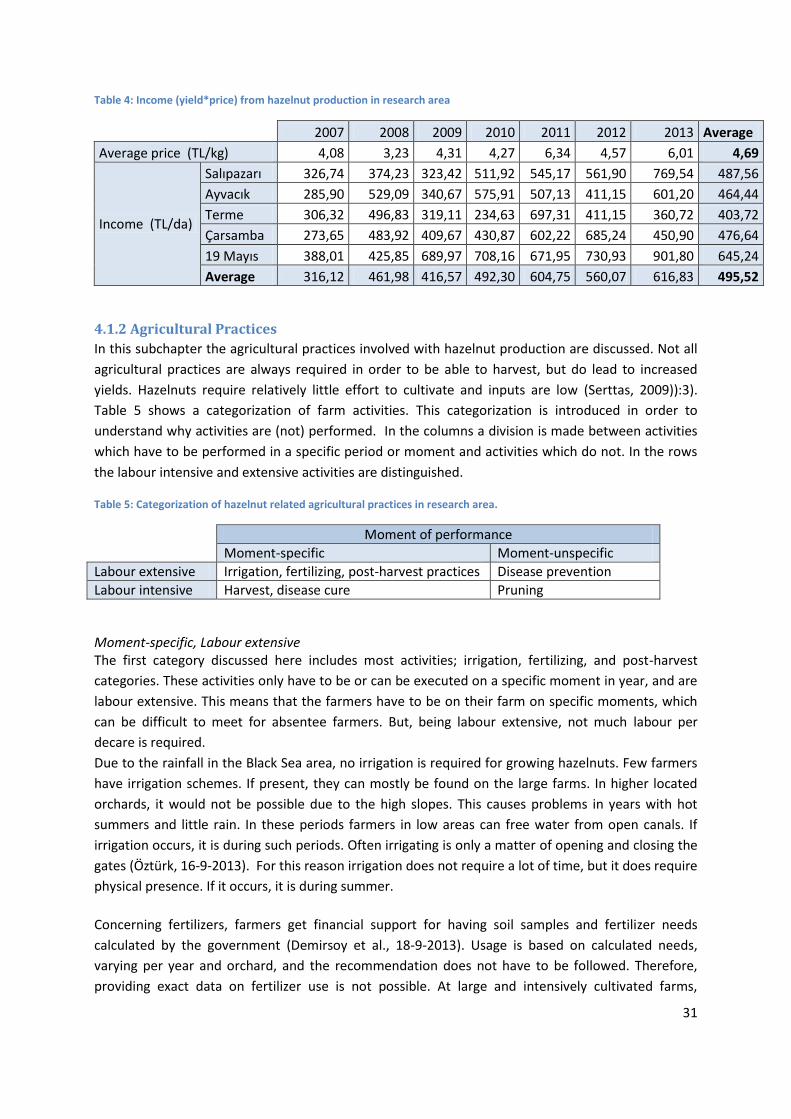
31
Table 4: Income (yield*price) from hazelnut production in research area
2007 2008 2009 2010 2011 2012 2013 Average
Average price (TL/kg) 4,08 3,23 4,31 4,27 6,34 4,57 6,01 4,69
Income (TL/da)
Salıpazarı 326,74 374,23 323,42 511,92 545,17 561,90 769,54 487,56
Ayvacık 285,90 529,09 340,67 575,91 507,13 411,15 601,20 464,44
Terme 306,32 496,83 319,11 234,63 697,31 411,15 360,72 403,72
Çarsamba 273,65 483,92 409,67 430,87 602,22 685,24 450,90 476,64
19 Mayıs 388,01 425,85 689,97 708,16 671,95 730,93 901,80 645,24
Average 316,12 461,98 416,57 492,30 604,75 560,07 616,83 495,52
4.1.2 Agricultural Practices
In this subchapter the agricultural practices involved with hazelnut production are discussed. Not all
agricultural practices are always required in order to be able to harvest, but do lead to increased
yields. Hazelnuts require relatively little effort to cultivate and inputs are low (Serttas, 2009)):3).
Table 5 shows a categorization of farm activities. This categorization is introduced in order to
understand why activities are (not) performed. In the columns a division is made between activities
which have to be performed in a specific period or moment and activities which do not. In the rows
the labour intensive and extensive activities are distinguished.
Table 5: Categorization of hazelnut related agricultural practices in research area.
Moment of performance
Moment-specific Moment-unspecific
Labour extensive Irrigation, fertilizing, post-harvest practices Disease prevention
Labour intensive Harvest, disease cure Pruning
Moment-specific, Labour extensive The first category discussed here includes most activities; irrigation, fertilizing, and post-harvest
categories. These activities only have to be or can be executed on a specific moment in year, and are
labour extensive. This means that the farmers have to be on their farm on specific moments, which
can be difficult to meet for absentee farmers. But, being labour extensive, not much labour per
decare is required.
Due to the rainfall in the Black Sea area, no irrigation is required for growing hazelnuts. Few farmers
have irrigation schemes. If present, they can mostly be found on the large farms. In higher located
orchards, it would not be possible due to the high slopes. This causes problems in years with hot
summers and little rain. In these periods farmers in low areas can free water from open canals. If
irrigation occurs, it is during such periods. Often irrigating is only a matter of opening and closing the
gates (Öztürk, 16-9-2013). For this reason irrigation does not require a lot of time, but it does require
physical presence. If it occurs, it is during summer.
Concerning fertilizers, farmers get financial support for having soil samples and fertilizer needs
calculated by the government (Demirsoy et al., 18-9-2013). Usage is based on calculated needs,
varying per year and orchard, and the recommendation does not have to be followed. Therefore,
providing exact data on fertilizer use is not possible. At large and intensively cultivated farms,
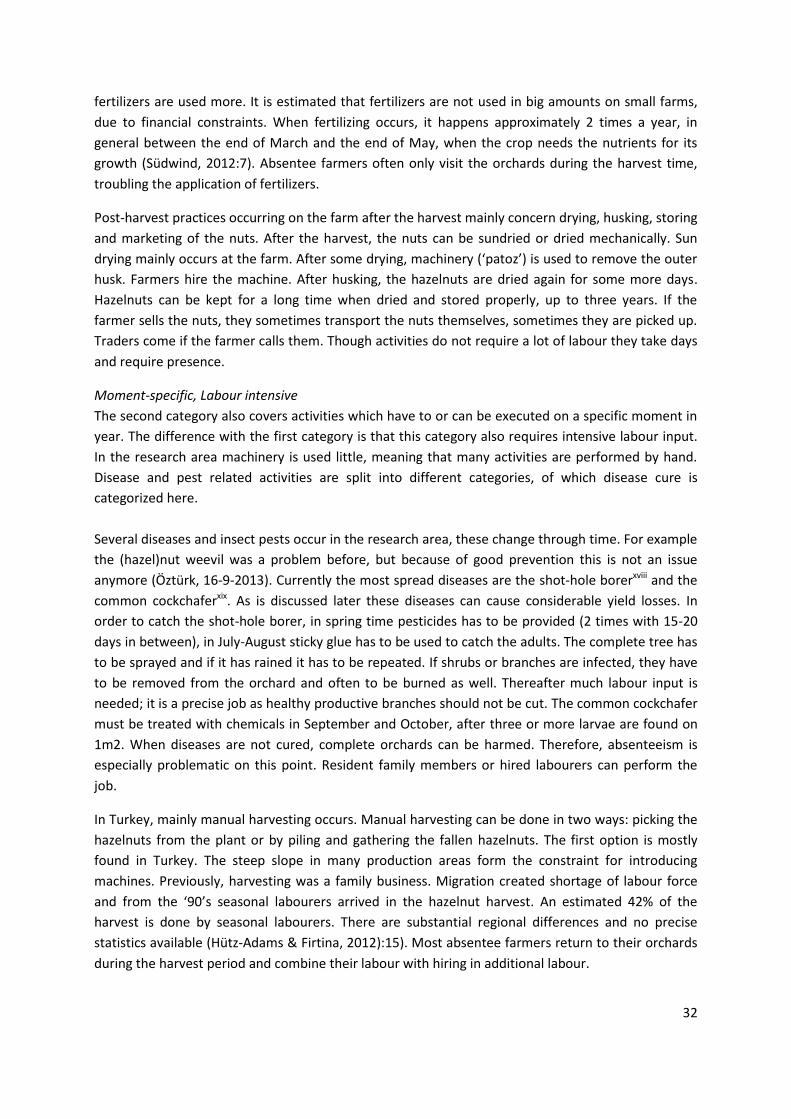
32
fertilizers are used more. It is estimated that fertilizers are not used in big amounts on small farms,
due to financial constraints. When fertilizing occurs, it happens approximately 2 times a year, in
general between the end of March and the end of May, when the crop needs the nutrients for its
growth (Südwind, 2012:7). Absentee farmers often only visit the orchards during the harvest time,
troubling the application of fertilizers.
Post-harvest practices occurring on the farm after the harvest mainly concern drying, husking, storing
and marketing of the nuts. After the harvest, the nuts can be sundried or dried mechanically. Sun
drying mainly occurs at the farm. After some drying, machinery (‘patoz’) is used to remove the outer
husk. Farmers hire the machine. After husking, the hazelnuts are dried again for some more days.
Hazelnuts can be kept for a long time when dried and stored properly, up to three years. If the
farmer sells the nuts, they sometimes transport the nuts themselves, sometimes they are picked up.
Traders come if the farmer calls them. Though activities do not require a lot of labour they take days
and require presence.
Moment-specific, Labour intensive
The second category also covers activities which have to or can be executed on a specific moment in
year. The difference with the first category is that this category also requires intensive labour input.
In the research area machinery is used little, meaning that many activities are performed by hand.
Disease and pest related activities are split into different categories, of which disease cure is
categorized here.
Several diseases and insect pests occur in the research area, these change through time. For example
the (hazel)nut weevil was a problem before, but because of good prevention this is not an issue
anymore (Öztürk, 16-9-2013). Currently the most spread diseases are the shot-hole borerxviii and the
common cockchaferxix. As is discussed later these diseases can cause considerable yield losses. In
order to catch the shot-hole borer, in spring time pesticides has to be provided (2 times with 15-20
days in between), in July-August sticky glue has to be used to catch the adults. The complete tree has
to be sprayed and if it has rained it has to be repeated. If shrubs or branches are infected, they have
to be removed from the orchard and often to be burned as well. Thereafter much labour input is
needed; it is a precise job as healthy productive branches should not be cut. The common cockchafer
must be treated with chemicals in September and October, after three or more larvae are found on
1m2. When diseases are not cured, complete orchards can be harmed. Therefore, absenteeism is
especially problematic on this point. Resident family members or hired labourers can perform the
job.
In Turkey, mainly manual harvesting occurs. Manual harvesting can be done in two ways: picking the
hazelnuts from the plant or by piling and gathering the fallen hazelnuts. The first option is mostly
found in Turkey. The steep slope in many production areas form the constraint for introducing
machines. Previously, harvesting was a family business. Migration created shortage of labour force
and from the ‘90’s seasonal labourers arrived in the hazelnut harvest. An estimated 42% of the
harvest is done by seasonal labourers. There are substantial regional differences and no precise
statistics available (Hütz-Adams & Firtina, 2012):15). Most absentee farmers return to their orchards
during the harvest period and combine their labour with hiring in additional labour.
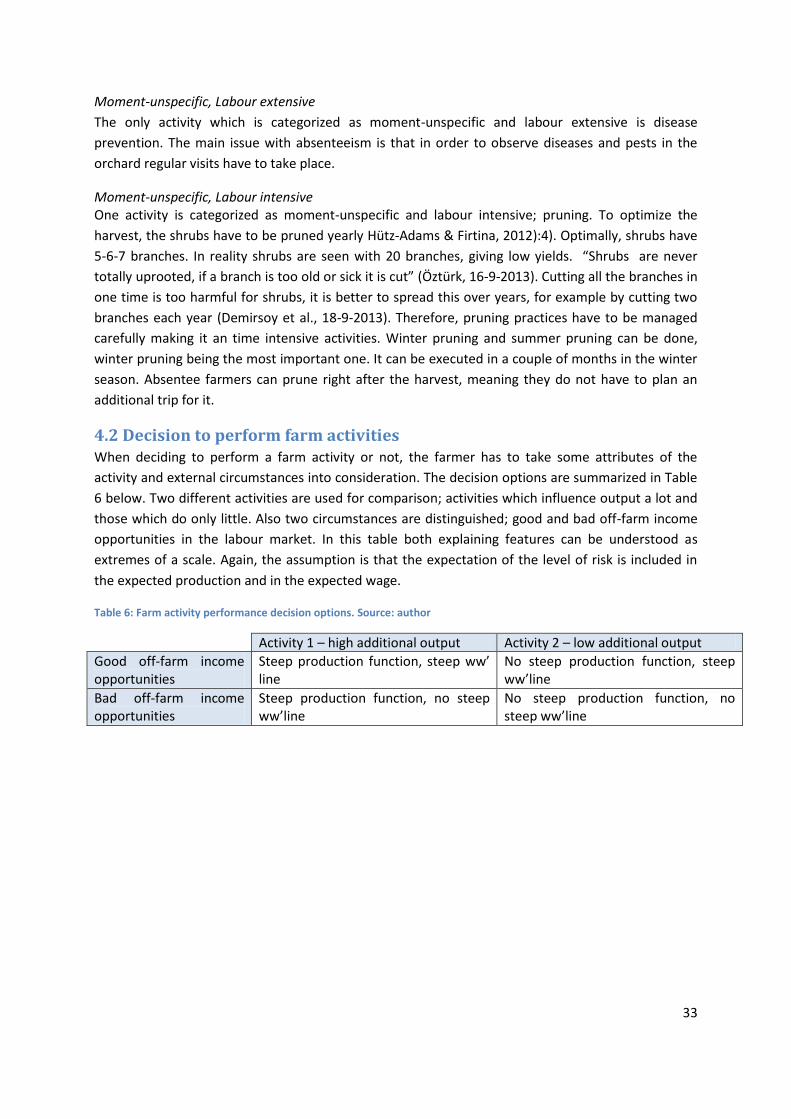
33
Moment-unspecific, Labour extensive
The only activity which is categorized as moment-unspecific and labour extensive is disease
prevention. The main issue with absenteeism is that in order to observe diseases and pests in the
orchard regular visits have to take place.
Moment-unspecific, Labour intensive One activity is categorized as moment-unspecific and labour intensive; pruning. To optimize the
harvest, the shrubs have to be pruned yearly Hütz-Adams & Firtina, 2012):4). Optimally, shrubs have
5-6-7 branches. In reality shrubs are seen with 20 branches, giving low yields. “Shrubs are never
totally uprooted, if a branch is too old or sick it is cut” (Öztürk, 16-9-2013). Cutting all the branches in
one time is too harmful for shrubs, it is better to spread this over years, for example by cutting two
branches each year (Demirsoy et al., 18-9-2013). Therefore, pruning practices have to be managed
carefully making it an time intensive activities. Winter pruning and summer pruning can be done,
winter pruning being the most important one. It can be executed in a couple of months in the winter
season. Absentee farmers can prune right after the harvest, meaning they do not have to plan an
additional trip for it.
4.2 Decision to perform farm activities When deciding to perform a farm activity or not, the farmer has to take some attributes of the
activity and external circumstances into consideration. The decision options are summarized in Table
6 below. Two different activities are used for comparison; activities which influence output a lot and
those which do only little. Also two circumstances are distinguished; good and bad off-farm income
opportunities in the labour market. In this table both explaining features can be understood as
extremes of a scale. Again, the assumption is that the expectation of the level of risk is included in
the expected production and in the expected wage.
Table 6: Farm activity performance decision options. Source: author
Activity 1 – high additional output Activity 2 – low additional output
Good off-farm income opportunities
Steep production function, steep ww’ line
No steep production function, steep ww’line
Bad off-farm income opportunities
Steep production function, no steep ww’line
No steep production function, no steep ww’line
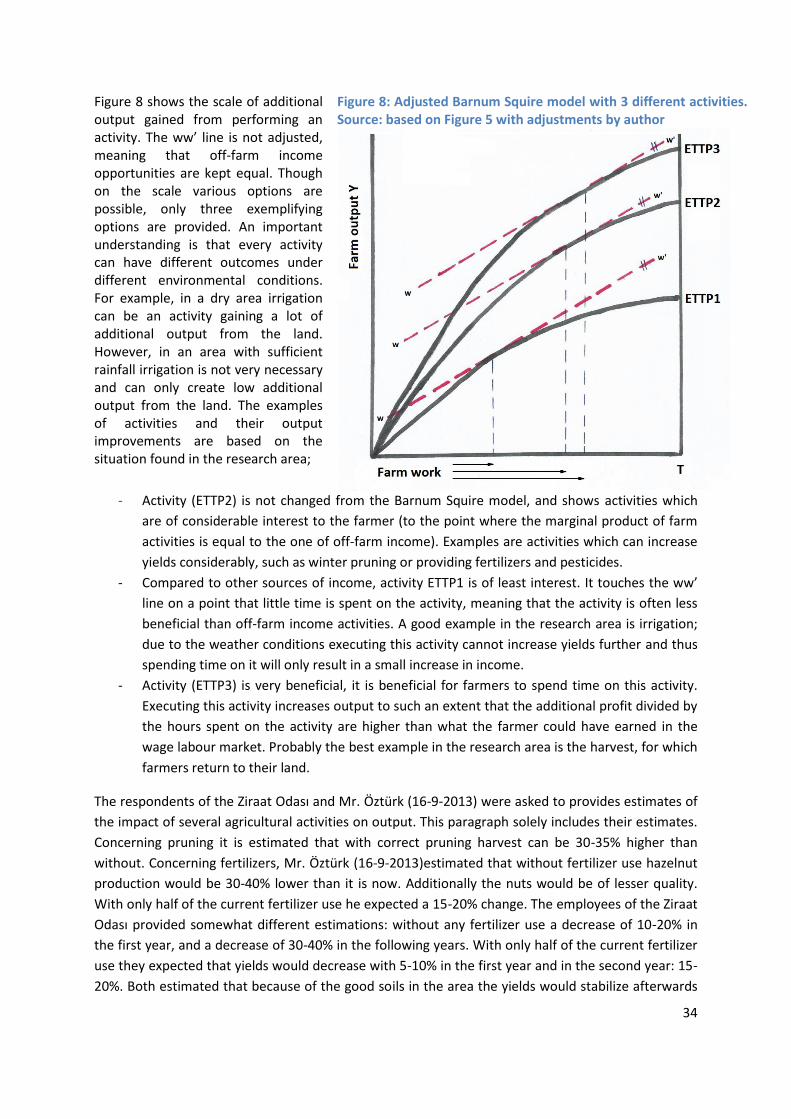
34
Figure 8 shows the scale of additional output gained from performing an activity. The ww’ line is not adjusted, meaning that off-farm income opportunities are kept equal. Though on the scale various options are possible, only three exemplifying options are provided. An important understanding is that every activity can have different outcomes under different environmental conditions. For example, in a dry area irrigation can be an activity gaining a lot of additional output from the land. However, in an area with sufficient rainfall irrigation is not very necessary and can only create low additional output from the land. The examples of activities and their output improvements are based on the situation found in the research area;
Figure 8: Adjusted Barnum Squire model with 3 different activities. Source: based on Figure 5 with adjustments by author
- Activity (ETTP2) is not changed from the Barnum Squire model, and shows activities which
are of considerable interest to the farmer (to the point where the marginal product of farm
activities is equal to the one of off-farm income). Examples are activities which can increase
yields considerably, such as winter pruning or providing fertilizers and pesticides.
- Compared to other sources of income, activity ETTP1 is of least interest. It touches the ww’
line on a point that little time is spent on the activity, meaning that the activity is often less
beneficial than off-farm income activities. A good example in the research area is irrigation;
due to the weather conditions executing this activity cannot increase yields further and thus
spending time on it will only result in a small increase in income.
- Activity (ETTP3) is very beneficial, it is beneficial for farmers to spend time on this activity.
Executing this activity increases output to such an extent that the additional profit divided by
the hours spent on the activity are higher than what the farmer could have earned in the
wage labour market. Probably the best example in the research area is the harvest, for which
farmers return to their land.
The respondents of the Ziraat Odası and Mr. Öztürk (16-9-2013) were asked to provides estimates of
the impact of several agricultural activities on output. This paragraph solely includes their estimates.
Concerning pruning it is estimated that with correct pruning harvest can be 30-35% higher than
without. Concerning fertilizers, Mr. Öztürk (16-9-2013)estimated that without fertilizer use hazelnut
production would be 30-40% lower than it is now. Additionally the nuts would be of lesser quality.
With only half of the current fertilizer use he expected a 15-20% change. The employees of the Ziraat
Odası provided somewhat different estimations: without any fertilizer use a decrease of 10-20% in
the first year, and a decrease of 30-40% in the following years. With only half of the current fertilizer
use they expected that yields would decrease with 5-10% in the first year and in the second year: 15-
20%. Both estimated that because of the good soils in the area the yields would stabilize afterwards
35
again. Estimates of the impact of diseases & pests related activities (on shot-hole borer and common
cockchafer) are as follows. Yield losses were estimated to be 20-30% after infection, because shrubs
have to be removed. Without prevention and on-time cure, the shot-hole borer has the most
impact; losses can reach to 30-50% of harvest. With on-time cure, common cockchafer -related
losses are between 5%-10%. The common cockchafer is most problematic with cure, as it comes back
year after year. As considerable output increases are established these activities would probably be
classified as ETTP2 or ETTP3 activities by the farmers, depending on their wage lines.
Concluding, this model explains which activities are performed by the farmer and are which not.
Farmers do not only decide whether to spend time on an activity, but also how much time and when
they do this. This is discussed now.
When is the moment that it is not interesting anymore for a farmer to prune (for example), and how
is this determined? The time spend on the activity can be understood from Figure 8. This paragraph
explains how it is established. In the presence of good labour opportunities the labour spend on an
activity is where the marginal physical product (MPP, or the slope of the ETPP line) is equal to the
ww’ line. If there are no other activitiesxx, the farmers are expected to make a different decision;
namely to spend inputs (here: labour) on the activity until the point where the MPP=0. At this point
the highest possible output is reached (other inputs kept equal), and after this point additional inputs
even decreases output. This is the case because the Barnum Squire model assumes fixed land
market. The picture is only drawn until the point that MVP=0, because spending more time on the
activity is irrational. Two factors have to be understood additionally:
- The first factor is how easily activities can be combined with different activities. Some
activities compete because of comparable resource needs in the same period, while others
can be combined very well. Therefore activities cannot be allocated in the groups (ETPP1,
ETPP2, ETPP3) solely based on the observation whether they are performed or not. For
example, the harvest is a questionable activity; would absentee farmers also return to their
orchards for the harvest is it would not overlap with the school holidays of their children?
The activities can be compared by their financial outcomes, and these outcomes can thus
answer this question.
- Differences between peak / low seasons are included in the analysis in paragraph 4.1.2.
(moment specificity), but not included in model because the model shows how much time is
spent on an activity, not when this is done. Though it might be expected, the occurrence of a
peak season is not related to the profitability of an activity. It only has influence on the
planning of the farm activities, not on the question whether the activity is performed or not.
Activities with a peak season cannot be planned flexibly, while activities without peak season
can be planned flexibly. Seasonality is thus not included here by using different models for
different periods in the year, as only single activities are discussed.
If some activities cannot be combined because of a limiting resource this decreases the farmers’
income possibilities. But, as is included in the conceptual framework, output can be created with
different combinations of inputs. This idea is worked out further in the next subchapter.
36
4.3 Optimal production outcomes In this third part of the chapter the production practices and levels are compared between the
average producers in Samsun area and a farmer group which is reaching very high yields by applying
an intensive production system. This is done in order to understand what it would take absentee
farmers to reach high production levels. This understanding can be used in Chapter 6, where
agricultural policy measures are related to absentee farmers. The underlying assumption is that
absentee farmers produce less or equally intensively as other farmers in the research area.
4.3.1 Practices creating high output
In this section farm management of a producer groupxxi reaching very high yields are discussed. If not
stated differently, all information is received in an interview with Mr. Şahin (7-10-2013) who is the
president of the producer group. The group was established in 2006, since then the group has grown
year by year. Currently, 110 farmers are part of the group, together producing hazelnuts on 3500
decares (=350 hectares). The total numbers of farmers in the area is 6300+ farmers. Weather
conditions are comparable with the research area, soils conditions are even argued to be better in
the Samsun production area. Therefore it is assumed that the yields reached by this group would also
be possible in the research area.
In this production region –Giresun- Keşap - yields were on average 80 kg per decare between 2005-
2013. In the first year some farmers had yields of 50 kg per decare. The current average lies around
200 kg per decare (with shell), but in this case the meaning of averages is ambiguous. Not all farmers
joined the group at the same moment, therefore all farmers are in different phases. Because of this,
some farmers have higher yields than others. Therefore the group looks at production outcomes
linked to the number of years farmers have adopted the principles. It takes at least 3 years to
improve the soil, trees, after these years production is estimated at 100 kg per decare. Thereafter it
takes another three years before the current production levels are reached. Approximately thirty
farmers have been member from the start, they now reach production averages of 300 kg per
decare. Also in this area weather conditions are of considerable influence on output levels, they are
estimated to influence yields with (+ or -) 20%. Again, providing estimations is difficult in this
situation because of the rising yields.
At start the production costs were 5 TL per kg, currently the production costs fluctuate around 3 TL
per kg. Approximately 80% is labour costs, for example to hired labour for fertilizing, pruning and the
harvest. The prices the group receives are approximately 10% higher than the market price of that
time. If 6TL in the sector, they get 6,60 TL.
The main thing the group members changed was the time spent in the orchard. These farmers spend
much more time in the orchards, while other farmers do not. Per year, the group members minimally
work hundred days in an orchard of ten decares. Some rough estimates are collected on the
influence of different activities on yield improvements. This varies between orchards based on the
conditions of the orchard, the climatic circumstances and the quality in which the activity is
performed. The percentages should be understood as follows: if farmers do the activities correctly,
the activities influence output like this. By far the highest percentage is from pruning: 60%.
Thereafter come soil improving activities and disease prevention and cure with 10-20%. The last
activities of influences are sprout control (3-5%), weed management (3-5%) and the post-harvest
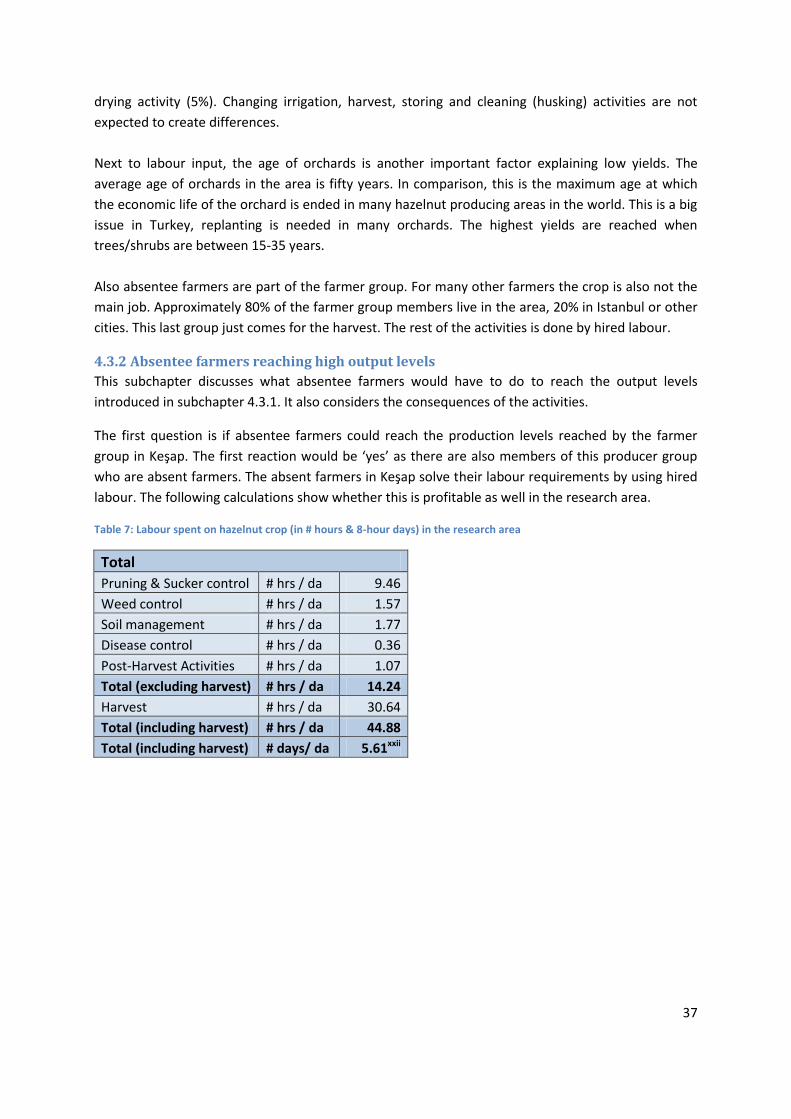
37
drying activity (5%). Changing irrigation, harvest, storing and cleaning (husking) activities are not
expected to create differences.
Next to labour input, the age of orchards is another important factor explaining low yields. The
average age of orchards in the area is fifty years. In comparison, this is the maximum age at which
the economic life of the orchard is ended in many hazelnut producing areas in the world. This is a big
issue in Turkey, replanting is needed in many orchards. The highest yields are reached when
trees/shrubs are between 15-35 years.
Also absentee farmers are part of the farmer group. For many other farmers the crop is also not the
main job. Approximately 80% of the farmer group members live in the area, 20% in Istanbul or other
cities. This last group just comes for the harvest. The rest of the activities is done by hired labour.
4.3.2 Absentee farmers reaching high output levels
This subchapter discusses what absentee farmers would have to do to reach the output levels
introduced in subchapter 4.3.1. It also considers the consequences of the activities.
The first question is if absentee farmers could reach the production levels reached by the farmer
group in Keşap. The first reaction would be ‘yes’ as there are also members of this producer group
who are absent farmers. The absent farmers in Keşap solve their labour requirements by using hired
labour. The following calculations show whether this is profitable as well in the research area.
Table 7: Labour spent on hazelnut crop (in # hours & 8-hour days) in the research area
Total
Pruning & Sucker control # hrs / da 9.46
Weed control # hrs / da 1.57
Soil management # hrs / da 1.77
Disease control # hrs / da 0.36
Post-Harvest Activities # hrs / da 1.07
Total (excluding harvest) # hrs / da 14.24
Harvest # hrs / da 30.64
Total (including harvest) # hrs / da 44.88
Total (including harvest) # days/ da 5.61xxii
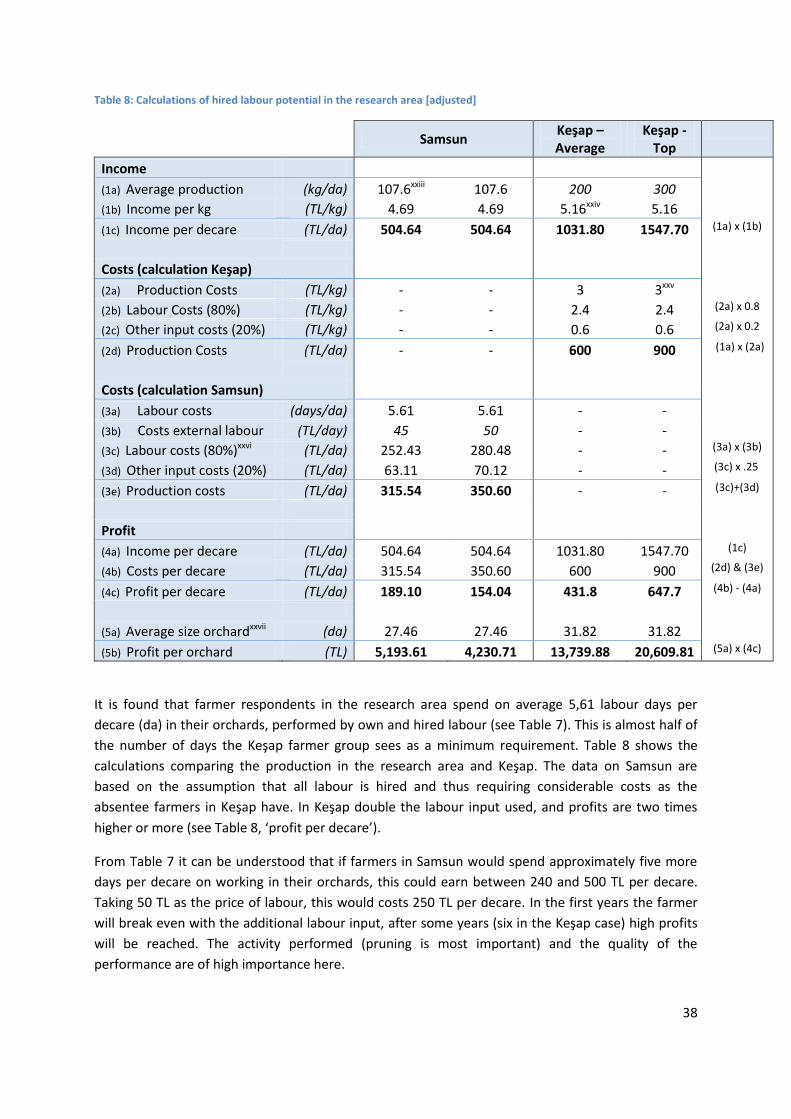
38
Table 8: Calculations of hired labour potential in the research area [adjusted]
Samsun
Keşap – Average
Keşap - Top
Income
(1a) Average production (kg/da) 107.6xxiii 107.6 200 300
(1b) Income per kg (TL/kg) 4.69 4.69 5.16xxiv 5.16
(1c) Income per decare (TL/da) 504.64 504.64 1031.80 1547.70 (1a) x (1b)
Costs (calculation Keşap)
(2a) Production Costs (TL/kg) - - 3 3xxv
(2b) Labour Costs (80%) (TL/kg) - - 2.4 2.4 (2a) x 0.8
(2c) Other input costs (20%) (TL/kg) - - 0.6 0.6 (2a) x 0.2
(2d) Production Costs (TL/da) - - 600 900 (1a) x (2a)
Costs (calculation Samsun)
(3a) Labour costs (days/da) 5.61 5.61 - -
(3b) Costs external labour (TL/day) 45 50 - -
(3c) Labour costs (80%)xxvi (TL/da) 252.43 280.48 - - (3a) x (3b)
(3d) Other input costs (20%) (TL/da) 63.11 70.12 - - (3c) x .25
(3e) Production costs (TL/da) 315.54 350.60 - - (3c)+(3d)
Profit
(4a) Income per decare (TL/da) 504.64 504.64 1031.80 1547.70 (1c)
(4b) Costs per decare (TL/da) 315.54 350.60 600 900 (2d) & (3e)
(4c) Profit per decare (TL/da) 189.10 154.04 431.8 647.7 (4b) - (4a)
(5a) Average size orchardxxvii (da) 27.46 27.46 31.82 31.82
(5b) Profit per orchard (TL) 5,193.61 4,230.71 13,739.88 20,609.81 (5a) x (4c)
It is found that farmer respondents in the research area spend on average 5,61 labour days per
decare (da) in their orchards, performed by own and hired labour (see Table 7). This is almost half of
the number of days the Keşap farmer group sees as a minimum requirement. Table 8 shows the
calculations comparing the production in the research area and Keşap. The data on Samsun are
based on the assumption that all labour is hired and thus requiring considerable costs as the
absentee farmers in Keşap have. In Keşap double the labour input used, and profits are two times
higher or more (see Table 8, ‘profit per decare’).
From Table 7 it can be understood that if farmers in Samsun would spend approximately five more
days per decare on working in their orchards, this could earn between 240 and 500 TL per decare.
Taking 50 TL as the price of labour, this would costs 250 TL per decare. In the first years the farmer
will break even with the additional labour input, after some years (six in the Keşap case) high profits
will be reached. The activity performed (pruning is most important) and the quality of the
performance are of high importance here.
39
This raises the question why the (absentee) farmers in the research area do not follow the
agricultural practices which are performed by the farmers of the Keşap farmer group. Potential
answers are raised in literature.
The first potential reason is that absentee farmers have to hire labour in order to perform the
activities and that this brings some difficulties. As is case in various situations, wage labour in
agriculture is linked to incentive problems. While focusing on supervision of agricultural production
teams, Lin stresses the following aspect of agriculture in relation to monitoring: “Because of
agriculture’s sequential nature and spatial dimensions, monitoring labour effort in agricultural
production is extremely difficult and very costly” (Lin, 1988):S199). According to Alchian and Demsetz
(1972) the incentive to work is based on the ‘metering of effort’xxviii. This means that effort has to be
measured and (financially) valued as such. In their study on the ‘behavioural and material
determinants of production relations in agriculture’, Binswanger and Rosenzweig (1986)xxix provide
the additional understanding on motivation of labourers by explaining which factors influence
motivation to work and metering. The first point they put forward is that of asymmetric information,
which is linked to measuring the effort. Information about the quality of the work performed can be
costly to acquire for farmers who do not reside close to the farm. Secondly, different workers have
different motives for (not) providing information: “High quality workers will want employers to have
accurate information about worker quality, while inferior workers would prefer that employers not
have information about worker quality” (Binswanger & Rosenzweig, 1986):507).
Not only information plays a role, but also the incentive to work; assigned payment or apportion
aspect. “When information is costly and asymmetrically distributed, incentives problems arise. A
daily paid labourer has no incentive to work hard, unless supervised closely via direct observation of
his effort or via inspection of his output. Incentives to work may be improved by providing share
contracts or piece rates. Since the worker receives only a share of the full marginal product, he will
still not work as hard as an owner-cultivator unless effort can be monitored in some way, and/or he
can be penalised in terms of loss of future contracts” (Binswanger & Rosenzweig, 1986):507).
The activities not only have to be performed, their necessity also has to be observed. Most activities
have to be performed annually, such as the harvest and post-harvest activities. But, there are also
activities which only have to be performed when needed, such as the cure of diseases. As can be
seen in Table 7, this activity requires only little time. But, as physical presence is required performing
this activity is impossible to perform by absentee farmers. For absentee farmers it is impossible to do
this themselves, therefore it can best be performed by family (the benefit from output) or
neighbouring resident farmer (they benefit if area is free from diseases and pests).
Another potential reason next to the difficulties linked to finding labour to perform the activities is
the riskiness of investing in the land and risk aversion attitude of most people. Binswanger and
Rosenzweig have linked this with insurance, assuming that most individuals are willing to reduce
their exposure to risks (Binswanger & Rosenzweig, 1986):508). Their reasoning is that in the absence
of insurance, this can be done by making use of ‘insurance substitutes’. The insurance substitutes
come in various forms; they “may include the holding of reserves, diversification of prospects,
conservative or ‘excessive’ input levels, investment in ‘credit-worthiness’ and social ties” (Binswanger
40
& Rosenzweig, 1986):508). Following this line of reasoning, keeping the orchard in an
underproductive state could be explained as being an insurance substitute as it can be compared
with keeping conservative input levels. In a situation with a lot of variation of output, as is found in
the research area, keeping the inputs down means that at least losses are not large (while at the
same time income is not large as well). If it is found that absentee farmers have considerable means
(resources) to safeguard oneself against risks this reason is not relevant. This is assumed in this
thesis, but as it is not proven empirically this option is kept open here.
The last potential reason is (combined) experience. Experience and the presence of clustered
knowledge can explain why currently farmers in Keşap reach higher productivity levels than farmers
in Samsun. Clusters are discussed much in literature and for various actors in the market economy.
Bathelt, Malmberg, and Maskell (2004) explain that knowledge creation (among others) can best be
seen “as the result of interactive processes where actors possessing different types of knowledge and
competencies come together and exchange information with the aim to solve some –technical,
organizational, commercial or intellectual- problems” (Bathelt et al., 2004):32). This is found in
Keşap, where the farmers work together and with knowledge institutions. “Overall, the shared
knowledge basis enables cluster firms to continuously combine and re-combine similar and non-
similar resources to produce new knowledge and innovations. This stimulates economic
specialization within the cluster and results in the development of localized capabilities are available
to cluster firms” (Bathelt et al., 2004):37). This is observed in Keşap, where quality of the product is
improved and specialization had occurred as some of the farmers are now managing the group and
agricultural engineers are present.
Next to reaching the Keşap productivity levels by making use of hired labour, it could theoretically
also be possible to do this by making use of other inputs, as has been introduced with the factor-
factor relationship in the theoretical framework. This section does not put forward data-based
conclusions, but ideas which can shed new light on the agricultural policies discussed in chapter 6.
The first factor discussed is land. Increasing the land used by the absent farmer in order to make the
land more profitable seems like a strange line of reasoning. But, in the research area farmers often
only own small orchards. As has been shown, profits per decare can be strongly increased. But, if this
income is only a small portion of total income, is it worth spending the effort on different income
sources? This is not the case if there are fixed costs involved, such as travelling costs in the case of
income sources in different places such as is the case with absentee farmers. The income can thus be
more interesting if there is more income involved. As will be shown in the next chapter, increasing
the land or the output per decare can require a considerable investment, both time and capital-wise.
Orchards are old, and therefore increasing yields on the long term requires a big investment, for
example uprooting and starting anew. These constraints are discussed by Hill (2010):1074). She
stressed that in the presence of liquidity constraints, “there may be some heterogeneity in the
observed investment behaviour across households with different levels of wealth, because richer
households are more able to respond to positive price shocks and, similarly, to replace capital lost”
(Hill, 2010):1074). This is also observed by Saxena (1992): “The western U.P. farmers had a long
experience of growing cash crops like sugarcane and potato, which generated enough surplus, and
therefore they had more confidence in innovating with another cash crop, like eucalyptus”. In this
situation the absentee farmers could even invest more in their land than resident farmers, because
41
they make more use of off-farm incomes and thus have more (financial) space to invest. Then again
this raises the question why these farmers do not invest, and how the government could stimulate
them to do so. This is discussed in chapter 6.
The second input which farmers can vary with is the resource capital. Spending the capital on hiring
labour is not included here, as that falls under increasing the labour use. Capital can also be used to
increase the use as other inputs, such as fertilizers or pesticides. As was discussed in chapter 4.3.1,
the largest changes are reached with correct pruning. This can only be influenced by increasing the
capital levels to some extent; for example by buying good quality tools. As the hazelnut crop does
not require much irrigation and constructions, additional capital can increase yields but to a lesser
extent than labour.
This chapter is concluded with the idea that farmers grow hazelnuts because it is possible to do this
in an extensive manner. It could be possible that farmers who prefer to produce intensively prefer
other crops such as annual crops or fruit. These and other options farmers have are discussed in the
next chapter.
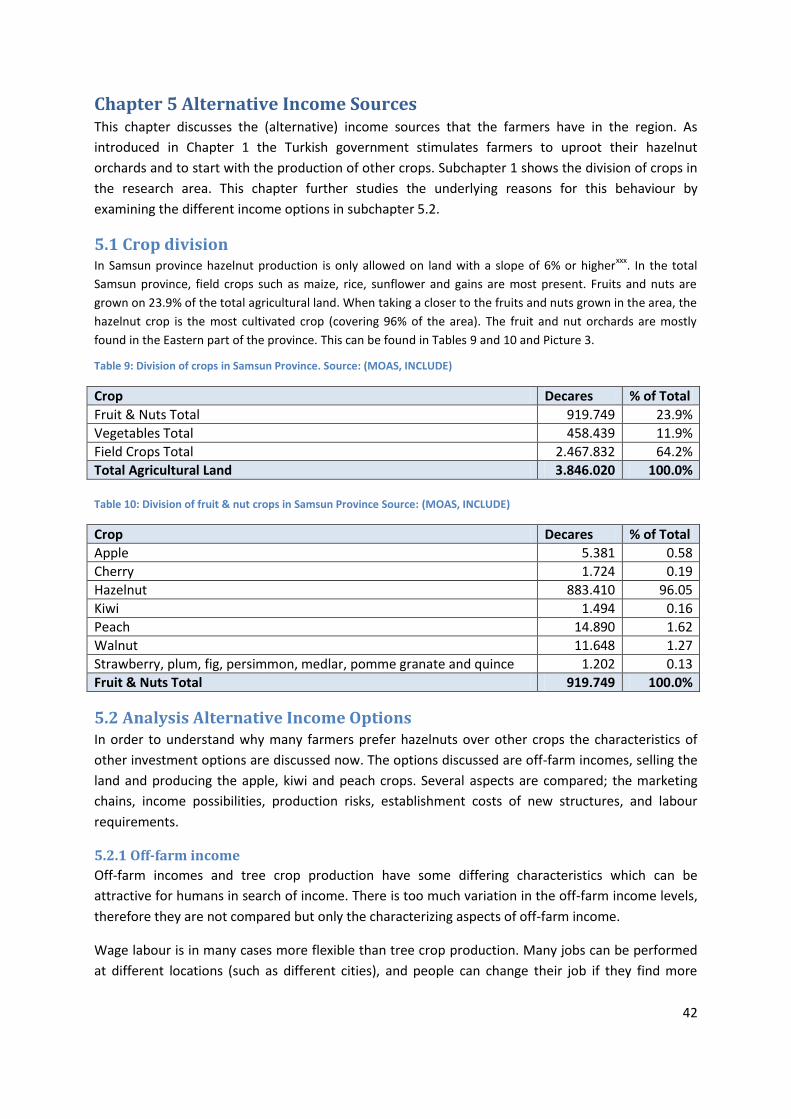
42
Chapter 5 Alternative Income Sources This chapter discusses the (alternative) income sources that the farmers have in the region. As
introduced in Chapter 1 the Turkish government stimulates farmers to uproot their hazelnut
orchards and to start with the production of other crops. Subchapter 1 shows the division of crops in
the research area. This chapter further studies the underlying reasons for this behaviour by
examining the different income options in subchapter 5.2.
5.1 Crop division In Samsun province hazelnut production is only allowed on land with a slope of 6% or higher
xxx. In the total
Samsun province, field crops such as maize, rice, sunflower and gains are most present. Fruits and nuts are
grown on 23.9% of the total agricultural land. When taking a closer to the fruits and nuts grown in the area, the
hazelnut crop is the most cultivated crop (covering 96% of the area). The fruit and nut orchards are mostly
found in the Eastern part of the province. This can be found in Tables 9 and 10 and Picture 3.
Table 9: Division of crops in Samsun Province. Source: (MOAS, INCLUDE)
Crop Decares % of Total
Fruit & Nuts Total 919.749 23.9%
Vegetables Total 458.439 11.9%
Field Crops Total 2.467.832 64.2%
Total Agricultural Land 3.846.020 100.0%
Table 10: Division of fruit & nut crops in Samsun Province Source: (MOAS, INCLUDE)
Crop Decares % of Total
Apple 5.381 0.58
Cherry 1.724 0.19
Hazelnut 883.410 96.05
Kiwi 1.494 0.16
Peach 14.890 1.62
Walnut 11.648 1.27
Strawberry, plum, fig, persimmon, medlar, pomme granate and quince 1.202 0.13
Fruit & Nuts Total 919.749 100.0%
5.2 Analysis Alternative Income Options In order to understand why many farmers prefer hazelnuts over other crops the characteristics of
other investment options are discussed now. The options discussed are off-farm incomes, selling the
land and producing the apple, kiwi and peach crops. Several aspects are compared; the marketing
chains, income possibilities, production risks, establishment costs of new structures, and labour
requirements.
5.2.1 Off-farm income
Off-farm incomes and tree crop production have some differing characteristics which can be
attractive for humans in search of income. There is too much variation in the off-farm income levels,
therefore they are not compared but only the characterizing aspects of off-farm income.
Wage labour is in many cases more flexible than tree crop production. Many jobs can be performed
at different locations (such as different cities), and people can change their job if they find more
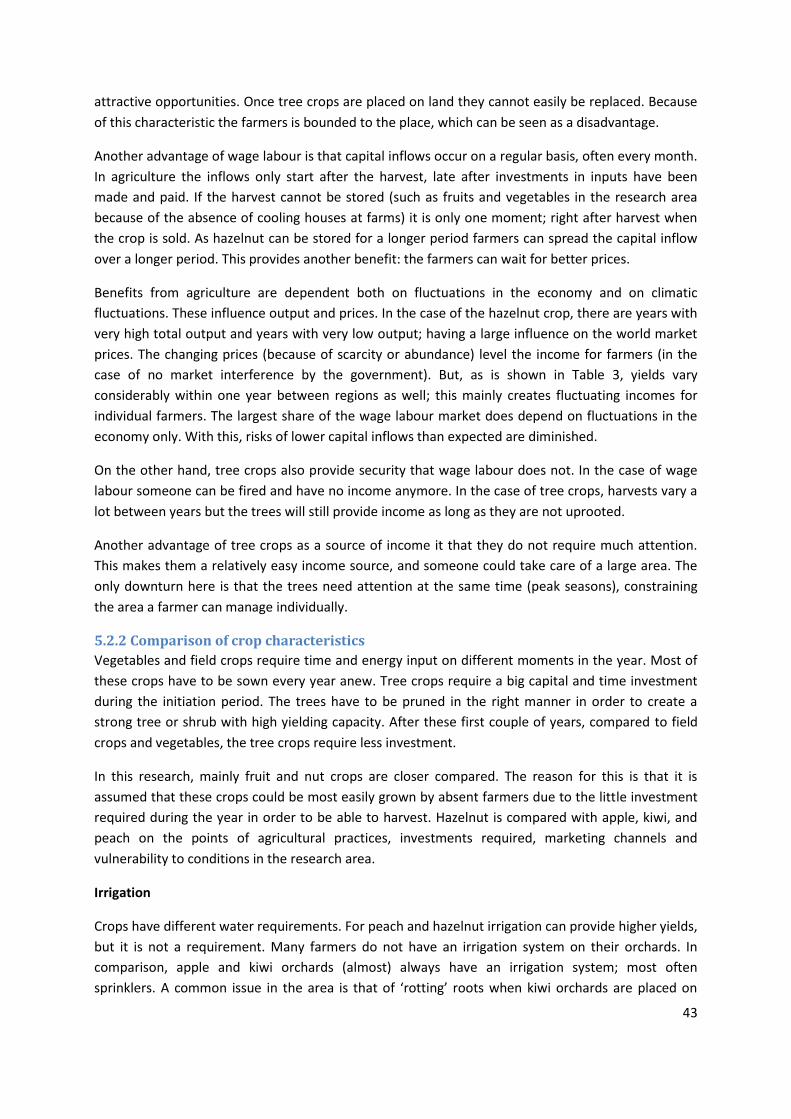
43
attractive opportunities. Once tree crops are placed on land they cannot easily be replaced. Because
of this characteristic the farmers is bounded to the place, which can be seen as a disadvantage.
Another advantage of wage labour is that capital inflows occur on a regular basis, often every month.
In agriculture the inflows only start after the harvest, late after investments in inputs have been
made and paid. If the harvest cannot be stored (such as fruits and vegetables in the research area
because of the absence of cooling houses at farms) it is only one moment; right after harvest when
the crop is sold. As hazelnut can be stored for a longer period farmers can spread the capital inflow
over a longer period. This provides another benefit: the farmers can wait for better prices.
Benefits from agriculture are dependent both on fluctuations in the economy and on climatic
fluctuations. These influence output and prices. In the case of the hazelnut crop, there are years with
very high total output and years with very low output; having a large influence on the world market
prices. The changing prices (because of scarcity or abundance) level the income for farmers (in the
case of no market interference by the government). But, as is shown in Table 3, yields vary
considerably within one year between regions as well; this mainly creates fluctuating incomes for
individual farmers. The largest share of the wage labour market does depend on fluctuations in the
economy only. With this, risks of lower capital inflows than expected are diminished.
On the other hand, tree crops also provide security that wage labour does not. In the case of wage
labour someone can be fired and have no income anymore. In the case of tree crops, harvests vary a
lot between years but the trees will still provide income as long as they are not uprooted.
Another advantage of tree crops as a source of income it that they do not require much attention.
This makes them a relatively easy income source, and someone could take care of a large area. The
only downturn here is that the trees need attention at the same time (peak seasons), constraining
the area a farmer can manage individually.
5.2.2 Comparison of crop characteristics
Vegetables and field crops require time and energy input on different moments in the year. Most of
these crops have to be sown every year anew. Tree crops require a big capital and time investment
during the initiation period. The trees have to be pruned in the right manner in order to create a
strong tree or shrub with high yielding capacity. After these first couple of years, compared to field
crops and vegetables, the tree crops require less investment.
In this research, mainly fruit and nut crops are closer compared. The reason for this is that it is
assumed that these crops could be most easily grown by absent farmers due to the little investment
required during the year in order to be able to harvest. Hazelnut is compared with apple, kiwi, and
peach on the points of agricultural practices, investments required, marketing channels and
vulnerability to conditions in the research area.
Irrigation
Crops have different water requirements. For peach and hazelnut irrigation can provide higher yields,
but it is not a requirement. Many farmers do not have an irrigation system on their orchards. In
comparison, apple and kiwi orchards (almost) always have an irrigation system; most often
sprinklers. A common issue in the area is that of ‘rotting’ roots when kiwi orchards are placed on
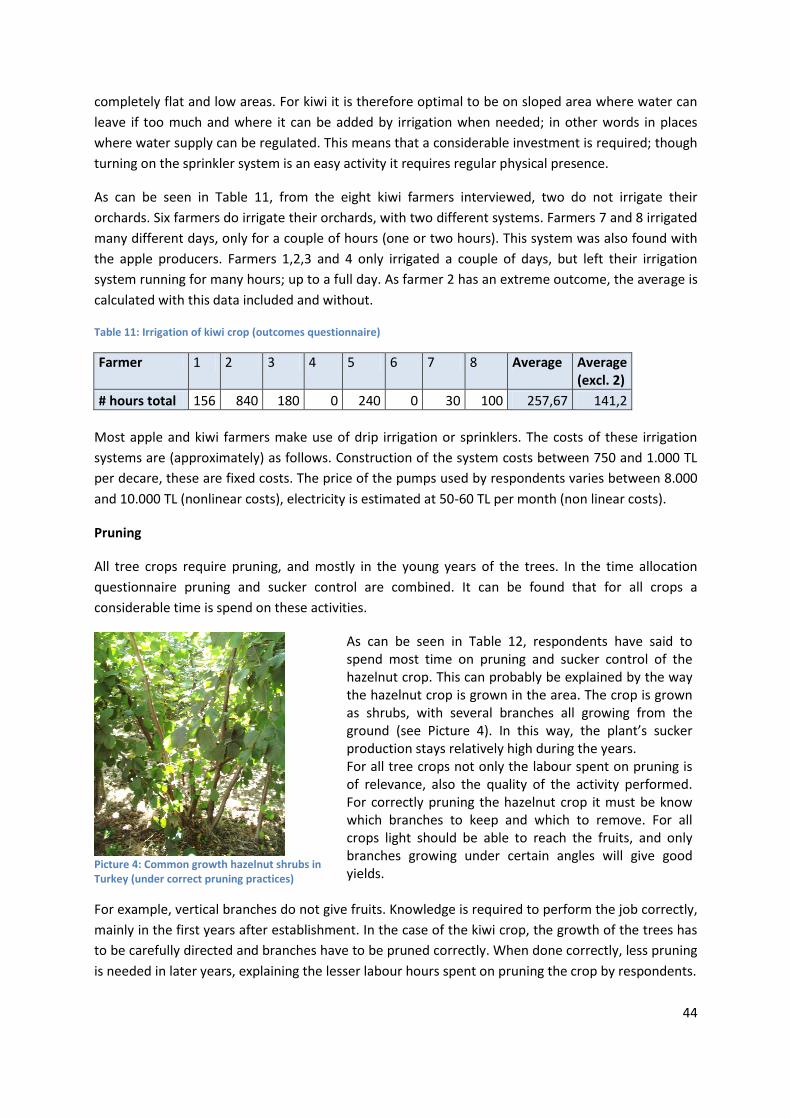
44
completely flat and low areas. For kiwi it is therefore optimal to be on sloped area where water can
leave if too much and where it can be added by irrigation when needed; in other words in places
where water supply can be regulated. This means that a considerable investment is required; though
turning on the sprinkler system is an easy activity it requires regular physical presence.
As can be seen in Table 11, from the eight kiwi farmers interviewed, two do not irrigate their
orchards. Six farmers do irrigate their orchards, with two different systems. Farmers 7 and 8 irrigated
many different days, only for a couple of hours (one or two hours). This system was also found with
the apple producers. Farmers 1,2,3 and 4 only irrigated a couple of days, but left their irrigation
system running for many hours; up to a full day. As farmer 2 has an extreme outcome, the average is
calculated with this data included and without.
Table 11: Irrigation of kiwi crop (outcomes questionnaire)
Farmer 1 2 3 4 5 6 7 8 Average Average (excl. 2)
# hours total 156 840 180 0 240 0 30 100 257,67 141,2
Most apple and kiwi farmers make use of drip irrigation or sprinklers. The costs of these irrigation
systems are (approximately) as follows. Construction of the system costs between 750 and 1.000 TL
per decare, these are fixed costs. The price of the pumps used by respondents varies between 8.000
and 10.000 TL (nonlinear costs), electricity is estimated at 50-60 TL per month (non linear costs).
Pruning
All tree crops require pruning, and mostly in the young years of the trees. In the time allocation
questionnaire pruning and sucker control are combined. It can be found that for all crops a
considerable time is spend on these activities.
Picture 4: Common growth hazelnut shrubs in Turkey (under correct pruning practices)
As can be seen in Table 12, respondents have said to spend most time on pruning and sucker control of the hazelnut crop. This can probably be explained by the way the hazelnut crop is grown in the area. The crop is grown as shrubs, with several branches all growing from the ground (see Picture 4). In this way, the plant’s sucker production stays relatively high during the years. For all tree crops not only the labour spent on pruning is of relevance, also the quality of the activity performed. For correctly pruning the hazelnut crop it must be know which branches to keep and which to remove. For all crops light should be able to reach the fruits, and only branches growing under certain angles will give good yields.
For example, vertical branches do not give fruits. Knowledge is required to perform the job correctly,
mainly in the first years after establishment. In the case of the kiwi crop, the growth of the trees has
to be carefully directed and branches have to be pruned correctly. When done correctly, less pruning
is needed in later years, explaining the lesser labour hours spent on pruning the crop by respondents.
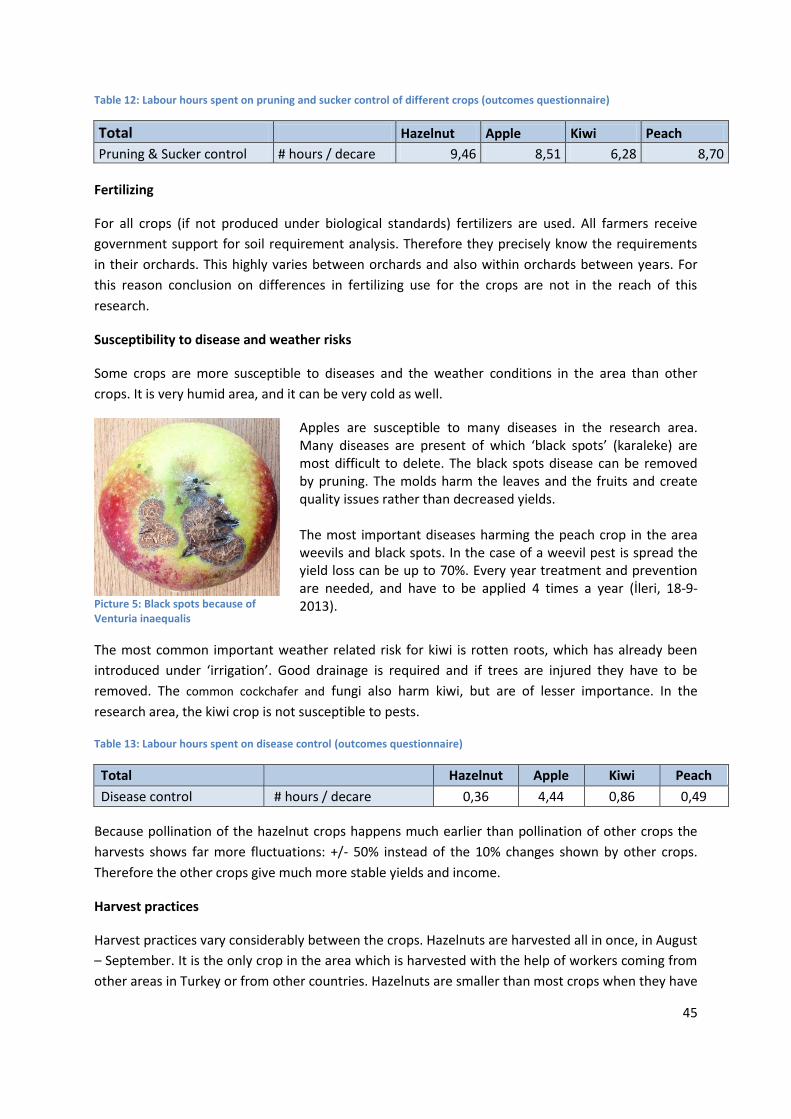
45
Table 12: Labour hours spent on pruning and sucker control of different crops (outcomes questionnaire)
Total Hazelnut Apple Kiwi Peach
Pruning & Sucker control # hours / decare 9,46 8,51 6,28 8,70
Fertilizing
For all crops (if not produced under biological standards) fertilizers are used. All farmers receive
government support for soil requirement analysis. Therefore they precisely know the requirements
in their orchards. This highly varies between orchards and also within orchards between years. For
this reason conclusion on differences in fertilizing use for the crops are not in the reach of this
research.
Susceptibility to disease and weather risks
Some crops are more susceptible to diseases and the weather conditions in the area than other
crops. It is very humid area, and it can be very cold as well.
Picture 5: Black spots because of Venturia inaequalis
Apples are susceptible to many diseases in the research area. Many diseases are present of which ‘black spots’ (karaleke) are most difficult to delete. The black spots disease can be removed by pruning. The molds harm the leaves and the fruits and create quality issues rather than decreased yields. The most important diseases harming the peach crop in the area weevils and black spots. In the case of a weevil pest is spread the yield loss can be up to 70%. Every year treatment and prevention are needed, and have to be applied 4 times a year (İleri, 18-9-2013).
The most common important weather related risk for kiwi is rotten roots, which has already been
introduced under ‘irrigation’. Good drainage is required and if trees are injured they have to be
removed. The common cockchafer and fungi also harm kiwi, but are of lesser importance. In the
research area, the kiwi crop is not susceptible to pests.
Table 13: Labour hours spent on disease control (outcomes questionnaire)
Total
Hazelnut Apple Kiwi Peach
Disease control # hours / decare 0,36 4,44 0,86 0,49
Because pollination of the hazelnut crops happens much earlier than pollination of other crops the
harvests shows far more fluctuations: +/- 50% instead of the 10% changes shown by other crops.
Therefore the other crops give much more stable yields and income.
Harvest practices
Harvest practices vary considerably between the crops. Hazelnuts are harvested all in once, in August
– September. It is the only crop in the area which is harvested with the help of workers coming from
other areas in Turkey or from other countries. Hazelnuts are smaller than most crops when they have
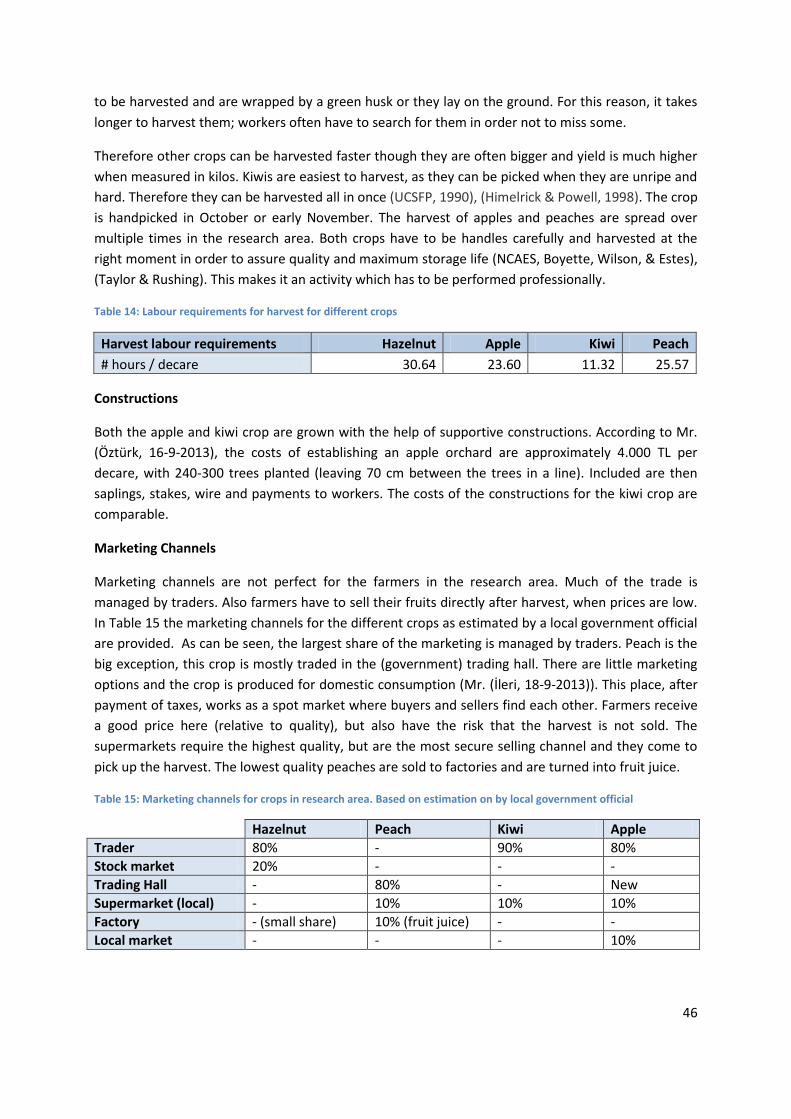
46
to be harvested and are wrapped by a green husk or they lay on the ground. For this reason, it takes
longer to harvest them; workers often have to search for them in order not to miss some.
Therefore other crops can be harvested faster though they are often bigger and yield is much higher
when measured in kilos. Kiwis are easiest to harvest, as they can be picked when they are unripe and
hard. Therefore they can be harvested all in once (UCSFP, 1990), (Himelrick & Powell, 1998). The crop
is handpicked in October or early November. The harvest of apples and peaches are spread over
multiple times in the research area. Both crops have to be handles carefully and harvested at the
right moment in order to assure quality and maximum storage life (NCAES, Boyette, Wilson, & Estes),
(Taylor & Rushing). This makes it an activity which has to be performed professionally.
Table 14: Labour requirements for harvest for different crops
Harvest labour requirements Hazelnut Apple Kiwi Peach
# hours / decare 30.64 23.60 11.32 25.57
Constructions
Both the apple and kiwi crop are grown with the help of supportive constructions. According to Mr.
(Öztürk, 16-9-2013), the costs of establishing an apple orchard are approximately 4.000 TL per
decare, with 240-300 trees planted (leaving 70 cm between the trees in a line). Included are then
saplings, stakes, wire and payments to workers. The costs of the constructions for the kiwi crop are
comparable.
Marketing Channels
Marketing channels are not perfect for the farmers in the research area. Much of the trade is
managed by traders. Also farmers have to sell their fruits directly after harvest, when prices are low.
In Table 15 the marketing channels for the different crops as estimated by a local government official
are provided. As can be seen, the largest share of the marketing is managed by traders. Peach is the
big exception, this crop is mostly traded in the (government) trading hall. There are little marketing
options and the crop is produced for domestic consumption (Mr. (İleri, 18-9-2013)). This place, after
payment of taxes, works as a spot market where buyers and sellers find each other. Farmers receive
a good price here (relative to quality), but also have the risk that the harvest is not sold. The
supermarkets require the highest quality, but are the most secure selling channel and they come to
pick up the harvest. The lowest quality peaches are sold to factories and are turned into fruit juice.
Table 15: Marketing channels for crops in research area. Based on estimation on by local government official
Hazelnut Peach Kiwi Apple
Trader 80% - 90% 80%
Stock market 20% - - -
Trading Hall - 80% - New
Supermarket (local) - 10% 10% 10%
Factory - (small share) 10% (fruit juice) - -
Local market - - - 10%
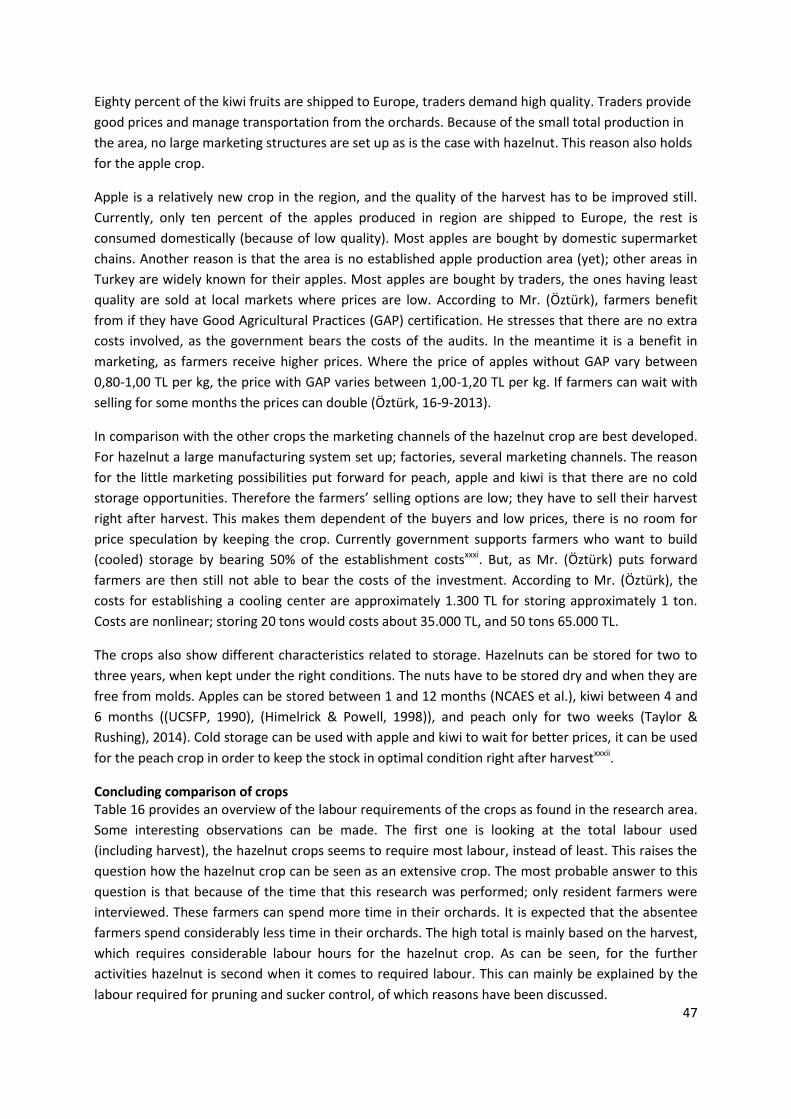
47
Eighty percent of the kiwi fruits are shipped to Europe, traders demand high quality. Traders provide
good prices and manage transportation from the orchards. Because of the small total production in
the area, no large marketing structures are set up as is the case with hazelnut. This reason also holds
for the apple crop.
Apple is a relatively new crop in the region, and the quality of the harvest has to be improved still.
Currently, only ten percent of the apples produced in region are shipped to Europe, the rest is
consumed domestically (because of low quality). Most apples are bought by domestic supermarket
chains. Another reason is that the area is no established apple production area (yet); other areas in
Turkey are widely known for their apples. Most apples are bought by traders, the ones having least
quality are sold at local markets where prices are low. According to Mr. (Öztürk), farmers benefit
from if they have Good Agricultural Practices (GAP) certification. He stresses that there are no extra
costs involved, as the government bears the costs of the audits. In the meantime it is a benefit in
marketing, as farmers receive higher prices. Where the price of apples without GAP vary between
0,80-1,00 TL per kg, the price with GAP varies between 1,00-1,20 TL per kg. If farmers can wait with
selling for some months the prices can double (Öztürk, 16-9-2013).
In comparison with the other crops the marketing channels of the hazelnut crop are best developed.
For hazelnut a large manufacturing system set up; factories, several marketing channels. The reason
for the little marketing possibilities put forward for peach, apple and kiwi is that there are no cold
storage opportunities. Therefore the farmers’ selling options are low; they have to sell their harvest
right after harvest. This makes them dependent of the buyers and low prices, there is no room for
price speculation by keeping the crop. Currently government supports farmers who want to build
(cooled) storage by bearing 50% of the establishment costsxxxi. But, as Mr. (Öztürk) puts forward
farmers are then still not able to bear the costs of the investment. According to Mr. (Öztürk), the
costs for establishing a cooling center are approximately 1.300 TL for storing approximately 1 ton.
Costs are nonlinear; storing 20 tons would costs about 35.000 TL, and 50 tons 65.000 TL.
The crops also show different characteristics related to storage. Hazelnuts can be stored for two to
three years, when kept under the right conditions. The nuts have to be stored dry and when they are
free from molds. Apples can be stored between 1 and 12 months (NCAES et al.), kiwi between 4 and
6 months ((UCSFP, 1990), (Himelrick & Powell, 1998)), and peach only for two weeks (Taylor &
Rushing), 2014). Cold storage can be used with apple and kiwi to wait for better prices, it can be used
for the peach crop in order to keep the stock in optimal condition right after harvestxxxii.
Concluding comparison of crops Table 16 provides an overview of the labour requirements of the crops as found in the research area.
Some interesting observations can be made. The first one is looking at the total labour used
(including harvest), the hazelnut crops seems to require most labour, instead of least. This raises the
question how the hazelnut crop can be seen as an extensive crop. The most probable answer to this
question is that because of the time that this research was performed; only resident farmers were
interviewed. These farmers can spend more time in their orchards. It is expected that the absentee
farmers spend considerably less time in their orchards. The high total is mainly based on the harvest,
which requires considerable labour hours for the hazelnut crop. As can be seen, for the further
activities hazelnut is second when it comes to required labour. This can mainly be explained by the
labour required for pruning and sucker control, of which reasons have been discussed.
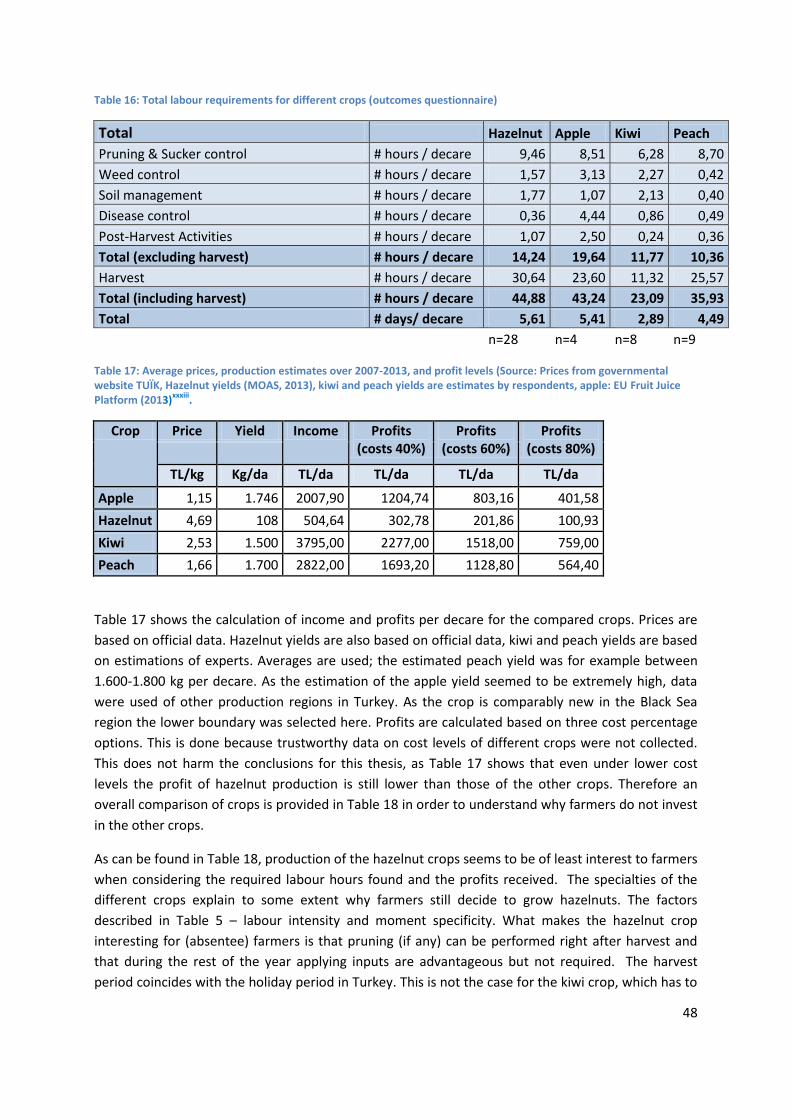
48
Table 16: Total labour requirements for different crops (outcomes questionnaire)
Total Hazelnut Apple Kiwi Peach
Pruning & Sucker control # hours / decare 9,46 8,51 6,28 8,70
Weed control # hours / decare 1,57 3,13 2,27 0,42
Soil management # hours / decare 1,77 1,07 2,13 0,40
Disease control # hours / decare 0,36 4,44 0,86 0,49
Post-Harvest Activities # hours / decare 1,07 2,50 0,24 0,36
Total (excluding harvest) # hours / decare 14,24 19,64 11,77 10,36
Harvest # hours / decare 30,64 23,60 11,32 25,57
Total (including harvest) # hours / decare 44,88 43,24 23,09 35,93
Total # days/ decare 5,61 5,41 2,89 4,49
n=28 n=4 n=8 n=9
Table 17: Average prices, production estimates over 2007-2013, and profit levels (Source: Prices from governmental website TUÏK, Hazelnut yields (MOAS, 2013), kiwi and peach yields are estimates by respondents, apple: EU Fruit Juice Platform (2013)
xxxiii.
Crop Price Yield Income Profits (costs 40%)
Profits (costs 60%)
Profits (costs 80%)
TL/kg Kg/da TL/da TL/da TL/da TL/da
Apple 1,15 1.746 2007,90 1204,74 803,16 401,58
Hazelnut 4,69 108 504,64 302,78 201,86 100,93
Kiwi 2,53 1.500 3795,00 2277,00 1518,00 759,00
Peach 1,66 1.700 2822,00 1693,20 1128,80 564,40
Table 17 shows the calculation of income and profits per decare for the compared crops. Prices are
based on official data. Hazelnut yields are also based on official data, kiwi and peach yields are based
on estimations of experts. Averages are used; the estimated peach yield was for example between
1.600-1.800 kg per decare. As the estimation of the apple yield seemed to be extremely high, data
were used of other production regions in Turkey. As the crop is comparably new in the Black Sea
region the lower boundary was selected here. Profits are calculated based on three cost percentage
options. This is done because trustworthy data on cost levels of different crops were not collected.
This does not harm the conclusions for this thesis, as Table 17 shows that even under lower cost
levels the profit of hazelnut production is still lower than those of the other crops. Therefore an
overall comparison of crops is provided in Table 18 in order to understand why farmers do not invest
in the other crops.
As can be found in Table 18, production of the hazelnut crops seems to be of least interest to farmers
when considering the required labour hours found and the profits received. The specialties of the
different crops explain to some extent why farmers still decide to grow hazelnuts. The factors
described in Table 5 – labour intensity and moment specificity. What makes the hazelnut crop
interesting for (absentee) farmers is that pruning (if any) can be performed right after harvest and
that during the rest of the year applying inputs are advantageous but not required. The harvest
period coincides with the holiday period in Turkey. This is not the case for the kiwi crop, which has to
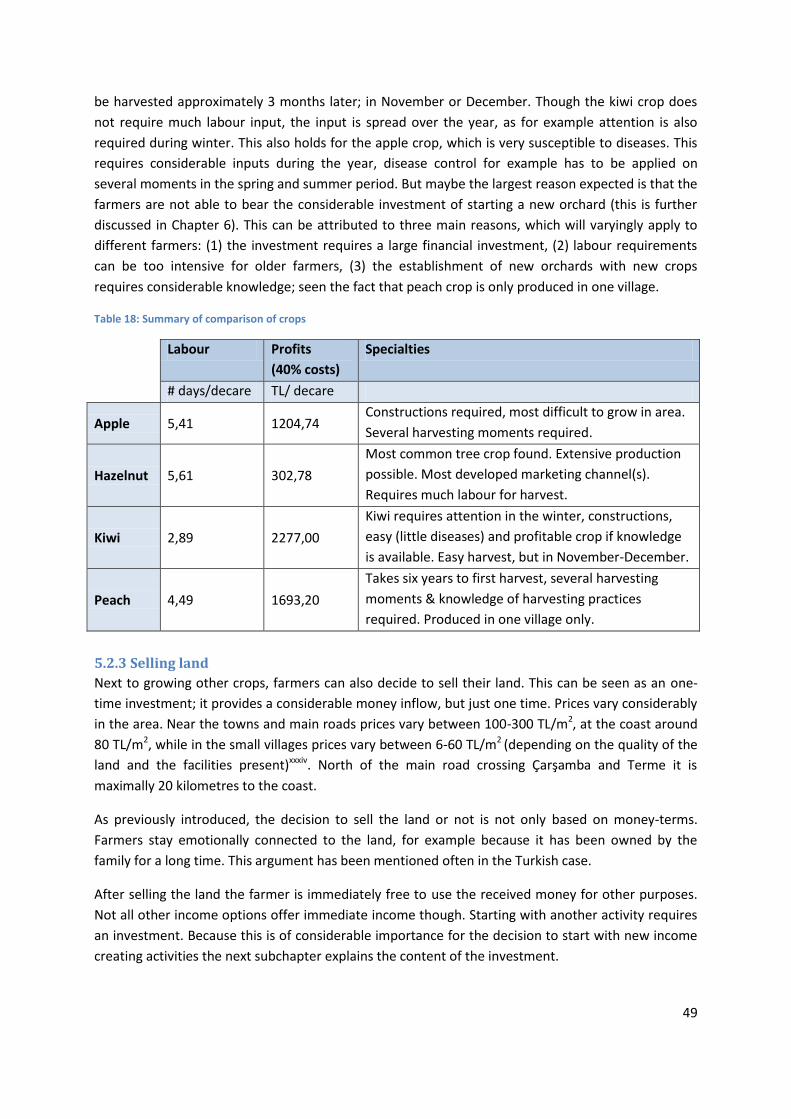
49
be harvested approximately 3 months later; in November or December. Though the kiwi crop does
not require much labour input, the input is spread over the year, as for example attention is also
required during winter. This also holds for the apple crop, which is very susceptible to diseases. This
requires considerable inputs during the year, disease control for example has to be applied on
several moments in the spring and summer period. But maybe the largest reason expected is that the
farmers are not able to bear the considerable investment of starting a new orchard (this is further
discussed in Chapter 6). This can be attributed to three main reasons, which will varyingly apply to
different farmers: (1) the investment requires a large financial investment, (2) labour requirements
can be too intensive for older farmers, (3) the establishment of new orchards with new crops
requires considerable knowledge; seen the fact that peach crop is only produced in one village.
Table 18: Summary of comparison of crops
Labour Profits
(40% costs)
Specialties
# days/decare TL/ decare
Apple 5,41 1204,74 Constructions required, most difficult to grow in area.
Several harvesting moments required.
Hazelnut 5,61 302,78
Most common tree crop found. Extensive production
possible. Most developed marketing channel(s).
Requires much labour for harvest.
Kiwi 2,89 2277,00
Kiwi requires attention in the winter, constructions,
easy (little diseases) and profitable crop if knowledge
is available. Easy harvest, but in November-December.
Peach 4,49 1693,20
Takes six years to first harvest, several harvesting
moments & knowledge of harvesting practices
required. Produced in one village only.
5.2.3 Selling land
Next to growing other crops, farmers can also decide to sell their land. This can be seen as an one-
time investment; it provides a considerable money inflow, but just one time. Prices vary considerably
in the area. Near the towns and main roads prices vary between 100-300 TL/m2, at the coast around
80 TL/m2, while in the small villages prices vary between 6-60 TL/m2 (depending on the quality of the
land and the facilities present)xxxiv. North of the main road crossing Çarşamba and Terme it is
maximally 20 kilometres to the coast.
As previously introduced, the decision to sell the land or not is not only based on money-terms.
Farmers stay emotionally connected to the land, for example because it has been owned by the
family for a long time. This argument has been mentioned often in the Turkish case.
After selling the land the farmer is immediately free to use the received money for other purposes.
Not all other income options offer immediate income though. Starting with another activity requires
an investment. Because this is of considerable importance for the decision to start with new income
creating activities the next subchapter explains the content of the investment.
50
Chapter 6 Relationship between absenteeism and hazelnut policies
Chapter six discusses how absenteeism impacts the effectiveness of agricultural policies and is based
on the framework established in previous chapters. Subchapter 6.1 answers the main question of this
chapter for hazelnut oriented policies. As the policies (are meant to) influence productivity and total
output, the influence of absenteeism on these factors is discussed here as well. In subchapter 6.2
agricultural policies for other crops are discussed. 6.3 is the final subchapter and includes possibilities
of additions to the current policies.
6.1 Current policies This subchapter focuses on the question how absenteeism influence uptake of policies. The policies
are discussed one by one. In order to understand the influence of absenteeism on uptake of policies,
first the targets of the policy (productivity & output related) and the influence of the policy on the
absentee farmers have to be understood. Then, the main question of this chapter can be answered;
how is the uptake of the policy influenced by absenteeism?
Area Based Direct Income Support
As has been discussed before, with the start of the ARIP program direct income support was
introduced. Instead of price and thus output based support, direct income support was based on the
size of the hazelnut orchard (area based). Though the payment is meant to improve the quality of
hazelnuts, there were and are no rules about the destination of the money (Kayalak & Özçelik,
2012):44). This means that farmers can decide to invest the money in the orchard or use it for other
purposes. The payment is sent to (the bank account) of farmers who have a license for hazelnut
production. After application, farmers can get a license if their orchards are located in the 1st
Standard Region. For the last years, the level of the support has been as follows in Table 19:
Table 19: Direct Income Payment Levels (MOAS, 2013b); (Resmi-gazete-28557, 2013)
Year 2009-2012 2013 2014
Payment (TL/da/year) 150 160 170
Two observations can be made related to the policy:
Interviews with the government have shown that it is unclear how long this policy is
continued and what the level of the future payments will be. During the research in 2013,
only the price for 2014 was known by province level government. This brings a level of
uncertainty with it for farmers.
The second understanding is that currently there is no motivation for the government to
stimulate productivity of orchards, because there are already excess stocks in the market
(Bozoğlu, 2013). If the government would really have the intention to increase productivity,
they would include rules to this policy; such as that the support can only be spent on hiring
labour or buying farm inputs. The fact that this is not done shows that increasing productivity
is no priority of the government.
The policy influences absentee farmers basically by providing additional income. Each year after
registration they receive the payment. As can be understood from Figure 9, in many years the
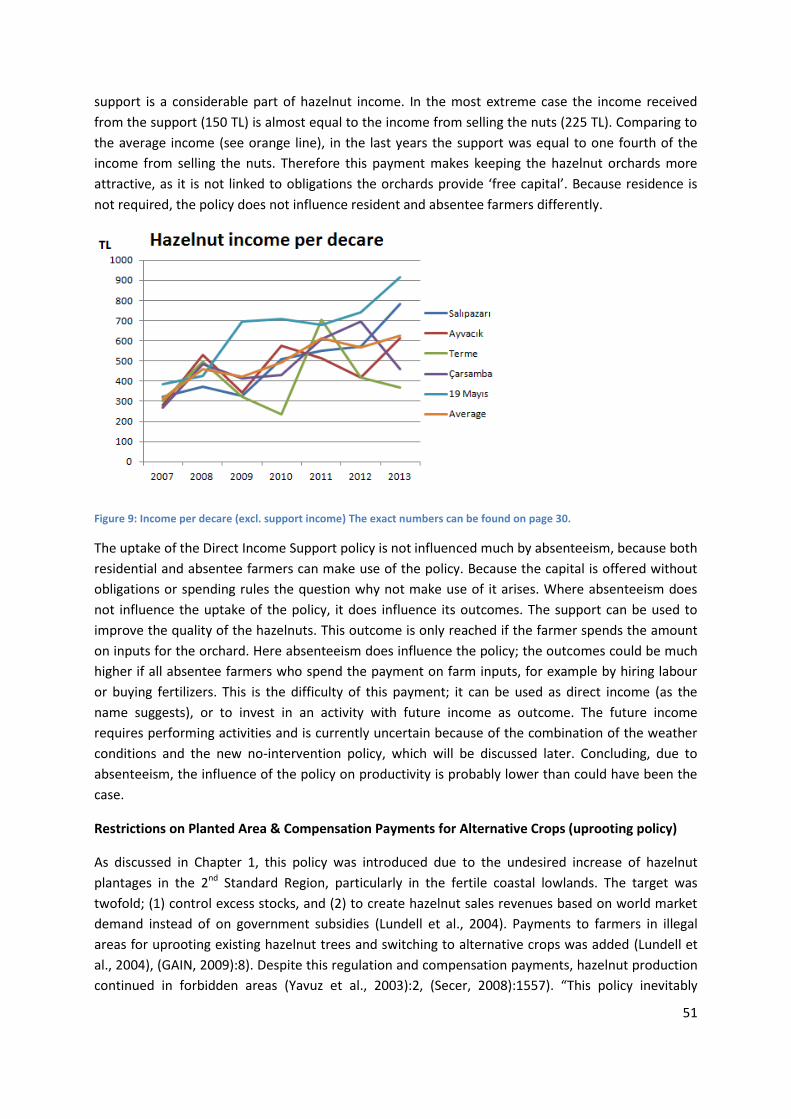
51
support is a considerable part of hazelnut income. In the most extreme case the income received
from the support (150 TL) is almost equal to the income from selling the nuts (225 TL). Comparing to
the average income (see orange line), in the last years the support was equal to one fourth of the
income from selling the nuts. Therefore this payment makes keeping the hazelnut orchards more
attractive, as it is not linked to obligations the orchards provide ‘free capital’. Because residence is
not required, the policy does not influence resident and absentee farmers differently.
Figure 9: Income per decare (excl. support income) The exact numbers can be found on page 30.
The uptake of the Direct Income Support policy is not influenced much by absenteeism, because both
residential and absentee farmers can make use of the policy. Because the capital is offered without
obligations or spending rules the question why not make use of it arises. Where absenteeism does
not influence the uptake of the policy, it does influence its outcomes. The support can be used to
improve the quality of the hazelnuts. This outcome is only reached if the farmer spends the amount
on inputs for the orchard. Here absenteeism does influence the policy; the outcomes could be much
higher if all absentee farmers who spend the payment on farm inputs, for example by hiring labour
or buying fertilizers. This is the difficulty of this payment; it can be used as direct income (as the
name suggests), or to invest in an activity with future income as outcome. The future income
requires performing activities and is currently uncertain because of the combination of the weather
conditions and the new no-intervention policy, which will be discussed later. Concluding, due to
absenteeism, the influence of the policy on productivity is probably lower than could have been the
case.
Restrictions on Planted Area & Compensation Payments for Alternative Crops (uprooting policy)
As discussed in Chapter 1, this policy was introduced due to the undesired increase of hazelnut
plantages in the 2nd Standard Region, particularly in the fertile coastal lowlands. The target was
twofold; (1) control excess stocks, and (2) to create hazelnut sales revenues based on world market
demand instead of on government subsidies (Lundell et al., 2004). Payments to farmers in illegal
areas for uprooting existing hazelnut trees and switching to alternative crops was added (Lundell et
al., 2004), (GAIN, 2009):8). Despite this regulation and compensation payments, hazelnut production
continued in forbidden areas (Yavuz et al., 2003):2, (Secer, 2008):1557). “This policy inevitably
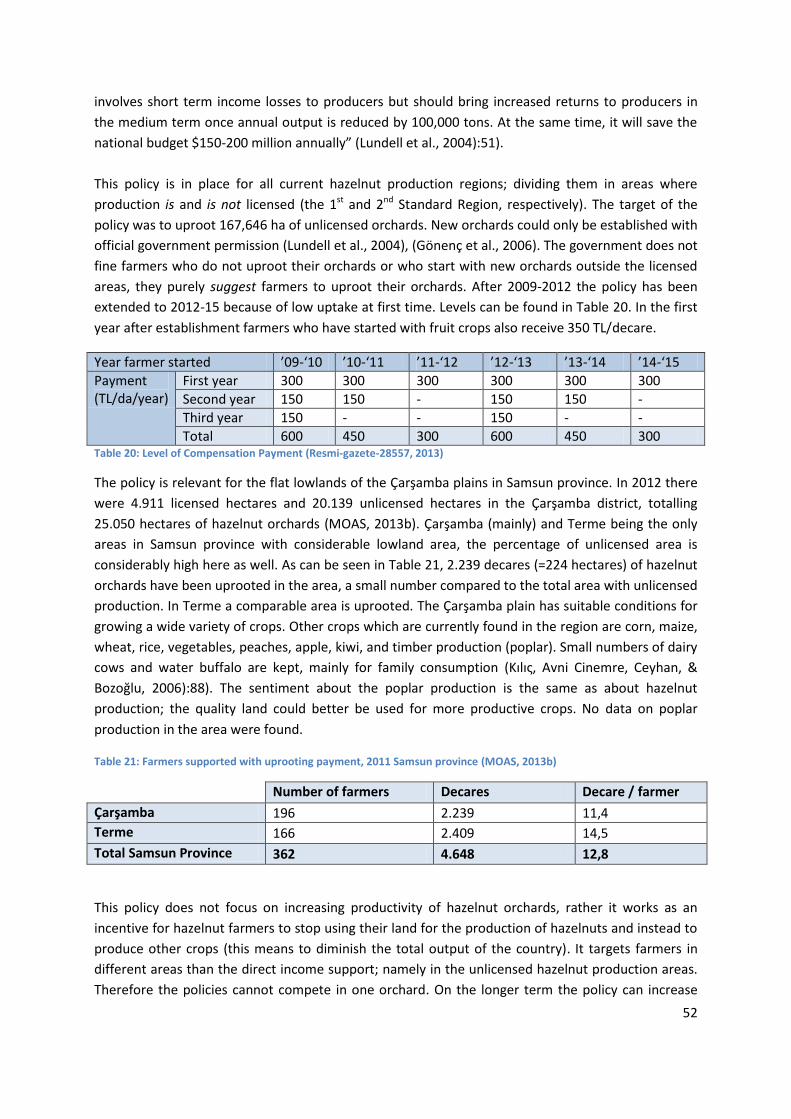
52
involves short term income losses to producers but should bring increased returns to producers in
the medium term once annual output is reduced by 100,000 tons. At the same time, it will save the
national budget $150-200 million annually” (Lundell et al., 2004):51).
This policy is in place for all current hazelnut production regions; dividing them in areas where
production is and is not licensed (the 1st and 2nd Standard Region, respectively). The target of the
policy was to uproot 167,646 ha of unlicensed orchards. New orchards could only be established with
official government permission (Lundell et al., 2004), (Gönenç et al., 2006). The government does not
fine farmers who do not uproot their orchards or who start with new orchards outside the licensed
areas, they purely suggest farmers to uproot their orchards. After 2009-2012 the policy has been
extended to 2012-15 because of low uptake at first time. Levels can be found in Table 20. In the first
year after establishment farmers who have started with fruit crops also receive 350 TL/decare.
Year farmer started ’09-‘10 ’10-‘11 ’11-‘12 ’12-‘13 ’13-‘14 ’14-‘15
Payment (TL/da/year)
First year 300 300 300 300 300 300
Second year 150 150 - 150 150 -
Third year 150 - - 150 - -
Total 600 450 300 600 450 300 Table 20: Level of Compensation Payment (Resmi-gazete-28557, 2013)
The policy is relevant for the flat lowlands of the Çarşamba plains in Samsun province. In 2012 there
were 4.911 licensed hectares and 20.139 unlicensed hectares in the Çarşamba district, totalling
25.050 hectares of hazelnut orchards (MOAS, 2013b). Çarşamba (mainly) and Terme being the only
areas in Samsun province with considerable lowland area, the percentage of unlicensed area is
considerably high here as well. As can be seen in Table 21, 2.239 decares (=224 hectares) of hazelnut
orchards have been uprooted in the area, a small number compared to the total area with unlicensed
production. In Terme a comparable area is uprooted. The Çarşamba plain has suitable conditions for
growing a wide variety of crops. Other crops which are currently found in the region are corn, maize,
wheat, rice, vegetables, peaches, apple, kiwi, and timber production (poplar). Small numbers of dairy
cows and water buffalo are kept, mainly for family consumption (Kılıς, Avni Cinemre, Ceyhan, &
Bozoğlu, 2006):88). The sentiment about the poplar production is the same as about hazelnut
production; the quality land could better be used for more productive crops. No data on poplar
production in the area were found.
Table 21: Farmers supported with uprooting payment, 2011 Samsun province (MOAS, 2013b)
Number of farmers Decares Decare / farmer
Çarşamba 196 2.239 11,4
Terme 166 2.409 14,5
Total Samsun Province 362 4.648 12,8
This policy does not focus on increasing productivity of hazelnut orchards, rather it works as an
incentive for hazelnut farmers to stop using their land for the production of hazelnuts and instead to
produce other crops (this means to diminish the total output of the country). It targets farmers in
different areas than the direct income support; namely in the unlicensed hazelnut production areas.
Therefore the policies cannot compete in one orchard. On the longer term the policy can increase
53
productivity as well, if a considerable number of farmers uproot (part of) their orchards and demand
decreases less strong (or stays equal or improves). This can improve hazelnut prices and thereby
work as an incentive to increase productivity. As there is oversupply in the current hazelnut sector,
this will only happen after considerable time.
When making use of this policy farmers receive a payment for maximally three years, depending on
their starting year. This coincides with the period that it takes before the new crops -in case of apple
and kiwi- provide the first yields after establishment. Therefore it covers “the large opportunity cost
of land lying with no output for three years until the trees bear fruit” (Hill, 2010):1067), which is also
included in the unit costs of investment. The support does not completely compensating the losses if
compared to Figure 9, but as the policy is most attractive for old orchards with low current and
future yields the support lies closer to the income as when expected based on this figure. But this
missed income is not the only cost as the new orchard also has to be established. The government
supports the farmers by contributing 50% of the investment. But many respondents, among which
government officials, have mentioned that the support payment is not sufficient and that it is
difficult for many farmers to collect the rest of the required capital.
For the analysis of this model only the Hill model is required. As was shown in Chapter 5, some new
crops require a considerable investment for establishment (apple, kiwi). The constructions (for kiwi
and apple) and labour input required for all crops make the investments are done in the presence of
fixed costs and irreversibility. As all trees in the orchard require the same constructions and labour
input, the costs do not decrease when the number of decares planted increases. These costs are
definitely fixed costs, as the level and quality of production is considerably different without the
constructions. In the case of cold storage, nonlinear costs are present. The costs of establishments
become relatively lower when their carrying capacity increases. These costs are not fixed because
cold storage facilities do not have to be present before or while the orchards are established. It is no
requirement but ‘only’ offers benefits; as farmers can keep their harvest and sell it when prices are
beneficial for them, instead of only directly after harvest. Therefore only a model including fixed
costs is used in order to understand what is required for starting a new crop. The peach crop does
not require constructions, and thus the fixed costs of establishment are lower. The missed income is
also categorized as fixed costs.
Figure 10 shows three different options; in area one the farmers are able to carry out the investment
and uproot and invest in new crops. In area 2 the farmers are not able and willing to do the
investment because of the presence of fixed costs in the situation or irreversibility and risks as is
found the research area. The aspect risk is discussed in under the next policy (referred to as the no-
intervention policy). In area 3 additional investments are made in hazelnut orchards. This area is
expected not to be relevant here. The uprooting policy is intended to shift farmers from area 2 to
area 1 in the Figure, mostly by covering the issues to irreversibility of the investment and lesser by
covering the risks faced with the new crops (such as the marketing issues).
For the investment of starting a new crop two resources are required; the resources capital and
labour. The resource land is of lesser importance. Compensation payments improve the ability for
farmers who have liquidity constraints to start with a new crop. The policy intends to influence the
(absentee) farmers by making the investment of making a switch to another crop easier. This is done
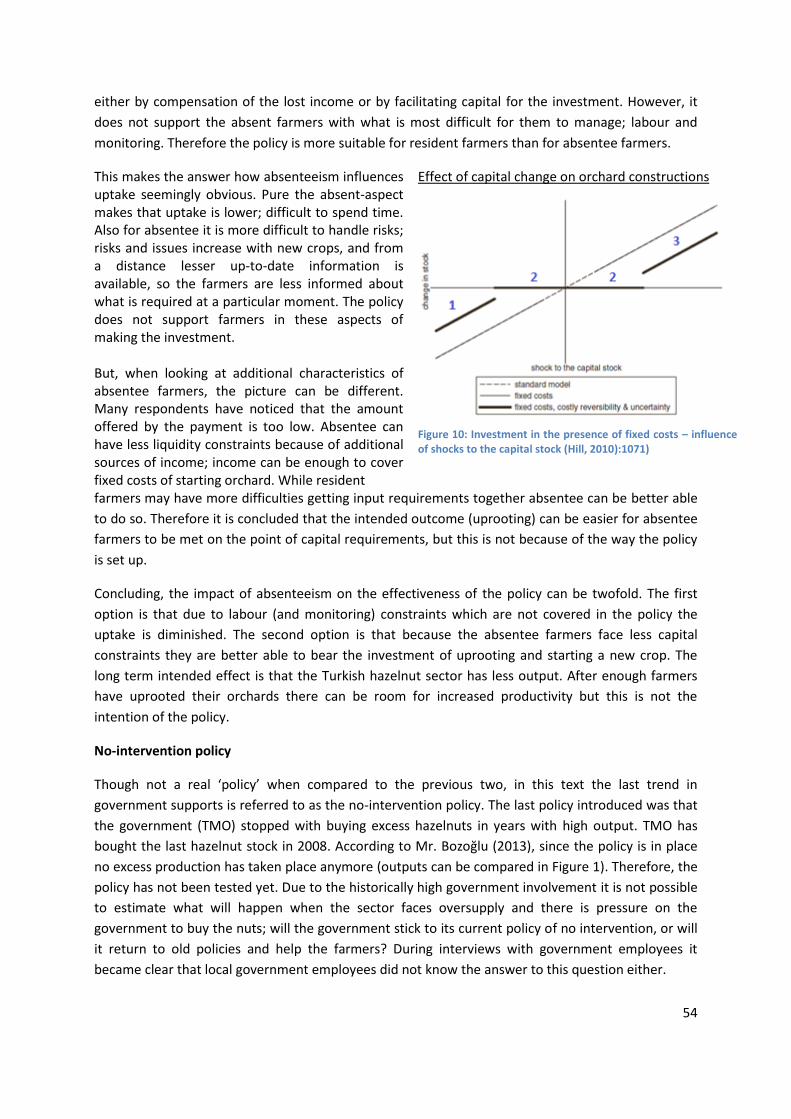
54
either by compensation of the lost income or by facilitating capital for the investment. However, it
does not support the absent farmers with what is most difficult for them to manage; labour and
monitoring. Therefore the policy is more suitable for resident farmers than for absentee farmers.
This makes the answer how absenteeism influences uptake seemingly obvious. Pure the absent-aspect makes that uptake is lower; difficult to spend time. Also for absentee it is more difficult to handle risks; risks and issues increase with new crops, and from a distance lesser up-to-date information is available, so the farmers are less informed about what is required at a particular moment. The policy does not support farmers in these aspects of making the investment. But, when looking at additional characteristics of absentee farmers, the picture can be different. Many respondents have noticed that the amount offered by the payment is too low. Absentee can have less liquidity constraints because of additional sources of income; income can be enough to cover fixed costs of starting orchard. While resident
Effect of capital change on orchard constructions
Figure 10: Investment in the presence of fixed costs – influence of shocks to the capital stock (Hill, 2010):1071)
farmers may have more difficulties getting input requirements together absentee can be better able
to do so. Therefore it is concluded that the intended outcome (uprooting) can be easier for absentee
farmers to be met on the point of capital requirements, but this is not because of the way the policy
is set up.
Concluding, the impact of absenteeism on the effectiveness of the policy can be twofold. The first
option is that due to labour (and monitoring) constraints which are not covered in the policy the
uptake is diminished. The second option is that because the absentee farmers face less capital
constraints they are better able to bear the investment of uprooting and starting a new crop. The
long term intended effect is that the Turkish hazelnut sector has less output. After enough farmers
have uprooted their orchards there can be room for increased productivity but this is not the
intention of the policy.
No-intervention policy
Though not a real ‘policy’ when compared to the previous two, in this text the last trend in
government supports is referred to as the no-intervention policy. The last policy introduced was that
the government (TMO) stopped with buying excess hazelnuts in years with high output. TMO has
bought the last hazelnut stock in 2008. According to Mr. Bozoğlu (2013), since the policy is in place
no excess production has taken place anymore (outputs can be compared in Figure 1). Therefore, the
policy has not been tested yet. Due to the historically high government involvement it is not possible
to estimate what will happen when the sector faces oversupply and there is pressure on the
government to buy the nuts; will the government stick to its current policy of no intervention, or will
it return to old policies and help the farmers? During interviews with government employees it
became clear that local government employees did not know the answer to this question either.
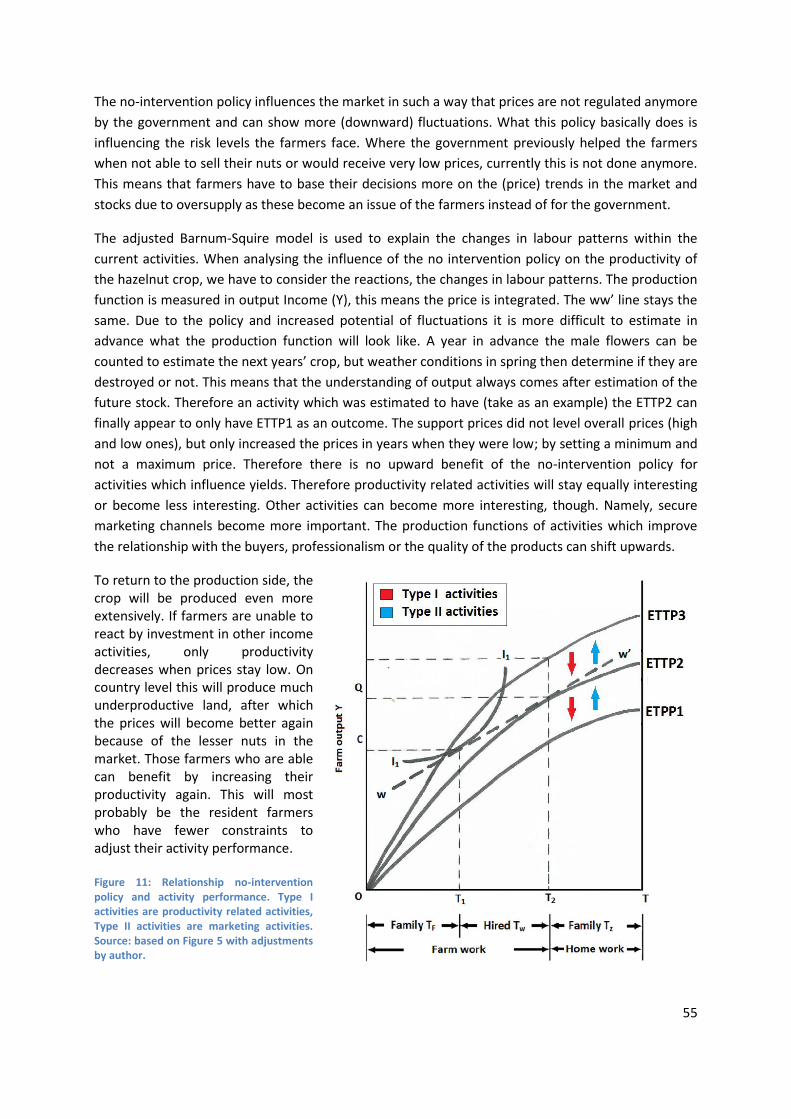
55
The no-intervention policy influences the market in such a way that prices are not regulated anymore
by the government and can show more (downward) fluctuations. What this policy basically does is
influencing the risk levels the farmers face. Where the government previously helped the farmers
when not able to sell their nuts or would receive very low prices, currently this is not done anymore.
This means that farmers have to base their decisions more on the (price) trends in the market and
stocks due to oversupply as these become an issue of the farmers instead of for the government.
The adjusted Barnum-Squire model is used to explain the changes in labour patterns within the
current activities. When analysing the influence of the no intervention policy on the productivity of
the hazelnut crop, we have to consider the reactions, the changes in labour patterns. The production
function is measured in output Income (Y), this means the price is integrated. The ww’ line stays the
same. Due to the policy and increased potential of fluctuations it is more difficult to estimate in
advance what the production function will look like. A year in advance the male flowers can be
counted to estimate the next years’ crop, but weather conditions in spring then determine if they are
destroyed or not. This means that the understanding of output always comes after estimation of the
future stock. Therefore an activity which was estimated to have (take as an example) the ETTP2 can
finally appear to only have ETTP1 as an outcome. The support prices did not level overall prices (high
and low ones), but only increased the prices in years when they were low; by setting a minimum and
not a maximum price. Therefore there is no upward benefit of the no-intervention policy for
activities which influence yields. Therefore productivity related activities will stay equally interesting
or become less interesting. Other activities can become more interesting, though. Namely, secure
marketing channels become more important. The production functions of activities which improve
the relationship with the buyers, professionalism or the quality of the products can shift upwards.
To return to the production side, the crop will be produced even more extensively. If farmers are unable to react by investment in other income activities, only productivity decreases when prices stay low. On country level this will produce much underproductive land, after which the prices will become better again because of the lesser nuts in the market. Those farmers who are able can benefit by increasing their productivity again. This will most probably be the resident farmers who have fewer constraints to adjust their activity performance. Figure 11: Relationship no-intervention policy and activity performance. Type I activities are productivity related activities, Type II activities are marketing activities. Source: based on Figure 5 with adjustments by author.
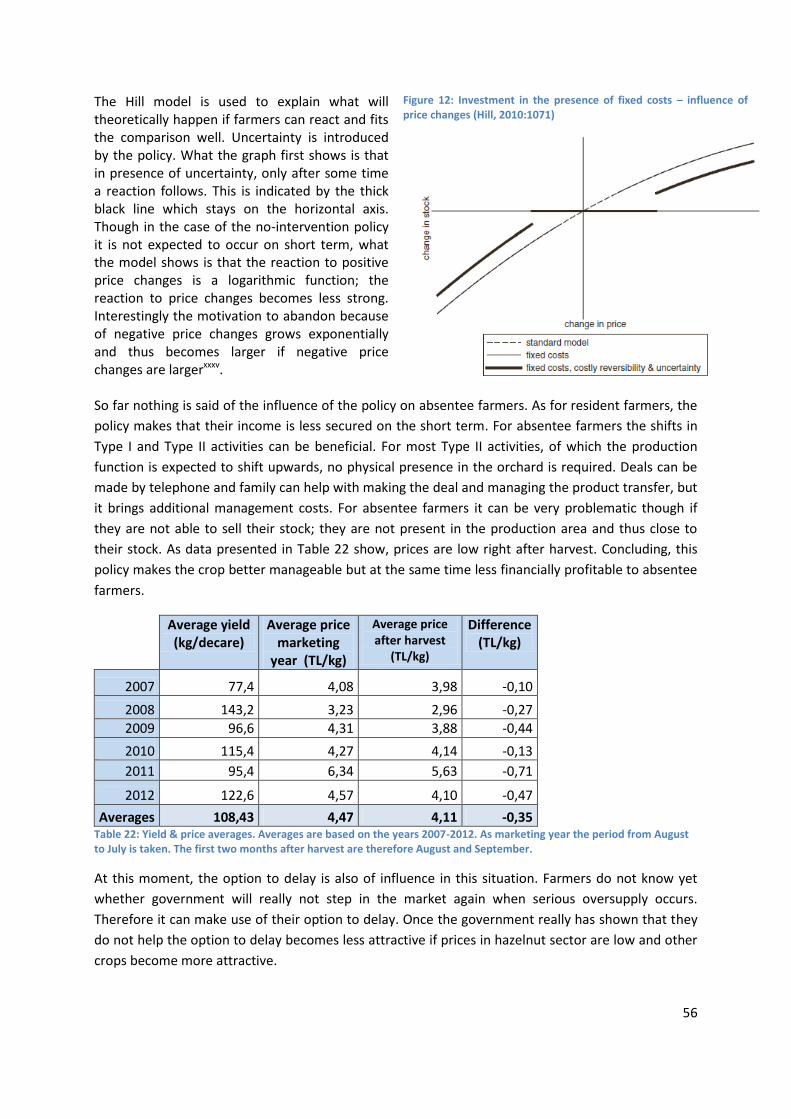
56
The Hill model is used to explain what will theoretically happen if farmers can react and fits the comparison well. Uncertainty is introduced by the policy. What the graph first shows is that in presence of uncertainty, only after some time a reaction follows. This is indicated by the thick black line which stays on the horizontal axis. Though in the case of the no-intervention policy it is not expected to occur on short term, what the model shows is that the reaction to positive price changes is a logarithmic function; the reaction to price changes becomes less strong. Interestingly the motivation to abandon because of negative price changes grows exponentially and thus becomes larger if negative price changes are largerxxxv.
Figure 12: Investment in the presence of fixed costs – influence of price changes (Hill, 2010:1071)
So far nothing is said of the influence of the policy on absentee farmers. As for resident farmers, the
policy makes that their income is less secured on the short term. For absentee farmers the shifts in
Type I and Type II activities can be beneficial. For most Type II activities, of which the production
function is expected to shift upwards, no physical presence in the orchard is required. Deals can be
made by telephone and family can help with making the deal and managing the product transfer, but
it brings additional management costs. For absentee farmers it can be very problematic though if
they are not able to sell their stock; they are not present in the production area and thus close to
their stock. As data presented in Table 22 show, prices are low right after harvest. Concluding, this
policy makes the crop better manageable but at the same time less financially profitable to absentee
farmers.
Average yield (kg/decare)
Average price marketing
year (TL/kg)
Average price after harvest
(TL/kg)
Difference (TL/kg)
2007 77,4 4,08 3,98 -0,10
2008 143,2 3,23 2,96 -0,27
2009 96,6 4,31 3,88 -0,44
2010 115,4 4,27 4,14 -0,13
2011 95,4 6,34 5,63 -0,71
2012 122,6 4,57 4,10 -0,47
Averages 108,43 4,47 4,11 -0,35 Table 22: Yield & price averages. Averages are based on the years 2007-2012. As marketing year the period from August to July is taken. The first two months after harvest are therefore August and September.
At this moment, the option to delay is also of influence in this situation. Farmers do not know yet
whether government will really not step in the market again when serious oversupply occurs.
Therefore it can make use of their option to delay. Once the government really has shown that they
do not help the option to delay becomes less attractive if prices in hazelnut sector are low and other
crops become more attractive.
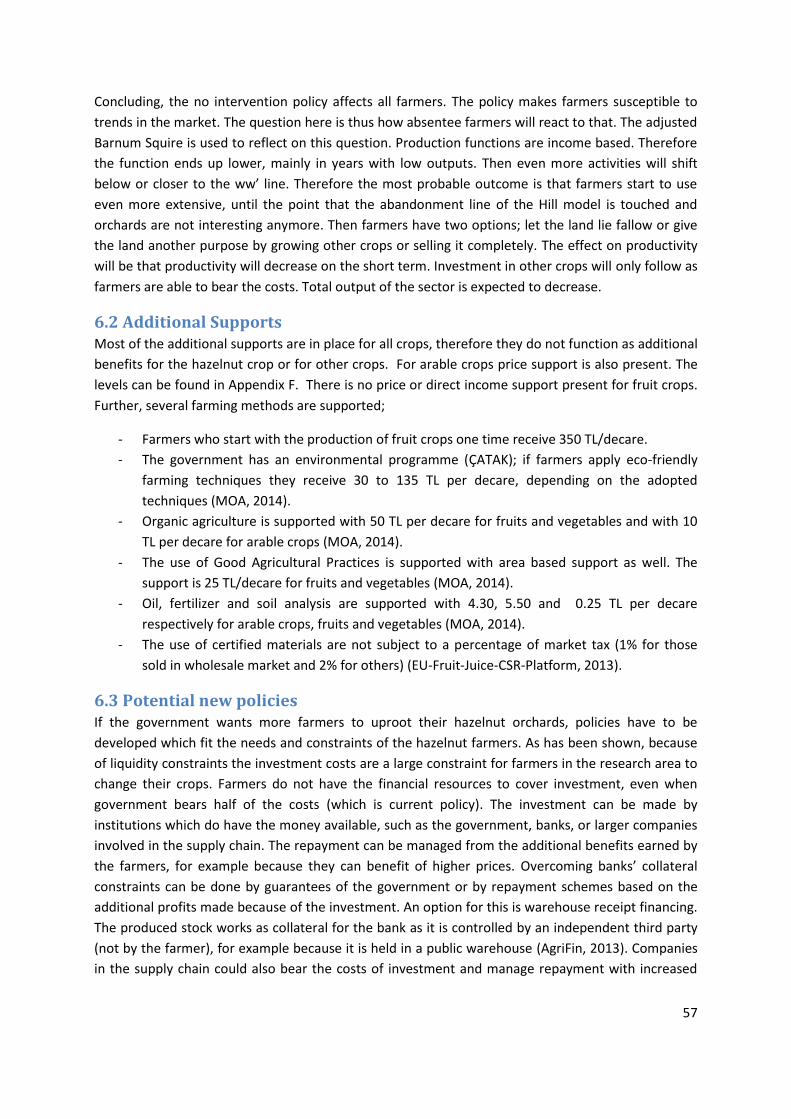
57
Concluding, the no intervention policy affects all farmers. The policy makes farmers susceptible to
trends in the market. The question here is thus how absentee farmers will react to that. The adjusted
Barnum Squire is used to reflect on this question. Production functions are income based. Therefore
the function ends up lower, mainly in years with low outputs. Then even more activities will shift
below or closer to the ww’ line. Therefore the most probable outcome is that farmers start to use
even more extensive, until the point that the abandonment line of the Hill model is touched and
orchards are not interesting anymore. Then farmers have two options; let the land lie fallow or give
the land another purpose by growing other crops or selling it completely. The effect on productivity
will be that productivity will decrease on the short term. Investment in other crops will only follow as
farmers are able to bear the costs. Total output of the sector is expected to decrease.
6.2 Additional Supports Most of the additional supports are in place for all crops, therefore they do not function as additional
benefits for the hazelnut crop or for other crops. For arable crops price support is also present. The
levels can be found in Appendix F. There is no price or direct income support present for fruit crops.
Further, several farming methods are supported;
- Farmers who start with the production of fruit crops one time receive 350 TL/decare.
- The government has an environmental programme (ÇATAK); if farmers apply eco-friendly
farming techniques they receive 30 to 135 TL per decare, depending on the adopted
techniques (MOA, 2014).
- Organic agriculture is supported with 50 TL per decare for fruits and vegetables and with 10
TL per decare for arable crops (MOA, 2014).
- The use of Good Agricultural Practices is supported with area based support as well. The
support is 25 TL/decare for fruits and vegetables (MOA, 2014).
- Oil, fertilizer and soil analysis are supported with 4.30, 5.50 and 0.25 TL per decare
respectively for arable crops, fruits and vegetables (MOA, 2014).
- The use of certified materials are not subject to a percentage of market tax (1% for those
sold in wholesale market and 2% for others) (EU-Fruit-Juice-CSR-Platform, 2013).
6.3 Potential new policies If the government wants more farmers to uproot their hazelnut orchards, policies have to be
developed which fit the needs and constraints of the hazelnut farmers. As has been shown, because
of liquidity constraints the investment costs are a large constraint for farmers in the research area to
change their crops. Farmers do not have the financial resources to cover investment, even when
government bears half of the costs (which is current policy). The investment can be made by
institutions which do have the money available, such as the government, banks, or larger companies
involved in the supply chain. The repayment can be managed from the additional benefits earned by
the farmers, for example because they can benefit of higher prices. Overcoming banks’ collateral
constraints can be done by guarantees of the government or by repayment schemes based on the
additional profits made because of the investment. An option for this is warehouse receipt financing.
The produced stock works as collateral for the bank as it is controlled by an independent third party
(not by the farmer), for example because it is held in a public warehouse (AgriFin, 2013). Companies
in the supply chain could also bear the costs of investment and manage repayment with increased
58
profits created by the investment. By managing the harvest (for example) they can make sure the
farmer does not sell it to other parties, thereby securing the repayment of the loan.
Though this might provide solutions to many farmers, the option that absentee farmers face liquidity
constraints to a lesser extent than resident farmers has been introduced. Therefore, these options
might not solve their main constraint; managing the labour input. The establishment of a new
orchard requires considerable labour input, the same counts for the first years after establishment.
Therefore here potential new policies are addressed which focus on combining resources and
constraints of different parties in order to make use of both’ strengths. This is done because of the
understanding that absentee and resident farmers or other parties in the supply chain are probably
not equally constrained in their resources. Two options for cooperation are introduced here.
The first one is the possibility of farmers making use of each other’s strengths. A common example of
this is sharecropping; where farmers produce on the land of others and the output is shared. In this
case land-constrained and labour-constrained farmers join their forces. In the research area
cooperation between labour constrained and capital constrained farmers could be promoted. For
example, resident farmers can receive a share of the output in exchange of labour input in the
orchards of absentee farmers when the last group is absent. Another option could be hiring a farm
manager by a group of absentee and resident farmers, so that income can be competitive with
market wages and metering (quality control) can be performed.
The second option is the potential of cooperation between farmers and companies in the supply
chain. Relationship and collaborations in the supply chain can adjust based on the requirements and
endowments of parties in the chain. For example, factories could manage labour inputs on the
orchards in return for (a share of) the increased profits. An option would be to let factory employees
prune in the orchards when the activity-levels in the factories are low. Also managing labour during
the harvest would secure that the nuts are not sold to other parties.
59
Chapter 7 Discussion
This thesis has two main findings. (1) The current uprooting policy does not cover the constraints of
investment of absentee farmers, and that therefore the influence of absenteeism on the
effectiveness is high. (2) Because of current excess production in the sector the government currently
has no motivation to stimulate productivity of agricultural lands.
The outcomes of this research provides us increased understanding about the importance of how
policies are structured for their effectiveness. Certain questions have to be answered in order to
understand the effectiveness for different farmer types. Does the policy offer farmers what they
require? Do they fit the situation and trends in the sector? Are there constraints which make it
impossible for farmers to make use of the policy? Policies have to be created focused on their
intended outcome and focused on the characteristics of the farmers. The outcomes have also
underlined the importance of creating good combinations of policies instead of policies that give
different incentives.
The methodology used is suboptimal, because the topic of this research was changed after return
from the research area. Thus, data was not collected directed to answering the research question.
Therefore, the conclusions are based on theories and models and are not proven in the research
area. Recommendation for a next study is to take this research as starting point and test conclusions.
In the research area, data was collected by semi-structured interviews with experts (government
officials, extension officers and university employees) and by structured - interviews with farmers.
Collecting information from experts is beneficial for the research as they have more overview on
trends rather than individual cases. I argue here that for data collection among farmers about costs,
prices, time spending et cetera, the methodology used for this research is suboptimal. Only having
one interview with a farmers and doing the research only in one period is not enough; answers
cannot be checked and quality of data cannot be guaranteed. Though more costly, a better system is
to research farmers in an area more structurally; so in a long term research where farmer and
researcher together document their information right after performance during a longer period (1-2
years minimum). This diminishes the estimation error.
The recommendation for research is to study the possibility of cooperation between parties in an
(agricultural) sector, in order to make use of the resources and strengths present and cover the
constraints. The potential of cooperation between capital constrained and labour constrained
farmers or cooperation between farmers and companies in the supply chain are interesting options.
Further recommendation
Collection of agricultural economic data requires considerable background knowledge of agronomy,
as agricultural outputs depend on many factors. The focus of the current research on the resource
labour and to a lesser extent farm decisions is possible to research. But studying inputs-output
relationships requires an agricultural economics or agronomy background. Therefore I would like to
recommend that such research is not performed by future development economics students.
60
Chapter 8 Conclusions
Based on analysis of data by using economic behaviour models and by studying trends in the market
the following is concluded;
Because of the irreversibility and fixed costs of investment related to tree crops farmers are
less reactive to trends in the market than farmers producing arable crops.
Based on financial data and labour inputs, other fruit crops (than hazelnut) were found to be
more profitable and time spending was found to be comparable. Several aspects were found
which can explain why many farmers still prefer to grow hazelnuts. The marketing channel of
the hazelnut crop is found to be most developed in the research area. The fruit crops require
cold storage, which is little present in the area. It was found that the fruit crops require
activities performed more spread in the year. This makes performing the activities more
difficult for absentee farmers. The apple crop is most susceptible to diseases in the area. As is
discussed in the following conclusions, the farmers can be unable to bear the investment of
starting a new crop. The last point put forward is the knowledge which is required for the
establishment and maintenance of the fruit crops.
Absenteeism has no influence on the uptake of the Direct Income Support. Productivity
increases can be lower because absentee farmers face labour constraints for applying inputs
which could have been bought with the money of the support.
The uprooting policy is intended to make farmers uproot their hazelnut orchards in areas
which also suit other crops and to diminish excess hazelnut stocks.
o Based on analysis of economic behaviour models it is concluded that current
uprooting policy does not cover the constraints of absentee- and resident farmers.
o Resident farmers mostly face liquidity constraints. The uprooting policy does address
liquidity constraints, but the level of support does not meet the requirements.
o On the other hand, absentee farmers are expected to face less liquidity constraints
of investment because of additional non-farm income sources. This would mean they
are better able to bear the investment. But these farmers mostly face labour and
monitoring constraints, which are not covered in the uprooting policy. Therefore the
influence of absenteeism on the effectiveness of the policy is concluded to be high.
o The effectiveness of the policy might be increased after covering the constraints
faced by (absentee) farmers. Therefore, new ways of cooperation in the sector are
proposed.
Currently the government does not intervene in the market (anymore) by setting support
prices and buying excess stocks. In this situation farmers are more susceptible to downward
price changes and marketing risks. The attractiveness of performance of activities can change
as a reaction to trends in the sector and wider economy.
o In case of lower prices and increased marketing risks it is found that farmers use less
labour inputs for productivity improving activities, and more labour inputs for
marketing activities. Thereafter two options are found to be possible. If farmers are
unable to invest, only productivity decreases. If farmers are able to invest, first
productivity decreases until the point is reached that investment in other crops is
more interesting to the farmer. Then (s)he will uproot and invest in another crop.
61
o Due to the option to delay, absenteeism influences the effectiveness of the policy by
making farmers to react on trends less fast. Growing hazelnuts becomes less
competitive to other crops. Farmers are expected to respond by investing later,
because of the influence of absenteeism on performance of farm activities (the
reasons are the shadow price of performing farm activities because of other income
sources and labour constraint of investment).
For countries with a monopoly position as Turkey in the hazelnut sector excess production is
not beneficial because the amounts produced by the country set prices in the world market.
This can balance hazelnut revenues in years with varying production output. If lesser nuts are
produced in the whole sector, farmers receive higher prices and vice versa. In the optimal
situation production occurs at the smallest area required (under high productivity), so the
rest of the area can be used for other crops. Because of current excess production in the
sector the government currently has no motivation to stimulate productivity of agricultural
lands. Therefore both the absence of productivity stimulation policies and the presence of
absentee farmers focusing on other income sources (and their combination) can be
important factors explaining the current productivity levels in the Turkish hazelnut sector.
Excess production in the sector is expected to diminish if the government does not intervene
in the market. If the government on top of that enables farmers to invest in other crops not
only total production in the Turkish hazelnut sector is expected to diminish, but fertile lands
can be used for the production of other crops as well.

62
References
Abel, A. B., & Eberly, J. C. (1994). A Unified Model of Investment under Uncertainty. American Economic Review, 84(5), 1369-1384.
Adaman, F., & Kaya, A. (2012). Social Impact of Emigration and Rural-Urban Migration in Central and Eastern Europe, Final Country Report Turkey. Gesellschaft für Versicherungswissenschaft und -gestaltung e.V. (GVG).
AgriFin. (2013). Warehouse receipt financing in agriculture in Africa. Retrieved 31-3-2014, from http://www.agrifinfacility.org/warehouse-receipt-financing-agriculture-africa
Alchian, A. A., & Demsetz, H. (1972). Production, Information Costs, and Economic Organization. The American Economic Review, 62(5), 777-795. doi: 10.2307/1815199
Bakewell, O. (2008). ‘Keeping Them in Their Place’: the ambivalent relationship between development and migration in Africa. [Third World Quarterly]. Third World Quarterly, 29(7), 1341-1358. doi: 10.1080/01436590802386492
Bakker, M. M., & van Doorn, A. M. (2009). Farmer-specific relationships between land use change and landscape factors: Introducing agents in empirical land use modelling. Land Use Policy, 26(3), 809-817. doi: http://dx.doi.org/10.1016/j.landusepol.2008.10.010
Barnum, H. N., & Squire, L. (1979). An econometric application of the theory of the farm-household. Journal of Development Economics, 6(1), 79-102.
Barnum, H. N., & Squire, L. (1979). A Model of an Agricultural Household: Theory and Evidence. Washington DC: The World Bank.
Bathelt, H., Malmberg, A., & Maskell, P. (2004). Clusters and knowledge: local buzz, global pipelines and the process of knowledge creation. Progress in Human Geography, 28(1), 31-56. doi: 10.1191/0309132504ph469oa
Becker, G. S. (1965). A Theory of the Allocation of Time. The Economic Journal, 75(299), 493-517. Binswanger, H. P., & Rosenzweig, M. R. (1986). Behavioural and Material Determinants of Production
Relations in Agriculture. Journal of development studies, 22(3), 502-539. Bozoğlu, M. (2013). Ondokuz Mayıs University, Samsun. Samsun University: Interview by author of
thesis. Burrell, A., & Kurzweil, M. (2007). Distortions to Agricultural Incentives in Turkey. (Agricultural
Distortions Working Paper 10). Chayanov, A. V. (1966). The Theory of Peasant Economy. Homewood, IL: Irwin. Cheshire, L., Willing, I., & Skrbiš, Z. (2013). Unrecognised Cosmopolitans: Mobility and Openness
Among Globally Engaged Family Farmers. [Mobilities]. Mobilities, 9(1), 84-103. doi: 10.1080/17450101.2013.796784
Crabtree, J. (2002). The impact of neo-liberal economics on peruvian peasant agriculture in the 1990s. [The Journal of Peasant Studies]. The Journal of Peasant Studies, 29(3-4), 131-161. doi: 10.1080/03066150412331311049
Dejanvry, A., Fafchamps, M., & Sadoulet, E. (1991). Peasant household behaviour with missing markets - some paradoxes explained Economic Journal, 101(409), 1400-1417. doi: 10.2307/2234892
Demirsoy, O., Güngör, F., Dalgiç, T., Akçay Terekçi, F., Hociyunuz, H., Gemrik, Y., . . . Güngör, İ. (18-9-2013). Ziraat Odası Çarşamba - Agricultural Chambers, Ministry of Agriculture. Çarşamba, Samsun province Interview by author of thesis.
Dillman, D. A., & Carlson, J. E. (1982). Influence of absentee landlords on soil erosion control practices. Journal of Soil and Water Conservation, 37(1), 37-41.
Drever, E. (1995). Using Semi-Structured Interviews in Small-Scale Research. A Teacher's Guide. Edinburgh. United Kingdom: Scottish Council for Research in Education.
63
Ellis, F. (1993). Peasant Economics, farm households and agrarian development. WYE studies in agricultural and rural development.
Escobar, A., Hailbronner, K., Martin, P., & Meza, L. (2006). Migration and Development: Mexico and Turkey. International Migration Review, 40(3), 707-718. doi: 10.2307/27645622
EU-Fruit-Juice-CSR-Platform. (2013). Fruit Juice Supply Chain Analysis - Europe. Consortium of UTZ Certified, AIJN, AZTI-Tecnicalia, IDH, and Sociability Retrieved from http://juicecsr.eu/wp-content/uploads/2013/09/CSR_Platform_Fruit_supply_research.pdf.
GAIN. (2009). Turkey Tree Nut, Annual Report 2009. (TU9033 ). USDA Retrieved from http://gain.fas.usda.gov/Recent%20GAIN%20Publications/TREE%20NUTS%20ANNUAL_Ankara_Turkey_10-6-2009.pdf.
Gönenç, S., Tanrıvermi, s., H., & Bülbül, M. (2006). Economic Assessment of Hazelnut Production and the Importance of Supply Management Approaches in Turkey. Journal of Agriculture and Rural Development in the Tropics and Subtropics, 107(1), 19-32.
Halfacree, K. H., & Rivera, M. J. (2012). Moving to the Countryside ... and Staying: Lives beyond Representations. Sociologia Ruralis, 52(1), 92-114. doi: 10.1111/j.1467-9523.2011.00556.x
Hill, R. V. (2010). Investment and Abandonment Behavior of Rural Households: An Empirical Investigation. American Journal of Agricultural Economics, 92(4), 1065-1086. doi: 10.1093/ajae/aaq055
Himelrick, D. G., & Powell, A. (1998). Kiwifruit Production Guide. Auburn University: Department of Horticulture.
Holden, S. T. (1993). Peasant household modelling: Farming systems evolution and sustainability in northern Zambia. Agricultural Economics, 9(3), 241-267. doi: http://dx.doi.org/10.1016/0169-5150(93)90050-M
Hütz-Adams, F., & Firtina, C. (2012). Haselnüsse aus der Türkei - Ökologische und soziale Probleme beim Anbau.
İleri, Y. (18-9-2013). Pensioned government officer and peach grower. Çarşamba, Samsun province: Interview by author of thesis.
Ishemo, A., Semple, H., & Thomas-Hope, E. (2006). Population mobility and the survival of small farming in the Rio Grande Valley, Jamaica. Geographical Journal, 172(4), 318-330.
Kayalak, S., & Özçelik, A. (2012). Türkiye’de ve dünyada fındık politikaları. Tarım Ekonomisi Dergesi, 18(2), 43-53.
Kılıς, O., Avni Cinemre, H., Ceyhan, V., & Bozoğlu, M. (2006). Alternative Farm Plan for Controlling Hazelnut Supply in Turkey. Agricultural Economics and Rural Development, 11(12), 85-94.
Kung, J. K.-s., Wu, X., & Wu, Y. (2012). Inequality of land tenure and revolutionary outcome: An economic analysis of China's land reform of 1946–1952. Explorations in Economic History, 49(4), 482-497. doi: http://dx.doi.org/10.1016/j.eeh.2012.07.001
Lin, J. Y. (1988). The Household Responsibility System in China's Agricultural Reform: A Theoretical and Empirical Study. Economic Development and Cultural Change, 36(3), S199-S224.
Longworth, N. (2005). Agricultural Production, Prices and Trade: CABI Publishing, Wageningen University.
Low, A. R. C. (1986). Agricultural Development in Southern Africa - Farm-household economics and the food crisis (1st ed.). London: Jamer Curry Ltd.
Lundell, M., Lampietti, J., Pertev, R., Pohlmeier, L., Akder, H., Ocek, E., & Jha, S. (2004). Turkey, A Review of the Impact of the Reform of Agricultural Sector Subsidization. Washington: The World Bank
Martin, P. L. (1991). The unfinished story: Turkish labour migration to Western Europe, with special reference to the Federal Republic of Germany. . Geneva: International Labour Office.
Mather, C. (2000). Foreign Migrants in Export Agriculture: Mozambican Labour in the Mpumalanga Lowveld, South Africa. Tijdschrift voor economische en sociale geografie, 91(4), 426-436. doi: 10.1111/1467-9663.00128
64
Mbonile, M. J. (2003). Absentee Farmers and Change of Land Management on Mount Kilimanjaro, Tanzania. LUCID, Land Use Change Analysis as an Approach for Investigating Biodiversity Loss and Land Degradation Project. (pp. 17): ILRI, UNEP, GEF, University of Dar es Salaam.
MGM. Weather conditions in Turkey. Retrieved 17-1-2014, from http://www.mgm.gov.tr/veridegerlendirme/il-ve-ilceler-istatistik.aspx?m=SAMSUN
MOA. (2014). Overview of Supports. Retrieved 17-3-2014, from http://www.tarim.gov.tr/Sayfalar///IceriklerDetay.aspx?rid=1252&NodeValue=481&KonuId=481&ListName=Icerikler
MOAS. (02-2013). Agricultural Investment Guide. Samsun Province: Ministry of Food, Agriculture and Livestock
MOAS. (2013a). “Samsun ili ürün dağılım haritası” (Samsun province production distribution map). Samsun, Received at 27-8-2013.
MOAS. (2013b). “Samsun ili yıllar itibariyle findik desteği cetveli” (Samsun province years hazelnut support table) Samsun, Received at 27-8-2013.
MOAS. (INCLUDE). ‘fruit production Samsun 2012 division of crops’ & Samsun_Tarim_2012_yili. Mollett, J. (1991). Migrants in Agricultural Development: A Study of Intrarural Migration.
Basingstoke: MacMillan Press. Nakajima, C. (1986). Subjective Equilibrium Theory of the Farm Household. Amsterdam: Elsevier. NCAES, Boyette, M. D., Wilson, L. G., & Estes, E. A. Postharvest Cooling and Handling of Apples.
Retrieved 16-1-2014, from http://www.bae.ncsu.edu/programs/extension/publicat/postharv/ag-413-1/
Oskam, A., Longworth, N., & Yildiz, A. (2005). Turkey’s Economy and Regional Income Distribution. In A. M. Burrell & A. J. Oskam (Eds.), Turkey in the European Union, Implications for Agriculture, Food and Structural Policy: CABI Publishing, Wageningen University.
Öztürk, M. (16-9-2013). Agricultural Engineer, Elma Üreticileri Birliği (Apple & Hazelnut Producer Group). Terme, Samsun province: Interview by author of thesis.
Petrzelka, P., & Marquart-Pyatt, S. (2011). Land tenure in the U.S.: power, gender, and consequences for conservation decision making. [Agriculture and Human Values]. 28(4), 549-560. doi: 10.1007/s10460-011-9307-0
Poincelot, R. (2004). Sustainable Horticulture: today and tomorrow: Library of Congress Cataloging-in-Publication Data.
Resmi-gazete-27856. (2011). Bakanlar Kurulu Karari, Resmi gazete Sayı. 27856 (Decision of Council of Ministers, Government publication nr. 27856). Retrieved from http://www.resmigazete.gov.tr/eskiler/2011/02/20110224-5.htm.
Resmi-gazete-28557. (2013). Bakanlar Kurulu Karari, Resmi gazete Sayı. 28557 (Decision of Council of Ministers, Government publication nr. 28557). Retrieved from http://www.resmigazete.gov.tr/eskiler/2013/02/20130212-7.htm.
Sahibinden. http://www.sahibinden.com/. Retrieved 13-3-2014 Şahin, M. (7-10-2013). President, Keşap Fındık Üreticileri Birliği (Keşap Hazelnut Producer Group)
Keşap, Giresun province: Interview by author of thesis. Saxena, N. C. (1992). Eucalyptus planting as a response to farm management problems faced by ‘on-
site’ and ‘off-site’ farmers. [Agroforestry Systems]. 19(2), 159-172. doi: 10.1007/bf00138506 Secer, A. (2008). An Investigation on Turkish Hazelnut Export Concentration. Journal of Applied
Sciences Research, 4(11), 1557-1560. Serttas, S. (2009)). Turkey Tree Nut, Annual Report 2009. (TU9033). GAIN (Global Agricultural
Information Network), USDA Retrieved from http://gain.fas.usda.gov/Recent%20GAIN%20Publications/TREE%20NUTS%20ANNUAL_Ankara_Turkey_10-6-2009.pdf.
SPO. (2000). The eighth five-year development plan: regional development expert committee report. Ankara (in Turkish).
65
SPO. (2001). Long term strategy eighth five-year development plan 2001-2005. Ankara. Stark, O., & Bloom, D. E. (1985). The New Economics of Labor Migration. The American Economic
Review, 75(2), 173-178. doi: 10.2307/1805591 Taylor, K. C., & Rushing, J. W. Harvesting and Handling Peaches. Retrieved 16-1-2014, from
http://www.ent.uga.edu/peach/peachhbk/harvest/harvestandhandle.pdf Temel, T. (2005). The Institutional Framework of Turkey and Turkish Agriculture. In A. M. Burrell & A.
J. Oskam (Eds.), Turkey in the European Union, Implications for Agriculture, Food and Structural Policy (pp. 27-56): CABI Publishing, Wageningen University.
Theobald, J. (2001). ‘Distant Lands’: The Management of Absentee Estates in Woodland High Suffolk, 1660–1800. Rural History, 12(01), 1-18. doi: doi:10.1017/S0956793300002247
Thomas-Hope, E. (1993). Population mobility and land assets in hill farming areas of Jamaica. Caribbean geography, 4(1), 49-63.
TÜIK. Turkish Statistical Institute website. Retrieved 27-1-2014 Tulum, Ö. (2009). Productivity and Profitability of Turkish Hazelnut Production. Paper presented at
the VIIth Internal Congress on Hazelnut Acta Horticulture 845. UCPTC, Crisosto, C. H., Mitcham, E. J., & Kader, A. A. Kiwifruit: Recommendations for Maintaining
Postharvest Quality. Retrieved 17-1-2014, from http://postharvest.ucdavis.edu/PFfruits/Kiwifruit/
UCSFP, J. A. B. (1990). Kiwifruit Production in California. Retrieved 17-1-2014 from http://sfp.ucdavis.edu/pubs/brochures/Kiwi/
Wertheim, S. J., & Goedegebure, J. (1988). De Teelt van Hazelnoten (Vol. 6): Consulentschap in algemene dienst voor de Fruitteelt in de volle grond Proefstation voor de Fruitteelt.
Wolleswinkel, A., & Weersink, A. (2001). Farmer emigration: the case of Dutch dairy farmers moving to Ontario. Livestock Production Science, 69(3), 197-205. doi: http://dx.doi.org/10.1016/S0301-6226(01)00174-9
Worldbank. (2000). Turkey: Economic reforms, living standards and social welfare study. ( 20029-TU). Washington DC.
Yavuz, F., Birinci, A., Peker, K., & Atsan, T. (2003). Econometric Modeling of Turkey’s Hazelnut Sector: Implications on Recent Policies. Turkish Journal for Agriculture, 29, 1-7.
66
Appendices
Appendix A - Historical policies and trends
In this appendix additional background information on the historical policies and trends is provided.
The sector has a long history of government support, with price support and input subsidies,
restrictions on planted area, payments for alternative crops, direct income support, and high border
protection (Burrell & Kurzweil, 2007), (Yavuz et al., 2003), (Kayalak & Özçelik, 2012). The 1930s and
1940 are used as a start because in this time interesting trends started. The period was characterized
by state control of the economy and public services (Burrell & Kurzweil, 2007):2). In this period
several product-oriented Agricultural Sales Co-operatives Unions (ASCUs) were establishedxxxvi,
among which Fıskobırlık for hazelnut in 1938. According to Burrell & Kurzweil the 1950s saw “a shift
towards more liberal domestic and external economic policies, which led to macroeconomic
instability and strong stabilization measures” (2007):2). In 1964 the government started with
hazelnut support prices and input subsidies for fertilizers and pesticides to encourage hazelnut
production and to raise producers’ incomes. Fıskobırlık was responsible for hazelnut purchasing of
the government (Secer, 2008):1557) and were also instrumental in channelling subsidised inputs to
farmers” (Burrell & Kurzweil, 2007):7-8). The level of the support prices was linked to politics
(Gönenç et al., 2006):23), as was the case in the State Economic Enterprises (SEE’s). “Agricultural
SEEs’ pricing policies tended to reflect the political cycle. In pre-election periods, increases in selling
prices were held below the rate of inflation, catching up only months later. Such practices were one
of many factors contributing to their losses” (Burrell & Kurzweil, 2007):7). The big rural population
had a considerable vote in Turkish politics.
After the economic crisis of the late 1970s, there was “a switch to export-led growth policies and
progressive trade liberalization” (Burrell & Kurzweil, 2007):2). In 1980, the Turkish government
undertook a major reform program to open the Turkish economy to international markets. Among
others, a Support and Price Stabilisation Fund (DFIF) was being established with a “revenue-raising
objective” (Burrell & Kurzweil, 2007):9). During its early years, the liberalization program achieved
considerable success in reducing external deficits and restoring economic growth (U.S. Library of
Congress). During the 1980s, the agricultural export regulations (including the ones for nuts) were
simplified. Finally they were completed in 1995” (Burrell & Kurzweil, 2007):10).
Burrell and Kurzweil described the following period in the later 1980s as being marked by “continuing
macroeconomic instability, with two major currency collapses and deep recessions” (2007:2). Heavy
support to the agricultural sector started in the latter 1980s (Burrell & Kurzweil, 2007):2). In the
1980’s the Government purchased approximately 50% of the total hazelnut production (Secer,
2008):1557) (see Table 23). Afterwards, due to policies real wages significantly improved in the
period 1988-1994. Agriculture shared in this trend, and saw its border protection and output
subsidies significantly increased” (Burrell & Kurzweil, 2007):2).
In the 1990s policies were introduced for controlling the area planted for hazelnuts (Burrell &
Kurzweil, 2007):13), meant to control the accumulation of hazelnut stock. The regulation was
enacted in 1995, but due to lack of funds it was not implemented (Yavuz et al., 2003):2). In the wider
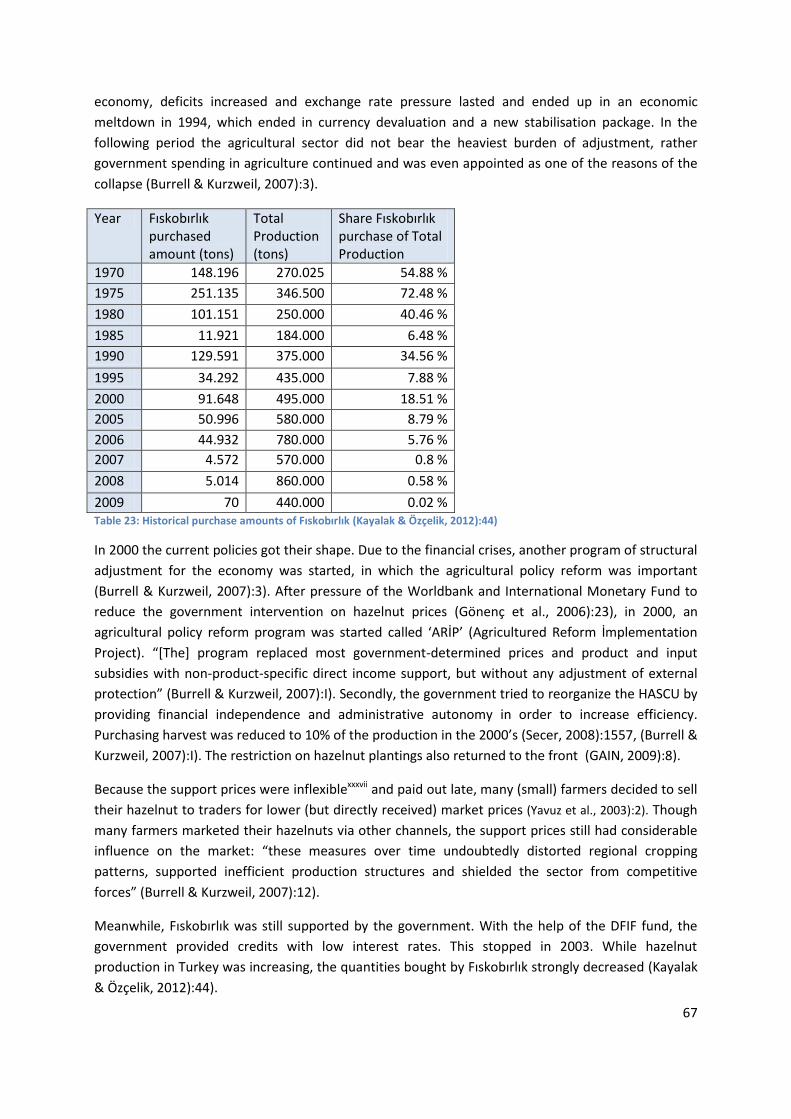
67
economy, deficits increased and exchange rate pressure lasted and ended up in an economic
meltdown in 1994, which ended in currency devaluation and a new stabilisation package. In the
following period the agricultural sector did not bear the heaviest burden of adjustment, rather
government spending in agriculture continued and was even appointed as one of the reasons of the
collapse (Burrell & Kurzweil, 2007):3).
Year Fıskobırlık purchased amount (tons)
Total Production (tons)
Share Fıskobırlık purchase of Total Production
1970 148.196 270.025 54.88 %
1975 251.135 346.500 72.48 %
1980 101.151 250.000 40.46 %
1985 11.921 184.000 6.48 %
1990 129.591 375.000 34.56 %
1995 34.292 435.000 7.88 %
2000 91.648 495.000 18.51 %
2005 50.996 580.000 8.79 %
2006 44.932 780.000 5.76 %
2007 4.572 570.000 0.8 %
2008 5.014 860.000 0.58 %
2009 70 440.000 0.02 % Table 23: Historical purchase amounts of Fıskobırlık (Kayalak & Özçelik, 2012):44)
In 2000 the current policies got their shape. Due to the financial crises, another program of structural
adjustment for the economy was started, in which the agricultural policy reform was important
(Burrell & Kurzweil, 2007):3). After pressure of the Worldbank and International Monetary Fund to
reduce the government intervention on hazelnut prices (Gönenç et al., 2006):23), in 2000, an
agricultural policy reform program was started called ‘ARİP’ (Agricultured Reform İmplementation
Project). “[The] program replaced most government-determined prices and product and input
subsidies with non-product-specific direct income support, but without any adjustment of external
protection” (Burrell & Kurzweil, 2007):I). Secondly, the government tried to reorganize the HASCU by
providing financial independence and administrative autonomy in order to increase efficiency.
Purchasing harvest was reduced to 10% of the production in the 2000’s (Secer, 2008):1557, (Burrell &
Kurzweil, 2007):I). The restriction on hazelnut plantings also returned to the front (GAIN, 2009):8).
Because the support prices were inflexiblexxxvii and paid out late, many (small) farmers decided to sell
their hazelnut to traders for lower (but directly received) market prices (Yavuz et al., 2003):2). Though
many farmers marketed their hazelnuts via other channels, the support prices still had considerable
influence on the market: “these measures over time undoubtedly distorted regional cropping
patterns, supported inefficient production structures and shielded the sector from competitive
forces” (Burrell & Kurzweil, 2007):12).
Meanwhile, Fıskobırlık was still supported by the government. With the help of the DFIF fund, the
government provided credits with low interest rates. This stopped in 2003. While hazelnut
production in Turkey was increasing, the quantities bought by Fıskobırlık strongly decreased (Kayalak
& Özçelik, 2012):44).
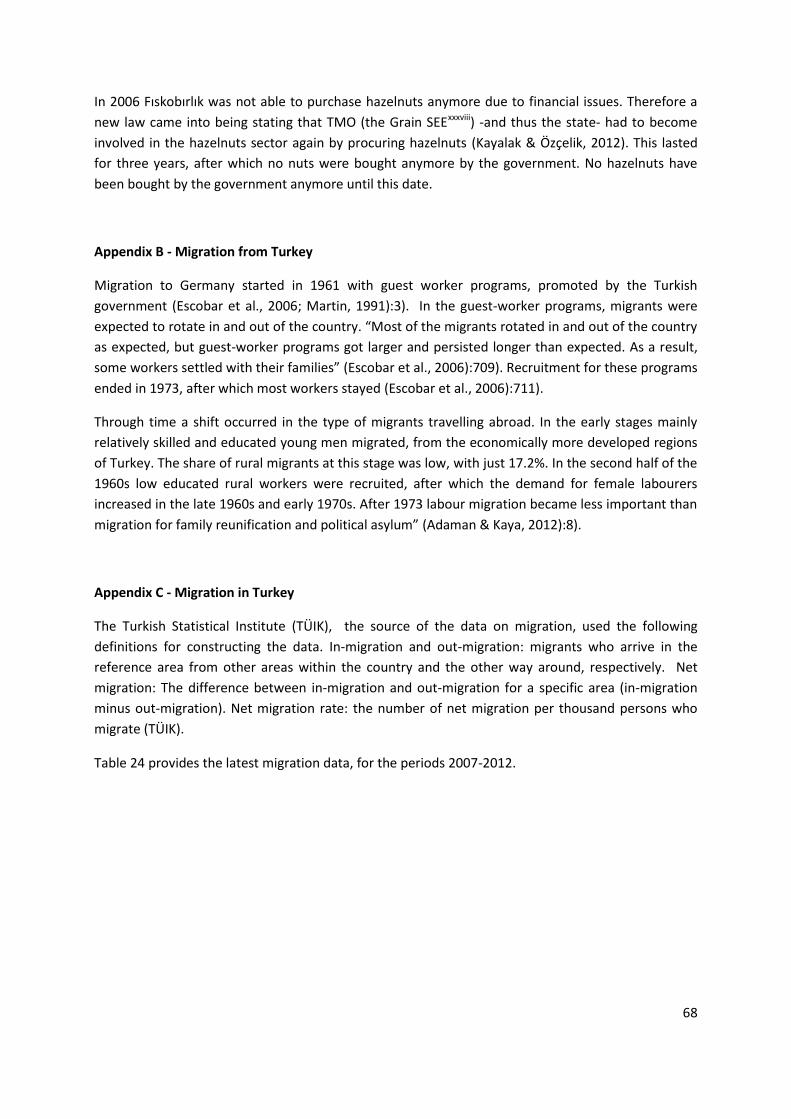
68
In 2006 Fıskobırlık was not able to purchase hazelnuts anymore due to financial issues. Therefore a
new law came into being stating that TMO (the Grain SEExxxviii) -and thus the state- had to become
involved in the hazelnuts sector again by procuring hazelnuts (Kayalak & Özçelik, 2012). This lasted
for three years, after which no nuts were bought anymore by the government. No hazelnuts have
been bought by the government anymore until this date.
Appendix B - Migration from Turkey
Migration to Germany started in 1961 with guest worker programs, promoted by the Turkish
government (Escobar et al., 2006; Martin, 1991):3). In the guest-worker programs, migrants were
expected to rotate in and out of the country. “Most of the migrants rotated in and out of the country
as expected, but guest-worker programs got larger and persisted longer than expected. As a result,
some workers settled with their families” (Escobar et al., 2006):709). Recruitment for these programs
ended in 1973, after which most workers stayed (Escobar et al., 2006):711).
Through time a shift occurred in the type of migrants travelling abroad. In the early stages mainly
relatively skilled and educated young men migrated, from the economically more developed regions
of Turkey. The share of rural migrants at this stage was low, with just 17.2%. In the second half of the
1960s low educated rural workers were recruited, after which the demand for female labourers
increased in the late 1960s and early 1970s. After 1973 labour migration became less important than
migration for family reunification and political asylum” (Adaman & Kaya, 2012):8).
Appendix C - Migration in Turkey
The Turkish Statistical Institute (TÜIK), the source of the data on migration, used the following
definitions for constructing the data. In-migration and out-migration: migrants who arrive in the
reference area from other areas within the country and the other way around, respectively. Net
migration: The difference between in-migration and out-migration for a specific area (in-migration
minus out-migration). Net migration rate: the number of net migration per thousand persons who
migrate (TÜIK).
Table 24 provides the latest migration data, for the periods 2007-2012.
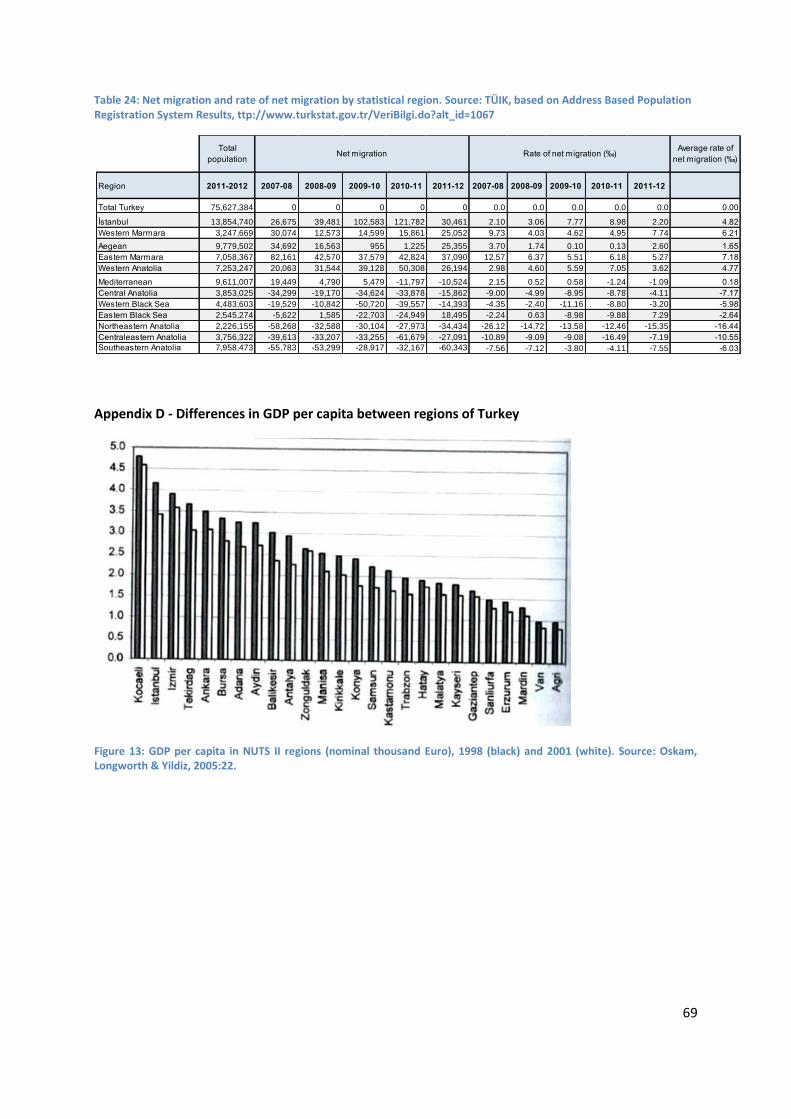
69
Table 24: Net migration and rate of net migration by statistical region. Source: TÜIK, based on Address Based Population Registration System Results, ttp://www.turkstat.gov.tr/VeriBilgi.do?alt_id=1067
Appendix D - Differences in GDP per capita between regions of Turkey
Figure 13: GDP per capita in NUTS II regions (nominal thousand Euro), 1998 (black) and 2001 (white). Source: Oskam, Longworth & Yildiz, 2005:22.
Region 2011-2012 2007-08 2008-09 2009-10 2010-11 2011-12 2007-08 2008-09 2009-10 2010-11 2011-12
Total Turkey 75,627,384 0 0 0 0 0 0.0 0.0 0.0 0.0 0.0 0.00
İstanbul 13,854,740 26,675 39,481 102,583 121,782 30,461 2.10 3.06 7.77 8.98 2.20 4.82
Western Marmara 3,247,669 30,074 12,573 14,599 15,861 25,052 9.73 4.03 4.62 4.95 7.74 6.21
Aegean 9,779,502 34,692 16,563 955 1,225 25,355 3.70 1.74 0.10 0.13 2.60 1.65
Eastern Marmara 7,058,367 82,161 42,570 37,579 42,824 37,090 12.57 6.37 5.51 6.18 5.27 7.18
Western Anatolia 7,253,247 20,063 31,544 39,128 50,308 26,194 2.98 4.60 5.59 7.05 3.62 4.77
Mediterranean 9,611,007 19,449 4,790 5,479 -11,797 -10,524 2.15 0.52 0.58 -1.24 -1.09 0.18
Central Anatolia 3,853,025 -34,299 -19,170 -34,624 -33,878 -15,862 -9.00 -4.99 -8.95 -8.78 -4.11 -7.17
Western Black Sea 4,483,603 -19,529 -10,842 -50,720 -39,557 -14,393 -4.35 -2.40 -11.16 -8.80 -3.20 -5.98
Eastern Black Sea 2,545,274 -5,622 1,585 -22,703 -24,949 18,495 -2.24 0.63 -8.98 -9.88 7.29 -2.64
Northeastern Anatolia 2,226,155 -58,268 -32,588 -30,104 -27,973 -34,434 -26.12 -14.72 -13.58 -12.46 -15.35 -16.44
Centraleastern Anatolia 3,756,322 -39,613 -33,207 -33,255 -61,679 -27,091 -10.89 -9.09 -9.08 -16.49 -7.19 -10.55
Southeastern Anatolia 7,958,473 -55,783 -53,299 -28,917 -32,167 -60,343 -7.56 -7.12 -3.80 -4.11 -7.55 -6.03
Total
population
Average rate of
net migration (‰)Rate of net migration (‰)Net migration
70
Appendix E
In this appendix some background information is provided about the models used.
Chayanov
In the Chayanov model, Y expresses the output or income created by the farm household. I shows
the utility lines of the household, expressing the combinations of labour and output creating the
same utility for the total household. The point where utility line I2 is horizontal shows the minimum
output or income requirements of the household. The TVP line is the production function.
Ellis has introduced a labour market and a market wage in the Chayanov theory, see Figure 4. In this
version a wage cost line (ww’) is added. “this wage cost line represents the opportunity cost to the
household of alternative uses of family labour time, namely, ‘home’ activity (i.e. household non-farm
activity), farm work, or wage work off farm” (Ellis, 1993):123-124). Home time has replaced leisure
days and includes both leisure and household non-farm activities; “activities associated with the daily
maintenance of the household” (Ellis, 1993):125). With the introduction of the wage cost line the
labour time spent on the farm is compared with market wage rates. In this situation the household
can decide whether to spend all its labour on the farm, make use of additional labour on the farm, or
hire out their labour and earn the market wage. Le shows the amount of labour which the family is
prepared to commit to farm production, “where the income (Y) which the household is prepared to
sacrifice for one more hour of home time (Z) is equated to the market wage. (...) Optimum labour use
in farm production is given by Lt, where the marginal product of labour equals the market wage”
(Ellis, 1993):125). In the case Lt is located more to the right than Le, the difference between them is
the amount of labour hired in by the household for farm work (see Ellis (1993), page 124 for the
related figure). In the research area the opposite situation is found; farmers do not hire in additional
labour to increase their farm output, but they prefer to spend their time on the labour market
instead on farm activities. This situation is shown in Figure 4; “the household is prepared to commit
Le hours of labour either to farm work or to wage work off the farm. In this case Le is greater than the
optimum level of labour use in farm production, Lt, and the difference between the two is the
amount of off-farm wage labour the household is prepared to supply to the labour market” (Ellis,
1993):125).
Model used by Hill
The model as used by Hill is also further discussed here. Hill has created four models of investment
(and abandonment) based on the following concepts. She works with some concepts;
Vt, which is the marginal unit of investment.
C, the unit cost of investment. This includes both the costs of establishing a new orchard as
the opportunity costs of the land giving no output for the years it takes until the new crop
first bears fruits.
Pt is the unit price of the crop.
Qt is the level of the capital stock. An important concept is the desired level of capital stock,
; the level of capital which equalizes Vt and C. Either investment or abandonment will
happen until this point is reached. The number of trees present is understood as the capital
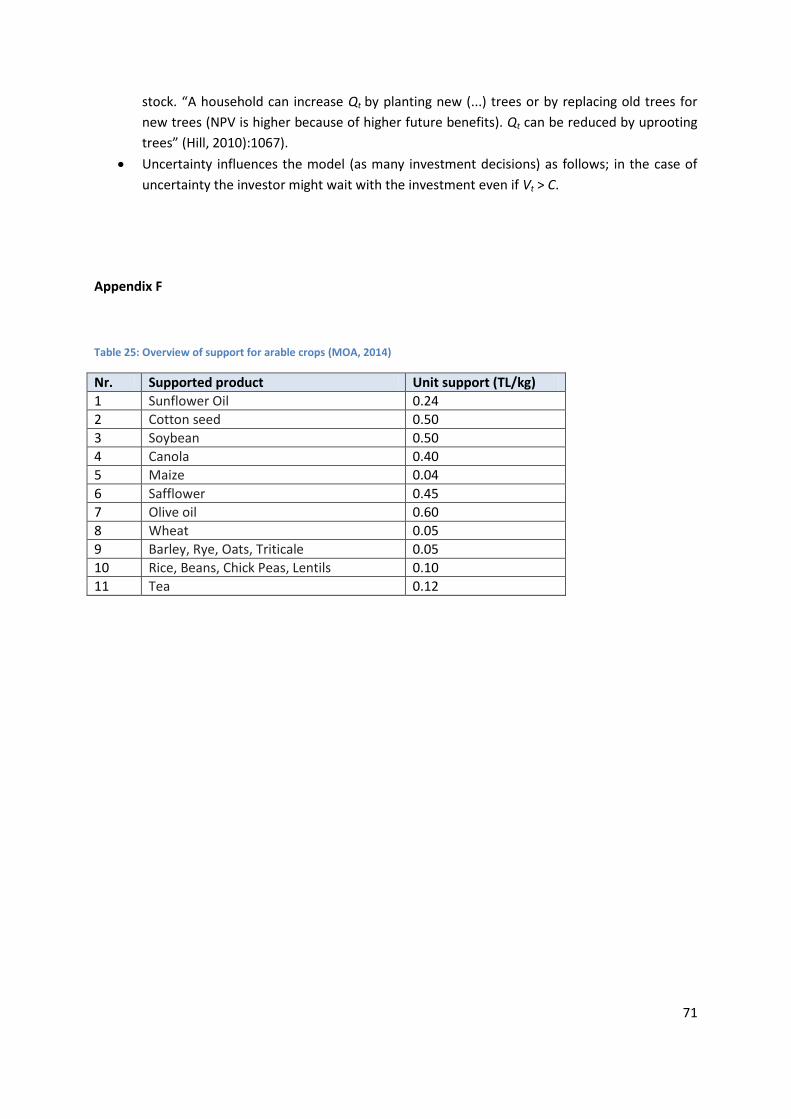
71
stock. “A household can increase Qt by planting new (...) trees or by replacing old trees for
new trees (NPV is higher because of higher future benefits). Qt can be reduced by uprooting
trees” (Hill, 2010):1067).
Uncertainty influences the model (as many investment decisions) as follows; in the case of
uncertainty the investor might wait with the investment even if Vt > C.
Appendix F
Table 25: Overview of support for arable crops (MOA, 2014)
Nr. Supported product Unit support (TL/kg)
1 Sunflower Oil 0.24
2 Cotton seed 0.50
3 Soybean 0.50
4 Canola 0.40
5 Maize 0.04
6 Safflower 0.45
7 Olive oil 0.60
8 Wheat 0.05
9 Barley, Rye, Oats, Triticale 0.05
10 Rice, Beans, Chick Peas, Lentils 0.10
11 Tea 0.12
72
Endnotes i Hazelnut production is important for Turkey’s economy. Hazelnut is “the main economic activity of nearly 400,000 households in the form of family farming in the Black Sea Region. (…)The hazelnut economy directly and indirectly supports 8 million people” (Gönenç, Tanrıvermi, & Bülbül, 2006):20). ii “Average over production** of hazelnut in the period 1970-2001 was 29,000 tons (raw), and during the last
ten years it averaged 48,000 tons. Due to the state’s support policies, Fiskobirlik’s hazelnut stocks increased to levels of 100,000 – 200,000 tons in some years. These stocks have either been sent/sold to other government organizations or processed into oil. Processing, warehousing, general administrative and financial expenditures for these hazelnut stocks are high compared to the sales revenue from oil production. It is estimated that $150-200 million is being wasted each year for hazelnut oil production” (Worldbank, 2004:58). Over production is calculated by subtracting domestic consumption and exports from total production. iii “The Y-axis in the diagram above indicates the productivity in terms of annual yield per hectare and the X-axis
indicates the region. (…) The “Whiskers” on the ends of each box indicate the maximum and minimum annual productivity over a fourteen-year period. (…) Each box illustrates where 50% of the annual productivity occurred in the 14-year period. A wider whisker and box range indicates significant change in the productivity annually, and a narrow range indicates more consistent productivity over the period” (Tulum, 2009):735) “The data used to perform the diagrams and the plot-size graph were gathered from the producers’ cooperative union (Fiskobirlik) and national and international industry trade associations (ITA), Turkish Department of Agriculture and Forestry (DAF), Turkish Department of Foreign Trade (DFT), Turkish Statistical Institute’s (Turkstat) 2001 Agriculture Census” (Tulum, 2009):735). iv See (Dillman and Carlson (1982); Petrzelka and Marquart-Pyatt (2011)), for example also on sharecropping.
v Some researchers have focused attention on migratory trends among farming and rural populations such as
(Mather, 2000), (Wolleswinkel & Weersink, 2001), (Halfacree & Rivera, 2012) and (Mollett, 1991) (derived from (Cheshire et al., 2013)) vi With migrants now being seen as ‘agents of development’ (Bakewell, 2008):1341).
vii
Next to the topic being outside the reach of this research, historically remittances to Turkey have been relatively low compared to remittances to other countries (Escobar et al., 2006). ix “A more sophisticated formulation of risk/uncertainty preferences would require detailed information on the
probability of all possible outcomes (or more correctly the peasants’ subjective assessment). It would also require explicit studies on actual attitudes towards risk among peasants in the study area” (Holden, 1993):252). x ‘Findik Üretimine Izin Verilecek Ilçeler’ are the areas called where hazelnut production is allowed.
xi Yellow: grain, Red: hazelnut, Light blue: rice, in the hazelnut area some other areas can be distinguished:
purple: various vegetables, green in hazelnut area: peaches. xii
This is explained as follows by Holden: “He developed the theory so as to make it relevant for the analyses of the farm firms, commercial farms, farm households and subsistence farms” (Holden p.244-245). xiii
As Low puts forward in his book on economics of farm household in Southern Africa, the focus away from self sufficiency is less applicable in the area of his research as a “considerable proportion of a farm-household’s time is taken up with non-market activities” (1986)31-32). xiv
Of Chayanov (1966), Nakajima (1986) and H.N. Barnum and L. Squire (1979). xv
Holden also includes the assumption of increasing marginal disutility of labour input.
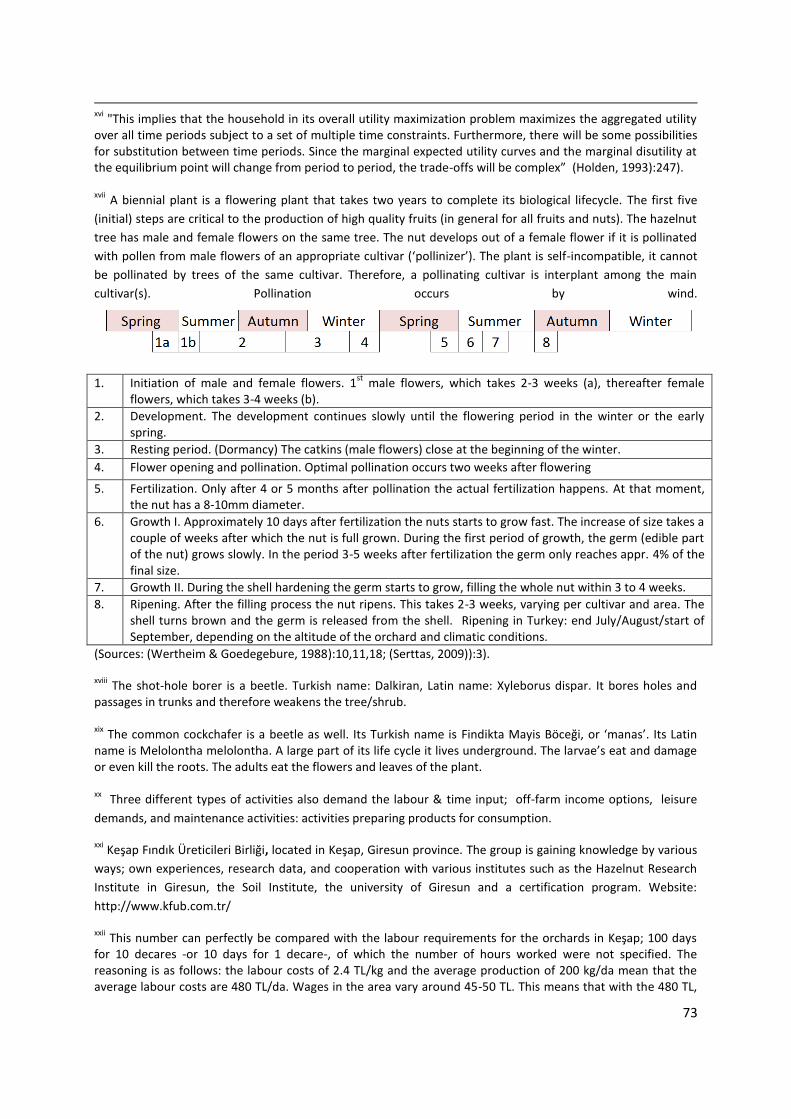
73
xvi
"This implies that the household in its overall utility maximization problem maximizes the aggregated utility over all time periods subject to a set of multiple time constraints. Furthermore, there will be some possibilities for substitution between time periods. Since the marginal expected utility curves and the marginal disutility at the equilibrium point will change from period to period, the trade-offs will be complex” (Holden, 1993):247). xvii
A biennial plant is a flowering plant that takes two years to complete its biological lifecycle. The first five
(initial) steps are critical to the production of high quality fruits (in general for all fruits and nuts). The hazelnut
tree has male and female flowers on the same tree. The nut develops out of a female flower if it is pollinated
with pollen from male flowers of an appropriate cultivar (‘pollinizer’). The plant is self-incompatible, it cannot
be pollinated by trees of the same cultivar. Therefore, a pollinating cultivar is interplant among the main
cultivar(s). Pollination occurs by wind.
1. Initiation of male and female flowers. 1st
male flowers, which takes 2-3 weeks (a), thereafter female flowers, which takes 3-4 weeks (b).
2. Development. The development continues slowly until the flowering period in the winter or the early spring.
3. Resting period. (Dormancy) The catkins (male flowers) close at the beginning of the winter.
4. Flower opening and pollination. Optimal pollination occurs two weeks after flowering
5. Fertilization. Only after 4 or 5 months after pollination the actual fertilization happens. At that moment, the nut has a 8-10mm diameter.
6. Growth I. Approximately 10 days after fertilization the nuts starts to grow fast. The increase of size takes a couple of weeks after which the nut is full grown. During the first period of growth, the germ (edible part of the nut) grows slowly. In the period 3-5 weeks after fertilization the germ only reaches appr. 4% of the final size.
7. Growth II. During the shell hardening the germ starts to grow, filling the whole nut within 3 to 4 weeks.
8. Ripening. After the filling process the nut ripens. This takes 2-3 weeks, varying per cultivar and area. The shell turns brown and the germ is released from the shell. Ripening in Turkey: end July/August/start of September, depending on the altitude of the orchard and climatic conditions.
(Sources: (Wertheim & Goedegebure, 1988):10,11,18; (Serttas, 2009)):3).
xviii The shot-hole borer is a beetle. Turkish name: Dalkiran, Latin name: Xyleborus dispar. It bores holes and
passages in trunks and therefore weakens the tree/shrub. xix
The common cockchafer is a beetle as well. Its Turkish name is Findikta Mayis Böceği, or ‘manas’. Its Latin name is Melolontha melolontha. A large part of its life cycle it lives underground. The larvae’s eat and damage or even kill the roots. The adults eat the flowers and leaves of the plant. xx
Three different types of activities also demand the labour & time input; off-farm income options, leisure
demands, and maintenance activities: activities preparing products for consumption.
xxi Keşap Fındık Üreticileri Birliği, located in Keşap, Giresun province. The group is gaining knowledge by various
ways; own experiences, research data, and cooperation with various institutes such as the Hazelnut Research
Institute in Giresun, the Soil Institute, the university of Giresun and a certification program. Website:
http://www.kfub.com.tr/
xxii This number can perfectly be compared with the labour requirements for the orchards in Keşap; 100 days
for 10 decares -or 10 days for 1 decare-, of which the number of hours worked were not specified. The reasoning is as follows: the labour costs of 2.4 TL/kg and the average production of 200 kg/da mean that the average labour costs are 480 TL/da. Wages in the area vary around 45-50 TL. This means that with the 480 TL,
74
approximately 10.10 daily wages (480/47.5) can be paid. As 45-50 TL are the wages for a full working day (+/- 8 hours) in the area, 8-hour working days can be used for the comparison. xxiii
This number is retrieved from Table 3. The outcome of the questionnaire for the average production in 2013 is 105.9 kg per decare, which is close to the average used here. xxiv
The difference between prices is based on the statement of Mr. Şahin (7-10-2013) that they receive 10% higher prices. It is assumed that because not only quantity but also quality would increase by following the same production methods, this would also happen in the research area. xxv
Increased efficiency (lower relative costs with higher production) is not included. xxvi
The same proportions as in Keşap are assumed. xxvii
The average size of the orchard of Samsun is based on the short questionnaires, of Keşap is calculated based on the interview held with Mr. Şahin (7-10-2013) (=3500 decares of 110 farmers). xxviii “Meter means to measure and also to apportion. One can meter (measure) output and one can also meter (control) the output” (Alchian & Demsetz, 1972):778). xxix
(Binswanger & Rosenzweig, 1986) created six assumptions (the presence of risk and costs of information and four behavioural assumptions fitting this thesis) and also discussed their consequences. The assumptions can be found on page 507 of their article. xxx
These regions are called ‘Findik Üretimine Izin Verilecek Ilçeler’ in Turkey (Resmi-gazete-27856, 2011). xxxi
The government does have a policy with which they can contribute 50% of the investment if a farmer
decides to invest in cold storage (Soğuk Hava Deposu in Turkish) until TL 150,000 for individuals and TL 600,000
for legal bodies (translated from (MOAS, 02-2013):19).
xxxii
The difference with hazelnuts is that the temperature has to be low, 0°C for kiwi and peach (UCPTC,
Crisosto, Mitcham, & Kader) Taylor & Rushing, 2014), and between -1 and 4⁰C for apples, depending on the
variety (NCAES). Additionally, the kiwi crop should not be stored with other crops that secrete ethylene, as this
hastens ripening (UCSFP). As average temperatures are between 23.4 ⁰C in August and 12.4⁰C in November
and on average 7.8 ⁰C between December and March (MGM) in the Samsun province, cooled warehouses are a
necessity if farmers want to store their crop in order to wait for better prices in the case of apples and kiwis or
if they want to keep their peach crop in optimal condition right after harvest.
xxxiii Average commercial apple yield in Turkey 17,460 kg/hectare (in 2002) – 23,100 kg/hectare (in 2012) (EU-
Fruit-Juice-CSR-Platform, 2013):7) based on reports Turkish Ministry of Agriculture (2013) Plant Production Head Office Formal Report). As the apple crop was introduced in the research area much later than in the major apple production areas, apple yields are assumed to be lower here. The yields of 2002 are used for calculations therefore. xxxiv
Prices are retrieved from the land market website (Sahibinden) http://www.sahibinden.com/ on 13-3-2014. xxxv
In order to see it the following trick can be applied; shifting to the right from the vertical axis it can be seen that distance of the lines to the horizontal axis grow less strong than when shifting to the left from the vertical axis. xxxvi
The ASCUs contributed in marketing activities and from the second half of the twentieth century they also played a key role in implementation of agricultural policies (Burrell & Kurzweil, 2007:7)
75
xxxvii
“Support prices were announced after planting, and payments were usually made one year or more after harvest and delivery. (...) Once announced, support prices could not be adjusted for changes in market conditions during the growing season or post-harvest, and many did not reflect differences in product quality. SEEs had to act as guaranteed buyer of last resort, so that when purchases exceeded storage or processing capacity, they made distress sales on the world market. (...) The short-run production incentives provided by these payments were weakened by the timing of the price announcement, and by the fact that high rates of inflation throughout the period eroded their value and exacerbated real price uncertainty” (Burrell & Kurzweil, 2007:12-13). xxxviii
“A key group of institutional players in the agricultural policy arena have been the state economic enterprises (SEEs). It is important to note that SEEs flourished extensively throughout the Turkish economy during most of the period under review, until the recent wave of full or partial privatizations. In agriculture, the earliest SEEs date from the 1930s [such as] TMO for grains. (...) SEEs carried out manufacturing and commercial activities on behalf of the state, in line with strategic plans and annual directives from relevant government bodies. (...) The trading losses and capital needs of these organisations were regularly met from public funds. For the years 1991-95, the annual average duty losses of TMO, and [two other SEEs] taken together were USD 622 million, and they rose to an annual average of over USD 1.7 billion during 1996-2001. The government began writing off the debt of agricultural SEEs in the mid-1990s” (Burrell & Kurzweil, 2007:7). One factor explaining the losses was the pricing system in pre-election periods (Burrell & Kurzweil, 2007).