msci investor deck 5.4.21.uploaded
TRANSCRIPT

MSCI Inc.
May 4, 2021
INVESTOR PRESENTATION

Table of Contents
2
1 3
2 4
Company overview
Financial review
Segment highlights
Appendix

Forward-Looking Statements
3
• This presentation contains forward-looking statements within the meaning of the Private Securities Litigation Reform Act of 1995, including without limitation, MSCI’s full-year 2021 guidance. These forward-looking statements relate to future events or to future financial performance and involve known and unknown risks, uncertainties and other factors that may cause our actual results, levels of activity, performance or achievements to be materially different from any future results, levels of activity, performance or achievements expressed or implied by these statements. In some cases, you can identify forward-looking statements by the use of words such as “may,” “could,” “expect,” “intend,” “plan,” “seek,” “anticipate,” “believe,” “estimate,” “predict,” “potential” or “continue,” or the negative of these terms or other comparable terminology. You should not place undue reliance on forward-looking statements because they involve known and unknown risks, uncertainties and other factors that are, in some cases, beyond MSCI’s control and that could materially affect actual results, levels of activity, performance or achievements.
• Other factors that could materially affect actual results, levels of activity, performance or achievements can be found in MSCI’s Annual Report on Form 10-K for the fiscal year ended December 31, 2020 filed with the Securities and Exchange Commission (“SEC”) on February 12, 2021 and in quarterly reports on Form 10-Q and current reports on Form 8-K filed or furnished with the SEC. If any of these risks or uncertainties materialize, or if MSCI’s underlying assumptions prove to be incorrect, actual results may vary significantly from what MSCI projected. Any forward-looking statement in this presentation reflects MSCI’s current views with respect to future events and is subject to these and other risks, uncertainties and assumptions relating to MSCI’s operations, results of operations, growth strategy and liquidity. MSCI assumes no obligation to publicly update or revise these forward-looking statements for any reason, whether as a result of new information, future events, or otherwise, except as required by law.

Other Information
4
• Percentage changes and totals in this presentation may not sum due to rounding.
• Percentage changes refer to the comparable period in 2020, unless otherwise noted.
• Foreign currency exchange rate fluctuations reflect the difference between the current period results as reported compared to the current period results recalculated using the foreign currency exchange rates in effect for the comparable prior period. While operating revenues adjusted for the impact of foreign currency fluctuations includes asset-based fees that have been adjusted for the impact of foreign currency fluctuations, the underlying assets under management (“AUM”), which is the primary component of asset-based fees, is not adjusted for foreign currency fluctuations. More than three-fifths of the AUM are invested in securities denominated in currencies other than the U.S. dollar, and accordingly, any such impact is excluded from the disclosed foreign currency-adjusted variances.

Company overview

MSCI at a Glance
1Represents the aggregate of all related clients under their respective parent entity.
Provide products and
services that global investors can use to
build better portfolios for a better world
Must-have products and services
• Across asset classes for performance and risk• $1.7B+ Total Operating Revenue in 2020, up 9% YoY• Approx. $1.9B Total Run Rate as of 1Q21, up 18% YoY
4,400+ clients1 in 90+ countries as of 3/31/2021
• Across investment and trading spectrum• World’s most sophisticated investors use our products
and services
Strong performance and inclusive culture
• Global, multi-cultural workforce• Driving innovation for industry-leading solutions
3,728 talented employees globally as of 3/31/2021
• 30+ MSCI locations in 20+ countries • 65% and 35% of employees located in emerging
market and developed market centers, respectively• Extensive knowledge of the investment process
WHO WE ARE
WHAT WE DO

Our Strategy
7
Support the Investment Process Needs of our Clients with Highly Differentiated Solutions Supported by Best-in-Class Capabilities

Our Vision: An Increasingly Complex Investment Industry Creates Opportunity
8
Markets
• New geographies and markets are accessible
Choices
• Securities
• Instruments
• Asset classes
Vehicles
• Funds
• Co-investing
• Direct investments
Scale
• Investable assets growing as a percentage of global economies
• Increased allocations to private markets
Styles
• Factors
• ESG & Climate consideration
• Thematics and mega themes
Investors
• Proliferation of institutional and individual investors
100,000+ Public Equities
Millions Fixed Income Instruments
10,000+ Private Equity (PE) Funds
100,000+ PE-owned Companies
$10T Global Investment Properties
$650T Notional Derivatives Contracts
$120T+ Bank Assets
$100T Managed Assets MORE:

Our Mission: Solutions to Enable All Participants in the Investment Process
9
Enabling Banks, Broker Dealers, Exchanges, Custodians and Others Support Providers and Users
of Capital in the Investment Process
Enabling Corporates and Others Present their ESG, Climate and Other Data to Providers of Capital
Enabling Owners and Managers of Assets
Build Better Portfolios for a Better World
PROVIDERSOF CAPITAL
USERSOF CAPITAL
FINANCIALINTERMEDIARIES

Addressing Client Needs to Power Better Investment Decisions
10
• Research-driven insights into drivers of risk and performance
• Broad asset class coverage
• Innovative tools to help investment strategies to market
• Exceptional quality
• Reliability, technology and business continuity infrastructure
INVESTORSRELY ON MSCI FOR
Supporting Investors’ Needs in EveryPart of the Investment Cycle
DESIGNING STRATEGIES
Portfolio Construction Tools • Indexes
MANAGING STRATEGIES
Asset Allocation Models • Risk and Performance Models
EVALUATING STRATEGIES
Benchmarks • Performance Attribution Applications •Risk Analytics and Reporting

MSCI Data and Technology Capabilities
11
To Stay Ahead of Client Demands, MSCI Will Deliver Everything We Do “As a Service”
Proven Ability to Handle Complex, Integrated and High-volume Workflows withFlexible and Scalable Solutions for Client’s Today
Collect
200+Data Vendors
750+Data Products
29M+Securities Maintained Daily
Compute
240K+Indexes Calculated Daily
6.6B+Positions Processed in Analytics
in a Single Day
800B+Daily Instrument Pricings
Deliver
500+APIs across All Product Lines
12Proprietary Applications at MSCI
30+Third-Party Distribution Partners
Clean and Enhance
Process and Enrich
Note: Information as of February 24, 2021.
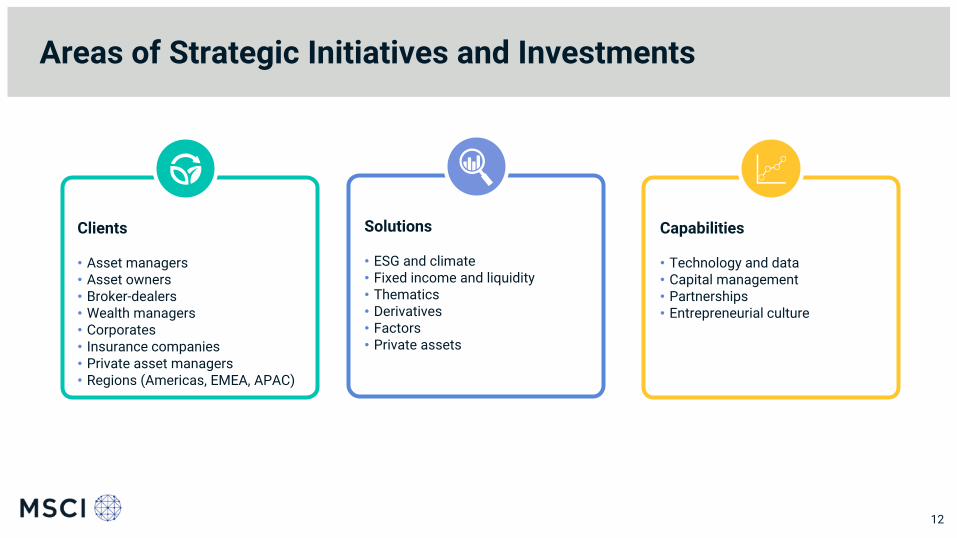
Areas of Strategic Initiatives and Investments
12
Solutions
• ESG and climate • Fixed income and liquidity • Thematics• Derivatives • Factors• Private assets
Clients
• Asset managers• Asset owners• Broker-dealers• Wealth managers• Corporates• Insurance companies• Private asset managers• Regions (Americas, EMEA, APAC)
Capabilities
• Technology and data• Capital management• Partnerships• Entrepreneurial culture

Continued Progress on MSCI Corporate Responsibility
13
1) TCFD: Taskforce on Climate-Related Financial Disclosure2) MSCI announcement made on April 19, 20213) United Nations Sustainable Development Goals4) Diversity, Equality & Inclusion
https://www.msci.com/who-we-are/corporate-responsibility/sustainability-reports-policies
Further Enhancing our Commitments, Processes and Disclosures
TCFD1
Supporter
Net Zero Commitment before 20402
Announced our commitment to
UN SDGs3
Senior Management
Compensation Linked to DE&I4
Corporate Responsibility Pillars

Robust and Compelling Financial Model
14
Recurring, visible revenue model~97% or higher recurring revenues1 as percent of total revenue from 2016 –1Q21
Operating efficiency strengthDisciplined operating expense management
Triple-Crown investment opportunities to grow businessInvesting in multiple strategic product areas, client segments and capabilities, including technology and partnerships, to drive growth
Attractive cash generation profileOur business is not highly capital intensive and, as such, we convert a high percentage of our profits into excess cash
Strong balance sheet and liquidityTotal cash and equivalents of ~$1.2B2 as of March 31, 2021
1Recurring Revenues include recurring subscription and asset-based fees revenues.2Pro-forma for redemption of all $500.0 million aggregate principal amount of 4.750% senior unsecured notes due 2026, completed on April 12, 2021.

Financial review

Delivering growth across key metrics
16
27% CAGRFree Cash Flow ($m)
$400 $355
$564 $656
$760 $863
2016 201920182017 2020 TTM 3/31/2021
$569 $660
$772 $850 972 $1,019
2016 2017 TTM 3/31/2021
202020192018
Adjusted EBITDA ($m)
$3.03 $3.98
$5.35 $6.44
$7.83 $8.39
201920182016 2017 2020 TTM 3/31/2021
Adjusted Earnings Per Share
15% CAGR
20% CAGR
$1,151 $1,274 $1,434 $1,558 1,695 $1,757
20172016 20202018 2019 TTM 3/31/2021
Revenue ($m)11% CAGR
Cumulative(1)
TTM 3/31/2021
1Represents sum of Adjusted Earnings per Share recorded in full-year 2020, the three months ended March 31, 2021 less the three months ended March 31, 2020.

Reflecting continued business growth
17
ESG & Climate
Analytics
All Other – Private Assets
Index
72.8% 72.8% 75.4% 75.8%
$1,060
20192018 TTM 3/31/20212020
$835 $921 $1,016
Segment Adjusted EBITDA Margin Segment Revenue
29.9% 30.6%33.7% 34.9%
2018
$480 $522$497 $514
2019 2020 TTM 3/31/2021
11% CAGR
4% CAGR
(US $ in millions)
22.4% 24.1%20.5% 20.1%
2019
$71$121
2020
$111$91
2018 TTM 3/31/2021
26%CAGR
10.4%13.0%
17.2% 17.5%
$54
TTM 3/31/2021
$47
20192018
$49 $54
2020
6%CAGR

Significant recurring revenue model with global client base
18
1Q21 Operating Revenue Mix by Segment
Index 61%
Analytics28%
ESG & Climate 7%
All Other – Private Assets 4%
RecurringSubscription
71%
Asset-Based Fees26%
Non-Recurring 3%
1Q21 Operating RevenueTotal Revenue by Type
MSCI Subscription Run Rate as of 3/31/2021 by Geography
Americas45%
APAC17%
EMEA38%
MSCI Subscription Run Rate as of 3/31/2021 by Client Base
Americas45%
EMEA38%Banks & Others
19%
Asset Managers57%
Hedge Funds9% Asset Owners
& Consultants10%
Wealth Management
5%

Strong balance sheet provides optionality
19
(US$ in millions, unless otherwise noted)
$500
$1,000 $900
$1,600
2021 2022 2023 2024 2025 2026 2027 2028 2029 2030 2031
$500M undrawn revolver5
Unsecured Debt Maturity Profile2
Cash1 and Debt as of 3/31/2021
• Total Cash of $1,747
• Total Debt3 of $3,866; Pro-Forma2 Total Debt of $3,963
• Net Debt of $2,119
• Pro-Forma Debt / TTM4 Adj. EBITDA of 3.9x
• Net Debt / TTM4 Adj. EBITDA of 2.1x
1MSCI typically seeks to maintain minimum cash balances globally of approximately $200.0 million to $250.0 million for general operating purposes2Pro-forma for redemption of all $500.0 million aggregate principal amount of 4.750% senior unsecured notes due 2026, completed on April 12, 2021, and pro-forma for issuance of$600.0 million of 3.625% senior unsecured notes due 2031which is expected to settle on May 14, 2021, subject to customary closing conditions, net of estimated deferred financing fees3Reflects gross debt, inclusive of deferred financing fees and premium. Includes current maturities of long-term debt of $496.4 million, which were redeemed on April 12, 20214Trailing twelve months5Aggregate commitments of $500.0 million until November 2024, at which point the aggregate commitments will be reduced to $467.5 million until March 2026
• Disciplined and consistent approach to deployment
- Triple-Crown framework to evaluate internal opportunities and MP&A (mergers, partnerships and acquisitions)
• Remaining capital returned to shareholders through dividends and opportunistic share repurchases
Moody's S&P Fitch
Outlook Stable Stable Stable
Long-term issuer rating
Ba1 BB+ BBB-
Senior unsecured Ba1 BB+ BBB-
Credit Ratings as of 4/29/2021:
Note: Credit ratings reflect the views of the different agencies and are not a recommendation to buy, sell or hold any security including our common stock or debt securities. These ratings are subject to periodic review and may be raised upward, downward or revoked at the sole discretion of the agencies.

Disciplined approach to capital deployment for shareholders
20
$97 $121
$172
$221 $247
$66
2016 2017 2018 2019 2020 1Q21
Dividends ($M)
• Meaningful dividend with strong historical growth
• Payout target of 40% – 50% of Adj. EPS
Opportunistic Share Repurchases Capitalizes on Attractive Values and Volatility
$4B+ of Share Repurchases since 2012
86
97 92
2016 2017
90
2018 2019
85
2020
83
1Q21
$759
$137
$925
$102
$727
$134
Weighted Average Diluted Shares Outstanding (in millions) Value of Shares Repurchased
Share Repurchase ($M)

Innovation and Investment in Key Growth Areas
Triple-Crown Investment Criteria
High Returns Projects must have a high return (ROI)
Quick Payback <3 YearsEarlier payback preferred
Strong ValuationPrefer investments with greater impact to MSCI’s valuation (segment multiple) with a particular focus on sustainability
ScaleExpand existing products and capabilities to accelerate growth
Examples:
• Innovative Factors & ESG Indexes
• ESG securities coverage expansion
• Expanding Futures and Options
EfficienciesAvoid and/or repurpose costs; achieve productivity gains
Examples:
• Cloud migration
• Streamline technology development
• Data process improvements
New GrowthDrive new business capabilities through new products and services
Examples:
• Climate and Corporates client segments
• Thematic Indexes
• Fixed income Indexes and ESG
Rigorous metric-driven approach to allocate capital across different business areas
21
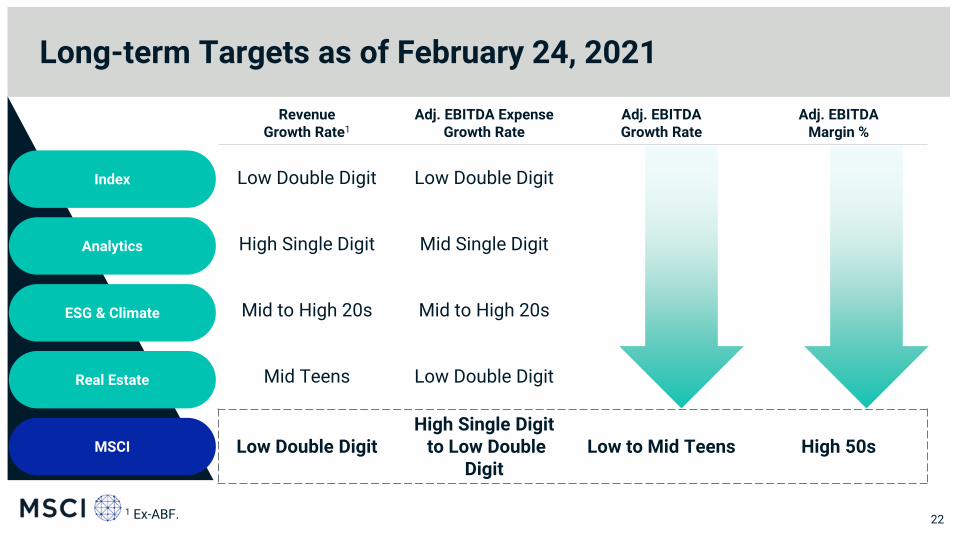
Long-term Targets as of February 24, 2021
221 Ex-ABF.
RevenueGrowth Rate1
Adj. EBITDA Expense Growth Rate
Adj. EBITDAGrowth Rate
Adj. EBITDAMargin %
Low Double Digit Low Double Digit
High Single Digit Mid Single Digit
Mid to High 20s Mid to High 20s
Mid Teens Low Double Digit
Low Double DigitHigh Single Digit
to Low Double Digit
Low to Mid Teens High 50s
Index
MSCI
Analytics
ESG & Climate
Real Estate

Full-Year 2021 Guidance as of April 27, 2021
23
Guidance Item Current Guidance for Full-Year 2021
Prior Guidance for Full-Year 2021
Operating Expense $885 to $920 million $870 to $895 million
Adjusted EBITDA Expense $795 to $825 million $780 to $800 million
Interest Expense (including amortization of financing fees)1 ~$150 million ~$150 million
Depreciation & Amortization Expense $90 to $95 million $90 to $95 million
Effective Tax Rate 15% to 18% 16% to 19%
Capital Expenditures $50 to $60 million $50 to $60 million
Net Cash Provided by Operating Activities$885 to $925 million $845 to $885 million
Free Cash Flow $825 to $875 million $785 to $835 millionNote: MSCI's guidance for 2021 is based on assumptions about a number of macroeconomic and capital market factors, in particular related to equity markets. These
assumptions are subject to uncertainty, and actual results for the year could differ materially from our current guidance, including as a result of ongoing uncertainty
related to the duration, magnitude and impact of the COVID-19 pandemic.
(1) Excludes incremental interest expense that will result from issuance of $600.0 million of 3.625% senior unsecured notes due 2031 which is expected to settle on
May 14, 2021, subject to customary closing conditions. Interest income will continue to be impacted by the lower rates available on cash balances.

Segment Highlights

Strong Subscription Run Rate Growth Across Businesses
25
Index (ex. ABF) AnalyticsAll Other –
Private Assets
(US$ in millions)
$380.4
$159.4$148.0
1Q211Q20
$397.6
$528.4 $557.05%
Equity Analytics
Multi-Asset Class Analytics
+8%
+5%
+5%Organic
+7%Organic
+11%Organic
+18%
+17%
+8%
1Q20
$71.1
$449.5
$83.4$53.6
$487.6
$63.5
1Q21
$574.1$634.6
11%
1Q20 1Q21
$49.7
$56.915%
$103.8
1Q20 1Q21
$147.3
42%
ESG & Climate
+39%Organic
Market Cap Weighted
Custom & Specialized
Factor & ESG

RESEARCH
Index: We are Uniquely Positioned to Meet the Industry’s Needs
26
STANDARDS
INDUSTRY FRAMEWORK
TECHNOLOGY
AITOP QUALITY
DATAMODELS
FACTORS
ANALYTICS
THEMATIC SCORES
ESG
By Leveraging Our Entire Firm, We Offer Clients a Comprehensive Toolset
We Offer Solutions Across:
Indexes for Portfolio
Management

Index: We Offer Simplicity, Modularity And Choice
27
In a Complex World, Meeting Client Demand with Top Quality Choices
An Index for Every Portfolio
Ready-Made
• Starting universe for portfolio building
• Indexes to integrate new strategies
• Strong product ecosystem
Customized
• Enable clients to customize indexes, bychoosing screens to overlay on the indexes
• Ingredients for self-build and modular building blocks
• Bespoke multi-strategy combinations
XReady-Made Indexes Customized Indexes

Helping Integrate Indexes at the Center of the Investment Process
28
InvestmentProcess
Define Investable Universe
Market Cap, Factor, Climate,ESG, Thematic
Asset Allocation
Benchmarking Performance
Reporting to Investors
Complying with Regulators
Indexes Customized for Risk Profile
Climate Risks and Opportunities
Derivatives for Hedging and Exposure Management
Exposure and Liquidity Management
Performance Attribution
Model Portfolios
GROWING ROLE OF INDEXES

Analytics: Significant Opportunities in Equity Portfolio Management: $1B+ TAM
Broad Adoption of Factors and Portfolio Customization Driving Growth
29
Asset Owners
Asset Managers
Hedge Funds andBroker Dealers
Growth Drivers Accelerators
Increasingly using Factors for portfolio construction and asset allocation
Integration of ESG and Climate in portfolio construction
Portfolio customization throughend user applications
• Client-facing applications
• ESG/climate/thematic integration
• Capabilities to customize indexes
Large consumers of model data to embed into their investment processes. Eager to consume all the new content we produce
Content distribution through APIs, partners and digital marketplaces

Analytics: Multi-Asset Class Solutions Well Positioned to Grow in a $2B+ TAM
Solving Two Critical Needs: Building MAC Portfolios and Managing Portfolios across Asset Classes
30
Multi-Asset ClassPortfolio Management
Multi-Asset ClassRisk Management
Growth Drivers Accelerators
Large demand for multi-asset solutionsfrom institutional andindividual investors
• Tools for multi-asset solution managers
• Asset allocation solutions forasset owners
• Mass portfolio personalization forwealth managers
Demand for solutions to new problems from asset managers and asset owners
Need to innovate, decrease complexity and achieve scale
• Solutions for liquidity, climate change,long horizon risk, private assetinvesting and new regulations
• Models and analytics through cloud-hosted APIs and integration withclients’ infrastructure
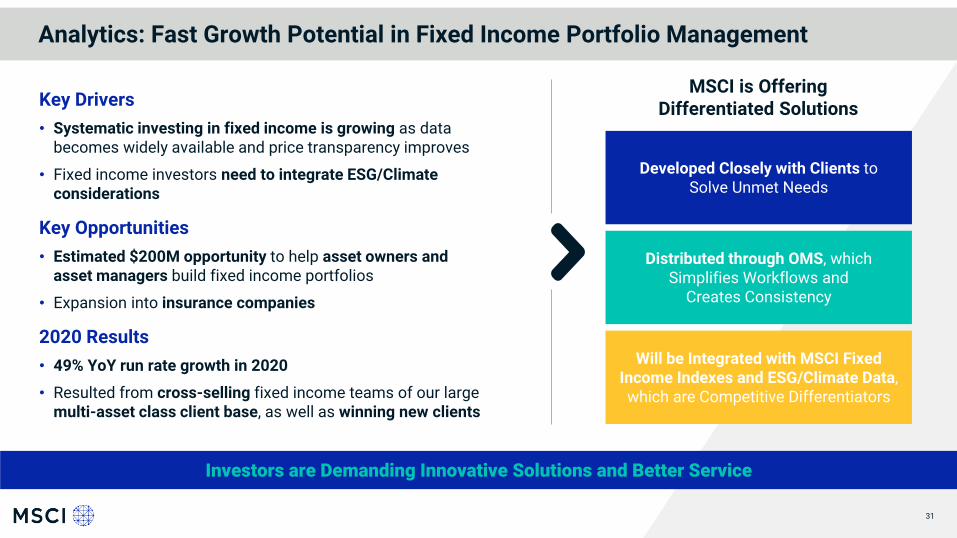
Analytics: Fast Growth Potential in Fixed Income Portfolio Management
Investors are Demanding Innovative Solutions and Better Service
31
Key Drivers
• Systematic investing in fixed income is growing as databecomes widely available and price transparency improves
• Fixed income investors need to integrate ESG/Climateconsiderations
Key Opportunities
• Estimated $200M opportunity to help asset owners andasset managers build fixed income portfolios
• Expansion into insurance companies
2020 Results
• 49% YoY run rate growth in 2020
• Resulted from cross-selling fixed income teams of our largemulti-asset class client base, as well as winning new clients
Developed Closely with Clients toSolve Unmet Needs
Distributed through OMS, which Simplifies Workflows and
Creates Consistency
Will be Integrated with MSCI Fixed Income Indexes and ESG/Climate Data, which are Competitive Differentiators
MSCI is OfferingDifferentiated Solutions

ESG & Climate: A Pioneer and Market Leader
1 Through MSCI legacy companies KLD, Innovest, IRRC, and GMI Ratings; 2 Source MSCI Inc. as of February 2021; 3 Data based on Refinitiv Universe as of December 2020, only primary listings, and not cross-listings; 4 MSCI ESG Research’s solutions are used by 48 of the top 50 world’s largest Asset Managers as determined by Willis Towers Watson report “The world’s largest 500 asset managers, Joint study with Pensions & Investments.” AUM and rankings calculated as of December 2019. Report published October 2020; 5 To calculate the number of clients, we use the shipping address of the ultimate customer utilizing the product, which counts affiliates, user locations or business units within a single organization as separate clients; 6 MSCI ESG Research’s climate solutions are used by 16 of the top 20 world’s largest Asset Managers as determined by Willis Towers Watson report “The world’s largest 500 asset managers, Joint study with Pensions & Investments.” AUM and rankings calculated as of December 2019. Report published October 2020; 7 Source: MSCI ESG Research as of February 20218 Data as of 30th September 2020, based on eVestment for Institutional funds, Morningstar for Retail funds and Refinitiv Universe for ETFs
Multiple Years of Creating a Comprehensive Ecosystem
32
Leadership in ESG Indexes
#1 ESG Index Provider by Equity ETF Assets Linked to its ESG Indexes3
$106B Linked to Equity ESG Assets3
70% of Equity ESG ETF Flows as of Q4’203
Leadership in ESG Ratings and Data
48 of the top 50 Asset Managers leverage MSCI ESG Research4
1,900+ MSCI ESG Research Clients5
Globally with Coverage of 14,800+ Issuers and 650,000+ Securities
Leadership in Climate Indexes
#1 Climate Index Provider by Equity Assets Linked to its Climate Indexes8
Our Solutions and Competitive Edge
• 45+ years experience in objectivelymeasuring and modeling ESGcharacteristics1
• 580+ ESG experts and technologistsproviding the most efficient investmentsignals
• 1,500+ MSCI ESG equity and fixedincome indexes2
• Extensive set of solutions for ESG andClimate integration
• Deep integration across MSCI productscatering to the investment value chain
Leadership in Climate Data & Analytics
Climate Data Provider to 16 of the World’s Top 20 Asset Managers6
700+ Climate Change Metrics, Covering 10,000+ Issuers7

ESG & Climate: Continued Growth Across Firmwide Franchise
33
2013 20142011
$106
$84
$25
$19$17
2020
$1
2010 2018
$17
$5$6
2012
$23
$254
$4$35
$40$5
2015
$40
$8
$49
$224
$12
2016
$79$65
$19
2017
$27
$146
$22 $101
$45
2019
$138$61
$86
$147
$107
1Q21
$18 $27
$48
ESG & Climate IndexesESG & Climate Research
2010-1Q21 CAGR:30%
Firmwide ESG & Climate Run Rate
Note: Includes ESG & Climate Research Run Rate, reported in the ESG & Climate segment, and ESG & Climate relatedIndex subscription and asset-based fees Run Rate reported in the Index segment.

ESG & Climate:Long Runway Ahead: Growing Opportunities with Existing and New Products
Note: Numbers based on internal estimates and projections. 34
MSCI Estimated Market Size for ESG Productsis Expected to Further
Expand to $3.9B Over the Near-term
$3.2BExisting Solutions
Future Solutions
$0.7BNew Solutions
Corporates
Bank Stress Testing
Climate
Potential for Additional Growth
Accelerating our solutions for new use cases
Private Assets
with an estimated market of $0.7B

ESG & Climate:Comprehensive Solutions Backed by Unique Capabilities
1 Origins of MSCI ESG Ratings from 1999; Financial materiality -> ratings focus key ESG issues that could become financially material over the medium to long term 2 MSCI ESG Research: 2,434 constituents of the MSCI ACWI Index as of November 30, 2017; 3 Source: MSCI ESG Research as of as of February 2021, coverage subject to change; 4 Source: MSCI ESG Research as of December 2020. Includes full time employees, employees of foreign affiliates providing investment advisory services to MSCI ESG Research LLC, and global allocated staff performing non-investment advisory tasks; 5 Serafeim, G & Yoon, A, (2021). Stock Price Reactions to ESG News: The Role of ESG Ratings and Disagreement Harvard Business School Accounting & Management Unit; 6 Linda-Eling Lee’s February 2021 comment on the results of the Serafeim, G & Yoon, A, (2021) paper
“One way out of the dilemma of uncorrelated ratings is to use the one with the most predictive power, which they found to be MSCI ESG Ratings”6
35
• On average, 45% of the data to determine a corporate MSCI ESG Rating is derived from alternative sources2
• Leverage technology and AI to increase timeliness and precision of data collection and analysis
• 120+ Technologists dedicated to ESG and Climate benefitting from the full power of the Microsoft partnership
• 60+ data scientists develop robust models turning unstructured data into meaningful output
Alternative data beyond corporate disclosure Leading Technology
• Extensive track record, analyzed by multiple academic studies
• Tried and tested solution
Broad ESG and Climate coverage Unique Track Record5
• Broad ESG Ratings coverage with 90% of equity and fixed income market value3
• Provide consistent solutions across investment instruments
Financial Materiality 1 Deep Knowledge
• First ESG provider to assess companies based on industry financial materiality, dating back to 19991
• Focus on the issues that are most relevant to a company’s core business model
• Team of 250+ analysts vets, validates and transforms data into meaningful insight4
• Deep climate expertise with dedicated MSCI Climate Risk Center

MSCI Real EstateProviding real estate investment support tools and critical business intelligence at both asset and fund levels to institutional investors and real estate owners, managers and brokers worldwide
Global market indexes and benchmarks
MSCI Real Estate Enterprise Analytics
MSCI Real Estate Global Intel
• Single integrated market information, analytics and risk platform
• Single, global framework
• Asset or fund level• Customizable
benchmarks
Real EstateClimate VaR
• Tools to measure climate-related exposures and risks
• Forward-looking and return-based valuation assessment
• Unique global private real estate market data to help drive allocation decisions, research & strategy, and portfolio and risk management

Appendix

Continued Resilient Key Operating Metrics
38
YoY Subscription Run Rate Growth (as Reported and Organic)
2Q18 4Q19
7%
11%9%
11%
10%
7%
7%
9%
8%
1Q16
7%
10%8%
2Q16
7%
3Q16
7%
10%
8%
4Q16
10%
6%
9%
1Q20
7%
1Q17
10%8%
2Q17
9%10%
3Q17
11%
10%
10%
9%
4Q17
10%
11%
7%
1Q18
9%
4Q20
10%
9%
3Q193Q18
10%
4Q18 1Q19 2Q19
8%
10%
8%
10%
10%
2Q20 3Q20
11% 11%
1Q21
Subscription Run Rate Growth as Reported Organic Subscription Run Rate Growth
Retention Rate Trends
93.1%
3Q191Q16
95.1% 95.0%
4Q16
93.5%
4Q18
92.7%
2Q16
89.9%
3Q16
94.7%
1Q17 1Q18
94.9%
2Q17 2Q20
94.0%
3Q17
91.6%
4Q17
94.6%
3Q18
94.1%
2Q18
95.0%
92.9%
4Q20
95.2%
3Q201Q19
95.5%
2Q19
95.0%
92.9%
4Q19 1Q20
94.5%
92.6%
96.3%
1Q21

1Q16 to 1Q21 YoY Segment Run Rate Growth
39
Index
Analytics
27%
10%
4Q162Q16
11%
11%13%10%
1Q16
9%5% 10%
10%
-3%
13%
10%
1Q203Q16
10%
10%
8% 11%
2Q20
10%21%
1Q17
11%
38%
1Q182Q17 3Q19
11%
37%
3Q17
21%11%
1%
46%
4Q17 2Q18
11%
5%
38%
12% 11%
1Q193Q18
-2%
4Q18
12%
5%
2Q19
11%
4Q19
11%
4%
13%
3Q20
11%
17%
4Q20
45%
1Q21
Subscription Run Rate Growth as Reported Asset-Based Fees Run Rate Growth as Reported
7%
6%
1Q16
3%
6% 5%
3Q19
5%
2Q16
8%
4%7%
3Q16
2%
8%
4%
4Q16
5%
2%
7%
3%
1Q17
5%4%
6%4%
1Q19
7%
2Q17
6%
3%
3Q17
7%
4Q17
7%
1Q18 2Q20
5%
7%
5% 0.5%
3Q18 4Q18
7%
0.3%
7%
2Q18
6%7%
4Q19 4Q20
6%
7%
1Q202Q19
7%
6%
3Q20
5%5%
4%
1Q21
6%
Subscription Run Rate Growth as Reported Organic Subscription Run Rate Growth

1Q16 to 1Q21 YoY Segment Run Rate Growth
40
ESG & Climate
All Other - Private Assets
1Q182Q16
22%
3Q20
24%
22%36%
21%
1Q202Q19
29%21% 22%
1Q16 3Q19
24%19%
28%21%
3Q16
22%
24%
4Q16
20%
23%
1Q17
25%
28%25%
2Q17
26%
3Q17
31%
4Q18
27%
4Q17
34% 29%
39%28%
2Q18
31%
4Q20
25%29%
3Q18
27%24%
25%
1Q19
25%26%
27%
4Q19
23% 23%
28%
2Q20
26%33%
42%
1Q21
24%
Subscription Run Rate Growth as Reported Organic Subscription Run Rate Growth
8%
9%
-7% -9%
7%2% 11%3%
7%
15%
3%
10%
2Q17
2%1%
1Q16 2Q16 3Q16 4Q194Q18
3%
4Q16
-8%
1Q21
5%
7%
-10%
11%3%
1Q17
-3%
6%
3Q17 3Q18
7%
13%
4%
4Q17 4Q20
14%
4%
1Q18 2Q202Q18 3Q20
7% 4%
9%
4%
11%
1Q19
11%
2Q19
11%7%
1Q20
9%
3Q19
7%5%
12%
6%
8%
Organic Subscription Run Rate GrowthSubscription Run Rate Growth as Reported

1Q21 QoQ AUM Drivers: MSCI-Linked Equity ETFs
41
(US$ in billions)
Cash inflows / (outflows): $61.9$18.9 $17.3
4Q20 Ending AUM
$17.4
Emerging MarketsU.S.
$23.2
Developed Markets ex U.S.
$21.3
Market Change 1Q21 Ending AUM
$1,103.6
$1,209.6U.S.
EMDM ex. U.S.
$44.1
4Q20 Ending AUM 1Q21 Ending AUM
$33.9
Market Cap Weighted Factors ESG & Climate
$4.7
Market Change
$1,103.6
$1,209.6
$3.3 $24.7
ESG & Climate
Market CapWeighted
Factors
$44.1
$6.8
$8.1
Cash inflows / (outflows): $61.9
By Geographic Exposure
By Product
$7.9
$32.6
Strong cash inflows across products and all geographic exposures

Index Segment: Asset-Based Fees Details
42
(US$ in millions, except AUM in billions and Average BPS)
1Based on period-end Run Rate for ETFs linked to MSCI equity indexes using period-end AUM. Please refer to Table 7: AUM in ETFs Linked to MSCI equity Indexes (unaudited) of the pressrelease reporting MSCI’s financial results for first quarter 2021.2US = ETFs linked to MSCI equity indexes, the majority of whose weight is comprised of securities in MSCI Developed Market (DM) countries, primarily or exclusively in the US; DM ex US = ETFslinked to MSCI equity indexes, the majority of whose weight is comprised of securities in MSCI DM countries other than the US; EM = ETFs linked to MSCI equity indexes, the majority of whoseweight is comprised of securities that are not in MSCI DM countries. Prior periods have been reclassified to conform to the current period classification. Note: The AUM in equity ETFs alsoincludes AUM in Exchange Traded Notes, the value of which is less than 1.0% of the AUM amounts presented.
Asset-based Fees (ABF) RevenueQuarterly Average AUM and Period-End Basis
Point Fee1 of ETFs linked to MSCI Equity Indexes
Quarter-End AUM by Market Exposure2
of ETFs linked to MSCI Equity Indexes
1Q211Q20
$13.8
$77.7$61.1
$126.7
$28.1
$11.0 $35.1$100.2
+26%
Futures & Options
Non-ETF
ETF
+25%
+25%
+27%
YoY
$877 $893$777
$999$1,169
$323.0
$186.3
$335.5
$356.5
1Q211Q20
$200.2
$709.5
$1,209.6
$517.6
+70%YoY
DM ex USUS EM
+80%
+78%
+60%
2.71 2.67 2.67 2.67
4Q20
$777
2Q20
$877
1Q20
$999$893
3Q20
2.61
$1,169
1Q21
Average AUM Period-End Basis Point Fee

Listed Futures & Options Linked to MSCI Indexes
43
Futures & Options Run Rate
(US$ in millions)
4Q201Q20 2Q20 3Q20 1Q21
$49.1$49.1
34.4
$52.3 $55.0
Futures & Options Volume Linked to MSCI Indexes
1Contract volumes traded may not tie to volume figures used for calculating Futures & Options Run Rate.
(in millions of contracts traded1)
3Q202Q20
24.9
1Q20 4Q20 1Q21
40.4
28.7 26.2 24.6
• Beginning in 3Q20, Run Rate includes the repricing of certain agreements with exchange partners announced in 2Q20.
Continued deepening liquidity of listed futures and options linked to MSCI Indexes

Va
ria
ble
Co
mp
en
sa
tio
n
Pay for performance culture at MSCI
44
Component Objective 2020
Annual Base Pay • Provides certainty and predictability to meet ongoing living and financial commitments
• The only fixed component of our executive compensation program
Annual Incentive Plan
• Alignment of management’s interests with shareholders’ interests
• Introduced to drive one-year performance results
• Specific financial criteria and key performance indicators
• Financial Metrics (70%) vary by executive, but include:
– Revenue
– Adjusted EPS
– Net New Sales
– Free Cash Flow
– Contribution Margin
• Key Performance Indicator Goals (30%) that include the following ESG metrics:
– Employee Engagement, Manager Effectiveness, Employee training and development participation, Inclusion and Diversity, Carbon Footprint, etc.
Long-Term Incentive Program
• Fosters an “owner-operator” mindset
• Closely aligns management’s interests with the long-term interests of our shareholders
• Promotes the retention of key members of our management team
• CEO and President & COO equity entirely in PSUs tied to multi-year absolute TSR
• Grant of 3-Year PSUs and 5-Year PSUs (which vest based on absolute TSR) and do not have any “retesting” features
– 3-Year PSUs cover a three-year performance period
– 5-Year PSUs cover a five-year performance period
• RSUs which ratably service vest over three years
Fix
ed
C
om
pe
ns
ati
on

Use of Non-GAAP Financial Measures
45
• MSCI has presented supplemental non-GAAP financial measures as part of this presentation. Reconciliations are provided in the following slides that reconcile each non-GAAP financial measure with the most comparable GAAP measure. The non-GAAP financial measures presented in this presentation should not be considered as alternative measures for the most directly comparable GAAP financial measures. The non-GAAP financial measures presented in this presentation are used by management to monitor the financial performance of the business, inform business decision-making and forecast future results.
• “Adjusted EBITDA” is defined as net income before (1) provision for income taxes, (2) other expense (income), net, (3) depreciation and amortization of property, equipment and leasehold improvements, (4) amortization of intangible assets and, at times, (5) certain other transactions or adjustments, including the impact related to the vesting of the multi-year restricted stock units subject to performance payout adjustments granted in 2016 (the “Multi-Year PSUs”).
• “Adjusted EBITDA expenses” is defined as operating expenses less depreciation and amortization of property, equipment and leasehold improvements and amortization of intangible assets and, at times, certain other transactions or adjustments, including the impact related to the vesting of the Multi-Year PSUs..
• “Adjusted net income” and “adjusted EPS” are defined as net income and diluted EPS, respectively, before the after-tax impact of the amortization of acquired intangible assets, including the amortization of the basis difference between the cost of the equity method investment and MSCI’s share of the net assets of the investee at historical carrying value, the impact of divestitures, the impact of adjustments for the Tax Cuts and Jobs Act that was enacted on December 22, 2017 (“Tax Reform”), except for certain amounts associated with active tax planning implemented as a result of Tax Reform, and, at times, certain other transactions or adjustments, including the impact related to the vesting of the Multi-Year PSUs and costs associated with debt extinguishment.
• “Capex” is defined as capital expenditures plus capitalized software development costs.• “Free cash flow” is defined as net cash provided by operating activities, less Capex.• Asset-based fees ex-FX does not adjust for the impact from foreign currency exchange rate fluctuations on the underlying AUM.• We believe adjusted EBITDA and adjusted EBITDA expenses are meaningful measures of the operating performance of MSCI because they adjust for significant one-time, unusual or non-
recurring items as well as eliminate the accounting effects of certain capital spending and acquisitions that do not directly affect what management considers to be our ongoing operating performance in the period.
• We believe adjusted net income and adjusted EPS are meaningful measures of the performance of MSCI because they adjust for the after-tax impact of significant one-time, unusual or non-recurring items as well as eliminate the impact of any transactions that do not directly affect what management considers to be our ongoing operating performance in the period. We also exclude the after-tax impact of the amortization of acquired intangible assets and amortization of the basis difference between the cost of the equity method investment and MSCI’s share of the net assets of the investee at historical carrying value, as these non-cash amounts are significantly impacted by the timing and size of each acquisition and therefore not meaningful to the ongoing operating performance in the period.
• We believe that free cash flow is useful to investors because it relates the operating cash flow of MSCI to the capital that is spent to continue and improve business operations, such as investment in MSCI’s existing products. Further, free cash flow indicates our ability to strengthen MSCI’s balance sheet, repay our debt obligations, pay cash dividends and repurchase shares of our common stock.
• We believe that the non-GAAP financial measures presented in this presentation facilitate meaningful period-to-period comparisons and provide a baseline for the evaluation of future results.• Adjusted EBITDA expenses, adjusted EBITDA, adjusted net income, adjusted EPS, adjusted tax rate, Capex, free cash flow and organic operating revenue growth are not defined in the same
manner by all companies and may not be comparable to similarly-titled non-GAAP financial measures of other companies. These measures can differ significantly from company to company depending on, among other things, long-term strategic decisions regarding capital structure, the tax jurisdictions in which companies operate and capital investments. Accordingly, the Company’s computation of these measures may not be comparable to similarly-titled measures computed by other companies.

Use of Operating Metrics
46
• MSCI has presented supplemental key operating metrics as part of this presentation, including Retention Rate, Run Rate, subscription sales, subscription cancellations and non-recurringsales.
• Retention Rate is an important metric because subscription cancellations decrease our Run Rate and ultimately our operating revenues over time. The annual Retention Rate represents theretained subscription Run Rate (subscription Run Rate at the beginning of the fiscal year less actual cancels during the year) as a percentage of the subscription Run Rate at the beginning ofthe fiscal year. The Retention Rate for a non-annual period is calculated by annualizing the cancellations for which we have received a notice of termination or for which we believe there is anintention not to renew during the non-annual period, and we believe that such notice or intention evidences the client’s final decision to terminate or not renew the applicable agreement, eventhough such notice is not effective until a later date. This annualized cancellation figure is then divided by the subscription Run Rate at the beginning of the fiscal year to calculate acancellation rate. This cancellation rate is then subtracted from 100% to derive the annualized Retention Rate for the period. Retention Rate is computed by operating segment ona product/service-by-product/service basis. In general, if a client reduces the number of products or services to which it subscribes within a segment, or switches between products orservices within a segment, we treat it as a cancellation for purposes of calculating our Retention Rate except in the case of a product or service switch that management considers to be areplacement product or service. In those replacement cases, only the net change to the client subscription, if a decrease, is reported as a cancel. In the Analytics and the ESG & Climateoperating segments, substantially all product or service switches are treated as replacement products or services and netted in this manner, while in our Index and Real Estate operatingsegments, product or service switches that are treated as replacement products or services and receive netting treatment occur only in certain limited instances. In addition, we treat anyreduction in fees resulting from a down-sale of the same product or service as a cancellation to the extent of the reduction. We do not calculate Retention Rate for that portion of our RunRate attributable to assets in index-linked investment products or futures and options contracts, in each case, linked to our indexes.
• Run Rate estimates at a particular point in time the annualized value of the recurring revenues under our client license agreements (“Client Contracts”) for the next 12 months, assuming allClient Contracts that come up for renewal are renewed and assuming then-current currency exchange rates, subject to the adjustments and exclusions described below. For any ClientContract where fees are linked to an investment product’s assets or trading volume/fees, the Run Rate calculation reflects, for ETFs, the market value on the last trading day of the period, forfutures and options, the most recent quarterly volumes and/or reported exchange fees, and for other non-ETF products, the most recent client-reported assets. Run Rate does not include feesassociated with “one-time” and other non-recurring transactions. In addition, we add to Run Rate the annualized fee value of recurring new sales, whether to existing or new clients, when weexecute Client Contracts, even though the license start date, and associated revenue recognition, may not be effective until a later date. We remove from Run Rate the annualized fee valueassociated with products or services under any Client Contract with respect to which we have received a notice of termination or non-renewal during the period and have determined thatsuch notice evidences the client’s final decision to terminate or not renew the applicable products or services, even though such notice is not effective until a later date.
• “Organic subscription Run Rate growth” is defined as the period over period Run Rate growth, excluding the impact of changes in foreign currency and the first year impact of anyacquisitions. It is also adjusted for divestitures. Changes in foreign currency are calculated by applying the currency exchange rate from the comparable prior period to current period foreigncurrency denominated Run Rate.
• Sales represents the annualized value of products and services clients commit to purchase from MSCI and will result in additional operating revenues. Non-recurring sales represent theactual value of the customer agreements entered into during the period and are not a component of Run Rate. New recurring subscription sales represent additional selling activities, such asnew customer agreements, additions to existing agreements or increases in price that occurred during the period and are additions to Run Rate. Subscription cancellations reflect clientactivities during the period, such as discontinuing products and services and/or reductions in price, resulting in reductions to Run Rate. Net new recurring subscription sales represent theamount of new recurring subscription sales net of subscription cancellations during the period, which reflects the net impact to Run Rate during the period.
• Total gross sales represent the sum of new recurring subscription sales and non-recurring sales. Total net sales represent the total gross sales net of the impact from subscriptioncancellations.

Reconciliation of Adjusted EBITDA to Net Income (Unaudited)
47
Dec. 31, Dec. 31, Dec. 31, Dec. 31, Dec. 31,
In thousands 2020 2019 2018 2017 2016
Consolidated adjusted EBITDA 971,510 850,499 772,433 659,757 569,457
Multi-Year PSU payroll tax expense — 15,389 — — —
Amortization of intangible assets 56,941 49,410 54,189 44,547 47,033
Depreciation and amortization of property,
equipment and leasehold improvements 29,805 29,999 31,346 35,440 34,320
Operating income 884,764 755,701 686,898 579,770 488,104
Other expense (income), net 198,539 152,383 57,002 112,871 102,166
Provision for income taxes 84,403 39,670 122,011 162,927 125,083
Net income 601,822$ 563,648$ 507,885$ 303,972$ 260,855$
Year Ended
Dec. 31, Dec. 31, Dec. 31,
In thousands 2020 2019 2018
Index Adjusted EBITDA 766,493$ 670,188$ 607,853$
Analytics Adjusted EBITDA 172,924 152,113 143,645
ESG and Climate Adjusted EBITDA 22,851 21,813 16,019
All Other - Private Assets Adjusted EBITDA 9,242 6,385 4,916
Total operating segment profitability 971,510 850,499 772,433
2016 Multi-Year PSUs grant payroll tax expense — 15,389 —
Amortization of intangible assets 56,941 49,410 54,189
Depreciation and amortization of property,
equipment and leasehold improvements 29,805 29,999 31,346
Operating income 884,764 755,701 686,898
Other expense (income), net 198,539 152,383 57,002
Provision for income taxes 84,403 39,670 122,011
Net income 601,822$ 563,648$ 507,885$
Year Ended

Reconciliation of Adjusted EBITDA to Net Income (cont’d) (Unaudited)
48
TTM
Mar. 31, Mar. 31, Mar. 31,
In thousands 2021 2020 2021
Index adjusted EBITDA 219,879$ 183,587$ 802,785$
Analytics adjusted EBITDA 45,731 36,317 182,338
ESG and Climate adjusted EBITDA 5,045 3,626 24,270
All Other - Private Assets adjusted EBITDA 5,931 5,697 9,476
Consolidated adjusted EBITDA 276,586 229,227 1,018,869
Multi-Year PSU payroll tax expense — — —
Amortization of intangible assets 15,068 13,776 58,233
Depreciation and amortization of property,
equipment and leasehold improvements 7,143 7,567 29,381
Operating income 254,375 207,884 931,255
Other expense (income), net 38,347 45,035 191,851
Provision for income taxes 19,209 14,724 88,888
Net income 196,819$ 148,125$ 650,516$
Three Months Ended
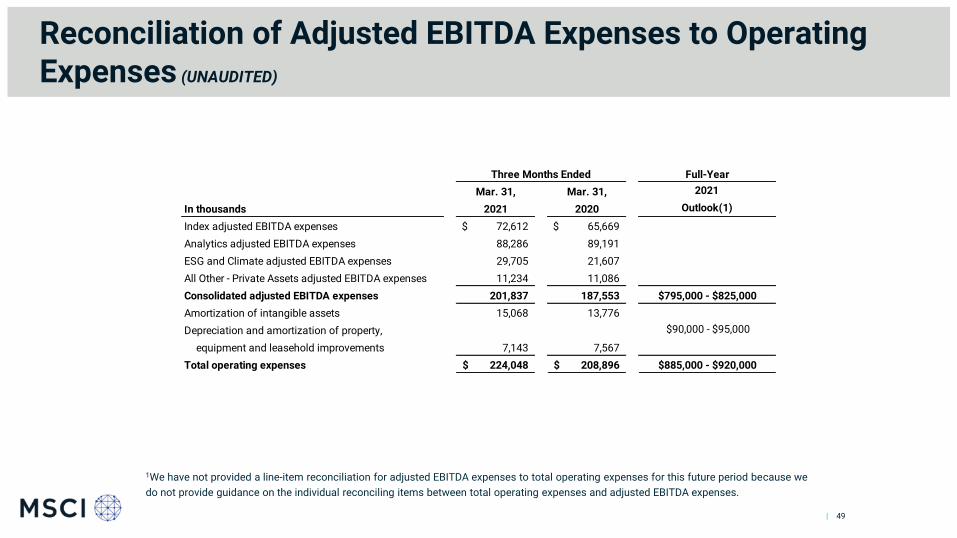
Reconciliation of Adjusted EBITDA Expenses to Operating Expenses (UNAUDITED)
1We have not provided a line-item reconciliation for adjusted EBITDA expenses to total operating expenses for this future period because we
do not provide guidance on the individual reconciling items between total operating expenses and adjusted EBITDA expenses.
| 49
Full-Year
Mar. 31, Mar. 31, 2021
In thousands 2021 2020 Outlook(1)
Index adjusted EBITDA expenses 72,612$ 65,669$
Analytics adjusted EBITDA expenses 88,286 89,191
ESG and Climate adjusted EBITDA expenses 29,705 21,607
All Other - Private Assets adjusted EBITDA expenses 11,234 11,086
Consolidated adjusted EBITDA expenses 201,837 187,553 $795,000 - $825,000
Amortization of intangible assets 15,068 13,776
Depreciation and amortization of property, $90,000 - $95,000
equipment and leasehold improvements 7,143 7,567
Total operating expenses 224,048$ 208,896$ $885,000 - $920,000
Three Months Ended

Reconciliation of Net Income and Diluted EPS to Adjusted Net Income and Adjusted EPS (Unaudited)
50
Dec. 31, Dec. 31, Dec. 31, Dec. 31, Dec. 31,
In thousands, except per share data 2020 2019 2018 2017 2016
Net income 601,822$ 563,648$ 507,885$ 303,972$ 260,855$
Plus: Amortization of acquired intangible assets and
equity method investment basis difference 37,413 34,773 43,981 39,157 47,033
Plus: Multi-Year PSU payroll tax expense — 15,389 — — —
Less: Discrete excess tax benefit related
to Multi-Year PSU vesting — (66,581) — — —
Plus: Debt extinguishment costs associated with the
2024 and 2025 Senior Notes Redemptions 44,930 16,794 — — —
Less: Gain on sale of Alacra (not tax effected) — — — (771) —
Less: Gain on sale of FEA (not tax effected) — — (10,646) — —
Less: Gain on sale of InvestorForce — — (46,595) — —
Less: Valuation Allowance released related to
InvestorForce disposition — — (7,758) — —
Less: Tax Reform adjustments (6,256) — (8,272) 34,500 —
Less: Income tax effect (16,490) (13,226) 1,678 (10,772) (15,243)
Adjusted net income 661,419$ 550,797$ 480,273$ 366,086$ 292,645$
Diluted EPS 7.12$ 6.59$ 5.66$ 3.31$ 2.70$
Plus: Amortization of acquired intangible assets and
equity method investment basis difference 0.44 0.41 0.49 0.43 0.49
Plus: Multi-Year PSU payroll tax expense — 0.18 — — —
Less: Discrete excess tax benefit related
to Multi-Year PSU vesting — (0.78) — — —
Plus: Debt extinguishment costs associated with the
2024 and 2025 Senior Notes Redemptions 0.53 0.20 — — —
Less: Gain on sale of Alacra (not tax effected) — — — (0.01) —
Less: Gain on sale of FEA (not tax effected) — — (0.12) — —
Less: Gain on sale of InvestorForce — — (0.52) — —
Less: Valuation Allowance released related to
InvestorForce disposition — — (0.09) — —
Plus: Tax Reform adjustments (0.07) — (0.09) 0.38 —
Less: Income tax effect (0.19) (0.16) 0.02 (0.13) (0.16)
Adjusted EPS 7.83$ 6.44$ 5.35$ 3.98$ 3.03$
Year Ended

Reconciliation of Net Income and Diluted EPS to Adjusted Net Income and Adjusted EPS (cont’d) (Unaudited)
51
Mar. 31, Mar. 31,
In thousands, except per share data 2021 2020
Net income 196,819$ 148,125$
Plus: Amortization of acquired intangible assets and
equity method investment basis difference 9,558 8,778
Plus: Debt extinguishment costs associated with the
2024 Senior Notes Redemption — 9,966
Less: Tax Reform adjustments — (759)
Less: Income tax effect (850) (3,396)
Adjusted net income 205,527$ 162,714$
Diluted EPS 2.36$ 1.73$
Plus: Amortization of acquired intangible assets and
equity method investment basis difference 0.11 0.10
Plus: Debt extinguishment costs associated with the
2024 Senior Notes Redemption — 0.12
Less: Tax Reform adjustments — (0.01)
Less: Income tax effect (0.01) (0.04)
Adjusted EPS 2.46$ 1.90$
Three Months Ended

Reconciliation of Net Cash Provided by Operating Activities to FCF (Unaudited)
52
Dec. 31, Dec. 31, Dec. 31, Dec. 31, Dec. 31,
In thousands 2020 2019 2018 2017 2016
Net cash provided by operating activities 811,109$ 709,523$ 612,762$ 404,158$ 442,363$
Capital expenditures (21,826) (29,116) (30,257) (33,177) (32,284)
Capitalized software development costs (29,149) (24,654) (18,704) (15,640) (10,344)
Capex (50,975) (53,770) (48,961) (48,817) (42,628)
Free cash flow 760,134$ 655,753$ 563,801$ 355,341$ 399,735$
Net Income 601,822$ 563,648$ 507,885$ 303,972$ 260,855$
Year Ended
(1) We have not provided a line-item reconciliation for free cash flow to net cash from operating activities for this future period because we do not provide guidance on the individual reconciling items between net cash from operating activities and free cash flow.
TTM Full-Year
Mar. 31, Mar. 31, Mar. 31, 2021
In thousands 2021 2020 2021 Outlook(1)
Net cash provided by operating activities 215,457$ 112,770$ 913,796$ $885,000 - $925,000
Capital expenditures (664) (3,613) (18,877)
Capitalized software development costs (9,696) (7,203) (31,642)
Capex (10,360) (10,816) (50,519) ($60,000 - $50,000)
Free cash flow 205,097$ 101,954$ 863,277$ $825,000 - $875,000
Three Months Ended