msft cover page - max m. fisher college of business summer...industry analysis ..... 7 industry life...
TRANSCRIPT
MICROSOFT (MSFT) Initiating Coverage with Neutral Rating
Jacob R. Clark [email protected] August 17 2004
Stock Rating Neutral Recent Price (8/16) $27.00 Target Price $29.00 52-week range $24-30
Stock Data Market cap $293B Shares outstanding 10.86B Beta 1.61 2005 Dividend Yield 1.19%
Summary of Investment Recommendation • Catalysts
o Management focus on cost efficiency provides some upside potential to stock
o Anticipated release of Longhorn will provide earnings momentum
o Special dividend of $3 per share will provide investors will excellent yield with potential for multiple expansion ex-dividend
o Potential for increased IT spending in the 4th quarter
• Risks o Linux open-source operating system o Reduced pace of technological innovation o Delay of Longhorn release o Continued questions about software security
• Current investment climate and expectations for future growth make this stock a hold for potential future upside. Strong management execution and focus on maximizing shareholder value provide a positive outlook for shareholders
• At current pricing levels, MSFT appears slightly undervalued
Earnings Estimates 2005E 2006E 2007E $1.24 $1.37 1.60 Valuation (P/E) 2005E 2006E 2007E 23.0 20.8 17.8
TABLE OF CONTENTS
COMPANY OVERVIEW .................................................................................................. 2 Product Segments............................................................................................................ 2
ECONOMIC OUTLOOK................................................................................................... 5 GDP Growth ................................................................................................................... 5 Inflation........................................................................................................................... 5 Interest Rates................................................................................................................... 6 Capital Flows .................................................................................................................. 6 Corporate Profits............................................................................................................. 6
INDUSTRY ANALYSIS ................................................................................................... 7 Industry Life Cycle ......................................................................................................... 7 Porter’s Five Forces ........................................................................................................ 7
COMPANY ANALYSIS.................................................................................................... 8 Industry Position ............................................................................................................. 8 Products and Business..................................................................................................... 9 Stock Catalysts.............................................................................................................. 11 Management.................................................................................................................. 12
RISKS & CONCERNS..................................................................................................... 12 Competition................................................................................................................... 12 Regulatory..................................................................................................................... 12 Legal ............................................................................................................................. 12 Product Development.................................................................................................... 13 Execution ...................................................................................................................... 13
FINANCIALS................................................................................................................... 13 Income Statement Analysis........................................................................................... 13 Balance Sheet Analysis................................................................................................. 14 Cash Flow Statement Analysis ..................................................................................... 14 ROE Analysis................................................................................................................ 14 Financial Ratio Analysis ............................................................................................... 15 Consensus Estimates..................................................................................................... 15
VALUATION................................................................................................................... 15 DCF Valuation .............................................................................................................. 15 P/E Multiple Valuation ................................................................................................. 15 Price/Sales Multiple Valuation ..................................................................................... 16 Price/Book Multiple Valuation ..................................................................................... 17 PEG Ratio Valuation..................................................................................................... 17 Absolute Valuation Multiple Chart for Microsoft ........................................................ 18 Valuation Multiple Chart for MSFT Relative to S&P 500 ........................................... 18 Valuation Multiple Chart for MSFT Relative to IT Sector........................................... 19 Price Momentum Index................................................................................................. 20 Prospective Growth & Margin Check........................................................................... 20 Valuation Summary ...................................................................................................... 21
CONCLUSION................................................................................................................. 21
Page 2 of 21
COMPANY OVERVIEW Microsoft Corporation develops, manufactures, licenses and supports a wide range of software products for various computing devices throughout the world. The Company's software products include scalable operating systems for servers, personal computers (PCs) and intelligent devices; server applications for client/server environments; information worker productivity applications; business solutions applications, and software development tools. Microsoft provides consulting services and product support services, and it trains and certifies system integrators and developers. The Company sells the Xbox video game console, along with games and peripherals. Its online businesses include the MSN subscription and the MSN network of Internet products and services. The Company's seven product segments are: Client, Server and Tools, Information Worker, Microsoft Business Solutions, MSN, Mobile and Embedded Devices and Home and Entertainment1. Product Segments2 Client Client segment includes Windows XP, Windows 2000, and other standard Windows operating systems. Client has overall responsibility for product delivery, engineering and technical architecture for the Microsoft Windows operating system, and new media technology, as well as relationships with manufacturers of personal computers and non-PC devices, including multinational and regional original equipment manufacturer (OEM) accounts. The segment includes sales and marketing expenses focused on business development efforts for the Windows platform, as well as integration of technology and products into non-PC devices. Server and Tools Server and Tools segment consists of server software licenses and client access licenses (CALs) for Windows Server, SQL Server, Exchange Server, and other servers. It also includes developer tools, training, certification, Microsoft Press, Premier product support services, and Microsoft consulting services. Microsoft server products offer a comprehensive range of solutions designed to meet the needs of developers and IT professionals, and are designed to flexibly run the programs and solutions that enable information workers to obtain, analyze, and share information quickly and easily. Microsoft servers provide capabilities ranging from messaging and collaboration to database management and ranging from e-commerce to mobile information access. Server and Tools segment includes the integrated product development and marketing that delivers Microsoft Windows Server System products. In addition, the segment provides information about the extended Microsoft platform through a variety of content offerings, such as web-based training for developers and IT managers. Through this
1 http://finance.yahoo.com 2 MSFT 2003 10-K
Page 3 of 21
segment, Microsoft offers a broad range of consulting services for advanced technology requirements, including custom solutions services, enterprise application planning, architecture and design services, and proof-of-concept services. The Server and Tools segment includes the Enterprise and Partner Group, which is responsible for enterprise sales strategy, enterprise sales learning and readiness, enterprise solution selling, enterprise partner sales strategy, and enterprise field communications. This group is also responsible for technical selling, field competitive strategy, and all competitive sales engagements. Information Worker Information Worker segment is responsible for developing and delivering technologies that focus on improving productivity for information workers in corporations. It consists of the new Microsoft Office System of programs, servers, services, and solutions. The Microsoft Office System features integration with Microsoft intranet collaboration technologies, Information Rights Management, and support for industry standard XML. The Information Worker segment also includes Microsoft Office Live Meeting, resulting from the acquisition of PlaceWare, Inc., Microsoft Office Live Communications Server 2003, and an allocation for CALs. The segment also includes professional product support. Microsoft Business Solutions Microsoft Business Solutions segment includes the businesses of Great Plains, Microsoft bCentral, and Navision. Microsoft Business Solutions develops and markets a wide range of business applications designed to help small and mid-market businesses become more connected with customers, employees, partners, and suppliers. Microsoft Business Solutions applications provide end-to-end automation for financial reporting, distribution, project accounting, electronic commerce, human resources and payroll, manufacturing, supply chain management, business intelligence, sales and marketing management, and customer service and support. Microsoft Business Solutions products are designed to meet the broad spectrum of business application needs of small to mid-market businesses, a group that generally consist of businesses with $1 million to $800 million in annual revenue. The business solutions are fully and seamlessly integrated across the application areas of enterprise resource management (ERM), customer relationship management (CRM), supply chain management (SCM) and business intelligence. These business solutions are sold, implemented, and supported through a partner network consisting of more than 4,500 value added resellers, systems integrators, consultants, ISVs, accounting firms (national, regional, and local), application service providers (ASPs), and eBuilders. MSN MSN segment includes MSN Subscriptions and MSN Network services. MSN Subscription services include MSN Internet access and premium services such as MSN Extra Storage, MSN Bill Pay, MSN Radio Plus and MSN Mobile, which are offered to consumers regardless of their Internet Service Provider. The MSN Network delivers
Page 4 of 21
online communication services such as email and online instant messaging through its MSN Hotmail and MSN Messenger products. It also delivers popular information services, such as MSN Search and content from top partners like MSNBC, ESPN, Expedia, and Access Hollywood. The segment is responsible for building and operating the MSN Network and for delivering MSN Subscription services. Revenue is principally generated from subscribers to MSN’s Internet access and premium services and from advertisers on the MSN Network. MSN delivers its services direct via its MSN Network and through partnerships with network operators such as Verizon, Qwest, Charter Communications, and Bell Canada. Mobile and Embedded Devices Mobile and Embedded Devices segment consists of Windows Mobile software, Windows Embedded device operating systems, MapPoint, and Windows Automotive. Windows Mobile software powers Pocket PC, Pocket PC Phone Edition, and Smartphone products. Windows Embedded, including Windows CE.NET, Windows XP Embedded and Windows NT Embedded, is a family of operating system software used in non-PC computing devices. Windows Embedded software is used widely in advanced consumer electronics devices including digital televisions, IP-based set top boxes, network gateways, and portable media players, as well as in enterprise devices including industrial controllers, retail point of sale systems, and voice-over-IP phones. The MapPoint family of location-enabled products and services includes the MapPoint Web Service, a hosted programmable XML web service that allows developers to integrate location intelligence in applications, business processes and web sites, and business and consumer oriented mapping CD-ROM products. Windows Automotive is an automotive grade software platform that provides developers with the building blocks to quickly and reliably create a broad range of advanced telematics solutions. Home and Entertainment Home and Entertainment segment includes the Microsoft Xbox video game system, PC games, the Home Products Division (HPD), and TV platform products. Home and Entertainment segment oversees development and business strategy for the Microsoft Xbox video game system, including hardware, third-party games development, games development published under the Microsoft label, Xbox and Xbox Live operations, marketing, research, and sales and support. The segment leads the development efforts of our HPD product lines. The segment also carries out all retail sales and marketing for Microsoft Office, the Windows operating systems, Xbox, games, and HPD products. The segment is responsible for the development, sales, and deployment of Microsoft’s TV platform products for the interactive television industry.
Page 5 of 21
ECONOMIC OUTLOOK The current economic environment is shrouded in uncertainty. It seems as if every time a positive economic variable is reported, that report is followed by a less optimistic report. Great uncertainty currently exists over oil prices, geopolitical concerns, and the U.S. election. Interest rates are still very low relative to historical levels despite recent actions by the Federal Reserve. Inflation expectations are low relative to historical standards. Consumer confidence levels are high despite a lack of strong job growth. The near-term outlook for the U.S. economy is steady growth driven by government expenditures with low inflation expectations in a rising interest rate environment. GDP Growth The past 12 months have provided for a perfect storm of economic growth. GDP growth accelerated behind government spending, strong consumption, and increased investment. Consumption was driven both my easy monetary and fiscal policy. Many consumers took advantage of record low mortgage rates several times to both extract equity from their homes and lower their monthly obligation. As consumers spent, corporate profits grew substantially from increasing revenues and contained costs. Corporate capital spending was the big surprise, as spending well-exceeded expectations. Future economic growth looks much more sanguine than the previous 12 months. Mortgage refinancing is slowing and consumers have less disposable income. The employment picture is tenuous, as job growth has continued to slow. Corporations are delaying their capital investments due to increased geopolitical concerns and uncertainty about the impending presidential election. Growth should average between 3-5% over the next year, as these concerns will continue to weigh heavily on consumers and corporations. Inflation Inflation has remained well contained over the past year. The CPI reached a low point of 1.7% year-over-year growth. Food and energy costs remained a volatile portion of the measurement, but were also well contained during this period. Once the easy monetary and fiscal policies took hold, prices started to accelerate as the demand for money increased significantly. The increase in inflation during this period still remained well contained and below the historical average. Inflation expectations for the near-term future appear to be increasing. Recently, increases in the price of crude oil per barrel to more than $45 have quelled much of the economic optimism from both the consumer and corporate side. Excluding food and energy costs, inflation should remain well contained over the next year as the Federal Reserve continues to manage inflation concerns with increases to the Federal Funds rate. Inflation should continue at a rate of 2-3% over the next year.

Page 6 of 21
Interest Rates Interest rates remained low compared to historical averages. Despite mixed signals on economic growth, the Federal Reserve continued its proactive approach to the management of the economy by increasing the Federal Funds Rate by 25 basis points at each of the last two meetings. The increases in interest rates are intended to keep the economy from overheating and producing a considerable increase in inflation. The easy monetary policy of the Fed is over. Interest rates will increase over the short-term through a continued attempt to contain inflation. The Federal Funds rate should see at least a 100 basis point increase over the next year, while a lessened impact on long-term Treasury yields will also occur. Longer-term rates should experience diminished marginal returns from the interest rate increases due to the capital flows into the sector and liquidity preference. The Federal Funds rate should fall between 2-3% over the next year. Capital Flows During the recent year, investor capital has searched for higher yields in a low interest rate environment. With the 3-month T-bill rate at all time lows, investors were willing to take additional risk to increase their returns. As a result, real estate saw a significant inflow of capital. Since interest rates were projected to increase, investors were less willing to invest in bonds since their prices act inversely to yields. Most recently, the stock market also gained investor capital due to a more positive outlook for corporate profits. Due to the great uncertainty in the global economy, real estate and risk free securities continue to hold favor with investors. Investors are seeking inflation-adjusted returns in the current economic environment. With corporate profits showing signs of a slowdown, capital flows to equities will likely prefer large cap companies. Corporate Profits Recently, corporate profits have expanded greatly. The necessity to cut costs at the corporate level and the top-line revenue growth from the easy monetary and fiscal policies fueled a surge in corporate profitability. Input prices have remained stable and despite a lack of increased pricing power for outputs, volume increased significantly. For the months ahead, the outlook for corporate profits appears flat. Most of the fat from a decade of economic expansion and corporate excess has been trimmed and input prices appear to be headed upward. Oil prices in particular are attracting heavy attention, as conflict around the global oil supply continues. Corporations and their bottom line will feel the overall impact of the uncertainty of domestic and global economies. Equity prices will continue to trade flat for the months to come until some uncertainty is removed from economic indicators and geopolitical

Page 7 of 21
concerns. Demographics also will play a negative part on equity markets for years to come as the baby boomer generation prepares for retirement and seek a more certain return on their investments. Although volatility has been great over the past few years, a reduction in the risk premium for equities is probable as investors are becoming more accepting of risk. This will bode well for equities since investors will require less return for each unit of risk accepted. Microsoft should benefit from the economic environment in the future due to their more secure revenue stream and lack of long-term debt.
INDUSTRY ANALYSIS Industry Life Cycle The industries within the Information Technology sector continue to remain favorable. Although industry growth has waned from the growth experienced during the latter half of the 90’s decade, growth should still outpace overall economic growth. Many companies within the sector have matured and have become true cash flow generators. While innovation is still occurring in the sector, it is confined to very specific industries within the sector. Consolidation is occurring and the large cap companies in the sector are fighting for the same customers along very different product lines. Companies like Microsoft, IBM, Dell, HP, and Intel, the well-known names within the sector are expanding their business opportunities and competing with each other. The consolidation, which is occurring within the sector, presents Microsoft with new challenges. Alliances and joint ventures with companies like Symantec are making the entry into new product lines more difficult for large companies like Microsoft. Microsoft has a great advantage during this consolidation, which is the value of its operating system. By leveraging its operating system into developing products like handheld devices and video game units, Microsoft will remain at the forefront of change within the technology sector. Porter’s Five Forces Barriers to Entry Microsoft maintains a strong competitive edge due to its dominance of the operating system and productivity software. The Windows XP operating system and Office software command a 95% market share. Microsoft continues to leverage these strengths into new product lines in an attempt to prevent future competition. The desktop, once the most valued piece of technology real estate is being moved to the television, the cell phone, and the automobile navigation system. Microsoft has an advantage due to the high switching costs associated with learning a new operating system or productivity software. While companies like IBM are trying to change the game with the acceptance of open source programming like Linux, Microsoft still maintains an advantage that should insulate itself from future competition.
Page 8 of 21
Power of Suppliers The main input for Microsoft’s products remains human capital. While innovation is key to the development of new products, it remains in greater supply than ever before. The global economy has provided great access to new sources of human capital from other nations that maintain a lower standard of living and cost of labor. Power of Buyers Nearly 80% of Microsoft’s revenue comes from corporate purchases. In recent years, IT managers have become savvier in negotiations and better timed their purchases. As a result, tech companies have seen little growth in gross margins from corporate purchases. Consumers have also become more powerful buyers with the increasing acceptance of the Internet as a purchasing point. The switching costs Microsoft maintains also help negate some buyer power. Threat of Substitutes Microsoft’s main threat is not from one of the companies within its sector as is typical in most industries. The open source model for software is the greatest threat to the Microsoft kingdom. Linux, an open source operating system, is the current substitute to the Windows operating system. Other firms within the sector are beginning to accept Linux and are pushing to get the platform into their systems. Rivalry among Existing Firms Since the industry is entering the end of the growth stage of the life cycle and approaching maturity, rivalry remains strong. Consolidation among existing firms is inevitable and will bring about great change within the industry. Firms will begin to integrate vertically and horizontally to protect the viability of their products. Microsoft holds a nice position given its core product line and lack of long-term debt.
COMPANY ANALYSIS Industry Position Microsoft is the leader in its main revenue producing business segments, Client and Information Worker, with a market share of 95%. While risks from the development of the Linux platform and other open source code software programs are significant, the position held by Microsoft is still dominant. The position held in the Server Platform segment, while not dominant, is still respectable and growing. Margins in the Server Platform segment are considerably lower and serve to represent the lack of differentiation among competitors.

Page 9 of 21
The Business Solutions segment is a very fragmented industry with a differentiation focus. Many firms operate in this industry and provide specific software solutions to firms for specific business needs. Recently, Microsoft announced a planned purchase of SAP, a leader in this industry, but has subsequently backed away from the acquisition. Little guidance from management has been given for the change of heart so some industry insiders believe that a future purchase is possible. The Justice department of the U.S. government has recently taken a position against a hostile merger between Oracle and Peoplesoft. Further consolidation within this industry is expected in the future. MSN segment provides an operating margin of 23%, but continues to feel pressure in this highly undifferentiated industry. Recent plans for Microsoft include enhancing their search technology to Google’s technology to gain marketing revenue from the highly used search engine. Mobile and Embedded Devices is the segment with the highest revenue growth. Advances in mobile technology will provide Microsoft with a great source of future profits. Since this industry is still growing rapidly, new competitors are quickly entering. Microsoft maintains an advantage due to its dominance in software. The Home and Entertainment segment is the least profitable of Microsoft’s businesses. The Xbox is a commodity product that faces strong industry leaders in Sony and Nintendo. The focus in this industry is on cost and the ability to get the best software since the hardware is homogenous. Products and Business The table below provides a comparison of Microsoft’s main business segments, its recent profitability, life cycle stage, and next product innovation:
Segment Operating Margin
Life Cycle Next Product Anticipated Release
Client 82% Growth - Mature Windows XP Service Pack 2
Summer 2004
Server Platforms 37% Growth - Mature Yukon Q2 2005
Information Worker
74% Growth - Mature Office for Longhorn
2007
Business Solutions
-16% Growth - Mature Project Green 2007
MSN 23% Growth MSN Search Late 2004
Mobile/Embedded Devices
-22% Pioneer None
Home & Entertainment
-29% Mature Xbox 2 Christmas 2005

Page 10 of 21
The charts below demonstrate the share of Microsoft’s revenue, recent annual revenue growth rate, and operating margin by business segment.
4Q Operating Income by Segment
40%
-1%
3%
-1% -4%
47%
16%
-10%
0%
10%
20%
30%
40%
50%
% of Operating Income
ClientServer PlatformsInformation WorkerBusiness SolutionsMSNMobile/Embedded DevicesHome & Entertainment
44QQ RReevveennuuee bbyy SSeeggmmeenntt
SSeerrvveerr && TToooollss$$22..33BB ▲▲ 2200%%
IInnffoorrmmaattiioonn WWoorrkkeerr $$22..99BB ▲▲ 2233%%
MMiiccrroossoofftt BBuussiinneessss SSoolluuttiioonnss $$119966MM ▲▲ 99%%
CClliieenntt $$22..88BB ▲▲ 99%%
HHoommee && EEnntteerrttaaiinnmmeenntt$$449999MM ▲▲ 33%%
MMSSNN $$558888MM ▲▲ 55%%
MMoobbiillee aanndd EEmmbbeeddddeedd
DDeevviicceess $$7700MM ▲▲ 5599%%
Page 11 of 21
The charts above show that Microsoft’s most profitable businesses; Information Worker and Client are also very slow growing. The recent increased growth of the Information Worker segment is attributable to the release of the most recent Microsoft Office version. While nearly every business segment has a new product in the pipeline, clearly the most critical product to come to market in the next few years is the new operating system codenamed Longhorn. Longhorn will also provide a new version of Office specifically for the new operating system that will drive future earnings growth. Current management and analyst expectations for Longhorn release are early in 2007. Given that most of the revenue generated by Microsoft is from the operating system and productivity software, the delay or early release of Longhorn will have a significant impact on the price of the stock. Stock Catalysts Dramatic near-term catalysts for the stock are not present. Microsoft will see its next big catalyst in 2007 with the release of Longhorn. Currently, the Client segment is set to introduce Service Pack v2 for the Windows XP operating system. This new service pack will provide some very important security features. Microsoft has suggested that they will come to market soon with an antivirus software package despite their alliances with Symantec. This new product could provide some upside to the stock if it does not delay the release of Longhorn. Microsoft has been a visible target for hackers for years and they continue to enhance their software code and work to keep workstations and PC’s secure. PC demand was particularly strong towards the end of last year. Many IT managers took it upon themselves to replace outdated systems last purchased at the end of the tech bubble. According to IT manager surveys, the budget for technology purchases remains an area of uncertainty. Most managers indicate a desire to make purchases toward the end of 2004. Additional growth in technology purchases will drive growth of operating systems and productivity software. Recent internal documentation from management indicates a further commitment to cost efficiency. Management has been very effective in reducing costs over the past year, but clearly there remains additional opportunity for operating margin growth through cost cutting. While the markets generally do not reward cost cutting as heavily as top-line revenue growth, some upside remains in the stock with additional cost reductions. With the uncertainties explained in the economic outlook of the report, investors are likely to shift their stock holdings to lower beta stocks. Since Microsoft maintains no long-term debt and low operating leverage, they will be a good choice for more uncertain investors. A shift from higher beta stocks to lower beta stocks will expand multiples and drive the share price higher.

Page 12 of 21
Management Microsoft management remains one of their greatest strengths. Management execution has always been and continues to be strong. Most recently, Steve Ballmer issued a challenge to Microsoft employees to increase innovation. Executive management has demonstrated strong execution of strategic initiatives over the years, which has entrenched Microsoft as one of the most admired companies and most dominant companies in the world.
RISKS & CONCERNS Competition The main competitive force is from Linux. As previously shown, the Windows operating system is the lifeblood of the company. The first computers with the Linux operating system are already being delivered. The open source environment is favored among the technically savvy and may continue to become more mainstream. One area of disadvantage to an open source operating system is that there is no company to provide strong service and support. Consistency is important among business users who share files and other work product. Security for an open source operating system may also present concerns for an IT manager to properly secure the system. Other competitive concerns are present among major technology companies such as IBM, HP, and Dell. Since many of the technology products are becoming more homogenous and reaching maturity in the product life cycle, consolidation and product integration will become greater concerns. Regulatory Most recently, Microsoft settled the U.S. government’s competitive concern. Microsoft will be somewhat disadvantaged from establishing itself in other industries in the future due to its large market share. Government regulators in the U.S. and other markets will make a careful consideration of anticompetitive activity as Microsoft continues to grow. Legal Microsoft faces very few legal issues domestically with the resolution of the Justice department’s lawsuit. International anticompetitive lawsuits are still unresolved, but they impact revenues much less than the U.S. case. Due to the closure of the U.S. government’s lawsuit, Microsoft elected to distribute $75 billion of cash over the next four years, which was held partly to deal with any potential legal costs.
Page 13 of 21
Product Development Microsoft has been struggling to continue its history of innovation. CEO, Steve Ballmer indicated in his most recent email address to employees that a lack of innovation is their biggest concern. Microsoft has become such a large company that it has become difficult to maintain the level of innovation once experienced during the late 90’s. Innovation has been limited to tweaks in the Windows operating system and accompanying Office productivity software. In order for Microsoft to continue as one of the strongest U.S. companies, they must successfully implement the new Longhorn operating system, maintain their software code to prevent malicious attacks on users of their software, and continue to push innovation in the mobile/embedded devices segment. Execution Management execution has historically been one of Microsoft’s greatest strengths. Once a company becomes as large as Microsoft, it becomes more difficult to execute on existing and new products. Of most immediate concern is the ability of management to decrease the time to patch discovered security flaws in their software and the importance of the new operating system Longhorn. Microsoft has also been vigilant in defending against software piracy, which also remains an important execution risk. Developing nations in Asia are the fastest growing countries in the world, but they also are the largest culprits in software piracy.
FINANCIALS Income Statement Analysis As shown in the income statement analysis from Exhibit I, revenue growth has been accelerating at a rate of 13% per annum on average. This appears to be a normative growth rate expectation based upon the time period analyzed. While this growth rate is significantly lower than the 10-year average growth of 23%, it still provides solid growth. During the past two years, research and development expenses have increased to approximately 21% of revenue, which is up from 15% of revenue in 2002. The increase in fiscal year 2004 is attributable to $1.31 billion of stock-based compensation expenses related to the option transfer program in the second quarter. A 3% growth in R&D headcount also occurred over the past fiscal year. General and Administrative expenses grew to 14% of revenue in 2004. This large increase is attributable to legal expenses of $1.92 billion to settle the Sun Microsystems case, a $605 million fine imposed by the European Commission, and $280 million of stock-based compensation.
Page 14 of 21
Fiscal year 2003 results were restated to recognize the acceptance of SFAS 123 as it relates to stock-based compensation. Balance Sheet Analysis Of significance on the balance sheet is the large decrease in unearned revenue relative to 2003. Unearned revenue decreased $838 million from prior year, which reflects a faster recognition of revenue from multi-year licensing than new additions. The recognition of revenue was primarily driven by Upgrade Advantage licensing agreements and a $489 million decline in revenue deferred for undelivered elements. Starting in April of 2003, revenue deferred for undelivered elements reflected lower deferral rates, partially offset by lengthened product life cycles for the underlying products licensed. As a result, a higher proportion of revenue is earned sooner. Exhibit II contains information from the balance sheet. Cash Flow Statement Analysis Cash flows from operations decreased slightly over the past year due to legal costs related to the Sun Microsystems case and the European Commission fines. Cash flow from financing, while still negative, was nearly $3 billion more than usual. The increase in cash flows from financing is related to the lack of share repurchases in the year, an increased cash dividend, and a more conservative cash policy. Cash flow from investing was also less negative than usual. The increase in cash flow from financing is attributable to a shift in duration of investments held. Longer-term maturities were exchanged for more liquid investments. The statement of cash flows is shown in Exhibit III. Microsoft recently announced a distribution of $75 billion over the next four years in the form of a special $3 per share dividend payable on December 2nd, an increase in the annual dividend to $0.32 per share (doubled), and an aggressive share repurchase plan. The announcement was well received in the market and justified due to the settlement of many large legal cases in which Microsoft served as defendant. ROE Analysis Return on equity has fallen considerably since 1997. While some decrease is expected due to the changing fundamentals of the economy and equity markets since 1997, ROE has fallen from 39% to 19% in the past seven years. A closer look at the DuPont equation indicates that the fall in ROE is mainly caused by poorer asset turnover. Since 1997, ROA has fallen from 0.98x to 0.44x. This demonstrates the nature of the tech industry and it’s falling margins and slower top-line revenue growth due to the industry becoming more mature.
Page 15 of 21
Other areas of the DuPont equation are relatively the same. Operating profit margin is still roughly 45% once the change from expensing stock options is factored into R&D and G&A expenses, but is down from the highs seen in 2000 at 62%. No debt is employed in Microsoft’s capital structure, so interest burden is still 1.0. The tax burden has increased to 68% from 65% in 1997. Leverage, as measured by assets to equity is also down slightly from 1997 levels to 1.3x. Financial Ratio Analysis A complete analysis of financial ratios from the financial statements is located in Exhibit IV. The ratio analysis shows increasing liquidity, slower cash conversion, lower asset turnover, lower margins, and decreasing return on equity. Decreases in these ratios further indicate a maturing industry, stronger competition, and increased buyer power. Microsoft will continue to benefit from its strong competitive position, but will need to spark new innovation to remain a leader in the tech sector. Consensus Estimates Some variation exists among analyst earnings estimates for fiscal year 2005. A total of 32 analyst estimates are included in the First Call estimates, which range from $1.21 to $1.27 per share. The current mean estimate is $1.24 per share with a standard deviation of $.02 per share. Recently, all analyst estimates have been revised to reflect Microsoft’s announcement to distribute $75 billion to shareholders thru share buybacks, a special $3 per share dividend, and an increased annual dividend. A good portion of this distribution is being made from the cash balance Microsoft held due to the uncertainty of pending lawsuits. Also, a shift to more liquid investments and future distributions to shareholders has reduced investment income projections by $0.09 - $0.12 per share.
VALUATION DCF Valuation A 10-year DCF valuation model is included as part of Exhibit V. The DCF valuation indicates an implied value per share of $31.48. The valuation is very sensitive to a variety of assumptions and is therefore not heavily weighted in the reconciliation of a target price for the stock. While this measure is highly sensitive to many forward-looking assumptions, it does provide a meaningful look at future earnings. Other relative measures are more heavily weighted when determining the target price of the stock and are explained in more detail in the sections that follow. P/E Multiple Valuation Since the consensus earnings estimate falls between $1.22 and $1.28 per share at a 95% confidence level, the P/E multiple valuation method provides another method of valuation. The current forward year estimated P/E multiple for Microsoft is 21.4x, which

Page 16 of 21
seems to suggest that the stock is slightly undervalued compared to the historical mean P/E ratio of 31.0x as shown in the valuation chart below. Assuming mean reversion, the historical P/E ratio suggests an implied value of MSFT shares of $39.11. Some caution is needed with this estimate as well since it incorporates both the stock market bubble valuations and years when Microsoft earnings were growing faster than current levels. On a relative basis, Microsoft shares also appear to be undervalued when compared to both the S&P 500 and the IT sector by 26%. Measure Current
Multiple Mean
Multiple Implied MSFT
Value MSFT - Historical
21.4x 31.0x $39.11
Relative to S&P 500
1.41x 1.78x $34.08
Relative to IT Sector
1.11x 1.47x $35.76
Price/Sales Multiple Valuation The price/sales multiple valuation method can be considered more accurate because it focuses on sales and does not have other variable items included in the valuation. Assuming reversion to the mean multiple, it appears as if Microsoft shares are undervalued by 32%. Measure Current
Multiple Mean
Multiple Implied MSFT
Value MSFT – Historical
7.98x 12.18x $41.21
Relative to S&P 500
5.69x 7.51x $35.64
Relative to IT Sector
3.17x 4.40x $37.48
Page 17 of 21
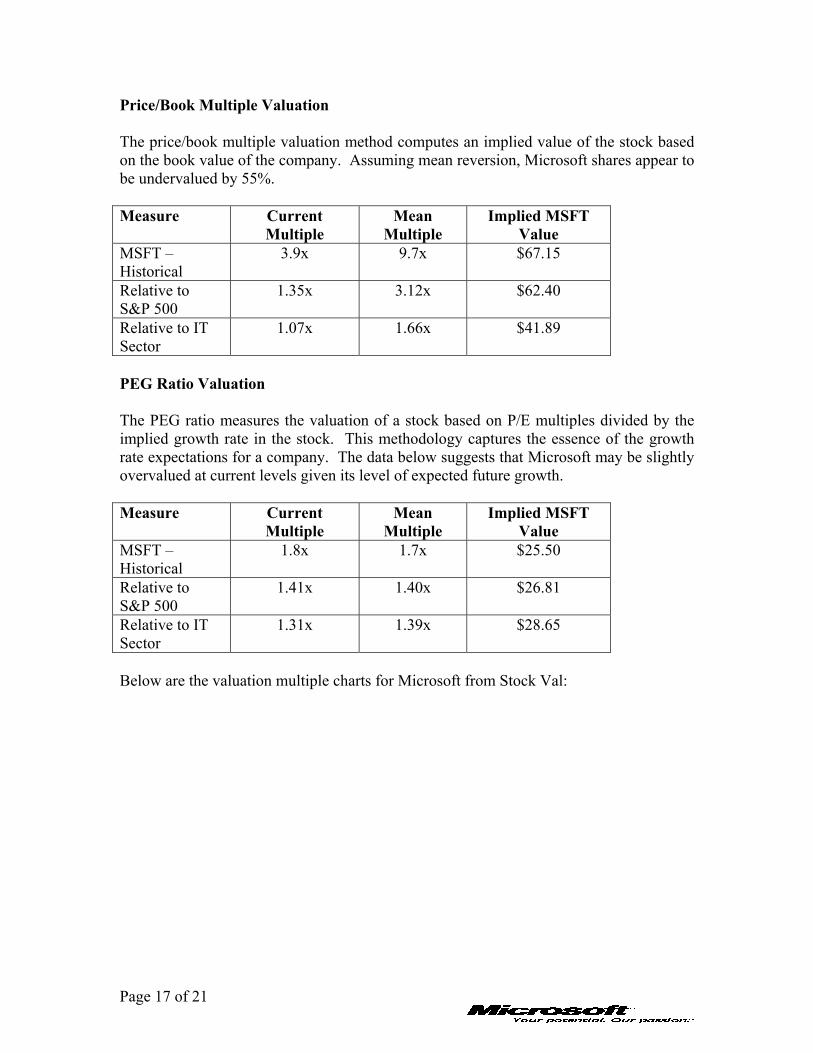
Price/Book Multiple Valuation The price/book multiple valuation method computes an implied value of the stock based on the book value of the company. Assuming mean reversion, Microsoft shares appear to be undervalued by 55%. Measure Current
Multiple Mean
Multiple Implied MSFT
Value MSFT – Historical
3.9x 9.7x $67.15
Relative to S&P 500
1.35x 3.12x $62.40
Relative to IT Sector
1.07x 1.66x $41.89
PEG Ratio Valuation The PEG ratio measures the valuation of a stock based on P/E multiples divided by the implied growth rate in the stock. This methodology captures the essence of the growth rate expectations for a company. The data below suggests that Microsoft may be slightly overvalued at current levels given its level of expected future growth. Measure Current
Multiple Mean
Multiple Implied MSFT
Value MSFT – Historical
1.8x 1.7x $25.50
Relative to S&P 500
1.41x 1.40x $26.81
Relative to IT Sector
1.31x 1.39x $28.65
Below are the valuation multiple charts for Microsoft from Stock Val:

Page 18 of 21
Absolute Valuation Multiple Chart for Microsoft
S to c k V a l®M IC R O S O F T C O R P O R A T IO N (M S F T ) P r ic e 2 7 .01 9 9 4 1 9 9 5 1 9 9 6 1 9 9 7 1 9 9 8 1 9 9 9 2 0 0 0 2 0 0 1 2 0 0 2 2 0 0 3 2 0 0 4 2 0 0 5
P R IC E / Y R -F O R W A R D E P S E S T S0
2 0
4 0
6 0 H I 6 6 .7 L O 1 9 .4 M E 3 1 .0 C U 2 1 .4
0 8 -1 2 -1 9 9 40 8 -1 3 -2 0 0 4
P R IC E / S A L E S0
8
1 6
2 4 H I 3 0 .8 8 L O 6 .6 9 M E 1 2 .1 8 C U 7 .9 8
0 8 -1 2 -1 9 9 40 8 -1 3 -2 0 0 4
P R IC E / B O O K V A L U E0
6
1 2
1 8 H I 2 1 .5 L O 3 .9 M E 9 .7 C U 3 .9
0 8 -1 2 -1 9 9 40 8 -1 3 -2 0 0 4
P R IC E / Y R -F O R W A R D E P S E S T S / G R E0
1
2H I 2 .7 L O 0 .8 M E 1 .7 C U 1 .8
0 8 -1 2 -1 9 9 40 8 -1 3 -2 0 0 4
Valuation Multiple Chart for MSFT Relative to S&P 500
S to c k V a l®M IC R O S O F T C O R P O R A T IO N (M S F T ) P r ic e 2 7 .01 9 9 4 1 9 9 5 1 9 9 6 1 9 9 7 1 9 9 8 1 9 9 9 2 0 0 0 2 0 0 1 2 0 0 2 2 0 0 3 2 0 0 4 2 0 0 5
P R IC E / Y R -F O R W A R D E P S E S T S R E L A T IV E T O S & P 5 0 0 C O M P O S IT E A D J U S T E D (S P 5 A ) M -W td0 .6
1 .2
1 .8
2 .4 H I 2 .6 3 L O 1 .0 3 M E 1 .7 8 C U 1 .4 1
0 8 -1 2 -1 9 9 40 8 -1 3 -2 0 0 4
P R IC E / S A L E S R E L A T IV E T O S & P 5 0 0 C O M P O S IT E A D J U S T E D (S P 5 A ) M -W td4
6
8H I 1 2 .4 9 L O 5 .0 2 M E 7 .5 1 C U 5 .6 9
0 8 -1 2 -1 9 9 40 8 -1 3 -2 0 0 4
P R IC E / B O O K V A L U E R E L A T IV E T O S & P 5 0 0 C O M P O S IT E A D J U S T E D (S P 5 A ) M -W td1
2
3
4 H I 4 .8 2 L O 1 .1 8 M E 3 .1 2 C U 1 .3 5
0 8 -1 2 -1 9 9 40 8 -1 3 -2 0 0 4
P R IC E / Y R -F O R W A R D E P S E S T S / G R E R E L A T IV E T O S & P 5 0 0 C O M P O S IT E A D J U S T E D (S P 5 A ) M -W td0 .9
1 .2
1 .5
1 .8 H I 1 .8 5 L O 0 .9 8 M E 1 .4 0 C U 1 .4 1
0 8 -1 2 -1 9 9 40 8 -1 3 -2 0 0 4

Page 19 of 21
Valuation Multiple Chart for MSFT Relative to IT Sector
StockVal®M ICRO SOFT CO RPO RATIO N (M SFT) Price 27.01994 1995 1996 1997 1998 1999 2000 2001 2002 2003 2004 2005
PRICE / YR-FORW ARD EPS ESTS RELATIVE TO S&P INFO TECH. SECTOR COMPOSITE ADJ (SP-45) M-W td0
1
2HI 2.03 LO 0.75 ME 1.47 CU 1.11
08-12-199408-13-2004
PRICE / SALES RELATIVE TO S&P INFO TECH. SECTOR COMPOSITE ADJ (SP-45) M-W td2
3
4
5 HI 5.91 LO 2.05 ME 4.40 CU 3.17
08-12-199408-13-2004
PRICE / BOOK VALUE RELATIVE TO S&P INFO TECH. SECTOR COMPOSITE ADJ (SP-45) M-W td0
1
2
3 HI 3.03 LO 0.73 ME 1.66 CU 1.07
08-12-199408-13-2004
PRICE / YR-FORW ARD EPS ESTS / GRE RELATIVE TO S&P INFO TECH. SECTOR COMPOSITE ADJ (SP-45)0.4
0.8
1.2
1.6 HI 1.94 LO 0.76 ME 1.39 CU 1.31
08-12-199408-13-2004

Page 20 of 21
Price Momentum Index The price momentum index indicates current investor sentiment and attempts to identify oversold/overbought conditions based on momentum. The chart below seems to indicate that the shares are priced correctly, with a slight overbought measure from the recent cash distribution announcement.
M I C R O S O F T C O R P O R A T I O N ( M S F T )S t o c k V a l ® P R I C E 2 7 . 0 D A T E 0 8 - 1 3 - 2 0 0 4
1 9 9 9 2 0 0 0 2 0 0 1 2 0 0 2 2 0 0 3 2 0 0 42 12 1
2 32 3
2 52 52 72 72 92 9
3 23 2
3 53 5
3 83 84 14 1
4 54 5
4 94 95 35 35 75 7
6 36 8
T h e O h io S t a t e U n i v e r s i t yF i s h e r C o l l e g e o f B u s in e s s
P R I C E M O M E N T U M I N D E X ( O V E R B O U G H T / O V E R S O L D )- 2- 2
- 1- 1
00
+ 1+ 1
+ 2+ 2
Prospective Growth & Margin Check The growth and margin check provides a quick summary level check on the growth rates anticipated in the future. As seen from the chart below, growth is expected to slow somewhat, but should still provide some upside in the stock.
P r o s p e c t i v e G r o w t h & M a r g i n C h e c k S t o c k V a l ®M I C R O S O F T C O R P O R A T I O N ( M S F T )P r i c e 2 7 . 0 2 0 0 8 / 1 3 / 0 4
P e r c e n t C h a n g e A c t u a l Y e a r P r o f i t M o m e n t u m %
Q u a r t e r R e v e n u e R E V R P S E A R N E P S E P S A g o M a r g i n % S F R E V E P S
S e p 0 2 7 , 7 4 6 . 0 2 6 2 9 1 4 1 6 0 . 2 5 0 . 2 2 3 5 . 2 + 3 + 2 3 + 1 5
D e c 0 2 8 , 5 4 1 . 0 1 0 1 3 - 4 - 2 0 . 2 4 0 . 2 5 3 0 . 6 + 1 + 1 1 - 2
M a r 0 3 7 , 8 3 5 . 0 8 1 1 6 8 0 . 2 6 0 . 2 4 3 6 . 0 + 2 + 8 + 8
J u n 0 3 • 8 , 0 6 5 . 0 1 1 1 4 4 7 0 . 2 3 0 . 2 2 3 1 . 0 0 + 1 0 + 6
S e p 0 3 8 , 2 1 5 . 0 6 6 - 4 - 4 0 . 2 4 0 . 2 5 3 1 . 8 - 3 + 6 - 4
D e c 0 3 1 0 , 1 5 3 . 0 1 9 1 9 1 7 1 7 0 . 2 8 0 . 2 4 3 0 . 1 - 2 + 2 0 + 1 6
M a r 0 4 9 , 1 7 5 . 0 1 7 1 7 1 6 1 5 0 . 3 0 0 . 2 6 3 5 . 5 + 1 + 1 6 + 1 6
J u n 0 4 • 9 , 2 9 2 . 0 1 5 1 5 0 0 0 . 2 3 0 . 2 3 2 6 . 9 - 3 + 1 4 0
T 4 Q 3 6 , 8 3 5 . 0 1 4 1 4 7 7 1 . 0 5 3 1 . 0
S e p 0 4 E 8 , 9 5 7 . 9 9 9 2 5 2 5 0 . 3 0 0 . 2 4 3 6 . 4 + 8 + 2 3
D e c 0 4 E 1 0 , 6 0 7 . 8 4 5 1 4 1 4 0 . 3 2 0 . 2 8 3 2 . 8 + 5 + 1 4
M a r 0 5 E 9 , 5 4 6 . 1 4 4 7 7 0 . 3 2 0 . 3 0 3 6 . 4 + 4 + 7
J u n 0 5 E • 9 , 7 3 9 . 0 5 5 3 0 3 0 0 . 3 0 0 . 2 3 3 3 . 5 + 5 + 2 4
F 4 Q E 3 8 , 8 5 0 . 8 5 6 1 8 1 8 1 . 2 4 3 4 . 7
P o i n t - t o - P o i n t G r o w t h R a t e s ( % ) L o n g - T e r m G r o w t h R a t e E s t i m a t e s ( % )
Y e a r s R E V R P S E A R N E P S M e d ia n E s t im a t e 1 2 . 0 %
1 1 4 1 4 7 7 N u m b e r o f E s t im a t e s 1 9
3 1 3 1 4 4 5 S t a n d a r d D e v ia t io n 3
5 1 3 1 3 8 9 D e f a u l t G R E E s t im a t e 1 0 . 0 %
1 0 2 3 2 1 2 5 2 4 A n a ly s t G R E E s t im a t e 1 0 . 0 %
1 5 2 9 2 7 3 1 2 9
2 0 3 5 3 1 3 1 2 8 E x p e c t e d R e p o r t D a t e 1 0 / 2 5 / 0 4
Page 21 of 21
Valuation Summary The different valuation methods above seem to indicate that Microsoft is slightly undervalued. Only the PEG ratio suggests that the stock is price accurately. Based upon the nature of the industry and the product life cycle for Microsoft, a target price of $29 per share is set to reflect a slight undervaluation in the market with a dividend yield of 1.1%. Holding MSFT shares over the next year based upon these factors should yield investors a relatively stable return of 8.5%. Based upon this valuation, Microsoft shares are rated neutral at current pricing levels.
CONCLUSION As stated previously, Microsoft carries a neutral rating. Based upon the current valuation of the stock, its prospects for future growth, the current state of the industry, and the overall health of the U.S. economy, the stock remains a great stock to hold in any portfolio. A target price of $29 per share is recommended. The following are the short-term catalysts and near-term risks for the stock: Catalysts
• Possible early release of Longhorn • Potential for increased PC demand in the 4th quarter • Management focus on cost efficiency • Special $3 per share dividend could cause upside with multiple expansion ex-
dividend Risks
• Linux and other open-source programs • Reduced pace of technological innovation • Delay of Longhorn release date • Software piracy and malicious code attacks
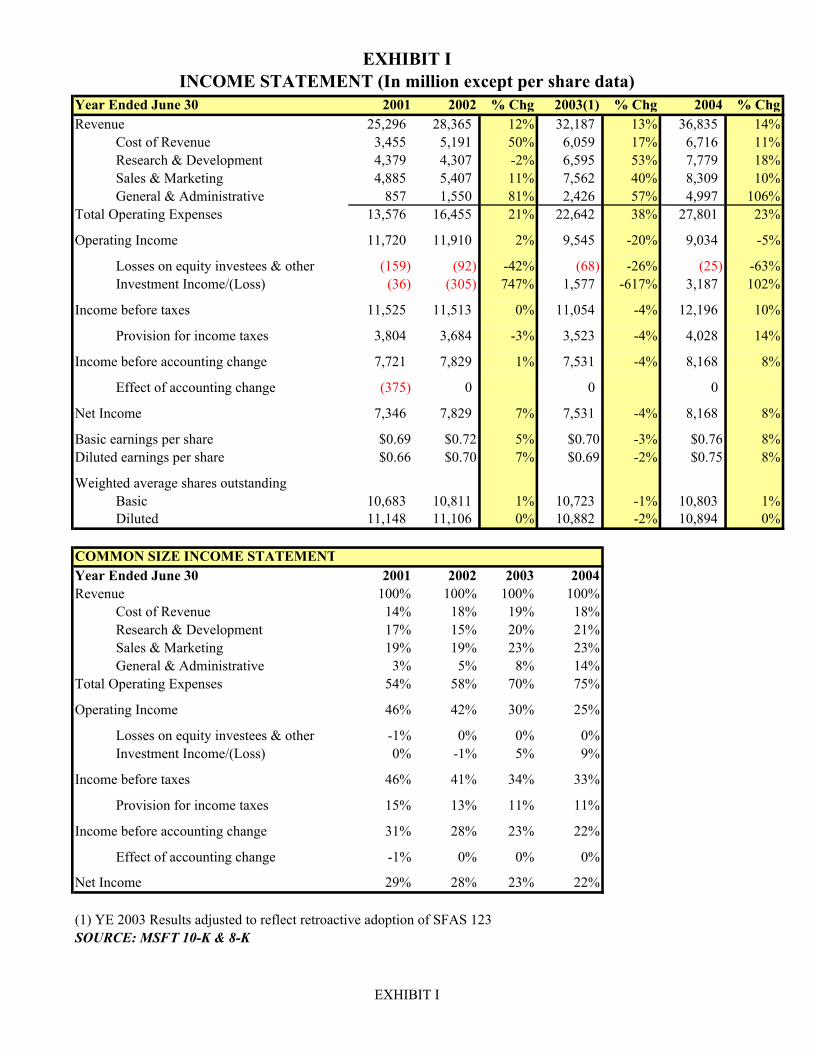
EXHIBIT IINCOME STATEMENT (In million except per share data)
Year Ended June 30 2001 2002 % Chg 2003(1) % Chg 2004 % ChgRevenue 25,296 28,365 12% 32,187 13% 36,835 14%
Cost of Revenue 3,455 5,191 50% 6,059 17% 6,716 11%Research & Development 4,379 4,307 -2% 6,595 53% 7,779 18%Sales & Marketing 4,885 5,407 11% 7,562 40% 8,309 10%General & Administrative 857 1,550 81% 2,426 57% 4,997 106%
Total Operating Expenses 13,576 16,455 21% 22,642 38% 27,801 23%
Operating Income 11,720 11,910 2% 9,545 -20% 9,034 -5%
Losses on equity investees & other (159) (92) -42% (68) -26% (25) -63%Investment Income/(Loss) (36) (305) 747% 1,577 -617% 3,187 102%
Income before taxes 11,525 11,513 0% 11,054 -4% 12,196 10%
Provision for income taxes 3,804 3,684 -3% 3,523 -4% 4,028 14%
Income before accounting change 7,721 7,829 1% 7,531 -4% 8,168 8%
Effect of accounting change (375) 0 0 0
Net Income 7,346 7,829 7% 7,531 -4% 8,168 8%
Basic earnings per share $0.69 $0.72 5% $0.70 -3% $0.76 8%Diluted earnings per share $0.66 $0.70 7% $0.69 -2% $0.75 8%
Weighted average shares outstandingBasic 10,683 10,811 1% 10,723 -1% 10,803 1%Diluted 11,148 11,106 0% 10,882 -2% 10,894 0%
COMMON SIZE INCOME STATEMENTYear Ended June 30 2001 2002 2003 2004Revenue 100% 100% 100% 100%
Cost of Revenue 14% 18% 19% 18%Research & Development 17% 15% 20% 21%Sales & Marketing 19% 19% 23% 23%General & Administrative 3% 5% 8% 14%
Total Operating Expenses 54% 58% 70% 75%
Operating Income 46% 42% 30% 25%
Losses on equity investees & other -1% 0% 0% 0%Investment Income/(Loss) 0% -1% 5% 9%
Income before taxes 46% 41% 34% 33%
Provision for income taxes 15% 13% 11% 11%
Income before accounting change 31% 28% 23% 22%
Effect of accounting change -1% 0% 0% 0%
Net Income 29% 28% 23% 22%
(1) YE 2003 Results adjusted to reflect retroactive adoption of SFAS 123SOURCE: MSFT 10-K & 8-K
EXHIBIT I

EXHIBIT IIBALANCE SHEET (In millions)
Year Ending June 30 2002 %of assets 2003(1) %of assets 2004%of
assetsCash & cash equivalents 3,016 4.5% 6,438 7.9% 15,982 17.3%Short-term investments 35,636 52.7% 42,610 52.1% 44,610 48.3%
Total cash & short-term investments 38,652 57.1% 49,048 60.0% 60,592 65.6%
Accounts receivable, net 5,129 7.6% 5,196 6.4% 5,890 6.4%Inventories 673 1.0% 640 0.8% 421 0.5%Deferred income taxes 2,112 3.1% 2,506 3.1% 2,097 2.3%Other 2,010 3.0% 1,583 1.9% 1,566 1.7%
Total Current Assets 48,576 71.8% 58,973 72.2% 70,566 76.4%
Property plant & equipment, net 2,268 3.4% 2,223 2.7% 2,326 2.5%Equity and other investments 14,191 21.0% 13,692 16.8% 12,210 13.2%Goodwill 1,426 2.1% 3,128 3.8% 3,115 3.4%Intangible assets, net 243 0.4% 384 0.5% 569 0.6%Deferred income taxes 0 0.0% 2,161 2.6% 1,829 2.0%Other long-term assets 942 1.4% 1,171 1.4% 1,774 1.9%
TOTAL ASSETS 67,646 100.0% 81,732 100.0% 92,389 100.0%
LIABILITIES & STOCKHOLDERS EQUITYCurrent Liabilities
Accounts payable 1,208 1.8% 1,573 1.9% 1,717 1.9%Accrued compensation 1,145 1.7% 1,416 1.7% 1,339 1.4%Income taxes 2,022 3.0% 2,044 2.5% 3,478 3.8%Short-term unearned revenue 5,920 8.8% 7,225 8.8% 6,514 7.1%Other 2,449 3.6% 1,716 2.1% 1,921 2.1%
Total Current Liabilities 12,744 18.8% 13,974 17.1% 14,969 16.2%
Long-term unearned revenue 1,823 2.7% 1,790 2.2% 1,663 1.8%Deferred income taxes 398 0.6% 0 0.0% 0 0.0%Other long-term liabilities 501 0.7% 1,056 1.3% 932 1.0%
TOTAL LIABILITIES 15,466 22.9% 16,820 20.6% 17,564 19.0%
Stockholders EquityCommon stock & paid-in capital 31,647 46.8% 49,234 60.2% 56,396 61.0%Retained earnings 20,533 30.4% 15,678 19.2% 18,429 19.9%
TOTAL STOCKHOLDERS EQUITY 52,180 77.1% 64,912 79.4% 74,825 81.0%
TOTAL LIABILITIES & STOCKHOLDERS EQUITY 67,646 100.0% 81,732 100.0% 92,389 100.0%
(1) YE 2003 Results adjusted to reflect retroactive adoption of SFAS 123SOURCE: MSFT 10-K & 8-K
EXHIBIT II

EXHIBIT IIISTATEMENT OF CASH FLOWS (In millions)
Year Ended June 30 2001 2002 2003(1) 2004Operations
Net Income 7,346 7,829 7,531 8,168Cumulative effect of accounting change, net of tax 375 0 0Depreciation, amortization, and other noncash items 1,536 1,084 1,393 1,186Stock based compensation 0 0 3,749 5,734Net recognized loss on investments 2,221 2,424 380 (1,296)Stock option income tax benefits 2,066 1,596 1,365 1,100Deferred income taxes (420) (416) (894) (1,479)Unearned revenue 6,970 11,152 12,519 11,777Recognition of unearned revenue (6,369) (8,929) (11,292) (12,527)Accounts receivable (418) (1,623) 187 (687)Other current assets (482) (264) 412 478Other long-term assets (330) (9) (28) 34Other current liabilities 774 1,449 35 2,063Other long-term liabilities 153 216 440 75
Net Cash from Operations 13,422 14,509 15,797 14,626
FinancingCommon stock issued 1,620 1,497 2,120 2,748Common stock purchased (6,074) (6,069) (6,486) (3,383)Repurchase of put warrants (1,367) 0 0 0Common stock dividends 0 0 (857) (1,729)Other, net 235 0 0 0
Net Cash used for Financing (5,586) (4,572) (5,223) (2,364)
InvestingAdditions to property and equipment (1,103) (770) (891) (1,109)Acquisitions of companies, net of cash required 0 0 (1,063) (4)Purchase of investments (66,346) (89,386) (89,621) (92,495)Maturities of investments 5,867 8,654 9,205 5,561Sales of investments 52,848 70,657 75,157 85,302
Net cash used for investing (8,734) (10,845) (7,213) (2,745)
Net Change in Cash and Equivalents (898) (908) 3,361 9,517
Effect of exchange rates on cash & equivalents (26) 2 61 27
Cash and equivalents, beginning of year 4,846 3,922 3,016 6,438Cash and equivalents, end of year 3,922 3,016 6,438 15,982
(1) YE 2003 Results adjusted to reflect retroactive adoption of SFAS 123SOURCE: MSFT 10-K & 8-K
EXHIBIT III

EXHIBIT IVMICROSOFT RATIO ANALYSIS
2002 2003 2004Internal Liquidity Ratios
Current Ratio 3.81 4.22 4.71Quick Ratio 3.44 3.88 4.44Receivables Turnover 5.53 6.19 6.25Collection Period 66 59 58Inventory Turnover 7.71 9.47 15.95Processing Period 47 39 23Payables Turnover 4.30 3.85 3.91Payment Period 85 95 93Cash Conversion Cycle 28 3 -12
Operating Efficiency RatiosSales/Total Assets 0.42 0.39 0.40
Operating Profitability RatiosGross Profit Margin 82% 81% 82%Operating Profit Margin 41% 34% 33%Net Profit Margin 28% 23% 22%Return on Equity 15% 12% 11%
EXHIBIT IV
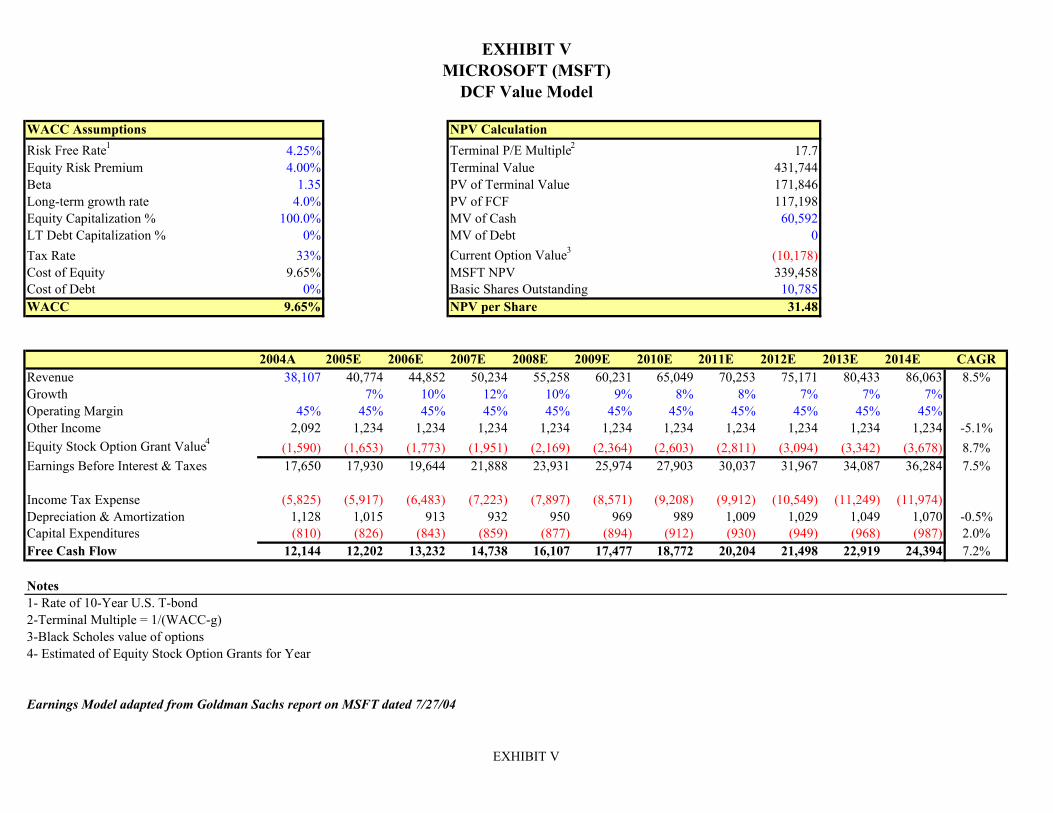
EXHIBIT VMICROSOFT (MSFT)
DCF Value Model
WACC Assumptions NPV CalculationRisk Free Rate1 4.25% Terminal P/E Multiple2 17.7Equity Risk Premium 4.00% Terminal Value 431,744Beta 1.35 PV of Terminal Value 171,846Long-term growth rate 4.0% PV of FCF 117,198Equity Capitalization % 100.0% MV of Cash 60,592LT Debt Capitalization % 0% MV of Debt 0Tax Rate 33% Current Option Value3 (10,178)Cost of Equity 9.65% MSFT NPV 339,458Cost of Debt 0% Basic Shares Outstanding 10,785WACC 9.65% NPV per Share 31.48
2004A 2005E 2006E 2007E 2008E 2009E 2010E 2011E 2012E 2013E 2014E CAGRRevenue 38,107 40,774 44,852 50,234 55,258 60,231 65,049 70,253 75,171 80,433 86,063 8.5%Growth 7% 10% 12% 10% 9% 8% 8% 7% 7% 7%Operating Margin 45% 45% 45% 45% 45% 45% 45% 45% 45% 45% 45%Other Income 2,092 1,234 1,234 1,234 1,234 1,234 1,234 1,234 1,234 1,234 1,234 -5.1%Equity Stock Option Grant Value4 (1,590) (1,653) (1,773) (1,951) (2,169) (2,364) (2,603) (2,811) (3,094) (3,342) (3,678) 8.7%Earnings Before Interest & Taxes 17,650 17,930 19,644 21,888 23,931 25,974 27,903 30,037 31,967 34,087 36,284 7.5%
Income Tax Expense (5,825) (5,917) (6,483) (7,223) (7,897) (8,571) (9,208) (9,912) (10,549) (11,249) (11,974)Depreciation & Amortization 1,128 1,015 913 932 950 969 989 1,009 1,029 1,049 1,070 -0.5%Capital Expenditures (810) (826) (843) (859) (877) (894) (912) (930) (949) (968) (987) 2.0%Free Cash Flow 12,144 12,202 13,232 14,738 16,107 17,477 18,772 20,204 21,498 22,919 24,394 7.2%
Notes1- Rate of 10-Year U.S. T-bond2-Terminal Multiple = 1/(WACC-g)3-Black Scholes value of options 4- Estimated of Equity Stock Option Grants for Year
Earnings Model adapted from Goldman Sachs report on MSFT dated 7/27/04
EXHIBIT V