mt2 wk4 s8 notes economic models
TRANSCRIPT
8/11/2019 MT2 Wk4 S8 Notes Economic Models
http://slidepdf.com/reader/full/mt2-wk4-s8-notes-economic-models 1/7
Model Thinking Class
1
Session 8: Economic Growth
8.1 – Introduction to Growth
Economic Growth: Why some countries are rich
and some are poor.
Models:(a)
Exponential Growth (compounding growth)
(b)
Economic Growth (limits – without innovation
growth stops)
(c) Solow’s Growth Model (innovation leverage)
(d) Extensions
Gross Domestic Product (GDP):
Total market value of all goods and services
Why Nations Fail (Robinson & ?) Real GDP (inflation adjusted growth) – avg ~3-4%
2008-2010 Recession:
Drop in growth during financial meltdown
China’s Growth Rate:
very highrelative to
developed
countries
Japan’s Growth: Exponential Growth: Put money in the bank and it
just grows and grows;
Economic Growth: Start fast and then begins to
tail off; Life
Satisfaction
vs. GDP. Note
above $30K,
NO. Below
$10K, YES.

8/11/2019 MT2 Wk4 S8 Notes Economic Models
http://slidepdf.com/reader/full/mt2-wk4-s8-notes-economic-models 2/7
Model Thinking Class
2
8.2 – Exponential Growth
Key Topics:
Compounding
Exponential Growth
Rule of 72
Compounding:
PV dollars @ r% interest for n years
PV = present value, FV = future value
Example: Growth rate impact on national wealth Rule of 72:Divide the growth rate (%/year) into 72 for an
estimate of the number of years for GDP to
DOUBLE.
Interest Years
2 % ~ 36
6 % ~ 12
8 % ~ 9
12 % ~ 6
Quiz: Let's use our growth model to compare two countries: Country 1 has a growth rate of 8% while Country 2
has a growth rate of 2%. How many more years does it take Country 2 to double its GDP, relative to Country 1?
(Hint: use the rule of 72). (a) 9 years, (b) 36 years, (c) 27 years, (d) 50 years
Anaylsis: ⁄ and : ⁄ ; Ans: (c) 27
Explanation: First, find the number of years it takes each country to double its GDP: Country 1: 72/8 = 9
Country 2: 72/2 = 36; now find the difference; 36 – 9 = 27.
It takes 27 more years for Country 2 to double its GDP than it takes Country 1.
US Basic Growth Model: Impact of time to double
GDP with 3% versus 4% growth rates.
Continuous Compounding:
Over years
Annually:
Monthly:
Daily: Continuously:
Recall
; exponential
Linear: Exponential:
Summary: Now understand that compounding growth is important to grow GDP exponentially and that
a few differences in interest rates make a large difference over time.

8/11/2019 MT2 Wk4 S8 Notes Economic Models
http://slidepdf.com/reader/full/mt2-wk4-s8-notes-economic-models 3/7
Model Thinking Class
3
8.3 – Basic Growth Model
Basic Model:
Workers
Coconuts (can eat or use to build machines)
Picking Machines (help pick coconuts faster)
Machines wear out (degrade over time)
Parameters:
Workers at time t
Machines at time t
Output of Coconuts at time t
Number Eaten Consumed at time t Number invested in Machines at time t
Savings rate
Depreciation rate
Assumptions:
(1) Output is increasing and concave in labor
and machines.
(2) Output is consumed or invested
and
(3)
Machines can be built but depreciate
Diminishing Returns to Scale:
Concave means that the first machine is worth
more than the 2nd, the 2nd more than the 3rd , and
the 3rd more than the 4th.
Simplification:
, workers
Example:
, depreciation & savings rates
Year 1: 4 machines
√
Year 2:
=4+6-1=9
Example (Cont.):
Year 2: 9 machines
√
Year 3:
=9+9-2=16
√
What happens in time?:
Year N: 400 machines
√
Year N+1
=200+60-100=360
Note: Number of Machines in N+1 is less than inYear N
Growth Maximum at Equilibrium:
Occurs when
Investment = Depreciation
Example:
√ √
(√ ) implies √ and
Check Equilibrium: Year K: 144 machines
√
Year K+1
=144+36-36=144

8/11/2019 MT2 Wk4 S8 Notes Economic Models
http://slidepdf.com/reader/full/mt2-wk4-s8-notes-economic-models 4/7
Model Thinking Class
4
Quiz: The economies of two small countries operate with the same output equation: Output= 5√M. Both countries
have the same depreciation rate: d=0.10. However, Country 1 is made up of very patient people who are able to
sustain a high savings rate: s=0.90. Country 2, on the other hand, is made up of very impatient people with a low
savings rate: s=0.10. What is the difference in long run equilibrium output between Country 1 and Country 2? (a)
Country 1 has 2000 more units of output. (b) Country 1 has 200 more units of output. (c) Country 1 has 225 more
units of output. (d) Country 1 has 1025 more units of output.
Analysis: Equilibrium and investment = depreciation. . Compare for both. and √ . For the second country,
and √
Ans: (a) 2000, Question really wants difference in machines produced, not overall output. See Explanation.
Explanation: Equilibrium occurs when Investment = Depreciation. Formally, this means:
Savings Rate * Output = Depreciation Rate * M.
To find the equilibria, we sol ve for M: Country 1:(5√M)(0.90)=(0.10)(M) With algebra you find that M=2025
Country 2: (5√M)(0.10)=(0.10)(M), In this case, M=25
Now find the difference between these two results: 2025−25=2000
Therefore, Country 1 has 2000 more units of output at long run equilibrium than does Country 2.
Growth Model Irony: There is a limit to growth!
Why? Depreciation is Linear . Output is Concave!
Extending Growth:
Innovation required to extend growth.
Summary: Simple model shows growth is limited. Sustained growth requires new innovation.
8.4 – Solow Growth Model
One variable Enables Growth:
Bob Solow (MIT Economist) – need multiple
models to understand the economy.
Parameters:
Workers at time t
Capital at time t
Output at time t
Technology at time t
Equation:
Interpretation:
then
is an indicator of the importance of capital in the
economy being larger for more capital intensive
industry.
Recall Example: Note: M(machines)=K(capital)
√ √
(√ ) √ and
√
Add Innovation Parameter:
√
√
(√ ) √ and
√
Observation:
Productivity doubled (2x) and Equilibrium point
quadrupled (4x)
.
Why?
(1) making more productive hence more stuff,
(2) getting more stuff encourages investing in more
machines.
Innovation Multiplier:
Labor and capital is more productive
Incentive is then to invest in more capital
Additive or Multiplicative Effect?:
Output quadrupled from doubling
Is it 2+2 or 22?
Innovation Parameter:
√
(√ ) √
√ √ and
√

8/11/2019 MT2 Wk4 S8 Notes Economic Models
http://slidepdf.com/reader/full/mt2-wk4-s8-notes-economic-models 5/7
Model Thinking Class
5
Quiz: A country's economy originally operates according to the following output equation: Output= 5√M. This
country has a depreciation rate of d=0.10, and savings rate of s=0.40. However, an innovation allows this country
to double its output, so that its new output equation is: Output= 10√M. Following this innovation, how much does
equilibrium output increase? (The answer will be in terms of units) (a) 1200 units, (b) 400 units, (c) 2 units, (d) 200
units
Analysis: Equilibrium and investment = depreciation. . Compare for both.
and √ . For the second country, and √
Ans: (a) 1200 units. Again not that this is the number of machines not GDP.
Explanation: First find the equilibrium without innovation: (5√M)(0.4)=(0.1)(M) ; M=400.
After the innovation, the equilibrium equation is: (10√M)(0.4)=(0.1)(M) ; Now M=1600.Tthe difference between the
equilibrium outputs before and after the innovation: 1600−400=1200
So, following the innovation, the equilibrium output increases by 1200 units.
Solow Model:
Growth can continue with changes to technology
(increases equilibrium level)
Endogenous Growth: Labor can go to output or
technology/idea creation
Growth ceases without innovation, so nearly
everyone should be pro innovation.
Quiz: Source of each quote (Obama or Reagan)?
(a) “In America, innovation doesn’t just change our lives. It is how we make our living.”
(b) “The remarkable thing is that although basic research does not begin with a particular practical goal, when you
look at the results over the years, it ends up being one of the most practical things government does. . . “
Ans: (a) by Obama, (b) by Reagan
8.5 – Will China Continue to Grow?
Recall Japan & China Growth Rates:
Reasonable to expect China’s Growth Rate to slow.
Analysis: Year K: 3600 machines
; depreciation & savings rates
√ ( per capita income)
Year K+1
=4440
Analysis (cont.): Year K+1: 4400 machines
√ ( per capita income)
Year K+2
=4440+1340-440=5340
Analysis (cont.): Year K+2: 5340 machines
√ ( per capita income)
Year K+3
=5340+1460-530=6270
Analysis (cont.): Year K: 10,000 machines √
=11,000
√
Analysis (cont.): Year P: 22,500 machines
√
=23,250
8/11/2019 MT2 Wk4 S8 Notes Economic Models
http://slidepdf.com/reader/full/mt2-wk4-s8-notes-economic-models 6/7
Model Thinking Class
6
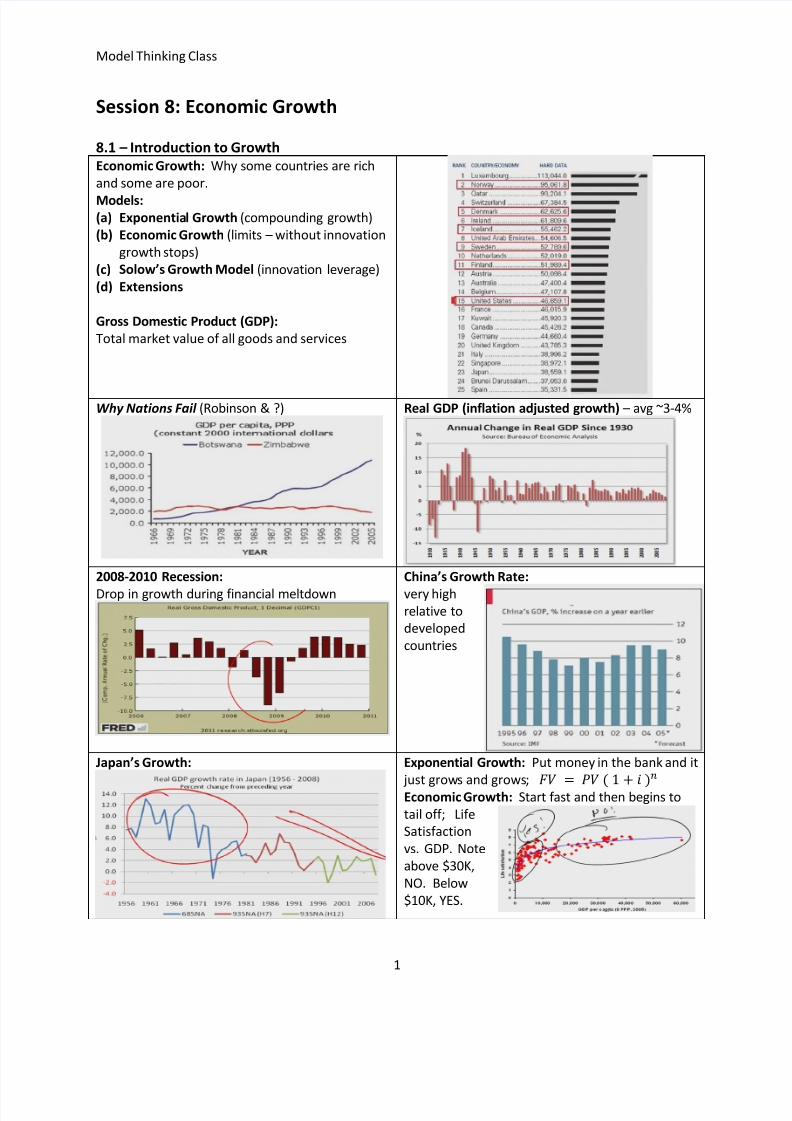
Graphical Interpretation: Equation:
For China to continue to grow, they will have
to leverage innovation but there has
never been innovation that sustains 8-9%
growth rate. China is most likely to follow slowing growth
rates such as Japan.
Summary: Two types of growth drivers, capital investment and innovation. Once capital has reached a
certain level and growth rate has slowed, then innovation must be introduced in order to mitigate
natural decline in growth rates.
8.6 – Why Do Some Countries Not Grow?
What has not been considered?:
Equality, Culture, etc.
Why Nations Fail insights.
Recall Botswana & Zimbabwe:
Lessons:
Growth requires a strong central government
to protect capital and investment
BUT that government cannot be controlled by
a select few. Extraction (by protected
government supporters) limits growth by
lowering investment and capital.
Increases in innovation means less labor is
required.
Growth requires creative destruction
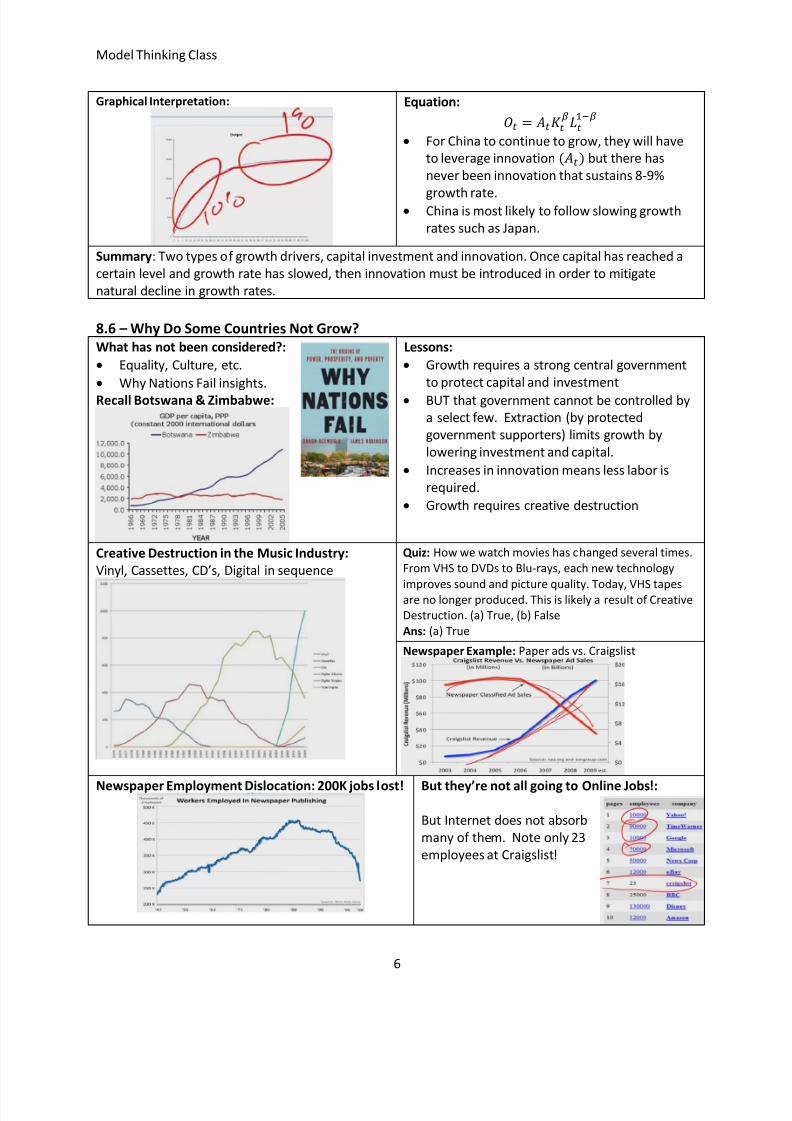
Creative Destruction in the Music Industry:
Vinyl, Cassettes, CD’s, Digital in sequence
Quiz: How we watch movies has changed several times.
From VHS to DVDs to Blu-rays, each new technology
improves sound and picture quality. Today, VHS tapesare no longer produced. This is likely a result of Creative
Destruction. (a) True, (b) False
Ans: (a) True
Newspaper Example: Paper ads vs. Craigslist
Newspaper Employment Dislocation: 200K jobs lost! But they’re not all going to Online Jobs!:
But Internet does not absorb
many of them. Note only 23
employees at Craigslist!

8/11/2019 MT2 Wk4 S8 Notes Economic Models
http://slidepdf.com/reader/full/mt2-wk4-s8-notes-economic-models 7/7
Model Thinking Class
7
Fertility of the Model:
Personal Application – at some point personal
innovation and reinvention is necessary to not
be displaced.
Summary:
Growth rates are supported by innovation in
the long run.
Need strong central government that doesn’t
extract too much which starves capital and
innovation Creative destruction is essential to innovation
that is necessary to sustain growth rates.