mto overlay design the following presentation contains references to figures 6.02 and 6.03, tables...
TRANSCRIPT

MTO OVERLAY DESIGNMTO OVERLAY DESIGN
The following presentation contains references to The following presentation contains references to Figures Figures 6.026.02 and and 6.036.03, , Tables 6.01Tables 6.01 and and 6.056.05, “, “Overlay Design ModelOverlay Design Model” ” and “and “Overlay Example ProblemOverlay Example Problem”, all of which are posted ”, all of which are posted under subsection 2.6 of the course notes on the instructor’s under subsection 2.6 of the course notes on the instructor’s website. Viewer discretion is advised as some scenes contain website. Viewer discretion is advised as some scenes contain material of a graphic nature.material of a graphic nature.

The basic problem is to test the The basic problem is to test the pavement’s strength and compare it to the pavement’s strength and compare it to the strength required to carry an estimated strength required to carry an estimated number of standard axle load repetitionsnumber of standard axle load repetitions
Instead of coring surveys and Instead of coring surveys and guesstimates of strength, its more guesstimates of strength, its more economical to measure deflections under economical to measure deflections under standard loads as with…standard loads as with…
THE BENKELMAN BEAMTHE BENKELMAN BEAM
oror
THE DYNAFLECTTHE DYNAFLECT

Deflection TestsDeflection TestsThe Dynaflect is more efficient for mass The Dynaflect is more efficient for mass inventory (many tests) but the original inventory (many tests) but the original strengthening technology is based on strengthening technology is based on Benkelman Beam Rebounds (BBR’s)Benkelman Beam Rebounds (BBR’s)
The Dynflect Sensor 1, (DYN) readings The Dynflect Sensor 1, (DYN) readings must first be converted into BBR’smust first be converted into BBR’s
in Ontario this conversion is made using in Ontario this conversion is made using the following equation:the following equation:
20095.0019.00024.0 DYNDYNBB
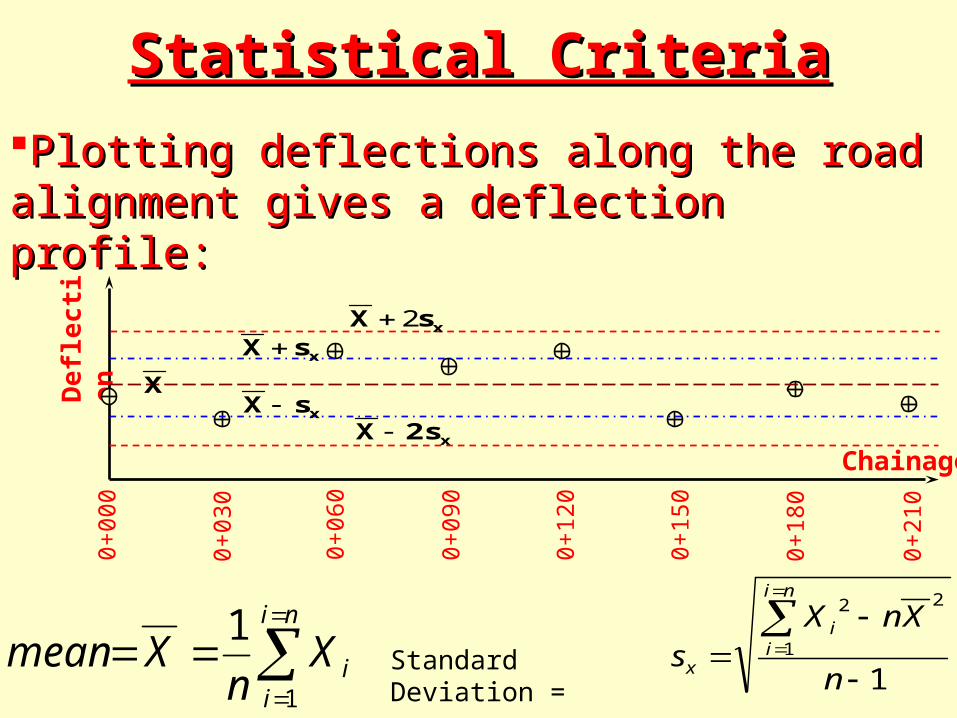
Statistical CriteriaStatistical CriteriaPlotting deflections along the road Plotting deflections along the road alignment gives a deflection profile:alignment gives a deflection profile:
0+
000
0+
030
0+
060
0+
090
0+
120
0+
150
0+
180
0+
210
Defl
ecti
on
Chainage
ni
iiXn
Xmean1
11
1
22
n
XnXs
ni
ii
x
XxsX
xsX 2
xsX x2sX
Standard Deviation =

Design Deflection, DDDesign Deflection, DD Assuming the variation in deflections is Assuming the variation in deflections is random and therefore normally distributed, random and therefore normally distributed, using the mean plus two standard using the mean plus two standard deviations will ensure that the maximum deviations will ensure that the maximum deflection is taken into consideration 95% deflection is taken into consideration 95% of the timeof the time
Engineers always like to consider the Engineers always like to consider the worst case scenario in designworst case scenario in design
The pavement is at its weakest in the The pavement is at its weakest in the early spring, when the frost has just come early spring, when the frost has just come out of the ground...out of the ground...
Design Deflection, DD Design Deflection, DD (Continued)(Continued)
The tests are usually takenThe tests are usually taken some time some time later, quite often in the autumn when the later, quite often in the autumn when the pavement structure has stabilizedpavement structure has stabilized
An adjustment is therefore made to An adjustment is therefore made to reflect the pavement’s strength in the early reflect the pavement’s strength in the early springspring
Standard gravel or crushed
All TypesSoil cement-stabilized base
1.4with asphalt concrete surface
All TypesFull depth construction - more
1.4than in April. Peak-to-peak
than 7" of asphalt concrete curvature, unlike standarddirectly on subsoil construction, is gradual.
above, the peak deflection
Gravel
All TypesDeep strength construction
1.4Peak deflection generally
with thin granular base layer occurs in June or July rather
Sand and1.6
construction, a spring/fall ratio
asphalt concrete surface 2.0 of high plasticity in standard
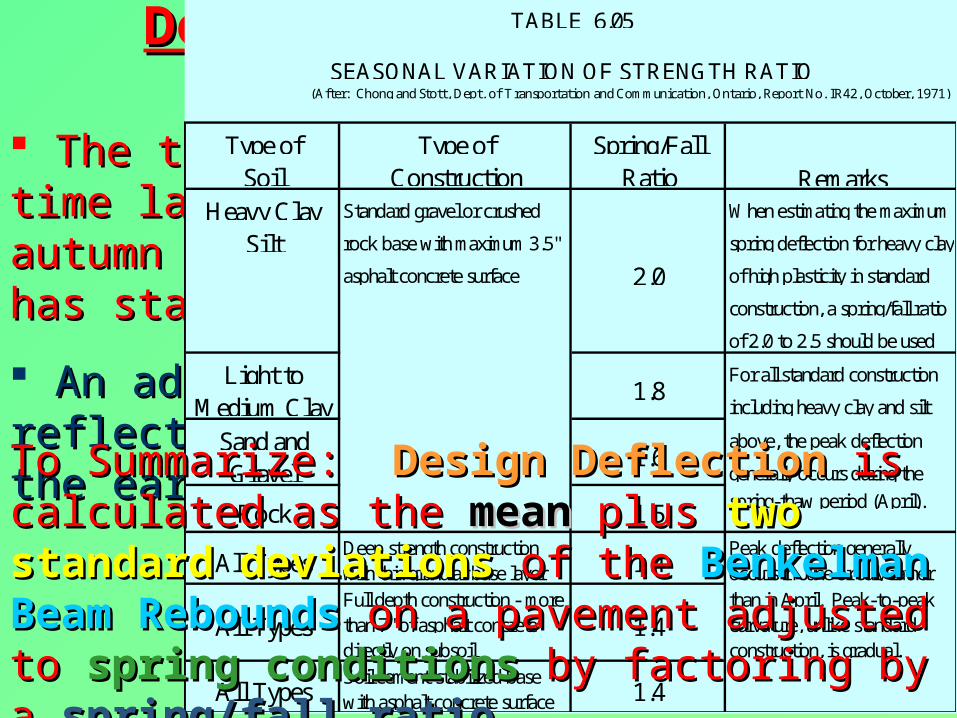
TABLE 6.05
SEASONAL VARIATION OF STRENGTH RATIO(After: Chong and Stott, Dept. of Transportation and Communication, Ontario, Report No. IR42, October, 1971)
Type of Type of Spring/FallRemarksSoil Construction Ratio
Heavy Clay When estimating the maximum
Silt rock base with maximum 3.5" spring deflection for heavy clay
of 2.0 to 2.5 should be used
Light to1.8
For all standard construction
Medium Clay including heavy clay and silt
generally occurs during the
Rock 1.5 spring-thaw period (April).
To Summarize: To Summarize: Design DeflectionDesign Deflection is is calculated as the calculated as the meanmean plus plus two two standard deviationsstandard deviations of the of the Benkelman Benkelman Beam ReboundsBeam Rebounds on a pavement adjusted on a pavement adjusted to to spring conditionsspring conditions by factoring by a by factoring by a spring/fall ratiospring/fall ratio
Maximum Tolerable Maximum Tolerable Deflection, MTDDeflection, MTD
Studies in Ontario (and elsewhere) have Studies in Ontario (and elsewhere) have correlated the design deflection of a correlated the design deflection of a
pavement with its ability to carry traffic pavement with its ability to carry traffic loads as characterized by the DTN. loads as characterized by the DTN.
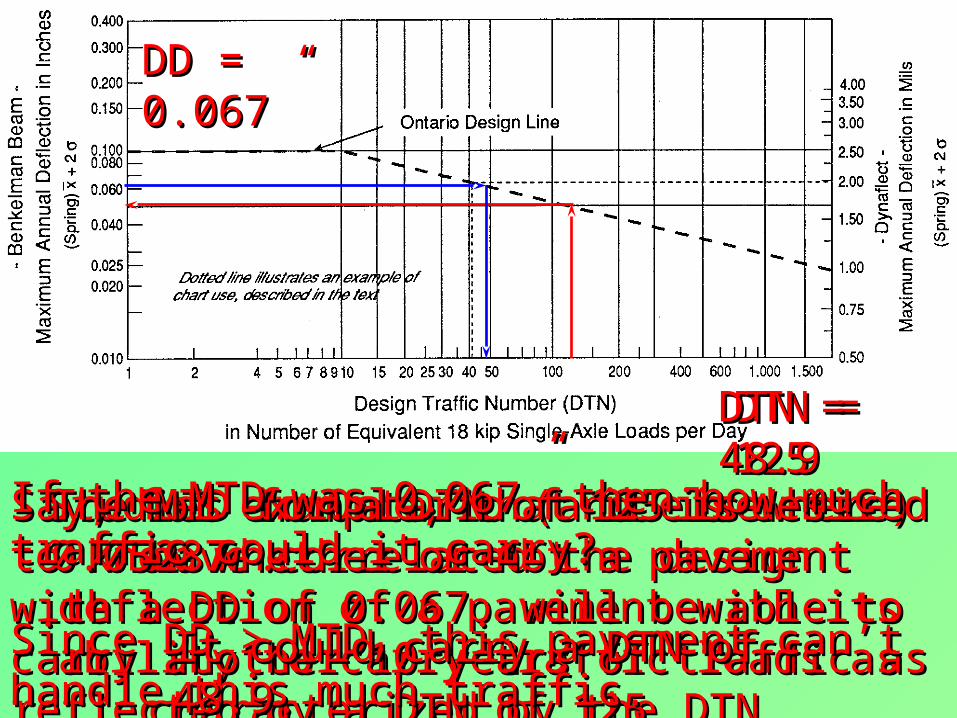
Say, for example, that it is desired to know Say, for example, that it is desired to know whether or not a pavement with a DD of whether or not a pavement with a DD of 0.067” will be able to carry another 10 0.067” will be able to carry another 10 years of traffic as reflected by a DTN of years of traffic as reflected by a DTN of 125.125.
The MTD for a DTN of 125 is 0.05287”.The MTD for a DTN of 125 is 0.05287”.
Since DD > MTD, this pavement can’t Since DD > MTD, this pavement can’t handle this much traffic.handle this much traffic.
If the MTD was 0.067” then how much If the MTD was 0.067” then how much traffic could it carry?traffic could it carry?
It could carry a DTN of 48.9.It could carry a DTN of 48.9.
DD = DD = 0.067”0.067”
DTN = DTN = 125125
DTN = DTN = 48.948.9

For the portion of this relationship for DTN For the portion of this relationship for DTN > 10, the following equation can be used > 10, the following equation can be used instead of the graph:instead of the graph:
"10.01787907.0
2523450.0
DTNMTD

Required StrengtheningRequired Strengthening Through extensive research, the Asphalt Through extensive research, the Asphalt Institute and MTO have developed design Institute and MTO have developed design curves relating Design Deflection to curves relating Design Deflection to Strengthening RequirementsStrengthening Requirements
Each curve is for a different MTD value Each curve is for a different MTD value which range from 0.02” up to 0.10”which range from 0.02” up to 0.10” The Strengthening is in terms of inches of The Strengthening is in terms of inches of GBE (new Granular A)GBE (new Granular A)
InterpolationInterpolation
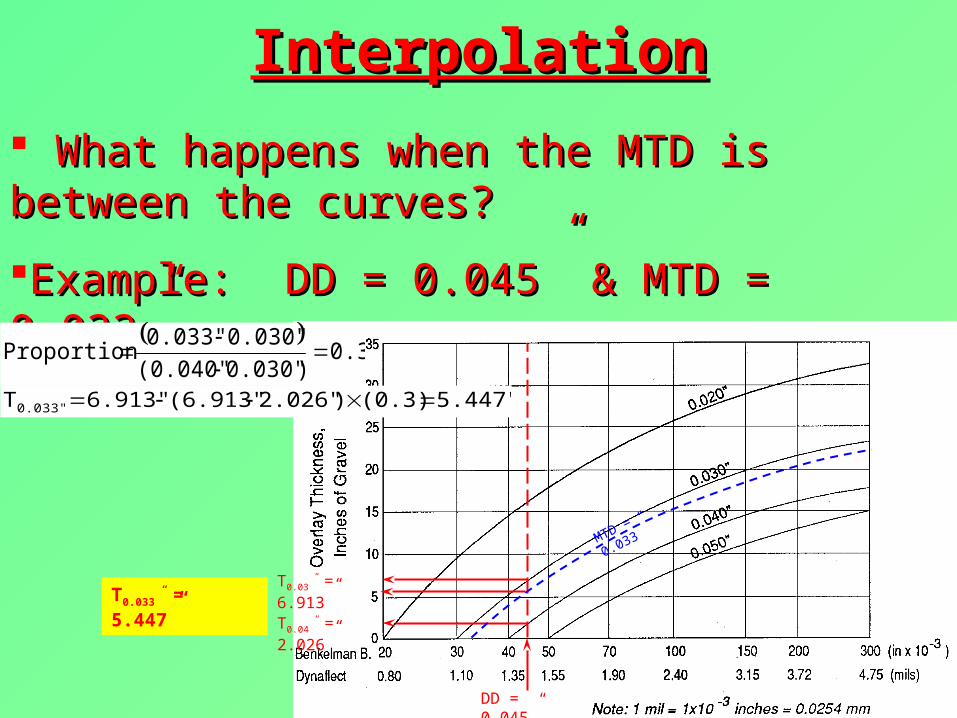
What happens when the MTD is between What happens when the MTD is between the curves?the curves?
Example: DD = 0.045” & MTD = 0.033” Example: DD = 0.045” & MTD = 0.033”
T0.03” = 6.913”T0.04” = 2.026”
MTD =
0.033”
0.3
)0.030"(0.040"0.030"0.033"
Proportion
5.447"(0.3))2.026"(6.913"6.913"T0.033"
DD = 0.045”
T0.033” = 5.447”

Overlay Thickness Overlay Thickness EquationsEquations
bMTDDD
MTDDDaT
)(
)(
MTD a b MTD a b
0.020 33.880888 0.0250955 0.070 14.948930 0.0892606
0.030 26.179140 0.0418036 0.075 11.960133 0.0723573
0.040 19.330437 0.0427002 0.080 11.927564 0.0832181
0.050 14.308789 0.0414468 0.090 9.600747 0.0728982
0.060 14.342670 0.0740099 0.100 12.565574 0.1565992
Each curve on these graphs Each curve on these graphs has an equation with two has an equation with two coefficients, a and b in the coefficients, a and b in the form…form…
WARNINGWARNING
Only the MTD Only the MTD values values tabulated can tabulated can be used in be used in this this equation!!!!!!equation!!!!!!
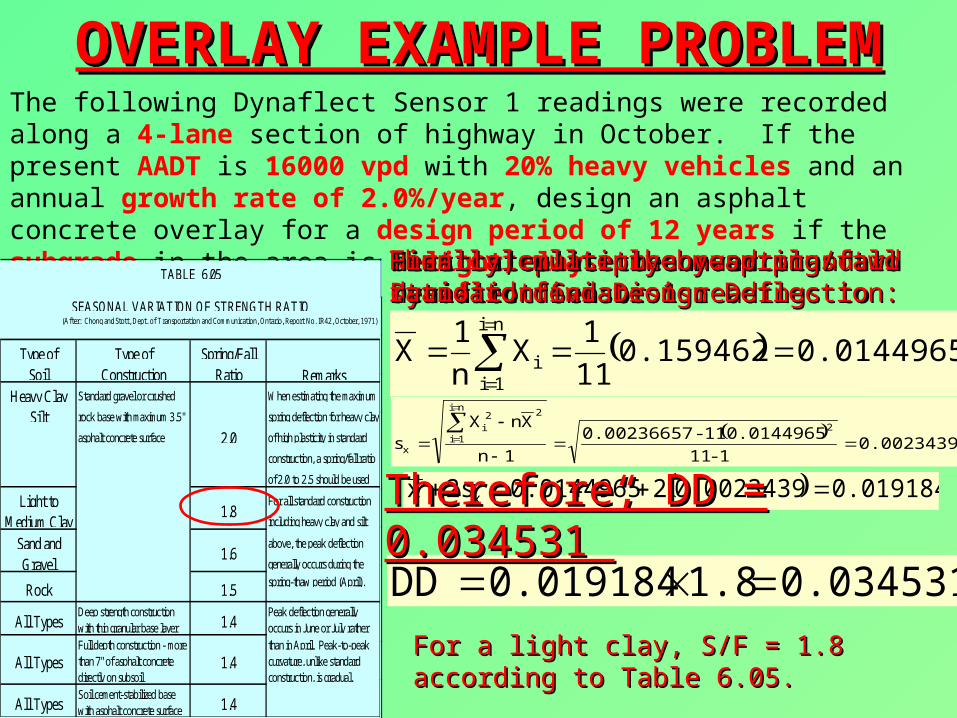
OVERLAY EXAMPLE OVERLAY EXAMPLE PROBLEMPROBLEMThe following Dynaflect Sensor 1 readings were recorded along a 4-
lane section of highway in October. If the present AADT is 16000 vpd with 20% heavy vehicles and an annual growth rate of 2.0%/year, design an asphalt concrete overlay for a design period of 12 years if the subgrade in the area is a light clay.
STASTA Sensor Sensor 11
0+0300+030 0.650.65
0+0600+060 0.600.60
0+0900+090 0.620.62
0+1200+120 0.570.57
0+1500+150 0.630.63
0+1800+180 0.610.61
0+2100+210 0.690.69
0+2400+240 0.820.82
0+2700+270 0.750.75
0+3000+300 0.680.68
0+3300+330 0.700.70
BBRBBR
0.0139640.013964
0.0124200.012420
0.0130320.013032
0.0115170.011517
0.0133410.013341
0.0127250.012725
0.0152330.015233
0.0195680.019568
0.0171940.017194
0.0149130.014913
0.0155550.015555
First step is to convert Dynaflect Sensor First step is to convert Dynaflect Sensor 1 readings to Benkelman Beam 1 readings to Benkelman Beam rebounds:rebounds: 20095.0019.00024.0 DYNDYNBB
013964.065.00095.065.0019.00024.0 2 BB 012420.060.00095.060.0019.00024.0 2 BB
Next calculate mean and standard Next calculate mean and standard deviation:deviation:
0.01449650.159462111
Xn1
Xni
1ii
0.0023439
1-110.014496511-0.00236657
1n
XnXs
2
ni
1i
22i
x
Then calculate the mean plus two Then calculate the mean plus two standard deviations:standard deviations:
0.0191840.002343920.01449652sx x
Finally, multiply by spring/fall ratio to Finally, multiply by spring/fall ratio to find Design Deflection:find Design Deflection:
Standard gravel or crushed
All TypesSoil cement-stabilized base
1.4with asphalt concrete surface
All TypesFull depth construction - more
1.4than in April. Peak-to-peak
than 7" of asphalt concrete curvature, unlike standarddirectly on subsoil construction, is gradual.
above, the peak deflection
Gravel
All TypesDeep strength construction
1.4Peak deflection generally
with thin granular base layer occurs in June or July rather
Sand and1.6
construction, a spring/fall ratio
asphalt concrete surface 2.0 of high plasticity in standard
TABLE 6.05
SEASONAL VARIATION OF STRENGTH RATIO(After: Chong and Stott, Dept. of Transportation and Communication, Ontario, Report No. IR42, October, 1971)
Type of Type of Spring/FallRemarksSoil Construction Ratio
Heavy Clay When estimating the maximum
Silt rock base with maximum 3.5" spring deflection for heavy clay
of 2.0 to 2.5 should be used
Light to1.8
For all standard construction
Medium Clay including heavy clay and silt
generally occurs during the
Rock 1.5 spring-thaw period (April).
For a light clay, S/F = 1.8 according to For a light clay, S/F = 1.8 according to Table 6.05.Table 6.05.
0.0345311.80.019184DD
Therefore, DD = Therefore, DD = 0.034531”0.034531”

OVERLAY EXAMPLE OVERLAY EXAMPLE (Continued)(Continued)Now to find the DTN from the traffic data given:Now to find the DTN from the traffic data given:
20291.86871002.0
116,000AADT12
f
TABLE 6.01
MTO LANE DISTRIBUTION FACTORS
(After: "Pavement Design and Rehabilitation Manual", 1990)
Lane DistributionHighway Type AADT (vpd) Factor, LDF
2 lanes All 1.00
< 5000 0.85
5000 - 15000 0.804 lanes
15000 - 25000 0.75
> 25000 0.70
< 15000 0.60
15000 - 25000 0.556 lanes
25000 - 40000 0.50
> 40000 0.45
TTii = 0.20 = 0.20; ; TTff = = 0.200.20
Since AADTSince AADTii =16,000, =16,000, LDFLDFii = = 0.750.75Since AADTSince AADTff =20,292, =20,292, LDFLDFff = = 0.750.75
FIGURE 6.03b - MTO TRUCK FACTORS: 4-LANE HIGHWAYS
0.0
0.5
1.0
1.5
2000 3000 4000 5000 6000 7000 8000
Traffic/Lane (= AADT/4 for 4-Lane Highways)
Tru
ck F
acto
r, T
F
40% HCT
30% HCT
20% HCT
10% HCT
0.96
40004
16,000/laneAADTi
0.90
50734
20,292/laneAADTf
TFTFii = = 0.900.90
TFTFff = = 0.960.96 10800.900.750.200.516,000/dayESAL i
1270.5073
21461.01451080
DTN
0.02945"1270.5073
0.1787907MTD
0.2523450
1461.01450.960.750.200.5720,291.868/dayESAL f
and finally the and finally the MTD…MTD…
Then find the DTN:Then find the DTN:
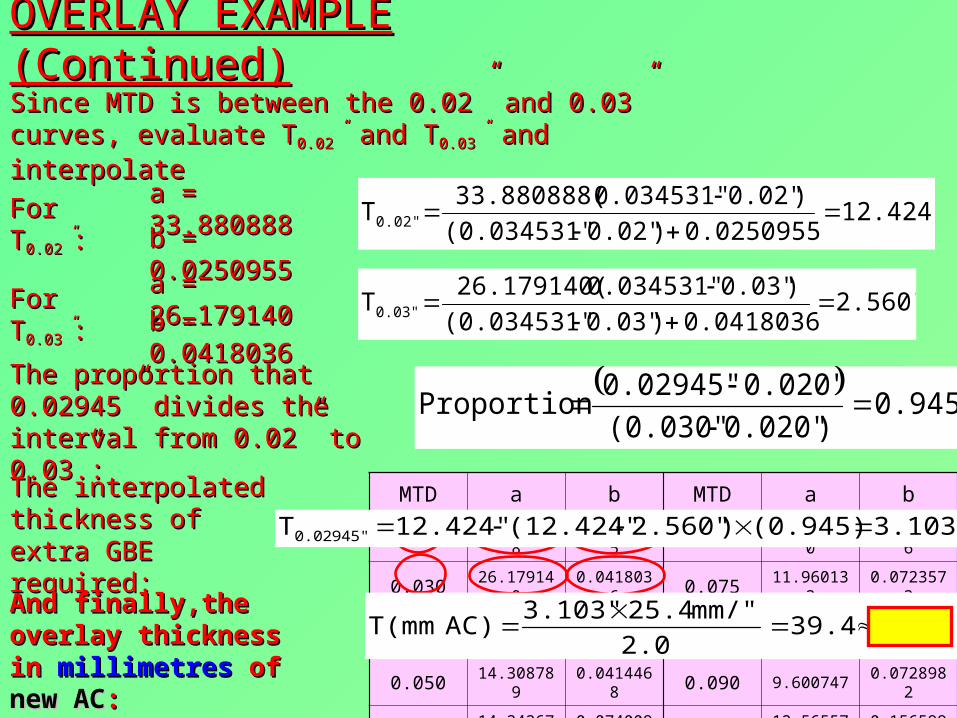
OVERLAY EXAMPLE OVERLAY EXAMPLE (Continued)(Continued)
MTD a b MTD a b
0.020 33.880888 0.0250955 0.070 14.948930 0.0892606
0.030 26.179140 0.0418036 0.075 11.960133 0.0723573
0.040 19.330437 0.0427002 0.080 11.927564 0.0832181
0.050 14.308789 0.0414468 0.090 9.600747 0.0728982
0.060 14.342670 0.0740099 0.100 12.565574 0.1565992
Since MTD is between the 0.02” and 0.03” Since MTD is between the 0.02” and 0.03” curves, evaluate Tcurves, evaluate T0.02”0.02” and T and T0.03”0.03” and interpolate and interpolate
12.424"0.0250955)0.02"(0.034531"
)0.02"0.034531"33.880888(T0.02"
2.560"0.0418036)0.03"(0.034531"
)0.03"0.034531"26.179140(T0.03"
For TFor T0.02”0.02”::
For TFor T0.03”0.03”::
a = 33.880888a = 33.880888
b = b = 0.02509550.0250955a = 26.179140a = 26.179140
b = b = 0.04180360.0418036
0.945
)0.020"(0.030"0.020"0.02945"
Proportion
The proportion that 0.02945” The proportion that 0.02945” divides the interval from divides the interval from 0.02” to 0.03”:0.02” to 0.03”:
The interpolated The interpolated thickness of extra thickness of extra GBE required:GBE required:
3.103"(0.945))2.560"(12.424"12.424"T0.02945"
40mm39.42.0
mm/" 25.4 3.103"AC) T(mm
And finally,the And finally,the overlay thickness in overlay thickness in millimetresmillimetres of of new new ACAC::