mtpo transportation safety plan - amazon s3 · mtpo transportation safety plan. june 11, 2018....
TRANSCRIPT

&
MTPO Transport at ion Safet y Plan
June 11, 2018
Stakeholder Meet ing # 2

—Self Int roduct ions—Review of Project Tasks —Presentat ion and Discussion
—Task B Data Ana lysis—Task C Em phasis Areas and Perform ance
Measures—Foc us on 4E ’s (E d uc ation , E ngineering, E nforc em ent,
E M S )
—V ision Z ero—Transp ortation S afety S urvey—O b tain S tak eh old er Feed b ac k / C onc urrenc e
for M oving Forw ard—N ext S tep s
Out l ine
— Carlton Scroggins (MTPO / City of Topeka) –Project Manager
— Taylor Ricket ts (MTPO / City of Topeka)
— Bill Fiander (MTPO / City of Topeka)
— Jason Peek (City of Topeka)
— Brian Faust (City of Topeka)
Core Team Mem bers
— Tom Vlach (Shaw nee County)
— Barry Beagle (Shaw nee County)
— Mike Spadafore (KDOT)
— Eric Nichol (KDOT)
— Adam Weigel (Topeka Met ro)
— Andy Fry (Topeka Com m unity Cycle Project / Topeka Met ro)
— SGT Gary Ludolph (Topeka Police Dept .)
Key St akeholders
— David Church (WSP) –Project Manager
— Jay Aber (WSP)
— Jessica Hut ton (MRI Global)
— Janelle Clayton (Merge Midw est Engr.)
— Jim Tobaben (WSP)
— Jackie Gatotho (WSP)
— Lisa Shofstall (WSP)
Consult ant Team Mem bers

— Task A –Project Managem ent— Task B –Data Analysis— Task C –Em phasis Areas and Perform ance
Measures— Task D –Ident ify St rategies— Task E –Develop Local Transportat ion
Safety Plan
Project Tasks

— KDOT Crash Database for Shaw nee County (20 10 –20 16)— 23, 591 total crashes (local roads only)
— Three Severity Levels— Fata l - (68 fa ta l crashes)— Injury - (5 ,545 in jury crashes)— Property Dam age Only - ( 17,978 PDO crashes)
— M ost P rom inent C rash Typ es— Angle-Side Im pact (23% of a ll fa ta l; 37% of a ll in jury)— Rear-end (25% of a ll in jury)— Pedest rian (13% of a ll fa ta l crashes)— Roadw ay Departure / Collision w ith Fixed-Ob ject
(34% of a ll fa ta l)
W hy is t h is Plan Im port ant ?

8
Kansas Traf f ic Safet y Resource Off ice is m ak ing a b ig d if ference in reducing fat al it ies and serious in juries in Kansas!

All Crashes in MTPO Area20 10 - 20 16
9
Approxim at ely half (1/2) of t he roadw ay fat al it ies in Kansas occur on local roadw ays
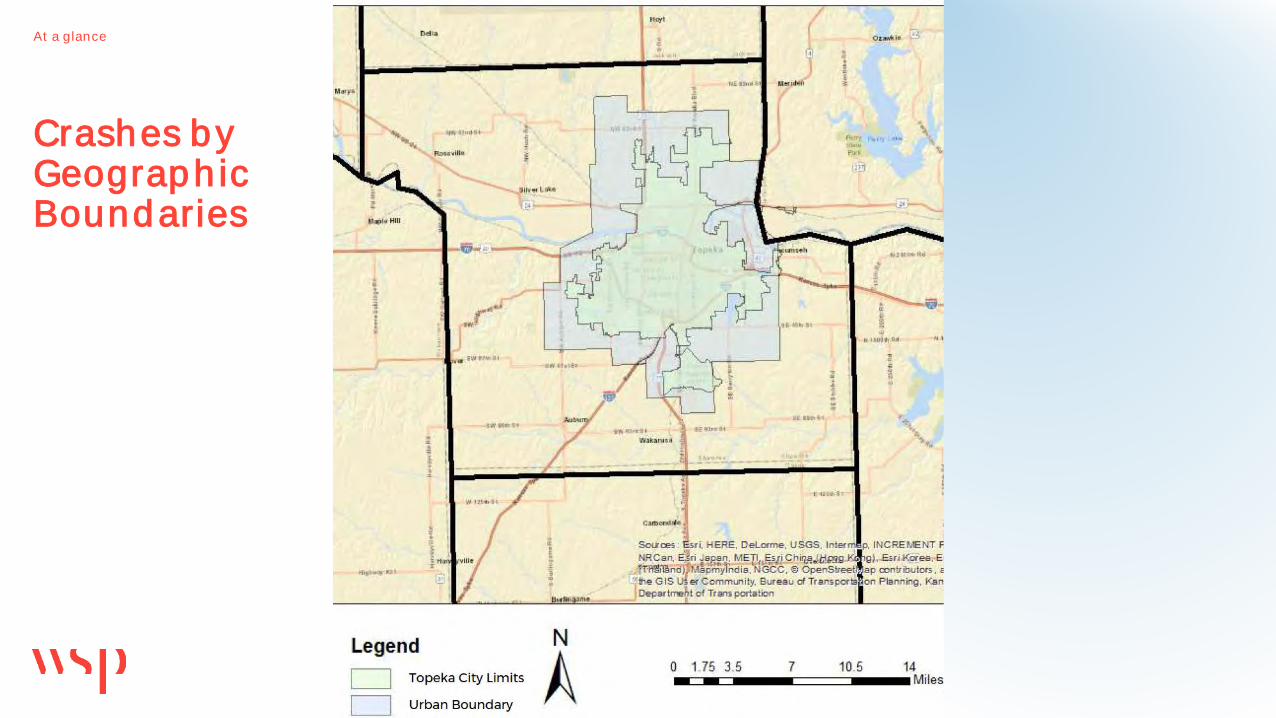
At a glance
Crashes by Geograph ic Boundaries

Shaw nee Count y Geograph ic Jurisd ict ions of Crashes

At a glance
W hat day of t he w eek are crashes occurring?

At a glance
W hat m ont h of t he year are crashes occurring?

At a glance
W hat t im e are crashes occurring?
At a glance
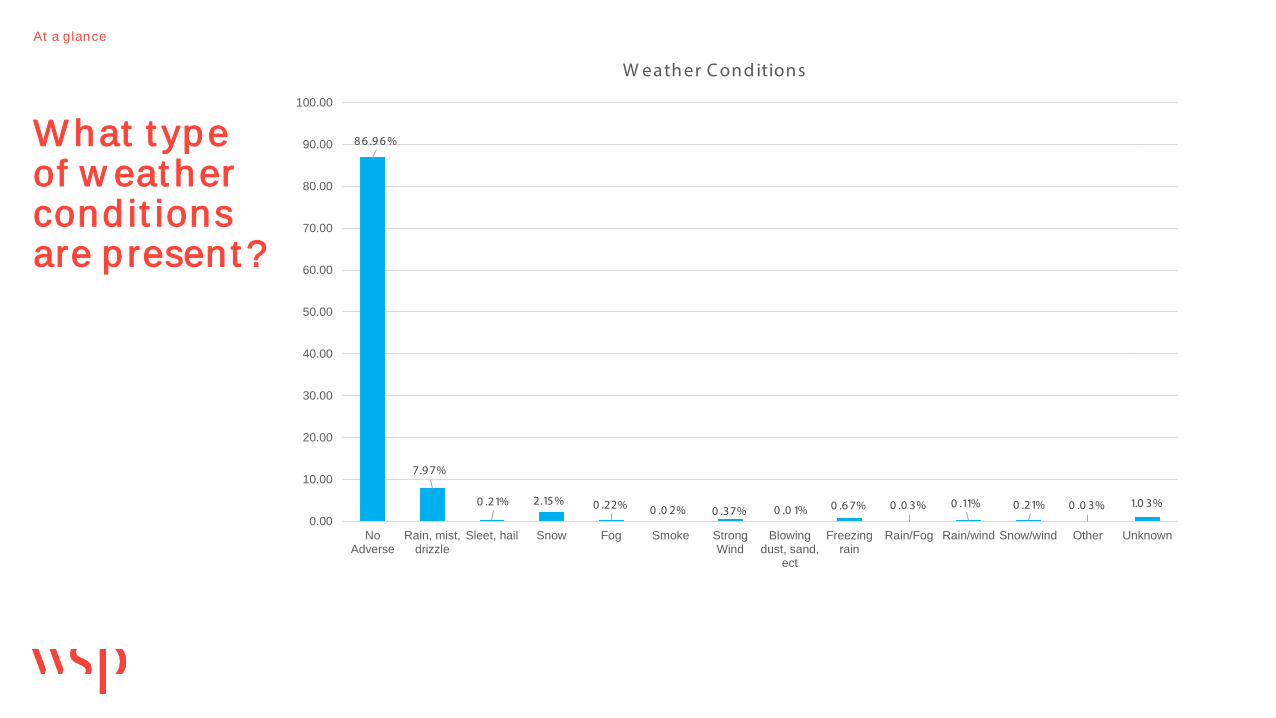
W hat t ype of w eat her cond it ions are p resent ?
8 6 .9 6 %
7.9 7%
0 .21% 2.15% 0 .22% 0 .0 2% 0 .37% 0 .0 1% 0 .6 7% 0 .0 3% 0 .11% 0 .21% 0 .0 3% 1.0 3%
0.00
10.00
20.00
30.00
40.00
50.00
60.00
70.00
80.00
90.00
100.00
NoAdverse
Rain, mist,drizzle
Sleet, hail Snow Fog Smoke StrongWind
Blowingdust, sand,
ect
Freezingrain
Rain/Fog Rain/wind Snow/wind Other Unknown
W eath er C ond itions

At a glance
W hat t ype of l igh t cond it ions are p resent ?
70 .71%
1.50 %2.45%
16 .48 %
7.33%
1.52%
0.00
10.00
20.00
30.00
40.00
50.00
60.00
70.00
80.00
Daylight Dawn Dusk Dark: street lights on Dark: no street lights Unknown
Ligh t C ond itions
At a glance
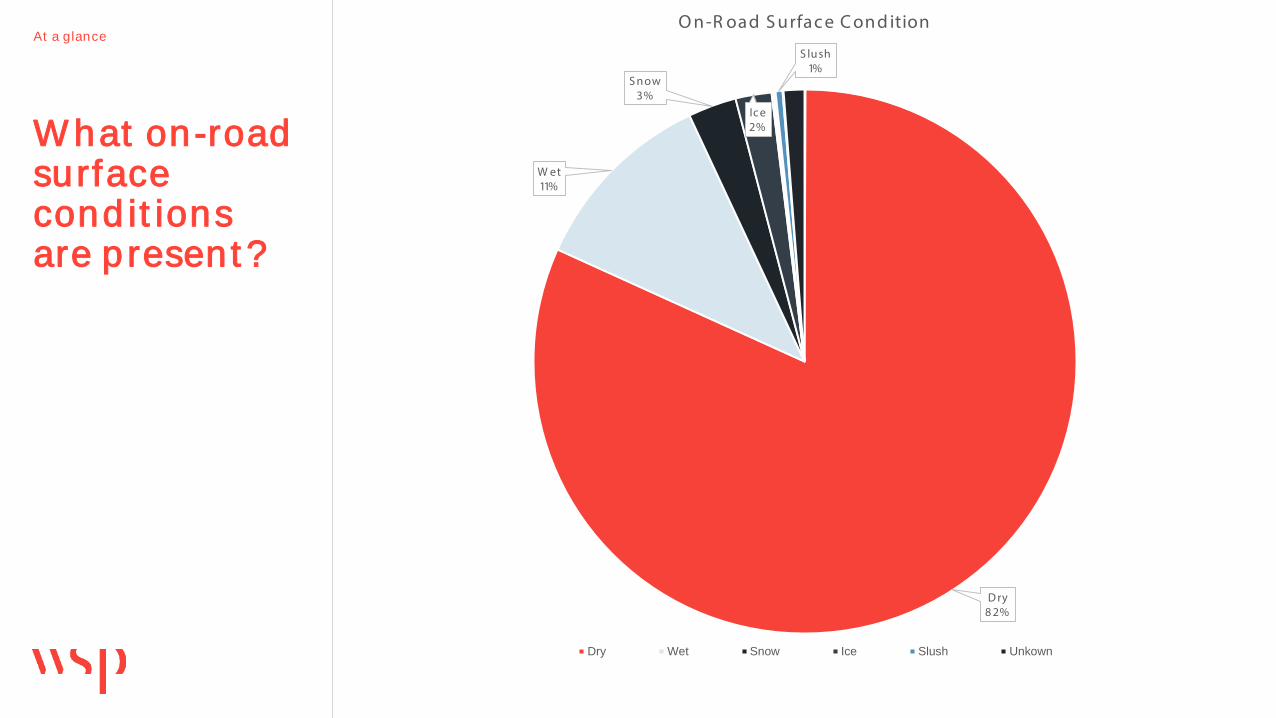
W hat on-road surface cond it ions are p resent ?
D ry8 2%
W et11%
S now3%
Ic e2%
S lush1%
O n-R oad S urfac e C ond ition
Dry Wet Snow Ice Slush Unkown
At a glance
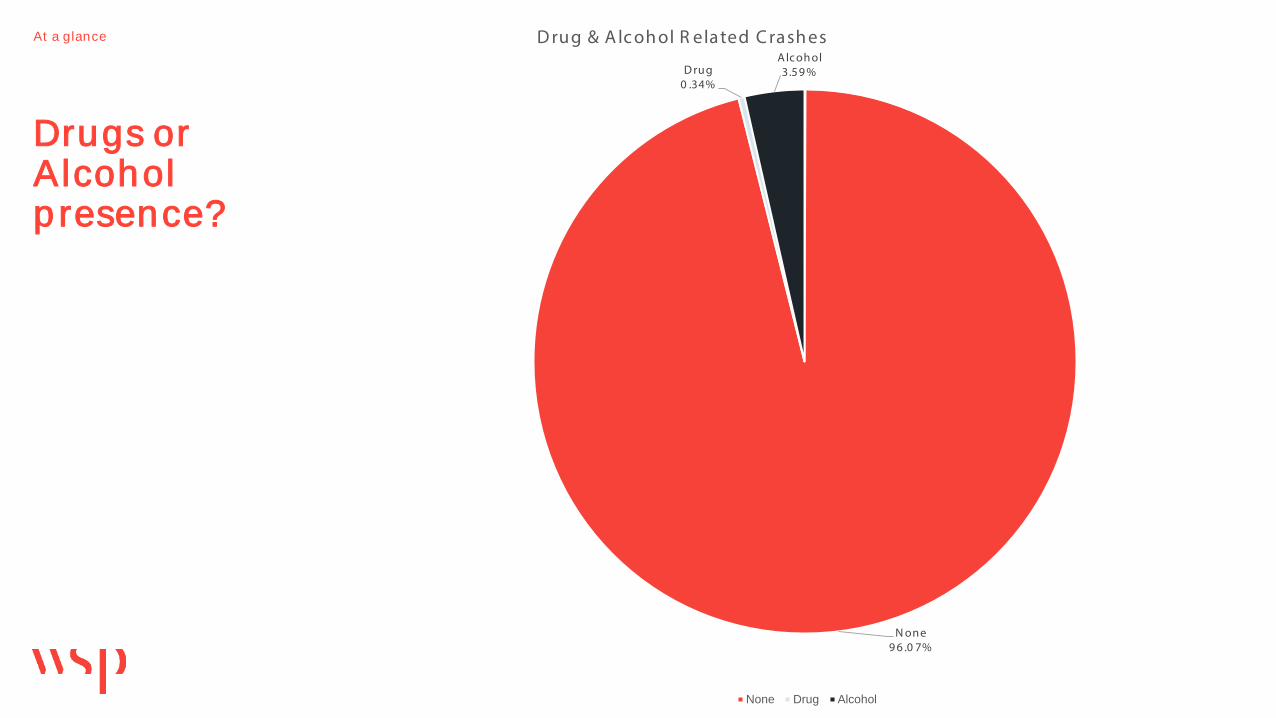
Drugs or Alcohol p resence?
N one9 6 .0 7%
D rug0 .34%
A lc oh ol3.59 %
D rug & A lc oh ol R elated C rash es
None Drug Alcohol

At a glance
Cont ribut ing Circum st ances
TOTAL CRASHES Category Contributing Circum stance % 1 Driver Inat tent ion (general sense) 20 .3 2 Driver Failed to yield the right of w ay 19.0 3 Driver Follow ed too closely 11.6 4 Driver Too fast for cond it ions 5.7 5 Driver Unknow n 5.3 6 Driver Disregarded t raffic signs, signals, or m arkings 5.1 7 Driver No cont ribut ing circum stance 4.5 8 Driver Im proper lane change 3.9 9 Driver Under the in fluence of Alcohol 3.8 10 Driver Im proper backing 3.7 11 Environm ent Anim al: dom est ic or w ild 3.6 12 Driver Made im proper turn 3.5 13 Driver Red light running (d isregarded t raffic signal) 2.7 14 Driver Reckless / Careless driving 2.1 15 Driver Avoidance or Evasive act ion 2.0 16 Driver Other d ist ract ion in or on vehicle 2.0 17 Roadw ay Icy or slushy 1.4 18 Driver Over correct ion / Over steering 1.2 19 Environm ent Rain, m ist , or d rizzle 1.1 20 Driver Exceeded posted speed lim it 1.0
N ote: 9 0 d ifferent c ontrib uting c irc um stanc es w ere noted in th e rep orts for Total C rash es w ith a % ab ove 0 .0 0 % .

At a glance
Cont ribut ing Circum st ances
N ote: 6 0 d ifferent c ontrib uting c irc um stanc es w ere noted in th e rep orts for Fatal and S erious In jury C rash es w ith a % ab ove 0 .0 0 % .
F&SI CRASHES Category Contributing Circum stance % 1 Driver Failed to yield the right of w ay 22.8 2 Driver Too fast for cond it ions 15.9 3 Driver Under the in fluence of Alcohol 15.3 4 Driver Inat tent ion (general sense) 15.3 5 Driver Disregarded t raffic signs, signals, or m arkings 12.0 6 Driver Reckless / Careless driving 11.1 7 Driver Exceeded posted speed lim it 8.1 8 Driver No cont ribut ing circum stance 6.0 9 Driver Over correct ion / Over steering 6.0 10 Driver Ill or Med ical cond it ion 4.5 11 Driver Other d ist ract ion in or on vehicle 3.6 12 Driver Aggressive / Antagonist ic d riving 3.3 13 Driver Follow ed too closely 3.3 14 Environm ent Rain, m ist , or d rizzle 3.0 15 Driver Avoidance or Evasive act ion 2.7 16 Driver Wrong side or w rong w ay 2.7 17 Driver Unknow n 2.4 18 Driver Red light running (d isregarded t raffic signal) 2.4 19 Driver Under the in fluence of illegal Drugs 2.4 20 Pedest rian Im proper crossing 2.4

Crashes by Driver’s Age
0
100
200
300
400
500
600
700
800
900
1000
10 20 30 40 50 60 70 80 90 100
Young Drivers High Risk

Fat al Crashes by Driver’s Age

Percent of Crashes t hat Involve Speed ing and Dist ract ion
0
5
10
15
20
25
30
35
40
Fatal Crashes Fatal and Injury Crashes Total Crashes
Speeding Distracted

W hy is t h is Plan Im port ant ?
Frequency of crashes by locat ion type and severity level
Accident Locat ionFat al
crashesIn jury
crashesTot al
CrashesIn t ersect ion and in t ersect ion-relat ed crashes 23 30 6 1 10 ,8 8 9Non-in t ersect ion-relat ed crashes
45 248 4 12,70 2TOTAL
6 8 5,545 23,59 1
66% of fat al it y crashes are non-in t ersect ion relat ed

25
Tot al Crashes are Trend ing Up
Fat al it y Crashes are Trend ing Up w h ile Serious In jury Crashes are Trend ing Dow n
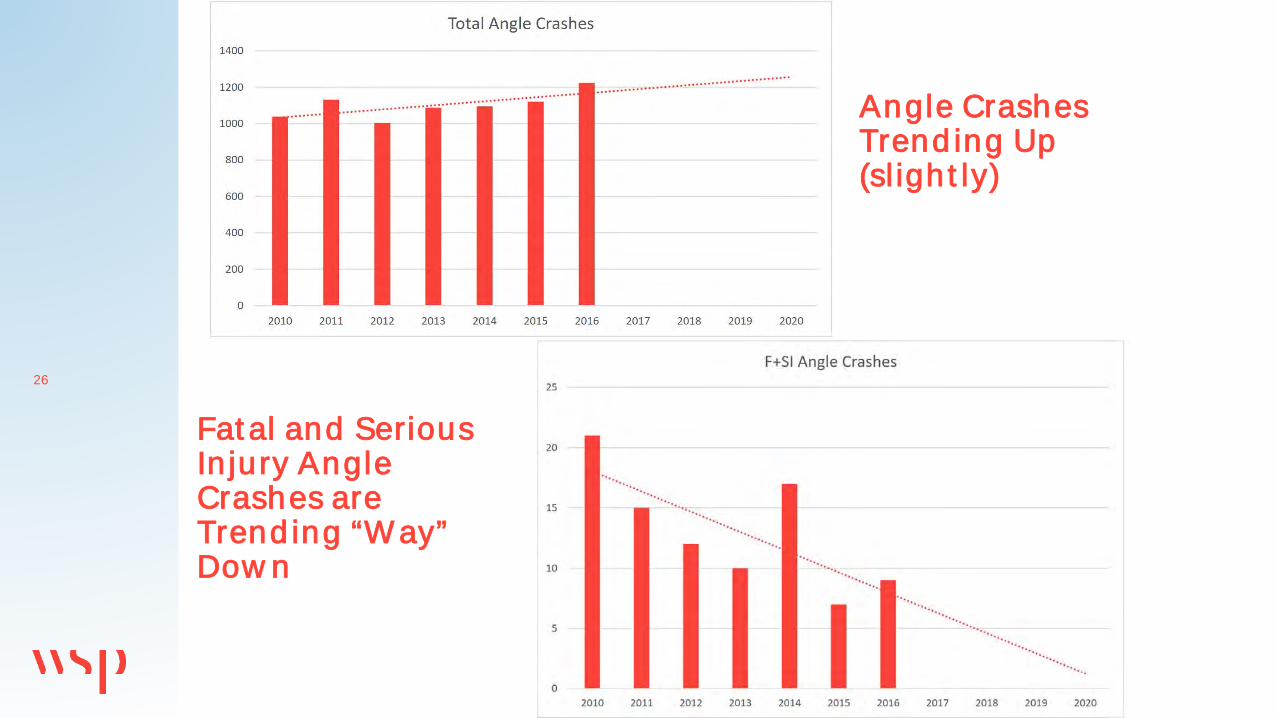
26
Angle Crashes Trend ing Up (sl igh t ly)
Fat al and Serious In jury Angle Crashes are Trend ing “W ay” Dow n
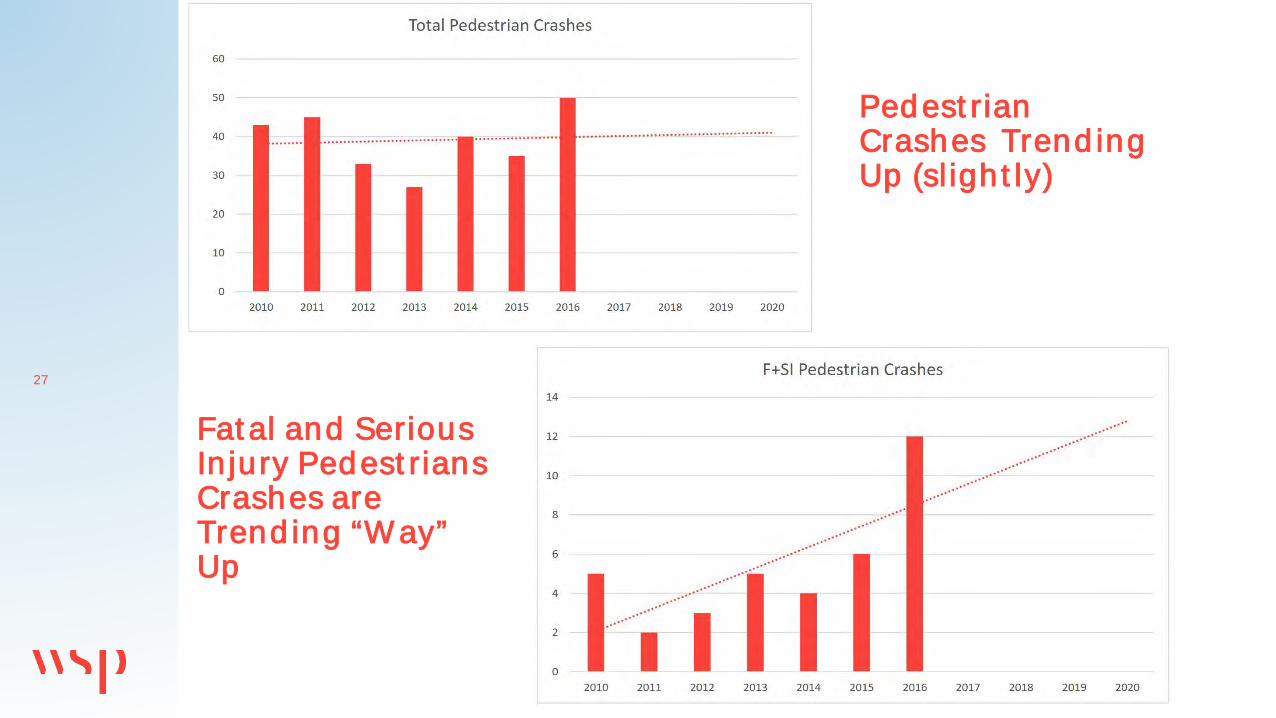
27
Pedest rian Crashes Trend ing Up (sl igh t ly)
Fat al and Serious In jury Pedest rians Crashes are Trend ing “W ay” Up
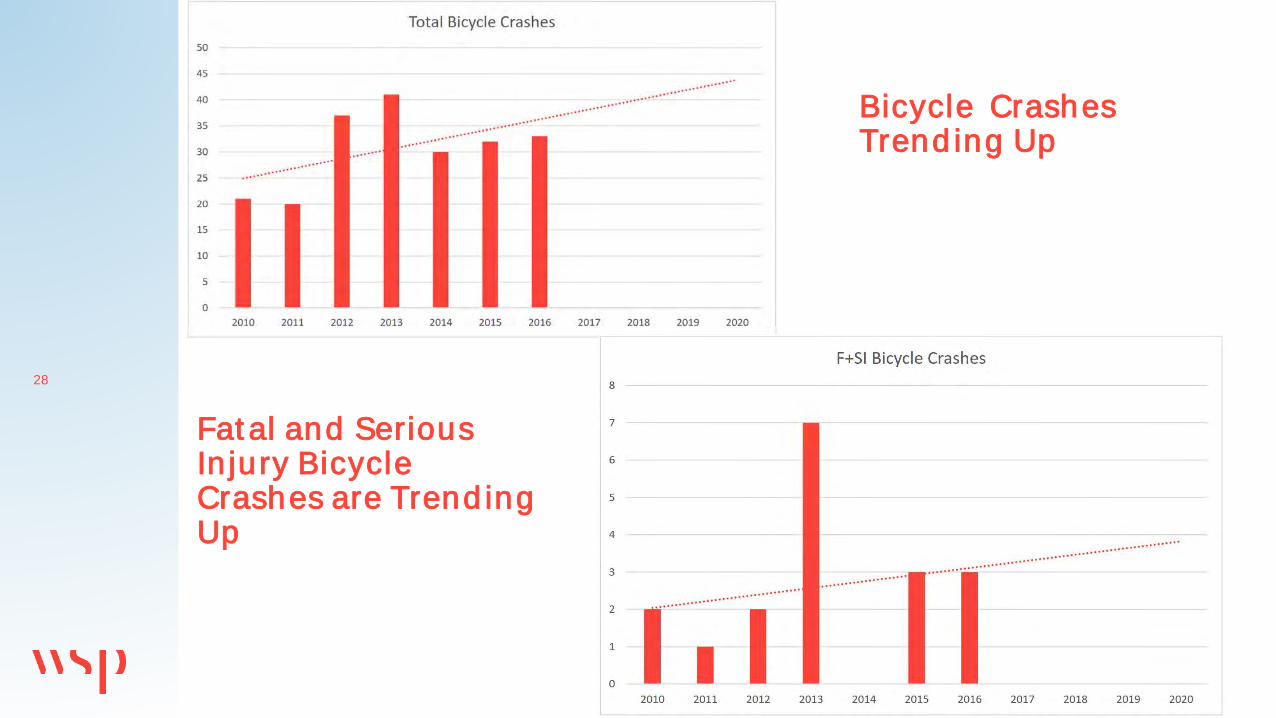
28
Bicycle Crashes Trend ing Up
Fat al and Serious In jury Bicycle Crashes are Trend ing Up

29
Roadw ay Depart ure / Overt urned Crashes Trend ing Up
Fat al and Serious In jury Roadw ay Depart ure / Overt urned Crashes are Trend ing Dow n
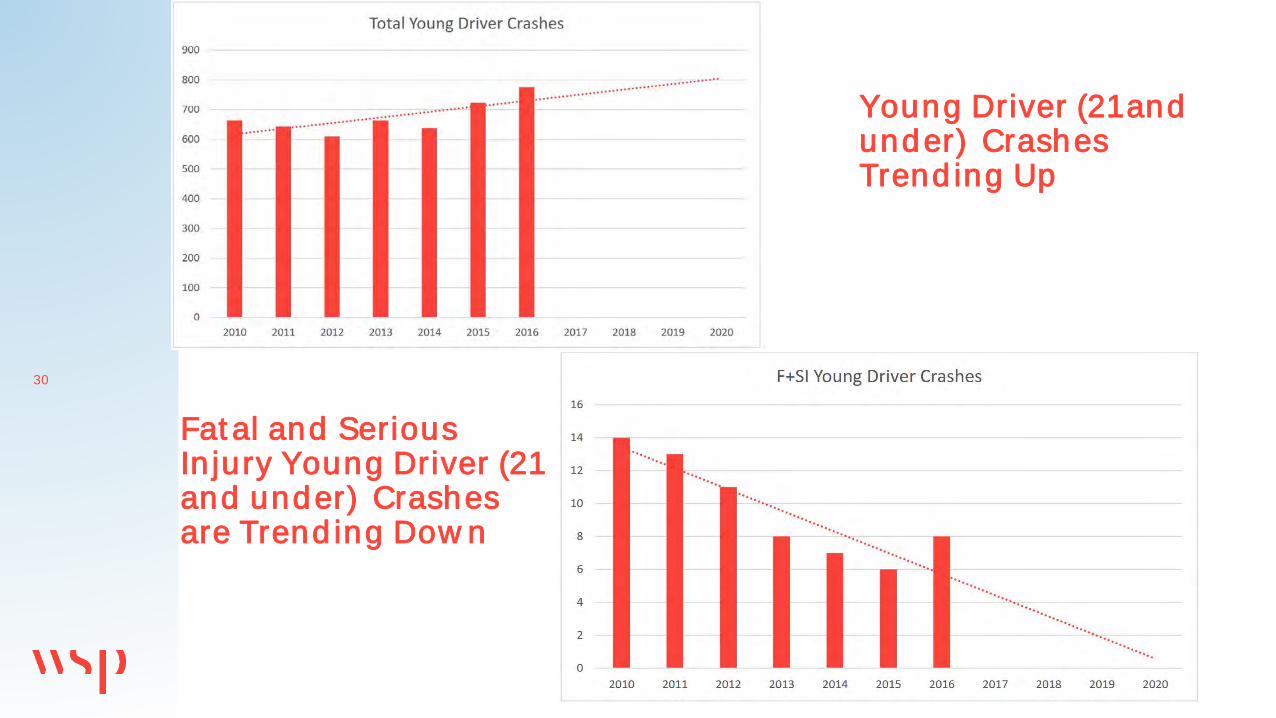
30
Young Driver (21 and under) Crashes Trend ing Up
Fat al and Serious In jury Young Driver (21 and under) Crashes are Trend ing Dow n

31
Mot orcycle Crashes Trend ing Dow n
Fat al and Serious In jury Mot orcycle Crashes are Trend ing Dow n
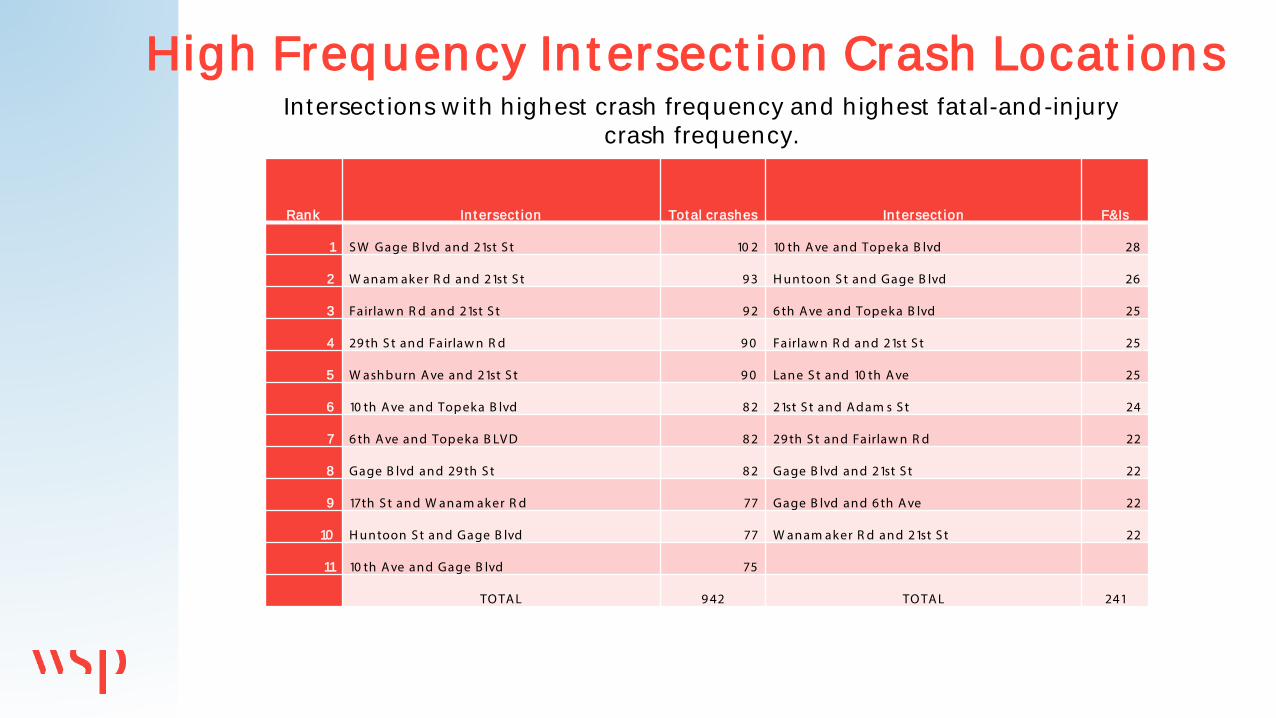
High Frequency In t ersect ion Crash Locat ions Intersect ions w ith h ighest crash frequency and h ighest fatal-and-in jury
crash frequency.
Rank In t ersect ion Tot al crashes In t ersect ion F&Is
1 S W Gage B lvd an d 21st S t 10 2 10 th A ve an d Topek a B lvd 28
2 W an am ak er R d an d 21st S t 9 3 H un toon S t an d Gage B lvd 26
3 Fairlaw n R d an d 21st S t 9 2 6 th A ve an d Topek a B lvd 25
4 29 th S t an d Fairlaw n R d 9 0 Fairlaw n R d an d 21st S t 25
5 W ash burn A ve an d 21st S t 9 0 Lan e S t an d 10 th A ve 25
6 10 th A ve an d Topek a B lvd 8 2 21st S t an d A d am s S t 24
7 6 th A ve an d Topek a B LV D 8 2 29 th S t an d Fairlaw n R d 22
8 Gage B lvd an d 29 th S t 8 2 Gage B lvd an d 21st S t 22
9 17th S t an d W an am ak er R d 77 Gage B lvd an d 6 th A ve 22
10 H un toon S t an d Gage B lvd 77 W an am ak er R d an d 21st S t 22
11 10 th A ve an d Gage B lvd 75
TO TA L 9 42 TO TA L 241

98.2% of Pedest rian Crashes Result in an In jury or Fat al it y
9 Fat al Crashes w / 259 In jury Crashes

95.8% of Pedalcycle Crashes Result in an In jury or Fat al it y
3 Fat al Crashes w / 20 2 In jury Crashes

—Selected Crash Types — All Crashes; Rear End ; Angle; Roadw ay Departure;
Pedest rian; Bicycle —Looked for specific correla t ions in the da ta—Created .km z files w ith roadw ay segm ents and
intersect ions —Ident ified List of Top 15 H igh Frequency Loca t ions
for each crash type— Intersect ion / Intersect ion Related Locat ions
— Inside City Lim its; Outside City Lim its— Roadw ay Segm ents
— Inside City Lim its; Outside City Lim its
Det ailed Crash Analysis
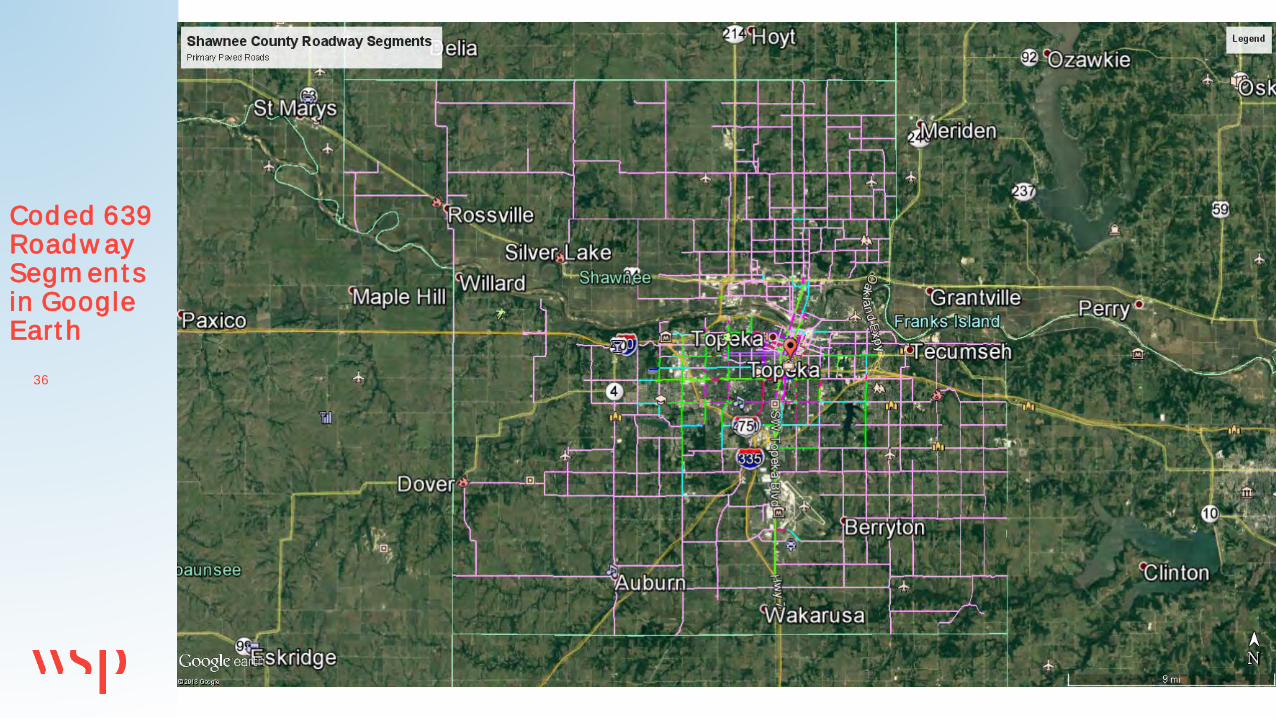
36
Coded 639 Roadw ay Segm ent s in Google Eart h

37
Tot al of 10 ,283 in t ersect ions in t he MTPO(Not e: Roundabout s count as one in t ersect ion per approach)

38
Intersection-realtedPDO F&I Total Percent
not intersection related 1786 520 2306 38.6Intersection related 2784 883 3667 61.4Total 4570 1403 5973 100
Traffic control at intersectionPDO F&I Total
Signal 1058 295 1353Stop sign 136 26 162Yield sign 27 4 31Other 1563 558 2121Total 2784 883 3667
Rear-End Risk Assessm ent Analysis

39
Driver conditition contributing circumstance
frequency percentcumulative frequency
cumulative percent
No Drug or alcohol reported 5899 98.76 5899 98.76Drug or alcohol reported 74 1.24 5973 100
No illegal drugs reported 5967 99.9 5967 99.9Illegal drugs reported 6 0.1 5973 100
No alcohol reported 5905 98.86 5905 98.86Alcohol reported 68 1.14 5973 100
No speeding reported 5684 95.16 5684 95.16Exceeding speed limit or driving too fast for conditions reported 289 4.84 5973 100
No inattention (general) reported 3953 66.18 3953 66.18Inattention (general) reported 2020 33.82 5973 100
No traffic control violation reported 5959 99.77 5959 99.77Disregarded traffic signs, signals, or markings; Red light running reported 14 0.23 5973 100
Rear-End Risk Assessm ent Analysis
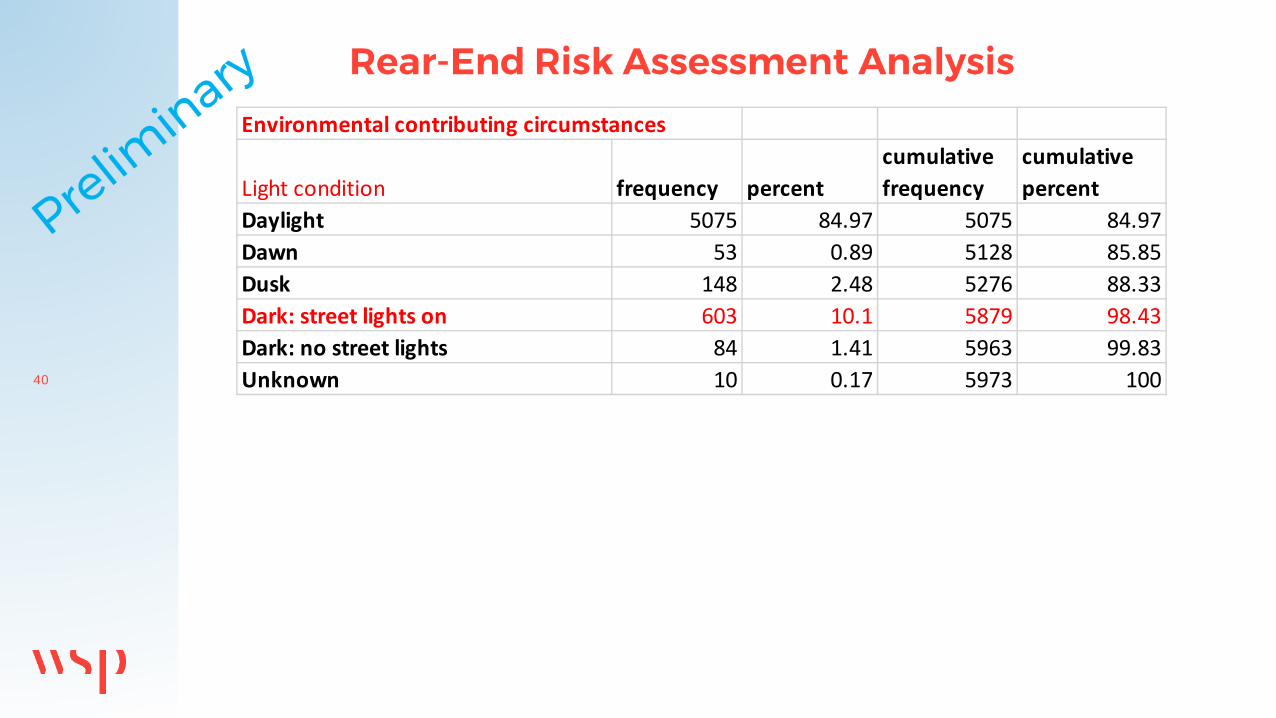
40
Environmental contributing circumstances
Light condition frequency percentcumulative frequency
cumulative percent
Daylight 5075 84.97 5075 84.97Dawn 53 0.89 5128 85.85Dusk 148 2.48 5276 88.33Dark: street lights on 603 10.1 5879 98.43Dark: no street lights 84 1.41 5963 99.83Unknown 10 0.17 5973 100

41
Weather conditionNo Adverse 5217 87.34 5217 87.34Rain, mist, drizzle 565 9.46 5782 96.8Sleet, hail 9 0.15 5791 96.95Snow 92 1.54 5883 98.49Fog 10 0.17 5893 98.66Smoke 1 0.02 5894 98.68Strong Wind 12 0.2 5906 98.88Blowing dust, sand, ect 1 0.02 5907 98.9Freezing rain 30 0.5 5937 99.4Rain/Fog 2 0.03 5939 99.43Rain/wind 4 0.07 5943 99.5Snow/wind 5 0.08 5948 99.58Other 2 0.03 5950 99.61Unknown 23 0.39 5973 100

42
Road surface conditionDry 4940 82.71 4940 82.71Wet 759 12.71 5699 95.41Snow 114 1.91 5813 97.32Ice 95 1.59 5908 98.91Mud/dirt/sand 6 0.1 5914 99.01Debris (oil, etc.) 1 0.02 5915 99.03Standing/moving water 2 0.03 5917 99.06Slush 15 0.25 5932 99.31Other 1 0.02 5933 99.33Unkown 40 0.67 5973 100

43
Posted "on road" speed limit
frequency percentcumulative frequency
cumulative percent
20 262 1.11 262 1.1125 124 0.53 386 1.6430 9571 40.57 9957 42.235 2871 12.17 12828 54.3740 7133 30.23 19961 84.61 40 mph roads are highly 45 1163 4.93 21124 89.54 overrepresented in rear-end50 342 1.45 21466 90.99 crashes55 247 1.05 21713 92.0460 10 0.04 21723 92.0865 40 0.17 21763 92.2570 10 0.04 21773 92.2975 11 0.05 21784 92.34None 1808 7.66 23592 100
40 m ph Roadw ays on ly Represent 4.6% of al l Roadw ays

44
Rear-End Risk Assessm ent Analysis
Rear-End Crashes per In t ersect ion (w it h in Cit y Lim it s)
STREETS RearEnd_TTot rank CITY
SW GAGE BLVD , SW 21ST ST 68 1SW WASHBURN AVE , SW 21ST ST 62 2SW GAGE BLVD , SW 29TH ST 52 3SW FAIRLAWN RD , SW 21ST ST 52 3SW WANAMAKER RD , SW 21ST ST 49 5SW 17TH ST , SW WANAMAKER RD 45 6SW 6TH AVE , SW TOPEKA BLVD 45 6SW 10TH AVE , SW TOPEKA BLVD 43 8SW GAGE BLVD , SW 6TH AVE 38 9SW 29TH ST , SW TOPEKA BLVD 38 9SW 29TH ST , SW WANAMAKER RD 37 11SW TOPEKA BLVD , SW 21ST ST 32 12SW 10TH AVE , SW GAGE BLVD 31 13SW 37TH ST , S KANSAS AVE 31 13SW TOPEKA BLVD , SW 1ST ST , NW TOPEKA BLVD 30 15

45
Rear-End Risk Assessm ent Analysis
F& I Rear-End Crashes per In t ersect ion (w it h in Cit y Lim it s)
STREETS RearEnd_FF&I rank CITY
SW GAGE BLVD , SW 21ST ST 14 1SW WASHBURN AVE , SW 21ST ST 13 2SW 17TH ST , SW WANAMAKER RD 13 2SW GAGE BLVD , SW 29TH ST 12 4SW FAIRLAWN RD , SW 21ST ST 11 5SW 10TH AVE , SW TOPEKA BLVD 11 5SW GAGE BLVD , SW 6TH AVE 11 5SW 29TH ST , SW LINCOLN ST 11 5SW 29TH ST , SW WANAMAKER RD 10 9SW TOPEKA BLVD , SW 1ST ST , NW TOPEKA BLVD 10 9SW TOPEKA BLVD , SW 21ST ST 9 11SW 21ST ST , SW SIMS AVE 9 11SW WANAMAKER RD , SW 21ST ST 8 13SW 6TH AVE , SW TOPEKA BLVD 8 13SE CALIFORNIA AVE , SE 29TH ST 8 13

46
Rear-End Risk Assessm ent Analysis
Rear-End Crashes per In t ersect ion (out side Cit y Lim it s)
STREETS City or CouRearEnd_TTot rank COUNTY
SE 29TH ST , SE WEST EDGE RD County 8 1SW INDIAN HILLS RD , SW 21ST ST County 7 2SW ROUNDABOUT RD , SW WANAMAKER RD (south approach of 53rd St.) County 5 3SW 21ST ST , SW KINGSROW RD County 4 4SW FAIRLAWN RD , SW 61ST ST County 4 4NW 46TH ST , NW BUTTON RD County 3 6NE SUMNER ST , NE SARDOU AVE County 3 6SW AUBURN RD , SW 29TH ST County 3 6NW 62ND ST , NW US 75 HWY County 3 6NW BUTTON RD , NW 62ND ST County 2 10SW 93RD ST , SW TOPEKA BLVD , SE 93RD ST County 2 10NW ROCHESTER RD , NW 58TH ST County 2 10SE 29TH ST , SE WITTENBERG RD County 2 10NW REDWOOD DR , NW 46TH ST County 2 10SE BERRYTON RD , SE 45TH ST , SE WEST EDGE RD County 2 10SE SHAWNEE HEIGHTS RD , SE 45TH ST County 2 10SE 45TH ST , SE MARYLAND AVE County 2 10SW 61ST ST , SW AUBURN RD County 2 10NE 46TH ST , NE K4 ACCESS HWY County 2 10

47
Rear-End Risk Assessm ent Analysis
F& I Rear-End Crashes per In t ersect ion (out side Cit y Lim it s)
STREETS City or CouRearEnd_FF&I rank COUNTY
SW ROUNDABOUT RD , SW WANAMAKER RD (south approach of 53rd St.) County 3 1SE 29TH ST , SE WEST EDGE RD County 2 2SW 21ST ST , SW KINGSROW RD County 2 2NW BUTTON RD , NW 62ND ST County 2 2NW 46TH ST , NW BUTTON RD County 1 5NE SUMNER ST , NE SARDOU AVE County 1 5SW AUBURN RD , SW 29TH ST County 1 5SW 93RD ST , SW TOPEKA BLVD , SE 93RD ST County 1 5NW ROCHESTER RD , NW 58TH ST County 1 5SE 29TH ST , SE WITTENBERG RD County 1 5NW REDWOOD DR , NW 46TH ST County 1 5SW 25TH ST , SW URISH RD County 1 5SW 53RD ST , SW BURLINGAME RD County 1 5SW SOUTH POINTE DR , SW 61ST ST County 1 5SE 45TH ST , SE CROCO RD County 1 5SE 45TH ST , SE MINNESOTA AVE County 1 5SE 45TH ST , SE GEMSTONE LN County 1 5SE SHAWNEE HEIGHTS RD , SE 89TH ST County 1 5SE CROCO RD , SE SYCAMORE DR , SE 10TH ST County 1 5
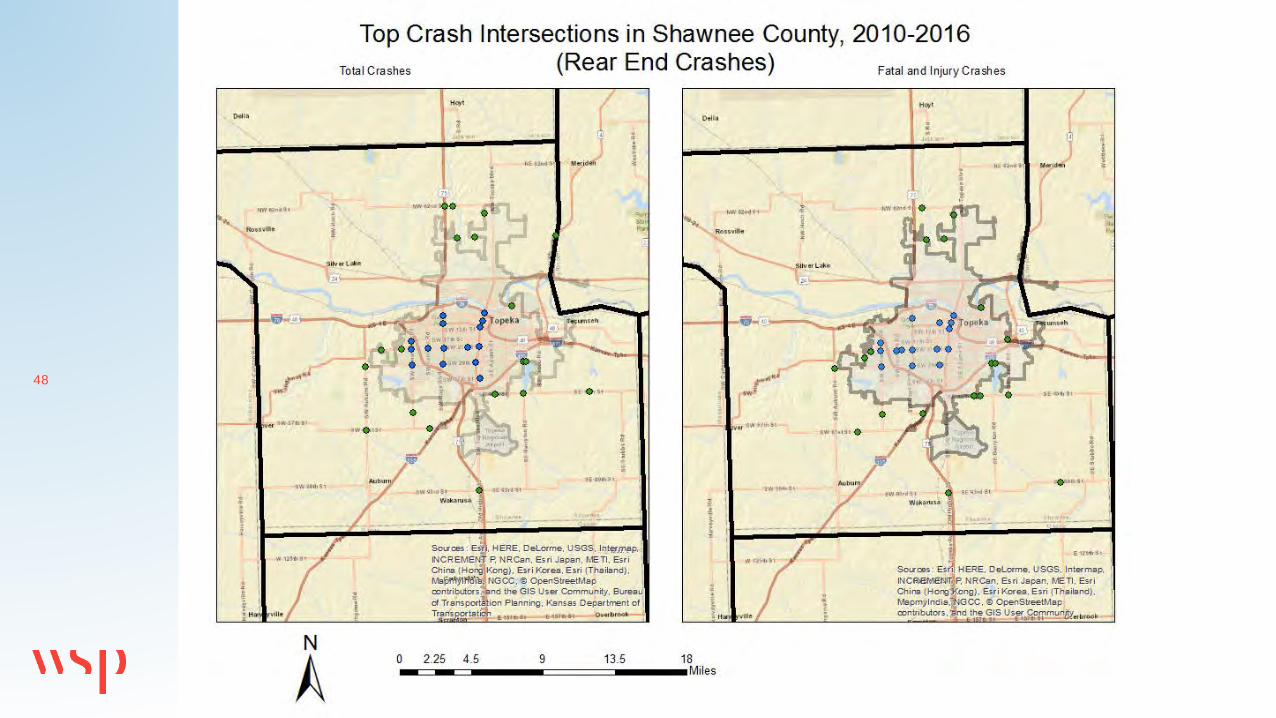
48

49
Rear-End Crash Frequency of 8 Crashes includ ing 2 F&I

50
Rear-End Risk Assessm ent Analysis
Rear-End Crashes per Year per Mile (w it h in Cit y Lim it s)
NameSegment Length (mi)
Rear end (total)
Total crashes per yr per mile
Rank by total frequency_CITY
SW Wanamaker 4-Lane Divided 0.3319 44 18.94 117th Street 3-Lane Channelized 0.3103 22 10.13 2SW Fairlawn 5-Lane 0.4210 29 9.84 3Gage Blvd. 4-Lane 0.1602 11 9.81 4SW Wanamaker 5-Lane 0.4525 28 8.84 521st Street 4-Lane 0.3606 21 8.32 6SW 29th Street 4-Lane 0.4988 29 8.31 7NW Topeka Blvd 3-Lane 0.0699 4 8.18 8Gage Blvd. 4-Lane 0.4298 24 7.98 921St Street 4-Lane 0.3387 18 7.59 10S Kansas Ave 5-Lane 0.1038 5 6.88 11SW Wanamaker 5-Lane 1.9188 92 6.85 12Gage Blvd. 5-Lane 0.6516 30 6.58 13Gage Bld. 4-Lane 0.4639 21 6.47 14SE California Avenue 4-Lane Undivided 0.3329 15 6.44 15

51
Rear-End Risk Assessm ent Analysis
F& I Rear-End Crashes per Year per Mile (w it h in Cit y Lim it s)
NameSegment Length (mi)
Rear end (F&I)
F&I crashes per yr per mi
Rank by F&I frequency_CITY
SW Wanamaker 4-Lane Divided 0.3319 12 5.17 1SE California Avenue 4-Lane Divided 0.4602 9 2.79 2Gage Bld. 4-Lane 0.2152 4 2.66 3SW Wanamaker 5-Lane 0.4525 8 2.53 4SW Fairlawn 5-Lane 0.4210 7 2.38 517th Street 3-Lane Channelized 0.3103 5 2.30 6SW Montara Parkway 2-Lane Divided 0.0656 1 2.18 7SE California Avenue 4-Lane Undivided 0.3329 5 2.15 8SE Adams Street 4-Lane Divided 0.1340 2 2.13 9SW 29th Street 4-Lane 0.4988 7 2.00 10SE California Avenue 5-Lane 0.0739 1 1.93 11NW Rochester Road 3-Lane (NB 3, SB 1) 0.0750 1 1.91 12SW Washburn Avenue 4-Lane Undivided 0.1508 2 1.89 13SW Burlingame Road 4-Lane Divided 0.1528 2 1.87 14SW 4th Street 6-Lane Divided 0.0792 1 1.80 15

52
Rear-End Risk Assessm ent Analysis
Rear-End Crashes per Year per Mile (out side Cit y Lim it s)
NameSegment Length (mi)
Rear end (total)
Total crashes per yr per mile
Rank by total frequency_COUNTY
SW 61st Street 3-Lane 0.3140 11 5.00 1SW University Blvd 2-Lane Undivided 0.0930 2 3.07 2SW Wanamaker 3-Lane 1.3031 28 3.07 3SE Croco Road 2-Lane Divided 0.1032 1 1.38 4SW 29th Street 3-Lane 0.1152 1 1.24 5NW 46th Street 2-Lane Undivided 0.7220 6 1.19 614th Street 2-Lane Undivided 0.4957 4 1.15 7SE 45th Street 3-Lane 0.1396 1 1.02 8SW 61st Street 2-Lane Undivided 1.6159 7 0.62 9SW 29th Street 2-Lane 3.0465 12 0.56 10SW 6th Avenue 3-Lane 0.2916 1 0.49 1121st Street - 3-Lane 0.7052 2 0.41 12NW Topeka Blvd 2-Lane Undivided 5.9973 15 0.36 13SE45th Street 2-Lane Undivided 0.4588 1 0.31 14SW Huntoon Street 2-Lane Undivided 0.4987 1 0.29 15

53
Rear-End Risk Assessm ent Analysis
F& I Rear-End Crashes per Year per Mile (out side Cit y Lim it s)
NameSegment Length (mi)
Rear end (F&I)
F&I crashes per yr per mi
Rank by F&I frequency_COUNTY
SW University Blvd 2-Lane Undivided 0.0930 1 1.54 1SW 29th Street 3-Lane 0.1152 1 1.24 2SW 61st Street 3-Lane 0.3140 1 0.45 3SE45th Street 2-Lane Undivided 0.4588 1 0.31 4SW Wanamaker 3-Lane 1.3031 2 0.22 521st Street - 3-Lane 0.7052 1 0.20 6NW 46th Street 2-Lane Undivided 0.7220 1 0.20 7SW 29th Street 2-Lane 3.0465 4 0.19 8SW 61st Street 2-Lane Undivided 1.6159 2 0.18 9SE California Avenue 2-Lane Undivided 1.0006 1 0.14 10NW Topeka Blvd 2-Lane Undivided 5.9973 5 0.12 11SW Urish Road 2-Lane Undivided 1.4082 1 0.10 12SW 65th Street 2-Lane Undivided 1.5049 1 0.09 13SW 85th Street 2-Lane Undivided 2.7525 1 0.05 14SE Shawnee Heights Road 2-Lane Undivided 4.0114 1 0.04 15

54

55
Rear-End Crash Frequency of 8.32 Crashes per Year per Mile (Non-In t ersect ion Relat ed )

56
Table 1 - Location of Pedestrian Crashes at Intersections with Respect to Marked Crossings and Sidewalk Presense
PDO Minor Injury
Serious Injury Fatal Total % Total
Marked Crossing 2 66 7 1 76 56.72%
Sidewalk Present 2 66 7 1 76 100.00% Non-Marked Crossing 1 51 5 1 58 43.28%
Sidewalk Present 1 45 5 1 52 89.66% None 0 4 0 0 4 6.90% Unknown 0 2 0 0 2 3.45%
Grand Total 3 117 12 2 134 100.00%
Pedest rian Risk Assessm ent Analysis
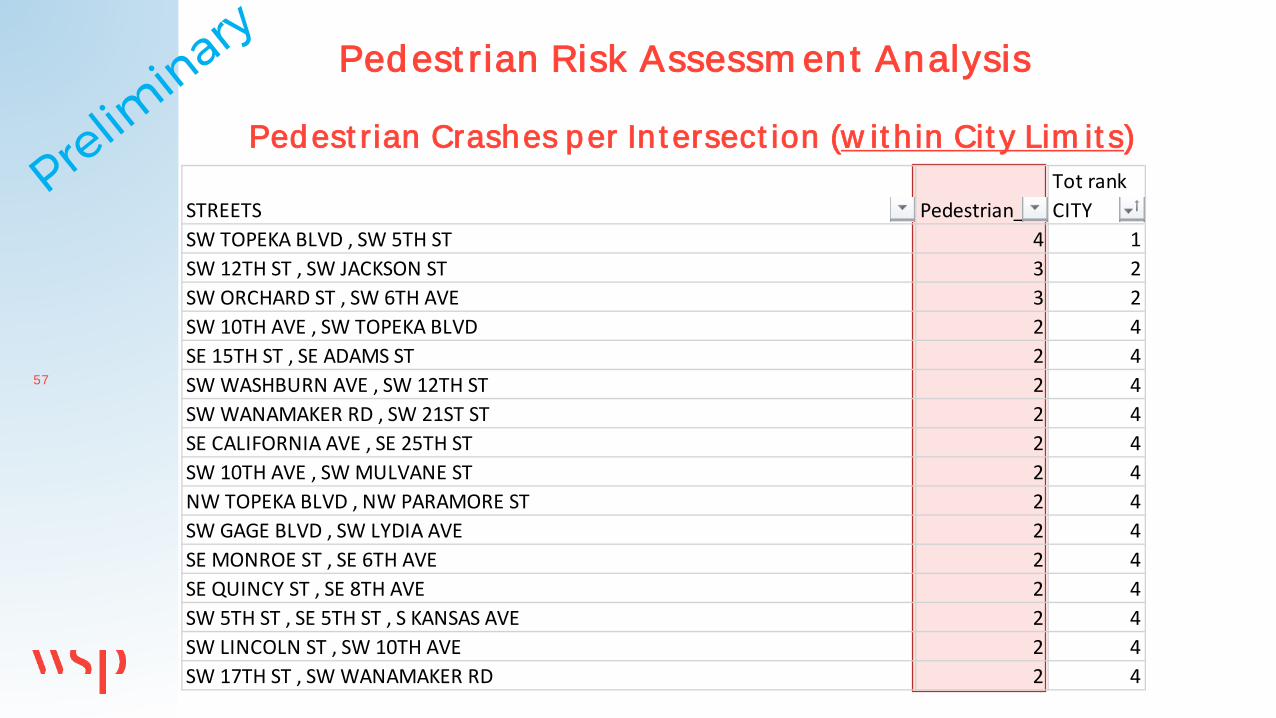
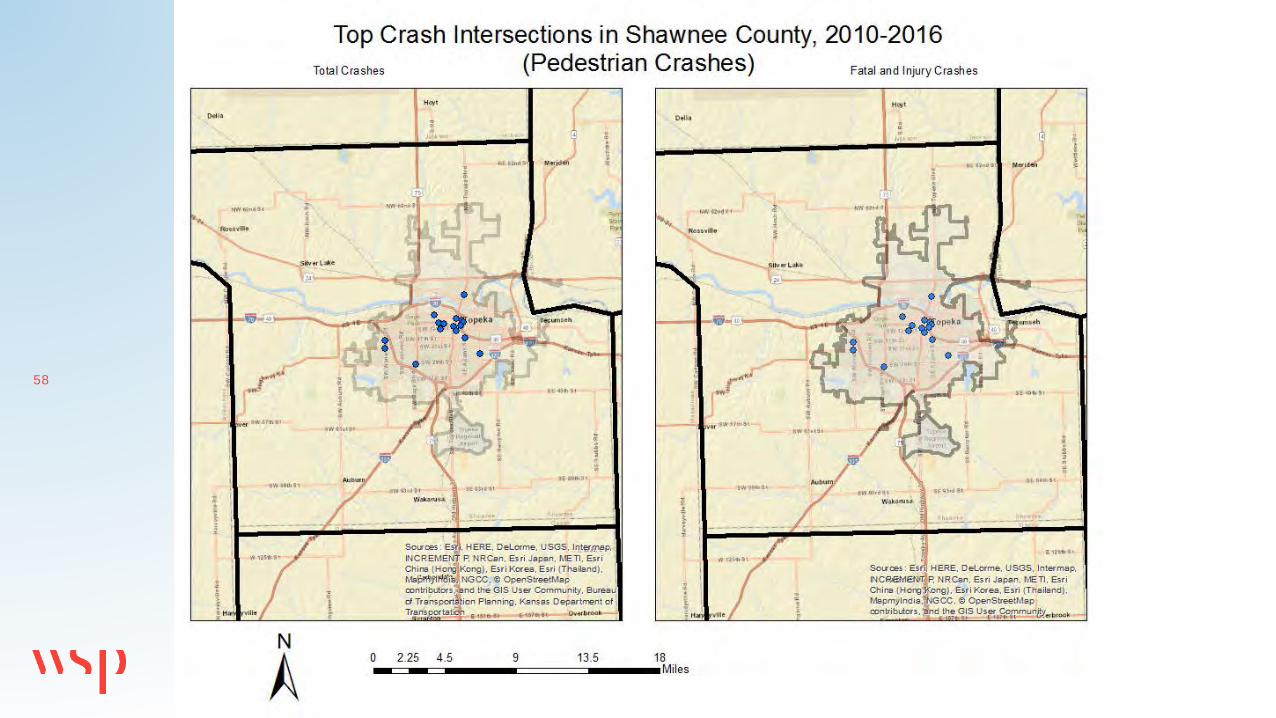
57
Pedest rian Risk Assessm ent Analysis
Pedest rian Crashes per In t ersect ion (w it h in Cit y Lim it s)
STREETS Pedestrian_TOTot rank CITY
SW TOPEKA BLVD , SW 5TH ST 4 1SW 12TH ST , SW JACKSON ST 3 2SW ORCHARD ST , SW 6TH AVE 3 2SW 10TH AVE , SW TOPEKA BLVD 2 4SE 15TH ST , SE ADAMS ST 2 4SW WASHBURN AVE , SW 12TH ST 2 4SW WANAMAKER RD , SW 21ST ST 2 4SE CALIFORNIA AVE , SE 25TH ST 2 4SW 10TH AVE , SW MULVANE ST 2 4NW TOPEKA BLVD , NW PARAMORE ST 2 4SW GAGE BLVD , SW LYDIA AVE 2 4SE MONROE ST , SE 6TH AVE 2 4SE QUINCY ST , SE 8TH AVE 2 4SW 5TH ST , SE 5TH ST , S KANSAS AVE 2 4SW LINCOLN ST , SW 10TH AVE 2 4SW 17TH ST , SW WANAMAKER RD 2 4
58

59
Pedest rian Risk Assessm ent Analysis
Table 1 - Location of Non-Intersection Pedestrian Crashes with Respect to Marked Crossings and Sidewalk Presence
PDO Minor
Injury Serious Injury Fatal Grand
Total % Total
Marked Crossing 0 19 2 0 21 15.1% Sidewalk Present 0 19 2 0 21 100.0%
Non-Marked Crossing 2 95 14 7 118 84.9% Sidewalk Present 1 63 7 3 74 62.7% None 1 16 6 4 27 22.9% Unknown 0 16 1 0 17 14.4%
Grand Total 2 114 16 7 139 100.0%
60
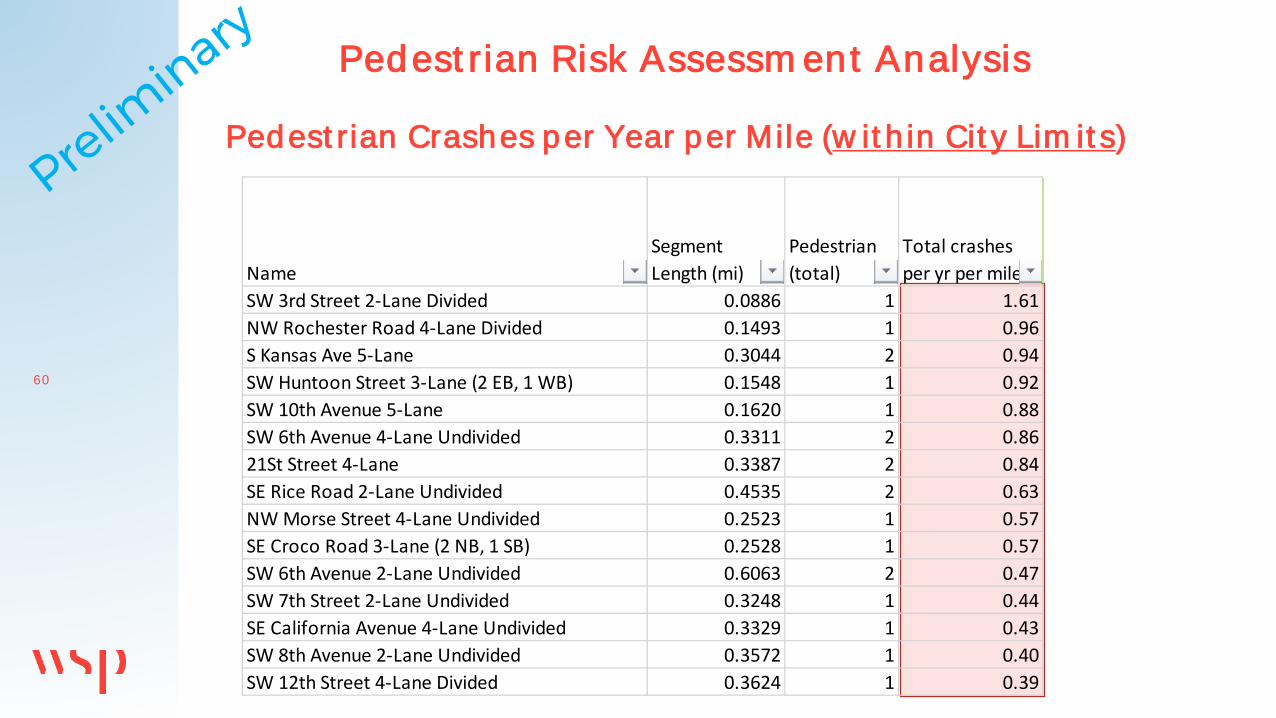
Pedest rian Risk Assessm ent Analysis
Pedest rian Crashes per Year per Mile (w it h in Cit y Lim it s)
NameSegment Length (mi)
Pedestrian (total)
Total crashes per yr per mile
SW 3rd Street 2-Lane Divided 0.0886 1 1.61NW Rochester Road 4-Lane Divided 0.1493 1 0.96S Kansas Ave 5-Lane 0.3044 2 0.94SW Huntoon Street 3-Lane (2 EB, 1 WB) 0.1548 1 0.92SW 10th Avenue 5-Lane 0.1620 1 0.88SW 6th Avenue 4-Lane Undivided 0.3311 2 0.8621St Street 4-Lane 0.3387 2 0.84SE Rice Road 2-Lane Undivided 0.4535 2 0.63NW Morse Street 4-Lane Undivided 0.2523 1 0.57SE Croco Road 3-Lane (2 NB, 1 SB) 0.2528 1 0.57SW 6th Avenue 2-Lane Undivided 0.6063 2 0.47SW 7th Street 2-Lane Undivided 0.3248 1 0.44SE California Avenue 4-Lane Undivided 0.3329 1 0.43SW 8th Avenue 2-Lane Undivided 0.3572 1 0.40SW 12th Street 4-Lane Divided 0.3624 1 0.39

61
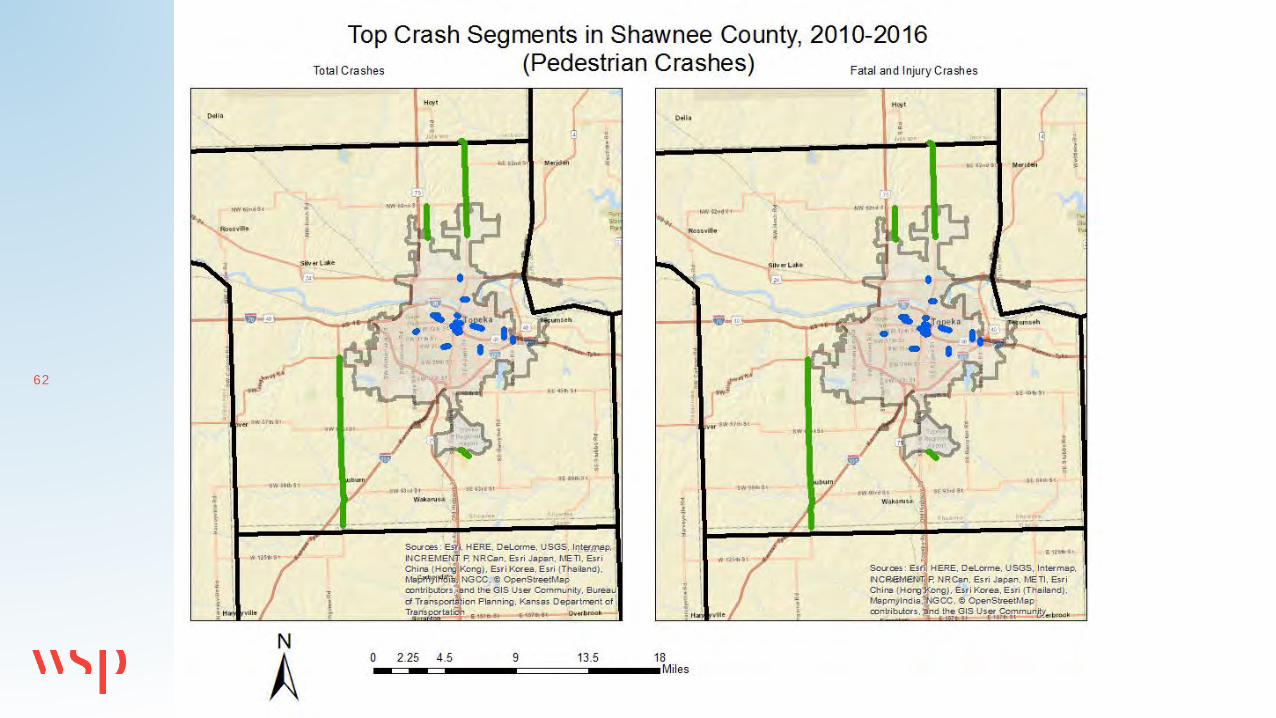
Pedest rian Risk Assessm ent Analysis
Pedest rian Crashes per Year per Mile (out side Cit y Lim it s)
NameSegment Length (mi)
Pedestrian (total)
Total crashes per yr per mile
Rank by total frequency_COUNTY
SE Gary Ornsby Drive 3-Lane (2 EB, 1 WB) 0.6557 1 0.22 1NW Button Road 2-Lane Undivided 2.0037 1 0.07 2SW Auburn Road 2-Lane Undivided 10.6039 2 0.03 3NW Topeka Blvd 2-Lane Undivided 5.9973 1 0.02 4
62

— Potent ial Em phasis Areas for MTPO
— Int ersect ions - (angle-sid e im p ac t, rear-end )— Roadw ay Depart ure (fixed ob jec t in urb an and rural areas) — Pedest r ians and Bicycl ist s — Urban & Rural Art er ials — Teen Drivers — Dist ract ed Driving — Speed
Em phasis Areas and Perform ance Measures

Topeka / Shaw nee County is doing w ell in these areas:— Occupant Prot ect ion –
— In 20 17, sea t belt observa t ions in Shaw nee County w ere a t 88 .2% (fifth h ighest county in Kansas).
— Mult i-year average ra te is 85.90 % (in m y op in ion, not an issue in Shaw nee County).
— Older Driver – b ased on th e d river age related d ata , c rash es involving old er d rivers in S h aw nee C ounty are b elow th e norm .
— Roundabout s – b uild ing round ab outs w h en intersec tions are im p roved surround ing th e C ity of Top ek a
— Com plet e St reet s Pol icy – In P roc ess
Em phasis Areas and Perform ance Measures

65

66
“Af t er a short learn ing curve period , roundabout s t end t o reduce all crashes by about 50 % and t end t o reduce serious in jury or fat al crashes by 80 % t o 90 % because t he h igh speed t -bone crash is alm ost im possib le in a roundabout .” - MinDOT

State of Kansas Safety Perform ance Measures
Em phasis Areas and Perform ance Measures
Measure (Dat a Source)
20 18 Project ion Target % below Project ion 20 18 HSP/HSIP Target
Num ber of Fat al i t ies (FARS) 36 4 0 % 36 4
Num ber of Serious In jur ies (KCARS) 120 2 1% 119 0
Serious In jury Rat e/10 0 MVMT (KCARS/FHW A)
3.8 5 1 2% 3.774
Fat al i t y Rat e/10 0 MVMT (FARS/FHW A) 1.17 1% 1.16
Non-Mot or ized Fat al i t ies and Serious In jur ies (FARS/KCARS) 139 1%
138

W HAT IS VISION ZERO?
• Safety is the m ost im portant factor in p lanning.
• Tra ffic dea ths & serious in juries a re p reventab le.
• Transporta t ion system s should be designed so tha t user errors a re not fa ta l.
• No loss of life is accep tab le.
Philosophy for t ransportat ion system design & operat ions that asserts:

69
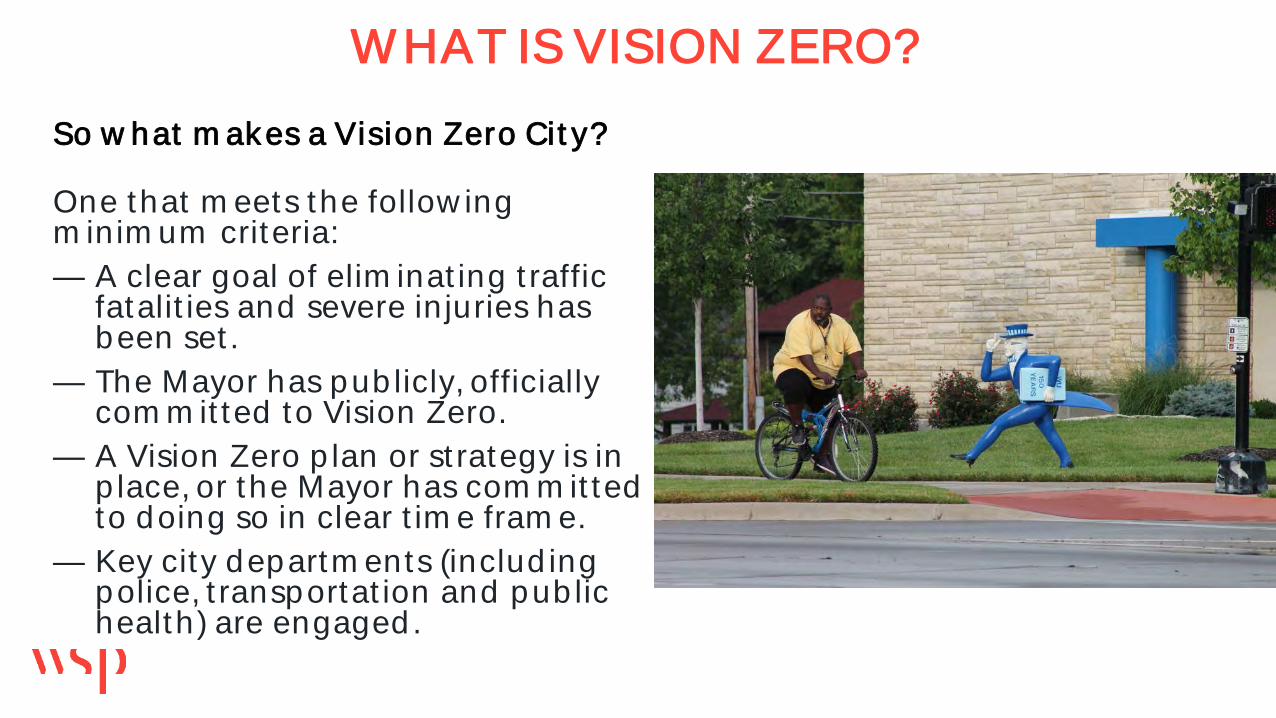
W HAT IS VISION ZERO?
One that m eets the follow ing m inim um criteria:— A clear goal of elim inat ing t raffic
fatalit ies and severe in juries has been set .
— The Mayor has pub licly, officially com m it ted to Vision Zero.
— A Vision Zero p lan or st rategy is in p lace, or the Mayor has com m it ted to doing so in clear t im e fram e.
— Key city departm ents (includ ing police, t ransportat ion and pub lic health) are engaged.
So w hat m akes a Vision Zero Cit y?

Transport at ion Safet y Survey
What input on t ransportat ion safety w ould w e like to ob tain from the pub lic?— Priorit izat ion? — Concerns for t ransp . safety?— Ideas to im prove t ransp . safety? — Support for Vision Zero?— Potent ial Em phasis Areas?
Discussion

- S ub m it Task B “w h itep ap er” to M TP O for review & c om m en t
- C on tin ue S afety A n alysis w ith in p ut from A d visory Group
- S elec t E m p h asis A reas to m ove forw ard (Task C )
- D evelop P erform an c e M easures for eac h E m p h asis A rea
- D evelop “Tran sp ortation S afety S urvey” th rough S urvey M on k ey for p ub lic in p ut
- P ub lic M eetin g # 1 w ill b e sc h ed uled in J uly 20 18 (C ity Lib rary)
- B egin strategy d evelop m en t for eac h E m p h asis A rea
- D evelop th e “D raft” M TP O Tran sp ortation S afety P lan d oc um en t
- P ub lic M eetin g # 2 w ill b e sc h ed uled in th e Fall of 20 18
- Fin alize M TP O Tran sp ortation S afety P lan d oc um en t
Next St eps
&
June 11, 2018
Stakeholder Meet ing # 2
Thank you!
Quest ions?