mtt a holistic, dynamic model to quantify and mitigate the environmental impacts of cattle farming_...
TRANSCRIPT

A holistic, dynamic model to quantify and mitigate the environmental impacts of cattle farming FootprintBEEF project (2012-) with Finnish companies HK Scan/Agri, Raisio and Yara
LiveM Livestock Modelling and Research Colloquium,
14-16 October 2014, Bilbao, Spain
Juha-Matti Katajajuuri1, Hannele Pulkkinen1, Sanna Hietala1, Perttu Virkajärvi2, Kirsi Järvenranta2, Jouni Nousiainen1, Arto Huuskonen3
1LCA team (SBE); 2Grass team; 3Beef production team of MTT

High-quality food, clean environment - better well-being
MTT Agrifood Research Finland
Our research promotes consumer well-being, the competitiveness
of agriculture and the food industry, the sustainable use of natural
resources, the quality of the production and living environment,
and the vitality of the countryside
1.1.2015- Natural Resources Institute Finland (LUKE)

© MTT Agrifood Research Finland
Objectives/themes of the “Responsible Food chain - Better Consumer Well-being” Research Area
1. Developing responsibility and sustainability in the food chain
2. Decreasing the footprints of food products and food chain
3. Improving resource efficiency in the food chain
4. Enabling consumers to make more responsible choices
5. Improving public health
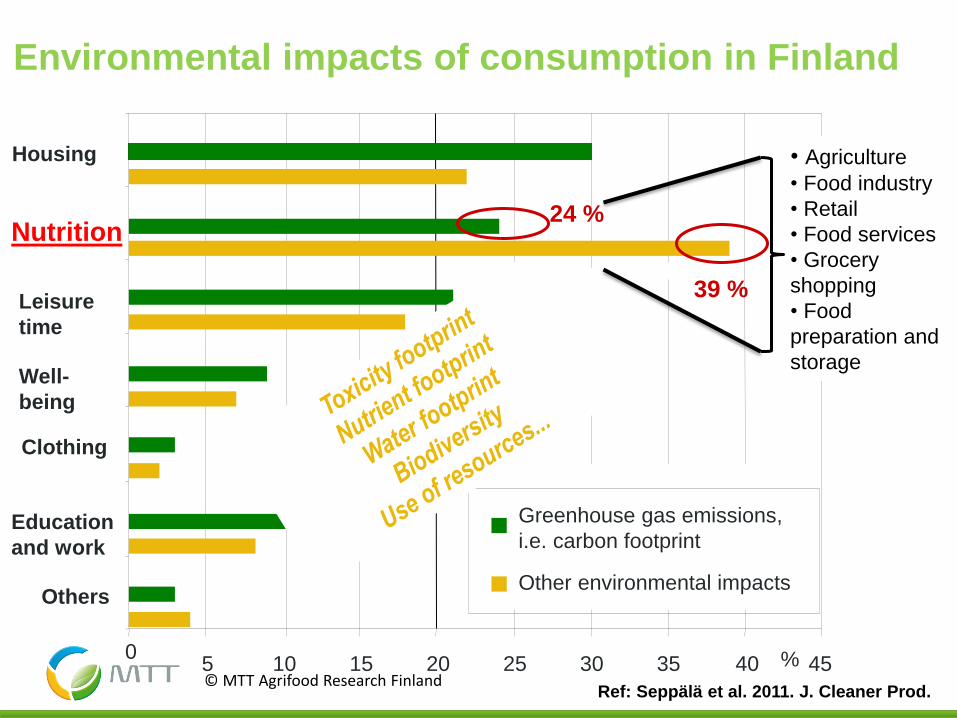
© MTT Agrifood Research Finland Ref: Seppälä et al. 2011. J. Cleaner Prod.
24 %
39 %
0 5 10 15 20 25 30 35 40 45
Housing
Nutrition
Leisure
time
Well-
being
Clothing
Education
and work
Others
%
Greenhouse gas emissions,
i.e. carbon footprint
Other environmental impacts
• Agriculture
• Food industry
• Retail
• Food services
• Grocery
shopping
• Food
preparation and
storage
Environmental impacts of consumption in Finland

© MTT Agrifood Research Finland
TEKIS MIELI VIEL NOSTAA ERI STUDYJEN VAIHTELUVÄLI RUOKATUOTTEISTA ESIM. NAUDANLIHA TAI KINKKU….ET YMMÄRTÄVÄT LÄHTÖKOHDAN KUIN PALJON TUTKIMKSET VAIHTELEE TEKIJÄT EROIHIN: - OLOSUHTEET - TUOTANTO-OSAAMINEN - METODIEROT!! Juu, kuulostaa fiksulta! Eiks se ole ihan hyvä se sun suomikalvo tosin eri ruokatuotteiden vaihteluvälistä. Kun yhden tuotteet vaihteluväli nyt ei paljon vielä kerro, mut kun näkee et kasviksilla 0,5-2 mut vaik sianlihalla 3-8, niin alkaa tajuta epävarmuudet!
17.10.2014 5
Examples of range of climate impacts of foodstuffs:
Climatic/regional differences
Management/production practices
Methodological differences
Ref: Katajajuuri, 2009. In: Government Foresight Report on
Long-term Climate and Energy Policy: Towards a Low-carbon
Finland. Prime Minister’s Office Publications 30/2009

© MTT Agrifood Research Finland
Background of FootprintBEEF project (2012-2015)
• Cattle farming is the most important agricultural contributor to environmental impacts
• Still, most often, for example the climate impacts of cattle farming are estimated using default IPCC emission factors (kg CH4 per cow) which only give a rough estimate rather than a detailed picture from different feeding and management strategies, in different geographical conditions, also many studies take N2O emissions as IPCC defaults, and N losses through manure as default (not calculated based on feeding), so there are no link between real feeding and associated emissions
• Detailed modeling and optimization of specific parts of the production system, such as grass production, enteric fermentation etc., has been made, but holistic and detailed studies on entire farming systems and their feed supply chains are more rare
• Deep biological (animal and crop) and LCA competence and real production data from farms are not often integrated
17.10.2014 6
© MTT Agrifood Research Finland
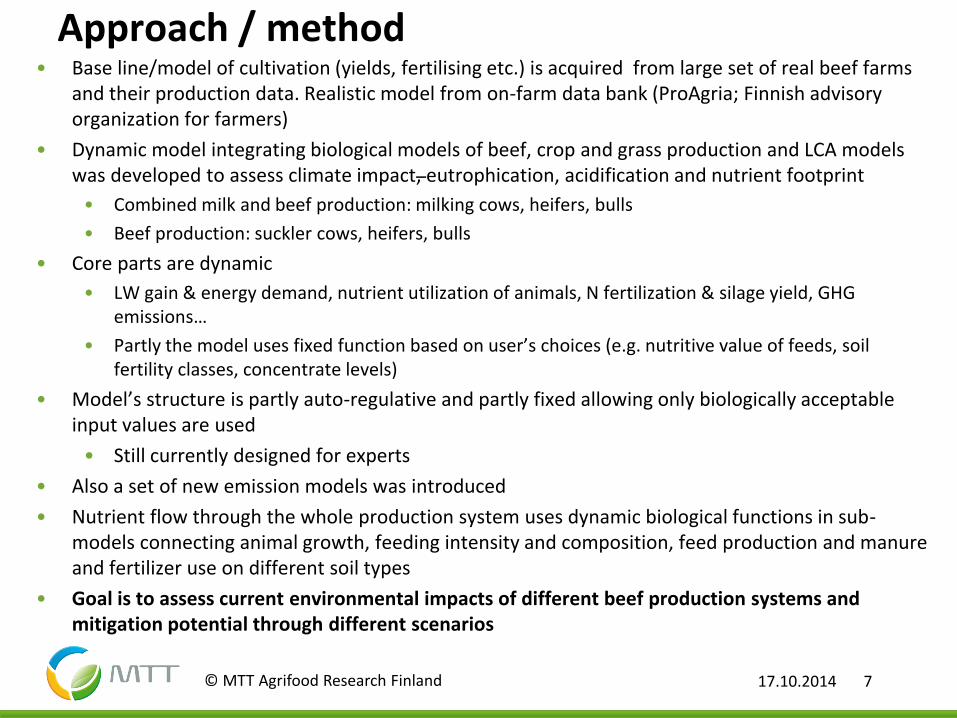
Approach / method • Base line/model of cultivation (yields, fertilising etc.) is acquired from large set of real beef farms
and their production data. Realistic model from on-farm data bank (ProAgria; Finnish advisory organization for farmers)
• Dynamic model integrating biological models of beef, crop and grass production and LCA models was developed to assess climate impact, eutrophication, acidification and nutrient footprint
• Combined milk and beef production: milking cows, heifers, bulls
• Beef production: suckler cows, heifers, bulls
• Core parts are dynamic
• LW gain & energy demand, nutrient utilization of animals, N fertilization & silage yield, GHG emissions…
• Partly the model uses fixed function based on user’s choices (e.g. nutritive value of feeds, soil fertility classes, concentrate levels)
• Model’s structure is partly auto-regulative and partly fixed allowing only biologically acceptable input values are used
• Still currently designed for experts
• Also a set of new emission models was introduced
• Nutrient flow through the whole production system uses dynamic biological functions in sub-models connecting animal growth, feeding intensity and composition, feed production and manure and fertilizer use on different soil types
• Goal is to assess current environmental impacts of different beef production systems and mitigation potential through different scenarios
17.10.2014 7
© MTT Agrifood Research Finland
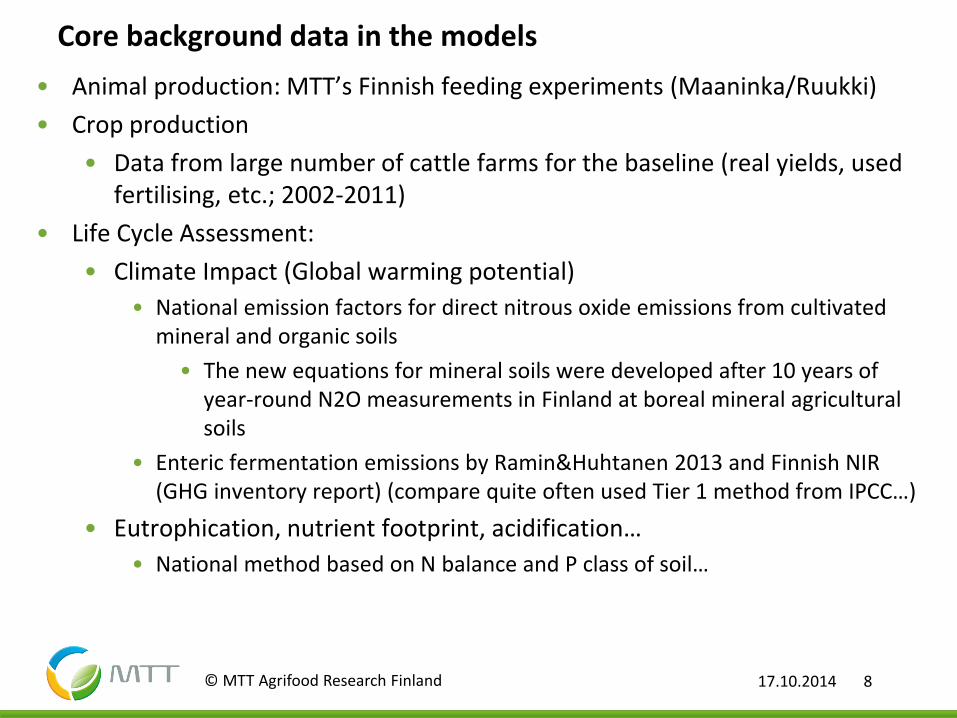
Core background data in the models
• Animal production: MTT’s Finnish feeding experiments (Maaninka/Ruukki)
• Crop production
• Data from large number of cattle farms for the baseline (real yields, used fertilising, etc.; 2002-2011)
• Life Cycle Assessment:
• Climate Impact (Global warming potential)
• National emission factors for direct nitrous oxide emissions from cultivated mineral and organic soils
• The new equations for mineral soils were developed after 10 years of year-round N2O measurements in Finland at boreal mineral agricultural soils
• Enteric fermentation emissions by Ramin&Huhtanen 2013 and Finnish NIR (GHG inventory report) (compare quite often used Tier 1 method from IPCC…)
• Eutrophication, nutrient footprint, acidification…
• National method based on N balance and P class of soil…
17.10.2014 8

© MTT Agrifood Research Finland
More information from emission background models e.g. from:
• Salo et al 2013. Nitrogen fertilizer rates, N balances, and related risk of N leaching in Finnish agriculture. MTT Report 102. MTT Agrifood Research Finland
• M. Ramin, P. Huhtanen 2013. Development of equations for predicting methane emissions from ruminants. Journal of Dairy Science. Volume 96, Issue 4. 2476-2493.
• K. Regina, J. Kaseva, M. Esala 2013. Emissions of nitrous oxide from boreal agricultural mineral soils - Statistical models based on measurements. Agriculture, Ecosystems & Environment. Volume 164. 131-136.
17.10.2014 9
© MTT Agrifood Research Finland
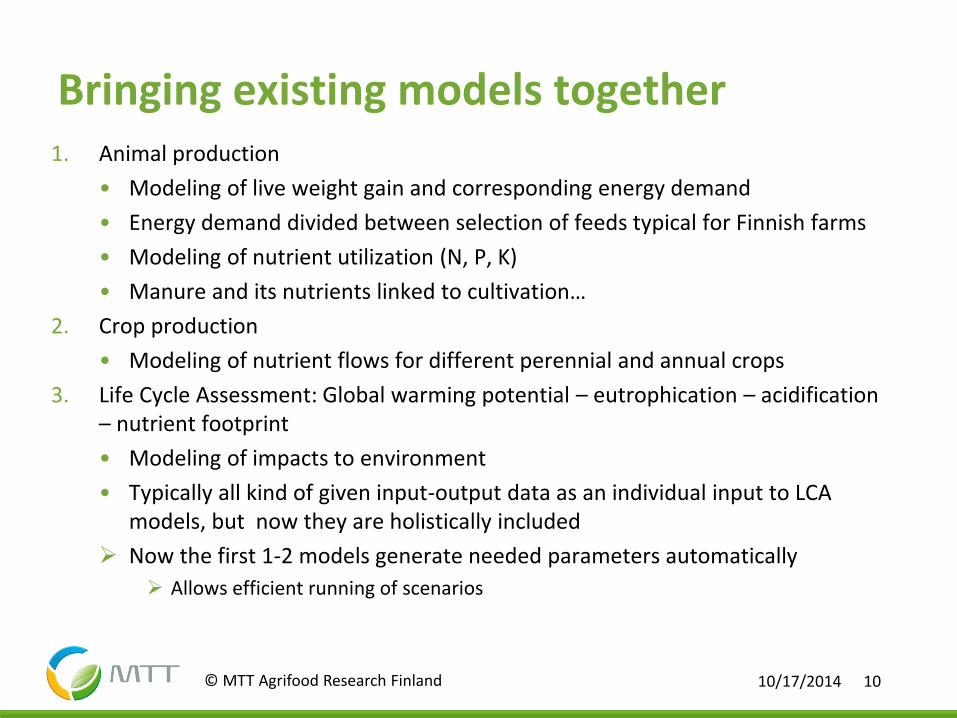
Bringing existing models together 1. Animal production
• Modeling of live weight gain and corresponding energy demand
• Energy demand divided between selection of feeds typical for Finnish farms
• Modeling of nutrient utilization (N, P, K)
• Manure and its nutrients linked to cultivation…
2. Crop production
• Modeling of nutrient flows for different perennial and annual crops
3. Life Cycle Assessment: Global warming potential – eutrophication – acidification – nutrient footprint
• Modeling of impacts to environment
• Typically all kind of given input-output data as an individual input to LCA models, but now they are holistically included
Now the first 1-2 models generate needed parameters automatically
Allows efficient running of scenarios
10/17/2014 10

© MTT Agrifood Research Finland
The holistic model • Modeling the life cycle of a one animal
• Input data in basic mode of FootprintBEEF-model:
1. Which feeds are used
2. Purchased feeds
3. Share of forage vs. concentrates
4. Slaughter age and weight
5. Manure management system
6. Share of manure spread on different feeds (cultivation areas)
• Model will automatically calculate
• gross energy need of the animal
• how much feeds are needed
• field area and bought fertilizers required
• Manure use at field
• Environmental impacts (from cradle to gate)
10/17/2014 11

© MTT Agrifood Research Finland
Additionally model consists of …
• light fuel oil use of machinery
• use of lime
• storing losses of manure
• energy consumption of cattle houses
• Environmental impacts from supply chain of mineral fertilizer and lime
• Environmental impacts of production energy carriers
• …
• Not included • production of pesticides, herbicides and fungicides
• Production of capital equipment
10/17/2014 12

© MTT Agrifood Research Finland 17.10.2014 13
The core of the model: Energy requirement of an animal
• Finnish data
• Calf period HY/Hepola
• Other: MTT Ruukki, MTT Maaninka,
• Energy requirement (ME) estimated for 6 periods
• Energy requirement devided between different feeds
• Restricted to most typical type of feeds
• Nutritional value from Feed Tables (Finland)
• pre-selected choice for e.g. D value of grass silage & corresponding other variables
Age, d D
aily
ene
rgy n
eed,
ME
/d

© MTT Agrifood Research Finland
Crop cultivation - Fertilizing, liming
Field use /crop
Enteric
fermentation &
nutrient levels of
manure and use
of bedding
Feeding - addition of purchased feeds
Total emissions from
field - N and P leaching and run-
off
- N2O-emissions from soils
- CO2-emissions from
liming
- CO2 & NOx emissions
from field work and
transportations
Results
- Nutrient losses/ animal
- N & P balances
- Greenhouse gases
- Eutrophication…
Nutrient losses from
manure spreading - N, P, K, C
Nutrient losses on field
N, P, K, C - Per crop type
Division of manure
nutrients to crops -Storage loss of manure
nutrients N, P, K, C
- GHG-emissions from
manure storage
System description - Slaughter data, feeds, silage D-value,
crop yield, soil type, P-class, manure use,
number of cuts in grass production,
spreading method …
Growth
rate
kg/d LW
D-value,
C vs R % Feed energy need of
an animal
Feed properties - Nutritional value (energy,
minerals etc.)
N & P
Energy consumption
of field work and
transportations
2.10.2014 14

© MTT Agrifood Research Finland
Running of scenarios
• Model constructed in such a way that efficient running of scenarios possible
• To evaluate effects to climate impact, eutrophication and acidification simultaneously
• To evaluate effects of different mitigation options simultaneously
• Corrections/checks
• Yield response to different N fertilizer levels
• Finnish grass experiments data (review of Salo et al 2013)
• Digestibility (D) values of grass silage
• Varies according to number of cuts (in Finland most commonly two (!) but also three are used)
• Corrections to growing period according to D-value and share of concentrates (grains and rape seed vs. roughage)
• Automatic calculations of energy need of one animal, when slaughter age and weight are changed
10/17/2014 15
© MTT Agrifood Research Finland
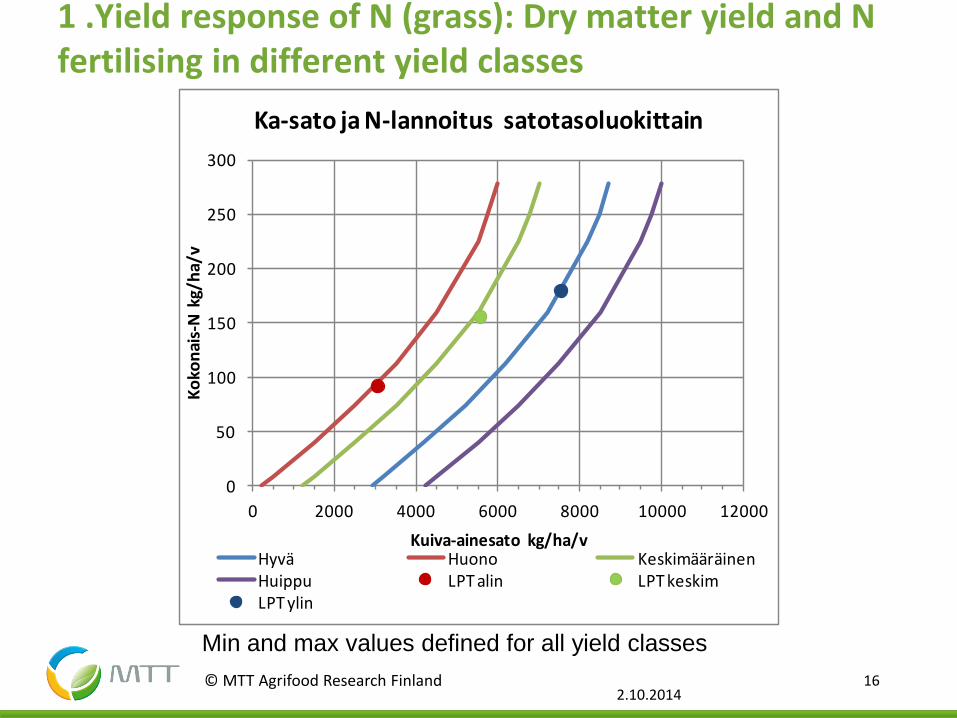
1 .Yield response of N (grass): Dry matter yield and N fertilising in different yield classes
2.10.2014 16
0
50
100
150
200
250
300
0 2000 4000 6000 8000 10000 12000
Ko
kon
ais-
N k
g/h
a/v
Kuiva-ainesato kg/ha/v
Ka-sato ja N-lannoitus satotasoluokittain
Hyvä Huono KeskimääräinenHuippu LPT alin LPT keskimLPT ylin
Min and max values defined for all yield classes

© MTT Agrifood Research Finland
Conclusions / Procedure until 2015 • The new model with various development options possible in
practical farming pinpoints the challenges at the sector
• The model can be used to achieve knowledge of a current status of a specific system based on available data or it can be used for assessment of different scenarios
• Effects of changing diet, inputs or manure management processes to different environmental impacts can be seen directly
• It gives understanding on contradictions between different mitigation options and helps choosing the most sustainable practices
• Modelling and results are completed in June 2015 (all different beef production systems and their scenarios)
17.10.2014 17