mucool lh2 absorber progress and pauses mary anne cummings fnal august 12, 2002
Post on 21-Dec-2015
216 views
TRANSCRIPT

Mucool LH2 Absorber Progress and Pauses
Mary Anne Cummings
FNALAugust 12, 2002
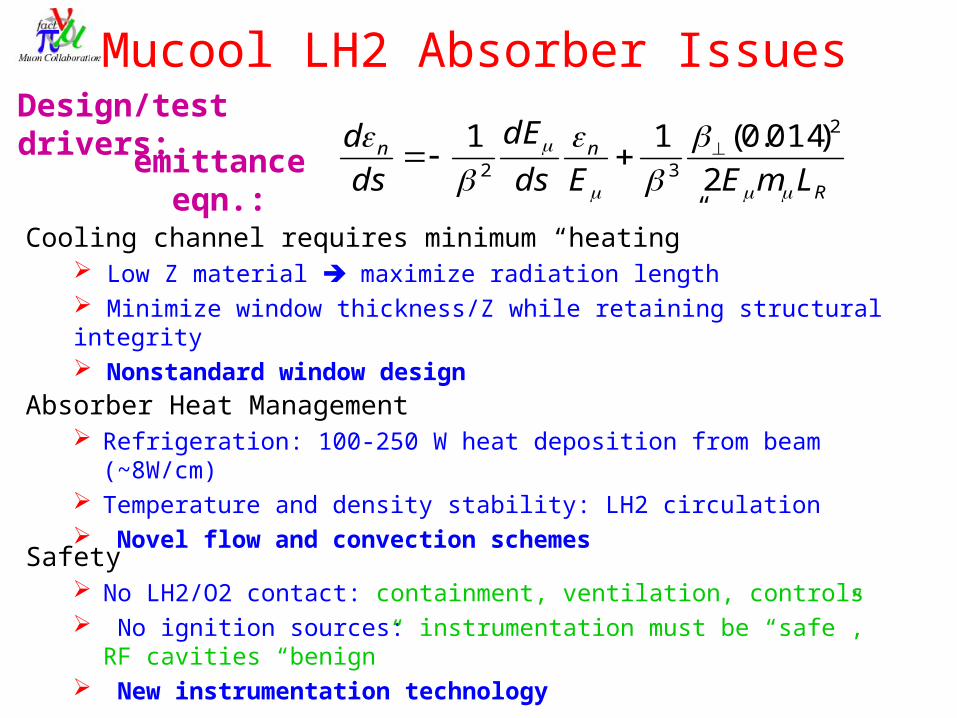
Cooling channel requires minimum “heating” Low Z material maximize radiation length Minimize window thickness/Z while retaining structural integrity Nonstandard window design
Absorber Heat Management Refrigeration: 100-250 W heat deposition from beam (~8W/cm) Temperature and density stability: LH2 circulation Novel flow and convection schemes
Mucool LH2 Absorber Issues
Safety No LH2/O2 contact: containment, ventilation, controls No ignition sources: instrumentation must be “safe”, RF
cavities “benign” New instrumentation technology
R
nn
LmEEds
dE
ds
d
2
)014.0(11 2
32emittance
eqn.:
Design/test drivers:
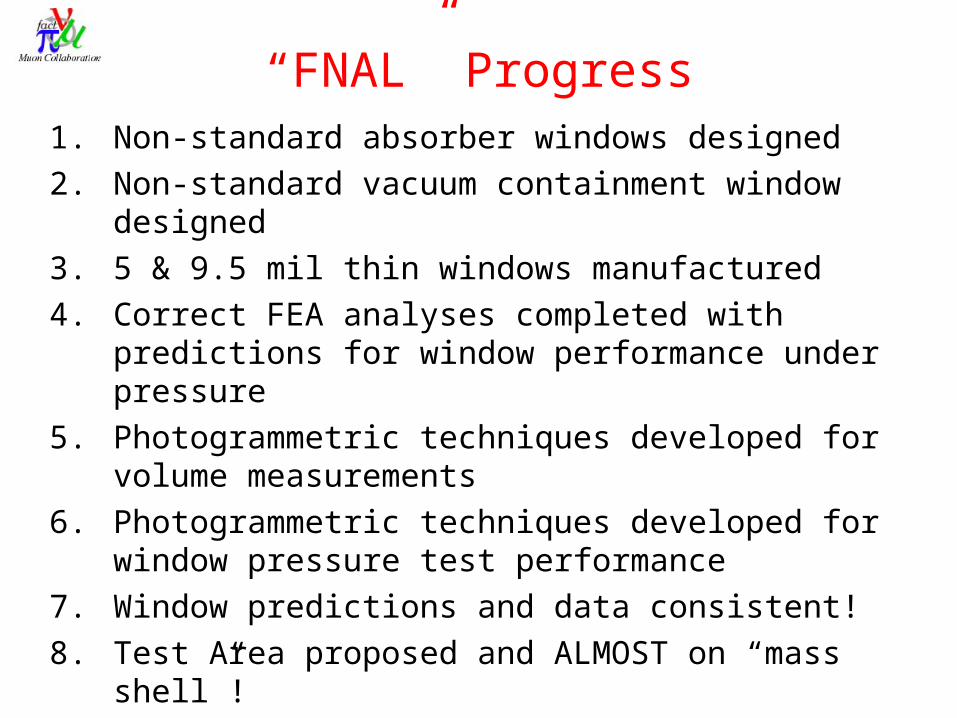
“FNAL” Progress1. Non-standard absorber windows designed2. Non-standard vacuum containment window
designed3. 5 & 9.5 mil thin windows manufactured4. Correct FEA analyses completed with predictions
for window performance under pressure5. Photogrammetric techniques developed for
volume measurements6. Photogrammetric techniques developed for
window pressure test performance 7. Window predictions and data consistent!8. Test Area proposed and ALMOST on “mass shell”!9. Test Area Absorber system designed.

“Offshore” Progress1. Convection prototype built2. Convection prototype cryogenically operated3. Convection calculations 4. Three dimensional flow test demonstration5. Schlieren test program started6. NIM Articles in progress7. Window predictions and data consistent!

“Non-standard” thin windowsExploit the structural stability of the spherical capwith a tapered/inflected connection to a solid flange
Modified torisphericalwindow (Black/Cummings)
“Bellows” inflectedwindow (Black/Lau)
Xi
t
diameter
R
r r

How to determine the “thinnest” thickness
1. Two different radii of curvature
2. Possibly not concentric
Modified torispherical design
If not at the center, where?

Manufacture to rupture
130 window“350” window
“340” window
2.
3.
Burst at ~ 120 psi
Burst at ~ 120 psi
4.
Burst at ~ 151 psi
Cryo test
Leaking appeared at 31 psi ..outright rupture at 44 psi!
1.
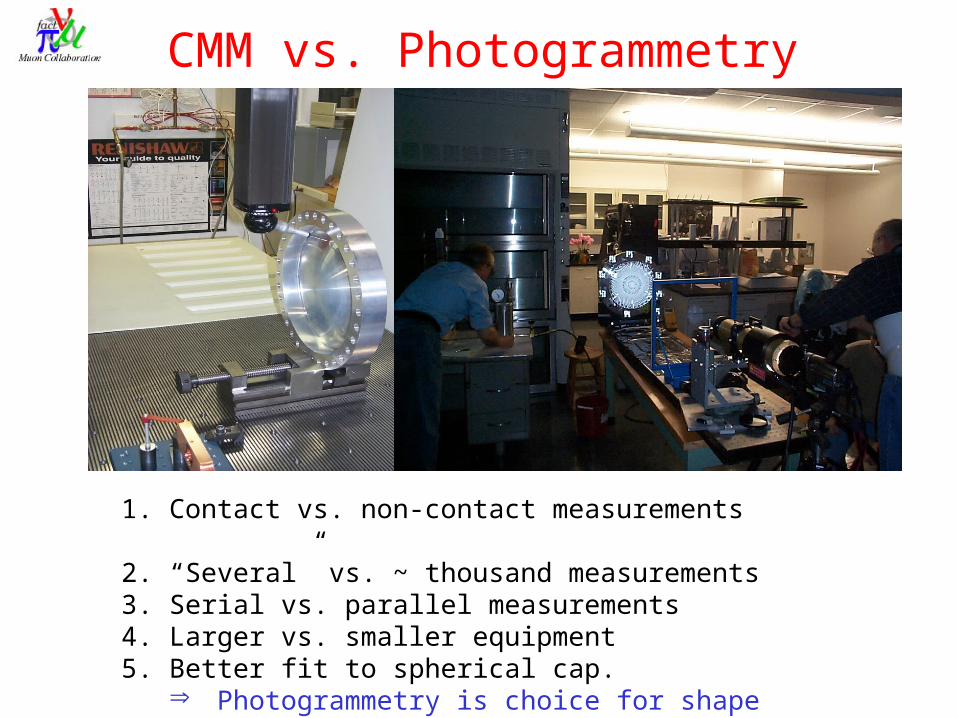
CMM vs. Photogrammetry
1. Contact vs. non-contact measurements 2. “Several” vs. ~ thousand measurements3. Serial vs. parallel measurements4. Larger vs. smaller equipment5. Better fit to spherical cap.
Photogrammetry is choice for shape measurement

Strain gage vs. Photogrammetry
1. Contact vs. non-contact measurements 2. Smaller spot vs. extended length3. No messy wiring on the window test setup!4. Better systematics – no added material!5. Better coverage!
Photogrammetry is choice for strain measurement
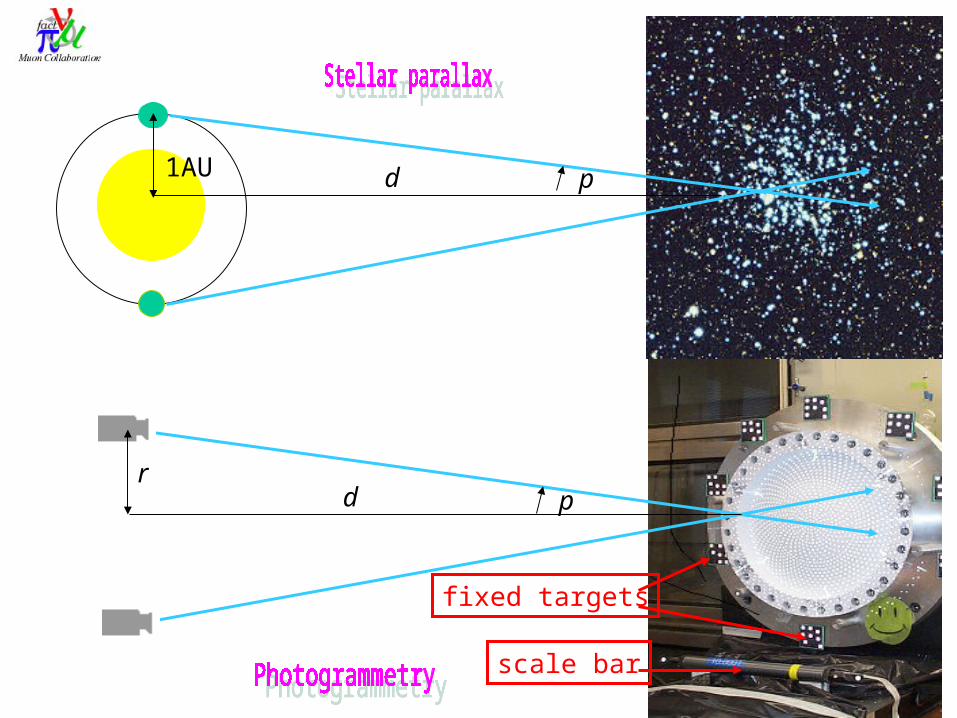
d
1AU
r
d
p
p
scale bar
fixed targets

Photogrammetry resolution
convex concave convex concave
dR
r
2cos
1sin
2
RRd
R
r
Alignment of sides
D’
Small triangle fit
Use spherical fit of small trianglesD = 341.0m ( 5.5m) + (- ~10m)

Stress distribution at the yield point
FEA CalculationsFinite Element Analysis
Non-elastic region included
Three dimensios necessary for vibrational analysis
Window/flangesimulation
Window/flange cross section
FEA, non-elastic region included Displacement vs. radius under pressure:
NIU photogrammetry results and FEA calculations

Window performance summary
Summary of burst pressures and thicknesses
Window number Temperature Measured burst pressure (psi) FEA burst (psi) FEA burst pressure (psi) CMM thickness (um) Photogrammetry thickness(um)thickness=127um design thickness=127um
1 room 43.5 48 na 114 na
Window number Temperature Measured burst pressure (psi) FEA burst (psi) FEA burst pressure (psi) CMM thickness (um) Photogrammetry thickness(um)thickness=345um design thickness=330um
2 room 119 123 117 357 na3 room 120 123 117 346 na4 LN 151 162 156 365 331.6
1. Descrepancies between CMM and photogrammetry are larger than their intrinsic errors
2. Descrepancies between photogrammetry and FEA predictions are < 5%

Design of LINAC LH2 Absorber Beam Test
x
z
accelerator
absorber
Multiple scattering
RF cavity
Physicist’svision
Engineer’svision

Heat Absorption and Temperature Maintenance
1. What are the usable predictions from simulations?
2. What are the meaningful measurements?3. Radical changes: flat windows?
Design:
1. What do we need for temp/density measurements?
2. Window heating3. Strain gauging
Monitoring:

Safety Review
1. Windows (absorber) holdup: MACC, FEA & data pts
2. Windows (Vacuum) holdup will be the same3. Manifolds Mucool Responsibilities4. Instrumentation Mucool 5. Cryogenics FNAL

The Near Program
1. MICE and FNAL LINAC program merge2. Convection Absorber schedule for LINAC3. Instrumentation and DAQ integration4. The LINAC/MICE cooling cell designs

Experiment Signals- Absorber
• temperature 12
• pressure transducers see under cryo 2
• Photogrammetry/optical (??) 2
• laser occlusion sensor (??) 4
• piezo vibration sensors 2
• Optical fiber strain gauges 2
• bolometry 44
• O2 sensors 3per each of 5 flanges 15
• H2 sensors on exhaust line 10
• CCD camera 2 images
• MICE channels “N”
#signals

Instrumentation
1. Temperature/density uniformity inside LH22. Safety instrumention inside vacuum area3. Detectors for cooling measurements
Safety Issues: 1. Limits the amount of energy/(area or vol)
2. Physical size of the signal feedthroughs3. Seals from signals to electronics:
wiresfiberstubes