mufg global fund sicav · director mr. akio iida, chief manager, mitsubishi ufj trust and banking...
TRANSCRIPT

MUFG Global Fund SICAV
Société d'Investissement à Capital Variable
Luxembourg
AUDITED ANNUAL REPORT AS AT MARCH 31, 2017
R.C.S. Luxembourg No. B-182.362


1
MUFG Global Fund SICAV Société d’Investissement à Capital Variable
Luxembourg
AUDITED ANNUAL REPORT AS AT MARCH 31, 2017

MUFG Global Fund SICAV
AUDITED ANNUAL REPORT AS AT MARCH 31, 2017
Any subscriptions not based on the information contained in the relevant currently valid prospectus accompanied by the relevant key investor information document, and the most recent annual report and semi-annual report, if the latter was published after the annual report, shall be invalid.
2

MUFG Global Fund SICAV
3
TABLE OF CONTENTS
MANAGEMENT AND ADMINISTRATION ............................................................................. 4
INFORMATION TO SHAREHOLDERS ................................................................................. 6
MANAGER’S REPORT ......................................................................................................... 7
RISK DISCLOSURE ............................................................................................................ 11
AUDIT REPORT .................................................................................................................. 12
STATEMENT OF NET ASSETS .......................................................................................... 14
STATEMENT OF OPERATIONS AND CHANGES IN NET ASSETS ................................. 16
MUFG Asia Pacific ex Japan Equity High Growth Fund
Statement of investments and other net assets ....................................... 18
Geographical classification of investments .............................................. 21
MUFG Asia Pacific ex Japan Equity Income Growth Fund
Statement of investments and other net assets ....................................... 22
Geographical classification of investments .............................................. 25
MUFG Asia Pacific ex Japan Equity Stable Growth Fund
Statement of investments and other net assets ....................................... 26
Geographical classification of investments .............................................. 29
MUFG Japan Equity Strategic Value Fund
Statement of investments and other net assets ....................................... 30
Geographical classification of investments .............................................. 31
MUFG Japan Equity Small Cap Fund
Statement of investments and other net assets ....................................... 32
Geographical classification of investments .............................................. 35
CHANGES IN THE NUMBER OF SHARES AND STATISTICAL INFORMATION .............. 36
NOTES TO THE FINANCIAL STATEMENTS ..................................................................... 41
UNAUDITED APPENDIX ..................................................................................................... 47

MUFG Global Fund SICAV
4
MANAGEMENT AND ADMINISTRATION REGISTERED 287-289, Route d’Arlon, L-1150 Luxembourg
OFFICE
MANAGEMENT MUFG Lux Management Company S.A., 287-289, Route d’Arlon, L-1150 Luxembourg
COMPANY
BOARD OF
DIRECTORS OF
THE SICAV
Chairman MUFG Lux Management Company S.A., represented by Jean-François FORTEMPS, Managing
Director and Conducting Officer, MUFG Lux Management Company S.A., Luxembourg Director Mr. Jun KAWAKUBO, Senior Vice President, Mitsubishi UFJ Investor Services & Banking
(Luxembourg) S.A., Luxembourg (resigned on March 18, 2016) Director Mr. Hiroyasu OMURA, Senior Deputy General Manager of the Global Asset Management
Business Division of Mitsubishi UFJ Trust and Banking (appointed on July 13, 2016)
Director Mr. Masaru YOSHIDA Senior Vice President, Mitsubishi UFJ Investor Services & Banking
(Luxembourg) S.A., Luxembourg
BOARD OF
DIRECTORS OF
THE MANAGEMENT
COMPANY
Chairman Mr. Ko TERAWAKI, Managing Director, Mitsubishi UFJ Investor Services & Banking
(Luxembourg) S.A., Luxembourg (resigned on December 15, 2016)
Chairman Mr. Shunji MAEHARA, Associate General Manager, Mitsubishi UFJ Trust and Banking
Corporation, Japan (appointed on December 15, 2016)
Director Mr. Jean-François FORTEMPS, Managing Director and Conducting Officer, MUFG Lux
Management Company S.A., Luxembourg
Director Mr. Paul GUILLAUME, Non-Executive and Independent Director, Altra Partners S.A.,
Luxembourg
Director Mr. Jiro OMORI, Senior Deputy General Manager, in the Trust Assets Planning Division of
Mitsubishi UFJ Trust and Banking Corporation, Japan (resigned on December 15, 2016)
Director Mr. Akio IIDA, Chief Manager, Mitsubishi UFJ Trust and Banking Corporation, Japan
(appointed on December 15, 2016)
CONDUCTING Mr. Jean-François FORTEMPS, Managing Director and Conducting Officer
OFFICERS Mr. Krzysztof DUDEK
Ms. Nathalie CHILLA (appointed on March 3, 2017)
Ms. Varsha PATEL-HAWES (appointed on March 3, 2017)
Mr. Andrea PAPAZZONI (resigned on October 31, 2016)

MUFG Global Fund SICAV
5
MANAGEMENT AND ADMINISTRATION (continued)
INVESTMENT Mitsubishi UFJ Asset Management (UK) Ltd, 24 Lombard Street, London EC3V 9AJ,
MANAGER United Kingdom
SUB-INVESTMENT Mitsubishi UFJ Trust and Banking, Corporation 4-5, Marunouchi 1-Chome, Chiyoda-ku,
MANAGERS Tokyo 100-8212, Japan
MU Investments Co., Ltd. 3-11, Kanda Surugadai 2-Chome, Chiyoda-ku, Tokyo 101-0062,
Japan
DEPOSITARY BANK, Mitsubishi UFJ Investor Services & Banking (Luxembourg) S.A., 287-289, Route d’Arlon,
DOMICILIARY AGENT, L-1150 Luxembourg
REGISTRAR,
TRANSFER,
ADMINISTRATIVE AND
PAYING AGENT
REPRESENTATIVE IN Mitsubishi UFJ Asset Management (UK) Ltd, 24 Lombard Street, London EC3V 9AJ,
UNITED KINGDOM United Kingdom
REPRESENTATIVE IN Société Générale Securities Services, 29 Boulevard Haussmann, 75009 Paris, France
FRANCE
AUDITOR PricewaterhouseCoopers, Société coopérative, 2, rue Gerhard Mercator, L-2182 Luxembourg
OF THE FUND
AUDITOR OF THE Deloitte Audit, Société à responsabilité limitée, 560, rue de Neudorf, L-2220 Luxembourg
MANAGEMENT
COMPANY

MUFG Global Fund SICAV
6
INFORMATION TO SHAREHOLDERS Financial year and reporting
The financial year starts on April 1 and ends on March 31 of each year.
Audited annual reports are made available at the registered office of the Fund no later than four months after the end of the
financial year and unaudited semi-annual reports are made available two months after the end of such period.
The Fund’s Annual General Meeting is held on Wednesday of the 3rd week in July. If such day is a legal bank holiday in
Luxembourg, the Annual General Meeting should hold on the next following full bank business day in Luxembourg.
Documents available for inspection
Copies of the following documents can be inspected during normal business hours (except for weekends and holidays) at
the registered office of the Management Company and the depositary bank:
The Fund’s full prospectus;
The Fund’s Key Investor Information Document (KIID);
The Fund’s Articles of Incorporation;
The Fund’s annual and semi-annual financial report.
The statement of changes in the investment portfolio for the year ended March 31, 2017 is available free of charge at the
Registered Office of the Management Company.

MUFG Global Fund SICAV
7
MANAGER’S REPORT Equity Market Review
MUFG Asia Pacific ex Japan Equity High Growth Fund / MUFG Asia Pacific ex Japan Equity Income Growth Fund /
MUFG Asia Pacific ex Japan Equity Stable Growth Fund
The MSCI AC Asia Pacific ex Japan Total Index, net dividends denominated in USD, returned +18.19% over the twelve
months ended 31st March 2017.
From April until June, the Asia Pacific equity market was almost flat despite its volatility on the back of concerns over
BREXIT and Fed rate hikes. From July through September, the market went up strongly due to receding expectations for
the Fed rate hikes and better-than-expected earnings results in the region were well received. The market was also pushed
up by strong money inflow into this region. In particular, China and Hong Kong were supported by money flow in
anticipation of the launch of the Shenzhen-Hong Kong Stock Connect.
Coming into October, the market started to slide due to a rise in US long-term rates fuelled by hawkish comments by Fed
officials, and increasing European rates in expectation of tapering of quantitative easing by the ECB. The market declined
further especially after US treasury yields shot up as a result of the US Presidential election in early November and foreign
investors pulled money out of this region.
However, since January, the market has turned positive. The market was supported by strong US and European markets
on the back of stabilization of rising long-term interest rates and US dollar. In addition, resilient Chinese macroeconomic
figures also fueled the market. On top of that, robust earnings results in the region since late-January provided another
boost. Especially since March, the market appreciated largely driven by corporate earnings.
Among the countries in the region, Taiwan and Korea outperformed due to strong earnings results mainly in Information
Technology sector. On the other hand, Malaysia and the Philippines underperformed mainly due to strong foreign money
outflow caused by a rise in US long-term yields.
Performance Review
MUFG Asia Pacific ex Japan Equity High Growth Fund
The Sub-fund underperformed the MSCI AC Asia Pacific ex Japan index by 6.52% (in USD) over the twelve-month period,
mainly during October 2016 to March 2017.
Our stock selection in Consumer and Information Technology sectors contributed negatively, especially in Korea, Taiwan
and Australia. The Sub-fund focuses on stocks with strong earnings growth on the back of mid-long term growth driver and
high ability to deliver earnings growth, and that worked well until September. Since October, however, our holdings such as
Taiwanese consumer related names faced profit-taking. Some of our holdings in Taiwan and Australia declined sharply as
they posted weaker-than-expected earnings results. As for individual stocks, one of the worst contributors was G8
Education (GEM AU, Australia, Child care center operator). The company released semi-annual results, which were
weaker than market expectations due to slower expansion of its center network and faster wage increases. We did not hold
Samsung Electronics, one of the biggest benchmark names, but the stock rallied strongly during this period, and that also
affected our performance negatively.
In terms of country allocation, we overweight the Philippines as a result of bottom up stock picking, and this position
contributed negatively, while our overweight position in Taiwan contributed positively.

MUFG Global Fund SICAV
8
MANAGER’S REPORT (continued) Performance Review (continued)
MUFG Asia Pacific ex Japan Equity Income Growth Fund
The Sub-fund underperformed the MSCI AC Asia Pacific ex Japan index by 4.34% (in USD) over the twelve-month period.
The strategy focusing on companies with 1) above average dividend yields and 2) potential to increase dividends on the
back of future earnings growth did not work well duréing this period mainly in Australia and Taiwan. Investors’ preference
for defensive stocks with high dividend yields abated due to rising interest rates globally, while some of our holdings in
Korea, Singapore and Malaysia performed strongly as they delivered strong earnings growth.
As for individual stocks, one of the worst contributors was Servcorp (SRV AU, Contracted serviced offices provider). Its
share price dropped sharply as the company revised their profit forecast downward. The other detractor was Estia Health
(EHE AU, Operator of retirement homes facilities). Estia posted weaker-than-expected profits as its costs increased due to
business expansion and adjustments in expense accruals. We sold off the position as its poor cost control could disrupt
future dividend growth.
In terms of country allocation, we overweight Malaysia and Singapore while underweight China. These positions worked
negatively.
MUFG Asia Pacific ex Japan Equity Stable Growth Fund
The Sub-fund underperformed the MSCI AC Asia Pacific ex Japan Index by 6.54% (USD I class) over the twelve-month
period, especially from October 2016 to February 2017. Our stock selection in Taiwan, Korea and Australia contributed
negatively.
The Sub-fund outperformed the overall market significantly due to earnings driven markets at the beginning of the fiscal
year. Our stock selection focusing on structural growth worked well especially in China.
However, the Sub-fund heavily underperformed especially from November to February. Our bottom-up stock picking
focusing on long-term structural growth drivers did not work, while cyclical and value stocks such as financials and
commodity related stocks led the market rally. One of the worst contributors was Jollibee Foods (JFC PM, Fast food
restaurants), which released weaker-than-expected earnings results due to increased staff costs. Also, our underweight
position in Samsung Electronics, which is one of the biggest benchmark names and rallied strongly during this period,
contributed negatively.
Overall, the stocks we invest in with a focus on structural growth lagged the market.
Equity Market Review
MUFG Japan Equity Strategic Value Fund
The Tokyo Stock Exchange Price Index, TOPIX, returned 14.7% in Japanese Yen over the twelve months ended 31st
March 2017.
The Japanese equity market started April on a negative note due to a stronger yen and a slide in oil prices. After a brief
rebound, concerns over the impact of the earthquakes in Kumamoto Prefecture weighed on Japanese shares. In June, the
outcome of the UK referendum to leave the EU intensified global risk aversion and the Japanese stock market tumbled to
its lowest level of the period.
The market rebounded in July along with other global equity markets with uncertainties receding on the back of a landslide
victory for the ruling party in the upper house election and the Bank of Japan’s decision to expand its ETF purchase
programme. A prompt election of a new prime minister in the UK also bolstered investor sentiment. Thereafter, Japanese
stocks extended gains, supported by the Bank of Japan’s announcement of new policy framework to keep the 10-year JGB
yield around zero in late September.

MUFG Global Fund SICAV
9
MANAGER’S REPORT (continued) Equity Market Review (continued)
MUFG Japan Equity Strategic Value Fund (continued)
After an initial sell-off in the wake of Mr Trump’s victory in the US presidential election on November 9, the Japanese equity
market moved up sharply on the yen depreciation amid growing expectations for a massive corporate tax cut, infrastructure
spending and easing of regulations under his administration. Entering 2017, the upward trend was weakened by concerns
about President Trump’s protectionist policies and political battle against the Congress; however, in March, the TOPIX
index reached its highest level in the period. Although the US Federal Reserve raised its interest rate in December 2016
and March 2017, the central bank’s cautious stance limited the impact on equity markets.
Performance Review
MUFG Japan Equity Strategic Value Fund
MUFG Japan Equity Strategic Value Fund posted positive returns amid strong advance in Japanese equities since July,
and returned 23.5% (in JPY, JPY I Class) over the twelve months period. Our strategy struggled in the fiscal year to March
2016, when investors had preferred to overvalued names, such as stable growth stocks. However, investor focus shifted
towards valuations reflecting the bottoming out in the global economy, with a part of large-cap stocks as well as cyclical
stocks - which had been left undervalued - outperforming the overall market. It provided a positive backdrop for the Fund.
At the stock level, notable positive contributor was Disco (6146 JP), a semiconductor equipment manufacturer. Its share
price rose sharply on the back of a recovery in the semiconductor market. The Fund also benefited by Ebara (6361 JP),
Komatsu (6301 JP), Omron (6645 JP) and Mitsubishi Electric (6503). Although they had been undervalued in light of
uncertain outlook for the global economy, stock prices rallied on expectations for earnings recovery. On the other hand,
negative contributors included domestic demand related stocks, which we newly purchased in the latter half of the period,
such as Aiful (8515 JP) and Japan Tobacco (2914 JP).
Equity Market Review
MUFG Japan Equity Small Cap Fund
The Russell/Nomura Small-cap Index rose 17.02%, while the large-cap TOPIX Index rose 14.69% in Japanese yen over
the twelve months ended 31st March 2017.
Japanese stocks were largely driven by the strong yen from April to June. The dollar/yen moved from 112 to 106 yen in
April when the Bank of Japan did not implement further easing as the market had hoped. The yen appreciated further to
below 100 yen at one point on a flight to safety with the UK's vote to leave the EU in June. Small caps declined by a
smaller margin as they tend to be more domestic demand oriented and less sensitive to the exchange rate.
The market rebounded in July mainly due to Japan’s ruling party’s strong victory in the Upper House election and the BOJ's
decision to double its purchase of exchange traded funds (ETFs), while market sentiment was changeable with shifting
expectations for Fed and BOJ policy in August and September.
The Japanese stocks rallied from October to December, and were largely driven by a rotation from defensive quality into
value stocks and economic cyclicals. Improved market sentiment backed by solid US macro indicators, rising oil prices,
and a weaker yen supported the markets in October. The yen dropped further in November due to the surprising outcome
of the US presidential election, which improved market sentiment especially in global demand related sectors, real estate
and banks. The market rally was led by large cap bellwethers. In particular, companies with robust earnings growth but
without earnings surprises tend to face profit-taking, while valued stocks with weak earnings gained sharply as share prices
of such stocks were expected to have bottomed out.
The market continued to gain for the fourth quarter. The trend reversals eased gradually, and the small-caps rallied on
President Trump’s promise of a “phenomenal” tax announcement, while large-cap stocks were weighed down by a stronger
yen.

MUFG Global Fund SICAV
10
MANAGER’S REPORT (continued) Performance Review
MUFG Japan Equity Small Cap Fund
MUFG Japan Equity Small Cap Fund outperformed the Russell/Nomura Small-cap Index by 9.2% (in JPY, JPY I class) over
the twelve-month period.
The Fund struggled during the second and third quarter. The trend reversals in sector and size were negative for our
strategy with a tilt to quality defensive stocks, and our domestic demand driven names contributed negatively despite solid
earnings growth. However, the Fund increased weightings in banks and high beta names related to global demand driven
stocks, for example in semiconductor and automotive sectors, while it decreased quality defensive stocks by locking in
profits in names that have become expensive in services sector.
The Fund outperformed during the fourth quarter. In addition to strong earnings results, the trend reversals have gradually
eased since late-December, and some of our quality defensive holdings recovered.
The top stock contributors was M&A Capital Partners (6080 JP), an advisory firm in M&A due diligence/corporate
regeneration to support owners of small and medium companies with business succession. The share price gained
significantly as the company continued to announce strong earnings results on the back of Japan’s demographics with a
rapidly aging society. The second was MCJ (6670), a manufacturer and provider of personal computers and related
products. Strong orders in high-end computers continued due to strong demand from professionals such as graphics/game
creators.
Luxembourg, June 30, 2017
The figures stated in this report are historical and not necessarily indicative of future performance.

MUFG Global Fund SICAV
11
RISK DISCLOSURE
The Management Company uses a Risk Management Process for the Company in accordance with the Law of
December 17, 2010 as amended and other applicable regulations, in particular CSSF Circular 11/512. This Risk
Management Process provides for the measurement and control of the overall risk of all funds using the commitment
approach.
PricewaterhouseCoopers, Société coopérative, 2 rue Gerhard Mercator, B.P. 1443, L-1014 Luxembourg T: +352 494848 1, F:+352 494848 2900, www.pwc.lu
Cabinet de révision agréé. Expert-comptable (autorisation gouvernementale n°10028256) R.C.S. Luxembourg B 65 477 - TVA LU25482518
12
Audit report
AUDIT REPORT
To the Shareholders of MUFG Global Fund SICAV
We have audited the accompanying financial statements of MUFG Global Fund SICAV and of each of its sub-funds, which comprise the statement of net assets and the statement of investments and other net assets as at March 31, 2017 and the statement of operations and changes in net assets for the year then ended, and a summary of significant accounting policies and other explanatory notes to the financial statements. Responsibility of the Board of Directors of the SICAV for the financial statements The Board of Directors of the SICAV is responsible for the preparation and fair presentation of these financial statements in accordance with Luxembourg legal and regulatory requirements relating to the preparation of the financial statements and for such internal control as the Board of Directors of the SICAV determines is necessary to enable the preparation of financial statements that are free from material misstatement, whether due to fraud or error. Responsibility of the “Réviseur d’entreprises agréé” Our responsibility is to express an opinion on these financial statements based on our audit. We conducted our audit in accordance with International Standards on Auditing as adopted for Luxembourg by the “Commission de Surveillance du Secteur Financier”. Those standards require that we comply with ethical requirements and plan and perform the audit to obtain reasonable assurance about whether the financial statements are free from material misstatement. An audit involves performing procedures to obtain audit evidence about the amounts and disclosures in the financial statements. The procedures selected depend on the judgment of the “Réviseur d’entreprises agréé”, including the assessment of the risks of material misstatement of the financial statements, whether due to fraud or error. In making those risk assessments, the “Réviseur d’entreprises agréé” considers internal control relevant to the entity’s preparation and fair presentation of the financial statements in order to design audit procedures that are appropriate in the circumstances, but not for the purpose of expressing an opinion on the effectiveness of the entity’s internal control. An audit also includes evaluating the appropriateness of accounting policies used and the reasonableness of accounting estimates made by the Board of Directors of the SICAV, as well as evaluating the overall presentation of the financial statements. We believe that the audit evidence we have obtained is sufficient and appropriate to provide a basis for our audit opinion.

pwc
Opinion
In our opinion, the financial statements grve a true and fair view of the financial position ofMUFG Global Fund SICAV and of each of its sub-funds as of March Jr,2or7,and of the results of theiroperations and changes in their net assets for the year then ended in accordance with Luxembourglegal and regulatory requirements relating to the preparation of the financial statements.
Other information
The Board of Directors of the SICAV is responsible for the other information. The other informationcomprises the information included in the annual report but does not include the financial statementsand our audit report thereon.
Our opinion on the financial statements does not cover the other information and we do not expressany form of assurance conclusion thereon.
In connection with our audit of the financial statements, our responsibility is to read the otherinformation and, in doing so, consider whether the other information is materially inconsistent withthe financial statements or our knowledge obtained in the audit or otherwise appears to be materiallymisstated. If, based on the work we have performed, we conclude that there is a material misstatementof this other information, we are required to report this fact. We have nothing to report in this regard.
PricewaterhouseCoopers, Soci6t6 coop6rative Luxembourg, June go, 2olz
13

MUFG Global Fund SICAV
The accompanying notes form an integral part of these financial statements.
14
STATEMENT OF NET ASSETS AS AT MARCH 31, 2017
ASSETS MUFG Asia Pacific ex
Japan Equity High Growth Fund
MUFG Asia Pacific ex Japan Equity Income
Growth Fund
MUFG Asia Pacific ex Japan Equity Stable
Growth Fund
ASSETS USD USD USD
ASSETS
Investments in securities at cost value (note 2) 3,191,036.51 1,629,393.20 95,121,192.93
Unrealized appreciation/(depreciation) 139,952.49 137,915.43 12,133,984.03
Investments in securities at market value (note 2) 3,330,989.00 1,767,308.63 107,255,176.96
Cash at banks (note 2) 102,118.26 36,756.94 1,859,397.82
Dividends receivable (note 2) 3,806.43 2,381.86 277,679.56
Interest receivable (note 2) 34.21 24.29 474.72
Other assets 17,714.24 18,528.03 10,184.23
Receivable on investments sold - - 860,078.49
Total Assets 3,454,662.14 1,824,999.75 110,262,991.78
LIABILITIES
Accrued expenses (note 3) (12,876.39) (12,223.99) (106,547.48)
Payable on investments purchased - - -
Other payables (85.26) (24.00) (2,217.81)
Total Liabilities (12,961.65) (12,247.99) (108,765.29)
TOTAL NET ASSETS 3,441,700.49 1,812,751.76 110,154,226.49
SHARES OUTSTANDING
Class JPY B 33,298.75981 18,035.49811 510,266.24400
Class JPY B 2* - - 312,283.05920
Class JPY I - - -
Class USD I - - 152,306.52390
NET ASSET VALUE PER SHARE
Class JPY B (expressed in JPY) 11,517 11,200 13,082
Class JPY B 2* (expressed in JPY) - - 11,519
Class JPY I (expressed in JPY) - - -
Class USD I (expressed in USD) - - 117.964200
*Launched on May 9, 2016

MUFG Global Fund SICAV
The accompanying notes form an integral part of these financial statements.
15
STATEMENT OF NET ASSETS AS AT MARCH 31, 2017 (continued)
ASSETS MUFG Japan Equity
Strategic Value Fund MUFG Japan Equity
Small Cap Fund Combined
ASSETS JPY JPY EUR
ASSETS
Investments in securities at cost value (note 2) 284,363,781 745,308,265 102,082,325.00
Unrealized appreciation/(depreciation) 13,601,869 175,582,635 13,192,127.37
Investments in securities at market value (note 2) 297,965,650 920,890,900 115,274,452.37
Cash at banks (note 2) 8,292,838 15,770,736 2,070,240.20
Dividends receivable (note 2) 2,325,686 6,181,416 336,788.98
Interest receivable (note 2) - - 498.55
Other assets 1,683,511 210,043 59,295.70
Receivable on investments sold - 203,378 805,856.34
Total Assets 310,267,685 943,256,473 118,547,132.14
hidden
LIABILITIES
Accrued expenses (note 3) (2,674,337) (3,060,792) (171,208.74)
Payable on investments purchased - (1,299,726) (10,905.58)
Other payables - - (2,175.74)
Total Liabilities (2,674,337) (4,360,518) (184,290.06)
TOTAL NET ASSETS 307,593,348 938,895,955 118,362,842.08
SHARES OUTSTANDING
Class JPY B - -
Class JPY B 2 - -
Class JPY I 30,000.00000 30,000.00000
Class USD I - 33,355.06730
NET ASSET VALUE PER SHARE
Class JPY B (expressed in JPY) - -
Class JPY B 2 (expressed in JPY) - -
Class JPY I (expressed in JPY) 10,253 13,302
Class USD I (expressed in USD) - 145.242300

MUFG Global Fund SICAV
The accompanying notes form an integral part of these financial statements.
16
STATEMENT OF OPERATIONS AND CHANGES IN NET ASSETS FOR THE YEAR ENDED MARCH 31, 2017
ASSETS MUFG Asia Pacific ex
Japan Equity High Growth Fund
MUFG Asia Pacific ex Japan Equity Income
Growth Fund
MUFG Asia Pacific ex Japan Equity Stable
Growth Fund
USD USD USD
NET ASSETS AT THE BEGINNING OF THE YEAR 6,211,198.68 2,924,077.20 88,722,848.51
INCOME
Dividends, net (note 2) 93,407.86 73,414.53 2,211,764.31
Interest on bank account (note 2) 157.74 147.09 1,732.48
Other income (note 14) 17,219.97 18,294.87 -
Total Income 110,785.57 91,856.49 2,213,496.79
EXPENSES
Administration and Transfer Agent fees (note 6) (2,946.26) (1,606.93) (71,955.89)
Custodian fees (note 7) (842.64) (459.13) (20,559.01)
Facilities Agent fees (note 8) (234.79) (234.79) (234.79)
Investment Management fees (note 4) - - (219,850.12)
Management Company fees (note 9) (842.64) (459.13) (20,562.63)
Other expenses (note 15) (6,598.09) (6,403.89) (12,969.37)
Other taxes (7,398.57) (658.24) (123,823.95)
Professional fees (13,751.50) (13,013.13) (13,751.50)
Sub-custodian fees (15,812.04) (13,309.84) (59,462.35)
"Taxe d'abonnement" (note 5) (405.91) (227.02) (10,732.83)
Total Expenses (48,832.44) (36,372.10) (553,902.44)
NET INVESTMENT INCOME/(LOSS) 61,953.13 55,484.39 1,659,594.35
Net realized gain/(loss) on investments (note 2) 46,972.86 36,056.03 2,331,938.02
Net realized gain/(loss) on currencies and forward foreign
exchange contracts (note 2) (153,448.13) (71,047.45) (2,174,045.17)
NET REALIZED GAIN/(LOSS) FOR THE YEAR (106,475.27) (34,991.42) 157,892.85
Change in net unrealized appreciation/depreciation:
- on investments 521,276.69 267,263.11 9,381,817.96
- on forward foreign exchange contracts (note 2) (0.06) (0.06) (0.06)
- on foreign exchange translation of other assets and liabilities
(note 2) (713.20) (1,136.33) (5,322.67)
520,563.43 266,126.72 9,376,495.23
INCREASE/(DECREASE) IN NET ASSETS AS A RESULT OF OPERATIONS
476,041.29 286,619.69 11,193,982.43
Subscriptions - - 72,829,124.23
Redemptions (3,245,539.48) (1,397,945.13) (62,149,575.30)
Dividends (note 13) - - (442,153.38)
(3,245,539.48) (1,397,945.13) 10,237,395.55
NET ASSETS AT THE END OF THE YEAR 3,441,700.49 1,812,751.76 110,154,226.49
MUFG Global Fund SICAV
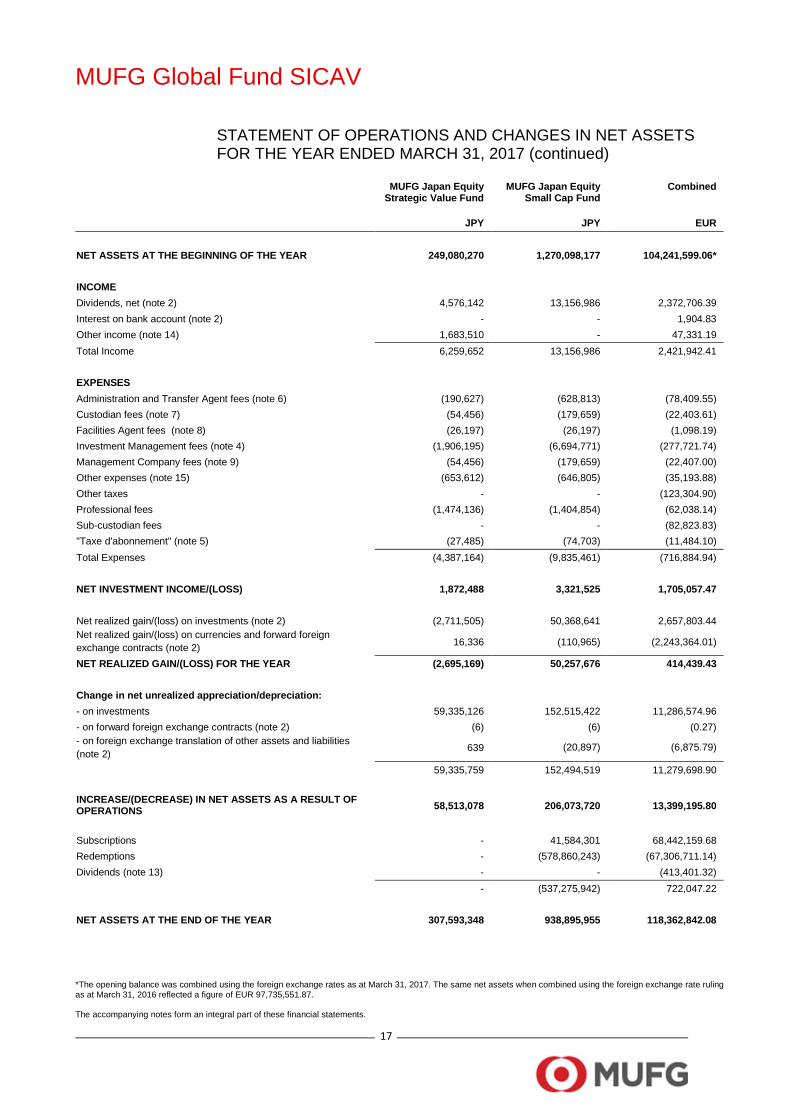
*The opening balance was combined using the foreign exchange rates as at March 31, 2017. The same net assets when combined using the foreign exchange rate ruling as at March 31, 2016 reflected a figure of EUR 97,735,551.87. The accompanying notes form an integral part of these financial statements.
17
STATEMENT OF OPERATIONS AND CHANGES IN NET ASSETS FOR THE YEAR ENDED MARCH 31, 2017 (continued)
MUFG Asia Pacific ex Japan Equity High Growth Fund
ASSETS MUFG Japan Equity
Strategic Value Fund
MUFG Japan Equity Small Cap Fund
Combined
JPY JPY EUR
NET ASSETS AT THE BEGINNING OF THE YEAR 249,080,270 1,270,098,177 104,241,599.06*
INCOME
Dividends, net (note 2) 4,576,142 13,156,986 2,372,706.39
Interest on bank account (note 2) - - 1,904.83
Other income (note 14) 1,683,510 - 47,331.19
Total Income 6,259,652 13,156,986 2,421,942.41
EXPENSES
Administration and Transfer Agent fees (note 6) (190,627) (628,813) (78,409.55)
Custodian fees (note 7) (54,456) (179,659) (22,403.61)
Facilities Agent fees (note 8) (26,197) (26,197) (1,098.19)
Investment Management fees (note 4) (1,906,195) (6,694,771) (277,721.74)
Management Company fees (note 9) (54,456) (179,659) (22,407.00)
Other expenses (note 15) (653,612) (646,805) (35,193.88)
Other taxes - - (123,304.90)
Professional fees (1,474,136) (1,404,854) (62,038.14)
Sub-custodian fees - - (82,823.83)
"Taxe d'abonnement" (note 5) (27,485) (74,703) (11,484.10)
Total Expenses (4,387,164) (9,835,461) (716,884.94)
NET INVESTMENT INCOME/(LOSS) 1,872,488 3,321,525 1,705,057.47
Net realized gain/(loss) on investments (note 2) (2,711,505) 50,368,641 2,657,803.44
Net realized gain/(loss) on currencies and forward foreign
exchange contracts (note 2) 16,336 (110,965) (2,243,364.01)
NET REALIZED GAIN/(LOSS) FOR THE YEAR (2,695,169) 50,257,676 414,439.43
Change in net unrealized appreciation/depreciation:
- on investments 59,335,126 152,515,422 11,286,574.96
- on forward foreign exchange contracts (note 2) (6) (6) (0.27)
- on foreign exchange translation of other assets and liabilities
(note 2) 639 (20,897) (6,875.79)
59,335,759 152,494,519 11,279,698.90
INCREASE/(DECREASE) IN NET ASSETS AS A RESULT OF OPERATIONS
58,513,078 206,073,720 13,399,195.80
Subscriptions - 41,584,301 68,442,159.68
Redemptions - (578,860,243) (67,306,711.14)
Dividends (note 13) - - (413,401.32)
- (537,275,942) 722,047.22
NET ASSETS AT THE END OF THE YEAR 307,593,348 938,895,955 118,362,842.08
MUFG Global Fund SICAV MUFG Asia Pacific ex Japan Equity High Growth Fund
The accompanying notes form an integral part of these financial statements.
18
Statement of investments and other net assets
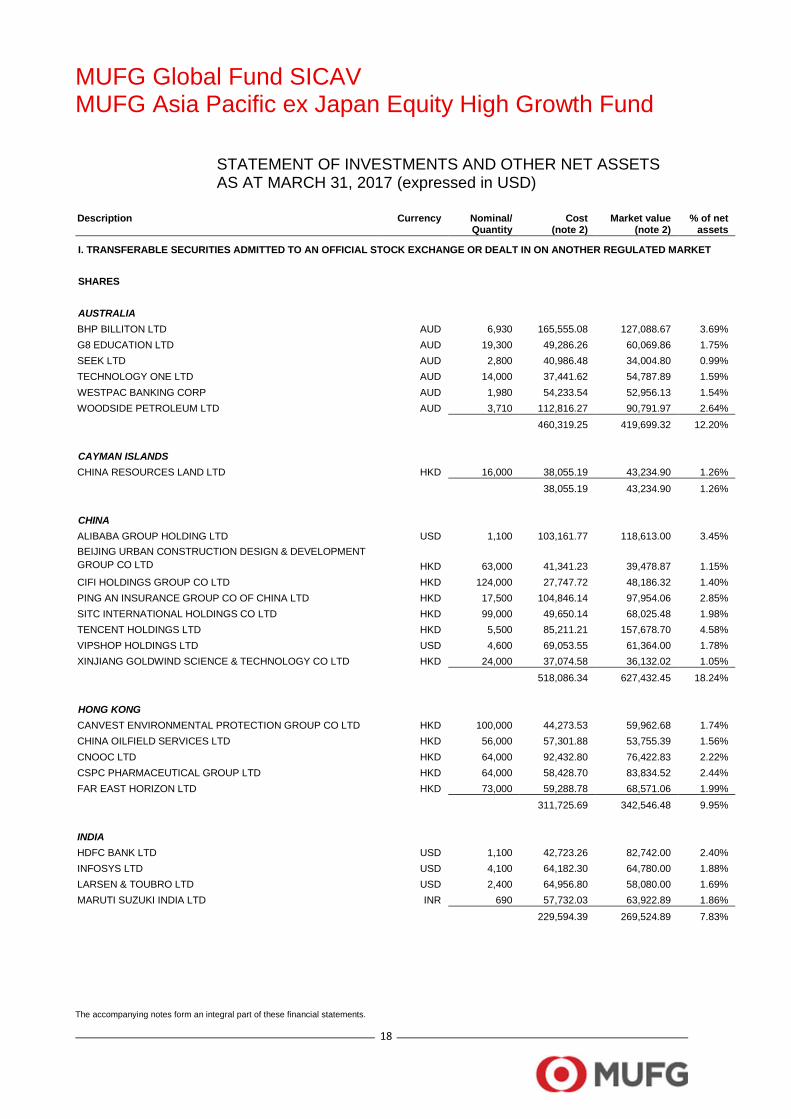
STATEMENT OF INVESTMENTS AND OTHER NET ASSETS AS AT MARCH 31, 2017 (expressed in USD)
Description Currency Nominal/ Quantity
Cost (note 2)
Market value (note 2)
% of net assets
I. TRANSFERABLE SECURITIES ADMITTED TO AN OFFICIAL STOCK EXCHANGE OR DEALT IN ON ANOTHER REGULATED MARKET
SHARES
AUSTRALIA BHP BILLITON LTD AUD 6,930 165,555.08 127,088.67 3.69%
G8 EDUCATION LTD AUD 19,300 49,286.26 60,069.86 1.75%
SEEK LTD AUD 2,800 40,986.48 34,004.80 0.99%
TECHNOLOGY ONE LTD AUD 14,000 37,441.62 54,787.89 1.59%
WESTPAC BANKING CORP AUD 1,980 54,233.54 52,956.13 1.54%
WOODSIDE PETROLEUM LTD AUD 3,710 112,816.27 90,791.97 2.64%
460,319.25 419,699.32 12.20%
CAYMAN ISLANDS CHINA RESOURCES LAND LTD HKD 16,000 38,055.19 43,234.90 1.26%
38,055.19 43,234.90 1.26%
CHINA ALIBABA GROUP HOLDING LTD USD 1,100 103,161.77 118,613.00 3.45%
BEIJING URBAN CONSTRUCTION DESIGN & DEVELOPMENT
GROUP CO LTD HKD 63,000 41,341.23 39,478.87 1.15%
CIFI HOLDINGS GROUP CO LTD HKD 124,000 27,747.72 48,186.32 1.40%
PING AN INSURANCE GROUP CO OF CHINA LTD HKD 17,500 104,846.14 97,954.06 2.85%
SITC INTERNATIONAL HOLDINGS CO LTD HKD 99,000 49,650.14 68,025.48 1.98%
TENCENT HOLDINGS LTD HKD 5,500 85,211.21 157,678.70 4.58%
VIPSHOP HOLDINGS LTD USD 4,600 69,053.55 61,364.00 1.78%
XINJIANG GOLDWIND SCIENCE & TECHNOLOGY CO LTD HKD 24,000 37,074.58 36,132.02 1.05%
518,086.34 627,432.45 18.24%
HONG KONG
CANVEST ENVIRONMENTAL PROTECTION GROUP CO LTD HKD 100,000 44,273.53 59,962.68 1.74%
CHINA OILFIELD SERVICES LTD HKD 56,000 57,301.88 53,755.39 1.56%
CNOOC LTD HKD 64,000 92,432.80 76,422.83 2.22%
CSPC PHARMACEUTICAL GROUP LTD HKD 64,000 58,428.70 83,834.52 2.44%
FAR EAST HORIZON LTD HKD 73,000 59,288.78 68,571.06 1.99%
311,725.69 342,546.48 9.95%
INDIA
HDFC BANK LTD USD 1,100 42,723.26 82,742.00 2.40%
INFOSYS LTD USD 4,100 64,182.30 64,780.00 1.88%
LARSEN & TOUBRO LTD USD 2,400 64,956.80 58,080.00 1.69%
MARUTI SUZUKI INDIA LTD INR 690 57,732.03 63,922.89 1.86%
229,594.39 269,524.89 7.83%

MUFG Global Fund SICAV MUFG Asia Pacific ex Japan Equity High Growth Fund
The accompanying notes form an integral part of these financial statements.
19
STATEMENT OF INVESTMENTS AND OTHER NET ASSETS AS AT MARCH 31, 2017 (expressed in USD) (continued)
Description Currency Nominal/ Quantity
Cost (note 2)
Market value (note 2)
% of net assets
I. TRANSFERABLE SECURITIES ADMITTED TO AN OFFICIAL STOCK EXCHANGE OR DEALT IN ON ANOTHER REGULATED MARKET (continued)
SHARES (continued)
INDONESIA
BUMI SERPONG DAMAI TBK PT IDR 337,000 41,873.71 47,671.38 1.38%
MITRA ADIPERKASA TBK PT IDR 131,000 48,459.33 58,738.88 1.71%
WASKITA KARYA PERSERO TBK PT IDR 236,000 30,438.97 41,973.66 1.22%
120,772.01 148,383.92 4.31%
MALAYSIA GLOBETRONICS TECHNOLOGY BHD MYR 39,000 36,000.72 45,472.83 1.32%
INARI AMERTRON BHD MYR 96,000 38,230.44 44,252.63 1.29%
74,231.16 89,725.46 2.61%
PHILIPPINES CONCEPCION INDUSTRIAL CORP PHP 37,300 31,860.52 46,462.38 1.35%
FILINVEST LAND INC PHP 1,700,000 72,736.75 55,565.52 1.61%
MEGAWORLD CORP PHP 430,000 43,031.40 28,966.62 0.84%
147,628.67 130,994.52 3.80%
SINGAPORE OVERSEA-CHINESE BANKING CORP LTD SGD 9,300 65,890.49 64,693.34 1.88%
SEMBCORP INDUSTRIES LTD SGD 31,200 69,385.16 71,005.51 2.06%
135,275.65 135,698.85 3.94%
SOUTH KOREA COSMAX INC KRW 390 48,255.11 47,429.13 1.38%
HANSSEM CO LTD KRW 220 38,643.15 43,279.98 1.26%
HS INDUSTRIES CO LTD KRW 5,100 46,406.45 49,937.40 1.45%
HYUNDAI HEAVY INDUSTRIES CO LTD KRW 521 69,938.54 76,871.14 2.23%
JUSUNG ENGINEERING CO LTD KRW 3,800 35,944.79 33,028.70 0.96%
LOTTE CHEMICAL CORP KRW 125 41,831.66 41,413.31 1.20%
NCSOFT CORP KRW 150 39,269.33 40,910.31 1.19%
SK HYNIX INC KRW 1,970 80,933.48 88,960.92 2.58%
SK MATERIALS CO LTD KRW 210 34,145.35 30,515.07 0.89%
TOKAI CARBON KOREA CO LTD KRW 1,740 53,673.15 50,412.23 1.46%
VIEWORKS CO LTD KRW 540 32,540.00 31,145.49 0.90%
521,581.01 533,903.68 15.50%
TAIWAN
CATHAY FINANCIAL HOLDING CO LTD TWD 45,000 65,478.59 72,225.43 2.10%
ENNOCONN CORP TWD 3,000 47,714.97 39,202.44 1.14%
GETAC TECHNOLOGY CORP TWD 16,000 22,995.77 22,990.85 0.67%
LAND MARK OPTOELECTRONICS CORP TWD 3,500 41,904.42 34,085.85 0.99%
SILERGY CORP TWD 4,000 39,220.76 73,823.84 2.14%

MUFG Global Fund SICAV MUFG Asia Pacific ex Japan Equity High Growth Fund
* Fair valued
The accompanying notes form an integral part of these financial statements.
20
STATEMENT OF INVESTMENTS AND OTHER NET ASSETS AS AT MARCH 31, 2017 (expressed in USD) (continued)
Description Currency Nominal/ Quantity
Cost (note 2)
Market value (note 2)
% of net assets
I. TRANSFERABLE SECURITIES ADMITTED TO AN OFFICIAL STOCK EXCHANGE OR DEALT IN ON ANOTHER REGULATED MARKET (continued)
SHARES (continued)
TAIWAN (continued)
TAIWAN SEMICONDUCTOR MANUFACTURING CO LTD USD 5,200 95,532.06 170,768.00 4.96%
TTFB CO LTD TWD 7,000 49,966.34 54,791.13 1.59%
362,812.91 467,887.54 13.59%
THAILAND CHULARAT HOSPITAL PCL THB 576,000 28,170.42 41,906.15 1.22%
SIAM COMMERCIAL BANK PCL/THE THB 8,000 38,071.22 37,948.34 1.10%
SRISAWAD POWER 1979 PCL THB 32,700 40,820.00 41,157.51 1.20%
107,061.64 121,012.00 3.52%
TOTAL I. 3,027,143.91 3,330,044.01 96.75%
II. OTHER TRANSFERABLE SECURITIES AND MONEY MARKET INSTRUMENT
SHARES
HONG KONG
CHINA LUMENA NEW MATERIALS CORP (in liquidation)* HKD 918,000 163,892.60 944.99 0.03%
163,892.60 944.99 0.03%
TOTAL II. 163,892.60 944.99 0.03%
TOTAL INVESTMENTS IN SECURITIES
3,191,036.51 3,330,989.00 96.78%
CASH AT BANKS 102,118.26 2.97%
OTHER NET ASSETS/(LIABILITIES) 8,593.23 0.25%
TOTAL NET ASSETS 3,441,700.49 100.00%

MUFG Global Fund SICAV MUFG Asia Pacific ex Japan Equity High Growth Fund
21
Geographical cl assification of investments
GEOGRAPHICAL CLASSIFICATION OF INVESTMENTS
AS AT MARCH 31, 2017
(in % of net assets)
CHINA 18.24%
SOUTH KOREA 15.50%
TAIWAN 13.59%
AUSTRALIA 12.20%
HONG KONG 9.98%
INDIA 7.83%
INDONESIA 4.31%
SINGAPORE 3.94%
PHILIPPINES 3.80%
THAILAND 3.52%
MALAYSIA 2.61%
CAYMAN ISLANDS 1.26%
96.78%

MUFG Global Fund SICAV MUFG Asia Pacific ex Japan Equity Income Growth Fund
The accompanying notes form an integral part of these financial statements.
22
MUFG Asia Pacific ex Japan Equity Income Growth Fund
Statement of investments and other net assets
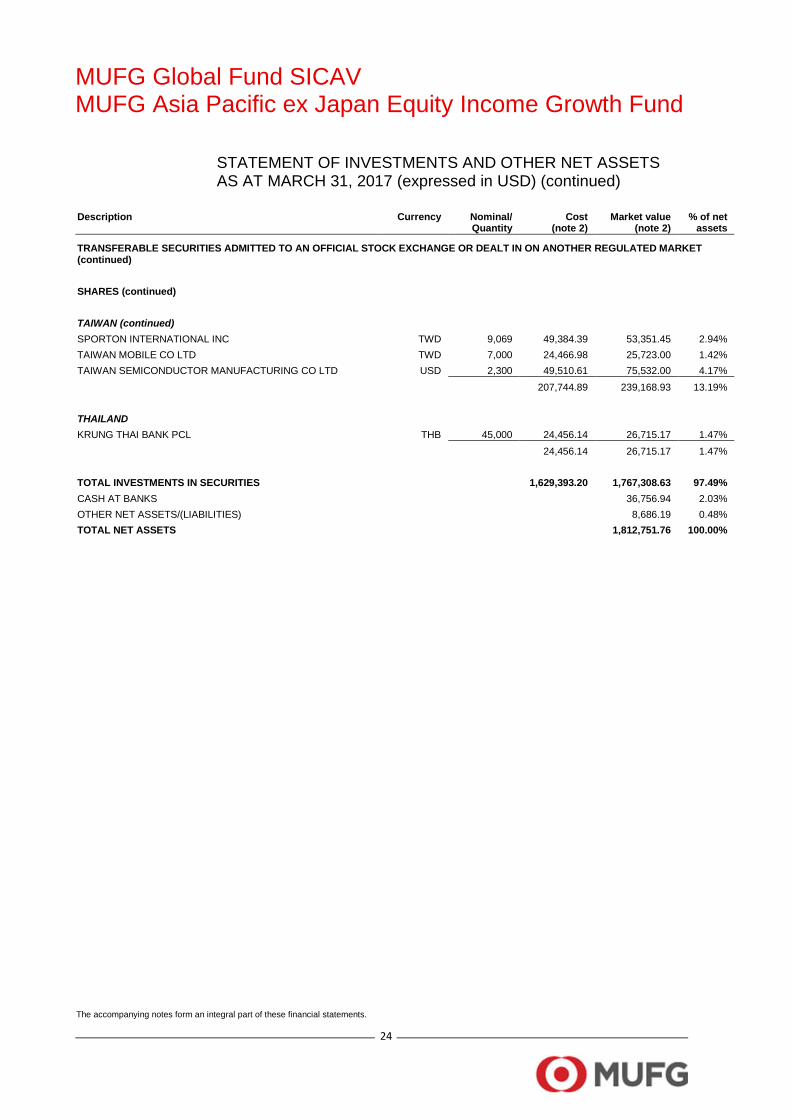
STATEMENT OF INVESTMENTS AND OTHER NET ASSETS AS AT MARCH 31, 2017 (expressed in USD)
Description Currency Nominal/ Quantity
Cost (note 2)
Market value (note 2)
% of net assets
TRANSFERABLE SECURITIES ADMITTED TO AN OFFICIAL STOCK EXCHANGE OR DEALT IN ON ANOTHER REGULATED MARKET
SHARES
AUSTRALIA AMCOR LTD/AUSTRALIA AUD 1,560 15,000.50 17,922.09 0.99%
APA GROUP AUD 3,250 19,177.80 22,214.19 1.24%
BHP BILLITON LTD AUD 2,100 57,234.85 38,511.72 2.12%
G8 EDUCATION LTD AUD 7,700 19,469.44 23,965.70 1.32%
GUD HOLDINGS LTD AUD 1,950 14,473.58 17,612.68 0.97%
MACQUARIE GROUP LTD AUD 740 41,442.72 50,918.71 2.81%
RETAIL FOOD GROUP LTD AUD 2,980 12,259.38 12,116.65 0.67%
RIO TINTO LTD AUD 350 17,131.43 16,142.67 0.89%
SERVCORP LTD AUD 2,500 11,265.96 11,728.82 0.65%
TRANSURBAN GROUP AUD 3,200 20,545.80 28,487.87 1.57%
WESTPAC BANKING CORP AUD 5,100 145,698.54 136,402.16 7.52%
WOODSIDE PETROLEUM LTD AUD 1,670 52,385.77 40,868.62 2.25%
426,085.77 416,891.88 23.00%
CHINA BANK OF CHINA LTD HKD 108,000 61,414.32 53,642.15 2.97%
INDUSTRIAL & COMMERCIAL BANK OF CHINA LTD HKD 129,000 79,525.30 84,323.49 4.65%
PING AN INSURANCE GROUP CO OF CHINA LTD HKD 9,500 50,927.28 53,175.06 2.93%
TENCENT HOLDINGS LTD HKD 4,100 70,486.62 117,542.30 6.48%
262,353.52 308,683.00 17.03%
HONG KONG AIA GROUP LTD HKD 5,000 26,981.20 31,525.45 1.74%
BOC HONG KONG HOLDINGS LTD HKD 7,000 21,628.17 28,598.08 1.58%
CHINA MOBILE LTD HKD 3,000 31,120.84 32,831.50 1.81%
CHINA PETROLEUM & CHEMICAL CORP HKD 38,000 29,231.27 30,804.86 1.70%
CK HUTCHISON HOLDINGS LTD HKD 2,000 23,816.04 24,602.72 1.36%
SINO LAND CO LTD HKD 14,000 22,981.23 24,535.80 1.35%
155,758.75 172,898.41 9.54%
INDIA
EMAMI LTD INR 1,010 15,145.40 16,554.92 0.91%
HDFC BANK LTD USD 400 20,579.90 30,088.00 1.66%
35,725.30 46,642.92 2.57%
INDONESIA
HANJAYA MANDALA SAMPOERNA TBK PT IDR 126,000 36,923.60 36,876.67 2.03%
36,923.60 36,876.67 2.03%

MUFG Global Fund SICAV MUFG Asia Pacific ex Japan Equity Income Growth Fund
The accompanying notes form an integral part of these financial statements.
23
STATEMENT OF INVESTMENTS AND OTHER NET ASSETS AS AT MARCH 31, 2017 (expressed in USD) (continued)
Description Currency Nominal/ Quantity
Cost (note 2)
Market value (note 2)
% of net assets
TRANSFERABLE SECURITIES ADMITTED TO AN OFFICIAL STOCK EXCHANGE OR DEALT IN ON ANOTHER REGULATED MARKET (continued)
SHARES (continued)
MACAO MGM CHINA HOLDINGS LTD HKD 6,000 9,363.28 12,507.24 0.69%
9,363.28 12,507.24 0.69%
MALAYSIA BERMAZ AUTO BHD MYR 22,600 13,201.93 10,213.54 0.57%
MALAYAN BANKING BHD MYR 13,100 36,138.28 26,404.25 1.46%
SYARIKAT TAKAFUL MALAYSIA BHD MYR 24,700 20,011.50 22,157.72 1.22%
VS INDUSTRY BHD MYR 79,000 27,602.41 30,882.39 1.70%
96,954.12 89,657.90 4.95%
NEW ZEALAND AUCKLAND INTERNATIONAL AIRPORT LTD NZD 5,300 26,180.17 25,045.56 1.38%
FISHER & PAYKEL HEALTHCARE CORP LTD NZD 3,400 20,248.16 23,054.67 1.27%
46,428.33 48,100.23 2.65%
SINGAPORE KEPPEL CORP LTD SGD 9,400 39,347.52 46,687.18 2.58%
OVERSEA-CHINESE BANKING CORP LTD SGD 5,000 37,384.79 34,781.36 1.92%
SINGAPORE O&G LTD SGD 19,800 9,697.59 18,562.94 1.02%
86,429.90 100,031.48 5.52%
SOUTH KOREA HYUNDAI MOBIS CO LTD KRW 65 14,849.75 13,978.81 0.77%
KOREA ELECTRIC POWER CORP KRW 470 18,717.39 19,522.04 1.08%
KUMHO PETROCHEMICAL CO LTD KRW 140 9,804.82 9,864.97 0.54%
LG CHEM LTD KRW 55 12,459.44 14,459.45 0.80%
SAMSUNG ELECTRONICS CO LTD USD 109 76,440.86 100,007.50 5.52%
SAMSUNG SDI CO LTD KRW 200 20,439.66 24,680.32 1.36%
SHINHAN FINANCIAL GROUP CO LTD USD 500 24,767.30 20,895.00 1.15%
SK HYNIX INC KRW 430 19,215.09 19,417.87 1.07%
SK INNOVATION CO LTD KRW 125 17,422.84 18,610.84 1.03%
SK TELECOM CO LTD USD 1,100 27,052.45 27,698.00 1.53%
241,169.60 269,134.80 14.85%
TAIWAN
BASSO INDUSTRY CORP TWD 9,000 24,962.33 27,347.78 1.51%
ELITE MATERIAL CO LTD TWD 2,000 5,297.27 7,777.87 0.43%
MACAUTO INDUSTRIAL CO LTD TWD 3,000 15,376.08 17,104.72 0.94%
MAKALOT INDUSTRIAL CO LTD TWD 4,426 25,079.46 18,160.57 1.00%
MEDIATEK INC TWD 2,000 13,667.77 14,171.54 0.78%
MUFG Global Fund SICAV MUFG Asia Pacific ex Japan Equity Income Growth Fund
The accompanying notes form an integral part of these financial statements.
24
STATEMENT OF INVESTMENTS AND OTHER NET ASSETS AS AT MARCH 31, 2017 (expressed in USD) (continued)
Description Currency Nominal/ Quantity
Cost (note 2)
Market value (note 2)
% of net assets
TRANSFERABLE SECURITIES ADMITTED TO AN OFFICIAL STOCK EXCHANGE OR DEALT IN ON ANOTHER REGULATED MARKET (continued)
SHARES (continued)
TAIWAN (continued) SPORTON INTERNATIONAL INC TWD 9,069 49,384.39 53,351.45 2.94%
TAIWAN MOBILE CO LTD TWD 7,000 24,466.98 25,723.00 1.42%
TAIWAN SEMICONDUCTOR MANUFACTURING CO LTD USD 2,300 49,510.61 75,532.00 4.17%
207,744.89 239,168.93 13.19%
THAILAND KRUNG THAI BANK PCL THB 45,000 24,456.14 26,715.17 1.47%
24,456.14 26,715.17 1.47%
TOTAL INVESTMENTS IN SECURITIES
1,629,393.20 1,767,308.63 97.49%
CASH AT BANKS
36,756.94 2.03%
OTHER NET ASSETS/(LIABILITIES)
8,686.19 0.48%
TOTAL NET ASSETS
1,812,751.76 100.00%

MUFG Global Fund SICAV MUFG Asia Pacific ex Japan Equity Income Growth Fund
25
Geographical cl assification of investments
GEOGRAPHICAL CLASSIFICATION OF INVESTMENTS AS AT MARCH 31, 2017
(in % of net assets)
AUSTRALIA 23.00%
CHINA 17.03%
SOUTH KOREA 14.85%
TAIWAN 13.19%
HONG KONG 9.54%
SINGAPORE 5.52%
MALAYSIA 4.95%
NEW ZEALAND 2.65%
INDIA 2.57%
INDONESIA 2.03%
THAILAND 1.47%
MACAO 0.69%
97.49%

MUFG Global Fund SICAV MUFG Asia Pacific ex Japan Equity Stable Growth Fund
The accompanying notes form an integral part of these financial statements.
26
MUFG Asia Pacific ex Japan Equity Stable Gr owth Fund
Statement of investments and other net assets
STATEMENT OF INVESTMENTS AND OTHER NET ASSETS AS AT MARCH 31, 2017 (expressed in USD)
Description Currency Nominal/ Quantity
Cost (note 2)
Market value (note 2)
% of net assets
TRANSFERABLE SECURITIES ADMITTED TO AN OFFICIAL STOCK EXCHANGE OR DEALT IN ON ANOTHER REGULATED MARKET
SHARES
AUSTRALIA APN OUTDOOR GROUP LTD AUD 190,000 877,108.58 826,166.55 0.75%
BHP BILLITON LTD AUD 108,290 2,592,920.15 1,985,921.00 1.80%
COMMONWEALTH BANK OF AUSTRALIA AUD 48,000 3,019,988.93 3,145,749.29 2.86%
CORPORATE TRAVEL MANAGEMENT LTD AUD 180,670 2,375,431.52 2,760,616.91 2.51%
HANSEN TECHNOLOGIES LTD AUD 330,000 968,079.58 863,469.92 0.78%
INVOCARE LTD AUD 107,360 1,073,908.07 1,158,060.00 1.05%
NANOSONICS LTD AUD 374,000 907,511.30 884,448.29 0.80%
RAMSAY HEALTH CARE LTD AUD 16,120 802,241.88 859,447.25 0.78%
SONIC HEALTHCARE LTD AUD 104,300 1,663,954.19 1,759,983.44 1.60%
WESTPAC BANKING CORP AUD 74,500 1,682,886.16 1,992,541.31 1.81%
15,964,030.36 16,236,403.96 14.74%
CAYMAN ISLANDS HAITIAN INTERNATIONAL HOLDINGS LTD HKD 1,231,000 2,329,194.45 2,863,858.97 2.60%
2,329,194.45 2,863,858.97 2.60%
CHINA ALIBABA GROUP HOLDING LTD USD 45,200 4,523,697.90 4,873,916.08 4.42%
INDUSTRIAL & COMMERCIAL BANK OF CHINA LTD HKD 3,299,000 1,981,436.39 2,156,458.86 1.96%
PING AN INSURANCE GROUP CO OF CHINA LTD HKD 328,000 1,823,872.61 1,835,939.01 1.67%
SITC INTERNATIONAL HOLDINGS CO LTD HKD 2,800,000 1,698,873.79 1,923,952.90 1.75%
TAL EDUCATION GROUP USD 25,700 1,086,375.34 2,738,848.99 2.49%
TENCENT HOLDINGS LTD HKD 237,100 4,543,139.81 6,797,385.32 6.17%
15,657,395.84 20,326,501.16 18.46%
HONG KONG AIA GROUP LTD HKD 465,200 2,652,160.25 2,933,127.45 2.65%
BOC HONG KONG HOLDINGS LTD HKD 410,000 1,658,101.69 1,675,030.56 1.52%
BRILLIANCE CHINA AUTOMOTIVE HOLDINGS LTD HKD 484,000 827,995.06 809,624.91 0.73%
CHINA OILFIELD SERVICES LTD HKD 1,100,000 1,078,583.85 1,055,909.41 0.96%
CSPC PHARMACEUTICAL GROUP LTD HKD 1,720,000 1,611,384.45 2,253,052.82 2.05%
DAIRY FARM INTERNATIONAL HOLDINGS LTD USD 128,000 1,014,246.46 1,162,240.00 1.06%
GUANGDONG INVESTMENT LTD HKD 594,000 799,547.80 846,878.98 0.77%
JARDINE MATHESON HOLDINGS LTD USD 14,900 874,363.60 957,325.00 0.87%
MTR CORP LTD HKD 190,000 880,236.66 1,067,168.50 0.97%
SANDS CHINA LTD HKD 506,000 2,266,437.92 2,343,949.04 2.13%
VITASOY INTERNATIONAL HOLDINGS LTD HKD 800,000 1,568,277.78 1,589,397.16 1.44%
15,231,335.52 16,693,703.83 15.15%

MUFG Global Fund SICAV MUFG Asia Pacific ex Japan Equity Stable Growth Fund
The accompanying notes form an integral part of these financial statements.
27
STATEMENT OF INVESTMENTS AND OTHER NET ASSETS AS AT MARCH 31, 2017 (expressed in USD) (continued)
Description Currency Nominal/ Quantity
Cost (note 2)
Market value (note 2)
% of net assets
TRANSFERABLE SECURITIES ADMITTED TO AN OFFICIAL STOCK EXCHANGE OR DEALT IN ON ANOTHER REGULATED MARKET (continued)
SHARES (continued)
INDIA
ASIAN PAINTS LTD INR 101,000 1,416,004.63 1,669,723.57 1.51%
HDFC BANK LTD USD 44,600 2,533,947.32 3,354,812.05 3.04%
LARSEN & TOUBRO LTD USD 49,000 1,183,710.14 1,185,800.04 1.08%
MARICO LTD INR 563,250 2,155,955.81 2,557,546.25 2.32%
MINDA INDUSTRIES LTD INR 130,000 839,654.80 889,689.68 0.81%
SHREE CEMENT LTD INR 4,000 1,002,600.06 1,052,326.12 0.96%
VAKRANGEE LTD INR 258,000 1,190,469.97 1,306,985.50 1.19%
10,322,342.73 12,016,883.21 10.91%
INDONESIA BANK CENTRAL ASIA TBK PT IDR 1,400,000 1,624,662.29 1,738,771.53 1.58%
UNILEVER INDONESIA TBK PT IDR 592,200 1,788,415.89 1,925,411.05 1.75%
WIJAYA KARYA PERSERO TBK PT IDR 6,180,000 1,207,182.88 1,117,691.64 1.01%
4,620,261.06 4,781,874.22 4.34%
MALAYSIA GLOBETRONICS TECHNOLOGY BHD MYR 1,000,000 987,840.15 1,165,969.95 1.06%
MY EG SERVICES BHD MYR 4,110,000 1,151,961.21 1,718,110.95 1.56%
2,139,801.36 2,884,080.90 2.62%
PHILIPPINES AYALA LAND INC PHP 2,722,700 2,037,083.77 1,793,427.70 1.63%
BANK OF THE PHILIPPINE ISLANDS PHP 567,420 1,168,238.03 1,144,452.50 1.04%
JOLLIBEE FOODS CORP PHP 167,520 776,004.71 659,396.11 0.60%
3,981,326.51 3,597,276.31 3.27%
SINGAPORE SEMBCORP INDUSTRIES LTD SGD 536,000 1,243,477.42 1,219,838.26 1.10%
VENTURE CORP LTD SGD 115,000 922,399.91 943,999.14 0.86%
2,165,877.33 2,163,837.40 1.96%
SOUTH KOREA OSSTEM IMPLANT CO LTD KRW 22,720 1,301,323.05 1,062,555.66 0.96%
SAMSUNG ELECTRONICS CO LTD USD 2,330 1,540,788.61 2,137,775.00 1.94%
SAMSUNG HEAVY INDUSTRIES CO LTD KRW 123,000 1,310,645.90 1,231,869.80 1.12%
4,152,757.56 4,432,200.46 4.02%

MUFG Global Fund SICAV MUFG Asia Pacific ex Japan Equity Stable Growth Fund
The accompanying notes form an integral part of these financial statements.
28
STATEMENT OF INVESTMENTS AND OTHER NET ASSETS AS AT MARCH 31, 2017 (expressed in USD) (continued)
Description Currency Nominal/ Quantity
Cost (note 2)
Market value (note 2)
% of net assets
TRANSFERABLE SECURITIES ADMITTED TO AN OFFICIAL STOCK EXCHANGE OR DEALT IN ON ANOTHER REGULATED MARKET (continued)
TAIWAN
ADVANTECH CO LTD TWD 297,000 2,235,233.62 2,486,215.70 2.26%
ASPEED TECHNOLOGY INC TWD 71,000 1,142,209.20 1,333,772.76 1.21%
CATHAY FINANCIAL HOLDING CO LTD TWD 700,000 1,078,100.27 1,123,506.63 1.02%
ELITE MATERIAL CO LTD TWD 296,000 934,282.02 1,151,124.66 1.05%
POYA INTERNATIONAL CO LTD TWD 166,290 1,882,644.17 1,956,514.13 1.78%
TAIWAN SEMICONDUCTOR MANUFACTURING CO LTD USD 152,100 3,559,299.93 4,994,964.02 4.53%
VOLTRONIC POWER TECHNOLOGY CORP TWD 91,101 1,370,490.62 1,215,981.05 1.10%
WT MICROELECTRONICS CO LTD TWD 830,000 1,224,111.40 1,213,166.35 1.10%
13,426,371.23 15,475,245.30 14.05%
THAILAND
BEAUTY COMMUNITY PCL THB 5,050,000 1,173,875.75 1,543,106.58 1.40%
CP ALL PCL THB 929,000 1,310,766.21 1,595,081.85 1.45%
FORTH SMART SERVICE PCL THB 780,000 432,704.46 415,394.69 0.38%
SRISAWAD POWER 1979 PCL THB 1,010,000 1,246,244.77 1,271,225.90 1.15%
4,163,591.19 4,824,809.02 4.38%
UNITED STATES OF AMERICA
NEXTEER AUTOMOTIVE GROUP LTD HKD 650,000 966,907.79 958,502.22 0.87%
966,907.79 958,502.22 0.87%
TOTAL INVESTMENTS IN SECURITIES 95,121,192.93 107,255,176.96 97.37%
CASH AT BANKS 1,859,397.82 1.69%
OTHER NET ASSETS/(LIABILITIES) 1,039,651.71 0.94%
TOTAL NET ASSETS 110,154,226.49 100.00%

MUFG Global Fund SICAV MUFG Asia Pacific ex Japan Equity Stable Growth Fund
29
GEOGRAPHICAL CLASSIFICATION OF INVESTMENTS AS AT MARCH 31, 2017
(in % of net assets)
CHINA 18.46%
HONG KONG 15.15%
AUSTRALIA 14.74%
TAIWAN 14.05%
INDIA 10.91%
THAILAND 4.38%
INDONESIA 4.34%
SOUTH KOREA 4.02%
PHILIPPINES 3.27%
MALAYSIA 2.62%
CAYMAN ISLANDS 2.60%
SINGAPORE 1.96%
UNITED STATES OF AMERICA 0.87%
97.37%

MUFG Global Fund SICAV MUFG Japan Equity Strategic Value Fund
The accompanying notes form an integral part of these financial statements.
30
MUFG Japan Eq uity Str ategic Value Fund
Statement of investments and other net assets
STATEMENT OF INVESTMENTS AND OTHER NET ASSETS AS AT MARCH 31, 2017 (expressed in JPY)
Description Currency Nominal/ Quantity
Cost (note 2)
Market value (note 2)
% of net assets
TRANSFERABLE SECURITIES ADMITTED TO AN OFFICIAL STOCK EXCHANGE OR DEALT IN ON ANOTHER REGULATED MARKET
SHARES
JAPAN AIFUL CORP JPY 26,400 8,437,048 8,632,800 2.81%
CITIZEN WATCH CO LTD JPY 12,700 10,404,657 9,067,800 2.95%
DAIDO METAL CO LTD JPY 5,800 6,773,211 5,672,400 1.84%
DISCO CORP JPY 500 4,724,913 8,465,000 2.75%
EBARA CORP JPY 2,900 7,851,566 10,541,500 3.43%
FP CORP JPY 1,800 7,943,266 9,324,000 3.03%
HITACHI METALS LTD JPY 6,500 11,998,139 10,153,000 3.30%
IRISO ELECTRONICS CO LTD JPY 1,400 10,595,418 9,996,000 3.25%
JAPAN TOBACCO INC JPY 2,000 7,492,505 7,236,000 2.35%
KOMATSU LTD JPY 3,500 8,439,711 10,155,250 3.30%
KURARAY CO LTD JPY 5,600 7,967,182 9,452,800 3.07%
MISUMI GROUP INC JPY 4,700 6,866,124 9,456,400 3.07%
MITSUBISHI ELECTRIC CORP JPY 5,900 8,602,200 9,422,300 3.06%
MIZUHO FINANCIAL GROUP INC JPY 42,600 9,442,448 8,690,400 2.83%
MURATA MANUFACTURING CO LTD JPY 600 7,855,531 9,501,000 3.09%
MUSASHI SEIMITSU INDUSTRY CO LTD JPY 3,500 8,998,937 9,961,000 3.24%
NGK INSULATORS LTD JPY 4,100 8,939,012 10,332,000 3.36%
NIDEC CORP JPY 900 7,104,600 9,535,500 3.10%
NIPPON SHOKUBAI CO LTD JPY 1,200 9,699,592 9,096,000 2.96%
OILES CORP JPY 4,200 9,983,400 8,618,400 2.80%
OMRON CORP JPY 2,000 10,010,439 9,770,000 3.18%
ORIX CORP JPY 5,200 9,053,200 8,567,000 2.79%
RAKUTEN INC JPY 8,500 15,006,165 9,477,500 3.08%
RELO GROUP INC JPY 6,000 6,650,561 11,076,000 3.60%
SHIMAMURA CO LTD JPY 600 7,302,848 8,826,000 2.87%
SMC CORP/JAPAN JPY 300 9,940,225 9,876,000 3.21%
SUMITOMO ELECTRIC INDUSTRIES LTD JPY 5,500 8,794,385 10,153,000 3.30%
SUMITOMO MITSUI FINANCIAL GROUP INC JPY 2,200 10,330,380 8,899,000 2.89%
TOPCON CORP JPY 4,800 7,304,667 9,561,600 3.11%
TOYOTA MOTOR CORP JPY 1,400 11,982,600 8,458,800 2.75%
WARABEYA NICHIYO HOLDINGS CO LTD JPY 4,000 8,728,643 10,328,000 3.36%
YAHOO JAPAN CORP JPY 18,800 9,140,208 9,663,200 3.14%
284,363,781 297,965,650 96.87%
TOTAL INVESTMENTS IN SECURITIES 284,363,781 297,965,650 96.87%
CASH AT BANKS 8,292,838 2.70%
OTHER NET ASSETS/(LIABILITIES) 1,334,860 0.43%
TOTAL NET ASSETS 307,593,348 100.00%

MUFG Global Fund SICAV MUFG Japan Equity Strategic Value Fund
31
Geographical cl assification of investments
GEOGRAPHICAL CLASSIFICATION OF INVESTMENTS AS AT MARCH 31, 2017
(in % of net assets)
JAPAN 96.87%
96.87%

MUFG Global Fund SICAV MUFG Japan Equity Small Cap Fund
The accompanying notes form an integral part of these financial statements.
32
MUFG Japan Eq uity Small Cap Fund
Statement of investments and other net assets
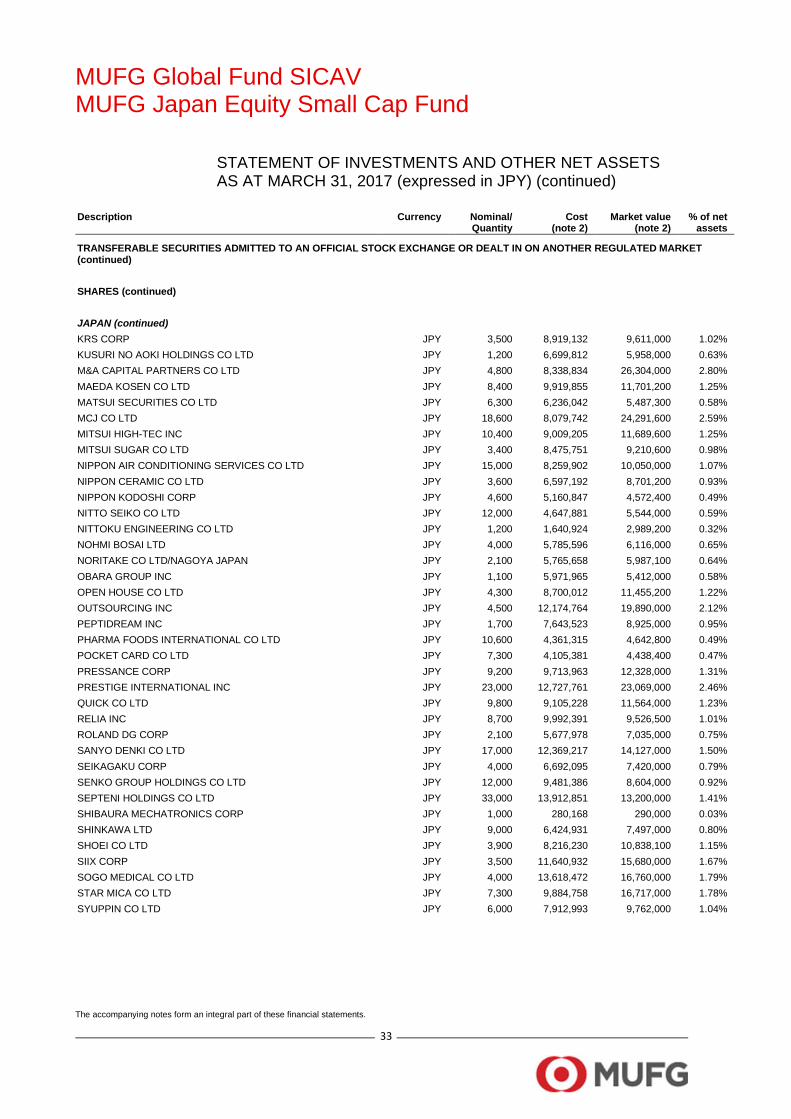
STATEMENT OF INVESTMENTS AND OTHER NET ASSETS AS AT MARCH 31, 2017 (expressed in JPY)
Description Currency Nominal/ Quantity
Cost (note 2)
Market value (note 2)
% of net assets
TRANSFERABLE SECURITIES ADMITTED TO AN OFFICIAL STOCK EXCHANGE OR DEALT IN ON ANOTHER REGULATED MARKET
SHARES
JAPAN 77 BANK LTD/THE JPY 26,000 12,076,731 12,532,000 1.32%
ADVENTURE INC JPY 500 4,080,446 5,070,000 0.54%
ANEST IWATA CORP JPY 16,000 14,551,943 16,224,000 1.73%
AOI ELECTRONICS CO LTD JPY 2,700 10,237,136 9,207,000 0.98%
CHUBU STEEL PLATE CO LTD JPY 4,300 2,709,311 2,790,700 0.30%
CI TAKIRON CORP JPY 9,000 4,662,396 5,211,000 0.56%
COMPUTER ENGINEERING & CONSULTING LTD JPY 6,000 9,053,724 12,810,000 1.36%
CREO CO LTD JPY 14,500 6,278,748 6,220,500 0.66%
CTS CO LTD JPY 7,600 5,324,689 5,206,000 0.55%
CYBERAGENT INC JPY 3,400 9,267,625 11,203,000 1.19%
DAI NIPPON TORYO CO LTD JPY 21,000 4,432,501 5,208,000 0.55%
DAIICHI JITSUGYO CO LTD JPY 11,000 6,183,551 7,667,000 0.82%
DAINICHI CO LTD JPY 4,200 3,130,534 2,994,600 0.32%
DIAMOND DINING CO LTD JPY 7,900 9,623,858 13,532,700 1.44%
EIKEN CHEMICAL CO LTD JPY 6,000 12,434,147 18,510,000 1.97%
EREX CO LTD JPY 9,300 4,723,537 12,210,900 1.30%
FUJI CORP LTD JPY 6,700 4,686,558 4,877,600 0.52%
FUJI KYUKO CO LTD JPY 11,000 12,636,937 10,857,000 1.16%
FUJIBO HOLDINGS INC JPY 3,400 8,242,355 10,455,000 1.11%
FUNAI SOKEN HOLDINGS INC JPY 6,600 9,951,249 12,995,400 1.38%
FUYO GENERAL LEASE CO LTD JPY 2,100 11,157,585 10,479,000 1.12%
GAKUJO CO LTD JPY 4,900 5,330,466 6,223,000 0.66%
GEOSTR CORP JPY 13,800 9,755,640 15,262,800 1.63%
GFOOT CO LTD JPY 10,700 9,579,268 7,971,500 0.85%
GUNMA BANK LTD/THE JPY 22,000 10,970,231 12,782,000 1.36%
HACHIJUNI BANK LTD/THE JPY 11,000 7,810,362 6,919,000 0.74%
HAKUDO CO LTD JPY 4,200 5,550,481 7,261,800 0.77%
HIKAKU.COM CORP JPY 8,600 9,509,257 9,098,800 0.97%
HIRAKAWA HEWTECH CORP JPY 7,100 5,624,846 8,882,100 0.95%
HONSHU CHEMICAL INDUSTRY CO LTD JPY 3,000 3,175,517 2,469,000 0.26%
IRISO ELECTRONICS CO LTD JPY 1,300 8,892,224 9,282,000 0.99%
JAC RECRUITMENT CO LTD JPY 2,300 2,347,129 4,176,800 0.44%
JAFCO CO LTD JPY 700 3,282,161 2,618,000 0.28%
JEOL LTD JPY 12,000 8,386,256 7,104,000 0.76%
JFE CONTAINER CO LTD JPY 13,000 5,487,827 5,460,000 0.58%
KAGA ELECTRONICS CO LTD JPY 4,900 8,592,892 9,682,400 1.03%
KANTO DENKA KOGYO CO LTD JPY 12,000 9,558,465 11,520,000 1.23%
KOIKE SANSO KOGYO CO LTD JPY 11,000 4,106,327 3,344,000 0.36%
KONOSHIMA CHEMICAL CO LTD JPY 4,100 3,752,575 8,245,100 0.88%
MUFG Global Fund SICAV MUFG Japan Equity Small Cap Fund
The accompanying notes form an integral part of these financial statements.
33
STATEMENT OF INVESTMENTS AND OTHER NET ASSETS AS AT MARCH 31, 2017 (expressed in JPY) (continued)
Description Currency Nominal/ Quantity
Cost (note 2)
Market value (note 2)
% of net assets
TRANSFERABLE SECURITIES ADMITTED TO AN OFFICIAL STOCK EXCHANGE OR DEALT IN ON ANOTHER REGULATED MARKET (continued)
SHARES (continued)
JAPAN (continued) KRS CORP JPY 3,500 8,919,132 9,611,000 1.02%
KUSURI NO AOKI HOLDINGS CO LTD JPY 1,200 6,699,812 5,958,000 0.63%
M&A CAPITAL PARTNERS CO LTD JPY 4,800 8,338,834 26,304,000 2.80%
MAEDA KOSEN CO LTD JPY 8,400 9,919,855 11,701,200 1.25%
MATSUI SECURITIES CO LTD JPY 6,300 6,236,042 5,487,300 0.58%
MCJ CO LTD JPY 18,600 8,079,742 24,291,600 2.59%
MITSUI HIGH-TEC INC JPY 10,400 9,009,205 11,689,600 1.25%
MITSUI SUGAR CO LTD JPY 3,400 8,475,751 9,210,600 0.98%
NIPPON AIR CONDITIONING SERVICES CO LTD JPY 15,000 8,259,902 10,050,000 1.07%
NIPPON CERAMIC CO LTD JPY 3,600 6,597,192 8,701,200 0.93%
NIPPON KODOSHI CORP JPY 4,600 5,160,847 4,572,400 0.49%
NITTO SEIKO CO LTD JPY 12,000 4,647,881 5,544,000 0.59%
NITTOKU ENGINEERING CO LTD JPY 1,200 1,640,924 2,989,200 0.32%
NOHMI BOSAI LTD JPY 4,000 5,785,596 6,116,000 0.65%
NORITAKE CO LTD/NAGOYA JAPAN JPY 2,100 5,765,658 5,987,100 0.64%
OBARA GROUP INC JPY 1,100 5,971,965 5,412,000 0.58%
OPEN HOUSE CO LTD JPY 4,300 8,700,012 11,455,200 1.22%
OUTSOURCING INC JPY 4,500 12,174,764 19,890,000 2.12%
PEPTIDREAM INC JPY 1,700 7,643,523 8,925,000 0.95%
PHARMA FOODS INTERNATIONAL CO LTD JPY 10,600 4,361,315 4,642,800 0.49%
POCKET CARD CO LTD JPY 7,300 4,105,381 4,438,400 0.47%
PRESSANCE CORP JPY 9,200 9,713,963 12,328,000 1.31%
PRESTIGE INTERNATIONAL INC JPY 23,000 12,727,761 23,069,000 2.46%
QUICK CO LTD JPY 9,800 9,105,228 11,564,000 1.23%
RELIA INC JPY 8,700 9,992,391 9,526,500 1.01%
ROLAND DG CORP JPY 2,100 5,677,978 7,035,000 0.75%
SANYO DENKI CO LTD JPY 17,000 12,369,217 14,127,000 1.50%
SEIKAGAKU CORP JPY 4,000 6,692,095 7,420,000 0.79%
SENKO GROUP HOLDINGS CO LTD JPY 12,000 9,481,386 8,604,000 0.92%
SEPTENI HOLDINGS CO LTD JPY 33,000 13,912,851 13,200,000 1.41%
SHIBAURA MECHATRONICS CORP JPY 1,000 280,168 290,000 0.03%
SHINKAWA LTD JPY 9,000 6,424,931 7,497,000 0.80%
SHOEI CO LTD JPY 3,900 8,216,230 10,838,100 1.15%
SIIX CORP JPY 3,500 11,640,932 15,680,000 1.67%
SOGO MEDICAL CO LTD JPY 4,000 13,618,472 16,760,000 1.79%
STAR MICA CO LTD JPY 7,300 9,884,758 16,717,000 1.78%
SYUPPIN CO LTD JPY 6,000 7,912,993 9,762,000 1.04%

MUFG Global Fund SICAV MUFG Japan Equity Small Cap Fund
The accompanying notes form an integral part of these financial statements.
34
STATEMENT OF INVESTMENTS AND OTHER NET ASSETS AS AT MARCH 31, 2017 (expressed in JPY) (continued)
Description Currency Nominal/
Quantity Cost
(note 2) Market value
(note 2) % of net assets
TRANSFERABLE SECURITIES ADMITTED TO AN OFFICIAL STOCK EXCHANGE OR DEALT IN ON ANOTHER REGULATED MARKET (continued)
SHARES (continued)
JAPAN (continued) TAIKO PHARMACEUTICAL CO LTD JPY 3,900 6,804,941 7,382,700 0.79%
TAKANO CO LTD JPY 3,900 2,573,854 3,939,000 0.42%
TAKARA HOLDINGS INC JPY 5,600 4,863,256 6,725,600 0.72%
TAKEEI CORP JPY 7,300 7,587,653 7,650,400 0.81%
TEMONA INC JPY 100 255,000 255,000 0.03%
TOKAI CORP/GIFU JPY 3,400 10,497,669 13,838,000 1.47%
TOKAI TOKYO FINANCIAL HOLDINGS INC JPY 8,400 6,336,501 4,863,600 0.52%
TOPY INDUSTRIES LTD JPY 3,800 9,760,344 11,240,400 1.20%
TORIDOLL HOLDINGS CORP JPY 3,400 7,011,643 8,224,600 0.88%
TOSHO CO LTD JPY 4,500 13,743,690 21,262,500 2.26%
TOWA CORP JPY 10,000 7,468,038 19,870,000 2.12%
TRUSCO NAKAYAMA CORP JPY 4,600 10,235,307 11,872,600 1.26%
TSUKUI CORP JPY 30,300 18,176,781 19,967,700 2.13%
UCS CO LTD JPY 8,500 9,192,694 8,984,500 0.96%
USER LOCAL INC JPY 100 294,000 1,247,000 0.13%
UZABASE INC JPY 400 1,004,000 1,644,000 0.18%
VEGA CORP CO LTD JPY 4,000 5,723,432 6,200,000 0.66%
WARABEYA NICHIYO HOLDINGS CO LTD JPY 2,100 5,174,491 5,422,200 0.58%
WELLNET CORP JPY 7,400 10,480,229 10,034,400 1.07%
YAMADA CONSULTING GROUP CO LTD JPY 2,300 8,346,116 10,994,000 1.17%
YONDOSHI HOLDINGS INC JPY 2,400 6,372,109 5,944,800 0.63%
ZENKOKU HOSHO CO LTD JPY 3,000 12,104,345 11,370,000 1.21%
745,308,265 920,890,900 98.08%
TOTAL INVESTMENTS IN SECURITIES 745,308,265 920,890,900 98.08%
CASH AT BANKS 15,770,736 1.68%
OTHER NET ASSETS/(LIABILITIES) 2,234,319 0.24%
TOTAL NET ASSETS 938,895,955 100.00%
MUFG Global Fund SICAV MUFG Japan Equity Small Cap Fund
35
Geographical cl assification of investments
GEOGRAPHICAL CLASSIFICATION OF INVESTMENTS AS AT MARCH 31, 2017
(in % of net assets)
JAPAN 98.08%
98.08%

MUFG Global Fund SICAV MUFG Asia Pacific ex Japan Equity High Growth Fund
36
CHANGES IN THE NUMBER OF SHARES AND STATISTICMATION
Year ended
March 31, 2017
Year ended March 31, 2016
Year ended March 31, 2015
Number of shares outstanding at the beginning of the year 67,110.58511 77,297.97021 119,728.49741
Number of shares issued - 12,261.04480 1,536.48390
Number of shares redeemed (33,811.82530) (22,448.42990) (43,967.01110)
Number of shares outstanding at the end of the year 33,298.75981 67,110.58511 77,297.97021
STATISTICAL INFORMATION
Net asset value per share at the end of the year
Class JPY B (expressed in JPY) 11,517 10,402 12,378
Total Net Assets (expressed in USD) 3,441,700.49 6,211,198.68 7,978,496.02
MUFG Global Fund SICAV MUFG Asia Pacific ex Japan Equity Income Growth Fund
37
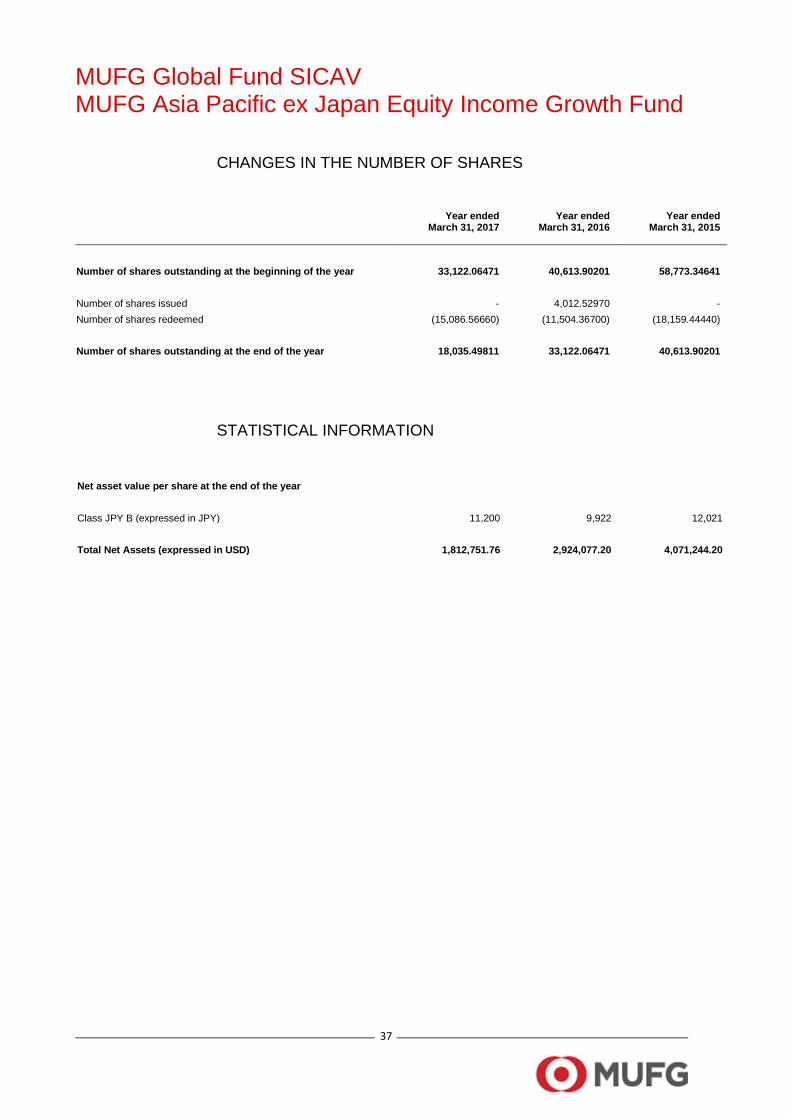
CHANGES IN THE NUMBER OF SHARES
Year ended March 31, 2017
Year ended March 31, 2016
Year ended March 31, 2015
Number of shares outstanding at the beginning of the year 33,122.06471 40,613.90201 58,773.34641
Number of shares issued - 4,012.52970 -
Number of shares redeemed (15,086.56660) (11,504.36700) (18,159.44440)
Number of shares outstanding at the end of the year 18,035.49811 33,122.06471 40,613.90201
STATISTICAL INFORMATION
Net asset value per share at the end of the year
Class JPY B (expressed in JPY) 11,200 9,922 12,021
Total Net Assets (expressed in USD) 1,812,751.76 2,924,077.20 4,071,244.20

MUFG Global Fund SICAV MUFG Asia Pacific ex Japan Equity Stable Growth Fund
38
CHANGES IN THE NUMBER OF SHARES
Year ended
March 31, 2017
Year ended March 31, 2016
Year ended March 31, 2015
Class JPY B
Number of shares outstanding at the beginning of the year 787,756.73810 718,314.40430 123,122.01610
Number of shares issued 130,294.18410 235,499.51700 758,250.19490
Number of shares redeemed (407,784.67820) (166,057.18320) (163,057.80670)
Number of shares outstanding at the end of the year 510,266.24400 787,756.73810 718,314.40430
Class JPY B 2
Number of shares outstanding at the beginning of the year - - -
Number of shares issued 352,679.50450 - -
Number of shares redeemed (40,396.44530) - -
Number of shares outstanding at the end of the year 312,283.05920 - -
Class USD I
Number of shares outstanding at the beginning of the year 58,898.77470 69,063.41690 47,528.70930
Number of shares issued 217,445.90760 30,780.70840 21,534.70760
Number of shares redeemed (124,038.15840) (40,945.35060) -
Number of shares outstanding at the end of the year 152,306.52390 58,898.77470 69,063.41690
STATISTICAL INFORMATION
Net asset value per share at the end of the year
Class JPY B (expressed in JPY) 13,082 11,771 13,545
Class JPY B 2 (expressed in JPY) 11,519 - -
Class USD I (expressed in USD) 117.964200 105.653700 114.644300
Total Net Assets (expressed in USD) 110,154,226.49 88,722,848.51 89,052,193.75

MUFG Global Fund SICAV MUFG Japan Equity Strategic Value Fund
39
CHANGES IN THE NUMBER OF SHARES
Year ended
March 31, 2017
Year ended March 31, 2016
Period from March 20, 2015
(launch date) to March 31, 2015
Number of shares outstanding at the beginning of the year/period 30,000.00000 30,000.00000 -
Number of shares issued - - 30,000.00000
Number of shares redeemed - - -
Number of shares outstanding at the end of the year/period 30,000.00000 30,000.00000 30,000.00000
STATISTICAL INFORMATION
Net asset value per share at the end of the year/period
Class JPY I (expressed in JPY) 10,253 8,303 9,913
Total Net Assets (expressed in JPY) 307,593,348 249,080,270 297,399,368

MUFG Global Fund SICAV MUFG Japan Equity Small Cap Fund
40
CHANGES IN THE NUMBER OF SHARES
Year ended
March 31, 2017
Year ended March 31, 2016
Period from March 20, 2015
(launch date) to March 31, 2015
Class JPY I
Number of shares outstanding at the beginning of the year/period 30,000.00000 30,000.00000 -
Number of shares issued - - 30,000.00000
Number of shares redeemed - - -
Number of shares outstanding at the end of the year/period 30,000.00000 30,000.00000 30,000.00000
Class USD I
Number of shares outstanding at the beginning of the year/period 74,328.80430 - -
Number of shares issued 3,244.09170 76,366.72790 -
Number of shares redeemed (44,217.82870) (2,037.92360) -
Number of shares outstanding at the end of the year/period 33,355.06730 74,328.80430 -
STATISTICAL INFORMATION
Net asset value per share at the end of the year/period
Class JPY I (expressed in JPY) 13,302 10,541 9,967
Class USD I (expressed in USD) 145.242300 114.178000 -
Total Net Assets (expressed in JPY) 938,895,955 1,270,098,177 299,038,201
MUFG Global Fund SICAV
NOTES TO THE FINANCIAL STATEMENTS AS AT MARCH 31, 2017
41
NOTES TO TH E FIN ANCIAL STATEMENTS
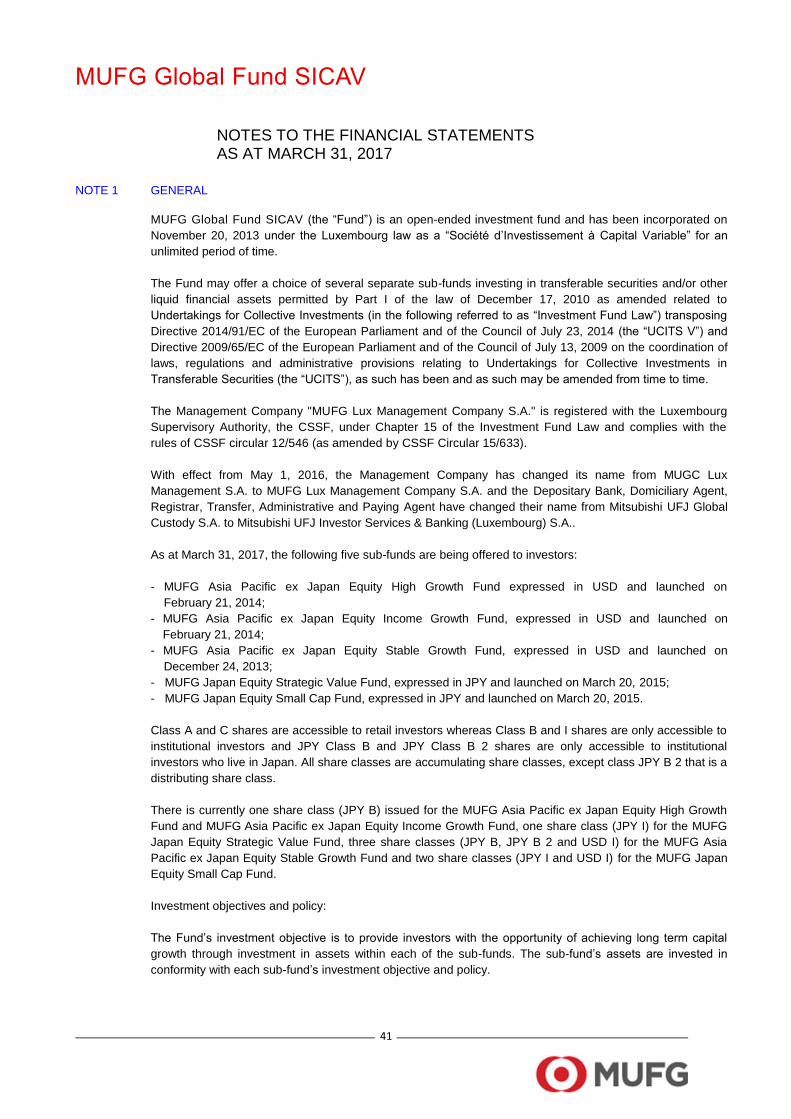
NOTE 1 GENERAL
MUFG Global Fund SICAV (the “Fund”) is an open-ended investment fund and has been incorporated on
November 20, 2013 under the Luxembourg law as a “Société d’Investissement à Capital Variable” for an
unlimited period of time.
The Fund may offer a choice of several separate sub-funds investing in transferable securities and/or other
liquid financial assets permitted by Part I of the law of December 17, 2010 as amended related to
Undertakings for Collective Investments (in the following referred to as “Investment Fund Law”) transposing
Directive 2014/91/EC of the European Parliament and of the Council of July 23, 2014 (the “UCITS V”) and
Directive 2009/65/EC of the European Parliament and of the Council of July 13, 2009 on the coordination of
laws, regulations and administrative provisions relating to Undertakings for Collective Investments in
Transferable Securities (the “UCITS”), as such has been and as such may be amended from time to time.
The Management Company "MUFG Lux Management Company S.A." is registered with the Luxembourg
Supervisory Authority, the CSSF, under Chapter 15 of the Investment Fund Law and complies with the
rules of CSSF circular 12/546 (as amended by CSSF Circular 15/633).
With effect from May 1, 2016, the Management Company has changed its name from MUGC Lux
Management S.A. to MUFG Lux Management Company S.A. and the Depositary Bank, Domiciliary Agent,
Registrar, Transfer, Administrative and Paying Agent have changed their name from Mitsubishi UFJ Global
Custody S.A. to Mitsubishi UFJ Investor Services & Banking (Luxembourg) S.A..
As at March 31, 2017, the following five sub-funds are being offered to investors:
- MUFG Asia Pacific ex Japan Equity High Growth Fund expressed in USD and launched on
February 21, 2014;
- MUFG Asia Pacific ex Japan Equity Income Growth Fund, expressed in USD and launched on
February 21, 2014;
- MUFG Asia Pacific ex Japan Equity Stable Growth Fund, expressed in USD and launched on
December 24, 2013;
- MUFG Japan Equity Strategic Value Fund, expressed in JPY and launched on March 20, 2015;
- MUFG Japan Equity Small Cap Fund, expressed in JPY and launched on March 20, 2015.
Class A and C shares are accessible to retail investors whereas Class B and I shares are only accessible to
institutional investors and JPY Class B and JPY Class B 2 shares are only accessible to institutional
investors who live in Japan. All share classes are accumulating share classes, except class JPY B 2 that is a
distributing share class.
There is currently one share class (JPY B) issued for the MUFG Asia Pacific ex Japan Equity High Growth
Fund and MUFG Asia Pacific ex Japan Equity Income Growth Fund, one share class (JPY I) for the MUFG
Japan Equity Strategic Value Fund, three share classes (JPY B, JPY B 2 and USD I) for the MUFG Asia
Pacific ex Japan Equity Stable Growth Fund and two share classes (JPY I and USD I) for the MUFG Japan
Equity Small Cap Fund.
Investment objectives and policy:
The Fund’s investment objective is to provide investors with the opportunity of achieving long term capital
growth through investment in assets within each of the sub-funds. The sub-fund’s assets are invested in
conformity with each sub-fund’s investment objective and policy.

MUFG Global Fund SICAV
NOTES TO THE FINANCIAL STATEMENTS AS AT MARCH 31, 2017 (continued)
42
NOTE 1 GENERAL (continued)
The sub-funds (ex Japan Equity) invest primarily in marketable equity securities of Asia and Pacific countries
(ex Japan) and companies whose headquarters are not in Asia Pacific countries (ex Japan) that generate
over half of their profits from Asia and Pacific countries (ex Japan), including equity-related securities such
as ADRs and GDRs, exchange traded funds and stock index futures.
The sub-funds (Japan Equity) invest in marketable equity securities listed in Japan, including exchange
traded funds and stock index futures.
Secondarily, the sub-funds may invest in cash, cash equivalents and short-term fixed income securities. The
sub-funds invest less than 15% in interest-bearing securities on taxation of savings income in the form of
interest payments.
NOTE 2 SUMMARY OF SIGNIFICANT ACCOUNTING POLICIES
Presentation of financial statements
The financial statements are prepared in accordance with Luxembourg legal and regulatory requirements
relating to the preparation of the financial statements.
Combined accounts
The combined accounts of the Fund are expressed in EUR and the accounts of the sub-funds are kept in
currency of each sub-fund. The combined statement of net assets and the combined statement of operations
and changes in net assets are the sum of the statements of net assets, the statement of operations and
changes in net assets of each sub-fund converted with the exchange rate prevailing at year-end.
Valuation of the assets The assets of the Fund are valued as follows:
a) securities listed on a stock exchange or traded on any other regulated market are valued at the last
available price on such stock exchange or market. If a security is listed on several stock exchanges or
markets, the last available price on the stock exchange or market which constitutes the main market for
such securities, is determining;
b) securities no longer listed on any stock exchange or traded on a regulated market are valued at their last
available closing market price;
c) securities for which the price referred to in (a) and/or (b) is not representative of the fair market value, are
valued prudently, and in good faith on the basis of their reasonably foreseeable sale price;
d) cash and other liquid assets are valued at their face value.
Net realized gain/(loss) on sales of securities
The net realized gain/(loss) on the sales of securities is calculated on the basis of the average cost of the
securities sold.
The security transactions are accounted on their trade date.

MUFG Global Fund SICAV
NOTES TO THE FINANCIAL STATEMENTS AS AT MARCH 31, 2017 (continued)
43
NOTE 2 SUMMARY OF SIGNIFICANT ACCOUNTING POLICIES (continued)
Investment income
Interest income is recognized on an annual basis.
Dividends are recorded on the ex-dividend date.
Cost of investment securities
The cost of investment securities expressed in currencies other than the accounting currency is translated
into the accounting currency with the exchange rate of the transaction date.
Foreign exchange translation
For each sub-fund, assets and liabilities denominated in other currencies than the sub-fund’s currency have
been translated into the prevailing exchange rate in effect at balance sheet date. The income, expenses
and realized gain/loss denominated in other currencies than the sub-fund’s currency have been translated
into the prevailing exchange rate in effect at the transaction date. Gains and losses on foreign exchange
transactions are recognized in the statement of operations and changes in net assets. Realized and
unrealized gains and losses on investments and derivative instruments include those that result from
foreign currency changes.
Applicable currency exchange rates used as at March 31, 2017 are as follows:
1 EUR = 1.402045 AUD
1 EUR = 8.312008 HKD
1 EUR = 14,252.288525 IDR
1 EUR = 69.451229 INR
1 EUR = 119.179956 JPY
1 EUR = 1,196.077765 KRW
1 EUR = 4.733294 MYR
1 EUR = 1.530005 NZD
1 EUR = 53.664671 PHP
1 EUR = 1.494482 SGD
1 EUR = 36.717652 THB
1 EUR = 32.452821 TWD
1 EUR = 1.069550 USD
Valuation of forward foreign exchange contracts
Forward foreign exchange contracts are valued at the closing date by reference to the forward rate of
exchange applicable to the outstanding life of the contract. The unrealized appreciation or depreciation on
open forward foreign exchange contracts is calculated as the difference between the contract rate and the
rate to close out the contract. The realized gain or loss and the change in net unrealized appreciation or
depreciation on those contracts are disclosed in the statement of operations and changes in net assets.

MUFG Global Fund SICAV
NOTES TO THE FINANCIAL STATEMENTS AS AT MARCH 31, 2017 (continued)
44
NOTE 3 ACCRUED EXPENSES
NOTE 4 INVESTMENT MANAGEMENT FEES
The Investment Manager is entitled to an investment management fee, calculated on the average Net
Asset Value of the Fund, over the concerned period, and payable on a quarterly basis at a rate of 0% for
class JPY B, 0.45% for JPY B 2, 0.70% for class JPY I and 0.70% for class USD I.
For MUFG Japan Equity Small Cap Fund, the applicable rate for JPY I and USD I is 0.75%.
NOTE 5 “TAXE D’ABONNEMENT”
Under Luxembourg law, there are currently no Luxembourg taxes on income, withholding or capital gains
due by the Fund. The Fund is, however, subject to a “taxe d’abonnement” of 0.05% per year, calculated
and payable quarterly, on the aggregate Net Asset Value of the outstanding shares of the Fund at the end
of each quarter. This annual tax is however reduced to 0.01% on the aggregate Net Asset Value of the
shares dedicated to institutional investors and for investments in money market instruments.
NOTE 6 ADMINISTRATION AND TRANSFER AGENT FEES
The fees to be paid to the Administrative and Transfer Agent are 0.07% (plus VAT when applicable) per
annum of the average daily Net Asset Value of the Fund during the relevant quarter. NOTE 7 CUSTODIAN FEES
The fees to be paid to the Custodian are 0.02% (plus VAT when applicable) per annum of the average daily
Net Asset Value of the Fund during the relevant quarter.
MUFG Asia Pacific
ex Japan Equity
High Growth Fund
MUFG Asia Pacific
ex Japan Equity
Income Growth Fund
MUFG Asia Pacific ex
Japan Equity Stable
Growth Fund
USD USD USD
Administration and Transfer Agent fees (note 6) 600.87 328.79 19,132.01
Custodian fees (note 7) 172.47 93.90 5,466.37
Facilities Agent fees (note 8) 117.64 117.64 117.64
Investment Management fees (note 4) - - 65,151.00
Management Company fees (note 9) 172.47 93.90 5,466.37
Other fees 3,879.91 3,788.71 2,024.74
Professional fees 7,849.56 7,754.31 6,470.70
“Taxe d’abonnement” (note 5) 83.47 46.74 2,718.65
TOTAL 12,876.39 12,223.99 106,547.48
MUFG Japan Equity
Strategic Value Fund
MUFG Japan Equity
Small Cap Fund
JPY JPY
Administration and Transfer Agent fees (note 6) 52,962 156,732
Custodian fees (note 7) 15,118 44,779
Facilities Agent fees (note 8) 12,674 12,674
Investment Management fees (note 4) 529,615 1,678,461
Management Company fees (note 9) 15,118 44,779
Other fees 627,498 389,559
Professional fees 1,413,799 711,329
“Taxe d’abonnement” (note 5) 7,553 22,479
TOTAL 2,674,337 3,060,792

MUFG Global Fund SICAV
NOTES TO THE FINANCIAL STATEMENTS AS AT MARCH 31, 2017 (continued)
45
NOTE 8 FACILITIES AGENT FEES
The Facilities Agent (Representative in United Kingdom) is entitled to a facilities agent fee of EUR 2,200 per
annum, calculated and payable quarterly. NOTE 9 MANAGEMENT COMPANY FEES
The Management Company is entitled to a fee payable quarterly in arrears at an annual rate of 0.02%
calculated on the basis of average daily Net Asset Value of the Fund during the relevant quarter.
NOTE 10 NET ASSET VALUE CALCULATION / SUBSCRIPTION AND REPURCHASE
The Net Asset Value per share, the subscription and the redemption prices for shares of the Fund are
determined on each Valuation Day. A “Valuation Day” is each day that is a bank business day where banks
are open for business in Japan, Luxembourg, UK and the United States. NOTE 11 COLLATERAL
As at March 31, 2017, none of the sub-funds used collateral during the Fund financial year. Therefore a
description of the permitted types of collateral, the level of collateral required and the haircut policy as
referred in the ESMA Guidelines and the Fund prospectus were not disclosed.
NOTE 12 TRANSACTION COSTS
The Fund incurred transaction costs (brokerage fees) in connection with the purchase and sale of
transferable securities, money market instruments or other permissible assets. The transaction costs are
included in the cost of investments and in the net realized gain/(loss) on investments.
Transaction costs for the year ended March 31, 2017 are as follows:
MUFG Asia Pacific ex Japan Equity High Growth Fund USD 22,130.79
MUFG Asia Pacific ex Japan Equity Income Growth Fund USD 8,774.30
MUFG Asia Pacific ex Japan Equity Stable Growth Fund USD 579,591.20
MUFG Japan Equity Strategic Value Fund JPY 176,840
MUFG Japan Equity Small Cap Fund JPY 323,366
NOTE 13 DIVIDENDS
MUFG Asia Pacific ex Japan Equity Stable Growth Fund
The Board of Directors of the SICAV decided to distribute the following dividends:
Ex-date Payment date Class of share Distribution rate Total amount Currency
09/02/2016 09/09/2016 JPY B 2 103 24,585,066 JPY
03/02/2017 03/07/2017 JPY B 2 79 23,330,455 JPY

MUFG Global Fund SICAV
NOTES TO THE FINANCIAL STATEMENTS AS AT MARCH 31, 2017 (continued)
46
NOTE 14 OTHER INCOME
Each share class has a set TER (Total Expense Ratio) cap rate including the annual tax but excluding
sub-depositary fees and other taxes. The fees over the TER Cap rates are covered by Mitsubishi UFJ Trust
and Banking Corporation, Japan and are booked against the “Other income” caption.
The CAP TER rates are set respectively at 90bps and 20bps for the USD I and JPY B class of shares for the
MUFG Asia Pacific ex Japan Equity High Growth Fund, the MUFG Asia Pacific ex Japan Equity Income
Growth Fund and the MUFG Asia Pacific ex Japan Equity Stable Growth Fund.
The CAP TER rate is set at 130bps for the JPY I class of shares for the MUFG Japan Equity Strategic Value
Fund and at 135bps for the USD I and JPY I class of shares for the MUFG Japan Equity Small Cap Fund. NOTE 15 OTHER EXPENSES
MUFG Asia Pacific
ex Japan Equity
High Growth Fund
MUFG Asia Pacific
ex Japan Equity
Income Growth Fund
MUFG Asia Pacific
ex Japan Equity
Stable Growth Fund
USD USD USD
CSSF expenses 1,105.68 1,047.68 1,085.65
Insurance fee 1,332.25 1,332.25 1,332.25
Miscellaneous expenses 344.31 182.62 6,523.02
Out of pocket expenses 2,239.19 2,239.19 2,100.93
Registration expenses 2.78 2.78 2.78
Reporting expenses 1,559.17 1,591.40 1,564.78
VAT paid (custody) 14.71 7.97 359.96
TOTAL 6,598.09 6,403.89 12,969.37
MUFG Japan Equity
Strategic Value Fund
MUFG Japan Equity
Small Cap Fund
JPY JPY
CSSF expenses 114,476 109,209
Insurance fee 149,650 149,650
Miscellaneous expenses - -
Out of pocket expenses 231,018 227,015
Registration expenses 307 307
Reporting expenses 157,197 157,475
VAT paid (custody) 964 3,149
TOTAL 653,612 646,805

MUFG Global Fund SICAV
UNAUDITED APPENDIX
47
Remuneration policy
The remuneration policy implemented by MUFG Lux Management Company S.A. is compliant with the rules
in terms of remuneration specified in the European Directive 2014/91/EU amending Directive 2009/65/EC on
undertakings for collective investment in transferable securities, which is applicable to the Fund, and came
into force on March 18, 2016. It is implemented in national law under the Luxembourg Act of May 10, 2016
implementing Directive 2014/91/EU. These rules, about remuneration policies and practices, have for
objective to be consistent with and to promote sound and effective risk management of fund managers and
the funds they manage.
The Management Company has adopted a remuneration policy compliant with the AIFMD and UCITS
standards and consistent with and promoting sound and effective risk management. It does not encourage
risk-taking which is inconsistent with the risk profiles, rules or instruments of incorporation of the funds
managed by the Management Company. The remuneration policy is in line with the business strategy,
objectives, values and interests of the Management Company and the funds it manages and the best
interest of investors of such funds, and includes measures to avoid conflicts of interest.
The Management Company has contractual delegation arrangements in place with external parties
regarding accomplishment of some activities, including portfolio management activities. The Management
Company ensures that the appointed delegates to which portfolio management activities have been
outsourced are subject to regulatory requirements on remuneration that are equally as effective as those
applicable under AIFMD, UCITS and ESMA guidelines through a due diligence process and on a contractual
basis.
The remuneration policy applies to all remunerations (fixed and variable remuneration) paid by the
Management Company to persons that have an employment contract with the Management Company, as
the case may be, directors, management and staff of the Management Company. In accordance with the
applicable regulatory provisions, the application of the policy falls within the scope of the third level controls
made by the internal auditor and the compliance officer of the Management Company. The result of such
controls has to be reported to the Management Company's board of directors on an annual basis.
The Management Company has taken into consideration the principle of proportionality in the sense that it
shall comply with the principles stated in any relevant law applicable to the Fund or to the Management
Company and AIFMD in a way and to the extent that is appropriate to its size, internal organization and the
nature, scope and complexity of its activities. Considering more specifically its particular nature:
- small number of employees;
- liquidity profile of the funds managed by the Management Company being largely assets that can
be readily converted to cash;
- investment management being delegated and carried out by well-known portfolio management
companies.
The beneficiaries of the remuneration policy of the Management Company are:
- the Management Company's directors;
- the management’s members for whom it is to be noted that to prevent any potential conflict of
interest, those members of the management that are also members of the board of directors are
prohibited from board meetings deciding the management’s remuneration when it concerns their
own remuneration for those specific items;
- and the staff whose fixed remuneration of the staff is determined by the management under the
supervision of the Management Company's board of directors.
MUFG Global Fund SICAV
UNAUDITED APPENDIX (continued)
48
Remuneration policy (continued)
These beneficiaries are categorised under three categories:
1.) the identified persons,
2.) the risk takers and
3.) all other staff of the Management Company.
The identified persons are the board members (executive and non-executive directors), the senior
management (conducting officers and managing director), the control functions (compliance, internal audit
and risk management) and the risk takers. There is however no risk taker identified for the Management
Company. All other staff are anyone not belonging to the identified staff.
The Management Company has a performance based-culture and therefore rewards its employees through
variable remuneration. This is designed to attract, retain and motivate its employees without encouraging
taking inappropriate risks.
The Management Company's board of directors and management do not accept that a variable
remuneration be fixed in the employment contract. The Management Company's board of directors may
decide to allocate a variable remuneration based on the list of criteria described in the detailed policy and
based on the results of the annual appraisal process. The annual appraisal process is used to evaluate and
measure an employee’s performance against defined objectives. The 'Specific Measurable Achievable
Realistic and Time-bound' (or else known as «SMART») objectives concept is utilized when setting
objectives. If approved by the Management Company's board of directors, the variable remuneration is paid
through an annual discretionary bonus.
For all the employees mentioned in the policy as being the identified persons, the assessment of
performance is set in a multi-year framework appropriate to the holding period of the investors of the funds
managed by the Management Company. The Management Company also ensures that the assessment of
the performance of its identified persons lives up to the long-term performance of the Fund and its
investment risks.
The board of the directors of the Management Company when deciding about fixed and variable
remuneration takes care that the fixed component represents a sufficiently high proportion of the total
compensation for a fully flexible policy to be exercised on variable remuneration components, including the
possibility to pay no variable remuneration.
This measure aims to avoid any possible, if any, inappropriate risk-taking by the employees. Depending on
the performance assessed during the annual appraisal process, depending on the achievements of the
employees, on their adherence to the Management Company's principles and on the annual profitability of
the Management Company, the Management Company's board of directors and/or the management may
decide to not allocate any variable remuneration.
The Management Company states that their detailed remuneration policy is easily accessible on the
following website: http://www.lu.tr.mufg.jp/lmsa/. All details of the up-to-date remuneration policy and a
description of how the remuneration and benefits are calculated, the identity of those responsible for the
allocation of remuneration and advantages are available in this policy. Due to the principle of proportionality,
the Management Company confirms that they have not set-up any remuneration committee as explained in
the remuneration policy. A paper version of the policy will be made available to investors free of charge
upon simple request.

MUFG Global Fund SICAV
UNAUDITED APPENDIX (continued)
49
Remuneration policy (continued)
Figures for 2016
1. Aggregate quantitative information for members of staff of MUFG Lux Management Company S.A.
in 2016:
Business Area Number of
Employees *
Total Remuneration (kEUR) (fixed + variable) **
Of which total variable remuneration (kEUR)
MUFG Lux Management Company S.A. (‘MUFGLM’)
8.6
799
102
MUFG Lux Management Company S.A. of which attributable to the UCITS ****
8.6 5 1
* Number of employees is all the employees of the Management Company, registered on the payroll of the Management Company during the year. This number has been computed on full time equivalent prorata temporis basis, during the year. ** Fixed remuneration consists of salaries paid, pension contributions as well as other non-monetary benefits such as car allowances. Variable remuneration consists of annual bonuses paid in accordance with remuneration policies.
2. Aggregate quantitative information for members of staff whose actions have a material impact on
the risk profile and are therefore “Identified Staff”*** in 2016:
Business Area Total Remuneration
(kEUR)
MUFG Lux Management Company S.A. (‘MUFGLM’)
664
MUFG Lux Management Company S.A. of which attributable to the UCITS****
4
*** The total remuneration disclosed in the table is the remuneration paid by the Management Company to
the Identified Staff. The Identified Staff are the Board Members (Executive and Non-Executive Directors),
the Senior Management (Conducting Officers and Managing Director), the Control Functions (Compliance,
Internal Audit and Risk Management) and the Risk Takers. There is no risk taker identified for MUFGLM.
Internal Audit roles are outsourced function and therefore not included in this figure.
**** The Breakdown of the proportion of the total remuneration of the staff of MUFGLM attributable to the
UCITS has been estimated by the prorata of the total assets under management of MUFG Global Fund
SICAV divided by the total assets under management of MUFG Lux Management Company on the
31.12.2016.
3. Other information for MUFG Lux Management Company S.A.:
Number of funds
(31.12.2016) AuM (billion Eur) at
31/12/2016
UCITS funds AIFs
2 72
0.874 18.743

MUFG Global Fund SICAV
UNAUDITED APPENDIX (continued)
50
Disclosure in accordance with regulation (EU) No. 2015/2365 on SFTR
The Fund does not use any instruments falling into the scope of SFTR.