muhammad hadi ali khan - tripod.comhadi202002.tripod.com/lab491.pdf · r 1 c 1 v 1 v + 2-c 2 r 2 r...
TRANSCRIPT

Page 1 of 15
LABORATORY MANUAL
FOR
Lab Course EL 491
Electronics Circuit Design Laboratory
CONTENTS
1. Quadrature Oscillator
2. Switch Capacitor
3. OTA – Multi-function Filters
4. Precision Rectifiers using Bi-phase Amplifiers
5. CFA (Current Conveyer)
6. Opamp-based Multi-function Filters
7. Appendix – I (Precautions)
8. Appendix –II (Data on the ICs CD4066 & CA3080)
Muhammad Hadi Al i Khan Electronics Engineer,
Department of Electronics Engineering, A. M. U., Aligarh - 202 002, India
Phone & Fax:- +91-571-2721148 (Office) Emai l : - hadia l ikhan@gmai l . com
NB:- This laboratory manual is also available on the Internet and can be downloaded from:-
http://hadialikhan.tripod.com/lab491.pdf
MHAK / 190707

Page 2 of 15
Electronic Circuits Design Laboratory
Lab. Course EL – 491
Experiment No. 01 (Quadra ture Osc i l la tor )
Object:- Design and Experimentally Verify an Opamp-based Quadrature Oscillator for a
frequency of ………….. Hz Circuit Diagram:-
R1
C1
V1
V2+
-
C2
R2
R3R4
R5
-
+V0
Theory:- On analyzing the circuit of the quadrature oscillator, shown above, the condition
of the oscillation may be written as : 2
5
3
4
RR
RR
= ------- ------------ (1)
And the frequency of oscillation can be expressed as ω2 = 2121
3
41
CCRRRR
+
,
or, f = π21
2121
3
41
CCRRRR
+ ,
Taking R3 = R4 and C1 = C2 = C , f = Cπ2
1
21
2RR
----- ----- (2)
Design:-
For design frequency (given), assume appropriate values of R1 & C,
and calculate R2 = …………….. KΩ,
Corresponding to the nearest available value of the resistor, calculate f by back calculations.
MHAK / 190707

Page 3 of 15
Observations:-
Use a pot of 10 KΩ for (R3 + R4) and adjust it to get the output waveform Vo. Once the
output Vo is obtained corresponding to the particular values of R1 and R2, replace R1 by a few
discrete values of resistors such as 2.2 KΩ, 3.3 KΩ, 4.7 KΩ etc., and measure the frequency
of Vo corresponding to each of these values and verify that the frequency is changing but the
phase difference between Vo and V2 is always 900.
R1 (KΩ) Time period (µs)
Practical value of frequency (KHz)
Theoretical value of frequency (KHz)
Sample Calculations: Designed frequency = -------- KHz Measured frequency = -------- KHz %age error = ----- % Plot a curve between R1 & f .
**************
MHAK / 190707
Page 4 of 15
Electronic Circuits Design Laboratory
Lab. Course EL – 491
Experiment No. 02 (Switch Capacitor)
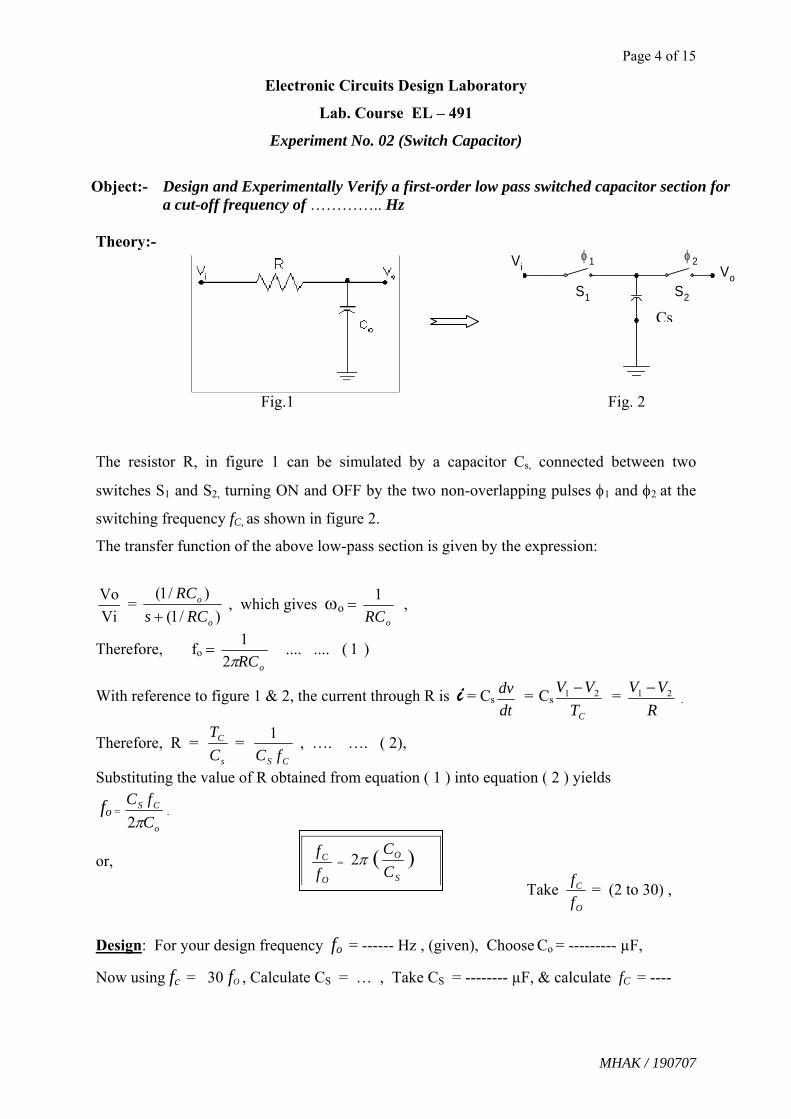
Object:- Design and Experimentally Verify a first-order low pass switched capacitor section for
a cut-off frequency of ………….. Hz Theory:-
φ 1 φ 2
S1 S2
Vi Vo
Fig. 2 Fig.1 The resistor R, in figure 1 can be simulated by a capacitor Cs, connected between two
switches S1 and S2, turning ON and OFF by the two non-overlapping pulses φ1 and φ2 at the
switching frequency fC, as shown in figure 2.
The transfer function of the above low-pass section is given by the expression:
ViVo =
)/1()/1(
o
o
RCsRC
+ , which gives ωo =
oRC1
,
Therefore, fo = oRCπ2
1 .... .... ( 1 )
With reference to figure 1 & 2, the current through R is i = Csdtdv
= CsCTVV 21 −
= R
VV 21 − .
Therefore, R = s
C
CT
= CS fC
1 , …. …. ( 2),
Substituting the value of R obtained from equation ( 1 ) into equation ( 2 ) yields
fo = o
CS
CfC
π2.
or,
Design: For your design frequen
Now using fc = 30 fO , Calculat
f C
Take O
C
ff = (2 to 3
O
C
f = π2 (
S
O
C)
cy fo = ------ Hz , (given), Choose Co = --------- µF,
e CS = … , Take CS = -------- µF, & calculate fC =
MHAK /
Cs
0) ,
----
190707

Page 5 of 15
The practically used values are Co = ------ µF CS = ------ µF fo = ------ KHz fC = ----- KHz
Note:- Use a NAND gate (TTL IC 7400) as an inverter (NOT gate), to get non-overlapping
pulses and a CMOS IC, CD 4066 for the two switches. (Ref:- Pin configurations of the two
ICs), where φ1 is the clock pulse of freq. = fc
Inverter
φ1φ2
Observations:- Vi = -------- mV, and fc = -------- KHz,
S. No. Signal freq. fi (Hz)
Vo = O/P Voltage (mV) Gain = (Vo/ Vi)
1. 2. 3. 4. 5. 6. 7. 8. 9. 10. 11. 12.
Plot the frequency response curve (gain versus frequency),
Result:- Practical value of the cut-off frequency obtained from the graph plotted is 490 Hz.
Designed value (given) = ------ Hz.
Hence, the percentage error = -------- %.
MHAK / 190707

Page 6 of 15
Experiment No. 03 (OTA Multi-function Filters)
Object Analyze, design and experimentally verify the OTA – c multi-function filters for the LP, HP, BP and BE responses for a cut-off ( pole ) frequency of …… KHz & Q = 1.
Circuit Diagram:-
µΑ
-
+
V+
+
-
-
+
V1V2
V3
Vo
1 Meg-Ohmspot.
47 K
C1 C2
2 2
336
65 5
Theory and Assumptions:-
2
2
1
1
2
22
12
2
1
12
2
23
2
0
Cg
Cg
Cgss
VCg
CgV
CgsVs
Vmmm
mmm
++
++= (3.1)
21
210
2
20 ; CCgg
Cg
QBW mmm === ω
ω (3.2)
BT
Bmm
m
m IVIgg
CgCg
Q 19.23 2
; 2112
21 ==== (3.3)
Assumptions:- gm1 = gm2 = gm = BT
B IVI 23.19
2= , C1 = C2 = C, Q = 1
The cut-off (pole) frequency is given by:-
f0 = CI B
π223.19 = 3.062
CIB --------- ------------- (1)
The Band-width (BW) = =Q
oω 2πfo ,
HHP = HLP = HBP =HBE = 1,
MHAK / 190707

Page 7 of 15
Operating Conditions:-
For LPF:- Vi = V1, & V2 = V3 = 0
For HPF:- Vi = V3, & V2 = V1 = 0
For BPF:- Vi = V2, & V1 = V3 = 0
For BEF:- Vi = V1 = V3 , & V2 = 0
Adjustment of IB by Rx
RT = (Rx + R), where Rx = variable resistor and R = fixed resistor
RT (KΏ) 100 150 200 300 600
Total IB (µA) 150 100 75 50 25
DC Biasing Supply range = Symmetrical dual (+/- 6 to 18 ) volts
DC Biasing Supply used = Symmetrical dual (+/- 15 ) volts
Design:-
Given f0 = ------- KHz, Assume IB = ----- µA
Calculate C = ------- µF, BW = ( 874.1x10⁶ IB ) Hz ,
Test the circuit band-width for IB = 25 µA, 50 µA and 100 µA.
Observations :-
V0 = ----- mV and IB = ----- µA,
1. Readings for LPF:- Vi = 20 mV
S. No. fi
( KHz)
Vo
(mV)
Gain (A) =
Vo / Vi
1. 0.1
2. 0.2
3. 0.5
4. 1.0
5. 1.5
6. 1.9
7. 2.5
8. 3.2
9. 4.2
10. 5.0
11. 5.5
12. 7.0
2. Readings for HPF:- Vi = 20 mV
S. No.fi
( KHz)
Vo
(mV)
Gain (A)
= Vo / Vi
1. 0.1
2. 0.2
3. 0.5
4. 1.0
5. 1.5
6. 1.9
7. 2.5
8. 3.2
9. 4.2
10. 5.0
11.
Similarly take observations for BPF and Band Elimination (Notch) filters.
MHAK / 190707

Page 8 of 15
Plot the frequency response curves for LPF, HPF, BPF & BEF. Report:- 1. Derive the expressions for the operating conditions. 2. Comment on the frequency responses obtained.
Testing an OTA (CA3080)
Connect the OTA under test as shown in the following circuit diagram:-
-
+
V+
RX
R
CA3080
56
2
3
RL(10K)
47 K
1 Meg
Vi Vo
1. Apply a sinusoidal signal of amplitude 50 mVp-p and frequency 2.0 KHz at Vi.
2. Observe the output signal.
3. If it is of opposite phase of the input and its amplitude is increasing by adjusting the variable
resistance, then the OTA under test is all right.
4. If no signal is observed at the output, or the amplitude does not change by variable
resistance, then the OTA is defective.
*************
MHAK / 170707

Page 9 of 15
El 491 (Electronics Circuit Design Laboratory)
Experiment No. 04 (Precision Rectifier)
Object:- Design and experimentally verify the Full-wave and the Half-wave precision
rectifier using bi-phase amplifier. Plot the output DC voltage versus input RMS
voltage for the input signal between 0 volt and 1 volt.
Circuit Diagram:-
+
+
-
-VinRS
R1
R2
R1
RBQ
VOIC-1
IC-2
Vo = - Vin, when Q is ON,
Vo = + Vin , when Q is OFF
Typically, Vin = 0.2 Voltp-p / 1.0 KHz Sine wave.
For Half-wave rectification, replace R1 by a short-circuit between pins # 2 and 6 of the IC-1.
1. Find the minimum input signal level for proper rectification at f = 200 Hz.
2. Find the maximum signal frequency for proper rectification at Vin = 1.0 Voltp-p
3. Trace the output waveforms for half-wave and full wave rectifiers.
Components Used:- 1) Opamp 741 (IC-1 & (IC-2) 2) NPN Transistor (Q) BC 147 3) Resistors:
MHAK / 170707

Page 10 of 15
El 491 (Electronics Circuit Design Laboratory)
Experiment No. 5 (CFA) Object:- Design an all pass section using CFA (AD844) for a pole frequency ωp (= ωz) = 2 лfo
(fo = gp-no KHz). Plot the frequency response of the designed AP section (magnitude and phase of Vo2 with respect to Vi , versus frequency).
Circuit Diagram:-
Vi
2R
+
-741
2
3
6 2
3
X
Y
ZR
5 6Vo1
Vo2
R1
C1
1
AD 844
Design Equations:-
1VV
i
o1 −= , ---- ---- (1)
11
11
i
o2
1
1
VV
CRs
CRs
+
−= ---- ---- (2)
The pole frequency ωp = ωz = 11
1CR
---- ---- (3)
( R = 10 KΩ, R1 = 22 KΩ ) (Vi = 0.4 Vp-p / 1.5 KHz Sine wave may be used for initial testing of the designed circuit).
Ratings of AD844 (60 MHz, 2000 V/µs Monolithic Op Amp):- Wide-range of Biasing Power Supplies: ± 4.5 V to ± 18 V; Capable of high o/p drive of 50 mA to50 Ω; ± Low offset voltage: 150 µV; Low Quiescent current: 6.5 mA; Large BW : 60 MHz at Gain of -1;
Pin Connections:-
MHAK / 170707

Page 11 of 15
Experiment No 06 (Opamp based Multi-function filter) Object:- Analyze, design and experimentally verify the OPAMP based
multifunction filter to realize low pass, high pass, band pass and band elimination responses for given cutoff (pole) frequency fo = ….. KHz.
Circuit Diagram:-
+
-741
Vo
V2
V1
C
R1
R2
V3
Theory and Analysis:-
On analyzing the circuit, the expression for Vo can be written as:
Vo =
CRB
RRCss
CRBV
CRVsVs
221
2
23
1
22
]11[ +++
++ , ----- ----- ----- (1)
where B = unity-gain band width of the opamp.
ω0 = CR
B
2
, Q = 221
1 BCRRR
R+
Design:- Expression for fo = CR
B
221π
, ----- ----- (2)
Note:- For Opamp 741, select B in the range (0.4 – 1.5) MHz.
MHAK / 170707

Page 12 of 15
Operating Conditions:
With reference to the eqn (1) above, the circuit will be working as a multi function filter under
the following conditions:
For Low pass filter:- V1 = V2 = 0, and V3 = Vin ,
For High pass filter:- V3 = V2 = 0, and V1 = Vin ,
For Band pass filter:- V1 = V3 = 0, and V2 = Vin ,
For Band Elimination filter:- V2 = 0, and V1 = V3 = Vin ,
where 0 stands for grounded and Vin for the input signal.
Observations: Given f0 = …….. KHz Take R1 = R2 = ---- KΩ Calculate C = ----- nF, Use the nearest available value of C = -------- µF, By back calculation, f0 = Vin = -------- volts p-p
(i) Readings for low pass filter:-
S. No. Freq. of Vin (Hz) Amplitude of Vo p-p (mV) Gain, A = in
o
VV
Similarly tabulate:- (ii) Readings for high pass filter:-
(iii) Readings for band pass filter:-
(iv) Readings for band elimination filter:-
Measure f0 from the frequency-response curve.
Report:- Plot frequency response of each filter on the same semi-log graph paper and verify the
designed cutoff frequency fo . Also give your comments on the results and carry out circuit
analysis.
***************
MHAK / 170707

Page 13 of 15
APPENDIX - I
Some Common Precautions Care should be taken to observe the following Precautions while performing experiments ON
the circuits employing Electronic Devices:-
1. Before connecting the device into the circuit, always ensure that the device is perfectly
working; that is, it should have already been tested separately in its test-circuit.
2. Always connect the device/IC carefully and correctly into the circuit being assembled
on the Breadboard to avoid any loose or incorrect connection leading to the damage of
the device.
3. While connecting the device into the circuit on the breadboard, ensure that no DC
supply or signal is connected to that circuit. (Keep power supplies and signal generators
OFF).
4. When the device has been correctly connected into the circuit, only then turn ON the
DC supply and the signal generators in this order:- “Firstly turn ON the Power Supply;
then turn ON the signal generator”.
5. Don’t forget to check the output voltage of the DC power supply before connecting it to
the circuit, and adjust it to proper value conforming to the device specifications.
6. Don’t forget to adjust the amplitude of the signal to be connected to the device, to its
proper value, always below the maximum signal level specified in the device data sheet,
to avoid the consequent damage to the device already checked and found OK.
7. Take extra care while using the costly and sensitive devices like OTAs and Current
conveyers, that is, read thoroughly their specifications given in their datasheets, and
never violate any rating of the device.
8. Before replacing any device or component on the bread-board, turn-OFF the signal
generator first and then turn-OFF the power supplies connected to the circuit, and then
replace the device or component; and after replacement, switch ON the power supply
first & then switch ON the signal generator.
******************
MHAK / 170707

Page 14 of 15
APPENDIX – II Pin Connections and the Specifications of the ICs : CD 4066 and OTA CA 3080
Schematic Diagram:-
For further details, refer to the manufacturer’s Datasheet
M. Hadi Al i Khan Electronics Engineer
MHAK / 170707

Page 15 of 15
CA 3080
2MHz, Operational Transconductance Amplifier (OTA)
Take IB < 500µA & Vi < 100 mV
The CA3080 and CA3080A types have differential input and a single-ended, push-pull,
class-A output. In addition, these types have an amplifier bias input which may be used either
for gating or for linear gain control. These types also have a high output impedance and their
transconductance (gM) is directly proportional to the amplifier bias current (IABC).
The CA3080 and CA3080A types are notable for their excellent slew rate (50V/µs),
which makes them especially useful for multiplexer and fast unity-gain voltage followers. These
types are especially applicable for multiplexer applications because power is consumed only
when the devices are in the “ON” channel state.
For further details, refer to the manufacturer’s Datasheet
Compiled by:- M. Hadi Ali Khan B. Sc. Engg. (Alig.); Ex-MIEEE (USA); Ex-AMIETE (India); Ex-MSSI (India) Electronics Engineer; Department of Electronics Engineering, AMU, Aligarh – 202 002 Res:- 5-B, Zakaullah Road, Tar Bangla, AMU, Aligarh-202 002 Email:- h a d i a l i k h a n @ g m a i l . c o mPhone & Fax No:- (0571) -2721148
NB:- This laboratory manual can be downloaded from the site :- http://hadialikhan.tripod.com/lab491.pdfMHAK / 170707