multi asset study
TRANSCRIPT

Welcome to the first in a series of research papers setting out the
findings of our proprietary in-depth analysis of multi-asset portfolios.
For the first time, this analysis includes the performance of funds run
by fiduciary managers, as well as those of investment managers.
Multi Asset Study
Multi Asset Study 2
Through the series, we outline a wide range of issues investors
should consider, aiming to provide readers with a framework for
selecting and assessing multi-asset managers. We explore the
behaviour of these funds, delving beyond headline risk and return
numbers to understand “how” returns have been generated.
To set the groundwork we introduce a new way of breaking down performance in
multi-asset portfolios. This new approach allows us to identify the key drivers behind
managers’ performances and use this to re-set investor expectations for performance
going forward.
Three key questions
• Is there a “style” of multi-asset investing that works better across all
market environments?
• Do multi-asset investments provide a low governance way to quickly
capture opportunities?
• Do multi-asset investments provide any material access to the
illiquidity premium?
The most important consideration when selecting or deciding to retain an investment is
whether that investment is fulfilling the role it was chosen for in the context of the wider
strategy. This bigger-picture assessment should not be overlooked in favour of more
detailed fund analysis.
However, by using the tools and framework provided through
this series, investors will benefit from a clearer view of how a
manager fits into their strategy and when they are not fulfilling
their role. This paper focuses on the key observations and
conclusions from our work and is supplemented by a detailed
paper which goes into depth on the underlying analysis.
The detailed study explores 25 multi-asset portfolios,
including pooled “diversified growth” funds offered by
asset managers, and “central” growth portfolios offered
by fiduciary managers.
The analysis and conclusions are based primarily on
an independent, wide-ranging survey of multi-asset
providers coordinated by Barnett Waddingham. This data
goes beyond headline risk and return figures, additionally
exploring portfolio attributes such as allocations, liquidity
profile and portfolio construction considerations.

Multi Asset Study 3
Under the banner of “multi-asset strategies”, there are a
wide range of nuanced sub-strategies and different ways
of implementing and accessing returns. Where available,
performance attribution provided by multi-asset managers
can help investors understand which asset classes have
contributed to returns. However, this only answers the
superficial question, “Where was the return generated?”
A new way to think about return generation
01

Multi Asset Study 4
We want to answer a subtly different question: “How did my
manager generate returns?” For example, was it through
active decisions or general market trends? Was it because
they adopt a high risk strategy?
Whilst the universe of asset classes is seemingly ever-expanding
and increasingly complex, we believe there continue to be
the same four fundamental sources of return that have always
existed.
It is important to understand that there isn’t a one-to-one
translation from an asset class-based performance attribution to
the sources of return set out above.
For example, an equity fund could be passively
implemented, in which case this could be
categorised as “owning”. For an active fund, there
is an element of skill, often referred to as “alpha”,
which is expected to contribute to returns.
As you will see from this series, analysing returns using this
model provides us with a much clearer picture of how multi-
asset managers generate their returns, which in turn allows
us to more easily draw out key conclusions about multi-asset
investing and will enable investors to better appoint funds that fit
in with their wider portfolio.
Skill: active decisions to allocate assets in assets which then increase in
value over time
e.g. stock selection, style tilts, dynamic asset allocation,
macroeconomic positioning
Lending: money to a third party and, as compensation for associated
risk, receive interest payments over time
e.g. government bonds, corporate bonds
Structural price premia: notably illiquidity (a premium compensating
for locking up assets for an extended period of time) or complexity
(influencing demand-side pricing)
e.g. private equity, private debt
Owning: an asset that increases in value, realised upon sale of the asset
e.g. equities, property, infrastructure

Multi Asset Study 5
100%
90%
80%
70%
60%
50%
40%
30%
20%
10%
0%
20%
18%
16%
14%
12%
10%
8%
6%
4%
2%
0%
The results in a single chart: How each manager has generated returns (2019)
There is wide variation in the balance of the sources of return across providers. What’s more, there is a strong and predictable link between a manager’s style and the broad
balance observed. For example, those multi-asset managers with an “absolute return” portfolio construction approach were generally less reliant on “owning” and “lending”
sources, i.e. those whose contribution is most closely linked to market returns. This link between portfolio construction and observable results means that, in general terms,
investors can be more sure of how a manager will perform in different market conditions. For example, during rising equity markets, it is unsurprising that those with an
absolute return focus, i.e. largely reliant on skill, were amongst the lower returning strategies (i.e. those on the left hand side above).
Effective date 31 December 2019. 21 of 25 managers surveyed provided sufficient data for inclusion in this section.
Multi Asset Study 5
Private Markets
Stock selection and other skill
DAA
Credit (lending)
Diversifying markets
Equity
Total return over 2019
Only a small number of providers were able to isolate the value
added through dynamic asset allocation in a meaningful way
CO
NT
RIB
UT
ION
TO
OV
ERA
LL R
ETU
RN
AB
SOLU
TE
RET
UR
N

Multi Asset Study 6
Using the framework set out above and data provided
by the managers we start to unravel the performance of
multi-asset investments. In the first instance, we focus on
answering the following questions:
• Is there a “style” of multi-asset investing that works
better across all market environments?
• Does multi-asset investing provide a low governance
way to quickly capture opportunities?
• Does multi-asset investing provide any material access
to the illiquidity premium?
Tackling three fundamental questions
02

Multi Asset Study 7
What does a style tell us about performance?We have been advising clients on multi-asset funds for over
25 years and a conversation we return to time and time again
is whether there is a particular style of multi-asset investing
that is best.
Do dynamic funds perform better than static ones? Do funds run by fiduciary managers
perform better than those run by investment managers? Do portfolios with high
exposures to market risks perform better than those with a more absolute-return style?
The list goes on.
The short answer is, no. There is no single approach that
consistently outperforms.
The charts overleaf illustrate how the best and worst performing managers in each year
performed in the subsequent year. For example, we can see that, 38% of the managers
with top-quartile performance in 2018 generated returns in the bottom-quartile the
following year. Similarly, 25% of the worst performing managers in 2018 were
amongst the best performing managers of 2019.
As well as showing that there is not a single approach that
consistently outperforms, this analysis suggests that investors
need to be patient. One year’s “poor” performance shouldn’t
make you nervous as an investor as long as the manager has
performed in line with what you would expect given their style.

Multi Asset Study 8
38%
13%
13%
38%
75%
0%
13%
13%
25%
25%
13%
38%
25%
0%
38%
38%
2015 2016 2017 2018 2019
PERFORMANCE RESULTS OF TOP QUARTILE MANAGERS FOLLOWING EACH YEAR
Bottom Quartile
Third Quartile
Second Quartile
Top Quartile
Sources: Fund managers; Barnett Waddingham LLP
25%
0%
50%
25%
0%
25%
13%
63%
25%
25%
25%
25%
25%
50%
25%
0%
2015 2016 2017 2018 2019
PERFORMANCE RESULTS OF BOTTOM QUARTILE MANAGERS FOLLOWING EACH YEAR
Bottom Quartile
Third Quartile
Second Quartile
Top Quartile
Sources: Fund managers; Barnett Waddingham LLP
Multi Asset Study 9
9%
8%
7%
6%
5%
4%
3%
2%
1%
0%
0% 10% 20% 30% 40% 50% 60% 70% 80%
Ret
urn
ove
r th
ree
year
s to
31
Dec
emb
er 2
019
(% p
.a.)
Average equity allocation over three years to 31 December 2019
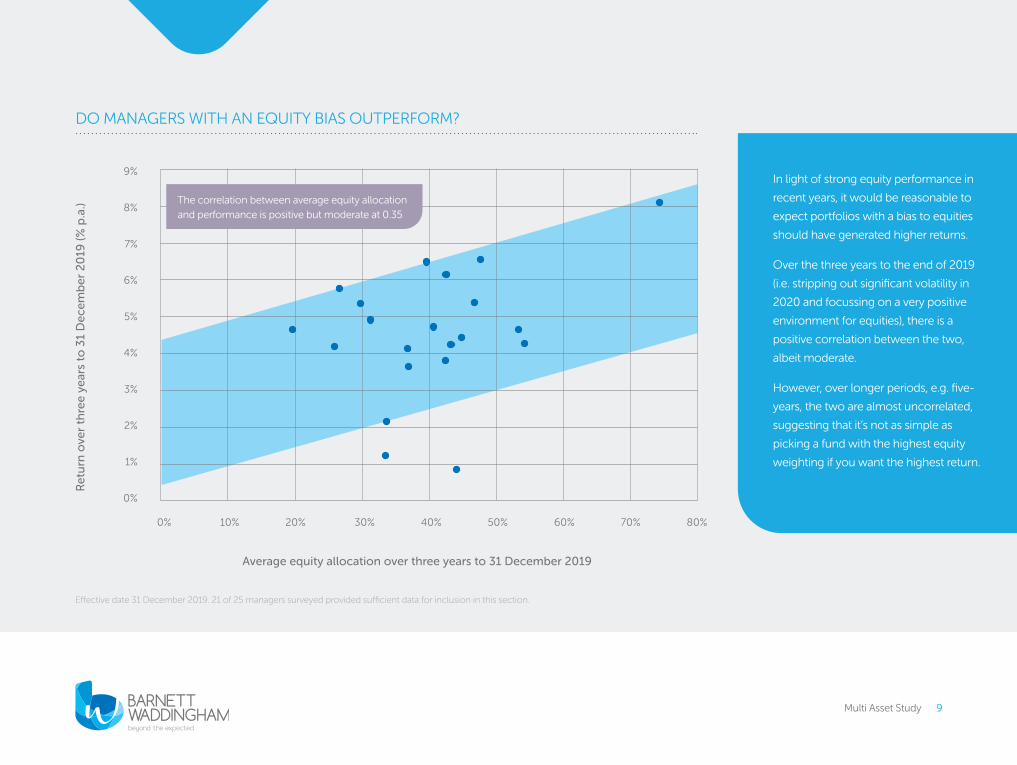
Effective date 31 December 2019. 21 of 25 managers surveyed provided sufficient data for inclusion in this section.
In light of strong equity performance in
recent years, it would be reasonable to
expect portfolios with a bias to equities
should have generated higher returns.
Over the three years to the end of 2019
(i.e. stripping out significant volatility in
2020 and focussing on a very positive
environment for equities), there is a
positive correlation between the two,
albeit moderate.
However, over longer periods, e.g. five-
years, the two are almost uncorrelated,
suggesting that it’s not as simple as
picking a fund with the highest equity
weighting if you want the highest return.
DO MANAGERS WITH AN EQUITY BIAS OUTPERFORM?
The correlation between average equity allocation
and performance is positive but moderate at 0.35

Multi Asset Study 10
The analysis broadly supports what we instinctively expected,
that the best style varies with market conditions. For example:
Crucially, we did not find one provider observably changed their
approach to perform strongly across all market environments.
This is perhaps the most important point in this paper: Multi-
asset managers will very rarely deviate from their DNA and so in
selecting the manager you are choosing your source of returns.
We do not think this is a bad thing – managers should stick to
where they feel they have a competitive advantage. However,
it means it is vital for investors to fully understand the DNA
of the multi-asset manager they are investing in and, if using
this manager as a subset of their portfolio, whether this DNA
complements the rest of the portfolio.
“This is perhaps the most important
point in this paper: Multi-asset
managers will very rarely deviate
from their DNA and so in selecting
the manager you are choosing
your source of returns.”
When market returns are strongly
positive, the opportunity to add
significant value from “skill” is
materially lessened…
In contrast, when market returns are
strongly negative, those with higher
reliance on skill typically have lower
levels of market exposure…
In volatile markets, there is more
potential to add value through skill
(e.g. stock picking or dynamic asset
allocation) and the contribution of
“skill” should be expected to
be higher…
… and funds with higher market
exposures (i.e. “owning” and
“lending”) tend to perform better
… and funds with lower reliance
on owning or lending are better
protected from falling prices
in general
… but whether this contribution
is positive or negative in absolute
terms is difficult to generalise
and results vary on a fund-by-
fund basis

Multi Asset Study 11Multi Asset Study 11
WHAT DOES IT MEAN TO BE DYNAMIC?
Effective date 31 December 2019. 19 of 25 managers surveyed provided sufficient data for inclusion in this section.
60%
50%
40%
30%
20%
10%
0%
60%
50%
40%
30%
20%
10%
0%
Average
AverageAverage allocation to equities over 5 years
Average allocation to fixed income over 5 years
1The majority of managers chose “2-5 year” when asked for the time horizon over
which top-level asset allocation decisions are made.
For many multi-asset managers, being dynamic does
not mean taking advantage of short-term opportunities
in the way that we discuss in the next section. Instead, it
means adjusting the portfolio to reflect their outlooks for
the various asset classes over the medium-term (usually
around three years)1.
The chart to the left shows the minimum, maximum and
average allocation to equities and fixed income of each
manager over the last five years.
It shows that in some cases managers have used the
freedoms within their mandates to make significant
alterations to the composition of their portfolios.
We suggest investors:
Check your definition of dynamic matches that of
your manager(s)
Understand how “dynamic” your manager’s
allocation has been based on the manager’s
definition and, crucially, why (there may be a
good reason for a static allocation)
How comfortable are you with how active the manager
has been in changing the allocation and their explanation
for this?

Multi Asset Study 12
Capturing opportunitiesMany multi-asset managers have the freedom to invest
across a plethora of asset classes ranging from traditional
assets, like listed equities and bonds, to very niche investment
ideas. Across the 25 providers surveyed, over 250 distinct
asset class names and labels were cited by the managers.
Often, this leads to an assumption that the managers will make use of this freedom to
change the composition of the portfolio frequently as opportunities arise. For many
investors, this expectation that the manager will be able to move quickly to capture
opportunities is a key reason for investing in a multi-asset portfolio, as most trustee
boards believe they do not have the expertise or time to do this themselves.
As the chart on page 5 illustrates, our analysis of how managers generated their returns
showed that there were very few managers where dynamic asset allocation made a
material contribution to performance.
However, perhaps even more importantly, we found it very hard to extract exactly
how dynamic managers are and, crucially, how much that dynamism adds to returns,
from the data provided. In fact, managers themselves were rarely able to answer these
questions. This raises an issue for investors: if you are going to invest in a portfolio that
professes to generate returns primarily through dynamic asset allocation, how do you
monitor this and assess manager performance if they can’t do that?
As investors, when deciding how much to allocate to a fund that
claims to be dynamic, you need to ask yourself the following,
“How comfortable are you with not being able to assess the
contribution this makes to the level of return?” and potentially
taper your allocation accordingly. The reliance on manager
skill – of which dynamic asset allocation is one part – should be
considered at a whole portfolio level.
How comfortable are you, given the make up of the rest of
your portfolio, to accept that the value of this element
cannot be assessed?
How much of the manager’s performance is attributable
to manager skill?
How dynamic does the manager claim to be?
Can they offer recent examples of dynamic trades?
How good at it are they? Can they provide a list of
short-term trades that have done well or badly

Multi Asset Study 13
A key takeaway from the last two sections is that
once you understand the nature of your multi-
asset investment, there aren’t too many surprises
with regard to how each of the providers’ returns
have been generated, at least relative to their
peers. From this, you can extrapolate how your
chosen fund might be expected to perform in
different economic scenarios.
This is crucial in assessing their continued
and ongoing value within a portfolio. Poor
performance by itself is rarely a good reason for
changing investments, but poor performance
relative to expectations, can be a leading indicator
of difficulties ahead.
Key Takeaway

Multi Asset Study 14
Across the multi-asset portfolios surveyed, the average allocation to assets with less than
annual liquidity was less than 3% in the years 2014-2019. However there was significant
variation between managers, with the maximum allocation to these assets being 31%
and the minimum 0%.
Illiquidity in multi-asset portfoliosThe final question we address is the extent to which multi-asset
portfolios generate returns through an illiquidity premium.
The vast majority of our clients, DB and DC pension funds,
endowments and charities, have a long time horizon and can
therefore allocate assets to illiquid investments. Do multi-asset
portfolios provide an effective way to access such investments?
Do such funds have a meaningful exposure? How much has this
contributed to returns?
As shown by the chart to the right, multi-asset managers
generate only a very small amount of their returns from the
illiquidity premium. In fact, only 3 managers across the 25
managers we surveyed generated more than 5% of their returns
through an illiquidity premium.
The lesson for investors here is, if you believe in the illiquidity
premium and want to access it, you should not assume a single
multi-asset portfolio will do this for you. Instead, you may need
to consider a specific allocation to illiquid assets. This may be
through a specialist fund or, if you are pursuing the fiduciary
route, ensuring this is built into scheme-specific mandate
parameters, which is likely to be outside their core offering.
There isn’t necessarily a single off-the-shelf solution. This is vital
for an investor tasked with building an investment portfolio.
100%
90%
80%
70%
60%
50%
40%
30%
20%
10%
0%
LIQUIDITY IN CORE MULTI-ASSET PORTFOLIOS
2014 2015 2016 2017 2018 2019
>3 year lock-up
>1-3 year lock-up Quarterly
Annual Monthly
Weekly

Multi Asset Study 15
Performance versus
targets versus expectations
In the early days of diversified growth funds, many investors invested on
the understanding that these funds would generate equity-like returns
with significantly lower volatility. Given the runaway performance of
equities in what was the longest equity bull-run in recent history, this
expectation left many investors disappointed with their multi-asset
allocations over the decade to 31 December 2019. But how has the
performance of these funds compared to their actual stated targets?
The chart to the left illustrates the returns produced by a range of DGFs
and FM growth portfolios over the five years to the end of 2019,
highlighting whether they have out, or underperformed their
individually stated targets.
Why does this matter? Whilst this may not do much to ease the
frustrations of investors that have missed out on equity-like performance
over the last five years, it should help investors assessing whether there
continues to be a role for multi-asset investments going forward. We take
from this that these portfolios are not a replacement for equities – and
will not keep pace with equities when equities are outperforming almost
everybody’s expectations but, on the whole, you should expect them to
meet their stated targets. Once again, the key is to know what to expect
from your multi-asset allocation – both in terms of the level of return and
how they will generate it – so that there are no surprises.
0% 1% 2% 3% 4% 5% 6% 7% 8% 9%
Outperforming (against individually stated benchmark)
Absolute return (5 yrs to 31 December 2019), % p.a.
Underperforming (against individually stated benchmark)
Benchmark performance
Effective date 31 December 2019. 24 of 25 managers surveyed provided
sufficient data for inclusion in this section.
Multi Asset Study 15

By using this new framework to analyse how multi-
asset managers have generated returns, we are able
to draw the following conclusions.
We encourage investors to apply this framework in
assessing the how their multi-asset managers fit into
their overall strategy and whether their managers are
successfully fulfilling that role.
Conclusion
Multi-asset investing has a place but investors should
understand how a manager generates returns and establish
their expectations around that. Whilst they, may all carry one
label, there is a significant variation in how the managers
generate returns. Managers rarely deviate from their chosen
style. Therefore, when selecting a manager you, the investor,
are choosing your sources of returns.
01
There is not one style that is likely to systematically
outperform. By understanding the return drivers underlying
the manager’s portfolios, investors will understand when
the managers can be expected to perform well and when
the fund may encounter problems. Be patient and don’t be
surprised when managers then perform in line with
these expectations.
02
Whichever options you chose, it is unlikely to provide you
with meaningful exposure to the illiquidity premium. If you
believe that this is something that can add value, you
need to get it elsewhere.
03
Multi Asset Study 16

Multi Asset Study 17Multi Asset Study 17
We found that only a few multi-asset managers were
able to quantify the value added through dynamic
asset allocation. Where responses were received, the
methodology also varied between providers.
In our next paper, we explore the challenges of
assessing this type of skill, particularly in trying to
compare multi-asset strategies which operate in
fundamentally different ways.
What’s next
03

Please contact your Barnett Waddingham consultant if you would like to discuss any of the above topics in more detail.
Alternatively get in touch via the following:
[email protected] 0333 11 11 222
www.barnett-waddingham.co.uk
Barnett Waddingham LLP is a body corporate with members to whom we refer as “partners”. A list of members can be inspected at the registered office. Barnett Waddingham LLP (OC307678), BW SIPP LLP (OC322417), and Barnett Waddingham Actuaries and Consultants Limited (06498431) are registered in England and Wales with their registered office at 2 London Wall Place, London, EC2Y 5AU. Barnett Waddingham LLP is authorised and regulated by the Financial Conduct Authority. BW SIPP LLP is authorised and regulated by the Financial Conduct Authority. Barnett Waddingham Actuaries and Consultants Limited is licensed by the Institute and Faculty of Actuaries in respect of a range of investment business activities.
Multi Asset Study 186007245
SARAH LOCHLUNDPrincipal and Senior
Investment Consultant
DAN WOODER Associate and Investment Consultant