multi criteria site selection and assessment of ports in
TRANSCRIPT
Abstract—Coastal zones represent vital international issues
for environmental and sustainable development. Most coastal
developing countries mainly depend on the limited coastal
resources for their economic development. The promising
region of the Northwestern coast of Egypt has attracted massive
investments. The main objectives of this present research are:
selection of most suitable sites for constructing ports in this area
based on a number of environmental criteria and to assess the
suitability of the proposed site. Factors used in this study
include natural land/marine hazards/factors man-made
facilities. Materials used include: multispectral satellite images,
digital elevation models, topographic maps, Admiral marine
maps, in addition to field survey of the sea depth. Spatial
modeling is performed using the spatial analyst module for port
site selection and assessment. A total of 62 locations are
identified and classified as suitable for positioning a port. All
identified areas extend from west of Marsa Matrouh to East of
Negeila and record a suitability values from (Good) to
unsuitable.
Index Terms—Site selection, ports, northwestern coast of
Egypt, remote sensing and GIS, land criteria, offshore/inshore
criteria.
I. INTRODUCTION
More than 95% of Egypt’s population and most of its
agricultural lands are mainly concentrated in less than 5% of
Egypt’s land, along the banks of the Nile River and its delta.
On the other hand, the northwestern coast of Egypt extends
over 520 km from the border of Libya from the west to the
city of Alexandria from the east. A great attention is directed
to this area, as one of the promising areas for future
expansion. It is under severe pressure due high rates of
urbanization, tourism, agriculture, and resource extraction.
All these activities have led to negative environmental
impacts including; accelerated erosion, marine life
destruction, and decrease of biodiversity. Impacts from the
predicted climatic changes represent another threat to the
coastal ecosystems [1]. The land - sea interface is that part of land affected by its
proximity to the sea and vice versa. The coastal area is
defined as the border area between land and sea, which can
Manuscript received May 25, 2019; revised July 23, 2019. This work was
supported by Engineering Applications and Marine Sciences Department,
National Authority for Remote Sensing and Space Sciences (NARSS).
Salwa F. Elbeih and Wael Attia are with Engineering Applications
Department, National Authority for Remote Sensing and Space Sciences,
Egypt (e-mail: [email protected], [email protected],
Sameh B. Elkafrawy is with Marine Sciences Department, National
Authority for Remote Sensing and Space Sciences, Egypt (e-mail:
[email protected]; [email protected]).
extend in the land and in the direction of the sea to a varying
extent based on the objectives and needs of different
development programs. The main uses of the coastal zone
include coastal engineering installations such as ports and
maritime transport (oil and gas, cargo and unloading of
goods). The coastal studies of the Egyptian Northwestern
Coast have become an urgent need to select the appropriate
location for constructing new ports. These studies aim to
avoid consequent beaches erosion and the transfer of
sediments to other places to drown in the shipping lanes of
the ports. Ports are the main ring in the series of multimodal
transport, as they are the contact point between land and sea.
On the seaside, there is a continuous movement of vessels
arriving and leaving the port carrying miscellaneous goods.
On the other hand, on the landside, there is movement of
goods transportation to and from the port by various ways as
roads or railways.
Ports are classified according to their location or function
[2]. According to their location, ports are classified as sea
ports, inland ports or mixed sea inland ports. For sea ports,
they are located in artificially or naturally protected coastal
areas, in bays… etc. According to their function, ports are
commercial, military, fishing ports… etc. In large
commercial ports, shipyards usually offer all kinds of basic
ship repair and maintenance services. Port capacity and
effectiveness of its operations is governed by several
environmental conditions such as wind, waves, swells, tides,
fog, storms, ..etc).
Port sites are constrained by different factors including;
Maritime access, referring to the site physical capacity to
accommodate ship operations; Maritime interface: Indicating
amount of space available to support maritime access (in
other words amount of shoreline with a good maritime
access); Infrastructures and equipment where the site, to be
efficiently used, must have infrastructures such as piers,
basins, stacking or storage areas, warehouses, and equipment
such as cranes; Land access: Access from the port to
industrial complexes and markets to insure its growth and
importance [3].
When selecting a port location, there are several important
points associated with the sea and the land that must be
addressed. For the seaside, these points represent the port site
with respect to: maritime navigation, competitive ports in the
region, the effect of waves’ movement, marine currents and
the effect of deposition near the coastal region. While on the
landside, a number of criteria have to be considered;
availability of land area (Backside land) behind the port for
various services, and the port location with respect to roads
network and railways and the accessibility to port.
Multi-criteria Site Selection and Assessment of Ports in the
Northwestern Coast of Egypt: A Remote Sensing and GIS
Approach
Salwa F. Elbeih, Sameh B. Elkafrawy, and Wael Attia
International Journal of Environmental Science and Development, Vol. 10, No. 10, October 2019
310doi: 10.18178/ijesd.2019.10.10.1192

For marine and coastal environment studies, satellite and
airborne remote sensing play a main role [4]. In 2015, [5]
designed a spatial multi-criteria evaluation (SMCE) model
for identifying suitable areas for siting offshore medium size
fish farms in the Italian Ligurian Sea. More than 9000 ha
were identified with about 40% of this area with high
suitability values. Unsuitable areas were discriminated from
the suitable ones based on several factors. Sixty five suitable
areas were identified from the SMCE for installing offshore
fish farms distributed along the Ligurian coast, with some
exceptions. An integrated multi-criteria decision-making
model was proposed [6] for developing a deep-water sea port
in the Klaipeda region considering the economic needs. A
combination of Analytic Hierarchy (AHP) and Fuzzy Ratio
Assessment (ARAS-F) methods were used to design the
model. The model is presented as a form of decision aiding to
be implemented for any specific port or a similar site
selection.
The main objectives of the present research are to: define
the most suitable site/sites for constructing Matrouh Port
based on: the guidelines for development of ports, harbors
and marinas [7] and assess the proposed / planned site.
II. MATERIALS AND METHODS
A. Study Area Description
The Northwestern coast development project is one of the
three main national development projects in Egypt for Urban
Development in 2052. The New Suez Canal is the first one is
and the second one is the Golden Triangle for mining in the
Eastern Desert. The selected area for investigation is a long,
relatively narrow strip of land and sea extending 7.0 km from
the coast line in the inshore area of the Mediterranean Sea. It
extends towards the south inland until the international
coastal road. From the east, it starts from west of Marsa
Matrouh city (a city for recreational and touristic activities)
and in the west, extends to a distance of about 30 km from
one of the planned sites for the port (Fig. 1). The investigated
area occupies an area of about 1165 km2. A commercial sea
port is planned to be established in El-Negeila area including
maritime berths, industrial zones, commercial areas and other
areas on an area of about 2395 acres in the outskirts of the
city of Sidi Barani, 110 km west of Marsa Matrouh city with
an investment cost estimated to be 1.6 billion Euros.
Fig. 1. Location map of the study area.
B. Data and Methods Applied
To fulfill the requirements of the present study, various
sources of data have been collected, processed, analysed and
integrated into a GIS database followed by the methodology
applied for Geo-environmental research. These datasets
include:
1) Satellite remote sensing data
Multispectral Landsat TM, ETM and OLI images were
used for:
1) Delineating land use /cover classes: Two main land
cover classes, urban and cultivated areas, were
delineated from a Landsat OLI satellite image dated
2nd of February 2018 (Fig. 2A). The Normalized
Difference Vegetation Index (NDVI) was the used
method for extracting cultivated areas using the
well-known Equation 1. The output of the
classification was enhanced using Google Earth
images for small cultivated areas. For urban areas,
on-screen digitizing was used and the output was
enhanced from Sentinel-2 and Google Earth images.
𝑁𝐷𝑉𝐼 =(ρ𝑁𝐼𝑅−ρ𝑅𝑒𝑑)
(ρ𝑅𝑒𝑑+ρ𝑁𝐼𝑅) (1)
where: ρNIR is the Reflectance in the near infrared band and
ρRed is the Reflectance in the red band. The value of this
index ranges from -1.0 to 1.0 with the common range for
green vegetation of 0.2 to 0.8.
2) Defining the shore line: The Normalized Difference
Water Index (NDWI) is the used water index for
coastline extraction and is a non-linear conversion of
both green and near-infrared bands of the Landsat
satellite image [8]. Water feature reflects the green
band radiation and absorbs in NIR band [9]. NDWI
was defined using Equation 2.
𝑁𝐷𝑊𝐼 =(ρ𝐺𝑟𝑒𝑒𝑛−ρ𝑁𝐼𝑅)
(ρ𝐺𝑟𝑒𝑒𝑛+ρ𝑁𝐼𝑅) (2)
where: ρGreen and ρNIR are the reflectance value of Green
and NIR band of Landsat image [8]. NDWI image was
produced and a threshold value is needed to divide the image
into two classes; land and water body using the methodology
shown in Fig. 3. The exact shoreline location is shown in Fig.
2B.
3) Extracting beach characteristics: In this study, the
main surveying devices was high-resolution satellite
images integrated with in situ survey. Beach
characteristics were extracted from a Landsat 8
satellite image and validated using field investigation.
The extracted units included: beach sand, sand dunes,
rock area, bare land and sabkhas. Sabkhas are given a
minimum weight and sand dunes lie away from the
coastal area.
4) Erosion / Accretion rates: DSAS (Digital Shoreline
Analysis System) was used as a GIS tool to examine
past and /or present shoreline positions. Using DSAS
in coastal change analysis is useful in computing the
rates of change for successive shoreline positions.
The end point rate (EPR) is calculated by dividing the
International Journal of Environmental Science and Development, Vol. 10, No. 10, October 2019
311
distance of shoreline movement by the time elapsed
between the oldest and the most recent shoreline [10],
[11]. Erosion and accretion rates are shown in Fig.
2B.
Sentinel-2: A Sentinel-2 image with a spatial resolution
of 10 m, acquired in January 2018, was used for:
1) Defining boundaries of urban areas using on-screen
digitizing (Fig. 2A).
2) Updating and enhancing the roads network of the
study area(Fig. 2D)
Shuttle Radar Topography Mission (SRTM) with a 30
m spatial resolution: SRTM data obtains elevation data to
generate high-resolution digital topographic database of
the earth. The data was processed and classified and was
used for:
1) Defining areas possible to get submerged by a 1.0 m
sea level rise (SLR). Using the raster calculator tool
(included in ArcGIS 10.1), areas with sub meter
elevation were extracted delineating areas under SLR
threats (Fig. 2C).
2) Flash flood analysis by studying the main drainage
basins and evaluating the flood hazards at certain
pour points along the international coastal road. The
major factors influencing the runoff volume and
associated peak discharge were described [12];
rainfall duration and intensity, soil types, type of
natural or manmade cover on soil, and time of
concentration.
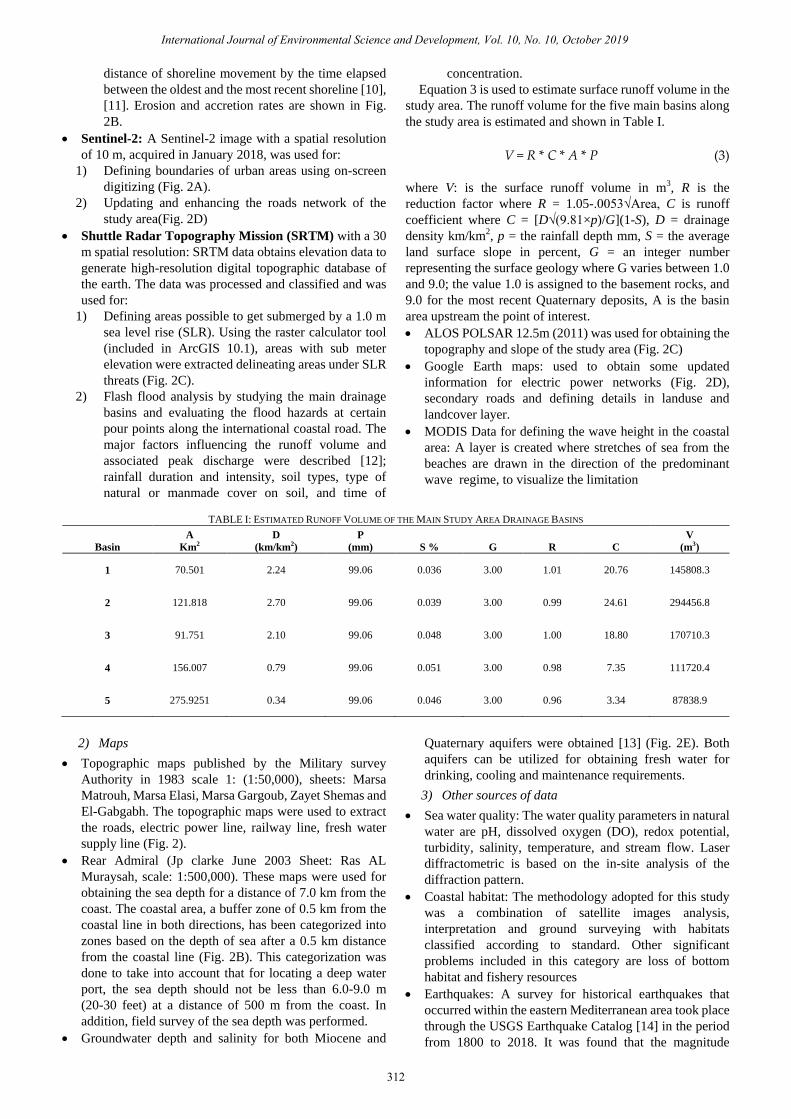
Equation 3 is used to estimate surface runoff volume in the
study area. The runoff volume for the five main basins along
the study area is estimated and shown in Table I.
V = R * C * A * P (3)
where V: is the surface runoff volume in m3, R is the
reduction factor where R = 1.05-.0053√Area, C is runoff
coefficient where C = [D√(9.81×p)/G](1-S), D = drainage
density km/km2, p = the rainfall depth mm, S = the average
land surface slope in percent, G = an integer number
representing the surface geology where G varies between 1.0
and 9.0; the value 1.0 is assigned to the basement rocks, and
9.0 for the most recent Quaternary deposits, A is the basin
area upstream the point of interest.
ALOS POLSAR 12.5m (2011) was used for obtaining the
topography and slope of the study area (Fig. 2C)
Google Earth maps: used to obtain some updated
information for electric power networks (Fig. 2D),
secondary roads and defining details in landuse and
landcover layer.
MODIS Data for defining the wave height in the coastal
area: A layer is created where stretches of sea from the
beaches are drawn in the direction of the predominant
wave regime, to visualize the limitation
TABLE I: ESTIMATED RUNOFF VOLUME OF THE MAIN STUDY AREA DRAINAGE BASINS
Basin
A
Km2
D
(km/km2)
P
(mm) S % G R C
V
(m3)
1 70.501 2.24 99.06 0.036 3.00 1.01 20.76 145808.3
2 121.818 2.70 99.06 0.039 3.00 0.99 24.61 294456.8
3 91.751 2.10 99.06 0.048 3.00 1.00 18.80 170710.3
4 156.007 0.79 99.06 0.051 3.00 0.98 7.35 111720.4
5 275.9251 0.34 99.06 0.046 3.00 0.96 3.34 87838.9
2) Maps
Topographic maps published by the Military survey
Authority in 1983 scale 1: (1:50,000), sheets: Marsa
Matrouh, Marsa Elasi, Marsa Gargoub, Zayet Shemas and
El-Gabgabh. The topographic maps were used to extract
the roads, electric power line, railway line, fresh water
supply line (Fig. 2).
Rear Admiral (Jp clarke June 2003 Sheet: Ras AL
Muraysah, scale: 1:500,000). These maps were used for
obtaining the sea depth for a distance of 7.0 km from the
coast. The coastal area, a buffer zone of 0.5 km from the
coastal line in both directions, has been categorized into
zones based on the depth of sea after a 0.5 km distance
from the coastal line (Fig. 2B). This categorization was
done to take into account that for locating a deep water
port, the sea depth should not be less than 6.0-9.0 m
(20-30 feet) at a distance of 500 m from the coast. In
addition, field survey of the sea depth was performed.
Groundwater depth and salinity for both Miocene and
Quaternary aquifers were obtained [13] (Fig. 2E). Both
aquifers can be utilized for obtaining fresh water for
drinking, cooling and maintenance requirements.
3) Other sources of data
Sea water quality: The water quality parameters in natural
water are pH, dissolved oxygen (DO), redox potential,
turbidity, salinity, temperature, and stream flow. Laser
diffractometric is based on the in-site analysis of the
diffraction pattern.
Coastal habitat: The methodology adopted for this study
was a combination of satellite images analysis,
interpretation and ground surveying with habitats
classified according to standard. Other significant
problems included in this category are loss of bottom
habitat and fishery resources
Earthquakes: A survey for historical earthquakes that
occurred within the eastern Mediterranean area took place
through the USGS Earthquake Catalog [14] in the period
from 1800 to 2018. It was found that the magnitude
International Journal of Environmental Science and Development, Vol. 10, No. 10, October 2019
312

ranged between 3.8 in 2015 (74km NNW of Rosetta) and
6.2 in 1955 (Eastern Mediterranean Sea). All surveyed
points are located outside of the study area extent.
A) B)
C) D)
E)
Fig. 2. Summary for model input layers (land and marine criteria); A) Landcover (cultivated and urban areas); B) Slope of the study area and areas expected to
be submerged due 1.0 m to SLR; C) Infrastructures; D) Erosion/accretion rates, coastal line and sea depth; E) Lithological layers and groundwater
characteristics for Miocene and Quaternary aquifers.
Fig. 3 Shore line extraction using NDWI.
C. SMCE for Site Selection of a Marine Sea Port
A SMCE model has been developed to define best
locations for a marine port along the northwestern coast of
Egypt. The procedure considers three main factors; marine
(inshore/offshore), land (terrestrial) and infrastructures. Six
steps have been implemented in the SMCE procedure as
follows: 1) factors and hazards affecting the suitability of a
site for the port; 2) data elaborated within a GIS platform for
obtaining criteria and constraints maps; 3) a model designed
to produce the suitability map for a suitable port site taking
into account marine factors; 4) a second model designed to
produce the suitability map for a suitable port site taking into
account land and infrastructures factors; 5) the final
suitability map is obtained from the first and second models;
6) The procedure was verified by comparing identified
suitable sites with the already planned port location.
Two key MCE methods are employed and used for
suitability analysis using GIS; weighted linear combination
(WLC) (weighted overlay) [15]-[20] and the simple Boolean
method. Constraints and criterion maps are obtained using
International Journal of Environmental Science and Development, Vol. 10, No. 10, October 2019
313
the Boolean overlay in which factors are combined by logical;
intersection and union operators. A common numeric range is
used to standardize the criterion maps. These maps are then
weighted and combined by WLC, masked by Boolean
constraints map, into an overall layer to produce the final
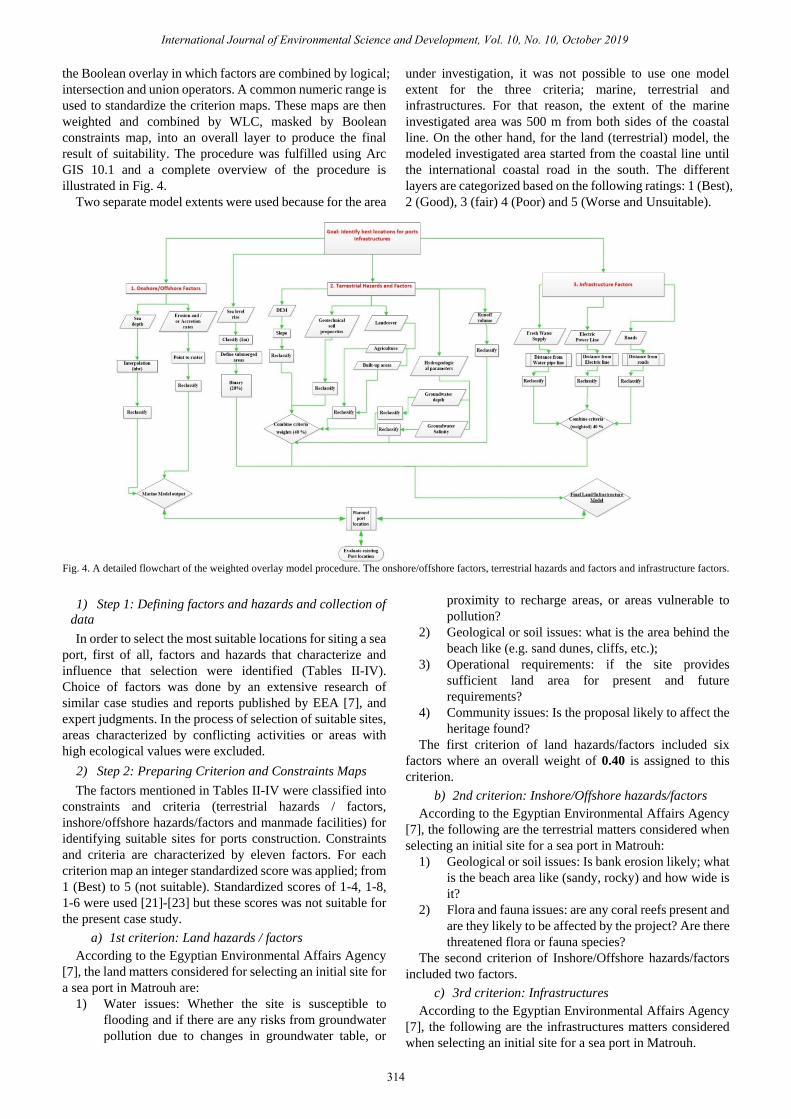
result of suitability. The procedure was fulfilled using Arc
GIS 10.1 and a complete overview of the procedure is
illustrated in Fig. 4.
Two separate model extents were used because for the area
under investigation, it was not possible to use one model
extent for the three criteria; marine, terrestrial and
infrastructures. For that reason, the extent of the marine
investigated area was 500 m from both sides of the coastal
line. On the other hand, for the land (terrestrial) model, the
modeled investigated area started from the coastal line until
the international coastal road in the south. The different
layers are categorized based on the following ratings: 1 (Best),
2 (Good), 3 (fair) 4 (Poor) and 5 (Worse and Unsuitable).
Fig. 4. A detailed flowchart of the weighted overlay model procedure. The onshore/offshore factors, terrestrial hazards and factors and infrastructure factors.
1) Step 1: Defining factors and hazards and collection of
data
In order to select the most suitable locations for siting a sea
port, first of all, factors and hazards that characterize and
influence that selection were identified (Tables II-IV).
Choice of factors was done by an extensive research of
similar case studies and reports published by EEA [7], and
expert judgments. In the process of selection of suitable sites,
areas characterized by conflicting activities or areas with
high ecological values were excluded.
2) Step 2: Preparing Criterion and Constraints Maps
The factors mentioned in Tables II-IV were classified into
constraints and criteria (terrestrial hazards / factors,
inshore/offshore hazards/factors and manmade facilities) for
identifying suitable sites for ports construction. Constraints
and criteria are characterized by eleven factors. For each
criterion map an integer standardized score was applied; from
1 (Best) to 5 (not suitable). Standardized scores of 1-4, 1-8,
1-6 were used [21]-[23] but these scores was not suitable for
the present case study.
a) 1st criterion: Land hazards / factors
According to the Egyptian Environmental Affairs Agency
[7], the land matters considered for selecting an initial site for
a sea port in Matrouh are:
1) Water issues: Whether the site is susceptible to
flooding and if there are any risks from groundwater
pollution due to changes in groundwater table, or
proximity to recharge areas, or areas vulnerable to
pollution?
2) Geological or soil issues: what is the area behind the
beach like (e.g. sand dunes, cliffs, etc.);
3) Operational requirements: if the site provides
sufficient land area for present and future
requirements?
4) Community issues: Is the proposal likely to affect the
heritage found?
The first criterion of land hazards/factors included six
factors where an overall weight of 0.40 is assigned to this
criterion.
b) 2nd criterion: Inshore/Offshore hazards/factors
According to the Egyptian Environmental Affairs Agency
[7], the following are the terrestrial matters considered when
selecting an initial site for a sea port in Matrouh:
1) Geological or soil issues: Is bank erosion likely; what
is the beach area like (sandy, rocky) and how wide is
it?
2) Flora and fauna issues: are any coral reefs present and
are they likely to be affected by the project? Are there
threatened flora or fauna species?
The second criterion of Inshore/Offshore hazards/factors
included two factors.
c) 3rd criterion: Infrastructures
According to the Egyptian Environmental Affairs Agency
[7], the following are the infrastructures matters considered
when selecting an initial site for a sea port in Matrouh.
International Journal of Environmental Science and Development, Vol. 10, No. 10, October 2019
314
1) Water issues: What is the source of fresh water
supply?
2) Operational requirements: Can services be efficiently
supplied to the site (water, eclectic power) and are
there any nearby services?
3) Transport issues: Can the capacity of the road
network accommodate traffic likely to be generated
by the port?
The third criterion of manmade facilities included four
factors as shown in
TABLE . The Euclidean distance spatial analyst tool was
used for obtaining three raster layers for roads, electricity line
and fresh water pipelines as shown in Fig. 5A. A weight of
0.40 is assigned to this criteria based on a fact that
infrastructures can be changed and updated based on the
required conditions and status available in the site.
The first and third criteria are modeled together in one
single model with an extent different from that of the second
criterion as described in section 2.3.
d) Constraints map
Constraints of the study area include all conditions and
factors that make an area not suitable for siting a port. So,
their mapping allows removing all unsuitable locations and
hence helps to avoid conflicts in decision-making:
unavailable sites or not completely suitable for ports
constructions are excluded. Constraints include: natural
protected areas, areas with optimum coastal habitat, areas
intersecting with gas and petroleum concession areas.
Constraints also include areas with unsuitable sea
morphology (depth less than 6.0 m after 500 m from the
coast). Excluded areas also include those with
erosion/accretion rates greater than 1.5 cm/year and all areas
subjected to be submerged due to SLR of 1.0m. Areas
submerged due to 1.0 m SLR are located in the east and
middle of the study area with a total area of about 1.5 km2.
All areas that are unsuitable for at least one criterion were
included in the constraints map (Fig. 5d). Boolean union was
used for obtaining the constraints map and is used as an
inverse mask for obtaining suitability map, so as to reduce the
raster computations. A weight of 0.2 was assigned to areas
exposed to 1.0 m SLR and these areas were restricted in the
model.
3) Step 3: Design and output of the Inshore/offshore
model
The Inshore/offshore model is designed to include two
main layers; depth of sea and erosion / accretion rates. To
elaborate both layers in the model, a different special extent
inside the study area was prepared. This extent is 0.5 km
buffer zone from both sides of the coastal line. The depth of
the sea at 0.5 km from the coast was interpolated in the 0.5
km buffer zone so that the depth of 0-6.0 m is given a rate of 4
(unsuitable), 6-9 m given a rate of 3, 9-20 m given a rate of 2,
and > 20 m given a rate of 1 (Best) as show in Table IV. A
similar categorization was applied for erosion/accretion rates.
The points when erosion / accretion rates were estimated
were converted to a raster file within the same extent.
Erosion/accretion rates were categorized as shown in Table
IV as: - 0.5- 0.5 cm/year (stable and rated 1),-0.5- -1.50
cm/year (high accretion and rated 2), 0.5-1.50 cm/year (high
erosion and rated 3) and >1.50 cm/year (extremely high
erosion and rated 5).
A weighted multicriteria overlay model is designed for the
two factors with an influence of 50% for each one of them.
The equal influence was set because both factors are with the
same degree of importance and are dynamic natural factors
that cannot be stopped or reduced unless there are other
external precautions taken into consideration.
4) Step 4: Design and output of land and infrastructure
model
Land and infrastructures model is designed to include
layers from both factors together (Tables II and III). Land and
infrastructures have the same extent; from the coastal line
southwards until the international coastal road. In addition to
these two main factors, SLR was included as a third factor
with same extent. First of all, areas liable to be submerged by
a 1.0 m SLR were extracted and were categorized by Binary
overlay (0 or 1).
The straight rank-sum method was applied for obtaining
the criteria weights of the land/terrestrial factors. The rank
sum method was described [24] and has been used in a
number of GIS-multi-criteria decision analysis (MCDA)
applications [25]. The first priority rank was assigned to the
Runoff volume class, second priority rank assigned to Slope,
the third priority rank assigned to the Land cover, the fourth
priority rank assigned to Soil, the fifth priority rank assigned
to GW Depth and the sixth priority rank assigned to GW
salinity. The method was used for weight assignment using
Equation 4 [24].
wj = (n − rj + 1∕SUM (n − rk + 1) (4)
where wj is the normalized weight for the j th factor, n is the
number of factors, rj is the rank position of the factor. Rk is
the factor number. Table V, Table VI and Table VII show the
weights for infrastructures, terrestrial and marine factors.
5) Step 5: Final Suitability Map
The final suitability map is obtained from the first and
second models. After setting the mask from constraints map,
criteria map are joined using judgment from experts,
representing the weights assigned to each criterion, using a
weighted linear combination (WLC), obtaining a final output
from suitable locations for a port location. WLC is one of the
most used decision methods in GIS [5], [16], [23], [26], [27].
In this study raster format was the main used format for the
analysis (even vector format data was converted to raster)
because it is easier to implement and better supported by Arc
GIS. Hence, criterion and constraints maps were created in a
vector format then converted to raster, using a unified spatial
resolution of 50 m (the best spatial resolution to give
optimum results). The final suitability map has been obtained
using the same 50 m resolution. Each criterion and
constraints map is composed of I pixels where each pixel is
associated with an xij value (representing a standardized
score of the i–th pixel W.R.T. the j-th criterion). The
suitability of each pixel was calculated using Equation 5 [28].
Ai = ∑𝑊𝑗𝑥𝑖𝑗 (5)
where Ai is the suitability of the i-th pixel, Wj is the weight of
the j-th criterion with ∑Wj=1.
International Journal of Environmental Science and Development, Vol. 10, No. 10, October 2019
315

According to literature and national reports [29] for specs
of local ports in Egypt (ex. Alexandria, Dekheila,..), in their
current design status and future plans, a typical structure for a
sea port is considered as follows. Its structure is composed of
two main sections; inshore/offshore and terrestrial. The
minimum distance along the coastal line is 1.4 km. For the
inshore/offshore direction, at least 0.5 km and 1.5 km for
terrestrial direction. In other words, an area of 2.1 km2 (1.5
km × 1.4 km) in the land side and 0.7 km2(0.5 km × 1.5 km)
in the inshore/offshore direction with a total area of 2.8 km2.
Consequently, in the first (marine) model, areas less than 0.7
km2 and less than 1.4 km in width are excluded from the
output. For the second (land and infrastructures model), areas
less than 2.1 km2 and less than 1.4 km in width are excluded
from the output.
6) Step 6: Verification
Model verification is a significant phase for data quality
and testing outputs of the process [30]. Verification took
place by comparing the suitable sites identified and the
positions of the planned port at Negilla.
TABLE II: LAND HAZARDS AND FACTORS, ATTRIBUTE VALUES, DESCRIPTION AND RATING
Criteria Factor Attribute values Description Rating
Terrestrial hazards / Factors (Overall Weight 40 %)
Runoff volume
(*1000 m3)
< 120 Best 1
121-150 Suitable 2
> 151 Unsuitable 3
Geotechnical Soil
properties
Cross bedded
calcarenite with
karstified columnar
structures at the top
Best 1
Grayish white
calcarenites with few
shale intercalations,
followed by upwards
white limestone
Suitable 2
Beach Sands Best 1
Sabkha sediments Unsuitable 5
Agriculture Unsuitable 5
Groundwater Salinity
(ppm)
< 1200 Best 1
1200-3000 Water involving a hazard for
irrigation
2
3000-7000 Water can be used for
irrigation only with leaching
and perfect drainage
3
> 7000 Unsuitable for both drinking
and irrigation
4
Groundwater Depth (m)
> 20 Very deep 1
15-20 deep 2
10 -15 Medium Deep 3
< 10 Shallow 4
Slope (degrees)
<1 Level 1
1-3 Very gentle slope 2
3-5 Gentle slope 3
5-10 Moderate slope 4
>10 Strong slope 5
Land cover
(area in m2)
Bare Land Bare Land 1
< 42000 Small cultivated lands 2
< 500 Small urban areas 2
>42000 Main cultivated lands 3
>500 Main built up areas 3
TABLE III: MANMADE FACILITIES (INFRASTRUCTURES), ATTRIBUTE VALUES, DESCRIPTION AND RATING
Criteria Factor Attribute values Description Rating
Man Made Facilities (Infrastructures) (Overall Weight = 40 %)
Proximity to Fresh Water Supply (m)
< 2500 Very Close 1
2500-5000 Close 2
5000-7500 Medium 3
7500-10000 Far 4
> 10000 Very far 5
Distance from Electric Power Line (m)
< 4000 Very Close 1
4000-8000 Close 2
8000-12000 Medium 3
>12000 Far 4
Distance from Roads (m)
< 1500 Very Close 1
1500-3000 Close 2
3000-4500 Medium 3
4500-6000 Far 4
>6000 Very far 5
**Sea Level Rise: lands expected to get submerged due to SLR of 1.0 m by the year 2030. (Overall Weight = 20 %)
International Journal of Environmental Science and Development, Vol. 10, No. 10, October 2019
316

TABLE IV: INSHORE/OFFSHORE HAZARDS / FACTORS, ATTRIBUTE VALUES, DESCRIPTION AND RATING
Criteria Factor Attribute values Description Rating
Depth of Sea (m) within a
buffer zone of 0.5 km from
coastal line based on the
depth after 0.5 km from
coast
0-6.0 Unsuitable for regular ports and deep
water ports
4
6.0-9.0 Suitable for regular ports and deep water
ports
Suitable for regular ports and deep water
ports
3
9.0-20.0 2
>20.0 1
Erosion / Accretion rate
(cm/year)
-0.5 – 0.5 Almost stable 1
-0.5 – -1.50 High accretion 3
< -1.50 Extremely high accretion 5
0.5 – 1.50 High erosion 3
>1.50 Extremely high erosion 5
TABLE V: CRITERIA WEIGHTS FOR THE TERRESTRIAL HAZARDS / FACTORS
Rank Criteria Weight
(n−rj +1)
Normalized
weight wj
1 Runoff volume 6 0.285
2 Slope degree 5 0.23
3 Land cover 4 0.19
4 Soil 3 0.143
5 GW Depth 2 0.09
6 GW salinity 1 0.05
Sum 21
TABLE VI: CRITERIA WEIGHTS FOR THE INFRASTRUCTURES FACTORS
Rank Criteria Weight
(n−rj + 1)
Normalized
weight wj
1 Distance to power line 3 0.5
2 Distance to fresh water
facility
2 0.33
3 Distance Roads 1 0.166
Sum 6
TABLE VII: CRITERIA WEIGHTS FOR THE INSHORE /OFFSHORE FACTORS
Rank Criteria Weight
(n−rj+1)
Normalized
weight wj
1 Depth of sea 1 0.5
2 Erosion/accretion 1 0.5
Sum 2
a)
b)
c)
d)
Fig. 5. Criteria maps for: a) Distance to roads, b) Distance to electricity line,
c) Distance to freshwater line, d) Map of constraints.
III. RESULTS
The suitability map for favorable ports sites to be
constructed, along the northwestern coast of Egypt, is shown
in Fig. 6, Fig. 7 and a summary of results is shown in Table
VIII. Locations suitable for constructing ports were obtained
from two models; the first one for the marine criteria and the
second one for land and infrastructures together.
A total of 62 locations are identified and classified as
suitable for positioning a port along the northwestern coast
(west to Marsa Matrouh), within a total extension of about 70
km in the east west direction. These 62 locations of the
marine coastal zone have a suitable morphology in terms of
slope (less than 10◦) and depth of sea (more than 6.0 m after
the first 500 m from coast).
TABLE VIII: SUMMARY OF SUITABLE AREAS (FROM MARINE MODEL
OUTPUT) GROUPED FOR SUITABILITY VALUES, EXPRESSED IN TERMS OF
NUMBER OF SUITABLE AREAS AND EXTENSION IN KM2 AND % WITH
RESPECT TO SUITABLE AREAS
Suitability value Surface area
(km2)
No. of
areas
%
1 1.6562 1 2.3
2 19.4694 21 26.6
3 40.7503 30 55.6
4 11.4039 10 15.6
5 0.0051 0 0
Total 73.2798 62 100
The output of the inshore/offshore model, (covering 1.0
km of the coastal zone, 500 m from each side of the coastal
line), shows the following results: All identified areas record
suitability values from 1 to 5. Only one location, at the far
eastern extension of the coast recorded a suitability of 1 (Best)
as shown in Fig. 6 and Fig. 7. This location is excluded due to
its proximity to a high risk area of terrestrial hazards (flash
floods possibility and steep slopes). About 21 of the
International Journal of Environmental Science and Development, Vol. 10, No. 10, October 2019
317
identified locations (26.6 %) show a rating of 2 (good
suitability). About 55.6 % of areas identified show a rating of
3 (fair suitability) counting to 30 locations. 15.6 % of the total
number of areas showed a rating of 4 with a total number of
10 areas. Moreover, no areas have obtained a suitability value
of 5.
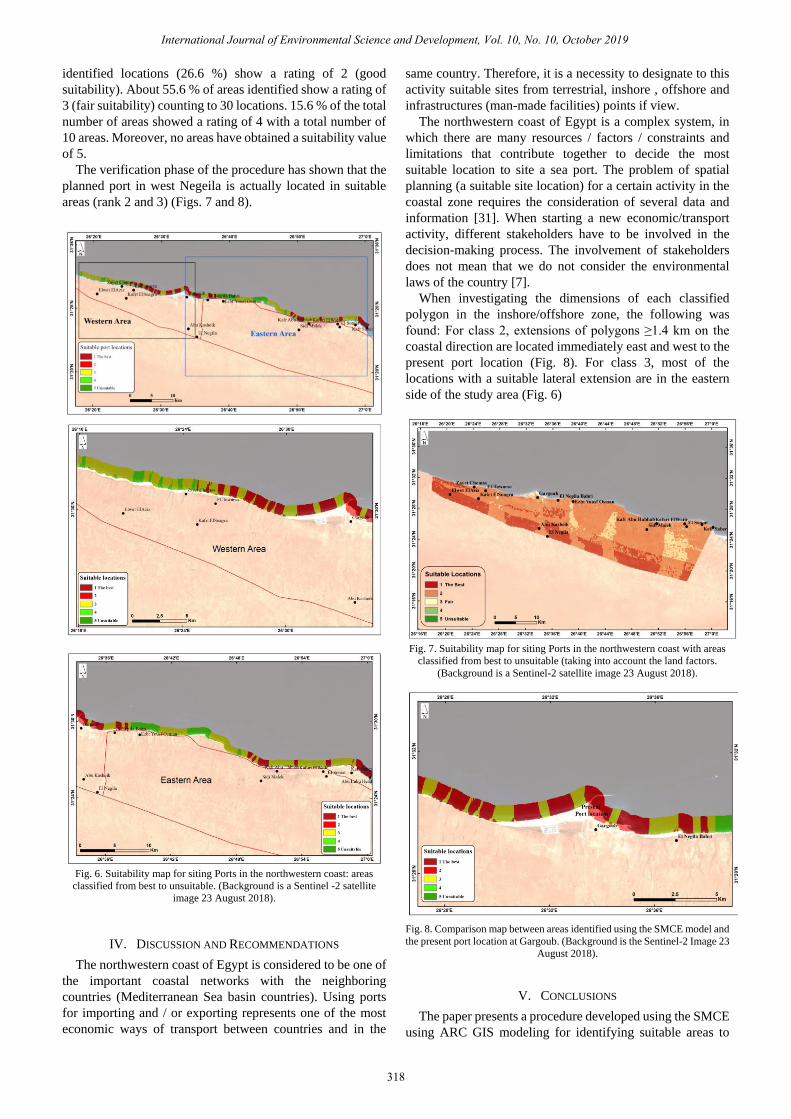
The verification phase of the procedure has shown that the
planned port in west Negeila is actually located in suitable
areas (rank 2 and 3) (Figs. 7 and 8).
Fig. 6. Suitability map for siting Ports in the northwestern coast: areas
classified from best to unsuitable. (Background is a Sentinel -2 satellite
image 23 August 2018).
IV. DISCUSSION AND RECOMMENDATIONS
The northwestern coast of Egypt is considered to be one of
the important coastal networks with the neighboring
countries (Mediterranean Sea basin countries). Using ports
for importing and / or exporting represents one of the most
economic ways of transport between countries and in the
same country. Therefore, it is a necessity to designate to this
activity suitable sites from terrestrial, inshore , offshore and
infrastructures (man-made facilities) points if view.
The northwestern coast of Egypt is a complex system, in
which there are many resources / factors / constraints and
limitations that contribute together to decide the most
suitable location to site a sea port. The problem of spatial
planning (a suitable site location) for a certain activity in the
coastal zone requires the consideration of several data and
information [31]. When starting a new economic/transport
activity, different stakeholders have to be involved in the
decision-making process. The involvement of stakeholders
does not mean that we do not consider the environmental
laws of the country [7].
When investigating the dimensions of each classified
polygon in the inshore/offshore zone, the following was
found: For class 2, extensions of polygons ≥1.4 km on the
coastal direction are located immediately east and west to the
present port location (Fig. 8). For class 3, most of the
locations with a suitable lateral extension are in the eastern
side of the study area (Fig. 6)
Fig. 7. Suitability map for siting Ports in the northwestern coast with areas
classified from best to unsuitable (taking into account the land factors.
(Background is a Sentinel-2 satellite image 23 August 2018).
Fig. 8. Comparison map between areas identified using the SMCE model and
the present port location at Gargoub. (Background is the Sentinel-2 Image 23
August 2018).
V. CONCLUSIONS
The paper presents a procedure developed using the SMCE
using ARC GIS modeling for identifying suitable areas to
International Journal of Environmental Science and Development, Vol. 10, No. 10, October 2019
318

locate new sea ports at the NW coast of Egypt (West to Marsa
Matrouh). Due to the different extent for analysis of land and
marine factors/criteria, two different extents were used. A
spatial resolution of 50 m was applied throughout the whole
modeling processes. Identification of suitable areas coincided
with the already planned port at Gargoub area (Fig. 8). The
present procedure can be enhanced in a way to incorporate all
factors in one model. Furthermore, network analysis might be
done in GIS to estimate minimum time for reaching the port
from adjacent commercial markets
CONFLICTS OF INTEREST
The authors declare no conflict of interest.
AUTHORS CONTRIBUTIONS
This work was carried out in collaboration between all
authors. All authors participated equally in the study idea,
literature review, data collection and analyses, methodology,
statistical analyses, tabulating the data, results validation,
writing and revising the whole manuscript-All authors read
and approved the final manuscript.
Funding: This research received no external funding.
ACKNOWLEDGMENTS
This study is part of a finished Research and Development
Research Project ‘‘Selection and Assessment of Civil and
Coastal Development Sites in Matrouh Governorate: A
Remote Sensing and GIS Approach”. The project was funded
by the National Authority for Remote Sensing and Space
Sciences (NARSS, 2019).
REFERENCES
[1] N. F. Soliman et al., “Sustainable development of the Northwestern
coastal zone of Egypt: economic, social and environmental
perspectives,” presented at International Conference on Biotechnology
and Environment 2016 (ICBE2016), Institute of Graduate Studies and
Research, 2016.
[2] G. Tsinker, Handbook of Port and Harbor Engineering. Geotechnical
and Structural Aspects, Springer-Science+Business Media, 1997.
[3] J.-P. Rodrigue and T. Notteboom, “The spatial organization of
transportation and mobility,” The Geography of Transport Systems,
2018.
[4] W. Quellette, “Remote sensing for marine spatial planning and
integrated coastal areas management: Achievements, challenges,
opportunities and future prospects,” July 2016.
[5] G. Dapueto et al., “A spatial multi-criteria evaluation for site selection
of offshore marine fish farm in the Ligurian Sea, Italy,” Ocean &
Coastal Management, vol. 116, 2015, pp. 64-77.
[6] E. K. Zavadskas, Z. Turskis, and V. Bagoˇcius, “Multi-criteria
selection of a deep-water port in the Eastern Baltic Sea,” Applied Soft
Computing, vol. 26, 2015, pp. 180–192.
[7] Egyptian Environmental Affairs Agency (EEAA) (1995 and 2005),
“Guidelines for development of ports, harbours and marinas,”
Environmental Impact Assessment, SEAM Project.
[8] S. McFeeters, “The use of normalized difference water index (NDWI)
in the delineation of open water features,” Int. J. Remote Sens., vol. 17,
pp. 1425–1432, 1996.
[9] S. S. Mitra, D. Mitra, and A. Santra, “Performance testing of selected
automated coastline detection techniques applied on multispectral
satellite imageries,” Earth Sci. Inf., 2017, vol. 10, pp. 321–330.
[10] M. Crowell et al., “On forecasting future US shoreline positions: A test
of algorithms,” Journal of Coastal Research, vol. 13, no. 4, pp.
1245-1255, 1997.
[11] R. Dolan et al., “Temporal analysis of shoreline recession and
accretion,” Journal of Coastal Research, vol. 7, no. 3, pp. 723-744,
1991.
[12] Y. S. Sherief, “Flash floods and their effects on the development in
El-Qaá plain area in south Sinai, Egypt, a study in applied
geomorphology using GIS and remote sensing,” Dissertation Zur
Erlangung des Grades “Doktor der Naturwissenschaften” im
Promotionsfach Geographie. Universität Mainz, 2008.
[13] N. A. Morad et al., “Hydrologic factors controlling groundwater
salinity in northwestern coastal zone,” Egypt. J. Earth Syst. Sci., vol.
123, no. 7, October 2014, pp. 1567–1578.
[14] Earthquake Catalog. (2018). [Online]. Avilable:
https://earthquake.usgs.gov/earthquakes/search/
[15] J. R. Eastman et al., “Raster procedures for multicriteria multiobjective
decisions,” Photogramm Eng Remote Sens, vol. 61, no. 5, pp. 539–547,
1995,
[16] R. Eastman, “Multi-criteria evaluation and GIS,” Geographical
Information Systems, Wiley, New York, pp. 493-502, 1999.
[17] H. Jiang and J. R. Eastman, “Application of fuzzy measures in
multi-criteria evaluation in GIS,” Int. J. Geogr. Inform. Sci., vol. 14, no.
2, pp. 173-184, 2000.
[18] D. O'Sullivan and D. J. Unwin, Geographic Information Analysis,
Wiley, Hoboken, NJ, p. 436, 2003.
[19] J. Malczewski and C. Rinner, “Exploring multicriteria decision
strategies in GIS with linguistic quantifiers: A case study of residential
quality evaluation,” J. Geogr. Syst., vol. 7, pp. 249-268, 2005.
[20] J. Malczewski, “Ordered weighted averaging with fuzzy quantifiers:
GIS-based multicriteria evaluation for land-use suitability analysis,”
Int. J. Appl. Earth Observ. Geoinform, vol. 8, pp. 270-277, 2006.
[21] J. Aguilar-Manjarrez and L. G. Ross, “Geographical information
system (GIS) environmental models for aquaculture development in
Sinaloa State, Mexico,” Aquac. Int., vol. 3, pp. 103-115, 1995.
[22] M. A. Salam and L. G. Ross, “Optimising site selection for
development of shrimp (Penaeus monodon) and mud crab (Scylla
serrata) culture in South-western Bangladesh,” in Proc. GIS 2000
Conference Proceedings, March 13-16, Toronto, Canada, 2000.
[23] O. M. Pérez et al., “Geographical information systems-based models
for offshore floating marine fish cage aquaculture site selection in
Tenerife, Canary Islands,” Aquac. Res., vol. 36, pp. 946-961, 2005.
[24] J. Malczewski, GIS and Multicriteria Decision Analysis, Wiley, New
York, 1999.
[25] H. A. Effat and A. El‑Zeiny, “Modeling potential zones for solar
energy in Fayoum, Egypt, using satellite and spatial data,” Model.
Earth Syst. Environ., vol. 3, pp. 1529–1542, 2017.
[26] M. L. M. Graymore et al., “An index of regional sustainability: A
GIS-based multiple criteria analysis decision support system or
progressing sustainability,” Ecol. Complex, vol. 6, pp. 453-462, 2009.
[27] JICA, T”he study on master plan and rehabilitation scheme of the
Greater Alexandria Port in the Arab Republic of Egypt: final report,”
1999.
[28] J. Wang et al., “IA-SDSS: A GIS-based land use decision support
system with consideration of carbon sequestration,” Environ. Model.
Softw., vol. 25, pp. 539-553, 2010.
[29] J. Malczewski, “On the use of weighted linear combination method in
GIS: common and best practice approaches,” Trans. GIS, vol. 4, no. 1,
pp. 5-22, 2000.
[30] S. S. Nath, J. P. Bolte et al., “Applications of geographical information
systems (GIS) for spatial decision support in aquaculture,” Aquac. Eng.,
vol. 23, pp. 233-278, 2000.
[31] P. C. Longdill et al., “An integrated GIS approach for sustainable
aquaculture management area site selection,” Ocean Coast. Manag.,
vol. 51, pp. 612-624, 2008.
Copyright © 2019 by the authors. This is an open access article distributed
under the Creative Commons Attribution License which permits unrestricted
use, distribution, and reproduction in any medium, provided the original
work is properly cited (CC BY 4.0).
Salwa F. Elbeih is an associate professor of civil
engineering at the Engineering Applications and Water
Division, National Authority for Remote Sensing and
Space Sciences (NARSS), Cairo Egypt since May
2014. She has obtained her Ph.D. in civil engineering
from Ain Shams University in 2007. She is the acting
head of the engineering applications department at
NARSS. She participated in several funded national
and international cooperation projects including (TEMPUS – Project)
2009-2012, (SUDSOE), FP7 2012-2014, (RDI Programme) 2010 -2012. She
is one of the national editors of the Egyptian Journal of Remote Sensing and
Space Sciences (EJRS) and a reviewer in more than six international journals.
Her research interests comprise: applications of remote sensing and GIS in
civil engineering, environmental and geotechnical engineering, the relation
between archaeological and water resources conditions. She received a prize
from the ministry of water resources and irrigation (2010), best paper in the
6th International Conference on Environmental Hydrology and 2009.
International Journal of Environmental Science and Development, Vol. 10, No. 10, October 2019
319

Sameh Bakr El Sayed El Kafrawy is an expert in the
field of environmental studies. He is the head of
Marine Science Department and Integrated Coastal
Zone Management (ICZM) Lab. at National Authority
for Remote Sensing and Space Sciences (NARSS). He
is an associate professor at NARSS specializing in
remote sensing applications in marine and coastal
studies. He was been employed at NARSS since 2000.
He has been involved and lead in several international
projects, WATERMED, ICAMS RAMSES, ALIMAM and MELMARINA,
PEGASO Projects and worked on several fields the application of remote
sensing and GIS to Environmental studies has been a major interest.
Wael Attia is a GIS & remote sensing analyst in the
Engineering Application Department at National
Authority for Remote Sensing and Space Sciences
(NARSS), Egypt. He was born on the August 6, 1985.
He has completed his B.Sc. in Geography Dept. in
Faculty of Arts Alexandria University. He had worked
in Egyptian General Survey Authority as a GIS
specialist. He has more than 12 years of experience in
GIS and remote sensing applications, and he got his
M.Sc in physical geography using GIS and remote sensing technique in
2018.
International Journal of Environmental Science and Development, Vol. 10, No. 10, October 2019
320