multi-disciplinary optimization in the early stages of...
TRANSCRIPT

1
MULTI-DISCIPLINARY OPTIMIZATION
IN THE EARLY STAGES OF DESIGN
Sukreet Singh Karen Kensek
Cuningham Group University of Southern California
70 Broadway, Suite 300 School of Architecture
Denver, CO 80203 Los Angeles, CA 90089-0291
[email protected] [email protected]
ABSTRACT
Architects are master jugglers. This is most apparent in the
early stages of design when they are balancing many major
issues including client requirements, preliminary costs,
aesthetics, community concerns, structures, environmental
impacts, etc. Decisions made then have a huge impact on
the performance of the building. With increased awareness
of the importance of sustainable design, architects are
looking for tools that evaluate analytical design choices and
inform knowledgeable decisions. Simulation software has
existed for decades. More recently, multi-disciplinary
optimization algorithms offer potential solutions for well-
defined questions, for example, what is a good trade-off
between increasing window size for day-lighting that does
not increase loads disproportionately? New processes that
incorporate their benefits need to be developed.
This paper explains about parametric and multidisciplinary
optimization techniques and then outlines a design approach
to utilize them in the preliminary design stage of a case
study building.
1. INTRODUCTION
Decisions made during early stage of design process have a
critical impact on overall performance of buildings.
However, often this is the least explored design alternative
phase. This is mainly due to limited funds allocated to this
early design, lack of awareness of the energy saving
potential of this phase, and limited knowledge about
optimization software and parametric analysis.This paper
tries to emphasize the importance of utilizing parametric
design and multi-disciplinary design optimization
techniques at the schematic level for exploring different
energy efficient design configurations and demonstrates one
process to achieve that goal.
Currently, simulation tools are being used to validate the
intuitions of architects and give them a basis to proceed with
design or modify designs based on the outcome of
simulation results. Simulation tools are incredible in making
energy efficient design calculations, but studying several
different design options is time consuming and often
difficult as the critical ranges of variables might not be
known. Parametric design possibilities and optimization
techniques can make the process quicker and provides result
from much larger pool of options.
2. PERFORMANCE BASED DESIGN
TECHNIQUES
In addition to the traditional types of analytical modeling
where a digital model is constructed and then performance
simulations are run, there are software programs available
that help in “optimizing” the design for specific criteria.
Optimization at the building and operations level has
potential to be an important contributor to the performance
of the overall designed space. There are a number of
optimization objectives that a designer can focus on - like
minimizing the following: energy demand (lighting, heating,
cooling, auxiliary), primary energy consumption, embodied
energy, operational carbon emissions, operational cost,
construction cost. Or objectives might include maximizing

2
indoor environmental qualities like daylight, air quality, and
thermal comfort.
Several methods are available for doing optimization:
parametric analysis, genetics algorithms, and the Pareto
Front are discussed below in the context of software
programs that use them. In addition, one might claim that
an experienced architect “intuitively” tries to optimize
multi-objectives passively, for example, previous experience
from other buiding projects might have shown that a
specific low-e glazing saves energy at a reasonable cost, and
therefore the architect might choose that combination again.
This type of “passive optimization” is mentioned further in
the case study.
2.1 Parametric Analysis
Parametric analysis is a well-established technique to find
design with most favorable characteristics (e.g. low loads,
less energy consumption, most comfortable etc.) by
systematically adjusting variables, usually only a few of
them at a time.
Parametric analysis can be performed with just one variable.
It can be as simple as having a spreadsheet where the user
methodically changes one value until another value reaches
a high or low value. The example in figure 1 shows a
computerized algorithm where the length of the shading
element is increased until the solar radiation on a window
no longer decreased, thus optimizing the shade length.
Often, when one parameter is being optimized it can also
just be solved for mathematically rather than using a brute
force method like this.
Fig. 1: Use of Revit Architecture and Dynamo to optimize
the depth of the window shade. (image courtesy of Tyler
Tucker)
Figure 2 is another example of parametric analysis with two
variables. The designer is trying to lessen energy
consumption by changing two variables. These variables are
different façade scenarios (window-wall ratio WWR) and
types of glazing. These results displayed in the form of
series of parametric design curves are calculated using
EnergyPlus engine and DesignBuilder interface. These
design curves gives options for designer up front to analyze
and choose a WWR coupled with glazing types based on
both aesthetics and performance. Note that the designer is
not being coerced into chosen a single solution, but is
learning what the consequences of different choices are.
Fig. 2: Parametric design curves illustrating effect of
different WWR and glazing combinations on total
energy consumption
These types of design curves are very useful at early design
phase of projects to understand the effect of different
variables on building performance. This gives the designer a
sense about sensitivity of the variables and establishes the
key elements that effect performance parameters like
thermal comfort and energy consumption. Sensitivity
analysis is a potential extra benefit; through parametric
iterations the designer can also learn which variables have
the most impact. Once that is established, designer can make
minimal changes with maximum impact on performance.
Moreover, these parametric illustrations helps designer to
communicate better with clients and make them understand
the design decisions that followed.
In spite of all advantages discussed above, there are some
limitations in finding optimal solutions using parametric
analysis, for example, the number of variables that can be
practically explored with single optimization objective (e.g.
best comfort, low energy consumption etc.) (1).
2.2 Genetic Optimization
Another form of optimizing techniques uses genetic or
evolutionary optimization algorithms to explore locally
optimal design solutions (2). This can be a more efficient
way to find optimal designs depending on the problem and
3
can solve for multiple conflicting objectives, for example,
minimizing energy consumption while maximizing comfort
levels or minimizing loads while also minimizing life-cycle
costs. This is also called multiple objective optimizations.
The research and development on finding an optimized
design is not only limited to a building scale but also
includes larger elements like a site and smaller components.
One example of optimization at the site level can be
performed using SITEOPS. It provides rapid site
evaluations, cost optimization, and value engineering. This
tool is driven by parametric design elements, which allow
objects to look and interact with each other. The designer
can see the cost-based conceptual grading plan based on
quick site layout. The project is submitted to SITEOPS
server and optimization carried out online to find the best
possible way to grade and do piping layout for this site in
order to minimize cost implications. (www.siteops.com)
The other end of size spectrum deals with component level
optimization. This includes optimizing external shades, light
shelves, window tilt, etc. An example of this would be
studying the depth of overhangs used with different glazing
types with the objective of enhancing that performance of a
space by minimizing loads and maximizing good daylight
levels or some compromise of those variables.
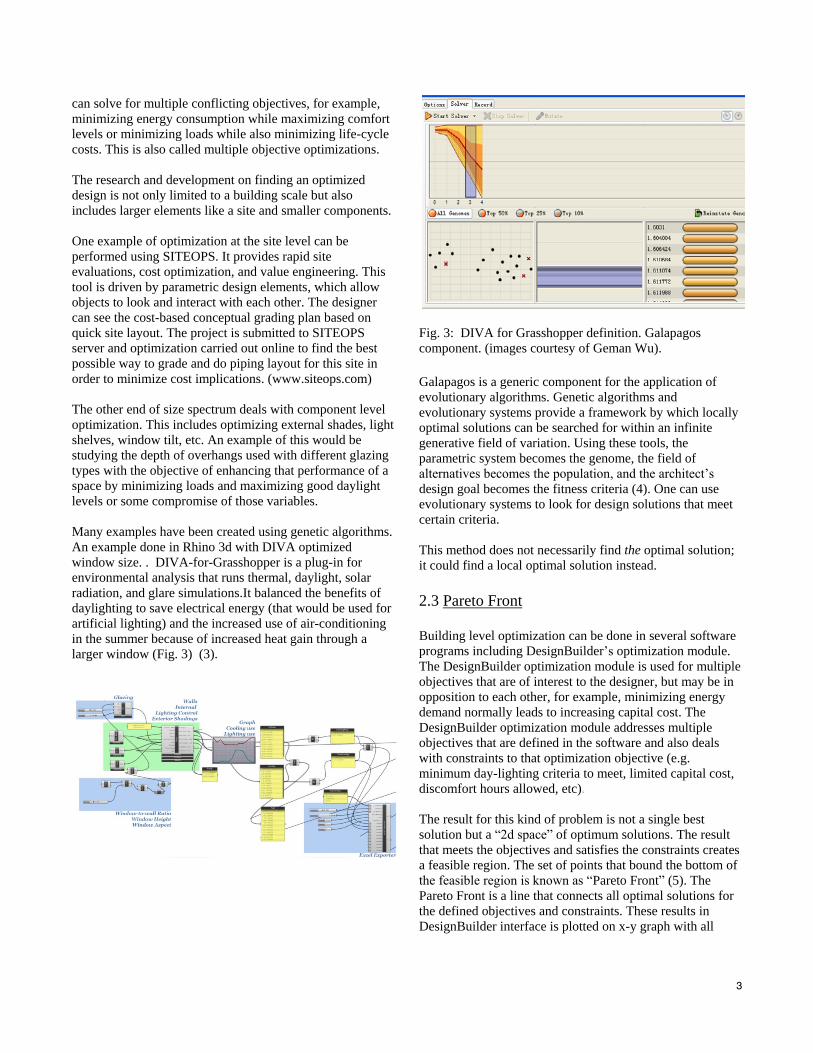
Many examples have been created using genetic algorithms.
An example done in Rhino 3d with DIVA optimized
window size. . DIVA-for-Grasshopper is a plug-in for
environmental analysis that runs thermal, daylight, solar
radiation, and glare simulations.It balanced the benefits of
daylighting to save electrical energy (that would be used for
artificial lighting) and the increased use of air-conditioning
in the summer because of increased heat gain through a
larger window (Fig. 3) (3).
Fig. 3: DIVA for Grasshopper definition. Galapagos
component. (images courtesy of Geman Wu).
Galapagos is a generic component for the application of
evolutionary algorithms. Genetic algorithms and
evolutionary systems provide a framework by which locally
optimal solutions can be searched for within an infinite
generative field of variation. Using these tools, the
parametric system becomes the genome, the field of
alternatives becomes the population, and the architect’s
design goal becomes the fitness criteria (4). One can use
evolutionary systems to look for design solutions that meet
certain criteria.
This method does not necessarily find the optimal solution;
it could find a local optimal solution instead.
2.3 Pareto Front
Building level optimization can be done in several software
programs including DesignBuilder’s optimization module.
The DesignBuilder optimization module is used for multiple
objectives that are of interest to the designer, but may be in
opposition to each other, for example, minimizing energy
demand normally leads to increasing capital cost. The
DesignBuilder optimization module addresses multiple
objectives that are defined in the software and also deals
with constraints to that optimization objective (e.g.
minimum day-lighting criteria to meet, limited capital cost,
discomfort hours allowed, etc).
The result for this kind of problem is not a single best
solution but a “2d space” of optimum solutions. The result
that meets the objectives and satisfies the constraints creates
a feasible region. The set of points that bound the bottom of
the feasible region is known as “Pareto Front” (5). The
Pareto Front is a line that connects all optimal solutions for
the defined objectives and constraints. These results in
DesignBuilder interface is plotted on x-y graph with all

4
optimized solutions marked in red. Figure 4 shows the
feasible region of optimal solutions and the Pareto Front.
Fig. 4: Multi-objective optimization results and the Pareto
Front where the more optimal solutions are located along
3. CASE STUDY
This case study was started as a competition proposal
organized by the ADOPT research group, but latter became
its own research project. The site constraints and parameters
were adapted from the competition brief. The program
required the following: 22,000 sf open office, 3,000 sf
cellular office, 4,000 sf utility space, and circulation to form
a 30,000 sf building. Functional criteria and specific
sustainable targets were set that included minimizing
operational carbon emissions, minimizing construction cost,
satisfying comfort criteria based on ASHRAE 55, and
achieving the minimum day-lighting requirement criteria set
by the designer. The site was located in south London near
Gatwick Airport.
As a design project, practicalities of design such as
aesthetics, frontage, site constraints, and others under the
umbrella of sustainable planning were considered. But
smaller architectural details (for example, fittings, furniture,
decorative materials, staircases, etc.) were ignored as they
would not have much impact on the thermal, daylight, and
cost performance of an early stage model. The major goal of
the case study was to explore how multi-objective
optimization algorithms can be incorporated into the design
process.
The shape of the building was derived in response to the
neighboring site conditions, solar insolation, and wind
analysis. The process started with the use of Climate
Consultant, Ecotect, and Vasari to understand the local
London weather and site conditions. The following was
deduced:
London is primarily heating load dominated climate.
During office hours in summer months in London, there
are cold winds (32F-70F) blowing primarily from SW
direction.
There is a need of maximizing solar gain during dominant
colder months and use natural ventilation as cooling
strategy during hotter months.
The designer used “passive optimization,” knowledge about
similar conditions and trade-offs, based on the data shown
in the software programs. These included measures to
reduce energy consumption of the building without actually
dealing with building fabric or systems. These included the
following:
The building was sited to obtain as much direct solar gain
as possible to passively heat the building during colder
months and simultaneously make sure the neighboring
buildings did not block cold winds during summer (Fig.
5). The building form itself was also specifically designed
in order to maximize solar absorption from the east,
south, and west sun and reduce heating load on active
systems. This form catered to several criteria including
meeting functional requirements, frontage to building,
context relationship, maximizing solar gain, and using
cool breezes during hot months
Fig. 5: Solar radiation (Ecotect) and wind tunnel analysis
(Vasari)

5
The footprint of building was placed on a less shaded area
of the site (marked as red zone in Fig. 6). The building
mass was set to multiple floors to capture more direct
solar radiation during the coldest months when the ground
level of site gets shaded as the low sun angle being
blocked by neighboring buildings.
Fig. 6: Passive optimization – determining the least shaded
area of the site for most solar heat gain
Once the basic 3d form was created, the Revit model was
exported and imported into DesignBuilder using gbXML
(Fig. 7). The basic default construction, glazing, opening,
and HVAC templates for a typical office building were
applied. Heating load, cooling load, annual energy
consumption and tentative construction cost were noted for
this baseline model. The Energy Use Intensity (EUI) for
baseline model was 67 kbtu/sft-yr. The cost of construction
was 32,30,000 GBP (British Pounds).
Fig. 7: DesignBuilder model
DesignBuilder was then used to optimize the façade,
construction, HVAC systems, lighting and related controls
of the building. In order to reduce simulation time of
performing thousands of optimization simulation, only one
typical floor (the 4th floor) was optimized, and changes were
then applied to the whole building. Ideally, either the first or
second floor plan should have been optimized separately as
they don’t come under ‘typical’ category. However, the
designer in this case focused on only one floor to explore
different options as majority of discovered strategies could
be implemented on lower floor as well.
There were two objectives to be optimized: minimize
construction cost (in British pounds) and lower operational
cost (in terms of carbon dioxide - CO2 emissions). There
were several parameters tested. These parameters were not
all selected and optimized at once but in subsets. Earlier
optimization focused on reducing external loads through
envelope and construction. Later internal loads, HVAC
system and controls were optimized. This helped maintain
logical optimization while not preventing the software from
crashing.
The first subset was the façade in which window wall ratio
(WWR), glazing type, and shading type parameters were
optimized. The range of WWR was given as 40-90%, eight
different double glazing types, six different types of triple
glazing, four types of louvers, and four types of overhang
systems were selected for testing (Fig. 8).
Fig. 8: Parameter settings for façade optimization
The optimization was set with constraints on the number of
uncomfortable hours (maximum 200) and minimum day-
lighting criteria (Daylight Factor >= 2%) (Fig. 9).
Uncomfortable hours are the hours when the combination of
operative temperature and zone humidity ratio is not in the
ASHRAE 55-2004 defined summer or winter clothes
region. The lighting controls were also selected as a 3-
stepped control system in the base building to include the
savings due to better day-lighting. Stepped control allows
the lighting system (or occupant) to switch lighting on/off
according to the availability of natural daylight in three
discrete steps.
Fig. 9: Constraints for optimization (typical)
The DesignBuilder optimization module calculated
solutions based on Pareto Front Evolutionary Algorithm.
Optimal solutions in this case would be a WWR with the
best suited glazing and shading type to reduce both
construction and operational cost by minimizing cooling
load, heating load, and maximizing daylight penetration.
Figure 10 shows DesignBuilder optimization module output

6
screen illustrating each simulation performed during
optimization as a dot. These dots are spread all over the
graph illustrating construction cost (y-axis) and CO2
emissions (x-axis) with different set of combinations. The
dots in red form the Pareto Front and indicate the most
optimal solutions based on objectives and constraints
selected. The table underneath the graph shows the
parameter combinations of optimized solutions that lie on
Pareto Front.
Fig. 10: Façade optimization results
Over 2500 simulations were carried out to get a set of about
20 optimized solutions. Out of these, designers can select
the options and combinations that suit their overall design
goals. As an example: if designer have personal preference
(maybe aesthetic reasons) to have WWR around 65% and
minimize the operations cost as second criteria, then his
closest best options would be to go with iteration 795, 2189
or 1953 as described in chart above in figure 9. However, if
his objective is the most optimized solution in terms of
minimum construction cost then iterations 200 and 22
would be better. In this case, the designer chose 68% WWR
with double air tinted glazing, and a 1.5’ louver considering
aesthetic reasons and minimizing operational cost. These
changes were updated in simulation model, and an annual
simulation was run.
The next step was to dive deeper in the model for
optimizing construction assemblies. Eleven different types
of wall constructions, eight types of roof constructions,
infiltration (range: 0.2 - 1.2), and four different types of
floor constructions were used as testing parameters. WWR
with a smaller range (40-70%) and three types of best
performing glazing types from the previous optimization
step were also included as parameters at this stage. (Fig. 11).
Fig. 11: Parameter settings for construction optimization
Figure 12 shows the 1500 iterations with the 15 most
optimized solutions for construction assembly that meet
those objectives (minimize construction and operations cost)
under the constraints (max. 200 uncomfortable hours and
Daylight Factor >= 2%) defined by the designer. The red
dots collectively form the Pareto Front, and the table below
shows their combinations.
Fig. 12: Construction optimization results
Due to current software limitations, optimizing more than
one construction variable was giving an error. Considering
an optimization of only the fourth floor and that the external
wall being the dominant factor, the optimization was taken
forward with external wall as construction parameter. Out of
15 most optimized solutions, the designer can pick and
choose the option that best fits their overall design goals as
discussed earlier. In this case, the designer gave more
importance to reducing operations cost and chose the option
that minimizes it keeping the WWR in range of 60 – 70%.
SIPS wall with infiltration value of 0.5 along with double
air tinted glazing and WWR as 65% was considered as the
optimized solution to move forward with to next step.

7
Once parameters dealing with external loads were decided
upon, the focus then shifted to internal loads, HVAC
system, and controls. This first stage of this category
included optimization of following: HVAC system, lighting
type and related controls including external window
openings, and heating and cooling set points. Several
different types of HVAC systems were tested including
VAV (Variable Air Volume) with terminal reheat, fan-coil
units, VRF (Variable Refrigerant Flow) heating/cooling
with DOAS (Dedicated Outside Air Systems) with heat
recovery, passive chilled beams with displacement
ventilation, ground source heat pump with floor heating,
natural ventilation and air source heat pump with floor
heating, and LTHW (Low Temperature Hot Water)
radiators with natural ventilation. In addition many lighting
systems were tested that involved different combinations of
LEDs and fluorescent lamps (Fig. 13). This was an
important step as HVAC and lighting typically forms
majority of end use energy consumption.
Fig. 13: Parameter settings for HVAC & light optimization
The constraints of thermal comfort criteria was important
while choosing optimized HVAC system and setpoints. The
constraint made sure that number of discomfort hours were
below 200. In other words, unmet load hours as defined by
ASHRAE were within the limit defined by designer. Figure
14 shows output results of this step. The designer chose
LTHW radiators with natural ventilaiton as preferred HVAC
strategy in addition to T5 fluorescent lamps with linear
controls, heating setpoint as 68 F and cooling set point as 76
F. These were chosen keeping in mind the least operational
cost.
Fig. 14: HVAC and lighting optimization results
The final stage of the optimizing of the building was the
fine-tuning of the control systems, which included the
percentage of external window opening, natural ventilation
set point temperature and max temperature difference,
mechanical ventilation set point, cooling and heating set
points (Fig.15). The final output results are shown in figure
16.
Fig. 15: Parameter settings for control optimization
Fig. 16: Control optimization results
Controls is an important criteria in making sure that
building works as conceptualized. The combination chosen
for final tuning in terms of controls included linear lighting
controls, heating set point as 68 F, cooling set point as 78 F,
natural ventilation set point being 70 F, 40% of external

8
window opening during summer conditions with modulating
window opening areas reducing it to 5% when temperature
difference between inside and outside temperature reaches
10 F.
All identified optimized strategies dealing with facades,
construction, HVAC, lighting and controls on fourth floor
were then replicated on all floors of the building, and an
annual simulation was run. Table 1 shows summary of all
parameters that were optimized.
TABLE 1: OPTIMIZED RESULTS
The orignal Energy Use Intensity (EUI) for the baseline
model was 67 kbtu/sft-yr. The cost of construction was
32,30,000 GBP (British Pounds). The optimized building’s
EUI was reduced to 23.89 kbtu/sft-yr (63% reduction), and
the construction cost was reduced by 3,87,600 GBP (12%
reduction).
CONCLUSION
The design was optimized for minimizing construction and
operations cost by fine tuning number of parameters such as
glazing, shading, wall to window ratio, construction
assembly, HVAC type and controls, natural ventilation set
points, lighting controls and day-lighting criteria. This was
done by optimizing one floor first and then replicating the
optimized strategies to whole building.
In summary, the EUI was reduced to 23.89 kbtu/sft-yr (63%
reduction), and the construction cost was reduced by
3,87,600 GBP (12% reduction). What is critical for
designers is not only the amount of energy that was saved in
this case study, but the integration of optimization process
in the design process. The optimization process gives
enough flexibility to the designer to choose what he
considers as the optimal solution based on project
constraints out of designs landing on the Pareto Front.
These optimization tools are constantly developing,
improving their optimization capabilities, and becoming
more user friendly for designers. However there were
important limitations: optimization couldn’t be done at
specific parts of the building, and the constraints option is
not properly integrated to optimization process leading to
software crash or inefficiencies currently in DesignBuilder.
The design process is based on a series of digital and
analogue tools that help architects simulate, manage,
synthesize, and balance the huge amounts of information
that they need to work with. Newer tools with optimization
capabilities can help designers make informed choices. But
it isn’t just the architects. Consultants, engineers,
contractors, facilities managers and others have to do the
same thing, but with different concerns and software tools
available. And the building after completion may be able to
fine-tune itself.
REFERENCES
(1) Design Builder “Help v3.0: Optimization” -
http://www.designbuilder.co.uk/helpv3.0/#Optimisation
.htm, last accessed February 2013
(2) Coello Coello, C.A. et al. 2007 Evolutionary
Algorithms for Solving Multi-objective problems,
Genetic and Evolutionary Computation Series, 2nd ed,
New York
(3) Wu, Geman, et. al. Studies in Preliminary Design of
Fenestration: Balancing daylight harvesting and energy
consumption," PLEA 2012 (28th International PLEA
Conference -Design Tools and Methods), Lima, Peru,
November 2012
(4) Miller, Nathan 2011, Introduction: USC Arch 517
Galapagos Course, The proving ground,
http://wiki.theprovingground.org/usc-arch517-
galapagos, last accessed January 2013
(5) Haupt, R.L. and Haupt S.E. 2004. Practical genetic
algorithms. Hoboken, NJ, John Wiley, pp. 97-103
Type/StageBefore
OptimizationAfter Optimization
Façade60% WWR
No shading
65% WWR
1.5' louver
ConstructionStnd R-19 Timber
Frame Wall
SIPS wall
Double air tinted glazing
Infiltration: 0.5
HVAC VAV with ReheatLTHW radiators with natural
ventilaiton
LightingSuspended
Fluorescent
T5 fluorescent lamps with
linear controls
Controls None
Heating SP 68F
Cooling SP 78F
Linear Lighting Controls
External Window Opening: 40%
Modulating Window Area: Till
5% of original opening