multi-modal music information retrieval - visualisation ... · multi-modal music information...
TRANSCRIPT

Multi-Modal Music Information Retrieval -
Visualisation and Evaluation of Clusterings
by Both Audio and Lyrics
Robert Neumayer, Andreas Rauber
Vienna University of Technology
Institute for Software Technology
and Interactive Systems
Favoritenstraße 9-11, 1040, Vienna, Austria
{neumayer,rauber}@ifs.tuwien.ac.at
Abstract
Navigation in and access to the contents of digital audio archives have become increasingly importanttopics in Information Retrieval. Both private and commercial music collections are growing both in terms ofsize and acceptance in the user community. Content based approaches relying on signal processing techniqueshave been used in Music Information Retrieval for some time to represent the acoustic characteristics of piecesof music, which may be used for collection organisation or retrieval tasks. However, music is not defined byacoustic characteristics only, but also, sometimes even to a large degree, by its contents in terms of lyrics. Asong’s lyrics provide more information to search for or may be more representative of specific musical genresthan the acoustic content, e.g. ‘love songs’ or ‘Christmas carols’. We therefore suggest an improved indexingof audio files by two modalities. Combinations of audio features and song lyrics can be used to organiseaudio collections and to display them via map based interfaces. Specifically, we use Self-Organising Mapsas visualisation and interface metaphor. Separate maps are created and linked to provide a multi-modalview of an audio collection. Moreover, we introduce quality measures for quantitative validation of clusterspreads across the resulting multiple topographic mappings provided by the Self-Organising Maps.
Introduction
On-line music stores are gaining market shares, driving the need for on-line music retailers toprovide adequate means of access to their catalogues. Their ways of advertising and makingaccessible their collections are often limited, be it by the sheer size of their collections, by

the dynamics with which new titles are being added and need to be filed into the collectionorganisation, or by inappropriate means of searching and browsing it. Browsing metadatahierarchies by tags like ‘artist’ and ‘genre’ might be feasible for a limited number of songs, butgets increasingly complex and confusing for collections of larger sizes that have to be searchedmanually. Hence, a more comprehensive approach for the organisation and presentation ofaudio collections is required.
Private user’s requirements coincide because their collections are growing significantlyas well. The growing success of on-line stores like iTunes1 or Magnatune2 brings digitalaudio closer to end users, creating a new application field for Music Information Retrieval.Many private users have a strong interest in managing their collections efficiently and beingable to access their music in diverse ways. Musical genre categorisation based on e.g. metatags in audio files music often restricts users to the type of music they are already listeningto, i.e. browsing genre categories makes it difficult to discover ‘new’ types of music. Themood a user is in often does not follow genre categories. Personal listening behaviours oftendiffer from predefined genre tags. Thus, recommending users similar songs to ones they arecurrently listening to or like is one of Music Information Retrieval’s main tasks.
Content based access to music has proven to be an efficient means of overcoming tra-ditional metadata categories. To achieve this, signal processing techniques are used to ex-tract features from audio files capturing characteristics such rhythm, melodic sequences,instrumentation, timbre, and others. These have proven to be feasible input both for au-tomatic genre classification of music as well as for alternative organisations of audio collec-tions like their display via map based, two-dimensional interfaces (Neumayer, Dittenbach &Rauber 2005).
Rather than searching for songs that sound similar to a given query song, users often aremore interested in songs that cover similar topics, such as ‘love songs’, or ’Christmas carols’,which are not acoustic genres per se. Songs about these particular topics might cover abroad range of musical styles. Similarly, the language of a song’s lyrics often plays a decisiverole in perceived similarity of two songs as well as their inclusion in a given playlist. Evenadvances in audio feature extraction will not be able to overcome the fundamental limitationsof this kind. Song lyrics therefore play an important role in music similarity. This textualinformation thus offers a wealth of additional information to be included in music retrievaltasks that may be used to complement both acoustic as well as metadata information forpieces of music.
We therefore address two main issues in this paper, namely (a) the importance andrelevance of lyrics to the visual organisation of songs in large audio collections and (b)spreading measurements for the comparison of multi-modal map visualisations. Moreover,we try to show that text representations of songs are feasible means of access and retrieval.
1http://www.apple.com/au/itunes/store/2http://www.magnatune.com
We will try to show that multi-modal clusterings, i.e. clusterings based on audio features incombination with clusterings based on song lyrics, can be visualised on an intuitive linkedmap metaphor, serving as a convenient interface for exploring music collections from differentpoints of view.
The remainder of this paper is organised as follows. The first section gives an overviewabout research conducted in the field of Music Information Retrieval, particularly dealingwith lyrics and other external data such as e.g. artist biographies. We present our contri-butions, namely the visualisation of multi-modal clusterings based on connections betweenmultiple clusterings, as well as suitable quality measurements in the ‘Multi-Modal Cluster-ings’ section. In the experiments section, a set of experiments on a parallel corpus comprisingalmost 10.000 pieces of music is used to validate the proposed approach. Finally, we drawconclusions and give an outlook on future work.
Related Work
Research in Music Information Retrieval comprises a broad range of topics including genreclassification, visualisation and user interfaces for audio collections. First experiments oncontent based audio retrieval were reported in (Foote 1999) as well as (Tzanetakis & Cook2000), focusing on automatic genre classification. Several feature sets have since been devisedto capture the acoustic characteristics of audio material. In our work we utilise StatisticalSpectrum Descriptors (SSD) (Lidy & Rauber 2005), which have shown to yield good resultsat a manageable dimensionality of 168 features. These have been used both for musicclustering as well as genre classification. An overview of existing genre taxonomies as well asthe description of a new one are given in (Pachet & Cazaly 2000), pointing out the relevance ofthe genre concept. This work also underpins our ambitions to further explore the differencesin between genres according to their spread in clustering analysis. An investigation aboutthe merits of and possible improvements for musical genre classification, placing emphasis onthe usefulness of both the concept of genre itself as well as the applicability and importanceof musical genre classification, is conducted in (McKay & Fujinaga 2006).
With respect to music clustering, the SOMeJB system (Rauber & Fruhwirth 2001) pro-vides a map-based interface to music collections utilising Self-Organising Maps (SOMs).This system forms the basis for the work presented in this paper. Self-Organising Mapsare a tool for the visualisation of data, grouping similar objects closely together on a two-dimensional output space. Topological relations are preserved as faithfully as possible in theprocess (Kohonen 2001). A technique to train aligned Self-Organising Maps with graduallyvariable weighings of different feature sets is presented in (Pampalk 2003). This results ina stack of SOMs rather than two separate views of a data set, each trained on a slightlydifferent weighing of a combined feature space, allowing to analyse structural changes in theclustering resulting from the different degrees of influence of the features.

It might not be obvious why cluster validation makes sense, since clustering is often usedas part of explorative data analysis. One key argument in favour of cluster validation is thatany clustering method will produce results even on data sets which do not have a naturalcluster structure (Tan, Steinbach & Kumar 2005). Other than that, cluster validation canbe used to determine the ‘best’ clustering out of several candidate clusterings.
Several quality measures for mappings generated by the Self-Organising Map have beendeveloped. For example, the topographic product is used to measure the quality of mappingsfor single units with respect to their neighbours (Bauer & Pawelzik 1992).
However, no class information is taken into account when clusterings are validated withthis approach. If the data set is labelled, i.e. class tags are available for all data points, thisinformation can be used to determine the similarities between classes and natural clusterswithin the data. It can be distinguished between unsupervised and supervised cluster vali-dation techniques. Whereas unsupervised techniques will be of limited use in the scenariocovered, supervised cluster validation and its merits for multi-dimensional clustering of audiodata will be more relevant and be described in more detail.
Other approaches utilising class information include cluster purity, which may be appliedto the SOM in certain seetings when clear cluster boundaries have been identified on themap. When comparing the organisation of a data set based on two different feature setrepresentations on two separate maps, novel measures for cluster consistency across thedifferent views may be created by considering certain organisations as class labels.
User interfaces based on the Self-Organising Map as proposed in our SOMeJB sys-tem (Rauber & Merkl 1999, Rauber, Pampalk & Merkl 2003) are used by several teams,e.g. Ultsch et al. (Morchen, Ultsch, Nocker & Stamm 2005) or Knees et al. (Knees, Schedl,Pohle & Widmer 2006). Novel interfaces particularly developed for small-screen devices werepresented in (Vignoli, van Gulik & van de Wetering 2004) and (Neumayer et al. 2005). Theformer, an artist map interface, clusters pieces of audio based on content features as well asmetadata attributes using a spring model algorithm, while the latter, PocketSOMPlayer, isan extension of the SOMeJB system for mobile devices.
The practicability of the adaption of Information Retrieval techniques to heterogeneousdocument collections has been pointed out in (Favre, Bellot & Bonastre 2004), concentratingon speech rather than music, albeit on a textual level only. Language identification of songsbased on a song’s lyrics as well as sophisticated structural and semantic analysis of lyricsis presented in (Mahedero, Martınez, Cano, Koppenberger & Gouyon 2005). Similarityexperiments concentrating on artist similarity are performed in (Logan, Kositsky & Moreno2004). Further, it is pointed out that lyrics are somewhat inferior to acoustic similaritymeasures in terms of genre categorisation, but a combination of lyrics information and audiofeatures is suggested as possibility to improve overall performance, which also motivated theresearch reported in this paper. The combination of acoustic features with album reviewsand song lyrics for similarity retrieval is presented in (Baumann, Pohle & Vembu 2004). It
is also outlined in how far the perception of music can be regarded a socio-cultural productand consequently heavily influences the similarity concept in Music Information Retrieval.
The combination of lyrics and audio features for musical genre classification has been ex-plored in (Neumayer & Rauber 2007), coming to the conclusion that classification accuraciesper genre differ greatly in between feature spaces. Moreover, it is shown that comparableaccuracy can be achieved in a lower-dimensional space when combining text and audio.
Multi-Modal Clusterings
Music can be represented by different modalities. For individual songs abstract represen-tations are available according to different audio feature sets that can be calculated froma song’s waveform representation, while on the textual level we can consider song lyrics asan important source of additional information for music IR. There are several additionalviews possible not considered in this paper, such as, e.g., the scores and instrumentationinformation provided in MIDI files, artist biographies, album reviews or covers, and musicvideos.
Audio Features
For feature extraction from audio we rely on Statistical Spectrum Descriptors (SSD, (Lidy& Rauber 2005)). The approach for computing SSD features is based on the first part ofthe algorithm for computing Rhythm Pattern features (Rauber, Pampalk & Merkl 2002),namely the computation of a psycho-acoustically transformed spectrogram, i.e. a Bark-scaleSonogram. Compared to the Rhythm Patterns feature set, the dimensionality of the featurespace is much lower (168 instead of 1440 dimensions), at a comparable performance in genreclassification approaches (Lidy & Rauber 2005). Therefore, we employ SSD audio featuresin the context of this paper, which we computed from audio tracks in standard PCM formatwith 44.1 kHz sampling frequency (i.e. decoded MP3 files).
Statistical Spectrum Descriptors are composed of statistical moments computed fromseveral critical frequency bands of a psycho-acoustically transformed spectrogram. Theydescribe fluctuations on the critical frequency bands in a more compact representation thanthe Rhythm Pattern features. In a pre-processing step the audio signal is converted to amono signal and segmented into chunks of approximately 6 seconds. Usually, not everysegment is used for audio feature extraction. For pieces of music with a typical duration ofabout 4 minutes, frequently the first and last one to four segments are skipped and from theremaining segments every third one is processed.
For each segment the audio spectrogram is computed using the Short Time Fast Fourier
Transform (STFT). The window size is set to 23 ms (1024 samples) and a Hanning windowis applied using 50 % overlap between the windows. The Bark scale, a perceptual scalewhich groups frequencies to critical bands according to perceptive pitch regions (Zwicker &Fastl 1999), is applied to the spectrogram, aggregating it to 24 frequency bands.
The Bark scale spectrogram is then transformed into the decibel scale. Further psycho-acoustic transformations are applied: Computation of the Phon scale incorporates equalloudness curves, which account for the different perception of loudness at different frequen-cies (Zwicker & Fastl 1999). Subsequently, the values are transformed into the unit Sone.The Sone scale relates to the Phon scale in the way that a doubling on the Sone scale soundsto the human ear like a doubling of the loudness. This results in a Bark-scale Sonogram – arepresentation that reflects the specific loudness sensation of the human auditory system.
From this representation of perceived loudness a number of statistical moments is com-puted per critical band, in order to describe fluctuations within the critical bands extensively.Mean, median, variance, skewness, kurtosis, min- and max-value are computed for each ofthe 24 bands, and a Statistical Spectrum Descriptor is extracted for each selected segment.The SSD feature vector for a piece of audio is then calculated as the median of the descriptorsof its segments.
Lyrics Features
In order to process the textual information of the lyrics, the documents were tokenised,no stemming was performed. Stop word removal was done using the ranks.nl3 stop wordlist. Further, all lyrics were processed according to the bag-of-words model. Therein, adocument is denoted by d, a term (token) by t, and the number of documents in a corpusby N . The term frequency tf(d) denotes the number of times term t appears in documentd. The number of documents in the collection that term t occurs in is denoted as documentfrequency df(t). The process of assigning weights to terms according to their importance orsignificance for the classification is called ‘term-weighing’. The basic assumptions are thatterms that occur very often in a document are more important for classification, whereasterms that occur in a high fraction of all documents are less important. The weighing werely on is the most common model of term frequency inverse document frequency (Salton &Buckley 1988), where the weight tf × idf of a term in a document is computed as:
tf × idf(t, d) = tf(d) · ln(N/df(t)) (1)
This results in vectors of weight values for each document d in the collection. Based onthis representation of documents in vectorial form, a variety of machine learning algorithms
3http://www.ranks.nl/tools/stopwords.html

like clustering can be applied. This representation also introduces a concept of distance, aslyrics that contain a similar vocabulary are likely to be semantically related.
The resulting high-dimensional feature vectors were further downscaled to about 7.000dimensions out of 45.000 using feature selection via document frequency thresholding, i.e.the omitting of terms that occur in a very high or very low number of documents. TheSelf-Organising Map clustering was finally performed on that data set.
SOM Training and Visualisation
Once both of these feature sets are extracted for a collection of songs, the Self-Organising Mapclustering algorithm can be applied to map the same set of songs onto two Self-OrganisingMaps (we use Self-Organising Maps of equal size).
Generally, a Self-Organising Map consists of a number M of units ξi, the index i rangingfrom 1 to M . The distance d(ξi, ξj) between two units ξi and ξj can be computed as theEuclidean distance between the units’ coordinates on the map, i.e. the output space of theSelf-Organising Map clustering. Each unit is attached to a weight vector mi ∈ <n. Inputvectors, i.e. elements from the high-dimensional input space, x ∈ <n, are presented to theSOM and the activation of each unit for the presented input vector is calculated using anactivation function (commonly the Euclidean Distance). Subsequently, the weight vector ofthe winner, i.e. the closest unit for a particular input vector, is moved towards the presentedinput signal by a certain fraction of the Euclidean distance as indicated by a time-decreasinglearning rate α. Consequently, the next time the same input signal is presented, this unit’sactivation will be even higher. Further, the weight vectors of units neighbouring the winner,as described by a time-decreasing neighbourhood function, are modified accordingly, yet toa smaller amount as compared to the winner. The result of this learning procedure is atopologically ordered mapping of the presented input signals in two-dimensional space, thatallows easy exploration of the given data set.
In this paper, we train one map representing the collection in terms of lyric similarity, onein terms of audio similarity. Those maps will henceforth be referred to as audio and lyricsmap, respectively. We further propose to visualise the similarities and differences betweenthe two clusterings by drawing lines across maps which visually connect pieces of music.Linkages can be shown on different levels:
Track Each (selected) track on the audio map is connected to the same track on the lyricsmap. This allows the analysis of the characteristics of a certain piece of music by identifyingits acoustic as well as textual placement, i.e. to which clusters it belongs in the respectivemodality
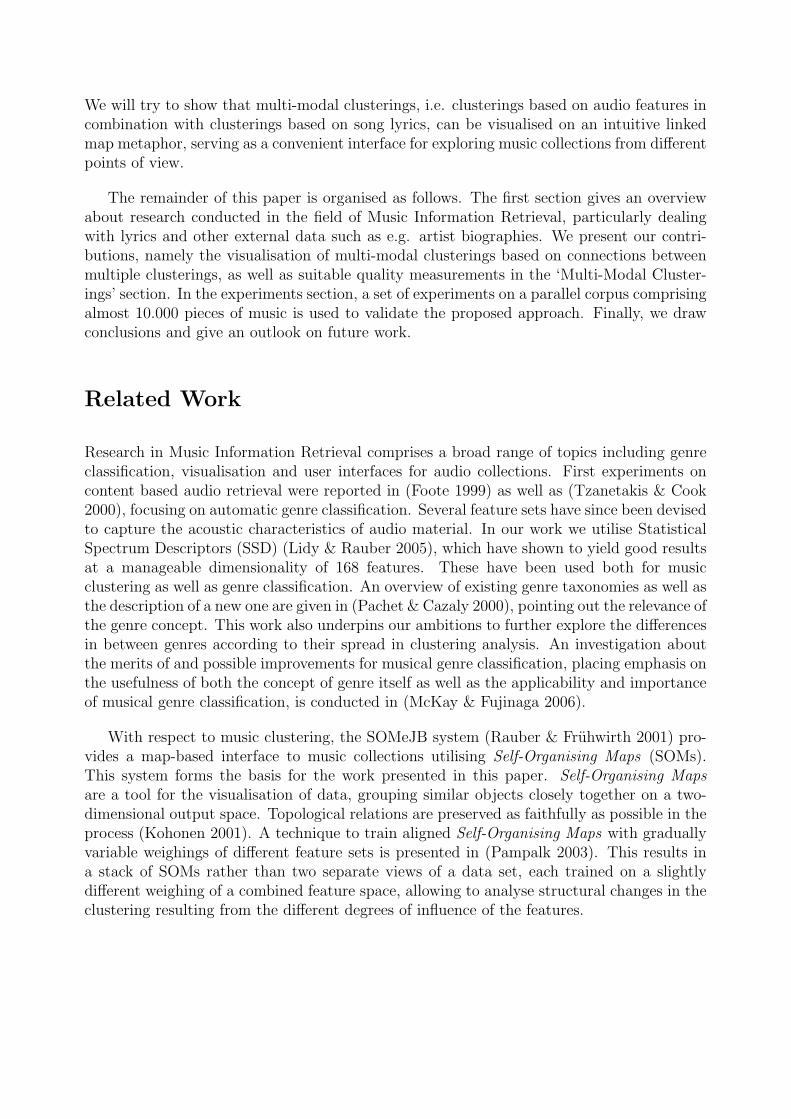
Figure 1: Clustering of songs centred around the love topic
Genre Each track of a selected genre is connected to all songs of the same genre on theother map. Here, the spread of a given genre can be inspected. For instance, whether a genreforms a consistent cluster in both modalities, or whether it does form a rather consistentcluster in, say, the textual domain, while it is rather spread across different clusters on theaudio map.
Artist Each track of the given artist on the audio map is connected to all songs of thesame artist on the lyrics map. This allows to analyse the textual or musical ’consistency’ ofa given artist or band.
Differences in Data Distribution Across Feature Spaces
Cluster Similarity and Dissimilarity
Similarity can be defined on several levels. For the Self-Organising Map the most importantways of calculating cluster similarity take into account the weight vectors assigned to singleunits as well as the distribution of instances over the map itself.
Lyrics Based Clustering
Figure 1 shows the distribution of genres on two particular units on a Self-Organising Maptrained on lyrics data. The pie chart display shows the numbers of songs belonging to thedifferent genres. The labelling of single units is done via the LabelSOM algorithm, via theidentification of discriminative components. In this case, the prominent key words ‘love’,‘baby’, ‘give’, ‘real’, and ‘need’ give a very good idea on the main topics of these songs’lyrics. The 50 songs, for instance, mapped onto the right unit of the Self-Organising Map
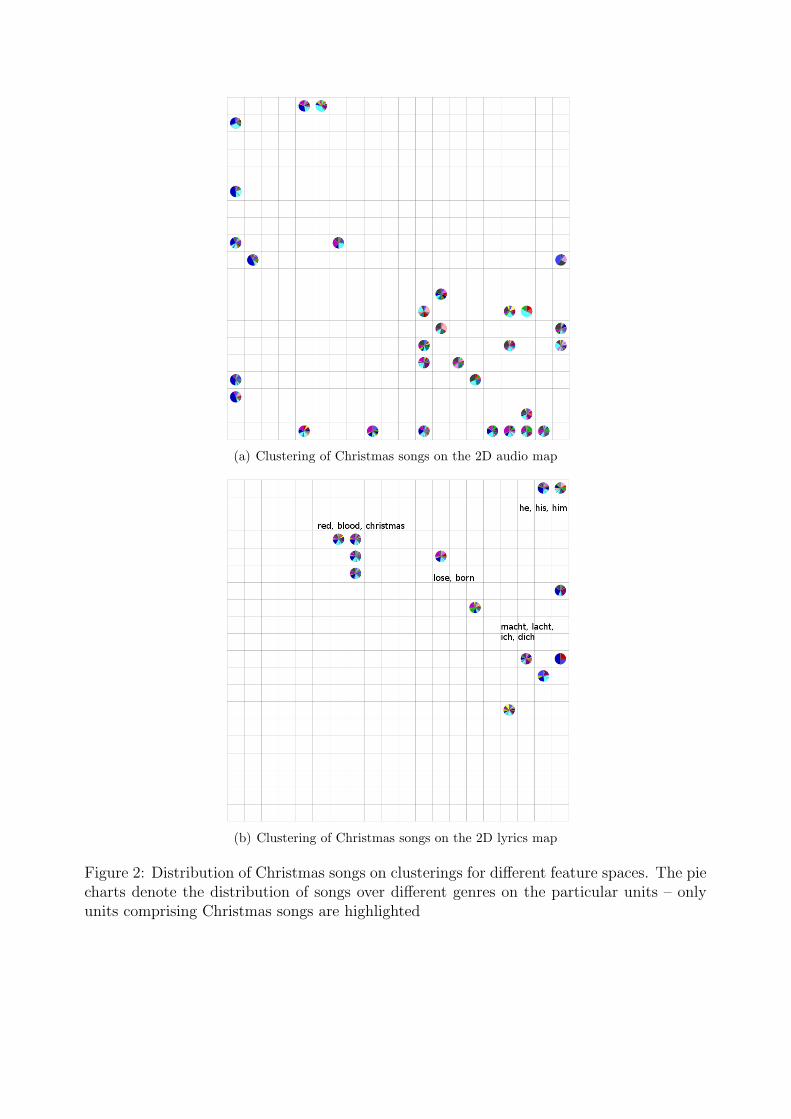
(a) Clustering of Christmas songs on the 2D audio map
(b) Clustering of Christmas songs on the 2D lyrics map
Figure 2: Distribution of Christmas songs on clusterings for different feature spaces. The piecharts denote the distribution of songs over different genres on the particular units – onlyunits comprising Christmas songs are highlighted
are distributed across 16 ‘traditional’ genres, the largest group being ‘R&B’ songs, followedby ‘Metal’ and ‘Indie’.
Artists whose songs are mapped onto this unit are, amongst others: ‘Mary J. Blige’,‘Beyonce’, ‘Christina Milian’, as well as ‘Wolfmother’ or the ‘Smashing Pumpkins’. This in-teresting mapping shows clearly that topics in song lyrics overcome traditional genre bound-aries, while pointing out that a categorisation on the lyrics level makes sense since all songscover similar topics.
Figure 2 shows the distribution of Christmas songs on the two-dimensional clusterings, thedistribution on the audio map is shown in Figure 2(a), and in Figure 2(b) on the lyrics map,respectively. In the former case, the 33 songs are mapped onto 30 units, in the latter only onto13. Hence, the lyrics clustering uncovers information such as vastly different interpretationsof one and the same song, that have the same lyrics, but differ greatly in sound. Manuallyassigned labels demonstrate the different key tokens present on the respective areas of themap, i.e. the ‘red / blood / christmas’ cluster on the top of the map. Due to the Self-Organising Map’s random initialisation, the fundamental differences in lyrics space, and thegeneral training algorithm, the songs are mapped onto different corners of the map. Forevaluation the absolute location on the map plays a less important role than the relativedistances. However, it is clear that the spread of songs differs from one clustering to theother. In the lyrics space, Christmas songs are clustered more closely to each other, whilstthey get spread over more units and occupy a larger space of the map in the audio space.The two interpretations of the song ‘The First Noel’, for example, are mapped onto one unitin the lyrics space. On the audio map, however, these songs lie on different units on differentregions of the map. The artists of the interpretations are the ‘Bright Eyes’ and ‘Saxofour’,even though the ‘Saxofour’ interpretation is instrumental, the lyrics space helps to uncoverthe similarity between the two songs.
Quality Measures for Parallel Self-Organising Map Clusterings
To determine the quality of the resulting Self-Organising Map clusterings we try to capturethe scattering of instances across the maps using meta information such as artist names orgenre labels as ground truth information. In general, the more units a set of songs is spreadacross, the more scattered and inhomogeneous the set of songs is. On the other hand, if weaccept ground truth values as reasonable structures expected to be revealed by the clustering,we should like to find songs from such sets to be clustered tightly on the map. In this section,we concentrate on distances in between units in terms of their position on the trained Self-Organising Map. The abstraction from the high-dimensional vector descriptions of instancesto the use of unit coordinates is feasible from both a computational as well as a conceptualpoint of view. Comparison of individual vectors does not take into consideration the verynature of the Self-Organising Map clustering algorithm, which is based on the preservation oftopological relations across the map. This approach therefore computes the spread for genres
or artists with respect to the Self-Organising Maps ’ clusterings. For distances between unitswe use the Euclidean distance on unit coordinates, which we also use for distances betweendata and unit vectors in the Self-Organising Map training process. All quality measurementsare computed for sets of data vectors and their two-dimensional positions on the trained Self-Organising Maps . Particularly, sets of data vectors refer to all songs belonging to a certaingenre or from a certain artist. In this context only units that have data points or songs thatbelong to a given category, i.e. a particular artist or genre, are considered. This holds forboth maps, all quality measurements can only be calculated with respect to a class tag, i.e.for songs belonging to a particular artist or genre. The average distance between these unitswith respect to a Self-Organising Map clustering is given in Equation 2, i.e. the pairwisedistances of all units (ξ) to each other.
avgdist =
∑ni=1
∑nj=1 d(ξ(i), ξ(j))
n2(2)
n denotes the number of data points or songs considered, i.e. the songs belonging to agiven artist or genre. Further, the average distance ratio defines the scattering differencebetween a set of two clusterings C = {caudio, clyrics}. caudio denotes an audio and clyrics alyrics clustering. The average distance ratio for two clusters is given as the ratio of theminimum and maximum values for the respective distances between units.
adraudio,lyrics =min(avgdistaudio, avgdistlyrics)
max(avgdistaudio, avgdistlyrics)(3)
The closer to the value of one the average distance ratio is, the more uniformly distributedare the data across the clusterings in terms of distances between units affected. However,this measure does not take into account the impact of units adjacent to each other, whichdefinitely plays an important role. Adjacent units should rather be treated as one unit thanseveral due to the similarity expressed by such results.
Therefore, the contiguity value co for a clustering c gives an idea of how uniformly aclustering is done in terms of distances between neighbouring or adjacent units. The specificsof adjacent units are taken into account, leading to different values for the minimum distancesbetween units since distances between adjacent units are omitted in the distance calculations.If, for example, the songs of a given genre are spread across three units on the map ξ1, ξ2, ξ3,where ξ1 and ξ2 are neighbouring units, the distances between ξ1 and ξ2 are not taken intoconsideration. Currently, no difference is made between units that are direct neighbours andunits only connected via other units. The contiguity distance cd is given in Equation 4,four-connectivity is used as neighbourhood function, i.e. only directly adjacent units aretaken into account.

co(ξi,ξj) =
{0 if ξi and ξj are neighbouring unitsd(ξi, ξj) otherwise
(4)
The contiguity value co is consequently calculated analogously to the average distanceratio based on contiguity distances. For cases of fully contiguous clusterings, i.e. where allunits a set of songs are mapped to are neighbouring units, the co value is not defined andset to the value of one. The overall contiguity ratio for a set of clusterings C and class j isgiven in Equation 5.
craudio,lyrics =min(coaudio, colyrics)
max(coaudio, colyrics)(5)
This information can be used to further weigh the adr value from Equation 3 as shownin Equation 6 and gives an average distance contiguity ratio value adr× cr, i.e. the productof average distance ratio and contiguity ratio, for a set of one audio and lyrics map.
adr × craudio,lyrics = adraudio,lyrics · craudio,lyrics (6)
This considers both the distances between all occupied units as well as it takes intoaccount the high relevance of instances lying on adjacent units of the Self-Organising Map.
A visualisation prototype was implemented for the simultaneous display of two musicmaps. Once connections are drawn on the maps, the connections between units are colouredaccording to their number of connecting units. The main idea is to allow for user selectionson one map and provide the simultaneous highlighting of songs on the other one. Theprototype allows for selection of
• Genres,
• Artists, and
• Tracks.
All selections are organised hierarchically according to the songs’ artist or genre tags, i.e.further selection refinements are possible. If the user selects, for instance, all songs from therock genre, all songs belonging to that genre are connected in the interactive 3D display ofthe Self-Organising Maps . Moreover, all single songs of that particular genre are displayedand the user can further refine his selection to a particular set of songs. The main userinterface is depicted in Figure 3. The largest part is occupied by the display of the twoSelf-Organising Maps on the right part. The 3D display offers ways to rotate the view as

Fig
ure
3:Full
vie
wof
the
vis
ual
isat
ion
pro
toty
pe.
The
vert
ical
map
clust
ers
songs
by
audio
feat
ure
s,th
ehor
izon
talm
apis
trai
ned
only
rics
feat
ure
s

Artist AC LC CR ADR ADR×CRSean Paul .3162 .1313 .4152 .4917 .2042
Good Riddance .0403 .0485 .8299 .7448 .6181Silverstein .0775 .1040 .7454 .8619 .6424
Shakespeare .2626 1.000 .2626 .3029 .0795Kid Rock .0894 .0862 .9640 .9761 .9410
Table 1: Artists with exceptionally high or low spreading values. AC denotes the audiocontiguity, LC the lyrics Contiguity, CR the contiguity ratio, ADR the average distanceratio, and ADR×CR the product of ADR and CR
well as pan and zoom in or out. Controls to select particular songs, artist or genres are onthe left side together with the palette describing the associations between colours and linecounts. Selections of artists or genres automatically update the selection of songs on the lefthand side. Several visualisations for single Self-Organising Maps have been proposed. In thiswork we use the Smoothed Data Histograms technique to colour-code the Self-OrganisingMaps (Pampalk, Rauber & Merkl 2002), even though the SOMToolbox application for 2Dclusterings supports a wide range of additional visualisations that could be used as a basisfor 3D visualisations as proposed in this paper. We relied on the same visualisation methodfor both audio and lyrics features. Of course, this is not necessary and different visualisationscould be deployed for the respective feature spaces and clusterings.
Experiments
For experimental evaluation we clustered a large private music collection according to bothaudio features and lyrics features. We then present examples for the browsing and explorativeanalysis of that collection.
Data Collection
We compiled a parallel corpus of audio and song lyrics files for a music collection of 7554 titlesorganised into 54 genres, containing music as well as spoken documents (e.g. Shakespearesonnets). Genres were assigned manually. Class sizes ranged from only a few songs for the‘Classical’ genre to about 1.900 songs for ‘Punk Rock’, due to both the distribution acrossgenres in the collection and difficulties in retrieving the lyrics for some genres like ‘Classical’.The collection contains songs from 644 different artists and 931 albums. For each song lyricsfeatures as well as audio features (Statistical Spectrum Descriptor) were computed. We thentrained two Self-Organising Maps of size 20 × 20, i.e. 400 units, one on the audio feature
set, one on lyrics.
To retrieve lyrics for songs, three portals were accessed, using artist name and track titleas queries. If the results from lyrc.com.ar were of reasonable size, these lyrics were assignedto the track. If lyrc.com.ar failed, sing365lyrics.com would be checked for validity by asimple heuristic, then oldielyrics.com.
Noticeable Artists
Table 1 shows a selection of particularly interesting artists with respect to their positions onthe maps. A total of 18 ‘Sean Paul’ songs are mapped on each Self-Organising Map. For theaudio map, the songs are distributed amongst seven different units, eleven being mappedonto one unit. On the lyrics map, all songs are mapped onto two adjacent units, the firstone covering 17 out of the 18 tracks.
The situation is different for ‘Good Riddance’, a Californian ‘Punk Rock’ band. For thelyrics map, their 27 songs are spread across 20 units. For audio, the songs lie on 18 units,but some of them are adjacent units, a fact that is represented by a rather high value forAC, the audio contiguity measure.
Shakespeare sonnets are clustered in a similar way. In terms of lyrics the six sonnets lieon two units, whereas the audio representations are mapped on three units, non of whichwere adjacent (only one sonnet is read by a male voice).
‘Kid Rock’ songs, mainly ‘Country’ tracks, lie on 13 units on the audio map, includingtwo adjacent units, compared to 11 units in the lyrics space, none of which are adjacent.The spread is therefore almost identical on both maps. Figure 4 shows the 3D visualisationfor all ‘Kid Rock’ songs.
Noticeable Genres
Analogously to the artists, we identified genres of interest in Table 2. ‘Rock’ music hasproven to be the most diverse genre in terms of audio features and rather diverse in termsof lyrics features alike. There were 690 songs assigned to that genre in the test collection.The overall adr × cr measure is still rather high due to the impact of adjacent units onboth maps. ‘Speech’ as well as ’Christmas Carols’, on the other hand, are rather diverse interms of audio similarity, but are more concentrated on the lyrics (or text) level, yielding ina low adr × cr value. Figure 5 shows the connections between all ‘Christmas’ songs, givingan interesting idea about the differences in distributions on the maps, c.f. Figure 2. Thesimilarity of ‘Reggae’ music is defined by acoustic and lyrics features to an equal amount.This genre has rather high values for adr and cr, caused by a high number of adjacent units
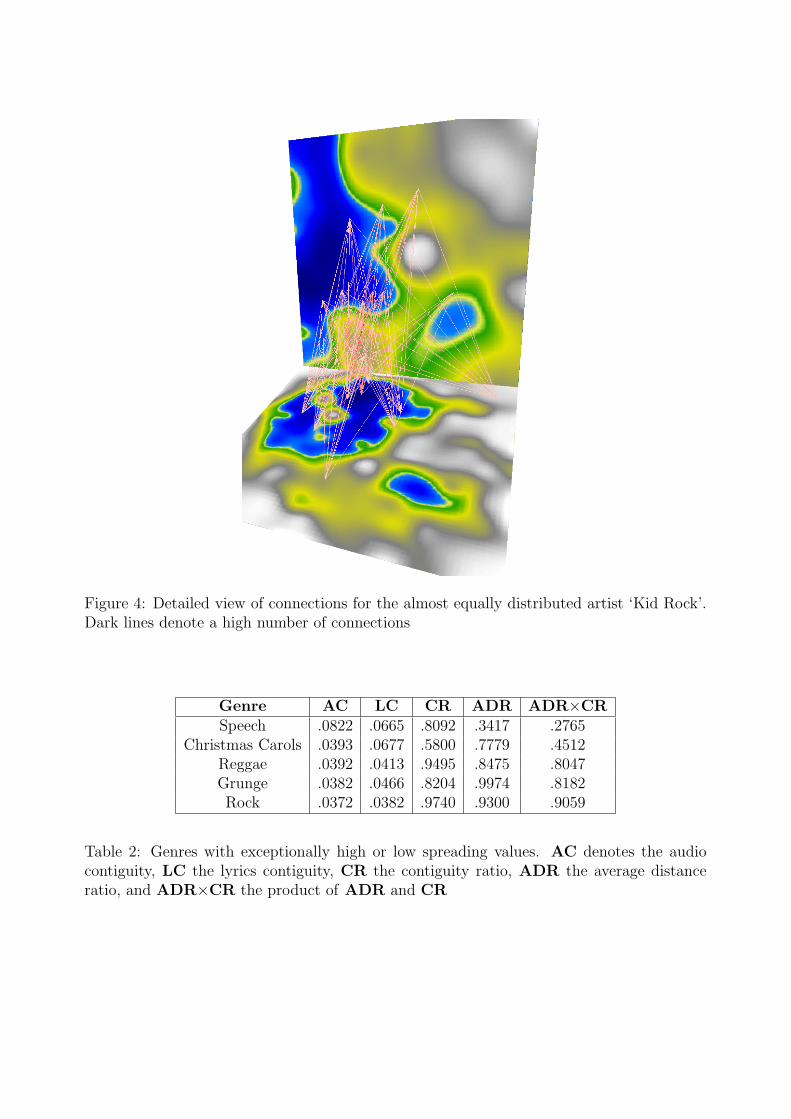
Figure 4: Detailed view of connections for the almost equally distributed artist ‘Kid Rock’.Dark lines denote a high number of connections
Genre AC LC CR ADR ADR×CRSpeech .0822 .0665 .8092 .3417 .2765
Christmas Carols .0393 .0677 .5800 .7779 .4512Reggae .0392 .0413 .9495 .8475 .8047Grunge .0382 .0466 .8204 .9974 .8182Rock .0372 .0382 .9740 .9300 .9059
Table 2: Genres with exceptionally high or low spreading values. AC denotes the audiocontiguity, LC the lyrics contiguity, CR the contiguity ratio, ADR the average distanceratio, and ADR×CR the product of ADR and CR
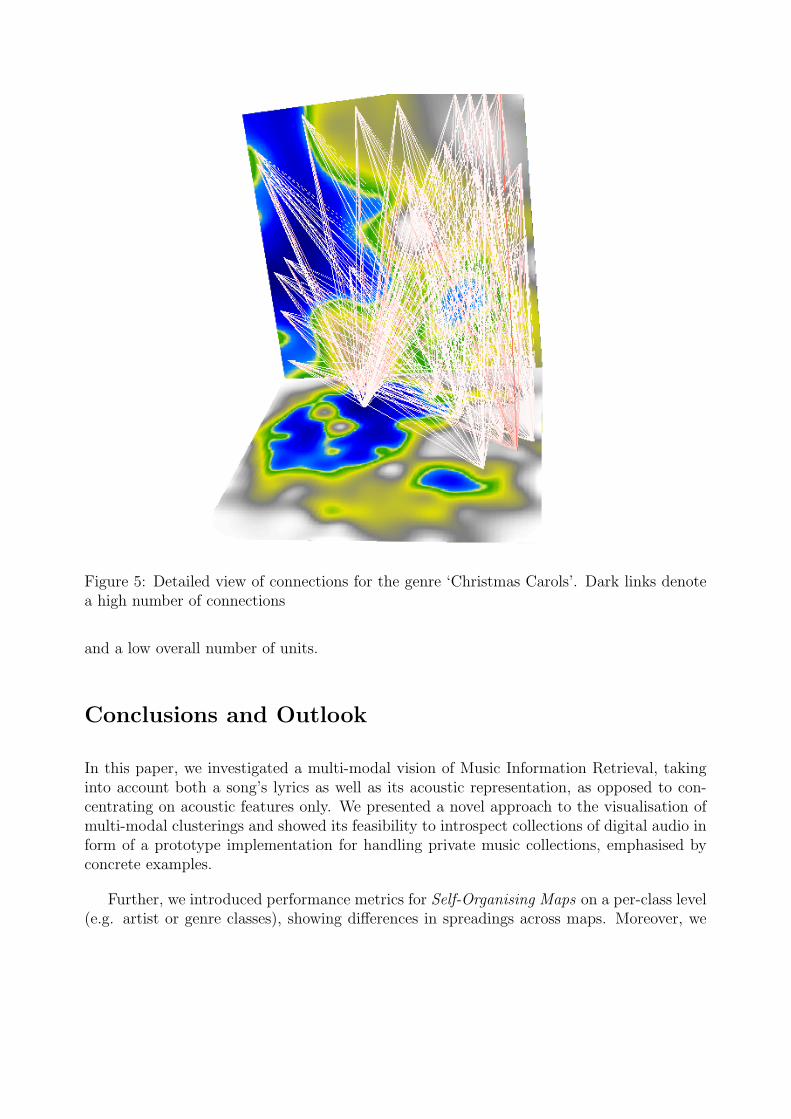
Figure 5: Detailed view of connections for the genre ‘Christmas Carols’. Dark links denotea high number of connections
and a low overall number of units.
Conclusions and Outlook
In this paper, we investigated a multi-modal vision of Music Information Retrieval, takinginto account both a song’s lyrics as well as its acoustic representation, as opposed to con-centrating on acoustic features only. We presented a novel approach to the visualisation ofmulti-modal clusterings and showed its feasibility to introspect collections of digital audio inform of a prototype implementation for handling private music collections, emphasised byconcrete examples.
Further, we introduced performance metrics for Self-Organising Maps on a per-class level(e.g. artist or genre classes), showing differences in spreadings across maps. Moreover, we

introduced measurements for the comparison of multi-dimensional clusterings and showedtheir application to identify genres or artists of particular interest.
Future work will mainly deal with the further exploitation of multi-faceted representationsof digital audio. The impact of lyrics data on classification performance in musical genrecategorisation as well as possible improvements will be investigated. Further, we plan toprovide a more elaborate user interface that offers sophisticated search capabilities.
Besides, the possibilities of automatically adding metadata to audio files through multi-modal representations will be explored in connection with semantic analysis or automaticconcept identification in music. An interesting application of this would be automatic musicalgenre classification, emphasising on the additional information contained in a song’s lyricsas opposed to purely acoustic approaches currently being in use. Moreover, the investigationand evaluation of advanced feature sets for the lyric space will play an important role infuture work.
Acknowledgements
Parts of this work were supported by the European Union in the 6. Framework Program, IST,through the MUSCLE NoE on Multimedia Understanding through Semantics, Computationand Learning, contract 507752.
References
Bauer, H.-U. & Pawelzik, K. R. (1992), ‘Quantifying the neighborhood preservation of self-organizing feature maps’, Transactions on Neural Networks 3(4), 460–465.
Baumann, S., Pohle, T. & Vembu, S. (2004), Towards a socio-cultural compatibility of mirsystems., in ‘Proceedings of the 5th International Conference of Music InformationRetrieval (ISMIR’04)’, Barcelona, Spain, pp. 460–465.
Favre, B., Bellot, P. & Bonastre, J.-F. (2004), Information retrieval on mixed writtenand spoken documents, in ‘Proceedings of Coupling approaches, coupling media andcoupling languages for information retrieval (RIAO’04) Conference’, Avignon, France,pp. 826–835.
Foote, J. (1999), ‘An overview of audio information retrieval’, Multimedia Systems 7(1), 2–10.
Knees, P., Schedl, M., Pohle, T. & Widmer, G. (2006), An Innovative Three-DimensionalUser Interface for Exploring Music Collections Enriched with Meta-Information from

the Web, in ‘Proceedings of the ACM Multimedia 2006 (ACMMM’06)’, Santa Barbara,California, USA, pp. 17–24.
Kohonen, T. (2001), Self-Organizing Maps, Vol. 30 of Springer Series in Information Sci-ences, 3rd edn, Springer, Berlin.
Lidy, T. & Rauber, A. (2005), Evaluation of feature extractors and psycho-acoustic trans-formations for music genre classification, in ‘Proceedings of the 6th International Con-ference on Music Information Retrieval (ISMIR’05)’, London, UK, pp. 34–41.
Logan, B., Kositsky, A. & Moreno, P. (2004), Semantic analysis of song lyrics, in ‘Proceedingsof the 2004 IEEE International Conference on Multimedia and Expo (ICME’04)’, IEEEComputer Society, Taipei, Taiwan, pp. 827–830.
Mahedero, J. P. G., Martınez, A., Cano, P., Koppenberger, M. & Gouyon, F. (2005), Naturallanguage processing of lyrics, in ‘Proceedings of the 13th annual ACM internationalconference on Multimedia (ACMMM’05)’, ACM Press, New York, NY, USA, pp. 475–478.
McKay, C. & Fujinaga, I. (2006), Musical genre classification: Is it worth pursuing andhow can it be improved?, in ‘Proceedings of the 7th International Conference on MusicInformation Retrieval (ISMIR’06)’, Victoria, BC, Canada, pp. 101–106.
Morchen, F., Ultsch, A., Nocker, M. & Stamm, C. (2005), Databionic visualization of musiccollections according to perceptual distance, in ‘Proceedings of the 6th InternationalConference on Music Information Retrieval (ISMIR’05)’, London, UK, pp. 396–403.
Neumayer, R., Dittenbach, M. & Rauber, A. (2005), PlaySOM and PocketSOMPlayer: Al-ternative interfaces to large music collections, in ‘Proceedings of the 6th InternationalConference on Music Information Retrieval (ISMIR’05)’, Queen Mary, University ofLondon, London, UK, pp. 618–623.
Neumayer, R. & Rauber, A. (2007), Integration of text and audio features for genre classifi-cation in music information retrieval (accepted for publication), in ‘Proceedings of the29th European Conference on Information Retrieval (ECIR’07)’, Rome, Italy.
Pachet, F. & Cazaly, D. (2000), A taxonomy of musical genres, in ‘Proceedings of Content-Based Multimedia Information Access Conference (RIAO’00)’, Paris, France, pp. 827–830.
Pampalk, E. (2003), Aligned self-organizing maps, in ‘Proceedings of the Workshop on Self-Organizing Maps (WSOM’03)’, Kyushu Institute of Technology, Kitakyushu, Japan,pp. 185–190.
Pampalk, E., Rauber, A. & Merkl, D. (2002), Using Smoothed Data Histograms for ClusterVisualization in Self-Organizing Maps, in ‘Proceedings of the International Conferenceon Artifical Neural Networks (ICANN’02)’, Springer, Madrid, Spain, pp. 871–876.

Rauber, A. & Fruhwirth, M. (2001), Automatically analyzing and organizing music archives,in ‘Proceedings of the 5th European Conference on Research and Advanced Technologyfor Digital Libraries (ECDL’01)’, LNCS, Springer, Darmstadt, Germany, pp. 402–414.
Rauber, A. & Merkl, D. (1999), The SOMLib digital library system, in ‘Proceedings of the3rd European Conference on Research and Advanced Technology for Digital Libraries(ECDL’99)’, Lecture Notes in Computer Science (LNCS 1696), Springer, Paris, France,pp. 323–342.
Rauber, A., Pampalk, E. & Merkl, D. (2002), Using psycho-acoustic models and self-organizing maps to create a hierarchical structuring of music by musical styles, in‘Proceedings of the 3rd International Symposium on Music Information Retrieval (IS-MIR’02)’, Paris, France, pp. 71–80.
Rauber, A., Pampalk, E. & Merkl, D. (2003), ‘The SOM-enhanced JukeBox: Organizationand visualization of music collections based on perceptual models’, Journal of NewMusic Research 32(2), 193–210.
Salton, G. & Buckley, C. (1988), ‘Term-weighting approaches in automatic text retrieval’,Information Processing and Management 24(5), 513–523.
Tan, P.-N., Steinbach, M. & Kumar, V. (2005), Introduction to Data Mining, Addison-Wesley.
Tzanetakis, G. & Cook, P. (2000), ‘Marsyas: A framework for audio analysis’, OrganizedSound 4(30), 169–175.
Vignoli, F., van Gulik, R. & van de Wetering, H. (2004), Mapping music in the palm of yourhand, explore and discover your collection, in ‘Proceedings of the 5th InternationalConference on Music Information Retrieval (ISMIR’04)’, Barcelona, Spain, pp. 409–414.
Zwicker, E. & Fastl, H. (1999), Psychoacoustics, Facts and Models, Vol. 22 of Series ofInformation Sciences, 2 edn, Springer, Berlin.