multi-objective optimization in aspergillus ... · list of symbols a p protease yield with respect...
TRANSCRIPT

Chaitali Mandal Æ Ravindra D. Gudi
G. K. Suraishkumar
Multi-objective optimization in Aspergillus niger fermentationfor selective product enhancement
Abstract Amulti-objective optimization formulation thatreflects the multi-substrate optimization in a multi-prod-uct fermentation is proposed in this work. This formula-tion includes the application of e-constraint to generatethe trade-off solution for the enhancement of one selectiveproduct in a multi-product fermentation, with simulta-neous minimization of the other product within athreshold limit. The formulation has been applied to thefed-batch fermentation of Aspergillus niger that producesa number of enzymes during the course of fermentation,and of these, catalase and protease enzyme expressionhave been chosen as the enzymes of interest. Also, thisproposed formulation has been applied in the environ-ment of three control variables, i.e. the feed rates of su-crose, nitrogen source and oxygen and a set of trade-offsolutions have been generated to develop the pareto-optimal curve. We have developed and experimentallyevaluated the optimal control profiles for multiple sub-strate feed additions in the fed-batch fermentation of A.niger to maximize catalase expression along with proteaseexpression within a threshold limit and vice versa. Anincrease of about 70% final catalase and 31% final pro-tease compared to conventional fed-batch cultivationwere obtained. Novel methods of oxygen supply throughliquid-phase H2O2 addition have been used with a view toovercome limitations of aeration due to high gas–liquidtransport resistance. The multi-objective optimizationproblem involved linearly appearing control variablesand the decision space is constrained by state and endpoint constraints. The proposed multi-objective optimi-zation is solved by differential evolution algorithm, a
relatively superior population-based stochastic optimi-zation strategy.
List of symbols
aP protease yield with respect to cell (unit pro-tease (kg cell mass)�1)
bP protease yield with respect to maintenance(unit protease (kg cell mass)�1 s�1)
C concentration of sucrose (kg m�3)Cfeed sucrose concentration in feed (kg m�3)CR crossover factord hyphal diameter (m)Ei intracellular enzyme (catalase) (kmol (kg-
cell)�1)F feed rate (m3 s�1)FC sucrose feed rate (m3 s�1)FH hydrogen peroxide feed rate (m3 s�1)FN nitrogen source feed rate (m3 s�1)H hydrogen peroxide concentration in the med-
ium (kmol m�3)Hfeed hydrogen peroxide concentration in feed
(kmol m�3)Hi hydrogen peroxide concentration in the cell
(kmol m�3)K rate constant for enzymatic reaction inside the
cell (kmol m�3)�1 s�1)KC monod type constant for sucrose (kg m�3)Kd rate constant for enzymatic reaction in the
medium (kmol m�3)�1 s�1)KH hydrogen peroxide permeability across the cell
envelope (m s�1)KHi
monod type constant for intracellular hydro-gen peroxide (kmol m�3)
Ki inhibition constant for hydrogen peroxide inthe medium (kmol m�3)
KN monod type constant for nitrogen source(kg m�3)
N nitrogen source concentration (kg m�3)Nd number of discretizations in fermentation
time
C. Mandal Æ R. D. GudiDepartment of Chemical Engineering, IIT Bombay, 400 076 Powai,Mumbai, India
G. K. SuraishkumarBiotechnology Department, IIT Madras, 600 036 Chennai, India

Nfeed nitrogen source concentration in feed(kg m�3)
NP population sizePcat catalase concentration (kmol m�3)Pprot protease concentration (U m�3)qP catalase yield with respect to cell (kmol cata-
lase (kg cell mass)�1)V reactor volume (m3)Vf maximum working volume of the reactor
(m3)X cell concentration (kg m�3)YC/X inverse of cell yield with respect to sucroseYC/peat inverse of catalase yield with respect to
sucroseYC/Ppeat inverse of protease yield with respect to
sucroseYN/X inverse of cell yield with respect to nitrogen
source
Greek letters
e penalty factorlm maximum specific growth rate (s�1)q density of the cell (kg m�3)
Subscripts
f final time
Introduction
Many industrial bioprocesses involve expression of morethan one product during the course of fermentation.Optimization of such bioprocesses therefore needs to befocussed towards obtaining more favourable productexpression rates, so that (i) the substrate is better utilizedtowards the main product of interest and (ii) down-stream processing towards separation of the desiredproduct, in the presence of other side products, is facil-itated. Thus, a multi-objective optimization problemresults when one includes constraints on the expressionrates/final concentrations on the other products. Theapplication of multi-objective optimization to fermen-tation problems has not been extensively explored so far,but has been useful in the context of the chemical pro-cess applications [1]. However, multi-objective optimi-zation is quite relevant in fermentation that has anumber of different product expressions (for example, anumber of enzymes could be expressed). The design ofan optimal control strategy in a multi-product fed-batchfermentation involves the development of a substratefeeding strategy that maximizes a given performanceindex and simultaneously accommodates other con-flicting or non-conflicting objectives, subject to severalphysical constraints arising out of the nature of theproblem. The optimization procedure requires a reliabledynamic model of the system that typically includes the
mass balances on biomass growth, substrate consump-tion and product formation.
In most of the cases considered in the biochemicalengineering literature, the optimization of fed-batchprocesses has involved a single operating variable.However, to better optimize a fed-batch process, multi-ple operating variables can also be simultaneouslyoptimized [2]. Such optimizations result in optimal timeprofiles for several variables say, the concentration ofcarbon, nitrogen and oxygen (substrates). This necessi-tates the regulation of those substrate levels in the bio-reactor during optimal operation. The optimization in amulti-product fermentation typically includes the endpoint constraint to reflect realistic bounds on the finallevels of product concentrations. Also, optimization offed-batch fermentations could typically include state-path and end point constraints. For example, a typicalend point constraint could be the level of substrate at theend of fermentation; a typical state-path constraintcould include bounds on the substrate level at any in-stant in time. Thus, the overall problem of arriving atoptimal profiles of multiple substrates, while accom-modating state-path and end point constraints, is fairlycomplex and interesting.
Generally, multi-objective optimization deals withmore than one conflicting types of objective functionsand if both the objective functions are equally important(in case of two objectives), then it is impossible tocompletely satisfy the two objective functions simulta-neously. Therefore, multi-objective optimization resultsin a trade-off solution between the two objective func-tions. An evolutionary algorithm (EA) is one of thepopular means to solve the multi-objective optimizationproblem. The solution of such optimization follows thepreference-based approach where a relative preferencevector is used to scalarize a multiple objective. In clas-sical search, the optimization methods use a point-by-point approach, where one solution in each iteration ismodified to a better solution and results in a singleoptimized solution. Therefore, the use of classical searchwould motivate the preference-based approach to gen-erate a single optimized solution in a single run. Thus,one approach and solution could be to convert themulti-objective optimization problem to a single objec-tive optimization and use classical search [3]. A numberof other approaches based on the concept of non-elitismin evolutionary computation have also been proposed [3]and applied to engineering problems [1].
One major difficulty in optimal control problemarises when the control variable appears linearly in thestate equations as well as in the Hamiltonian; this resultsin a singular control problem [4]. In the majority of theavailable literature, the Pontryagin’s principle [5, 6] hasbeen used to solve the singular control problem. Thesingular control problem is normally difficult to solve,for a constraint-bound complex optimization problemconsists of four or more dynamic balance equationsdescribing the system. It is possible to transform a sin-gular problem formulation to a relatively easier non-
150

singular problem formulation depending on the struc-ture of the state equations [7–9]. But again, transfor-mations to convert the problem from singular to non-singular for a constraint-bound optimization problemare not easy to find.
Evolutionary algorithms are therefore increasinglybecoming popular to solve complex optimization prob-lems. Differential evolution (DE), as developed by Stornand Price [10] in 1996, is one of the relatively superiorpopulation-based evolutionary algorithms. It is a sto-chastic parallel direct search method that operates on apopulation of potential solutions by applying the prin-ciple of the survival of the fittest to produce an optimalsolution. It is capable of solving problems involvinggeneral constraints, as shown in Chiou and Wang [11].However, the DE strategy has not been applied to solvea multi-objective optimization problem involvingmanipulation of addition rates for multiple substrates.Further, the experimental evaluations of the optimiza-tion strategies are not widely reported.
This work is concerned with the development ofoptimal control profiles for maximizing selected enzymeexpressions through appropriate manipulations of mul-tiple substrate additions. The system of focus is the fed-batch fermentation involving the organism Aspergillusniger which is an industrially important filamentousfungi due to its versatile application for the productionof various enzymes and acids. We specifically focus onthe expressions rates for two of these enzymes, viz.,catalase and protease, in this study. Catalase is a heme-containing enzyme that is present in almost all aerobicorganisms and it protects the cell against the damagingeffects of H2O2 [12]. Protease is one of the most widelyused industrial enzymes [13] and is involved in the pro-teolytic degradation [14]. A liquid phase oxygen supplystrategy (LPOS) through need-based liquid phase H2O2
addition has been used for this system with a view toovercome limitations of aeration due to high gas–liquidtransport resistance [15]. In this study as well, we con-sider this mode of oxygen supply and seek to optimizethe liquid phase peroxide additions. Other substratesthat are crucial to the fermentation are the sucrose andnitrogen levels, which we also seek to optimize. Theproblem is also typically (upper) bounded by the H2O2
level in the fermentation, which is treated in our work asa path constraint. We additionally impose end pointconstraints to minimize residual levels of substrates atthe end of the fermentation. High levels of protease andcatalase at the end of fermentation poses a problem inthe downstream separation of these enzymes [13, 16–18].Therefore, we seek to optimize conditions in thefermentation that maximize expressions of one of theproducts (say, catalase) while keeping the other product(say, protease) expressions within threshold limits. Weshow that a multi-objective optimization problem thusresults and the objectives are conflicting. To solve thiscomplex multi-objective optimization problem, we pro-pose the use of the DE algorithm. We demonstrate theapplicability of the proposed methodology through
simulations and experimental validations involving fed-batch fermentation of A. niger.
Process model
The production of catalase and protease enzyme byA. niger, with liquid phase H2O2 addition as an alterna-tive source of oxygen, has been chosen as the modelsystem. Of these, catalase is expressed as a growth-asso-ciated product, whereas the protease is expressed as anon-growth-associated product. Since catalase is agrowth-associated product, its expression rate increaseswith cell growth and then there is a decrease in catalaseproduction as the cell growth reaches its stationary phase.Therefore, if catalase is chosen to be the enzyme ofinterest, one of the objectives of this optimization prob-lem is to maintain the cell growth at its exponential phasein order to maximize the catalase production. On theother hand, the protease production occurs both inexponential and stationary growth phases with a signifi-cant production occurring in the stationary phase.Therefore, to maximize protease, the other objective ofthis optimization is to maintain a prolonged stationaryphase tomaximize the protease production. However, fora fixed time of fermentation, depending on which enzymeexpression is sought to be maximized, the optimizationalgorithm would have to look at balancing these growthphase or stationary phase related objectives, so as tosatisfy various constraints imposed on the problem.
Towards this end, it is necessary to first develop thedynamic process model for themold system, which can beused for both catalase and protease maximization runs.Since the growth model criteria are different in the maxi-mization of these two different products, a simple growthmodel was developed using the logarithmic phase only.Themechanism of oxygen availability fromH2O2 [19] hasalso been considered while developing the model.
It has been observed from the experimental data thatincreased H2O2 concentration (within toxic thresholds)in the broth results in a 26% enhancement in the cata-lase production. Also, it is well known that the cell has anatural tendency to produce catalase to avoid the per-oxide toxicity in the broth [20, 21]. This is true in eithercase of H2O2 concentration increase, viz., by externaladdition or by the expression from the microorganismsthemselves. In contrary, the effect of increased H2O2
concentration on protease production is almost negligi-ble. Accordingly, therefore, the catalase and the proteasemodels have been developed by taking care of the effectsof H2O2 on them.
In a submerged culture, the A. niger grows either asa hyphal element (dispersed mycelia) or as a pelletedform [22]. The hyphal morphology affects the rheo-logical properties of the broth and imposed high vis-cosity. The mechanism of the filamentous growth iscomplicated and different from that of unicellulargrowth. All the cells within the mycelium take part inthe production of the protoplasm but the extension of
151
the hypha occurs only at the tips. The total length ofthe hyphae may increase exponentially due to the for-mation of the new tips along the hyphae [23]. There-fore, the model is based on a simple assumption tomeasure the cell surface area for H2O2 diffusion. It isassumed that all the hyphal growth together formed anequivalent single solid cylindrical hypha whose equiv-alent diameter, d, is constant and the hyphal length, l,increases with time. Therefore, the area of the singlehypha can be written as
A ¼ pdlþ pd2
2¼ 4XV
dqþ pd2
2: ð1Þ
The dynamic mass balance equations for the fed-batchfermentation involving the addition of sucrose andnitrogen sources and H2O2 can be written as follows:
A mass balance for H2O2 in the medium, consideringthat the flux of H2O2 in the cell is proportional to thedifference in H2O2 concentrations between the mediumand cell, and also considering the decomposition ofH2O2 by extracellular catalase, can be written as
dHdt¼ FHHfeed
V� ðFH þ FC þ FNÞH
V
� KH4XVdqþ pd2
2
� �ðH � HiÞ
V� KdPcatH : ð2Þ
A balance on the H2O2 concentration, considering thecell as the system, yields the following dynamic balancein terms of the intracellular hydrogen peroxide concen-tration, Hi,
dHi
dt¼ KH
4XVdqþ pd2
2
� �H � Hið Þ q
XV
� ðFH þ FC þ FNÞHi
V� KEiHiq
� Hilm
Ki
ðKi þ HÞN
ðKN þ NÞ : ð3Þ
In Eq. 3, the last term on the right hand represents theuptake of intracellular H2O2 due to growth.
The specific growth rate, l, is dependent on the H2O2
concentration and nitrogen levels in the medium. Thedependency on H2O2 is modelled assuming enzymeinhibition kinetics in which nitrogen is considered as alimiting growth factor. The dynamic equation describingcell growth can be written as
dXdt¼ lmX
Ki
ðKi þ HÞN
ðKN þ NÞ �ðFH þ FC þ FNÞX
V: ð4Þ
The dynamic equation for the catalase production, agrowth-associated product, is written as
dPcat
dt¼ qPlmX
Ki
ðKiþHÞN
ðKNþNÞHi
ðKHiþHiÞ
CðKCþCÞ
�ðFHþFCþFNÞPcat
V; ð5Þ
where intracellular H2O2 level and sucrose concentrationwere considered as the limiting factors on catalaseproduct formation.
The dynamic equation for the protease formation, anon-growth-associated product, is developed from Lu-edeking–Piret model where sucrose is considered as thelimiting nutrient. The dynamic equation for the productformation is written as
dPprot
dt¼ aPlmX
Ki
ðKi þ HÞN
ðKN þ NÞ þ bPX� �
CðKC þ CÞ
� ðFH þ FC þ FNÞPprot
V:
ð6ÞThe mass balances for sucrose and nitrogen concentra-tions in the medium were represented by the followingequations:
dCdt¼FCCfeed
V�ðFHþFCþFNÞC
V�YC=X lmX
Ki
ðKiþHÞN
ðKNþNÞ
�YC=peatqPlmXKi
ðKiþHÞN
ðKNþNÞHi
ðKHiþHiÞ
CðKCþCÞ
�YC=Pprot aPlmXKi
ðKiþHÞN
ðKNþNÞþbPX� �
CðKCþCÞ;
ð7Þ
dNdt¼ FNNfeed
V� ðFH þ FC þ FNÞN
V
� YN=X lmXKi
ðKi þ HÞN
ðKN þ NÞ : ð8Þ
Finally, the variation of the broth volume as a functionof the addition rates of the three substrates can bewritten as
dVdt¼ FH þ FC þ FNð Þ: ð9Þ
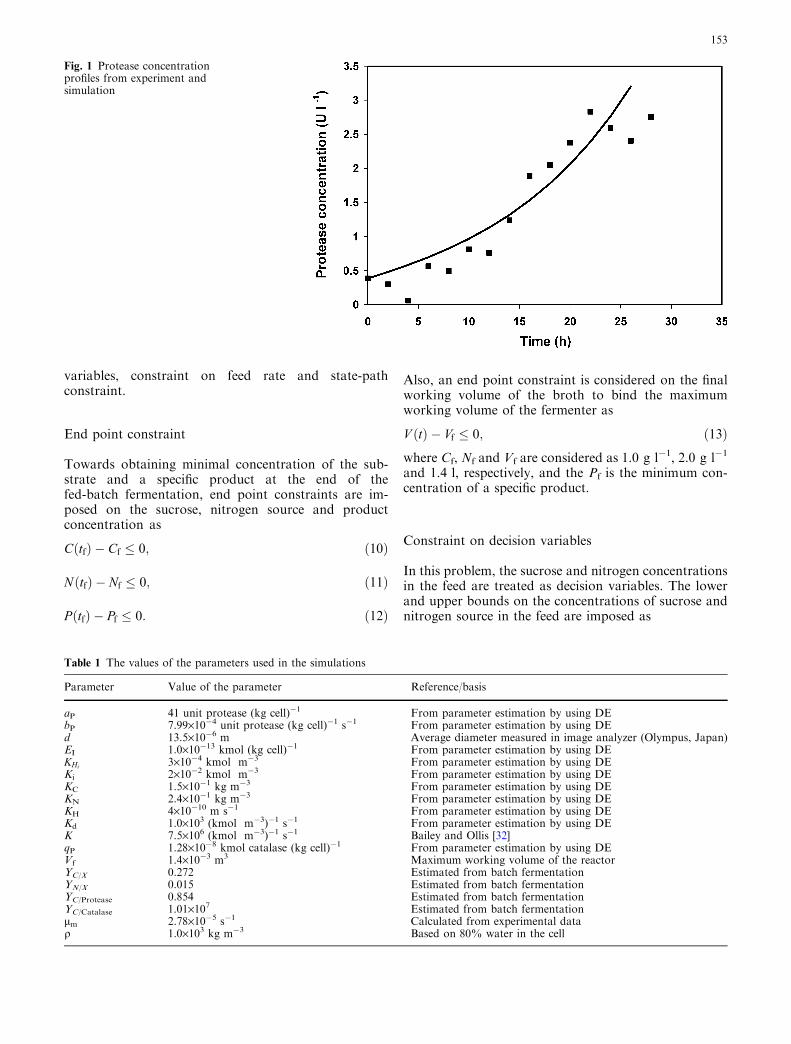
The model parameters in the above equations werepartly estimated from the batch experiment data andpartly by solving the parameter estimation problemusing the DE algorithm. Data from various batch andfed-batch fermentations were used in this parameterestimation, which was essentially based on minimizationof the prediction errors in a least squared sense. Forfurther details on the estimation problem and sensitivityof the resulting parameters, the reader is referred toreference [24]. For brevity, we present a single plot of thecomparison of the model predictions and experimentaldata (for fed-batch fermentation with constant feedaddition of H2O2, sucrose and nitrogen source) in Fig. 1.The values of the process parameter are given inTable 1.
In the above problem, the objective is to maximizethe concentration of one product and simultaneouslykeep the concentration of the other product at the end ofthe fermentation within some threshold. The additionrates of the three substrates, FC, FN and FH, are con-sidered as the control variables. The search space of thisoptimization problem is bounded by several constraints,viz., end point constraints, constraint on the decision
152
variables, constraint on feed rate and state-pathconstraint.
End point constraint
Towards obtaining minimal concentration of the sub-strate and a specific product at the end of thefed-batch fermentation, end point constraints are im-posed on the sucrose, nitrogen source and productconcentration as
C tfð Þ � Cf � 0; ð10Þ
N tfð Þ � Nf � 0; ð11Þ
P tfð Þ � Pf � 0: ð12Þ
Also, an end point constraint is considered on the finalworking volume of the broth to bind the maximumworking volume of the fermenter as
V ðtÞ � Vf � 0; ð13Þwhere Cf, Nf and Vf are considered as 1.0 g l�1, 2.0 g l�1
and 1.4 l, respectively, and the Pf is the minimum con-centration of a specific product.
Constraint on decision variables
In this problem, the sucrose and nitrogen concentrationsin the feed are treated as decision variables. The lowerand upper bounds on the concentrations of sucrose andnitrogen source in the feed are imposed as
Fig. 1 Protease concentrationprofiles from experiment andsimulation
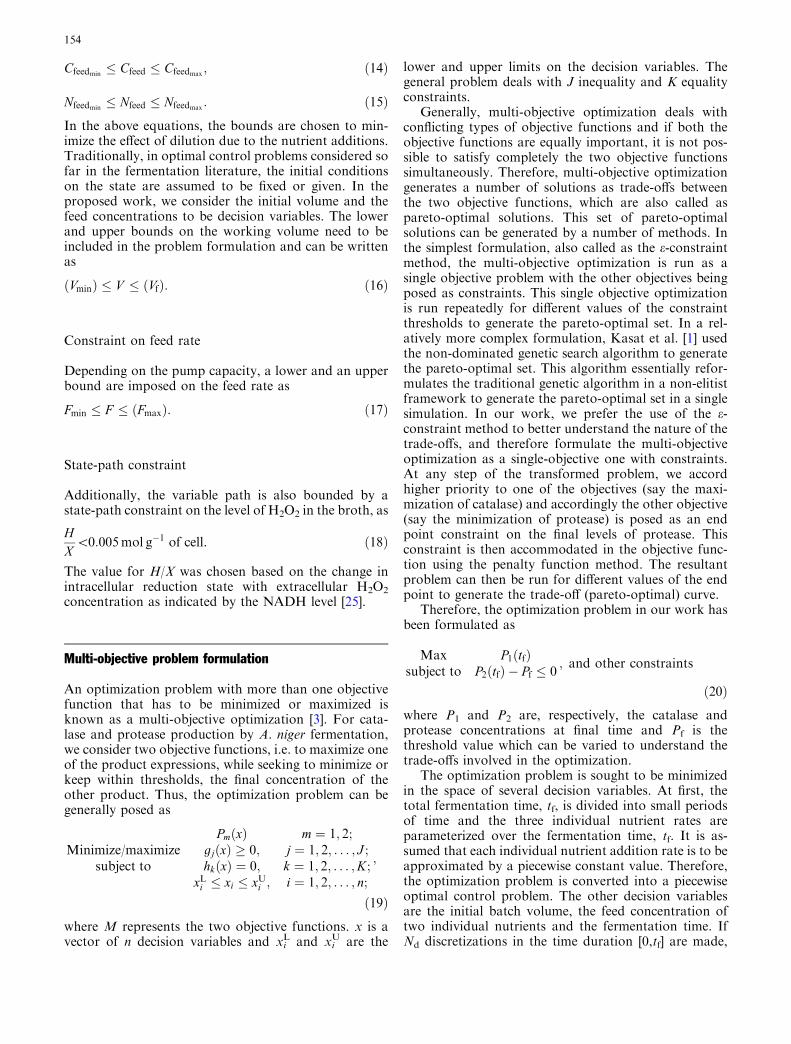
Table 1 The values of the parameters used in the simulations
Parameter Value of the parameter Reference/basis
aP 41 unit protease (kg cell)�1 From parameter estimation by using DEbP 7.99·10�4 unit protease (kg cell)�1 s�1 From parameter estimation by using DEd 13.5·10�6 m Average diameter measured in image analyzer (Olympus, Japan)EI 1.0·10�13 kmol (kg cell)�1 From parameter estimation by using DEKHi 3·10�4 kmol m�3 From parameter estimation by using DEKi 2·10�2 kmol m�3 From parameter estimation by using DEKC 1.5·10�1 kg m�3 From parameter estimation by using DEKN 2.4·10�1 kg m�3 From parameter estimation by using DEKH 4·10�10 m s�1 From parameter estimation by using DEKd 1.0·103 (kmol m�3)�1 s�1 From parameter estimation by using DEK 7.5·106 (kmol m�3)�1 s�1 Bailey and Ollis [32]qP 1.28·10�8 kmol catalase (kg cell)�1 From parameter estimation by using DEVf 1.4·10�3 m3 Maximum working volume of the reactorYC/X 0.272 Estimated from batch fermentationYN/X 0.015 Estimated from batch fermentationYC/Protease 0.854 Estimated from batch fermentationYC/Catalase 1.01·107 Estimated from batch fermentationlm 2.78·10�5 s�1 Calculated from experimental dataq 1.0·103 kg m�3 Based on 80% water in the cell
153
Cfeedmin� Cfeed � Cfeedmax
; ð14Þ
Nfeedmin� Nfeed � Nfeedmax
: ð15ÞIn the above equations, the bounds are chosen to min-imize the effect of dilution due to the nutrient additions.Traditionally, in optimal control problems considered sofar in the fermentation literature, the initial conditionson the state are assumed to be fixed or given. In theproposed work, we consider the initial volume and thefeed concentrations to be decision variables. The lowerand upper bounds on the working volume need to beincluded in the problem formulation and can be writtenas
Vminð Þ � V � Vfð Þ: ð16Þ
Constraint on feed rate
Depending on the pump capacity, a lower and an upperbound are imposed on the feed rate as
Fmin � F � Fmaxð Þ: ð17Þ
State-path constraint
Additionally, the variable path is also bounded by astate-path constraint on the level of H2O2 in the broth, as
HX
\0:005mol g�1 of cell. ð18Þ
The value for H/X was chosen based on the change inintracellular reduction state with extracellular H2O2
concentration as indicated by the NADH level [25].
Multi-objective problem formulation
An optimization problem with more than one objectivefunction that has to be minimized or maximized isknown as a multi-objective optimization [3]. For cata-lase and protease production by A. niger fermentation,we consider two objective functions, i.e. to maximize oneof the product expressions, while seeking to minimize orkeep within thresholds, the final concentration of theother product. Thus, the optimization problem can begenerally posed as
PmðxÞ m ¼ 1; 2;Minimize/maximize gjðxÞ � 0; j ¼ 1; 2; . . . ; J ;
subject to hkðxÞ ¼ 0; k ¼ 1; 2; . . . ;K;xLi � xi � xUi ; i ¼ 1; 2; . . . ; n;
;
ð19Þwhere M represents the two objective functions. x is avector of n decision variables and xi
L and xiU are the
lower and upper limits on the decision variables. Thegeneral problem deals with J inequality and K equalityconstraints.
Generally, multi-objective optimization deals withconflicting types of objective functions and if both theobjective functions are equally important, it is not pos-sible to satisfy completely the two objective functionssimultaneously. Therefore, multi-objective optimizationgenerates a number of solutions as trade-offs betweenthe two objective functions, which are also called aspareto-optimal solutions. This set of pareto-optimalsolutions can be generated by a number of methods. Inthe simplest formulation, also called as the e-constraintmethod, the multi-objective optimization is run as asingle objective problem with the other objectives beingposed as constraints. This single objective optimizationis run repeatedly for different values of the constraintthresholds to generate the pareto-optimal set. In a rel-atively more complex formulation, Kasat et al. [1] usedthe non-dominated genetic search algorithm to generatethe pareto-optimal set. This algorithm essentially refor-mulates the traditional genetic algorithm in a non-elitistframework to generate the pareto-optimal set in a singlesimulation. In our work, we prefer the use of the e-constraint method to better understand the nature of thetrade-offs, and therefore formulate the multi-objectiveoptimization as a single-objective one with constraints.At any step of the transformed problem, we accordhigher priority to one of the objectives (say the maxi-mization of catalase) and accordingly the other objective(say the minimization of protease) is posed as an endpoint constraint on the final levels of protease. Thisconstraint is then accommodated in the objective func-tion using the penalty function method. The resultantproblem can then be run for different values of the endpoint to generate the trade-off (pareto-optimal) curve.
Therefore, the optimization problem in our work hasbeen formulated as
Max P1 tfð Þsubject to P2 tfð Þ � Pf � 0
; and other constraints
ð20Þwhere P1 and P2 are, respectively, the catalase andprotease concentrations at final time and Pf is thethreshold value which can be varied to understand thetrade-offs involved in the optimization.
The optimization problem is sought to be minimizedin the space of several decision variables. At first, thetotal fermentation time, tf, is divided into small periodsof time and the three individual nutrient rates areparameterized over the fermentation time, tf. It is as-sumed that each individual nutrient addition rate is to beapproximated by a piecewise constant value. Therefore,the optimization problem is converted into a piecewiseoptimal control problem. The other decision variablesare the initial batch volume, the feed concentration oftwo individual nutrients and the fermentation time. IfNd discretizations in the time duration [0,tf] are made,
154
each individual nutrient addition rate would give rise toNd decision variables, corresponding to its value in eachdiscrete time interval. Hence, the total number of deci-sion variables for the above problem can be evaluated asNd·3 variables arising from each of sucrose, nitrogensource and H2O2 additions, another two variables forthe feed concentration of the individual nutrients andtwo other variables relating to the initial batch volumeand fermentation time.
In this work, we propose to use the DE algorithm [10]to solve the multi-objective optimization problem in thespace of decision variables and constraints. The DEmethod is a parallel direct search method that utilizes alarge number of populations of vectors, NP, for eachgeneration, W. Each vector carries the decision param-eters of x dimensions. The value of NP is chosen so as toreflect and obtain a diverse population.
The basic structure of DE consists of four mainoperations, viz., initialization of the population, muta-tion, cross over and evaluation.
Initialization
The initialization involves the random selection of thepopulation, Zi (i=1, ..., NP). The mathematical repre-sentation of the initialization can be written as
Zi ¼ Zmin þ qi Zmax � Zminð Þ; ð21Þwhere qi denotes a random number generated from auniform distribution. Zmax and Zmin are the upper andlower limits, respectively, on the initialization value.
Mutation
Mutation involves the generation of the difference vec-tor, Djk, between any two individuals of the NP vectors.The weighted difference vector, Djk, is added to a thirdrandomly selected individual or best performing indi-vidual to have a perturbed individual, �ZW
i [10]. Amongthe five types of mutation strategies proposed by Storn[26], we use the following strategy for simplicity:
Djk ¼ ZW�1j � ZW�1
k
� �ð22Þ
�ZWi ¼ ZW�1
p þ f ZðW�1Þj � ZðW�1Þk
� �; ð23Þ
where f2(0, 1.2) is a scaling factor introduced by Stornand Price [10] to ensure convergence.
Crossover
Crossover is an interesting step to increase the diversityof the new individuals in the next generation. Theresulting perturbed individual, �ZW
i ; from Eq. 23 and atarget individual in the current generation are selected
by a binomial distribution to perform crossover opera-tion to generate an offspring. In the crossover operation,the jth gene of the ith individual at the next generation isproduced from the perturbed individual �ZW
i ¼ �Z1; . . . ;½�ZNd�Wi and current individual �ZW�1
i ¼ �Z1; . . . ; �ZNd½ �W�1i as
Zji ¼ ZW�1ji if a random number > CR
ZWji otherwise
; ð24Þ
where j=1, ..., Nd, i=1, ..., NP and the crossover factorCR2(0,1) is a user specified real number.
Evaluation
In DE, the evaluation function of an offspring competesone to one with that of its parent (target individual in thecurrent generation) and the parent is replaced by its off-spring in the next generation only if the objective functionvalue of the offspring is lower than that of its parent.
The DE algorithm was generally formulated forunconstrained minimization problems. Therefore forconstrained problems as above, dynamic/adaptive pen-alty functions [27] are used to convert the constrainedproblem to an unconstrained problem. In these meth-ods, the penalty terms associated with constraints areadded to the objective function, i.e. penalty term reflectsthe violation of the constraints and assigns higher costsof the penalty function to the individuals that are farfrom the feasible region. Therefore, the objective func-tional can be modified as
J ½uðtÞ� ¼ P ðtfÞ þXl
l¼1e2l ; ð25Þ
where e is the penalty function associated with violationof a constraint.
Hence, any candidate individual that violates theconstraints would inherit a worse fitness value and willfind it difficult to survive in the next generation. Thesteps of mutation, crossover and evaluation are repeatedfor a number of generations (iterations) till a populationof individuals that maximize the above objective func-tion is obtained.
Materials and methods
Culture, growth medium and cultivations
Aspergillus niger (A. niger—618, ATCC—10594, CMI—15955, NCIM, Pune, India) was grown on potatodextrose agar medium for sporulation. All the slantswere maintained at 4 �C. The growth medium for theseed culture consisted of 30 g l�1 sucrose, 5 g l�1 solublestarch [28], 0.4 g l�1 (NH4)2HPO4, 0.2 g l�1 KH2PO4,0.2 g l�1 MgSO4Æ7H2O and 10 g l�1 peptone in tapwater [29]. The medium was inoculated with a sporesuspension (transmittance adjusted to 10%) at 10% (v/
155
v) and the cells were grown in a shaker incubator at30 �C. The growth medium used for the bioreactorconsisted of 6.0 g l�1 initial sucrose concentration,0.2 g l�1 KH2PO4, 0.2 g l�1 MgSO4Æ7H2O and 1.5 g l�1
initial nitrogen concentration.The feed concentrations of H2O2 and sucrose were
0.3 M and 300 g l�1, respectively, for both the catalaseand protease maximization runs. The feed concentrationof nitrogen source was 300 g l�1 for protease maximi-zation run and 268 g l�1 for catalase maximization run.(NH4)2HPO and peptone were used as the nitrogensources in the ratio of 1:14 [(NH4)2HPO4nitrogen:Pep-tonenitrogen]. The experiments were carried out in a 2 lbioreactor with a constant pH of 3.8, at a constanttemperature of 30 �C and at a constant rpm of 300. Thesucrose, nitrogen source and H2O2 were added in fed-batch mode and the feed rates of additions were regu-lated according to the control profiles derived by DE.
Experimental setup
A 2 l bioreactor with 1.4 l working volume (VaspanIndustries, India) was used. The stirred tank bioreactorwas equipped with two Rushton turbine impellers withtemperature and RPM controls. A polarographic DOprobe (Bela Instruments, India) was used to measure thedissolved oxygen level (DO) in the broth and data wasacquired with a data acquisition system (S.C.R. Elek-troniks, India). The pH was controlled online by using apH controller (Bela Instruments, Mumbai, India, Model672 P). The H2O2, sucrose and the nitrogen were addedintermittently through peristaltic pumps (Cole Parmar,USA).
Analysis
Samples were taken at regular intervals, filtered anddried to obtain dry cell concentrations. The filtratesobtained were stored at �20 �C for further analysis andenzyme assays were performed immediately after thecompletion of the cultivation. Standard methods wereused for enzyme assay: the azocasein degradationmethod for protease [30] and the decomposition rate (ofH2O2) method for catalase [31].
Results and discussion
Simulation results
The DE-based optimization was run for over 10,000iterations. The optimizer was run twice for the twoobjective functions, viz., (i) catalase maximization withthreshold on final protease concentration and (ii) pro-tease maximization with threshold on final catalaseconcentration.
In all the simulations, the fed-batch fermentation wasassumed to start with an initial condition on cell mass
(0.75 g l�1), nitrogen source (1.5 g l�1), sucrose(6.0 g l�1), product (0.0 g l�1) and H2O2 concentrationboth in the medium and in the cell (0.0 mol l�1). Al-though the fermentation time can be accommodated inthe formulation as a control variable, it was set as aparameter to simplify the optimization task. The overallbioreactor run was assumed to be of 30 h duration(based on a priori knowledge) and the total run time wasdivided into 15 intervals of 2 h duration each, i.e. thevalue of Nd was assumed to be 15. Therefore, as dis-cussed in an earlier section, each individual nutrientaddition gave rise to 15 decision variables. Thus, in thisproblem a total number of 49 decision variables wereused consisting of 45 decision variables generated fromeach of the sucrose, nitrogen source and H2O2 additions,two variables for sucrose and nitrogen concentrations inthe feed and two variables for initial batch volume andfermentation time. A population of 100 vectors ofdecision variables in one generation was used to solvethe optimization problem, i.e. NP=100. Lower and up-per bounds were imposed on the decision and controlvariables as
Cfeedminð200 g l�1Þ � Cfeed � Cfeedmax
ð300 g l�1Þ;
Nfeedminð200 g l�1Þ � Nfeed � Nfeedmax
ð300 g l�1Þ:
A concentrated feed condition was considered to re-duce the dilution effect due to fed-batch addition and tomeet the nutrient requirement.
Vmin ð700mlÞ � V � Vf ð1; 400mlÞ;
Fmin ð0:0 cm3 s�1Þ � F � Fmax ð1:5� 10�2 cm3 s�1Þ:The initial value of the decision and control variableswere determined by using Eq. 21. A crossover factor(CR) of 0.5 was used and the program was run for 10,000generations. In the following subsections, the results ofthe overall optimization as well as the influence of eachof the individual constraints/decision variables on theoverall productivity are discussed.
Optimum run for catalase maximization
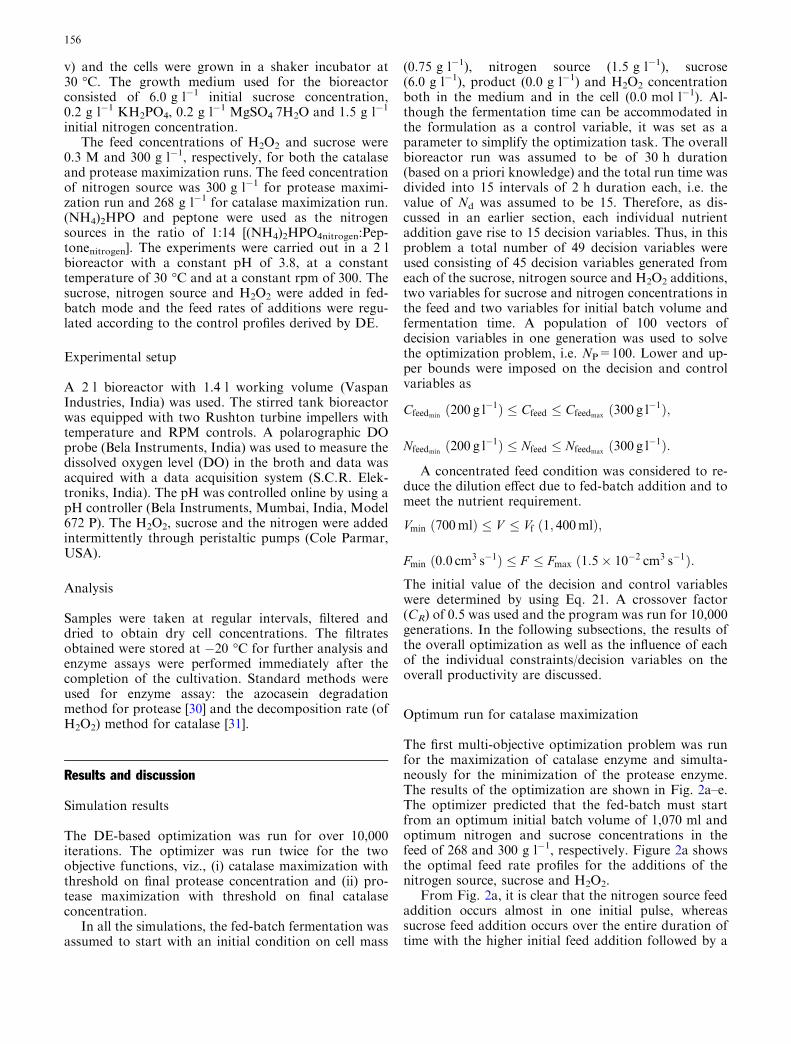
The first multi-objective optimization problem was runfor the maximization of catalase enzyme and simulta-neously for the minimization of the protease enzyme.The results of the optimization are shown in Fig. 2a–e.The optimizer predicted that the fed-batch must startfrom an optimum initial batch volume of 1,070 ml andoptimum nitrogen and sucrose concentrations in thefeed of 268 and 300 g l�1, respectively. Figure 2a showsthe optimal feed rate profiles for the additions of thenitrogen source, sucrose and H2O2.
From Fig. 2a, it is clear that the nitrogen source feedaddition occurs almost in one initial pulse, whereassucrose feed addition occurs over the entire duration oftime with the higher initial feed addition followed by a
156
decreasing profile. ForH2O2, the additions occur over theentire time durationmostlywith an increasing profile. Theoptimal sucrose feed additions are able to maintain thesucrose concentration profile in an increasing nature al-most up to the half of the fermentation duration toaccelerate the growth-associated catalase enzyme, fol-lowed by a decreasing trend in sucrose concentration tomaintain the end point constraint on the final residualsucrose concentration, as shown in Fig. 2b. The increas-ing nature of H2O2 feed addition supports the fact thatenhanced H2O2 concentration favours the catalase
production. Again there is H2O2 inhibition on growth,which the optimizer has to consider and therefore bringdown the H2O2 concentration in the broth so as to en-hance the cell growth. Hence, there is a trade-off betweenthe inhibition and promoting nature of H2O2 on thegrowth and on the catalase enzyme. Also, this optimal runis for multi-objective optimization where the simulta-neous minimization of protease enzyme lowers the finalcell concentration (enhances the inhibition term) aswell asthe protease production to satisfy the end point constrainton final protease concentration. Hence, a trade-off solu-
Fig. 2 a Optimal feed rate profiles for sucrose, nitrogen and H2O2
in catalase maximization run. b Sucrose and nitrogen profiles forcatalase maximization. c Hydrogen peroxide concentration in the
medium (H) and inside the cell (Hi) for catalase maximization. dCell mass, catalase and protease profiles for catalase maximization.e Volume profile for catalase maximization
157

tion is obtained for the final cell concentration to satisfyboth the objectives. The maximum nutrient addition, toenhance the product concentration, is limited by the finalbatch volume. As is evident from the results, these profilesare therefore predicted by the optimizer to balance thethree effects, viz., those resulting from constraints on finalbatch volume, the end point residual protease and nutri-ent concentration aswell as the nutrient (sucrose, nitrogenand H2O2) requirements for growth and productformation. A final cell and catalase concentrations of7.23 g l�1 and 0.45 lM, respectively, were obtained at30 h. A final protease concentration in the catalase max-imization run of 4.99 U l�1 was obtained. The individualprofiles of the variables for this optimized case are shownin Fig. 2b–e.
Optimum run for protease maximization
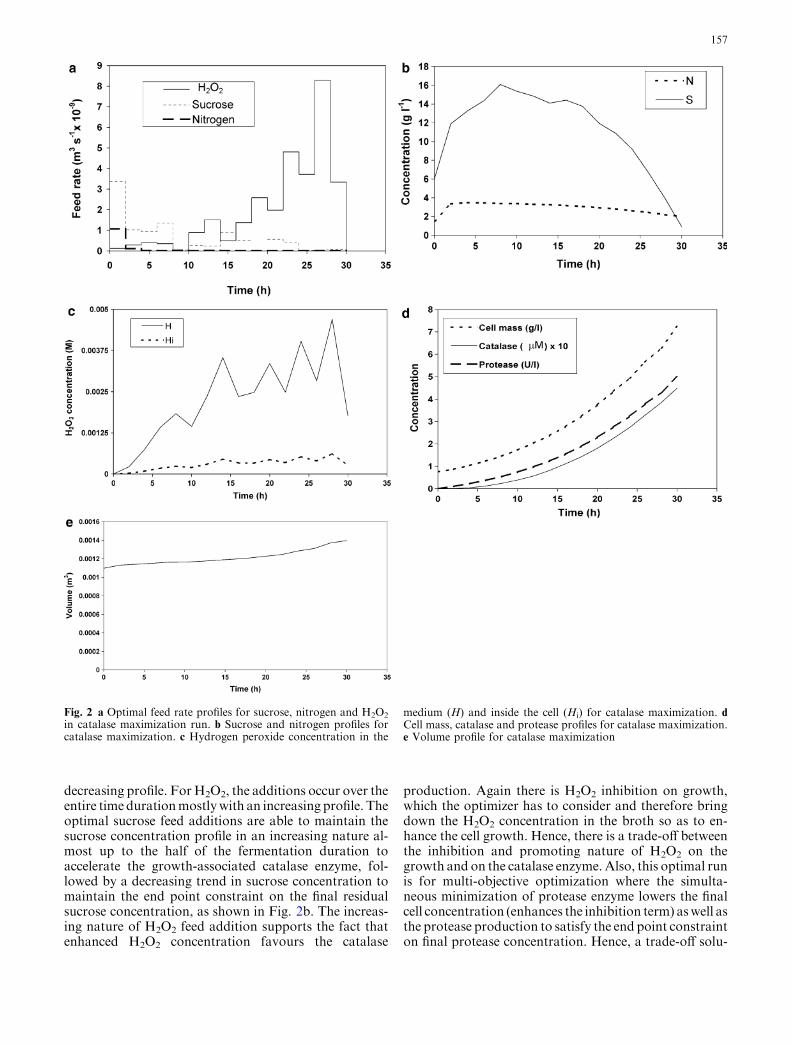
The second optimization problem was solved to maxi-mize the protease enzyme and to minimize the catalaseenzyme. The results of the optimization are shown inFig. 3a–e. In this second case, the optimizer predictedthat the fed-batch must start from an optimum initialbatch volume of 1,250 ml and optimum nitrogen sourceand sucrose concentrations in the feed of 300 g l�1 each.Figure 3a shows the optimal feed rate profiles for theadditions of the nitrogen source, sucrose and H2O2.
From Fig. 3a, it is clear that the nitrogen source feedadditions are almost the same as the catalase run: in oneinitial pulse, whereas the sucrose feed additions are dif-ferent from that of the catalase maximization run: an
Fig. 3 a Optimal feed rate profiles for sucrose, nitrogen source andH2O2 in protease maximization run. b Sucrose and nitrogen profilesfor protease maximization. c Hydrogen peroxide concentration in
the medium (H) and inside the cell (Hi) for protease maximization.d Cell mass, catalase and protease profiles for protease maximiza-tion. e Volume profile for protease maximization
158
increasing rate of sucrose feed addition up to half of thefermentation followed by a decreasing feed additionprofile to maintain the end point constraint on residualsucrose. The optimizer predicts a sucrose addition ratethat increases the sucrose concentration at a slow rate upto 6 h of fermentation followed by a sharp increase inthe sucrose concentration up to 17 h of fermentation tofavour the expression of the protease enzyme. Then, theoptimizer maintains the sucrose concentration at itsmaximum level to maximize the secondary metabolite,protease, followed by a decrease in sucrose concentra-tion to meet the end point constraint as seen in Fig. 3b.For H2O2, the additions occur in small pulses up to halfof the time period, with a comparatively large additionat the end. Since it is a multi-objective optimization withthe minimization of the final catalase concentration asone of the objectives, the optimizer seeks to maintain alow H2O2 concentration in the broth in order to mini-mize the catalase concentration. As discussed earlier,protease expression rate does not get substantially af-fected with the H2O2 addition except at low H2O2 con-centration when the inhibition effect on cell growth islowered, and hence the final cell concentration is in-creased. The higher final cell concentration enhanced theprotease production. A final cell concentration of11.27 g l�1 and a final protease of 7.50 U l�1 at 30 hwere obtained. The final catalase concentration in thisprotease maximization run was predicted to be0.316·10�3 lM. The individual profiles of the variablesfor this optimized case are shown in Fig. 3b–e.
Analysis of the optimum runs
The final concentration of the state variables obtainedfrom the two optimized runs is shown in Table 2.
The optimal feed addition profiles for sucrose andH2O2 obtained for both catalase and protease maximi-zation runs are entirely different in nature as discussedearlier. The optimizer generally predicts higher final cellmass concentration in the case of protease maximiza-tion, keeping in view the non-growth-associated natureof the expression. Although protease is produced in bothgrowth and stationary phases, its non-growth naturefavours expression during the stationary phase, thusrequiring higher cell concentration towards the end ofthe fermentation, to maximize the final protease con-centration. In contrast, the catalase, being the growth-associated product, is produced during growth andrequires a suitable cell concentration to maximize thecatalase concentration. The optimum initial batchvolume is lower in case of catalase than protease. Incatalase run, there is a higher dilution due to the
continuous addition of H2O2, when compared with theprotease run where the pulse addition of H2O2 is ob-served. Therefore, it can be concluded that the optimizerrecognizes this requirement and predicts lower initialbatch volume for catalase to allow higher dilution in thepresence of constraints on the maximum batch volume.In the case of protease run, the prediction of higherbatch volume does not violate the maximum limit onfinal batch volume.
Analysis of other runs
Some other simulations have also been carried out forboth catalase and protease maximization runs, tounderstand the nature of the trade-offs. Generally, cat-alase production is favoured by high growth rate whichessentially translates to keep extracellular peroxide levelslow and the nitrogen and intracellular peroxide levelshigh (see Eq. 5). The optimizer would therefore seekdilution conditions and feed concentrations which willachieve levels of peroxide and nitrogen as a compromisebetween these requirements. On the other hand, proteaseproduction is favoured by a large cell concentration,which translates to higher growth rates and lower dilu-tion factors (see Eq. 6). In the light of the above rela-tionships, the results obtained for various optimizationruns are discussed and presented below in a tabular form.
Different runs
1. Catalase max. without any end point constraint.2. Catalase max. with end protease higher than the
optimal threshold value.3. Catalase max. with end protease lower than the
optimal threshold value.4. Catalase max. with end Hi higher than the optimal
threshold value.5. Protease max. without end point constraint.6. Protease max. with end catalase higher than the
optimal threshold value.7. Protease max. with end catalase lower than the
optimal threshold value.8. Protease max. with end Hi lower than the optimal
threshold value.
The final concentration of the state variables obtainedfrom the above runs is shown in Table 3.
Effect of end protease concentration in catalasemaximization
In catalase maximization, Run 2, the higher final con-centration of protease than its threshold optimal value
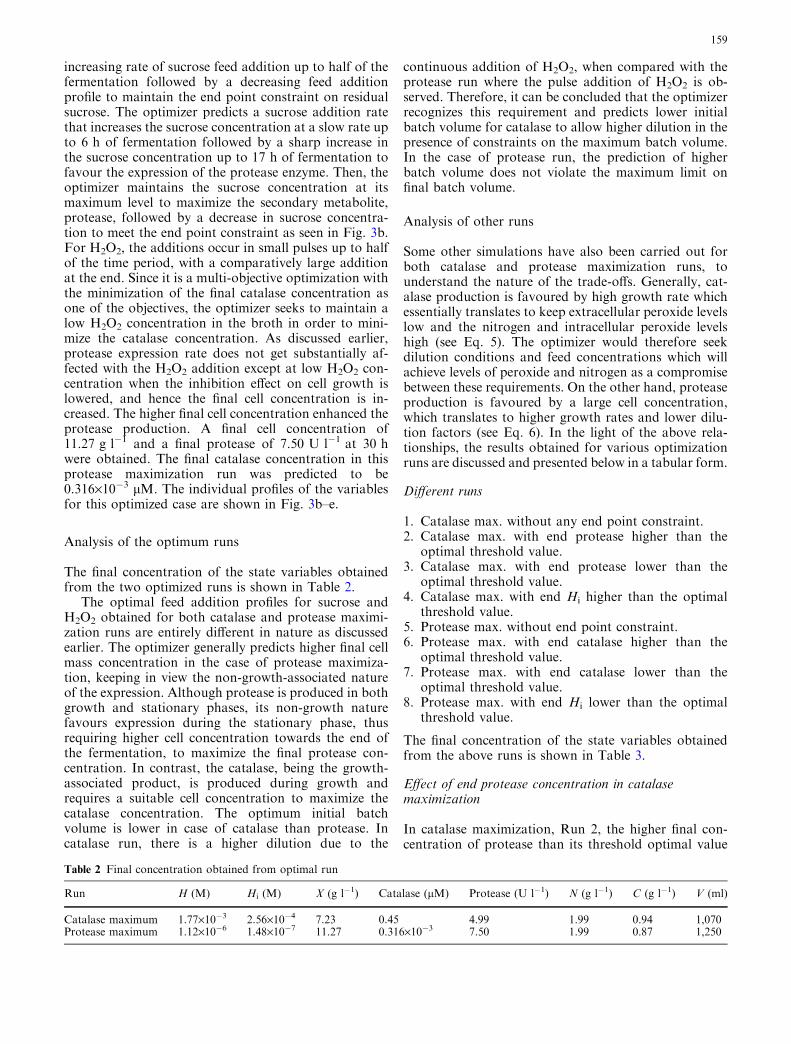
Table 2 Final concentration obtained from optimal run
Run H (M) Hi (M) X (g l�1) Catalase (lM) Protease (U l�1) N (g l�1) C (g l�1) V (ml)
Catalase maximum 1.77·10�3 2.56·10�4 7.23 0.45 4.99 1.99 0.94 1,070Protease maximum 1.12·10�6 1.48·10�7 11.27 0.316·10�3 7.50 1.99 0.87 1,250
159
obtained from the optimized catalase maximization rundecreases the final catalase concentration from its opti-mal value. This is because the enhancement of oneproduct in a multi-product fermentation simultaneouslydecreases the concentration of the other product. Simi-larly in the same catalase maximization, Run 3, the de-crease in protease concentration from its thresholdoptimal value should increase the final optimal catalaseconcentration. But, Run 3 shows a lower value of finalcatalase than its optimal value. The reason is the endpoint constraint to lower the final protease concentra-tion from its optimal threshold value directed the opti-mizer towards the low cell mass production. In otherwords, this also means lower growth rates. Since catalaseis a growth-associated product, its expression decreasedfrom its optimal value due to this low cell concentration.
Effect of end catalase concentration in proteasemaximization
In case of protease maximization, Run 7, the specifica-tion of a lower final catalase concentration from itsoptimal threshold value obtained from the optimumprotease maximization run directed the optimizer to-wards a decrease in the cell concentration. As an effect ofthis decrease, the final protease concentration also de-creased from its optimal value, though the change in thefinal concentration is almost negligible. On the otherhand, a specification of the end point constraint to behigher than the final optimal catalase concentration(Run 6) decreased the protease concentration from itsoptimal value. Therefore, we can say that the enhance-ment in one product reduced the production of the otherproduct to maintain the mass balance in the competitivesubstrate utilization system.
Effect of end H2O2 concentration in catalasemaximization
It is observed from Run 4 that the further enhancementin the final intracellular H2O2 concentration, Hi, doesnot increase the catalase concentration further. The in-crease inHi concentration also increases the extracellular
H2O2 concentration (H) indirectly and has an adverseeffect on the cell concentration as well as the catalaseindirectly. This is because of the inhibition effect ofH onthe catalase levels (see Eq. 5).
Effect of end H2O2 concentration in proteasemaximization
In the case of protease maximization, Run 8, the furtherdecrease in the intracellular H2O2 concentration, Hi,practically has no effect on the final protease concen-tration. Still, there is a trend to decrease the final pro-tease. The decrease in Hi concentration indirectlydecreases the final cell concentration through a decreasein final catalase concentration, and hence a decrease inthe final protease concentration is observed.
End point constraints on the final residual nutrientconcentrations
One of the other interesting aspects of this work is thereduction of the final residual nutrient concentrations byincluding endpoint constraints in the problem formula-tion; this has been proposed here to ease separationduring downstream processing. The optimization prob-lems without imposing any end point constraints on thefinal residual nutrient concentration, Run 1 and Run 5,yield a high residual nutrient concentration at the end ofthe fermentation that could interfere with the down-stream processing. It shows high residual nitrogen con-centrations of 11.34 g l�1 (Run 1) and 11.38 g l�1 (Run5) at the end of the fermentation when there is no endpoint constraint imposed on residual nitrogen. On theother hand, in the case of the optimum (Table 2), a verylow residual nitrogen concentration of 1.99 g l�1 is ob-tained for both the runs. In Run 1 and Run 5 wherethere is no end point constraint, the final concentrationof the product is about 13% higher in the case of cata-lase and 10% higher in the case of protease than thosewith end point constraints. This indicates a trade-offbetween high final concentrations of the product and theresidual nutrient levels. Relaxation of the end pointconstraints could yield higher final product concentra-
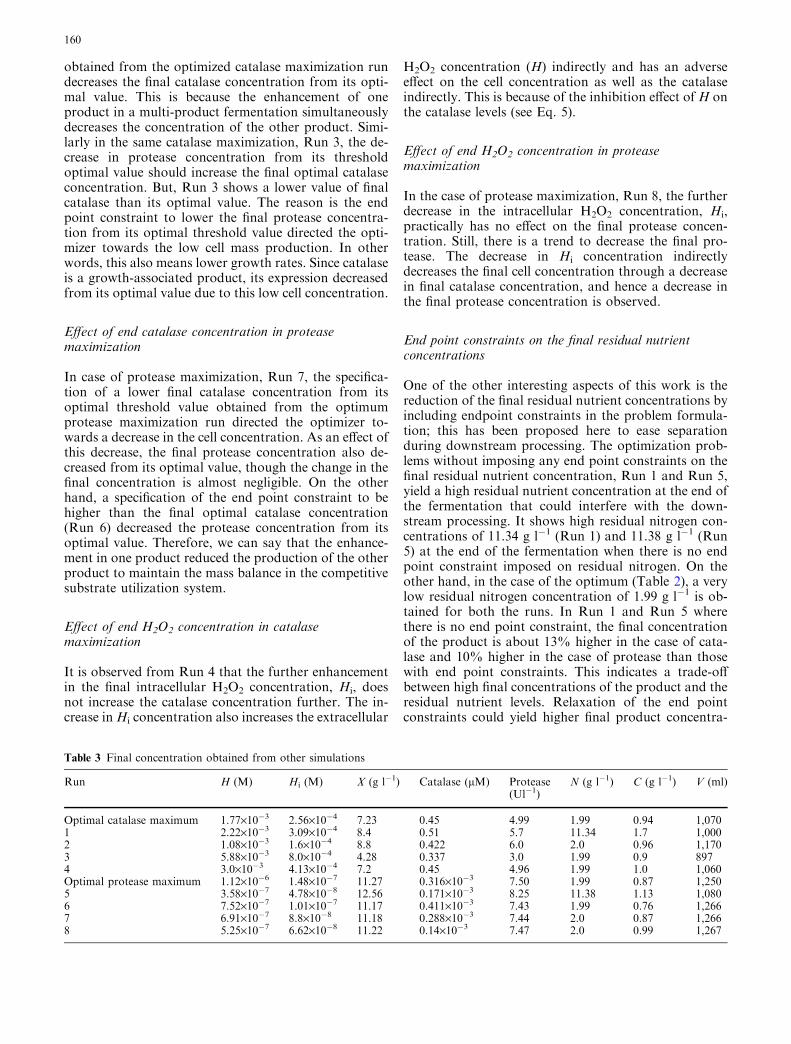
Table 3 Final concentration obtained from other simulations
Run H (M) Hi (M) X (g l�1) Catalase (lM) Protease(Ul�1)
N (g l�1) C (g l�1) V (ml)
Optimal catalase maximum 1.77·10�3 2.56·10�4 7.23 0.45 4.99 1.99 0.94 1,0701 2.22·10�3 3.09·10�4 8.4 0.51 5.7 11.34 1.7 1,0002 1.08·10�3 1.6·10�4 8.8 0.422 6.0 2.0 0.96 1,1703 5.88·10�3 8.0·10�4 4.28 0.337 3.0 1.99 0.9 8974 3.0·10�3 4.13·10�4 7.2 0.45 4.96 1.99 1.0 1,060Optimal protease maximum 1.12·10�6 1.48·10�7 11.27 0.316·10�3 7.50 1.99 0.87 1,2505 3.58·10�7 4.78·10�8 12.56 0.171·10�3 8.25 11.38 1.13 1,0806 7.52·10�7 1.01·10�7 11.17 0.411·10�3 7.43 1.99 0.76 1,2667 6.91·10�7 8.8·10�8 11.18 0.288·10�3 7.44 2.0 0.87 1,2668 5.25·10�7 6.62·10�8 11.22 0.14·10�3 7.47 2.0 0.99 1,267
160

tions but at the expense of higher residual nutrient levelswhich translate to higher processing/downstream costs.
State-path constraints on nutrient additions
As stated in Eq. 18, a state-path constraint is used in thisoptimization problem to bind the toxic level of H2O2
concentration on the cell growth. The results obtainedare presented in Figs. 4 and 5. It shows that the H/Xvalue was maintained below the threshold value of0.005 mol g�1 of cell over the entire duration of fer-mentation.
Experimental evaluation of the simulation results
Catalase maximization
The final product and the cell concentration profilesobtained from the simulation result have been validatedhere through experiments. In the results presented in thesequel, all the experiments have been done in duplicatewith an average error of 6–8%. For the biomass, theexperimental results match the simulation predictionsvery closely. Figure 6 shows the cell concentrationprofile obtained from the experiments and simula-tion results. A final cell concentration of 7.35 g l�1 ob-tained from the experiments compares well with7.23 g l�1 from the simulation. Also, the catalase profileobtained from the experiment (Fig. 7) is comparablewith that from the simulation.
The final product (catalase) predicted from thesimulations was approximately 0.45 lM whereas thatobtained from the experiment was 0.265 lM. The pri-mary reason for this departure from the predicted valuesis that the variance errors associated with the estimationof the parameters are high; these can be improved byusing data from a larger number of experiments duringthe parameter estimation step. In fact, when both the
specific growth rate and the catalase yield coefficientwere reduced by approximately 10% in the simulations,there was a good agreement between the experimentaland simulated values.
Furthermore, when compared with conventionalmethods of constant feed additions of sucrose, nitrogenand hydrogen peroxide, experimental results demon-strated a 70% improvement in the final catalase levels,when the additional profiles suggested based on thesimulation models were implemented. We would like tosubmit that while better models and parameter estimatescan be generated to further improve the quality of pre-dictions, even the existing models do provide enoughvalidation to demonstrate the efficacy of the methodsproposed.
Protease maximization
The final product and the cell concentration profilesobtained from the simulation result have been validatedhere through experiments. The experimental results ob-tained for protease maximization (Figs. 8 and 9) showthe most deviations from the profiles predicted viasimulations. The reasons for this can be summarized asfollows: the optimal nutrient addition policies predictedbased on the simulation model, when implementedduring experiments, resulted in a batch-like growth dueto the pulse additions of peroxide and the resultinglimited oxygen environment for the cells. This took theexperiment into batch-like operating regions; however,the parameters were estimated using experimental datathat had nutrient addition policies typically found in fed-batch fermentation. The mismatch between theseparameter estimates for the fed-batch case and the trueparameters for batch-like growth was large enough tomake the experimental profiles for protease deviate fromthose predicted from the simulations. As seen in Fig. 9,the simulation predicts an exponential rate of proteaseexpression, whereas the experiments actually realize a
Fig. 4 Profile of the constraint,H/X for catalase maximization
161
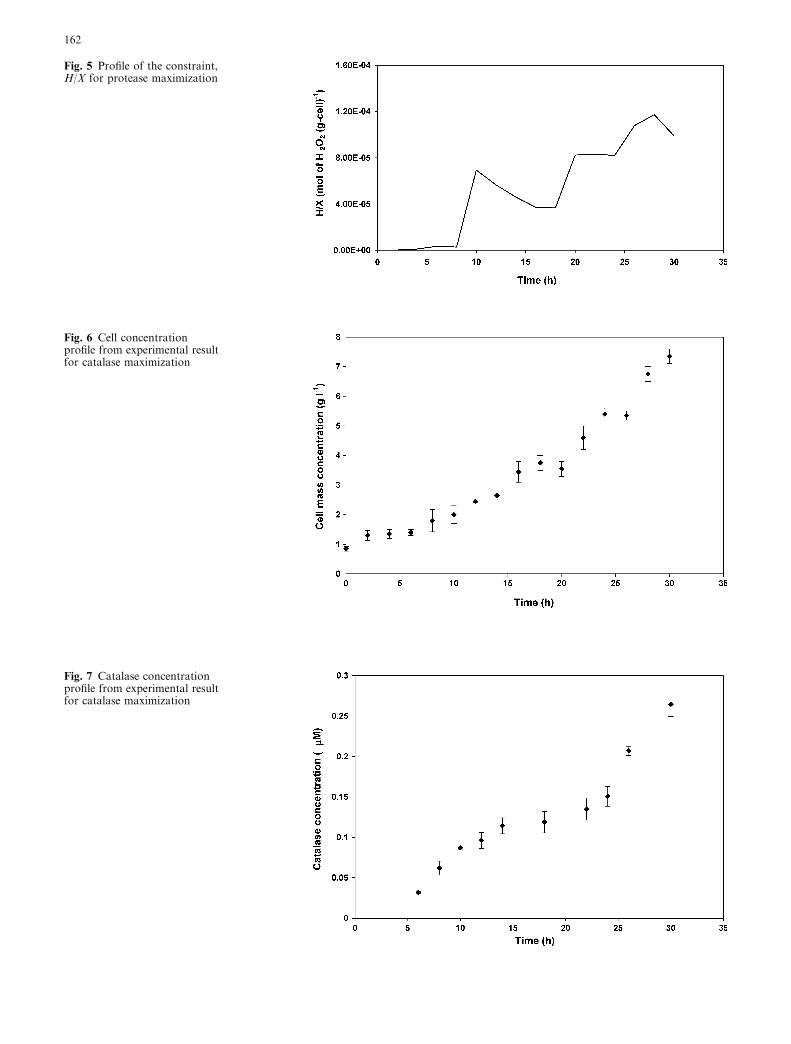
Fig. 5 Profile of the constraint,H/X for protease maximization
Fig. 6 Cell concentrationprofile from experimental resultfor catalase maximization
Fig. 7 Catalase concentrationprofile from experimental resultfor catalase maximization
162
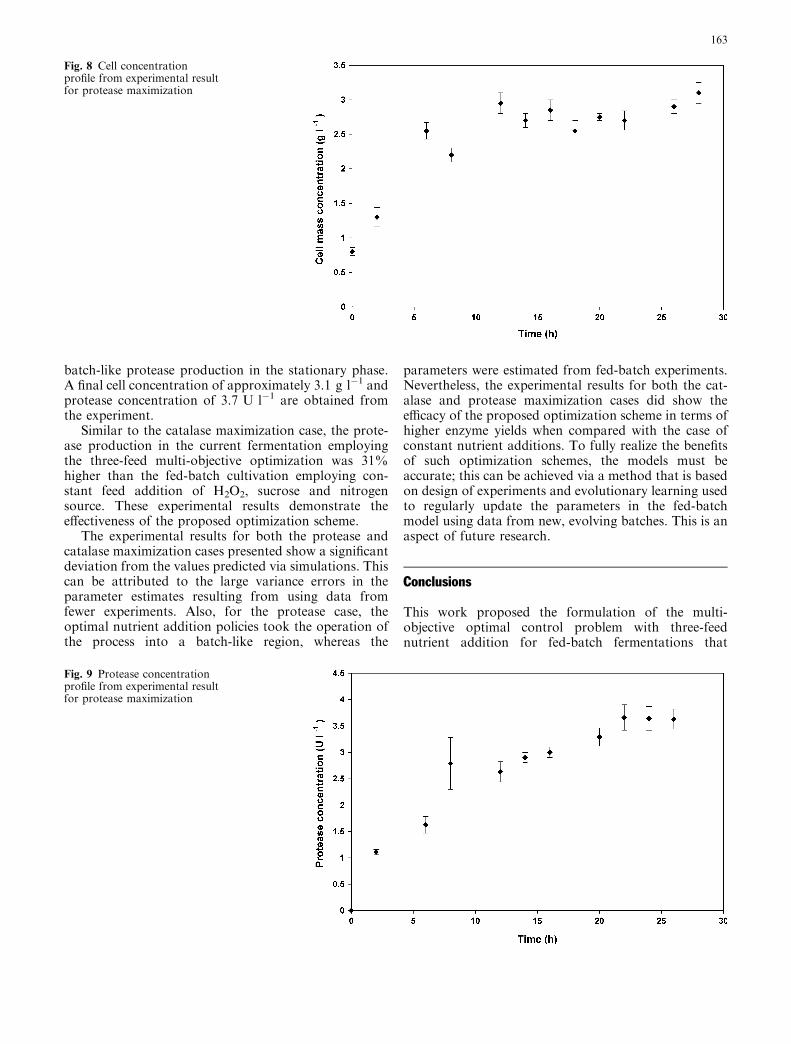
batch-like protease production in the stationary phase.A final cell concentration of approximately 3.1 g l�1 andprotease concentration of 3.7 U l�1 are obtained fromthe experiment.
Similar to the catalase maximization case, the prote-ase production in the current fermentation employingthe three-feed multi-objective optimization was 31%higher than the fed-batch cultivation employing con-stant feed addition of H2O2, sucrose and nitrogensource. These experimental results demonstrate theeffectiveness of the proposed optimization scheme.
The experimental results for both the protease andcatalase maximization cases presented show a significantdeviation from the values predicted via simulations. Thiscan be attributed to the large variance errors in theparameter estimates resulting from using data fromfewer experiments. Also, for the protease case, theoptimal nutrient addition policies took the operation ofthe process into a batch-like region, whereas the
parameters were estimated from fed-batch experiments.Nevertheless, the experimental results for both the cat-alase and protease maximization cases did show theefficacy of the proposed optimization scheme in terms ofhigher enzyme yields when compared with the case ofconstant nutrient additions. To fully realize the benefitsof such optimization schemes, the models must beaccurate; this can be achieved via a method that is basedon design of experiments and evolutionary learning usedto regularly update the parameters in the fed-batchmodel using data from new, evolving batches. This is anaspect of future research.
Conclusions
This work proposed the formulation of the multi-objective optimal control problem with three-feednutrient addition for fed-batch fermentations that
Fig. 9 Protease concentrationprofile from experimental resultfor protease maximization
Fig. 8 Cell concentrationprofile from experimental resultfor protease maximization
163
produce more than one product. The formulationproposed the maximization of one product withsimultaneous minimization of the other product. Itincluded an end point constraint to pose the require-ment of end product concentration more realistically.Additionally, it also proposed an inclusion of decisionvariables such as initial batch volume, substrate feedconcentrations and end point constraints such as theminimization of the end residual nutrients, final batchvolume and also state-path constraint on permissibleoxygen levels. A robust stochastic optimization algo-rithm based on DE was found to solve the resultingoptimization problem. The results obtained from thesimulations were verified experimentally and showed anincrease of about 70% final catalase and 31% finalprotease compared to conventional fed-batchcultivation.
References
1. Kasat RB, Kunzru D, Saraf DN, Gupta SK (2002) Multiob-jective optimisation of industrial FCC units using Elitist non-dominated sorting genetic algorithm. Ind Eng Chem Res41:4765–4776
2. Venkatesh KV, Doshi P, Rengaswamy R (1997) An optimalstrategy to model microbial growth in a multiple substrateenvironment. Biotechnol Bioeng 56:635–644
3. Deb K (2002) Multi-objective optimization using evolutionaryalgorithms. Wiley, England
4. Modak JM, Lim HC, Tayeb YJ (1986) General characteristicsof optimal feed rate profiles for various fed-batch fermentationprocesses. Biotechnol Bioeng 28:1396–1407
5. Ray WH (1981) Advanced process control. McGraw-Hill, NewYork
6. Ramirez WF (1994) Process control and identification. Aca-demic, California
7. Guthke R, Knorre WA (1981) Optimal substrate profile forantibiotic fermentation. Biotechnol Bioeng 23:2771–2777
8. Modak JM, Lim HC (1989) Simple nonsingular control ap-proach to fed-batch fermentation optimization. BiotechnolBioeng 33:11–15
9. Yamane T, Kune T, Sada E, Takamarsu T (1977) Nonsingularcontrol approach to fed-batch fermentation problem withspecific growth rate as the control variable. J Ferment Technol55:587–592
10. Storn R, Price K (1996) Minimizing the real functions of theICEC’96 contest by differential evolution. IEEE Conference onEvolutionary Computation, Nagoya, pp 842–844
11. Chiou JP, Wang FS (1999) Hybrid method of evolutionaryalgorithms for static and dynamic optimization problems withapplication to a fed-batch fermentation process. Comput ChemEng 23:1277–1291
12. Nicholls P, Schonbaum GR (1963) In: Boyer PD (ed) Catalasesin the enzymes, vol 8. Academic, New York, pp 147–225
13. Beg QK, Gupta R (2003) Purification and characterization ofan oxidation-stable, thiol-dependent serine alkaline proteasefrom Bacillus mojavensis. Enzyme Microb Technol 32:294–304
14. Xu J, Wang L, Ridgway D, Gu T, Moo-Young M (2000) In-creased heterologous protein production in Aspergillus nigerfermentation through extracellular proteases inhibition bypelleted growth. Biotechnol Prog 16:222–227
15. Sriram G, ManjulaRao Y, Suresh AK, Sureshkumar GK(1998) Oxygen supply without gas–liquid film resistance toXanthomonas campestris cultivation. Biotechnol Bioeng59:714–723
16. El-Beltagy AE, El-Adawy TA, Rahma EH, El-Bedawey AA(2004) Purification and characterization of an acidic proteasefrom the viscera of bolti fish (Tilapia nilotica). Food Chem86:33–39
17. Ro YT, Lee HIl, Kim EJ, Koo JH, Kim E, Kim YM (2003)Purification, characterization, and physiological response of acatalase–peroxidase inMycobacterium sp strain JC1 DSM 3803grown on methanol. FEMS Microbiol Lett 226:397–403
18. Busquets M, Franco R (1986) A laboratory experiment on thepurification of catalase. Biochem Educ 14:84–87
19. Sriram G, Sureshkumar GK (2000) Mechanism of oxygenavailability from hydrogen peroxide to aerobic cultures ofXanthomonas campestris. Biotechnol Bioeng 67:487–492
20. Mate MJ, Zamocky M, Nykyri LM, Herzog C, Alzari PM,Betzel C, Koller F, Fita I (1999) Structure of catalase-A fromSaccharomyces cerevisiae. J Mol Biol 268:135–149
21. Schonbaum GR, Chance B (1976) In: Boyer PD (ed) Catalasein the enzyme, vol 13, 2nd edn. Academic, New York, pp 363–408
22. Nielsen J, Krabben P (1995) Hyphal growth and fragmentationof Penicillin chrysogenum in submerged cultures. BiotechnolBioeng 46:588–598
23. Nielsen J (1993) A simple morphologically structured modeldescribing the growth of filamentous microorganism. Biotech-nol Bioeng 41:715–727
24. Mandal C (2004) Multiobjective optimization of multisubstratefermentations. Doctoral Thesis. http://www.library.iitb.ac.in/�mnj/gsdl/cgi-bin/library
25. Sriram G, Sureshkumar GK (2001) Culture fluorescencedynamics in Xanthomonas campestris. Process Biochem36:1167–1173
26. Storn R (1996) On the usage of differential evolution forfunction optimization. http://www.icsi.berkeley.edu/�storn/code.html
27. Michalewicz Z, Schoenauer M (1996) Evolutionary algorithmsfor constrained parameter optimization problems. Evol Com-put J 4:1–32
28. Mosbach K (1988) Methods in enzymology, vol 137. Academic,San Diego, p 689
29. Hatzinikolaou DG, Macris BJ (1995) Factors regulating pro-duction of glucose oxidase by Aspergillus niger. Enzyme Mic-rob Technol 17:530–534
30. Sarath G, Motte RSDL, Wagner FW (1990) In: Beynon RJ,Bond JS (eds) Protease assay methods in proteolytic enzymes: apractical approach. IRL Press, Oxford
31. Beer R, Sizer FA (1951) A spectrophotometric method for thebreakdown of hydrogen peroxide. J Biol Chem 226:133–139
32. Bailey JE, Ollis DF (1986) Biochemical engineering funda-mentals, 2nd edn. McGraw-Hill, New York
164