multi-product firms and product turnover in the …npavcnik/research_files/gkpt... · multi-product...
TRANSCRIPT
Multi-product Firms and Product Turnover in the Developing World:
Evidence from India*
Penny Goldberg Princeton University
BREAD, NBER
Amit Khandelwal Columbia Business
School, BREAD
Nina Pavcnik Dartmouth College
BREAD, CEPR, NBER
Petia Topalova Asia & Pacific
Department IMF
April 2009
Abstract
This paper provides evidence on the patterns of multi-product firm production in a large
developing country – India – during a period that spans market reforms. In the cross-section,
multi-product firms in India look remarkably similar to their U.S. counterparts. The time-series
patterns however exhibit important differences. In contrast to evidence from the U.S., product
churning – particularly product rationalization – is far less common in India. We find no link
between product rationalization and output tariff declines following India's 1991 trade
liberalization. The lack of “creative destruction” is consistent with the role of industrial
regulation in preventing an efficient allocation of resources.
Keywords: Multi-product Firms, Product Churning, Developing Countries, India, Creative
Destruction, Trade Liberalization
JEL: O12, O24, F0

2
1. Introduction
Firm-level studies have emphasized substantial gains in aggregate output that arise when
policy reform, such as international trade liberalization, or changes in market fundamentals
induce a reallocation from low- to high-performance firms within industries.1 This literature
typically treats each firm as producing a single product and abstracts from the reallocation of
output within multi-product firms through changes in product mix in response to changes in the
economic environment. A notable exception is recent work on multi-product firms by Bernard,
Redding and Schott (henceforth, BRS (2006a, 2006b)), Nocke and Yeaple (2006), Eckel and
Neary (2006), and Baldwin and Gu (2006).
The focus on multi-product firms' product mix decisions is relevant to the extent the
changes in the product mix account for a significant portion of changes in firms' output over
time. BRS (2006a, 2006b) indeed document that the contribution of firms’ product margin
towards output growth trumps the contribution of firm entry and exit, a widely studied channel in
the literature on firm dynamics. This evidence suggest that product mix changes represent a
potentially important channel through which resources are reallocated from less to more efficient
uses within U.S. firms. While this work has uncovered thought-provoking new facts, it has
focused mainly on the U.S.2 This paper provides evidence on the characteristics and product
mix decisions of multi-product firms in a large developing country, India.
The extension of firms' product mix literature to a developing country setting is relevant
for several reasons. First, it is well known that countries at different stages of development
exhibit notable differences in the size distribution of firms as well as differences in the efficiency
of resource allocation across heterogeneous firms.3 These differences stem in part from
differences in the regulatory environments in which firms operate (Tybout (2000)). Firms in

3
developing countries often face constraints that are irrelevant to U.S. firms. In India, for
example, private sector activity was heavily regulated through the “license raj”, a system of
complex industrial license requirements for establishing and expanding capacity in the
manufacturing sector, while the Industrial Disputes Act (1947) provided significant protection
for labor in the organized sector (Kochhar et al (2006)). Given these constraints, it is
questionable whether Indian firms had the necessary flexibility to adjust their product mix in
order to achieve a more efficient allocation of resources. Second, many developing countries
implemented sweeping market reforms in recent years that altered the environment in which
firms had operated in the past. In India, such reforms include the trade liberalization of the early
1990’s and a stepped-up dismantling of the “license raj.” These reforms provide an interesting
setting for the purpose of investigating how firms adjust product mix in a changing economic
environment.
We use a unique firm-level panel database which contains detailed information on
products that each firm manufactures to study firms’ product mix changes during a period of
major market reforms in India. Our data is particularly well suited to examine whether Indian
firms change their product scope in response to India’s large-scale tariff liberalization. India's
trade reform provides an attractive setting for the study in part because firms were unlikely to
have anticipated the reform; tariff changes between 1991 and 1997 were less prone to the usual
political economy pressures (Topalova (2007)).
The data indicate that Indian multi-product firms are quite similar to their counterparts in
U.S. manufacturing studied by BRS along several dimensions. Multi-product firms are strong
performers: within narrowly defined industries, India’s multi-product firms are larger, more
productive, and more likely to export than single-product firms. We also find a striking

4
resemblance of the within firm product distribution to the U.S. data. Finally, we document a
positive correlation between the firms' extensive and intensive margins. These cross-sectional
patterns are consistent with predictions of theoretical models of multi-product firms, especially
BRS (2006b).
Perhaps more surprisingly, our analysis also suggests that despite the regulatory
constraints described above, changes in firms’ product mix had a non-negligible contribution to
growth; on net, they account for approximately 25% of the increase in Indian manufacturing
output during our sample period. This validates the focus on firms' product margin in recent
empirical work. However, a closer examination of the gross changes in the product mix of
Indian firms reveals important differences to U.S. firms in the time-series. While BRS (2006a)
uncover a substantial amount of product churning within U.S. firms, Indian firms exhibit far less
frequent changes in their product mix over a 5-year period. Moreover, firms in India
infrequently drop a product or simultaneously add and drop a product. The contribution of the
net product margin to total output growth is therefore driven almost exclusively by product
additions, and not by discontinuation of product lines that have become obsolete. Hence, our
results suggest that product churning, or “creative destruction” along the product dimension, is
not happening in India in the 1990’s, despite major trade and other structural reforms during this
period. Furthermore, we are unable to connect the changes in firms’ product mix to changes in
trade policy. The empirical framework that exploits differential changes in tariffs across Indian
industries finds no relationship between declines in output tariffs and a firms' extensive margin—
the number of products it manufactures.
The lack of product dropping seems surprising given predictions from recent multi-
product firm models in trade. For example, BRS (2006b), a multi-product extension of Melitz
5
(2003), predict that a decline in trade costs causes firms to rationalize their extension by
shedding products outside their "core competency". More generally, theories emphasizing the
role of “creative destruction” in the growth process predict that product dropping plays an
important role in firms’ adjustment to a changing economic environment.
However, these models assume a frictionless environment that easily allows an efficient
allocation of resources across and within firms. These assumptions are at odds with the
conditions firms faced in India during our sample period. A plausible explanation for our
findings is that remnants of industrial licensing and rigid labor market regulations continue to
affect the daily operations of firms, potentially precluding them from eliminating unprofitable
product lines. This interpretation is consistent with the explanations put forth for the lack of
product dropping in case-studies on product scope of Indian conglomerates by Khanna and
Palepu (1999).4 Some of our results also suggest that declines in tariffs are associated with
somewhat bigger changes in firms' product scope in industries no longer subject to licenses at the
onset of the 1991 reform compared to regulated industries. Given the high sunk costs facing
firms that wanted to expand their operations in the past, it is not surprising that firms that paid
these high sunk costs are reluctant to withdraw established product lines even when these are
unprofitable, as markets become more liberalized.
Alternatively, the low degree of product shedding might reflect the rapid growth of the
Indian economy. In a fast-growing economy, the relative share of output of a given product
could be declining considerably without an absolute decline of output and inputs and hence the
lack of product dropping. Because of huge wealth disparities in India's population, it is also
possible that there is always demand for older products, which would have become obsolete in

6
more developed countries like the U.S. Accordingly, we do not interpret our results as evidence
against recent theories.
2. Data
We compile a firm-level panel data set that spans the period from 1989 to 2003 based on
the Prowess database, collected by the Centre for Monitoring the Indian Economy (CMIE). The
Prowess database contains information primarily from the income statements and balance sheets
of about 9,500 publicly listed companies, almost 5,000 of which are in the manufacturing sector.
This database is a firm-level panel and the only Indian database, to our knowledge, that records
detailed annual information on firms’ product-mix. Indian firms are required by the 1956
Companies Act to disclose product-level information on capacities, production and sales in their
annual reports. The CMIE compiles these detailed quantitative data and therefore enables us to
track a firm’s adding and dropping of products over time. Furthermore, for each product
manufactured by the firm, the dataset provides the value of sales, quantity and units. The
Prowess is therefore particularly well suited for understanding how firms adjust their product
lines over time and how their responses may be related to policy changes.5
The definition of a product is based on the CMIE's internal product classification. There
are a total of 1,886 products linked to 108 four-digit NIC industries across the 22 manufacturing
sectors (two-digit NIC codes). As a comparison, the U.S. data used by BRS (2006a), contain
approximately 1,500 products, defined as five-digit Standard Industrial Classification (SIC)
codes, across 455 four-digit SIC industries. Thus, our definition of a product is slightly more
detailed than BRS (2006a).
We complement the data on firm product mix with various measures on trade policy at
the industry level. Detailed description of data sources, product classification, variable
7
construction, and data quality is included in an unpublished appendix available on the authors'
web sites.
3. A Portrait of Multi-Product Firms
While we are particularly interested in the implications of theories of multi-product firms
for the way firms adjust to structural changes in an open economy, recent models (BRS (2006b),
Nocke and Yeaple (2006)) also yield several predictions about the characteristics of multi-
product firms in a cross section. In this section, we document the economic significance and
characteristics of multi-product firms in India and examine the extent to which the cross-
sectional patterns observed in the Indian data are consistent with these predictions.
We begin by examining the relative importance of single- and multi-product firms in
India. Given the scant empirical evidence on multi-product firms, particularly for developing
countries, the facts uncovered by BRS (2006a) for U.S. firms serve as a useful benchmark for the
Indian firms. We emphasize however, that comparisons between the two studies should be
interpreted with caution given that the U.S. and India are two countries incredibly distinct along
several dimensions of their respective economic environments. Table 1 reports the share of each
type of firm in the total number of firms, as well as their share in total manufacturing output in
the Prowess sample. The table illustrates that multi-product firms account for 47% of
manufacturing firms and 80% of manufacturing output.6 By comparison, 39 percent of U.S.
firms manufacture more than one product and these firms account for 87 percent of total output.
The third column of Table 1 shows that multiple-product firms manufacture on average 3
products, compared to 3.5 products for U.S. multi-product firms. 33 and 24 percent of firms
manufacture products that span more than one industry and sector, respectively. These multiple-
industry and multiple-sector firms account for 62 percent and 54 percent of output, respectively.
8
Again for comparison’s sake, 28 and 10 percent of U.S. firms span multiple industries and
sectors, and account for 81 and 66 percent of output, respectively. Thus, Indian firms tend to
span more sectors, but multiple-sector firms account for a smaller share of output than multiple-
sector U.S. firms. These facts are consistent with observations by Kochhar et al. (2006) that
India’s economic policies have lead to more diversification and firms of smaller capacity.
Another explanation, proposed by Khanna and Palepu (1999), is that diversification may be a
response to the lack of well-functioning capital, labor and product markets. The absence of
market intermediaries may force firms to become more diversified to overcome these
imperfections.
The recent multi-product models provide a number of cross-sectional predictions which
we can examine using the Indian data. One important prediction of these models is that multi-
product firms are stronger performers than single-product firms. This occurs because the
presence of headquarter fixed costs implies that the more “able” firms will self-select into
becoming multi-product firms. Accordingly, all models predict that multi-product firms will at
the equilibrium have higher total sales and will be more likely to export. We find strong evidence
that is consistent with these predictions reported in Table 2. In particular, we observe that Indian
multi-product firms produce, on average, 125 percent (e.81-1) higher output and are 13 percent
more likely to export than single-product firms. These relative comparisons are quite similar to
the average percent differences between U.S. single- and multiple-product firms in BRS (2006a).
We also observe that multi-product firms are 1 percent more productive than single product
firms, although the estimate is not statistically significant.7 Overall, the evidence suggests that
multi-product firms are stronger performers along several dimensions and this evidence is
strongly consistent with BRS (2006b).8

9
The BRS (2006b) model also predicts that firms possess “core competencies”, so that
output should be highly skewed towards products for which firms have particular expertise. We
also find evidence that Indian firms possess a core competent product with output inside the firm
unevenly distributed across products in Table 3. The largest product accounts for 86% to 65%
to 46 % of total sales in firms that produce at most 2, 5, and 10 products, respectively, and these
figures are similar to U.S. (BRS (2006a)).
Finally, one implication of the BRS (2006b) model is that, depending on the distribution
of productivity and product-expertise draws, it is possible to generate a positive correlation
between the firm intensive and extensive margins. Our analysis suggests that approximately 8.5
to 11.5 percent of the variation in output across firms can be attributed to the variation in the
extensive margin. Moreover, we find a positive correlation (0.43) between multi-product firms’
extensive and intensive margins. We again note the similarity to the U.S. data along this
dimension, as well.
In general, differences in the design of firm level surveys and product classifications
make it hard to compare results related to firm and product characteristics across countries. With
this caveat in mind, we cannot help but note that in the cross-section, Indian firms appear
remarkably similar to U.S. firms in terms of the prevalence and characteristics of multiple-
product firms, the distribution of products within the firm, and the correlations between the
intensive and extensive product margins. These similarities are surprising given the vast
differences between the two countries, especially those related to their regulatory environments.
Furthermore, the cross-sectional patterns of multi-product Indian firms, like the ones
documented for U.S. firms, are consistent with the main predictions of recent multi-product firm
models.

10
4. Changes in Product Mix over Time
In this section we examine the importance of changes in firms' product margin over time,
which for the typical Indian firm, steadily increased from about 1.4 products in 1989 to almost
2.3 products by 2003.
We first examine in greater detail the nature of product mix changes that led to the
observed expansion of the extensive margin. We classify firm activity into one of four mutually
exclusive groups: no activity, add products only, drop products only, and both add and drop
products. A product is added in period t if it is produced in period t but not in period t-1. A
product is dropped in period t, if it was produced in period t-1 but it is not produced in period t.
We compute these figures only for surviving firms, so that the analysis focuses on product mix
changes at incumbents. We report the summary of overall, five-year, three-year and annual firm
activity in Table 4. The top panel reports the share of firms participating in each activity and the
bottom panel weighs participation in each activity by firm output.
In contrast to the cross-sectional descriptive results, this table shows large differences in
the activities of Indian and U.S. firms. First, Indian firms are characterized by less product
churning. Over a five-year period, only 28 percent of firms report changes in their product mix,
with most of these being larger firms. The firms that switch products over a five-year interval
account for 43 percent of the total output.9 Second, Indian firms that change their product mix
are far more likely to add products over time than to shed product lines: 22 percent of the firms
report adding at least one product, 4 percent of firms drop a product, and 2 percent of firms
simultaneously add and drop a product. This is in contrast to the U.S. where 54 percent of firms
report a change in their product mix. However, a common feature of the Indian and U.S. data is
that changes in product mix are more common among multi-product than single product firms.

The lack of product dropping in the data raises the concern that it may reflect reporting
problems. There are several reasons suggesting that the lack of product shedding is not due to
data problems. If there were inertia in reporting product lines, this would likely affect both the
reporting of product adding and product dropping; however, we do find evidence of product
adding. More importantly, firms were required to report not only the product name, but also the
quantity produced and value of sales. If firms continued to list products that they no longer
produced, we would observe a large share of observations with zero production. Yet, only 13
percent of the original product name-firm-year observations report zero production (we count
these products as dropped). Furthermore, the product sales account for 92 and 99 percent of total
output and manufacturing output reported by the firm on their annual statements (GKPT (2008)).
Finally, apart from the product dropping patterns, the Indian data appear similar to the U.S. data
along many dimensions discussed earlier. In the analysis that follows below we also show that
the shrinking of products sales is limited as well, suggesting that the lack of reallocation from
“shrinking” to “growing" products is real.
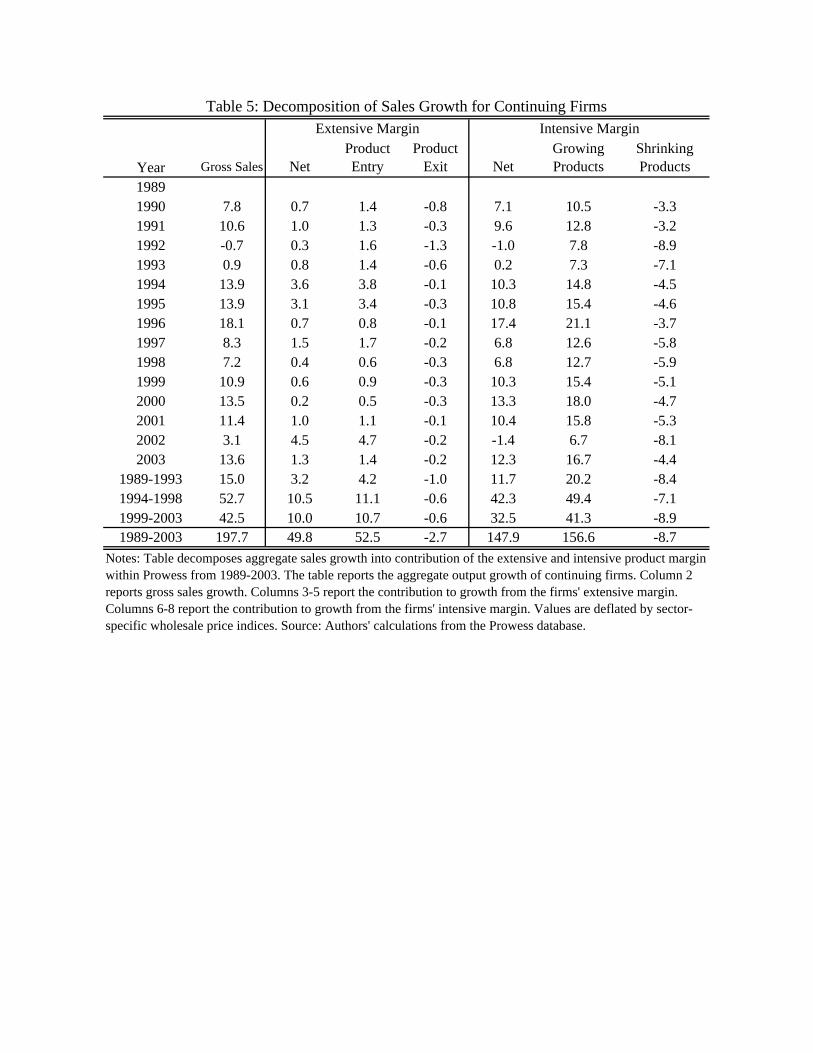
Changes in product mix provide a non-negligible contribution to changes in output of
continuing firms, despite the relatively lower product switching in India relative to the U.S. We
decompose the aggregate change in output of continuing firms into changes in output due to
changes in product mix (i.e., the extensive margin) and changes in output due to existing
products (i.e., the intensive margin) in Table 5.10 Let denote the output of product i produced
by firm j at time t, C the set of products that a firm produces in both periods t and t-1 (i.e., the
intensive margin), and E the set of products that the firms produce only in t or t-1 (i.e., the
ijtY
11

12
Y
extensive margin). Then changes in a firm’s total output between periods t and t-1 can be
decomposed as follows: . jt ijt ijti E i C
Y Y∈ ∈
Δ = Δ + Δ∑ ∑
t ijtj i A
Y
We can further decompose the (net) extensive margin into the gross margins due to product
additions (A) and product droppings (D). The (net) intensive margin is the sum of the gross
changes from growing (G) and shrinking products (S). The aggregate change in output among
continuing firms in the Prowess database is therefore
⎡ijt ijt ijt
i D i G i S
Y Y Y Y∈ ∈ ∈ ∈
⎤Δ + Δ + ΔΔ = Δ +⎢ ⎥⎦∑ ∑ ∑
⎣∑ ∑ .
The first two terms capture the growth due to changes in the firms’ net extensive product margin
and the final two terms capture changes in the net intensive margin.
Table 5 reports the decomposition. As in the U.S., the firm's intensive margin accounts
for the majority (75 percent) of output growth over longer time horizons in India. Interestingly,
despite the lower product churning observed in India, the extensive margin accounts for a
considerable portion of output changes over longer time periods: 25% between 1989 and 2003.
As in the U.S., the importance of the extensive margin fluctuates considerably over shorter
horizons.
The relative contributions of the net extensive and intensive product margins over longer
time horizons appear similar to those documented for the U.S. However, important differences
emerge between the Indian and U.S. firms in comparing the gross margins. While product
shedding is an important channel through which firms adjust their output in the U.S., its
contribution to changes in output in India is negligible (with the exception of 1992). The
changes in output stemming from the extensive margin are almost entirely driven by output
growth due to product additions. Consequently, gross and net contributions of the extensive
13
margin to output growth are of similar orders of magnitude. This is in large contrast to the U.S.,
where both product additions and subtractions significantly contribute to output changes leaving
the gross margin an order of magnitude larger than the net extensive margin. Similar patterns
emerge when we decompose changes in the net intensive margin due to growing and shrinking
products. The growth in the intensive margin in India is predominately driven by growth in
"growing products", with little reallocation of output away from "shrinking products", so that the
net and gross output changes are of similar orders of magnitude. Again, this in stark contrast to
the U.S. data, where the gross intensive margin is an order of magnitude larger than the net
intensive margin.
So, while the patterns we documented suggest many similarities between the U.S. and
Indian multi-product firms in the cross section, their dynamic behavior, measured by the degree
of product churning over time, appears quite distinct. These observed differences over time
speak to how much more dynamic the U.S. economy is relative to India. Despite the significant
reforms taking place in India during the 1990’s, we find little evidence of "creative destruction".
While our data do not allow us to pin down the reasons behind the lower degree of product
churning in India, we believe that this pattern could be driven by two factors.
First, it is plausible that labor market regulation and the remnants of industrial regulation
still affect the operation of Indian firms, constraining their flexibility to adjust to new economic
conditions. While we do not have direct evidence on this hypothesis, earlier work has
consistently found that pro-worker labor legislation, industrial licensing and especially their
interaction leads to a less efficient allocation of resources, i.e., lower output and productivity in
manufacturing industries (e.g., Besley and Burgess (2004), Aghion et al. (2008), Ahsan and
Pages (2008)). While this evidence does not cover product turnover, it strongly suggests that the

14
sunk costs of firm entry and new product introduction were high. Therefore, it is not surprising
that firms that did pay these high sunk costs are reluctant to withdraw products, even as markets
become more liberalized.
The low degree of product shedding could also reflect that India is a fast-growing
developing country, so that the relative share of output of a given product could be declining
considerably without an absolute decline of output and inputs and hence no product dropping.
This explanation is also consistent with the fact that when we examine the intensive margin, we
find little evidence of “shrinking”, but strong evidence of “growing” products. Given that India
is also characterized by huge wealth disparities in its population, it is also possible that there is
always demand for older products, which would have become obsolete in more developed
countries like the U.S.11
As noted above, we are not able to distinguish between these hypotheses given the data
available to us. However, a different approach towards explaining product turnover in India (or
the lack thereof) is suggested by India’s recent trade reforms. India underwent a significant trade
liberalization in the early 1990’s, which provides us with fairly precisely measured changes in
trade barriers. In the next section we relate these changes in trade policy to changes in firms’
product mix to examine if the patterns we observe in the Indian data can at least partly be
explained by changes in the economic environment.
5. Product Mix and Trade Policy
Several studies emphasize the adjustments to trade reform that occur within industries,
and recent papers focus on the role of firms' product margin in this process (BRS (2006b), Eckel
and Neary (2006), Nocke and Yeaple (2006), Baldwin and Gu (2006)). These models generally
predict that lower trade costs lead firms to reduce their extensive product margin by dropping
15
products. For example, in BRS (2006b), a symmetric bilateral decline in trade costs induces
firms to reduce their product scope by shedding relatively unproductive products. This is because
such a decline is associated with an increase in the domestic productivity cut-off (since the
increase in exports leads to an increase in domestic labor demand, which in turn leads to higher
wages). The least productive domestic firms exit and all firms reduce product scope. This leads
to productivity growth within and across firms and in the aggregate. While these results are
derived using a bilateral trade liberalization, similar predictions hold under unilateral
liberalization. A multi-product firm extension of Melitz and Ottaviano (2008) also predicts that
unilateral trade reform induces product rationalization because foreign entry intensifies product
market competition (Baldwin and Gu (2006)).
To our knowledge, this link between declines in trade costs and firms’ extensive margin
has not been previously examined empirically in the context of developing countries, of which
several have experienced substantial declines in their trade barriers in the last two decades. The
large tariff declines resulting from India’s 1991 trade liberalization provide a nice setting for
such analysis for several reasons. First, India's reforms came as a surprise, so it is reasonable to
assume that they were not anticipated by firms prior to the reform. Second, tariff cuts were large
(average tariffs where reduced from over 90% in 1987 to about 30% in 1997) and brought a
substantial decline in the dispersion of tariffs across industries. Industries with larger pre-reform
tariffs experienced larger tariff declines, a pattern unlikely to be observed if traditional political
economy concerns played an important role in India’s trade liberalization of 1991. In fact, there
is no evidence that industry tariff changes, which were mostly spelled out in the Eighth Five
Year Plan (1992-1997) were correlated with pre-reform industry characteristics such as
productivity, industry size, etc (Topalova, 2007). However, Topalova (2007) provides evidence

that tariff changes begin to appear susceptible to political economy pressures following the
election of the BJP party in 1997. We thus restrict the analysis of the impact of the trade
liberalization on the firms’ extensive margin from 1989-1997.
We regress the (log) number of products manufactured by firm j in time t, nit, on the tariff
rate of the firm’s main industry (m), lagged one year, τm,t-112
(1) jttmtjjtn εβταα +++= −1,log .
The regression includes firm fixed effects and year fixed effects to control for time-invariant firm
characteristics and unobserved aggregate shocks. Standard errors are clustered at the industry
level.
Column 1 of Table 6 reports the results using output tariffs as the trade policy measure.
The coefficient is negative but statistically insignificant. This suggests that declines in tariffs are
uncorrelated with changes in the number of products at the firm-level. In column 2, we include
sector (NIC2)-year fixed effects to control for sector-specific demand or supply shocks. The
coefficient on tariffs remains statistically insignificant and the magnitude is quite similar to the
baseline result that included year fixed effects. Given that some sectors were still subject to non-
tariff barriers (NTBs) during this period, the lack of relationship between changes in product mix
and output tariffs could be due to the fact that these sectors remained protected despite the
decline in tariffs. By 2001, however, over 90% of the HS6 lines were not subject to NTBs. We
therefore estimated regression (1) using data on only one pre- (1990) and one post-reform year
(2001), by which the majority of NTBs were dismantled. The results of this regression are
shown in column 3; the coefficient on the output tariff continues to be small in magnitude and
insignificant. In column 4 we adopt a simple difference-in-differences approach by regressing
firm-level number of products on an indicator if the industry had above average declines in
16

17
tariffs interacted with the post 1991 indicator, firm fixed effect, and year effects.13 The
interaction effect is statistically insignificant, consistent with the earlier columns.
If lower output tariffs induce firms to simultaneously add and drop products, the firm's
extensive margin might remain unchanged. While none of the existing models generate product
switching in response to trade reforms, Bernard, Schott, and Jensen (2006) find that U.S. firms
that are exposed to a greater degree of foreign competition are more likely to switch an industry.
Recall from Table 4 that simultaneous adding and dropping of product lines is quite rare for
Indian firms. Nevertheless, in columns 5 and 6 of Table 6, we replace the dependent variable in
equation (1) with an indicator (addit) if firm i adds a product in year t, and a separate indicator
(dropit) if firm i drops a product in time t that it manufactured at t-1, respectively. The
coefficients on the output tariffs remain small and statistically insignificant in both cases.
Column 7 provides an alternative specification where firm-level tariffs are constructed by
weighting industry tariffs according the initial industry shares of firm output. As before, the
coefficient on tariffs remains statistically insignificant. In column 8, we assign a firm-specific
tariff based on the least important (initial-period) product manufactured by the firm. This idea is
motivated by the theoretical models which suggest that firms should rationalize the least
important products in response to tariff liberalization. We find a small and statistically
insignificant coefficient on this tariff measure. The take-away message of Table 6 is that the
firms' product scope does not appear correlated with tariffs.
The lack of a relationship between declines in trade costs and firms' extensive margin is
somewhat surprising in light of the predictions of theoretical models. As we noted earlier, the
Indian trade liberalization of the early 1990’s is best characterized as a unilateral trade reform, so
that there is no tension between our results and the predictions of models that focus on

18
symmetric bilateral trade reductions (e.g., BRS (2006b)). However, the tension does exist, when
one considers models that encompass the case of unilateral trade reform. At this point it is
important to note that the previous literature on the effects of the Indian trade reforms does find
firm adjustments to the 1991 trade barrier reductions. Lower output tariffs induce productivity
gains (Krishna and Mitra (1998), Sivadasan (2006), Topalova (2007)). Yet, our results suggest
that lower tariffs are not associated with product rationalization within surviving firms in India.14
A potential explanation for our findings is that remnants of the strict industrial regulation
of the past may be inhibiting firms from shedding existing product lines, even when these
become less profitable; the lack of shedding could in this sense be interpreted as indirect
evidence that Indian firms faced high sunk costs when introducing a new product. As discussed
above, industrial licenses were important parts of the economic climate in India during this
period. India started dismantling its license system during the 1980s and stepped up this process
in 1991. The removal of licenses would have lowered product-specific entry costs and may have
enabled firms to increase their extensive margins. On the other hand, it may have allowed firms
to become more flexible to shocks by shutting down or restarting a product line in the absence of
license requirements. Column 9 of Table 6 reports the results of estimating equation (1) that
includes an indicator that takes a value of one if the industry was license free as an additional
control. The inclusion of delicensed variable does not affect the coefficient on output tariffs and
the coefficient on delicensed is statistically insignificant.15
In order to examine the link between tariff reforms and delicensing in influencing firms'
product scope more directly we distinguish between industries that were delicensed in the 1980s
and those that continued to be regulated after 1988. One would expect tariff declines to have a
larger effect on product scope in industries that were no longer regulated by licenses at the onset

19
of trade reform. We interact an indicator for whether an industry was delicensed by 1988 with
the output tariff and include this interaction as an additional regressor in equation (1). Column
10 of Table 6 presents the results. The tariff coefficient is insignificant, but, the negative and
significant coefficient on the interaction suggests that lower tariffs are associated with more
product additions in industries that were delicensed by 1988. This result provides some tentative
evidence that regulation might play some role in explaining the limited product churning in
Indian firms.
Still, a striking feature of our data is that they indicate that firms expand their product
scope during a period of substantial reforms; changes in the extensive margin are driven by
product addition, not product destruction. Existing models focus on product scope reduction as a
channel through which firms adjust to external shocks. Against this background, it may not
come as a surprise that we cannot relate the product additions we observe to changes in trade
policy, as suggested in these models.
6. Conclusion
We study multi-product firms in India. In the cross-section, India's multi-product firms
look remarkably similar to U.S. counterparts, despite many differences in the regulatory
environments in which these firms operate. We also find that changes in firms’ product mix had
a non-negligible contribution to growth; on net, they account for approximately 25% of the
increase in Indian manufacturing output during our sample period. However, Indian and U.S.
firms differ in gross changes in product mix. Product churning is substantially lower among
Indian firms and almost entirely driven by product additions rather than the shedding of existing
product lines.

20
The lack of product shedding is consistent with the high regulation of the past that placed
constraints on Indian manufacturing firms’ operating decisions. While India initiated market-
oriented reforms in the early 1990s, firms faced high sunk costs of expanding operations prior to
the reforms. It is therefore likely that once these costs were sunk, firms were reluctant to
withdraw established product lines, particularly given the rapid growth rate of the Indian
economy. Given that we do not find evidence of product dropping in raw data, perhaps
unsurprisingly, we are then unable to connect the changes in firms’ product mix through product
additions to changes in trade policy. In future work, we plan to investigate additional channels
through which changes in the economic environment, trade policy in particular, affect the
product decisions of multi-product firms in developing countries.
References
Ahsan, Ahmad, and Carmen Pages, “Are All Labor Regulations Equal? Evidence from Indian
Manufacturing," IZA DP No. 3394 (2008).
Aghion, Philippe, Robin Burgess, Stephen J. Redding, and Fabrizio Zilibotti, “The Unequal
Effects of Liberalization: Evidence from Dismantling the License Raj in India” American
Economic Review 98:4 (2008), 1397-1412.
Baldwin, John R., and Wulong Gu, “The Impact of Trade on Plant Scale, Production-Run
Length and Diversification,” Economic Analysis Research Paper working paper no. 38,
Statistics Canada (2006).
Bartelsman, Eric, John Haltiwanger, and Stefano Scarpetta, “Cross Country Differences in
Productivity: The Role of Allocative Efficiency,” University of Maryland mimeo (2006).

21
Bernard, Andrew B., Jonathon Eaton, J. Bradford Jensen, and Samuel Kortum, “Plants and
Productivity in International Trade,” American Economic Review 93:4 (2003), 1268-1290.
Bernard. Andrew B., J. Bradford Jensen, and Peter K. Schott. “Trade Costs, Firms and
Productivity,” Journal of Monetary Economics 53:5 (2006), 917-937.
Bernard, Andrew B., Stephen J. Redding, and Peter K. Schott, “Multi-product Firms and Product
Switching,” NBER working paper no. 12293 (2006a).
Bernard, Andrew B., Stephen J. Redding, and Peter K. Schott, “Multi-product Firms and Trade
Liberalization,” NBER working paper no. 12782 (2006b).
Bernard, Andrew B., Stephen J. Redding, and Peter K. Schott, “Comparative Advantage and
Heterogeneous Firms,” Review of Economic Studies 74:1 (2007), 31-66.
Bernard. Andrew B., J. Bradford Jensen, and Peter K. Schott. “Survival of the Best Fit: Exposure
to Low-Wage Countries and the (Uneven) Growth of U.S. Manufacturing Plants.” Journal of
International Economics 68:1 (2006), 219-227.
Besley, Timothy, and Robin Burgess, “Can Labor Regulation Hinder Economic Performance?
Evidence from India,” Quarterly Journal of Economics 119:1 (2004), 91-134.
Eckel, Carsten, and J. Peter Neary, “Multi-product Firms and Flexible Manufacturing in the
Global Economy,” Oxford University mimeo (2006).
Goldberg, Pinelopi K., Amit K. Khandelwal, Nina Pavcnik, and Petia Topalova. “Multi-product
Firms and Product Turnover in the Developing World: Evidence from India”, NBER
working paper no. 14127 (2008).
Hsieh, Chang-Tai, and Peter J. Klenow, “Misallocation and Manufacturing TFP in China and
India,” NBER working paper no. 13290 (2007).

22
Khanna, Tarun, and Krishna Palepu, “Policy Shocks, Market Intermediaries and Corporate
Strategy: the Evolution of Business Groups in Chile and India.” Journal of Economics &
Management Strategy 8:2 (1999), 271-310.
Kochhar, Kalpana, Utsav Kumar, Raghuram Rajan, Arvind Subramanian, and Ioannis Tokatlidis,
“India's Pattern of Development: What Happened, What Follows," Journal of Monetary
Economics 53:5 (2006), 981-1019.
Krishna, Pravin, and Devashish Mitra, “Trade Liberalization, Market Discipline and Productivity
Growth: New Evidence from India,” Journal of Development Economics 56:2 (1998), 447-
462.
Melitz, Marc J., “The Impact of Trade on Intra-Industry Reallocations and Aggregate Industry
Productivity,” Econometrica 71:6 (2003), 1695-1725.
Melitz, Marc J., and Gianmarco I.P., “Market Size, Trade, and Productivity" Review of Economic
Studies 75:1 (2008), 291-316.
Navarro, Lucas, “Plant-Level Evidence on Product Mix Changes in Chilean Manufacturing,”
ILADES-Georgetown University working papers no. 210 (2008).
Nocke, Volker, and Stephen Yeaple, “Globalization and Endogenous Firm Scope,” NBER
working paper no. 12322 (2006).
Roberts, Bee Yan, and Yi Lee, “Multiproduct Plants in Taiwanese Electronics Sector,” Penn
State mimeo (2008).
Roberts, Mark J. and James R. Tybout (Eds), Industrial Evolution in Developing Countries:
Micro Patterns of Turnover, Productivity, and Market Structure (New York, NY: Oxford
University Press, 1996).

23
Sivadasan, Jagadeesh, “Productivity Consequences of Product Market Liberalization: Micro
evidence from Indian Manufacturing Sector Reforms,” University of Michigan mimeo
(2006).
Topalova, Petia, “Trade Liberalization and Firm Productivity: The Case of India,” IMF working
paper no. WP/04/28 (2007).
Tybout, James R., “Manufacturing Firms in Developing Countries: How Well do They do and
Why?” Journal of Economic Literature 38:1 (2000), 11-44.
Tybout, James R., “Plant and Firm Level Evidence on the "New" Trade Theories,” in E. Kwan
Choi and James Harrigan (Eds.), Handbook of International Trade, Malden, MA:Blackwell
(2003).
* We thank Matthew Flagge, Andrew Kaminski and Michael Sloan Rossiter for excellent
research assistance and Andy Bernard, Pete Schott, and Steve Redding for comments and
discussions. We also thank two anonymous referees, the Editor, and seminar participants at the
UCLA Business School, Notre Dame, the LSE China-India Conference, World Bank, Columbia,
and the IZA/World Bank Employment and Development Conference. We thank the Economic
Growth Center at Yale for financial support. Correspondence to Goldberg at
[email protected], Khandelwal at [email protected], Pavcnik at
[email protected], or Topalova at [email protected]. The views expressed in this
paper are those of the authors and should not be attributed to the International Monetary Fund, its
Executive Board, or its management.

24
1 See Bernard et al. (2003), Bernard et al (2007), Melitz (2003), Roberts and Tybout (1996) and
Tybout (2003).
2 Roberts and Lee (2008) and Navarro (2008) study multi-product firms in Taiwanese electronics
and Chile.
3 For example, see Tybout (2000), Hsieh and Klenow (2007), and Bartelsman et al (2006).
4 Managers pointed to the costs of reducing scope of operations such as “lack of liquid markets
for assets, regulatory restrictions on cost cutting through reduction of employees, lack of
professionals with experience in takeovers, buyouts and restructuring, and prohibitive taxes on
gains on asset sales.” (Khanna and Palepu (1999), p. 226)
5 This database is not well suited to study firm entry and exit because firms are under no legal
obligation to report to the data collecting agency. However, since Prowess contains only the
largest Indian firms, entry and exit is not necessarily an important margin for understanding
these firms.
6 The ASI rounds in 1997/98, 1999/2000 and 2001/02 record product-level information for
manufacturing plants. These data are not suitable for analysis of firms' product mix changes
because the ASI neither contains product information prior to the reforms nor is a panel.
However, in these rounds, multi-product plants are 51 percent of total plants and account for 78
percent of manufacturing output. These figures are remarkably similar to the Prowess sample.
7 Productivity measure is based on Levinsohn and Petrin methodology as in Topalova (2007).
We should note that differences in productivity were statistically significant in the ASI data,
which also includes smaller firms.
25
8 In an earlier draft (GKPT (2008)) we find further support for the selection hypothesis. Initially
single-product firms that eventually add products are stronger performers than (initially) single-
product firms that do not add a product. We find a similar relationship for initial multi-product
firms that add products relative to those that do not.
9 The middle and right parts of the table repeat the analysis for single and multi-product firms
separately. As in the U.S., multi-product firms in India are more likely to churn products than
single product firms.
10We perform this decomposition for continuing firms, as Prowess is not well suited for studying
firm entry and exit.
11 We thank a referee and Dr. Janak Raj from the Reserve Bank of India for these two
explanations for our findings.
12 Tariffs are matched to the firm’s 4-digit NIC industry code that reflects each firm's initial main
line of business.
13 This regression includes year and firm fixed effects, so post 1991 indicator and an indicator if
the industry had above average declines in tariffs is not identified. Industry tariff decline is
measured between 1997 and 1989.
14 Firms could drop products by exiting the market but our data is not well suited to examine this
channel. Moreover, given the size of these firms, firm exit is unlikely to be an important margin
of adjustment.
15The coefficient on the delicensed dummy is similar in the unconditional regressions. Using the
industry-level ASI data from 1980 to 1997, Aghion et al. (2008) find that de-licensing only
affected output in states that pass more flexible labor market legislation. Our unreported results

26
find no heterogeneous impact of delicensing on the firm’s extensive margin across labor markets.
Many Prowess firms have plants in states with different labor markets, which may wash away
any heterogeneity. In addition, there were no state amendments to labor market regulation after
1989 during the period of our sample (Aghion et el. (2008), Ahsan and Pages (2008)).

Type of Firm Share of Firms Share of Output
Mean Products, Industries or Sectors per
FirmSingle-Product 0.53 0.20 1Multiple-Product 0.47 0.80 3.06Multiple-Industry 0.33 0.62 2.01Multiple-Sector 0.24 0.54 1.68
Table 1: Prevalence of Single- and Multiple-Product Firms
Notes: Table classifies firms by single product, multiple product, multiple industry (four-digit NIC) and multiple-sector (two-digit NIC). The unconditional mean products per firm is 1.97. Source: Authors' calculations from Prowess database.
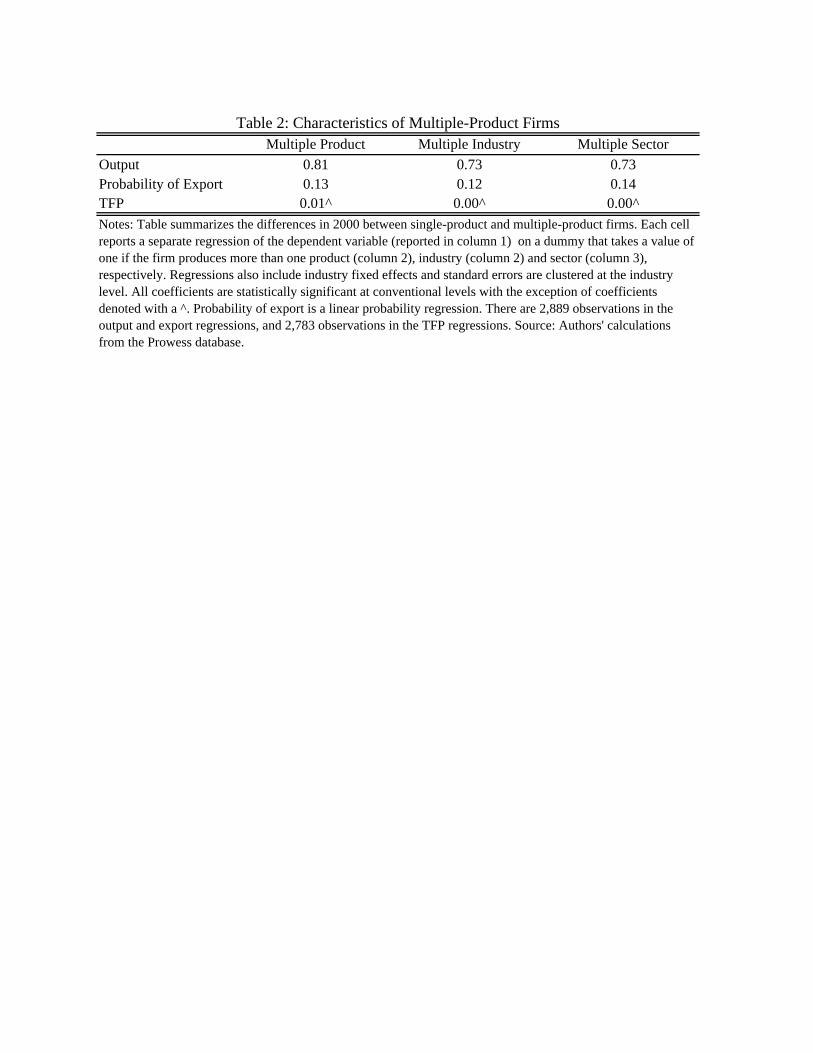
Multiple Product Multiple Industry Multiple SectorOutput 0.81 0.73 0.73Probability of Export 0.13 0.12 0.14TFP 0.01^ 0.00^ 0.00^Notes: Table summarizes the differences in 2000 between single-product and multiple-product firms. Each cell reports a separate regression of the dependent variable (reported in column 1) on a dummy that takes a value of one if the firm produces more than one product (column 2), industry (column 2) and sector (column 3), respectively. Regressions also include industry fixed effects and standard errors are clustered at the industry level. All coefficients are statistically significant at conventional levels with the exception of coefficients denoted with a ^. Probability of export is a linear probability regression. There are 2,889 observations in the output and export regressions, and 2,783 observations in the TFP regressions. Source: Authors' calculations from the Prowess database.
Table 2: Characteristics of Multiple-Product Firms

1 2 3 4 5 6 7 8 9 10+1 100 86 75 70 65 63 62 64 53 462 14 20 21 21 21 19 16 22 203 4 7 9 9 9 9 12 134 2 4 4 6 5 7 75 2 2 3 3 3 46 1 1 2 2 37 0 1 1 28 0 1 29 0 1
10+ 2
Notes: Columns indicate the number of products produced by the firm (truncated at 10 products). Rows indicate the share of the product in total firm sales, in decreasing order of size. Each cell is the (simple) average across the relevant firm-products in the sample (1989-2003). Source: Authors' calculations from the Prowess database.
Table 3: Distribution of Products Within the Firm
Ave
rage
Sha
re o
f Pro
duct
in
Fi
rm S
ales
(Hig
h to
Low
)
Number of Products Produced by the Firm

PeriodNo
Activity Add only Drop onlyAdd and
DropNo
Activity Add only Drop onlyAdd and
DropNo
Activity Add only Drop onlyAdd and
DropOverall 42 45 5 8 53 42 na 5 29 48 11 11Five-Year Average 72 22 4 2 80 19 na 1 63 26 8 3Three-Year Average 80 15 3 1 87 13 na 1 73 17 7 2Annual Average 90 7 2 0 94 6 na 0 86 9 5 1
PeriodNo
Activity Add only Drop onlyAdd and
DropNo
Activity Add only Drop onlyAdd and
DropNo
Activity Add only Drop onlyAdd and
DropOverall 22 72 1 5 46 52 na 2 17 76 1 5Five-Year Average 57 28 2 12 76 24 na 0 53 29 3 15Three-Year Average 69 23 2 6 84 16 na 0 65 25 3 7Annual Average 83 13 3 1 93 7 na 0 81 14 4 1
Percent of FirmsAll Firms
Table 4: Firm Activity
Single-Product Firms Multiple-Product Firms
Output-Weighted Percent of Firms
Notes: Table classifies continuing firms into four mutually exclusive groups: no activity, add only, drop only and both. A product addition is defined as a firm adding a product in period t that it did not produce in the previous period. A drop in defined as a firm dropping a product in period t that it produced in the previous time period. These definitions imply that a single-product firm cannot drop a product only. Source: Authors' calculations from the Prowess database.
All Firms Single-Product Firms Multiple-Product Firms
Year Gross Sales NetProduct Entry
Product Exit Net
Growing Products
Shrinking Products
19891990 7.8 0.7 1.4 -0.8 7.1 10.5 -3.31991 10.6 1.0 1.3 -0.3 9.6 12.8 -3.21992 -0.7 0.3 1.6 -1.3 -1.0 7.8 -8.91993 0.9 0.8 1.4 -0.6 0.2 7.3 -7.11994 13.9 3.6 3.8 -0.1 10.3 14.8 -4.51995 13.9 3.1 3.4 -0.3 10.8 15.4 -4.61996 18.1 0.7 0.8 -0.1 17.4 21.1 -3.71997 8.3 1.5 1.7 -0.2 6.8 12.6 -5.81998 7.2 0.4 0.6 -0.3 6.8 12.7 -5.91999 10.9 0.6 0.9 -0.3 10.3 15.4 -5.12000 13.5 0.2 0.5 -0.3 13.3 18.0 -4.72001 11.4 1.0 1.1 -0.1 10.4 15.8 -5.32002 3.1 4.5 4.7 -0.2 -1.4 6.7 -8.12003 13.6 1.3 1.4 -0.2 12.3 16.7 -4.4
1989-1993 15.0 3.2 4.2 -1.0 11.7 20.2 -8.41994-1998 52.7 10.5 11.1 -0.6 42.3 49.4 -7.11999-2003 42.5 10.0 10.7 -0.6 32.5 41.3 -8.91989-2003 197.7 49.8 52.5 -2.7 147.9 156.6 -8.7
Table 5: Decomposition of Sales Growth for Continuing Firms
Notes: Table decomposes aggregate sales growth into contribution of the extensive and intensive product margin within Prowess from 1989-2003. The table reports the aggregate output growth of continuing firms. Column 2 reports gross sales growth. Columns 3-5 report the contribution to growth from the firms' extensive margin. Columns 6-8 report the contribution to growth from the firms' intensive margin. Values are deflated by sector-specific wholesale price indices. Source: Authors' calculations from the Prowess database.
Intensive MarginExtensive Margin

Scope Scope Scope Scope Add Drop Scope Drop Scope Scope(1) (2) (3) (4) (5) (6) (7) (8) (9) (10)
Lagged Tariffs -0.033 -0.028 0.032 -0.016 0.006 -0.034 0.0240.038 0.037 0.122 0.023 0.017 0.035 0.046
Post-1991 *Large Tariff Decline Indicator -0.0320.025
Firm-Specific Lagged Tariff -0.0170.027
Lagged Tariff of Smallest Product -0.0180.015
Lagged Delicensed -0.0370.025
Lagged Tariff x Delicensed by 1988 -0.081 *0.046
Year FEs yes no yes yes yes yes yes yes yes yesNIC2*Year FEs no yes no no no no no no no noFirm FEs yes yes yes yes yes yes yes yes yes yesR-squared 0.90 0.90 0.94 0.89 0.27 0.25 0.90 0.26 0.90 0.9Observations 14,864 14,864 4,115 14,596 11,615 11,615 14,819 11,569 13,435 13,435
Table 6: Firm Extensive Product Margin and Tariffs
Notes: The dependent variable for each regression is reported in the column heading. Scope is log number of products produced by a firm. Add and Drop are indicators for whether a firm adds (drops) a product. Column 3 uses pre- and post-liberalization years of data, 1990 and 2001; for 2001, the 1997 tariff is assigned. Columns 4 reports a specification where "post-1991" is an indicator that is 1 in 1991-97 and "Large Tariff Decline" indicator is one for NIC4 industries with above average (greater than 59 percentage points) decline in tariffs between 1989 and 1997. The post-1991 indicator and the "Large Tariff Decline" indicator are itself not identified because of the included year and fixed effects. Column 7 uses firm-specific tariffs based on the firms's initial product weights. Column 8 uses the tariff of the smallest (initial) product of the firm. Column 10 interacts lagged tariffs with an indicator for if the industry was delicensed by 1988 (the main effect of the delicensed in 88 variable is not identified because of the firm fixed effect). Standard errors clustered at the industry level except column 3 which clusters at the industry-year level. Significance: * 10 percent, ** 5 percent, *** 1 percent.