multi resolution spatial database linking and mobile...
TRANSCRIPT
MULTI RESOLUTION SPATIAL DATABASE FOR MOBILE APPLICATIONS
A THESIS SUBMITTED TO
THE GRADUATE SCHOOL OF NATURAL AND APPLIED SCIENCES
OF
MIDDLE EAST TECHNICAL UNIVERSITY
BY
KAMİL İNAL
IN PARTIAL FULFILLMENT OF THE REQUIREMENTS
FOR
THE DEGREE OF MASTER OF SCIENCE
IN
GEODETIC AND GEOGRAPHIC INFORMATION TECHNOLOGIES
JULY 2013

Approval of the thesis;
MULTI RESOLUTION SPATIAL DATABASE FOR MOBILE APPLICATIONS
submitted by KAMIL INAL in partial fulfillment of the requirements for the degree of
Master of Science in Geodetic and Geographic Information Technologies Department,
Middle East Technical University by,
Prof. Dr. Canan Özgen
Dean, Graduate School of Natural And Applied Sciences
Assoc. Dr. Ahmet Coşar
Head of Department, Geodetic and Geographic Information Technologies
Prof. Dr. Zuhal Akyürek
Supervisor, Civil Engineering Dept., METU
Examining Committee Members:
Assoc. Dr. Ahmet Coşar
Computer Engineering Dept., METU
Prof. Dr. Zuhal Akyürek
Civil Engineering Dept., METU
Prof. Dr. Mahmut Onur Karslıoğlu
Civil Engineering Dept., METU
Tuncay Küçükpehlivan, M.Sc.
General Manager Assistant, Başarsoft Ltd.
Dr. Tahsin Alp Yanar
Senior Software Engineer, STM A.Ş.
Date:

iv
I hereby declare that all information in this document has been obtained and
presented in accordance with academic rules and ethical conduct. I also declare that,
as required by these rules and conduct, I have fully cited and referenced all material
and results that are not original to this work.
Name, Last Name : Kamil İNAL
Signature :
v
ABSTRACT
MULTI RESOLUTION SPATIAL DATABASE FOR MOBILE APPLICATIONS
İnal, Kamil
M.Sc., Department of Geodetic and Geographic InformationTechnologies
Supervisor: Prof. Dr. Zuhal Akyürek
July 2013, 65 Pages
Nowadays, in Geographical Information Systems (GIS), usage of Location Based Services
(LBS) has been exploded and map based web/mobile applications have been rapidly
increased. With the occurrence of this event, spatial data accessing, storing and querying
operations have become more important than before.
There is a new challenge, which is about the efficient access to geographical map data at
multiple detail of level. Multiple detail of level is a process of derivation of a map at a
particular resolution. This process is called as Multi Resolution Database (MRDB). It is an
expensive job and needs advance knowledge about map generalization techniques such as
simplification, amalgamation tasks. Existing spatial databases currently do not support this
innovation. Current spatial databases only support some basic geometry types to model
features and spatial operators/operands for determining geospatial measurements like
distance, area, and length. MRDB has another usage domain called information drilling.
Information drilling provides linking between spatial objects at different spatial databases.
Unfortunately, there is no support for data drilling in current spatial databases.
In this study, a multi resolution database concept is modeled and prototype applications are
developed. Information drilling methodology between multiple spatial databases is
constructed. This drilling scenario contains a scale based linked data retrieval features.
Sample location is selected as Ankara, which is the capital city of Turkey. Schools, roads,
districts and power transformers data have been used as example of different data layers.
Server side application is created to serve services to clients by using Java Enterprise
Edition (J2EE) technologies. Also a native mobile application is implemented for Android
platform to demonstrate information drilling in MRDB concept in mobile domain.
Keywords: Geographical Information Systems, Location Based Services, Multiple
Resolution Spatial Database, Information Drilling.
vi
ÖZ
ÇOK ÇÖZÜNÜRLÜKLÜ KONUMSAL VERİTABANLARI VE MOBİL
UYGULAMALARI
İnal, Kamil
Yüksek Lisans, Jeodezi ve Coğrafi Bilgi Teknolojileri Bölümü
Tez Yöneticisi: Prof. Zuhal Akyürek
Temmuz 2013, 65 Sayfa
Günümüzde, Coğrafi Bilgi Teknolojileri (CBS) destekli mobil ve web uygulamalarının
çoğalması ile konum tabanlı servislerin kullanımı yaygın bir hale gelmiştir. Bu değişim
süreci ile birlikte konumsal verinin erişilebilir olması, sorgulanması ve saklanması eskiye
nazaran daha bir önem kazanmıştır.
Coğrafi Bilgi Teknolojileri’nde, farklı detay seviyelerindeki coğrafi verinin en etkili ve
hızlı bir biçimde son kullanıcıya sunulması için yeni bir ilgi alanı doğmuştur. Bu alan Çok
Çözünürlüklü Konumsal Veritabanı konsepti adı ile anılmaktadır. Bu konsept temel olarak
istenen bir harita çözünürlüğü için harita oluşturma süreçlerini içermektedir. Harita
oluşturma süreçleri literatürde kapsamlı bir işlem sürecine sahiptir. Bu işlemin
gerçekleştirimi için harita genelleştirme tekniklerinin iyi derecede bilinmesi ve pratikte
kullanımı gereklidir. Mevcut konumsal veritabanı yazılımları Çok Çözünürlüklü Konumsal
Veritabanı konseptini desteklememektedir. Mevcut konumsal veritabanları, modelleme
özellikleri, mesafe ölçme, alan ölçme, uzunluk bulma gibi mekansal ölçümler belirlenmesi
için mekansal operatörler ve bazı temel geometri türlerini desteklemektedir. Çok
Çözünürlüklü Konumsal Veritabanı konsepti, diğer bir kullanım alanı olarak bilgi
derinleştirme veya zenginleştirme alanında kullanılmaktadır. Bilgi derinleştirme farklı
konumsal veritabanlarındaki farklı coğrafi özniteliklerin birbirleri arasında
ilişkilendirilebilmesini sağlayabilmektedir. Malesef, mevcut konumsal veritabanları
arasında farklı coğrafi özniteliklerin ilişkilendirilmesi ile igili bir alt yapı bulunmamaktadır.
Bu çalışmada, Çok Çözünürlüklü Konumsal Veritabanı konsepti modellenerek, sunucu ve
istemci olarak prototip uygulamalar geliştirilmiştir. Farklı konumsal veritabanları birbirleri
arasında ilişkilendirilerek veri derinleştirme metodolojisi oluşturulmuştur. Veri
derinleştirme işlemi harita çözünürlüğüne bağımlı olarak coğrafi özniteliklerin
ilişkilendirilmesi üzerine kurulmuştur. Örnek veri seti olarak, Türkiye’nin başkenti olan
Ankara ili seçilmiştir. Coğrafi veri kümesi olarak; Ankara iline özgü, okullar, yollar,
mahalleler, ilçeler ve elektrik trafo gibi farklı veri katmanları kullanılmıştır. Sunucu tarafı
uygulamasında istemcilere çevirim içi servis desteği vermek ve web platformunda kullanım

vii
için Java Enterprise (J2EE) teknolojilerinden faydalanılmıştır. Mobil platformlarda, Çok
Çözünürlüklü Konumsal Veritabanında bilgi derinleştirme işlevi gösterimi için Android
platformuna özgü bir mobil uygulama geliştirilmiştir.
Anahtar Kelimeler: Coğrafi Bilgi Sistemleri, Konum Tabanlı Servisler, Çok Çözünürlüklü
Konumsal Veritabanı, Bilgi Derinleştirme.

viii
ACKNOWLEDGEMENTS
First of all, I would like to extend my deepest gratitude to Prof. Dr. Zuhal AKYÜREK for
her guidance and insight throughout this study.
I would like to thank all jury members for their criticism in a positive way and also thanks
for M.Sc. Tuncay Küçükpehlivan for providing power transformers data.
I would also like to thank all of my friends who kept me motivated.
Finally, i would like to thank my family who gave me the endless support and love, which
made this thesis possible.

ix
TABLE OF CONTENTS
ABSTRACT .................................................................................................................... v
ÖZ…………................................................................................................................... vi
ACKNOWLEDGEMENTS ......................................................................................... viii
TABLE OF CONTENTS ............................................................................................... ix
LIST OF TABLES ........................................................................................................ xii
LIST OF FIGURES ...................................................................................................... xiii
CHAPTERS
1. INTRODUCTION ...................................................................................................... 1
1.1 GIS And Spatial Databases ............................................................................. 1
1.2 Multi-Resolution Spatial Databases ................................................................ 2
1.3 General Approaches ........................................................................................ 3
1.4 Multi Representation ....................................................................................... 3
1.5 Multi Resolution .............................................................................................. 4
1.6 Motivation and Scope of Research .................................................................. 4
1.7 Organization of Thesis .................................................................................... 5
2. MRDB TECHNIQUES IN GIS ................................................................................. 7
2.1 MRDB Data Structures and Modeling ............................................................ 8
2.2 Derivation of Maps .......................................................................................... 8
2.2.1 Simplification .......................................................................................... 9
2.2.2 Smoothing ............................................................................................... 9
2.2.3 Aggregation ............................................................................................. 9
2.2.4 Amalgamation ....................................................................................... 10
x
2.2.5 Merging .................................................................................................. 10
2.2.6 Collapse ................................................................................................. 10
2.2.7 Refinement ............................................................................................. 10
2.2.8 Typification ............................................................................................ 11
2.2.9 Exaggeration .......................................................................................... 11
2.2.10 Enhancement .......................................................................................... 11
2.2.11 Displacement.......................................................................................... 11
2.2.12 Classification.......................................................................................... 12
2.3 Reference Projects ......................................................................................... 13
2.3.1 GiMoDig Project .................................................................................... 13
2.3.2 Murmur Project ...................................................................................... 20
2.3.3 Information Drilling ............................................................................... 21
2.3.4 Geometry Drilling .................................................................................. 21
2.3.5 Attribute Drilling ................................................................................... 22
3. SYSTEM ARCHITECTURE ................................................................................... 23
3.1 Overall Design ............................................................................................... 23
3.2 Database Design ............................................................................................ 26
3.3 MRDB Approach ........................................................................................... 27
3.4 Dataset Linking Procedure ............................................................................. 28
3.5 System Flow Design ...................................................................................... 29
4. IMPLEMENTATION DETAILS ............................................................................. 31
4.1 Pre-requirements ............................................................................................ 31
4.2 Database Setup ............................................................................................... 31
4.3 Map Server Setup ........................................................................................... 31
xi
4.3.1 Data Preparation and Transmission ....................................................... 32
4.4 Web Application ........................................................................................... 32
4.4.1 Overview ............................................................................................... 32
4.4.2 Used Technologies ................................................................................ 33
4.4.3 User Interface ........................................................................................ 37
4.4.4 Application Work Flow ......................................................................... 42
4.5 Service Infrastructure .................................................................................... 43
4.5.1 Data Contracts ....................................................................................... 43
4.5.2 Service Contracts ................................................................................... 44
4.6 Mobile Application ....................................................................................... 49
4.6.1 Used Technologies ................................................................................ 49
4.6.2 User Interface ........................................................................................ 50
4.6.3 Application Work Flow ......................................................................... 54
4.7 Summary of Implementation ......................................................................... 55
4.8 Case Study ..................................................................................................... 57
4.9 Areas of Use .................................................................................................. 59
5. CONCLUSIONS AND RECOMMENDATIONS ................................................... 61
REFERENCES .............................................................................................................. 63
WEB REFERENCES .................................................................................................... 63
OFFLINE REFERENCES ............................................................................................ 64
xii
LIST OF TABLES
TABLES
Table 1 Map generalization operators, both in an original map and generalized map. (Shea
and McMaster, 1989) ........................................................................................................... 12
Table 2 Layer get service method ........................................................................................ 45
Table 3 Feature get service method ...................................................................................... 46
Table 4 Multiple feature get service method ........................................................................ 46
Table 5 Features get with bounds service method ................................................................ 47
Table 6 Linked feature get service method .......................................................................... 47
Table 7 Multiple linked features get service method ........................................................... 48

xiii
LIST OF FIGURES
FIGURES
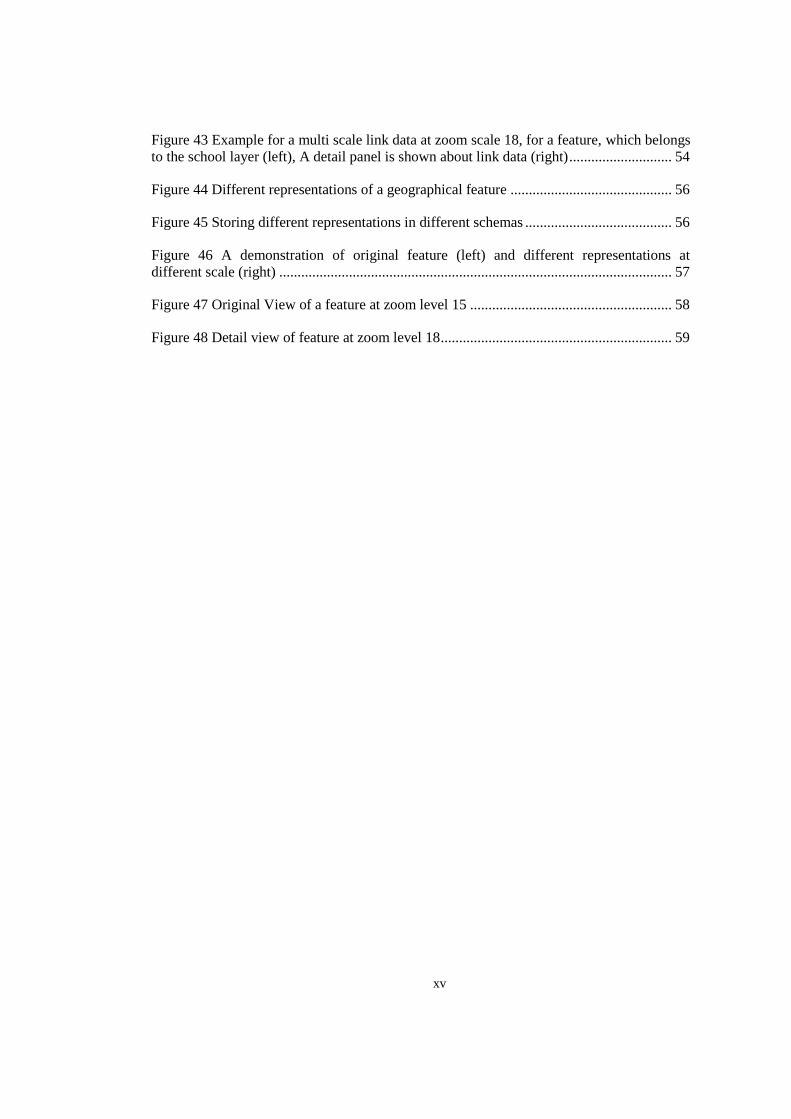
Figure 1 OGC Feature Geometry Types, (URL 27) .............................................................. 2
Figure 2 a) MRDB with different level of detail b) MRDB with linked objects (after Hampe
et al., 2003) ............................................................................................................................ 3
Figure 3 Cartographical generalizations, (URL 22)............................................................... 4
Figure 4 Multiple geometric representations for a single geographical phenomenon, (after
Zour and Jones, 2003) ............................................................................................................ 7
Figure 5 Digital Generalisation Components, (after Shea and McMaster, 1989) .................. 9
Figure 6 Example aggregation process at scales 1:25000 and 1:50000, (URL 5) ............... 10
Figure 7 Example of displacement process on roads, (URL 28) ......................................... 11
Figure 8 A federated database system and its components, (after Sheth and Larson, 1990) 15
Figure 9 Presentation of a line in attribute-variant approach, (after Hampe et al., 2003) .... 15
Figure 10 Bottom up linking, (after Hampe et al., 2003)..................................................... 16
Figure 11 Bottom up variant as an attribute in object table, (after Hampe et al., 2003) ...... 16
Figure 12 GiMoDig sample database schema and linking, (after Hampe et al., 2003) ....... 16
Figure 13 Cases for building simplification, left case (offset), middle case (bulge), right
case (edge), (after Hampe and Sester, 2004) ....................................................................... 17
Figure 14 Before the building simplification (Left), result of simplification process (right),
(after Hampe and Sester, 2004) ........................................................................................... 18
Figure 15 Amalgamation Process; original case (left), enlarging case (middle), combined
and downsized case (right), (after Hampe and Sester, 2004). .............................................. 19
Figure 16 Original data (left), after the typification and displacement (right), (after Hampe
and Sester, 2004).................................................................................................................. 19
Figure 17 GiMoDig linking in the MRDB, (after Hampe and Sester, 2004)....................... 20
Figure 18 A typical client-server model, (URL 19) ............................................................. 24
xiv
Figure 19 Demonstration of client-server model types. One-tier architecture (left), Two-tier
architecture (middle), three-tier architecture (right), (URL 29) ........................................... 24
Figure 20 Main architecture ................................................................................................. 26
Figure 21 Link database entity relational (ER) diagram ...................................................... 27
Figure 22 Sample dataset for link database .......................................................................... 28
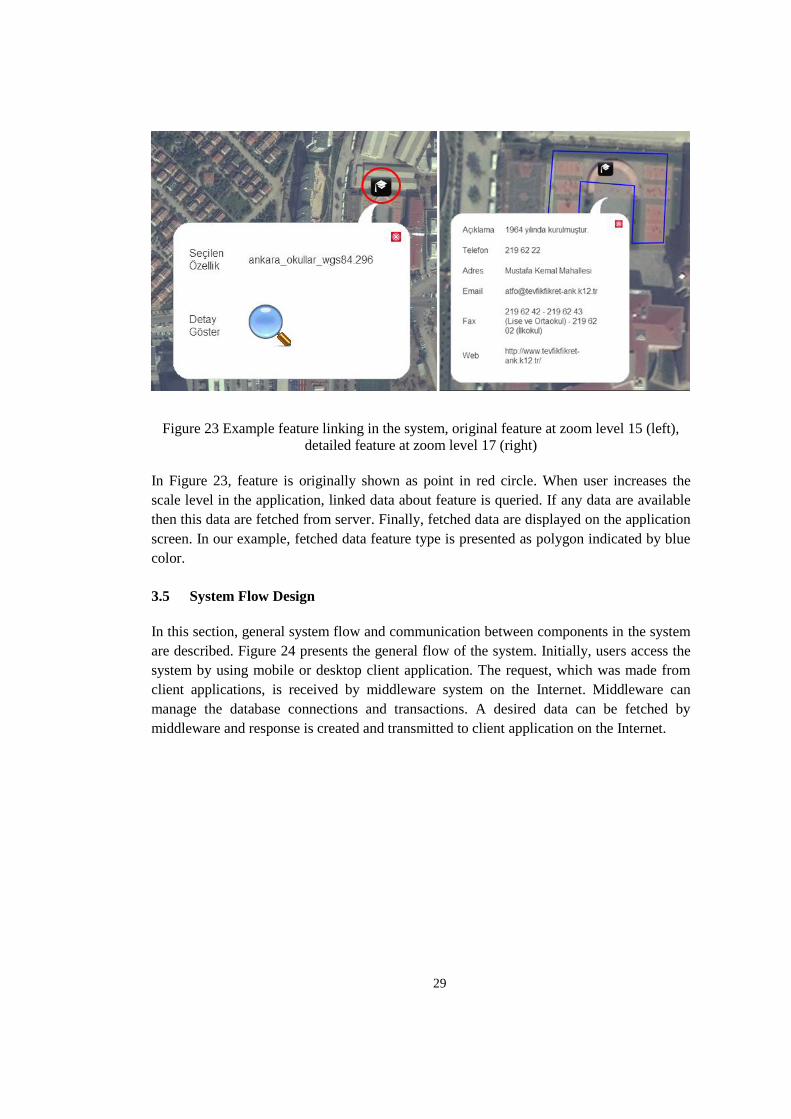
Figure 23 Example feature linking in the system, original feature at zoom level 15 (left),
detailed feature at zoom level 17 (right) ............................................................................... 29
Figure 24 General flow of the system .................................................................................. 30
Figure 25 Basic J2EE server, (URL 23) ............................................................................... 33
Figure 26 Creating basic map view with OpenLayers ......................................................... 34
Figure 27 Spring framework architecture, (URL 24) ........................................................... 35
Figure 28 Restful web services, (URL 25) ........................................................................... 36
Figure 29 Web Application Main View ............................................................................... 37
Figure 30 Web application layer selection view .................................................................. 38
Figure 31 Active layers data preview ................................................................................... 39
Figure 32 Selected feature’s detail ....................................................................................... 39
Figure 33 Multi resolution detail information about a feature ............................................. 40
Figure 34 Web application preview on android mobile browser ......................................... 41
Figure 35 Active layers preview on android mobile browser .............................................. 41
Figure 36 Application flow chart ......................................................................................... 42
Figure 37 Service Data Contracts ......................................................................................... 44
Figure 38 WFS flow chart on GeoServer ............................................................................. 48
Figure 39 Architecture for android application development, (URL 26) ............................. 49
Figure 40 Application main view, (left) Main menu items (right) ....................................... 51
Figure 41 Layer selection dialog (left), A popup panel for a feature (right) ........................ 52
Figure 42 Left side image contains a map view with school layer, right image contains a
map view with both school road and transformer layers. ..................................................... 53
xv
Figure 43 Example for a multi scale link data at zoom scale 18, for a feature, which belongs
to the school layer (left), A detail panel is shown about link data (right) ............................ 54
Figure 44 Different representations of a geographical feature ............................................ 56
Figure 45 Storing different representations in different schemas ........................................ 56
Figure 46 A demonstration of original feature (left) and different representations at
different scale (right) ........................................................................................................... 57
Figure 47 Original View of a feature at zoom level 15 ....................................................... 58
Figure 48 Detail view of feature at zoom level 18 ............................................................... 59

1
CHAPTER 1
INTRODUCTION
1.1 GIS And Spatial Databases
A Geographic Information System (GIS) is a system that uses spatial and non-spatial data
to make some analyses and decisions. Nowadays, GIS are widely used in many areas. Since
the invention of GIS, database usage in GIS systems has become more important.
Typically, a GIS system contains at least one database structure. This structure is called
Spatial Database. A spatial database actually is a kind of relational database. It is
optimized and extended to store and query for spatial data.
The Open Geospatial Consortium (OGC) is an international consortium, which has 478
companies, government agencies and universities. This consortium develops interface
standards for GIS infrastructure. OGC created the Simple Features specification and
standards to make spatial extension for relational databases. The simple features
specification contains some two-dimensional geographical data models, which are point,
line, polygon, multi-point, multi-line etc. Almost all spatial databases provide these features
to create and run spatial queries. OGC feature geometry types are shown in Figure 1.
2
Figure 1 OGC Feature Geometry Types, (URL 27)
1.2 Multi-Resolution Spatial Databases
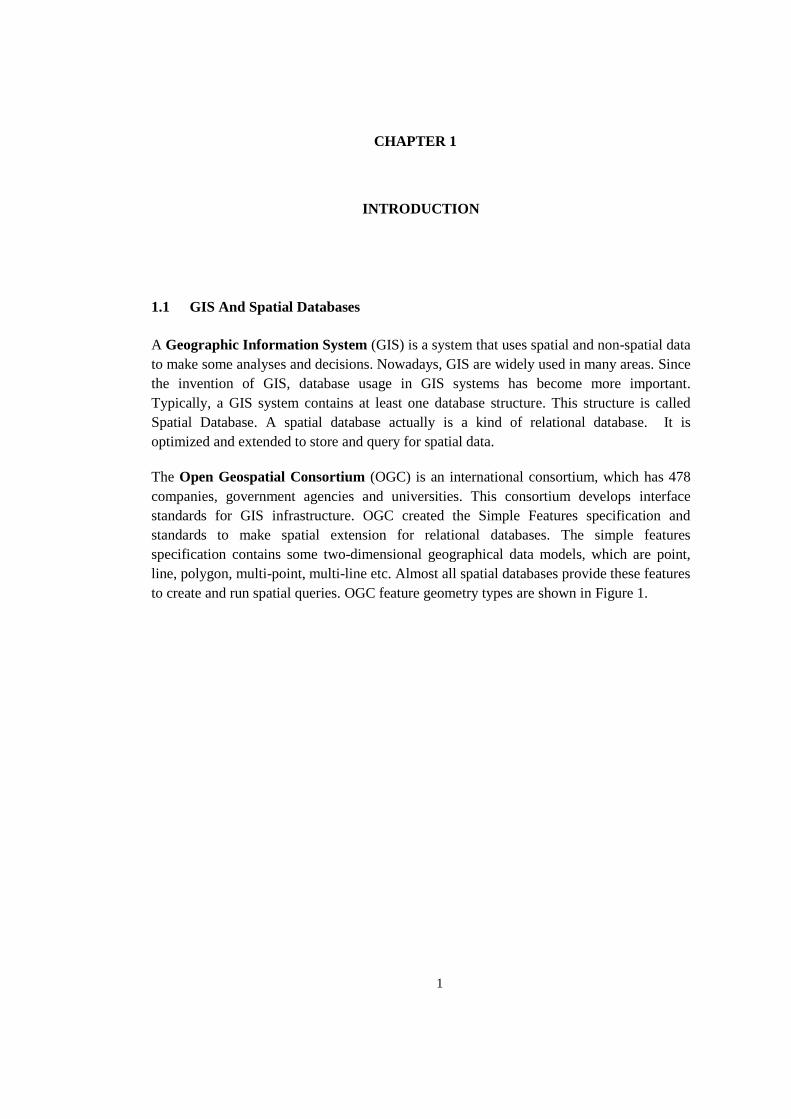
A Multi-Resolution Spatial Database (MRDB) can be described as a spatial database,
which can be used to store the real world phenomena at different levels of precision,
accuracy and resolution (Devogele et al., 1996). MRDB provides to link features in each
other and stores them with different representations in database. In addition, each stored
feature representation can hold different geographical types and attributes.
There are two important features that describe an MRDB:
a. Different levels of details (LoD’s) are stored in one database
b. The features in the different scales are linked
For the first feature, we can say that different scales of map exist separately and a common
geometry object linked to these maps. In the second case, every object is linked with each
other and each object knows its other scale version objects. Two important features of
MRDB can be seen in Figure 2.
3
Figure 2 a) MRDB with different level of detail b) MRDB with linked objects (after Hampe
et al., 2003)
There are several reasons for using multi resolution concept: in the first instance, it allows a
multi scale analysis of data. This means any information in one resolution can be compared
with respect to information given in another resolution. Gabay and Sester (2002) present an
example for this feature where topographic data is linked to cadastral data. A topographic
data contains only lower resolution settlement areas whereas cadastral data includes more
detail according to topographic data. Example shows that topographic data can be derived
from cadastral data on demand. After the creation of topographic data, data analyses can be
done. Other reason for using multi resolution concept is investment in National Mapping
Agency. National Mapping Agency is an organization that produces topographic maps and
geographic information of a country. In Turkey General Command of Mapping is
responsible from these activities.
1.3 General Approaches
For Multi Resolution Spatial Database system, there are two basic approaches to support
applications that require variable level of resolution. First of them is called “Multi
Representation” approach. In this approach, data are pre-generated and stored at different
resolution levels. Second is called as “Multi Resolution” approach. In this approach, as
different from the other, only the highest level of resolution is stored and data can be
simplified dynamically by using generalization.
1.4 Multi Representation
Multi representation approach stores data physically at different scales in a database (Zhou
et al., 2004). Before being stored, spatial data are generated for different scales. This
concept is similar having multiple paper-based maps at different scales for different
purposes. Disadvantages of this approach are a higher storage overhead and difficulties
arising from object updates.
4
1.5 Multi Resolution
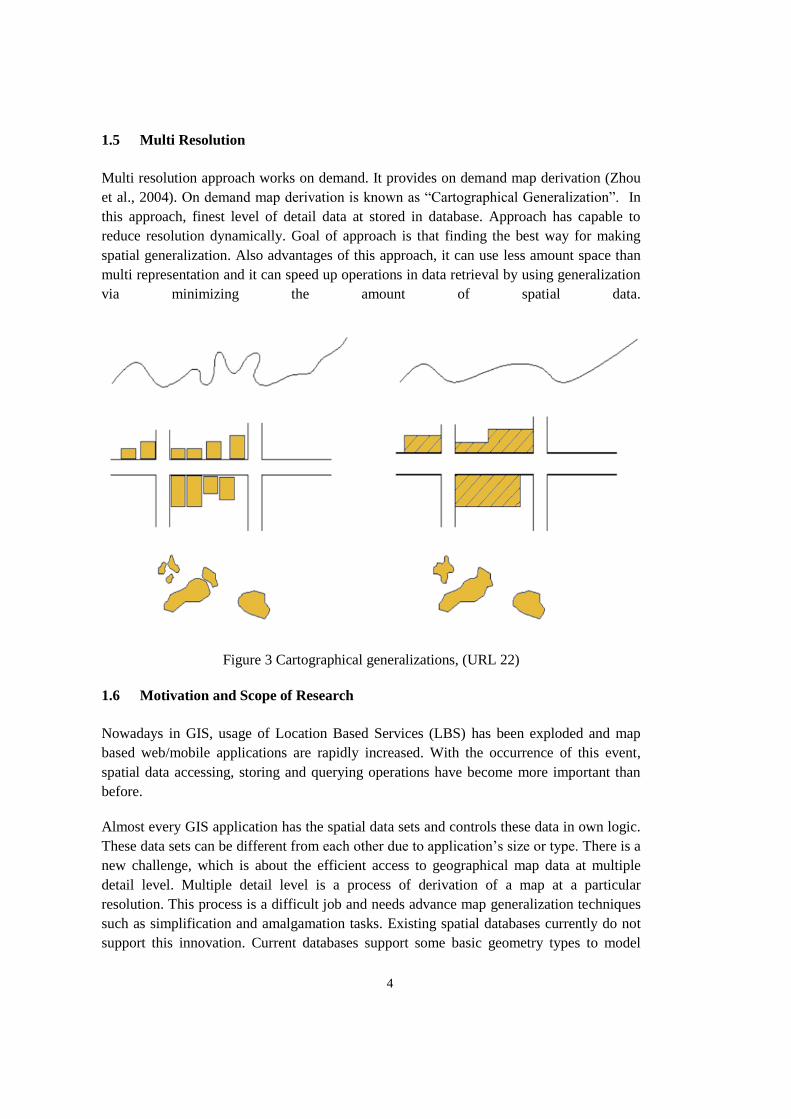
Multi resolution approach works on demand. It provides on demand map derivation (Zhou
et al., 2004). On demand map derivation is known as “Cartographical Generalization”. In
this approach, finest level of detail data at stored in database. Approach has capable to
reduce resolution dynamically. Goal of approach is that finding the best way for making
spatial generalization. Also advantages of this approach, it can use less amount space than
multi representation and it can speed up operations in data retrieval by using generalization
via minimizing the amount of spatial data.
Figure 3 Cartographical generalizations, (URL 22)
1.6 Motivation and Scope of Research
Nowadays in GIS, usage of Location Based Services (LBS) has been exploded and map
based web/mobile applications are rapidly increased. With the occurrence of this event,
spatial data accessing, storing and querying operations have become more important than
before.
Almost every GIS application has the spatial data sets and controls these data in own logic.
These data sets can be different from each other due to application’s size or type. There is a
new challenge, which is about the efficient access to geographical map data at multiple
detail level. Multiple detail level is a process of derivation of a map at a particular
resolution. This process is a difficult job and needs advance map generalization techniques
such as simplification and amalgamation tasks. Existing spatial databases currently do not
support this innovation. Current databases support some basic geometry types to model

5
features and spatial operators/operands for determining geospatial measurements like
distance, area, and length.
In this study, rather than generalization on spatial features, methodology of drilling in the
attribute level of multi resolution spatial database system is presented. The sample location
is identified as Ankara, which is a capital city of Turkey. Schools, roads and power
transformers data have been used in developed MRDB system. A mobile application is
implemented to demonstrate methodology of drilling in multi resolution concept in mobile
domain.
Applications of multi resolution spatial database concepts include feature generalization
process in their workflows. Feature generalization techniques are not used in this study.
Aim of this study is to retrieve detailed information about a feature presented on a coarse
scale from the detailed information stored in a larger scale. In order to do this, data
mapping procedure between different databases and querying infrastructure are
implemented.
1.7 Organization of Thesis
The current study includes five chapters. In the first chapter, introduction of the GIS and
databases have been discussed. In addition, basic knowledge about the multi resolution
databases is referred. Finally, the motivation behind the thesis and scope of the thesis are
explained.
In the second chapter, detailed information about the multi resolution concept is presented.
The solution and techniques provided in the literature are discussed.
In the third chapter, the system architecture is discussed. Firstly, our approach and model
structure are introduced. Secondly, database design of system is shown. Finally, system
flow is discussed briefly.
In the fourth chapter, the details of the implementation of the study are demonstrated.
Software technologies, which are used in this study, are introduced. Developed web
application and Web Feature Service (WFS) infrastructure are discussed. Mobile
application and implementation details are introduced in this section.
Lastly, in the fifth chapter, the results of the current study are discussed. The gain from the
development of a drilling of multi scale spatial database system is evaluated.

6
7
CHAPTER 2
MRDB TECHNIQUES IN GIS
Any geometric objects in spatial databases and GIS domain represent the real world
geographical phenomena. A single phenomenon may have multiple representations
according to different criteria such as application, classification, level of detail, viewpoint.
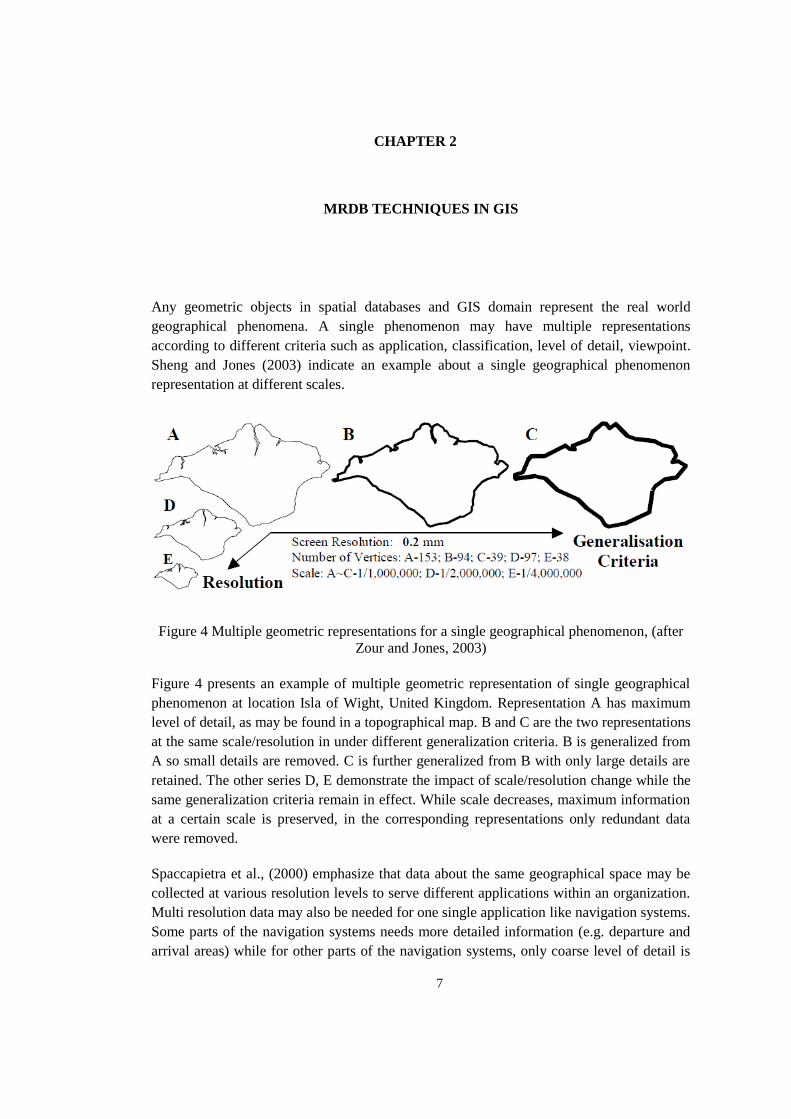
Sheng and Jones (2003) indicate an example about a single geographical phenomenon
representation at different scales.
Figure 4 Multiple geometric representations for a single geographical phenomenon, (after
Zour and Jones, 2003)
Figure 4 presents an example of multiple geometric representation of single geographical
phenomenon at location Isla of Wight, United Kingdom. Representation A has maximum
level of detail, as may be found in a topographical map. B and C are the two representations
at the same scale/resolution in under different generalization criteria. B is generalized from
A so small details are removed. C is further generalized from B with only large details are
retained. The other series D, E demonstrate the impact of scale/resolution change while the
same generalization criteria remain in effect. While scale decreases, maximum information
at a certain scale is preserved, in the corresponding representations only redundant data
were removed.
Spaccapietra et al., (2000) emphasize that data about the same geographical space may be
collected at various resolution levels to serve different applications within an organization.
Multi resolution data may also be needed for one single application like navigation systems.
Some parts of the navigation systems needs more detailed information (e.g. departure and
arrival areas) while for other parts of the navigation systems, only coarse level of detail is

8
needed (e.g., travelling on highway). These multi resolution data sources, which are
independently formed, bring a new challenge on data integration in GIS applications.
Unfortunately, current data management systems (DBMS, GIS) do not provide enough
functionality to manage multiple representations of geographical phenomena.
2.1 MRDB Data Structures and Modeling
There are two principals for data linking in multi resolution spatial databases: Single-
Resolution Management that one real world object is associated with one instance in the
database, Multiple-Resolution that one real world object has several connections in the
database.
2.2 Derivation of Maps
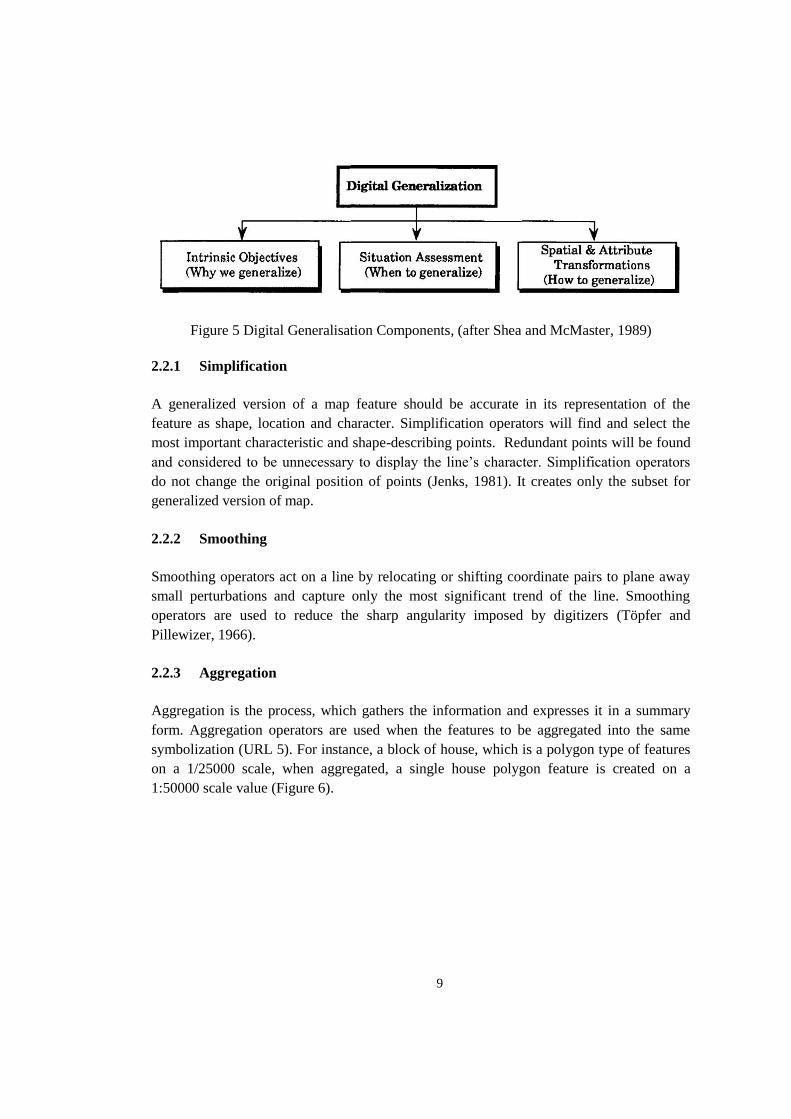
Derivation of a map at a particular space is referred as map generalization. In order to make
a map generalization, we should know the answers such as why do we need the
generalization, when to use and how to make this generalization.
Map generalization techniques composite of some process on map elements; selection,
elimination, shape simplification caricature, amalgamation and displacement. Shea and
McMaster (1989) mention these questions as digital generalization components. The
answer of question: “why we generalize?” can be explained as: map generalization is
designed to reduce complexities of the real world by strategically reducing unnecessary
details at a particular scale on a map. For the “when to generalize?” question, six conditions
occurring under scale reduction are used to determine a need for generalization. These
conditions are
Congestion: it refers that feature density is too high.
Coalescence: it refers that the distance between features is smaller than the
resolution of output device.
Conflict: it refers that a condition about spatial representation of feature is in
conflict with its background.
Complication: it is related with the complexity of spatial data.
Inconsistency: it is described as applying a set of generalization decisions non-
uniformly on map.
Imperceptibility: it is described as a case result when a feature size or length falls
below minimum determined threshold size on map.
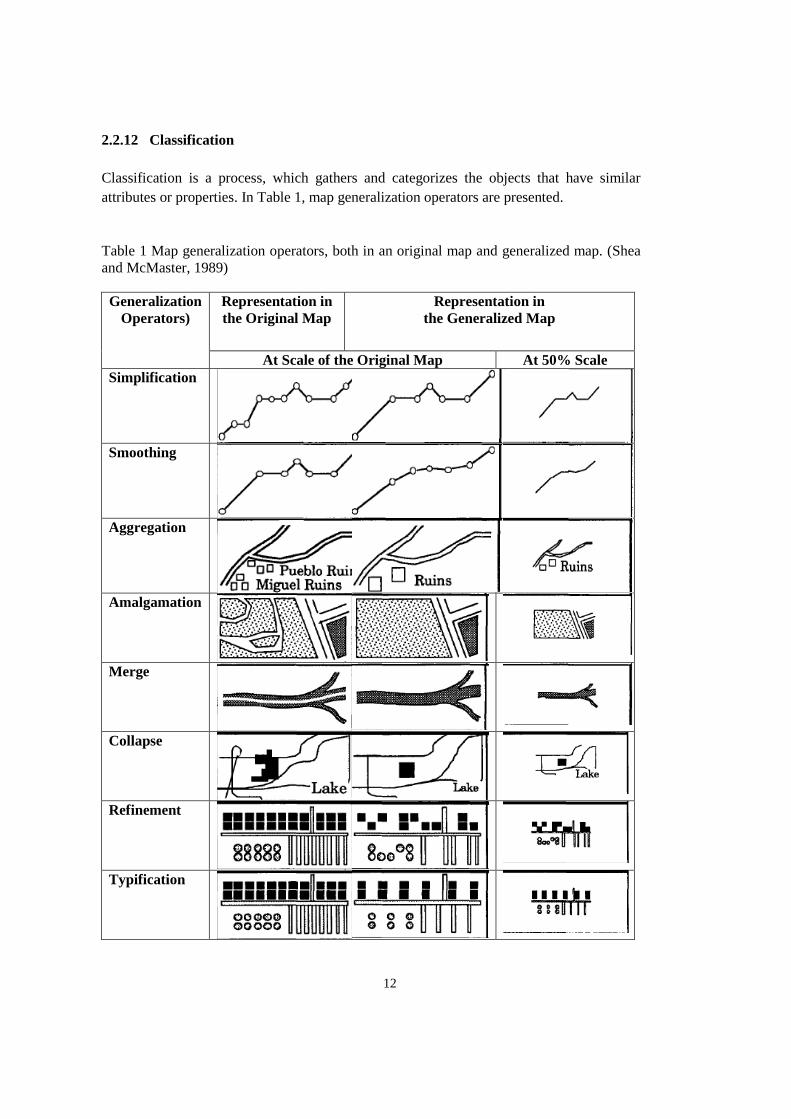
Lastly for “How to generalize” question, there exist twelve categories of generalization
operators to make generalization operation (Figure 5). These operators are simplification,
smoothing, aggregation, amalgamation, merging, collapse, refinement, typification,
exaggeration, enhancement, displacement, and classification. These operators are listed
below with their detailed information.
9
Figure 5 Digital Generalisation Components, (after Shea and McMaster, 1989)
2.2.1 Simplification
A generalized version of a map feature should be accurate in its representation of the
feature as shape, location and character. Simplification operators will find and select the
most important characteristic and shape-describing points. Redundant points will be found
and considered to be unnecessary to display the line’s character. Simplification operators
do not change the original position of points (Jenks, 1981). It creates only the subset for
generalized version of map.
2.2.2 Smoothing
Smoothing operators act on a line by relocating or shifting coordinate pairs to plane away
small perturbations and capture only the most significant trend of the line. Smoothing
operators are used to reduce the sharp angularity imposed by digitizers (Töpfer and
Pillewizer, 1966).
2.2.3 Aggregation
Aggregation is the process, which gathers the information and expresses it in a summary
form. Aggregation operators are used when the features to be aggregated into the same
symbolization (URL 5). For instance, a block of house, which is a polygon type of features
on a 1/25000 scale, when aggregated, a single house polygon feature is created on a
1:50000 scale value (Figure 6).
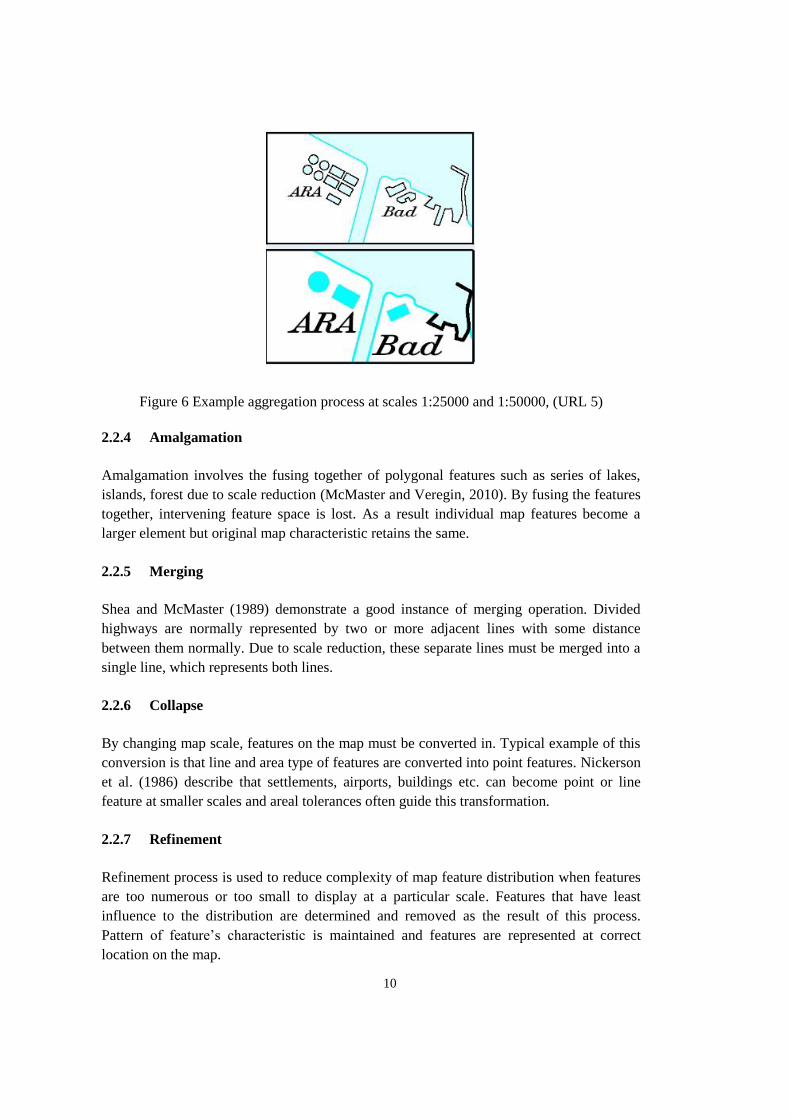
10
Figure 6 Example aggregation process at scales 1:25000 and 1:50000, (URL 5)
2.2.4 Amalgamation
Amalgamation involves the fusing together of polygonal features such as series of lakes,
islands, forest due to scale reduction (McMaster and Veregin, 2010). By fusing the features
together, intervening feature space is lost. As a result individual map features become a
larger element but original map characteristic retains the same.
2.2.5 Merging
Shea and McMaster (1989) demonstrate a good instance of merging operation. Divided
highways are normally represented by two or more adjacent lines with some distance
between them normally. Due to scale reduction, these separate lines must be merged into a
single line, which represents both lines.
2.2.6 Collapse
By changing map scale, features on the map must be converted in. Typical example of this
conversion is that line and area type of features are converted into point features. Nickerson
et al. (1986) describe that settlements, airports, buildings etc. can become point or line
feature at smaller scales and areal tolerances often guide this transformation.
2.2.7 Refinement
Refinement process is used to reduce complexity of map feature distribution when features
are too numerous or too small to display at a particular scale. Features that have least
influence to the distribution are determined and removed as the result of this process.
Pattern of feature’s characteristic is maintained and features are represented at correct
location on the map.
11
2.2.8 Typification
Typification uses the same approach as refinement process. The difference between
typification and refinement is that typification process uses a representative pattern of
symbols and features are located in approximate locations on map. Feature density on a
map is reduced after the process.
2.2.9 Exaggeration
Exaggeration is the process that you make elements seem larger, more important than they
really are (Stern et al., 2012). It enhances or emphasizes important characteristic of the
attributes. Also exaggeration is usually closely related with displacement.
2.2.10 Enhancement
Enhancement is a process, which is used by cartographers to make a better visualization
and highlight the specific details of features on a map. Generalization methods usually
concentrate on reducing the level of detail, on the contrary enhancement method aims the
addition of detail (Shea and McMaster, 1989).
2.2.11 Displacement
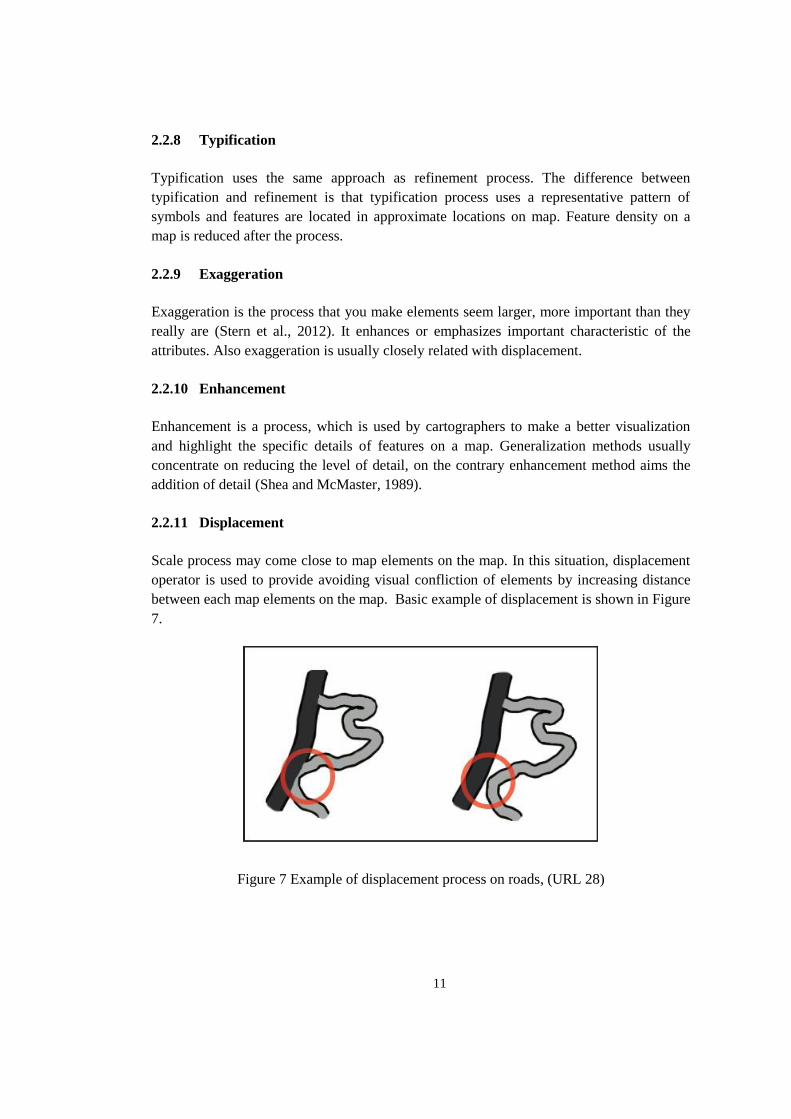
Scale process may come close to map elements on the map. In this situation, displacement
operator is used to provide avoiding visual confliction of elements by increasing distance
between each map elements on the map. Basic example of displacement is shown in Figure
7.
Figure 7 Example of displacement process on roads, (URL 28)
12
2.2.12 Classification
Classification is a process, which gathers and categorizes the objects that have similar
attributes or properties. In Table 1, map generalization operators are presented.
Table 1 Map generalization operators, both in an original map and generalized map. (Shea
and McMaster, 1989)
Generalization
Operators)
Representation in
the Original Map
Representation in
the Generalized Map
At Scale of the Original Map At 50% Scale
Simplification
Smoothing
Aggregation
Amalgamation
Merge
Collapse
Refinement
Typification
13
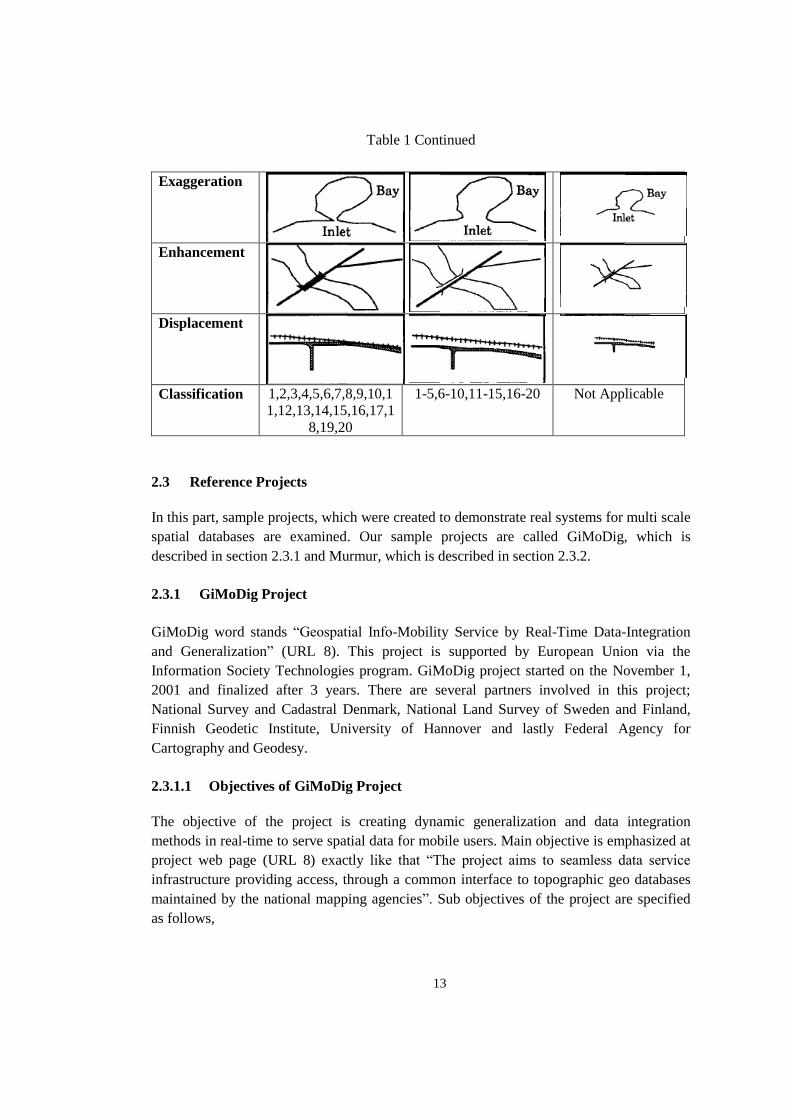
Table 1 Continued
Exaggeration
Enhancement
Displacement
Classification 1,2,3,4,5,6,7,8,9,10,1
1,12,13,14,15,16,17,1
8,19,20
1-5,6-10,11-15,16-20 Not Applicable
2.3 Reference Projects
In this part, sample projects, which were created to demonstrate real systems for multi scale
spatial databases are examined. Our sample projects are called GiMoDig, which is
described in section 2.3.1 and Murmur, which is described in section 2.3.2.
2.3.1 GiMoDig Project
GiMoDig word stands “Geospatial Info-Mobility Service by Real-Time Data-Integration
and Generalization” (URL 8). This project is supported by European Union via the
Information Society Technologies program. GiMoDig project started on the November 1,
2001 and finalized after 3 years. There are several partners involved in this project;
National Survey and Cadastral Denmark, National Land Survey of Sweden and Finland,
Finnish Geodetic Institute, University of Hannover and lastly Federal Agency for
Cartography and Geodesy.
2.3.1.1 Objectives of GiMoDig Project
The objective of the project is creating dynamic generalization and data integration
methods in real-time to serve spatial data for mobile users. Main objective is emphasized at
project web page (URL 8) exactly like that “The project aims to seamless data service
infrastructure providing access, through a common interface to topographic geo databases
maintained by the national mapping agencies”. Sub objectives of the project are specified
as follows,
14
Investigating problems between national primary geospatial databases and to
develop a system for real-time harmonization of data.
Generating some methods for real-time transformation of spatial data from
different national geo-databases and to create common EUREF-based co-ordinate
system.
Investigating and developing methods for transferring vector-formatted spatial data
to a mobile user using XML data exchange type.
Construction of prototype system that can be used as a test-bed for the developed
methods.
The project main vision is indicated in Hampe et al. (2003) like that a mobile user when
travelling within an European country, can receive online information of his/her
environment on the mobile device.
2.3.1.2 Problems
Data integration and real-time generalization process is huge part of this project. The main
problem is the harmonization of data sets from different countries map providers. To
achieve this problem, GiMoDig developer team analyzed data sets of different countries.
Also data sets were linked in each other (Hampe et al., 2003).
2.3.1.3 Design of MRDB
In GiMoDig project, MRDB concept is based on Federated Database System (FDBS)
(Sheth and Larson, 1990). To summarize simply, a Federated Database System is a
collection of several working Database Management Systems (DBMS). In Figure 8, a
sample of a several working database management systems is depicted. FDBS has some
characteristics to classify type of system. These characteristics are Distribution,
Heterogeneity and Autonomy. Distribution means that data, which is used in the system,
may be distributed among multiple databases. These databases again may be located in a
single computer environment or multiple computer environments. In terms of
heterogeneity, it is aimed to represent several commercial DBMS, which are available to
use. Last one, Autonomy refers to each database system, which is designed and run
independently from each other.
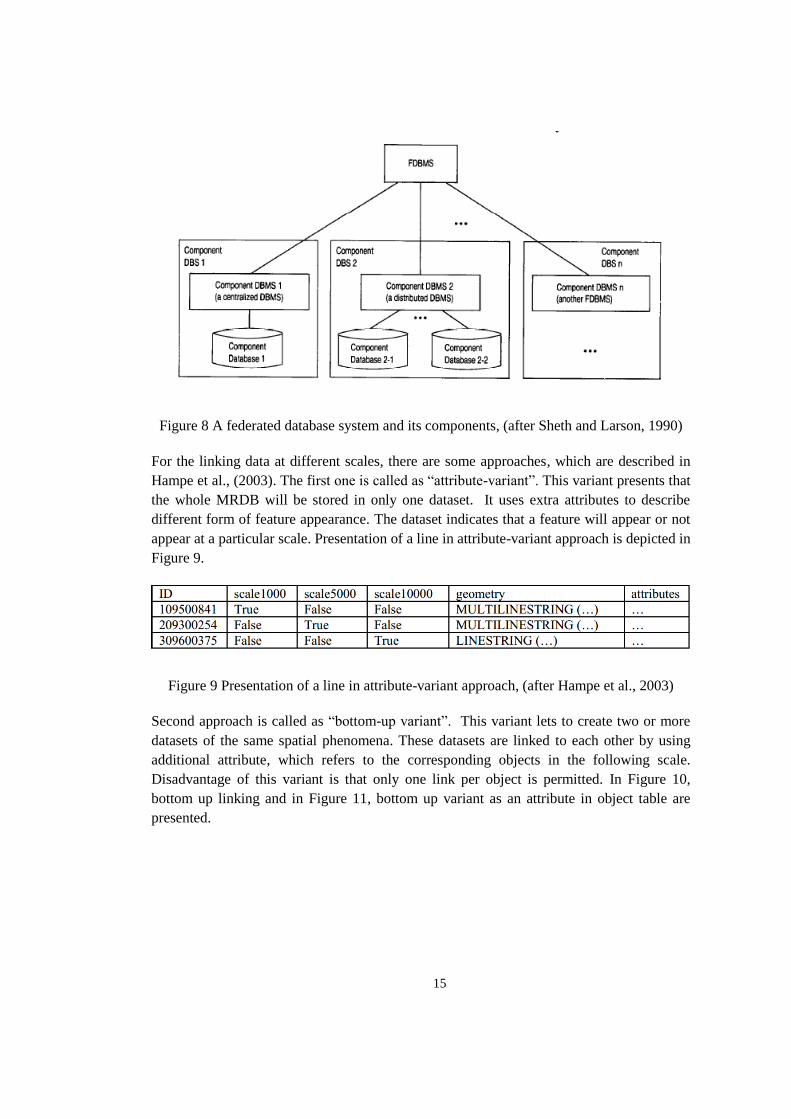
15
Figure 8 A federated database system and its components, (after Sheth and Larson, 1990)
For the linking data at different scales, there are some approaches, which are described in
Hampe et al., (2003). The first one is called as “attribute-variant”. This variant presents that
the whole MRDB will be stored in only one dataset. It uses extra attributes to describe
different form of feature appearance. The dataset indicates that a feature will appear or not
appear at a particular scale. Presentation of a line in attribute-variant approach is depicted in
Figure 9.
Figure 9 Presentation of a line in attribute-variant approach, (after Hampe et al., 2003)
Second approach is called as “bottom-up variant”. This variant lets to create two or more
datasets of the same spatial phenomena. These datasets are linked to each other by using
additional attribute, which refers to the corresponding objects in the following scale.
Disadvantage of this variant is that only one link per object is permitted. In Figure 10,
bottom up linking and in Figure 11, bottom up variant as an attribute in object table are
presented.
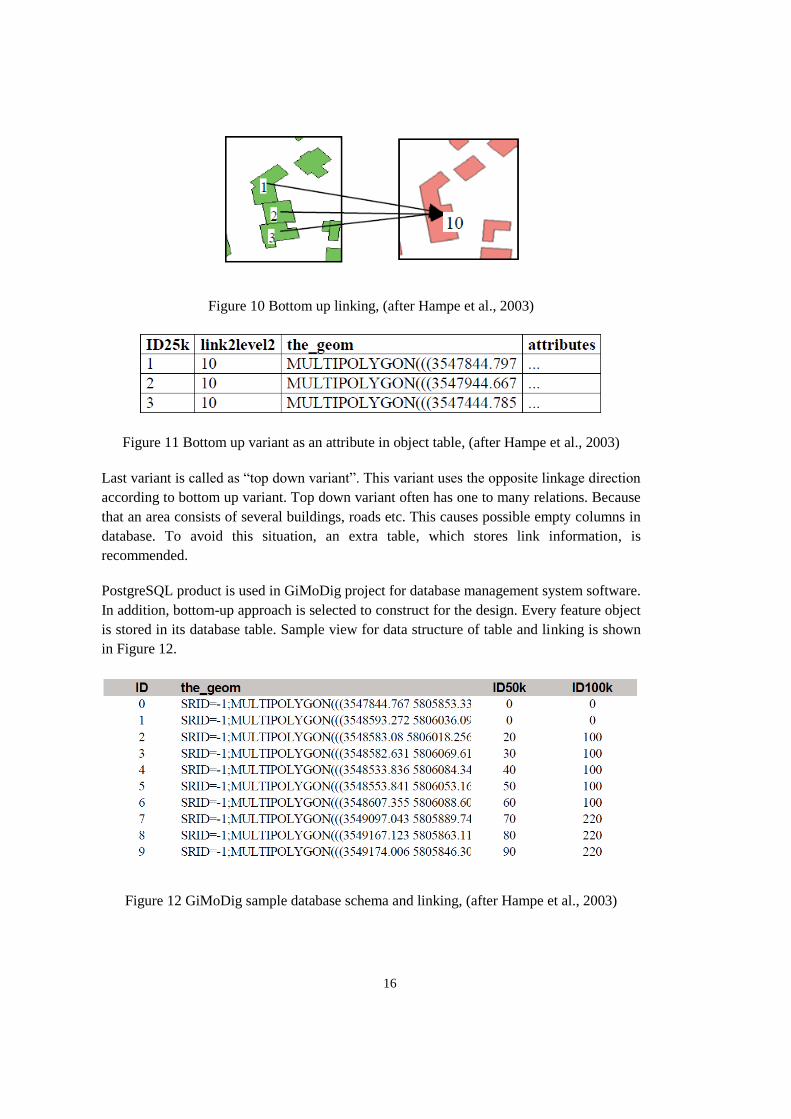
16
Figure 10 Bottom up linking, (after Hampe et al., 2003)
Figure 11 Bottom up variant as an attribute in object table, (after Hampe et al., 2003)
Last variant is called as “top down variant”. This variant uses the opposite linkage direction
according to bottom up variant. Top down variant often has one to many relations. Because
that an area consists of several buildings, roads etc. This causes possible empty columns in
database. To avoid this situation, an extra table, which stores link information, is
recommended.
PostgreSQL product is used in GiMoDig project for database management system software.
In addition, bottom-up approach is selected to construct for the design. Every feature object
is stored in its database table. Sample view for data structure of table and linking is shown
in Figure 12.
Figure 12 GiMoDig sample database schema and linking, (after Hampe et al., 2003)

17
2.3.1.4 Generalization Methodology
GiMoDig project developer team implemented offline and online generalization process.
Offline processes are time consuming operations, for that reason the data were processed
and stored in database before the submission of online generalization service. Online or
real-time generalization, is called when users requesting a map for a certain scale and
region. This process uses pre-calculated offline data, which is created during the offline
generalization. Data are generalized in a few times for requesting scale. They integrated
generalization methods for building simplification, amalgamation, enhancement,
typification and displacement. Algorithms, which were integrated in GiMoDig are detailed
in below sections.
2.3.1.5 Simplification for Buildings
There are several algorithms available for simplification process. In this part, a process
called building simplification, which was developed in GiMoDig project is demonstrated.
The idea behind the algorithm is finding the extreme cases and then, elimination of these
finding cases. There are three cases “Offset”, ”Bulge”, “Edge” on building selection
according to the implementation detail in Hampe and Sester, (2004). These cases are
demonstrated in Figure 13.
Figure 13 Cases for building simplification, left case (offset), middle case (bulge), right
case (edge), (after Hampe and Sester, 2004)
Firstly, a threshold value is determined. Then, this value is compared with every feature’s
edge length. If compared edge has smaller length from threshold, this edge is marked. This
edge is called as (Sn). After that, the algorithm looks the angle between (Sn) – (Sn-1) and
(Sn) – (Sn+1). The algorithm classifies the marked edge into offset, bulge or edge. Finally
these marked edges are eliminated. Result of this process is shown in Figure 14. They
mentioned in report that implemented simplification process is quite fast and used in real
18
time generalization processes. Also they gave an example on description of process speed
that two thousand buildings have been processed in approximately less than one second.
Figure 14 Before the building simplification (Left), result of simplification process (right),
(after Hampe and Sester, 2004)
After the simplification process, some gaps are occurred. These gaps can be seen in the
right side of Figure 14. GiMoDig developer team mentioned that these gaps could be
removed by processing additional operation called amalgamation.
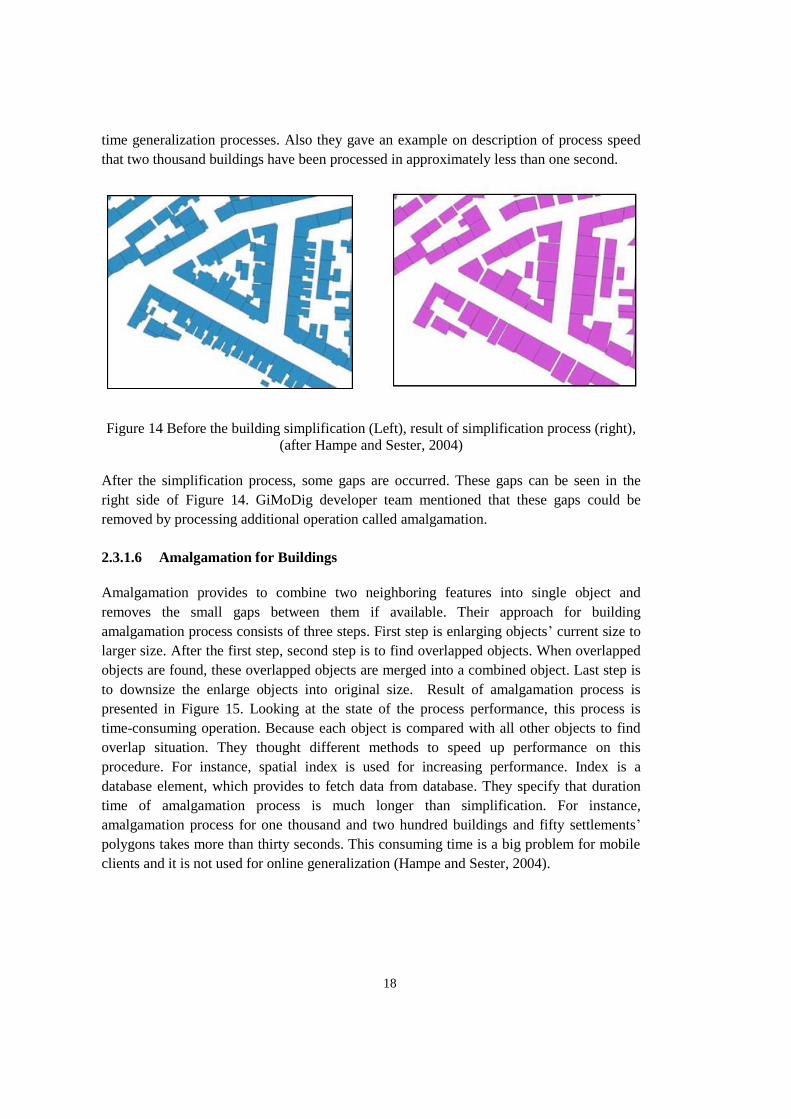
2.3.1.6 Amalgamation for Buildings
Amalgamation provides to combine two neighboring features into single object and
removes the small gaps between them if available. Their approach for building
amalgamation process consists of three steps. First step is enlarging objects’ current size to
larger size. After the first step, second step is to find overlapped objects. When overlapped
objects are found, these overlapped objects are merged into a combined object. Last step is
to downsize the enlarge objects into original size. Result of amalgamation process is
presented in Figure 15. Looking at the state of the process performance, this process is
time-consuming operation. Because each object is compared with all other objects to find
overlap situation. They thought different methods to speed up performance on this
procedure. For instance, spatial index is used for increasing performance. Index is a
database element, which provides to fetch data from database. They specify that duration
time of amalgamation process is much longer than simplification. For instance,
amalgamation process for one thousand and two hundred buildings and fifty settlements’
polygons takes more than thirty seconds. This consuming time is a big problem for mobile
clients and it is not used for online generalization (Hampe and Sester, 2004).
19
Figure 15 Amalgamation Process; original case (left), enlarging case (middle), combined
and downsized case (right), (after Hampe and Sester, 2004).
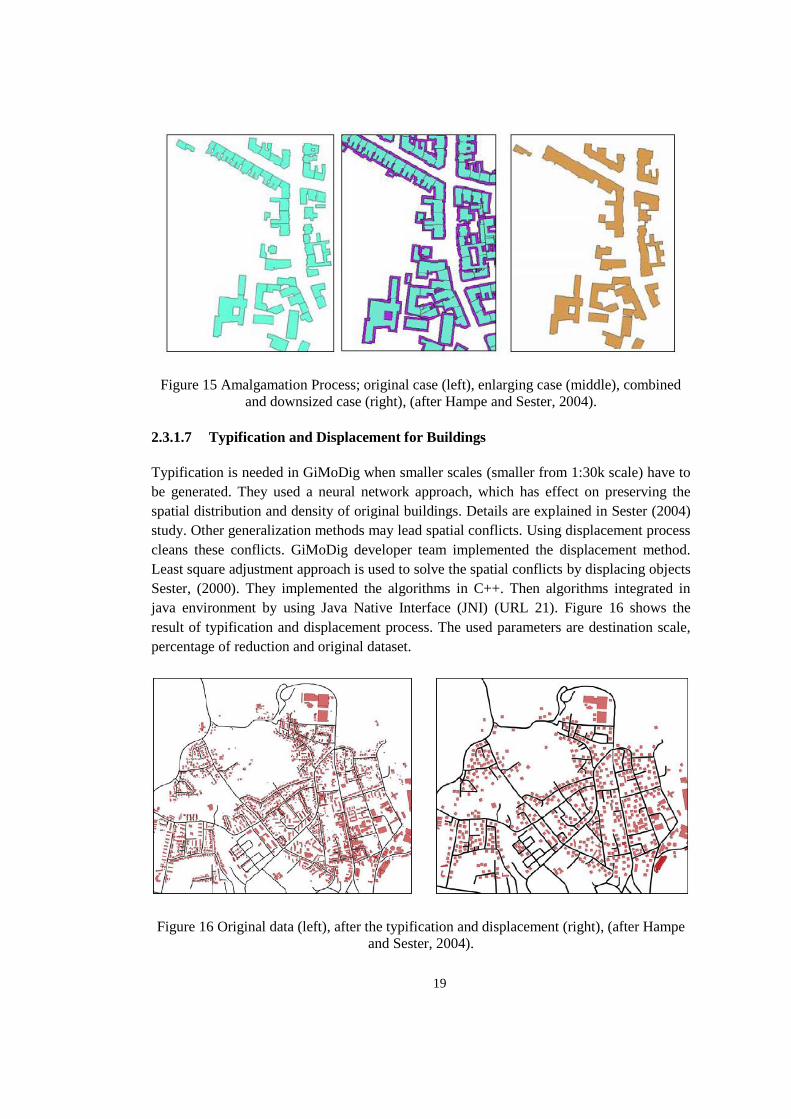
2.3.1.7 Typification and Displacement for Buildings
Typification is needed in GiMoDig when smaller scales (smaller from 1:30k scale) have to
be generated. They used a neural network approach, which has effect on preserving the
spatial distribution and density of original buildings. Details are explained in Sester (2004)
study. Other generalization methods may lead spatial conflicts. Using displacement process
cleans these conflicts. GiMoDig developer team implemented the displacement method.
Least square adjustment approach is used to solve the spatial conflicts by displacing objects
Sester, (2000). They implemented the algorithms in C++. Then algorithms integrated in
java environment by using Java Native Interface (JNI) (URL 21). Figure 16 shows the
result of typification and displacement process. The used parameters are destination scale,
percentage of reduction and original dataset.
Figure 16 Original data (left), after the typification and displacement (right), (after Hampe
and Sester, 2004).
20
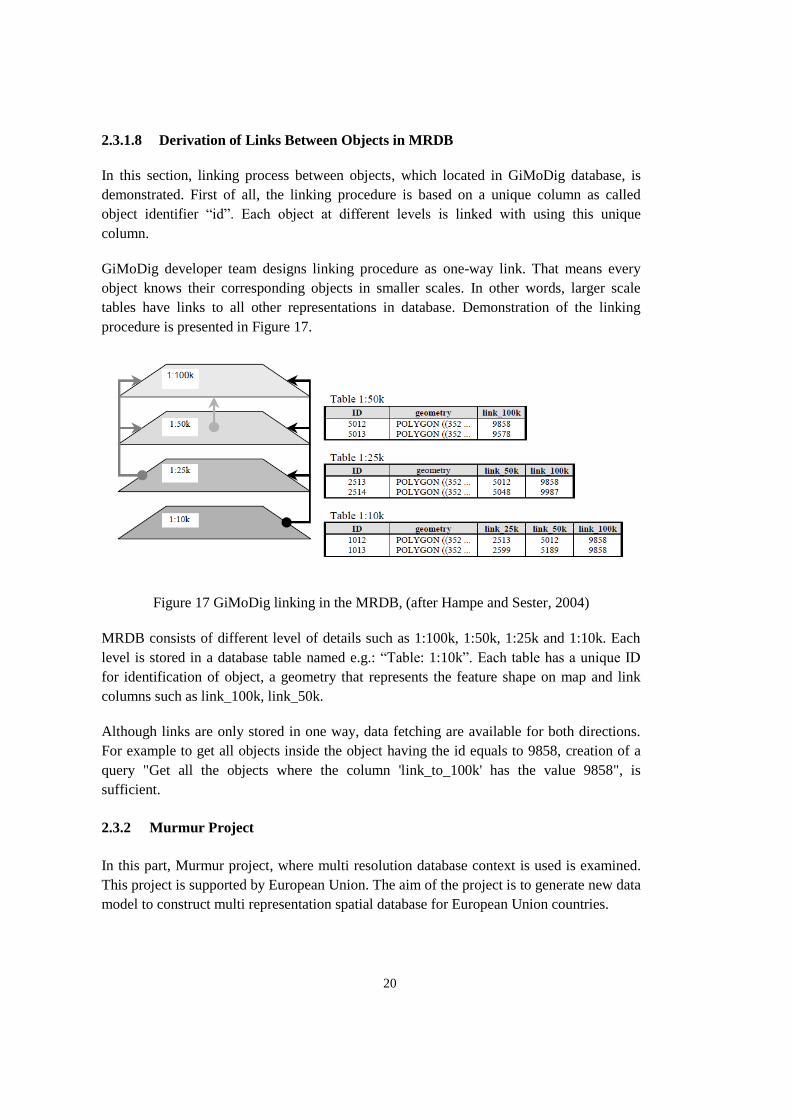
2.3.1.8 Derivation of Links Between Objects in MRDB
In this section, linking process between objects, which located in GiMoDig database, is
demonstrated. First of all, the linking procedure is based on a unique column as called
object identifier “id”. Each object at different levels is linked with using this unique
column.
GiMoDig developer team designs linking procedure as one-way link. That means every
object knows their corresponding objects in smaller scales. In other words, larger scale
tables have links to all other representations in database. Demonstration of the linking
procedure is presented in Figure 17.
Figure 17 GiMoDig linking in the MRDB, (after Hampe and Sester, 2004)
MRDB consists of different level of details such as 1:100k, 1:50k, 1:25k and 1:10k. Each
level is stored in a database table named e.g.: “Table: 1:10k”. Each table has a unique ID
for identification of object, a geometry that represents the feature shape on map and link
columns such as link_100k, link_50k.
Although links are only stored in one way, data fetching are available for both directions.
For example to get all objects inside the object having the id equals to 9858, creation of a
query "Get all the objects where the column 'link_to_100k' has the value 9858", is
sufficient.
2.3.2 Murmur Project
In this part, Murmur project, where multi resolution database context is used is examined.
This project is supported by European Union. The aim of the project is to generate new data
model to construct multi representation spatial database for European Union countries.
21
2.3.2.1 Objectives of Murmur Project
The objective of Murmur project is to enhance Geographic Information System (GIS) and
Database Managements System (DBMS) functionality to provide flexible representation of
data schemas and provide possibility in managing multiple represented data easily
Spaccapietra et al., (2000).
Providing multiple representations means that two or more representations are linked to the
same real world phenomena. For instance in a relational database, a person instance can be
stored as an instance in employee table and staff table where two tables may not have a
common attribute. In a geographical multi-scale database, the same building can be stored
as precise representation at 1/10000 scale and less precise representation format stored at
1/100000 scale.
Although object oriented or object relational database management systems provide extra
support using generalization/specialization hierarchies, current database management
systems support very limited functionality for multiple representations.
2.3.2.2 Design of MRDB
Murmur project aims to develop multi representation data models and framework.
According to the aim, their development team takes into account three different
perspectives,
Multi scale databases, where representations at different levels are stored in a single
database.
Integrated databases, where representations connected from different existing
databases correlated and virtually integrated in a federated framework.
Finally temporal databases, where multiple representations correspond to
representations taken at different points in time.
2.3.3 Information Drilling
Another methodology of MRDB is called “Information Drilling”. Users may be interested
in a certain object at any resolution level in a map. If a user requests detailed information
about a feature, then detailed information can be retrieved from its linked objects (Hampe
and Sester, 2004). MRDB structure allows getting related data, which are connected to
directly to the objects in the actual map. There are two kinds of drilling operation about a
feature. These are listed below as geometry and attribute.
2.3.4 Geometry Drilling
In the case of geometry drilling, users can request buildings or roads, which are located in
specific location on the world. For users, it is needed only a click for selected area to drill

22
more information about it. After making selection of area, a request with bundle of selected
feature’s identifier is sent to server by a typical web service or another infrastructure.
Server can get request then starts data drilling from different databases. After getting the
response from server, users can determine or analyze the drilling data, for example this
drilling information can be a building plan about a building.
2.3.5 Attribute Drilling
The MRDB structure can allow retrieving information that is not linked directly in
database. There is a good example usage of attribute drilling presented by Hampe and
Sester, (2004). Maybe, an attribute does not exist in feature of a building within the map at
a certain scale, but if map scale is configured much smaller, built-up area or cities can own
the attribute “city name” and hence, buildings linked with this object can access this
attribute data when it is requested.
In the MRDB structure, if a user wants to learn city name information about a building,
corresponding city feature is requested then the desired information can be returned to user.
In MRDB, the number of attributes is not limited with stored feature. Because of the links
between the objects in the database, indirect access can be done to retrieve linked
information from database.
23
CHAPTER 3
SYSTEM ARCHITECTURE
In this chapter, overall structure of the system is described. Overall system mainly consists
of three common components. These are listed as a server side application as we call
middleware, a service infrastructure and clients. Details about these components will be
described separately in chapter 4.
Server side application is a kind of a web application. It includes service infrastructure and
other important components such as data access module, scale control manager, link
module etc. Service infrastructure is constructed to provide communication between server
and client. Two clients are implemented in this research. These are called web client, and
mobile client. These clients have a rich user interface and responsible to present developed
MRDB prototype to end-users. These components will be explained briefly in the next
chapter.
System architecture can be introduced as follows; firstly general architecture and database
architecture will be explained. After that implementation of MRDB approach and dataset
linking procedure will be described. Finally data flow and communication between system
components will be explained.
3.1 Overall Design
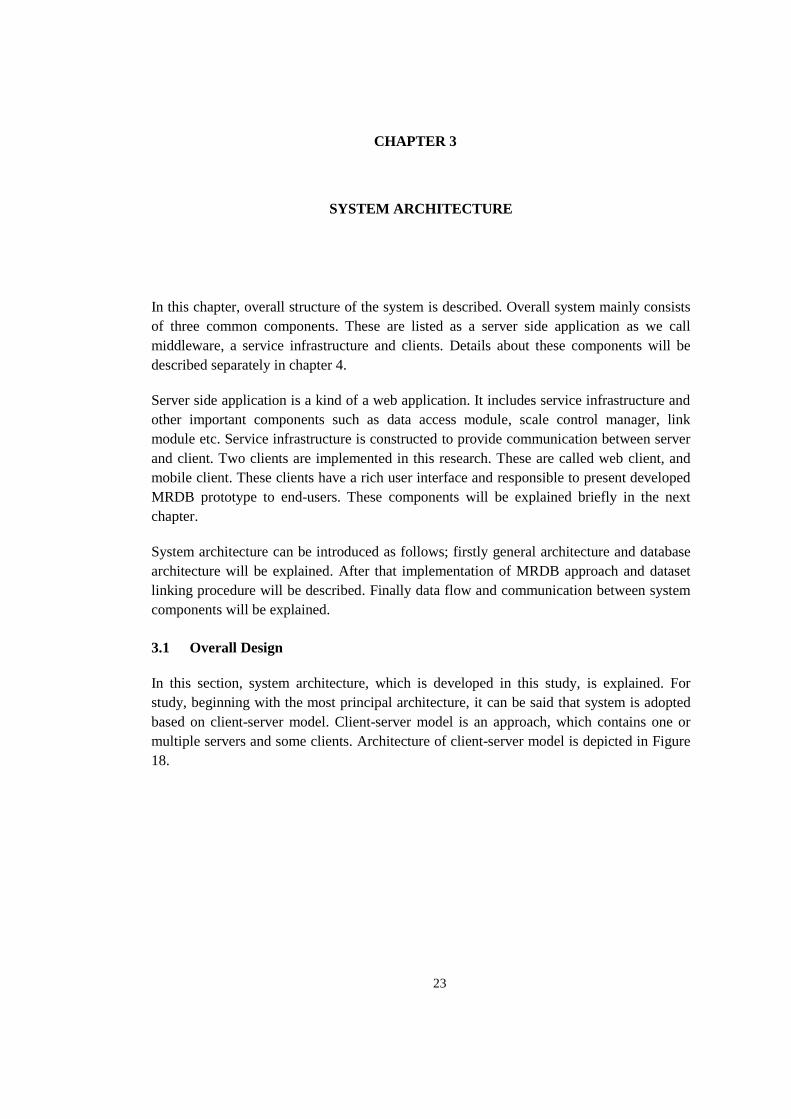
In this section, system architecture, which is developed in this study, is explained. For
study, beginning with the most principal architecture, it can be said that system is adopted
based on client-server model. Client-server model is an approach, which contains one or
multiple servers and some clients. Architecture of client-server model is depicted in Figure
18.
24
Figure 18 A typical client-server model, (URL 19)
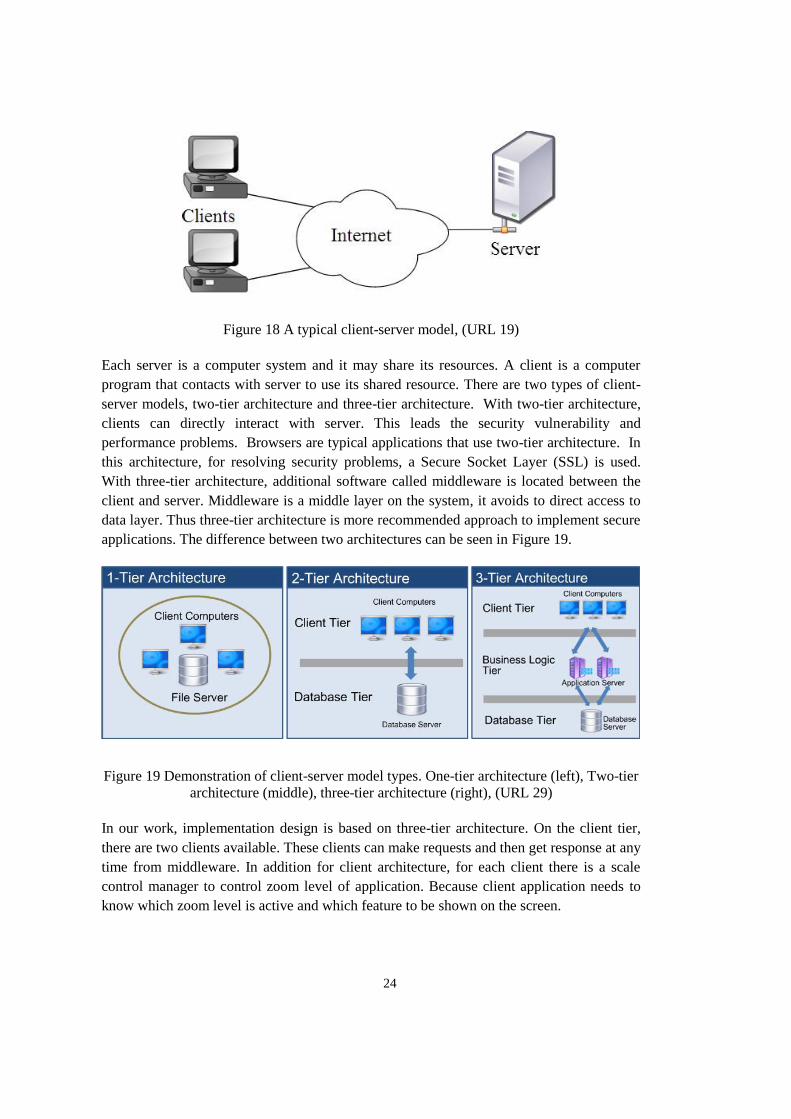
Each server is a computer system and it may share its resources. A client is a computer
program that contacts with server to use its shared resource. There are two types of client-
server models, two-tier architecture and three-tier architecture. With two-tier architecture,
clients can directly interact with server. This leads the security vulnerability and
performance problems. Browsers are typical applications that use two-tier architecture. In
this architecture, for resolving security problems, a Secure Socket Layer (SSL) is used.
With three-tier architecture, additional software called middleware is located between the
client and server. Middleware is a middle layer on the system, it avoids to direct access to
data layer. Thus three-tier architecture is more recommended approach to implement secure
applications. The difference between two architectures can be seen in Figure 19.
Figure 19 Demonstration of client-server model types. One-tier architecture (left), Two-tier
architecture (middle), three-tier architecture (right), (URL 29)
In our work, implementation design is based on three-tier architecture. On the client tier,
there are two clients available. These clients can make requests and then get response at any
time from middleware. In addition for client architecture, for each client there is a scale
control manager to control zoom level of application. Because client application needs to
know which zoom level is active and which feature to be shown on the screen.
25
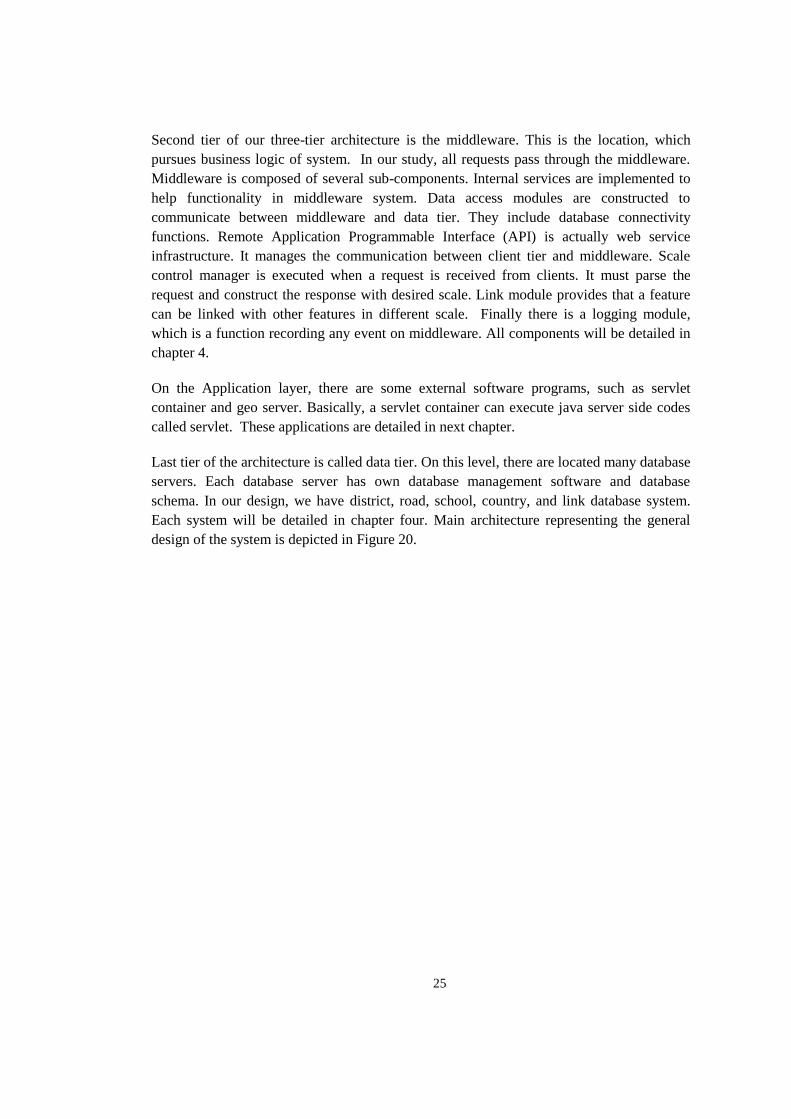
Second tier of our three-tier architecture is the middleware. This is the location, which
pursues business logic of system. In our study, all requests pass through the middleware.
Middleware is composed of several sub-components. Internal services are implemented to
help functionality in middleware system. Data access modules are constructed to
communicate between middleware and data tier. They include database connectivity
functions. Remote Application Programmable Interface (API) is actually web service
infrastructure. It manages the communication between client tier and middleware. Scale
control manager is executed when a request is received from clients. It must parse the
request and construct the response with desired scale. Link module provides that a feature
can be linked with other features in different scale. Finally there is a logging module,
which is a function recording any event on middleware. All components will be detailed in
chapter 4.
On the Application layer, there are some external software programs, such as servlet
container and geo server. Basically, a servlet container can execute java server side codes
called servlet. These applications are detailed in next chapter.
Last tier of the architecture is called data tier. On this level, there are located many database
servers. Each database server has own database management software and database
schema. In our design, we have district, road, school, country, and link database system.
Each system will be detailed in chapter four. Main architecture representing the general
design of the system is depicted in Figure 20.
26
Figure 20 Main architecture
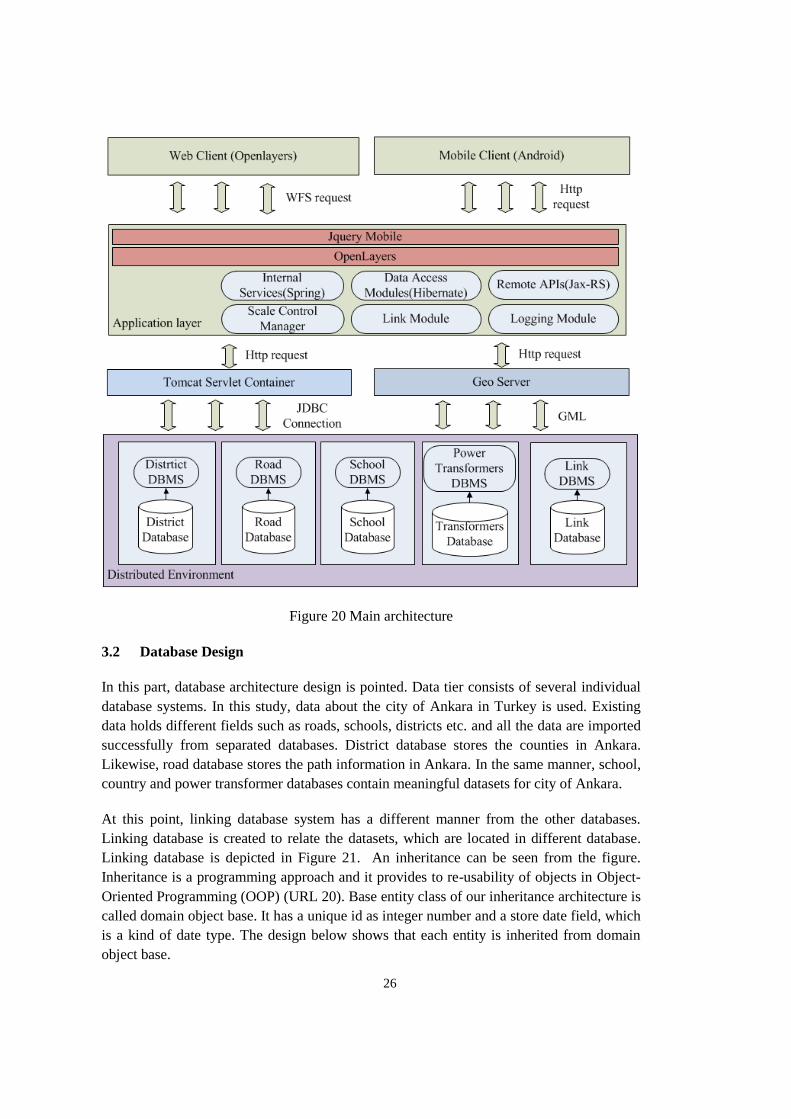
3.2 Database Design
In this part, database architecture design is pointed. Data tier consists of several individual
database systems. In this study, data about the city of Ankara in Turkey is used. Existing
data holds different fields such as roads, schools, districts etc. and all the data are imported
successfully from separated databases. District database stores the counties in Ankara.
Likewise, road database stores the path information in Ankara. In the same manner, school,
country and power transformer databases contain meaningful datasets for city of Ankara.
At this point, linking database system has a different manner from the other databases.
Linking database is created to relate the datasets, which are located in different database.
Linking database is depicted in Figure 21. An inheritance can be seen from the figure.
Inheritance is a programming approach and it provides to re-usability of objects in Object-
Oriented Programming (OOP) (URL 20). Base entity class of our inheritance architecture is
called domain object base. It has a unique id as integer number and a store date field, which
is a kind of date type. The design below shows that each entity is inherited from domain
object base.
27
Layer database entity keeps the specific information for different layers. As previously
mentioned systems such as district, road, school databases are defined as layers in layer
entity table. A layer entity has several fields for layer definition. Multi scale detail database
entity provides to store the relationship information between features. In this entity table,
basically layer id and feature id composition describes features layer and content. Zoom
level field describes the feature description and content on that zoom level. Geometry field
includes spatial information of feature. Basic geometry types could be point, polygon or
multi polygon and line. Poi entity is represented for Point of Interest. A Point of Interest
holds some information about a location on the world. Poi address and detail entities are
constructed for keeping different types of data in own structure.
Figure 21 Link database entity relational (ER) diagram
3.3 MRDB Approach
In the previous chapter, we described MRDB approaches in the literature. GiMoDig
approach, which we introduced in previous chapter, holds the data at maximum level of
detail in the database. Then generalization methods uses this data to obtain lower scale data.
28
After the generalization process the new data and original data are linked to each other to
be accessed. This flow of process is worked in real time when the users request map for a
particular scale.
In this study, Multi representation approached is used. Integration of generalization
methods is not focused for this study. We have focused on creating a separated database
environment and generating linking procedure to support MRDB. Also information drilling
methodology developed for multiple spatial databases to drill data on demand.
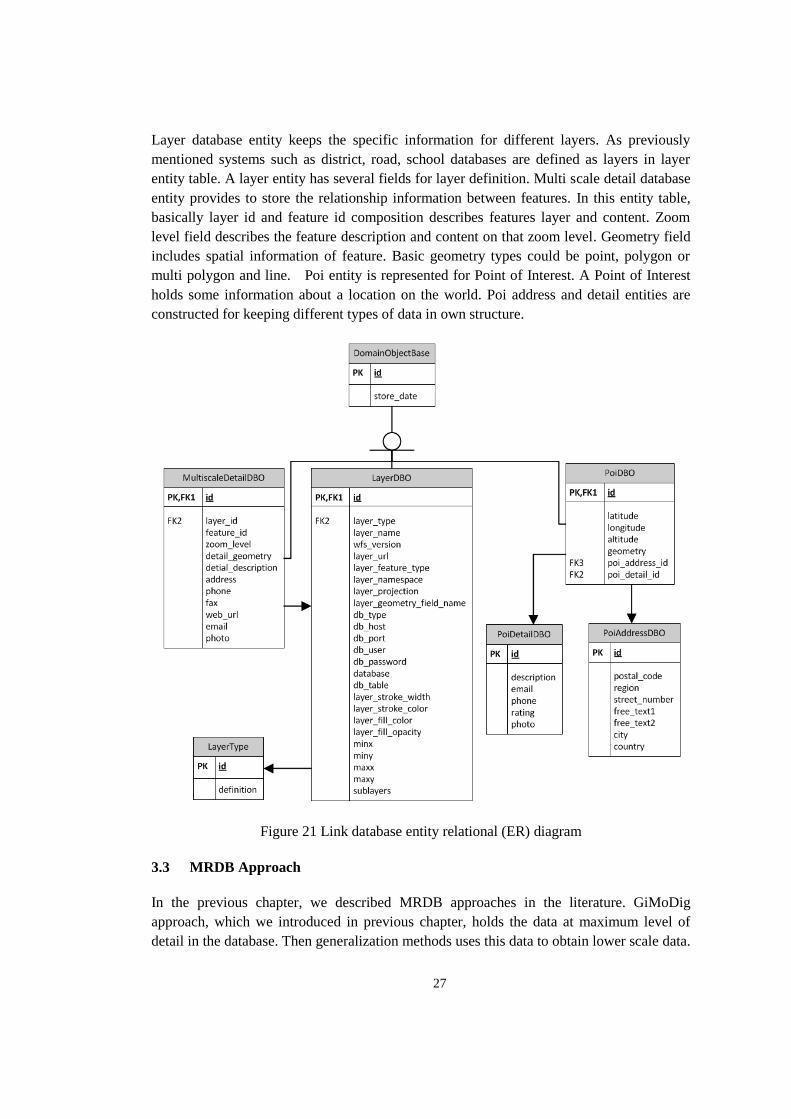
3.4 Dataset Linking Procedure
For MRDB linking procedure, a database mentioned as Link database is constructed.
Sample dataset for link database is figured out in Figure 22.
Figure 22 Sample dataset for link database
System is based on zoom level field. Zoom levels are defined between zero and twenty in
database and level twenty is the most detailed and level zero is the least detailed level.
Feature linking procedure can be explained by giving an example. For instance, a feature,
which has feature id equals to 296, is selected from school layer. This feature is persisted in
school database. By using linking generator service, a detail feature can be generated.
Detail feature keeps feature specific properties. These are feature representation geometry,
zoom level etc. Also detail feature is stored in linking database (Figure 22). Each client
application has a component called scale control manager. This manager controls the scale
change event on client application and if any change is detected on scale, request is
demanded from middleware to fetch and display linking detail information on the
application. Motivation is to create detail features for existing features. These detail
features can be represented in client applications at proper zoom level. Figure 23 represents
the linking process flow on client application.
29
Figure 23 Example feature linking in the system, original feature at zoom level 15 (left),
detailed feature at zoom level 17 (right)
In Figure 23, feature is originally shown as point in red circle. When user increases the
scale level in the application, linked data about feature is queried. If any data are available
then this data are fetched from server. Finally, fetched data are displayed on the application
screen. In our example, fetched data feature type is presented as polygon indicated by blue
color.
3.5 System Flow Design
In this section, general system flow and communication between components in the system
are described. Figure 24 presents the general flow of the system. Initially, users access the
system by using mobile or desktop client application. The request, which was made from
client applications, is received by middleware system on the Internet. Middleware can
manage the database connections and transactions. A desired data can be fetched by
middleware and response is created and transmitted to client application on the Internet.
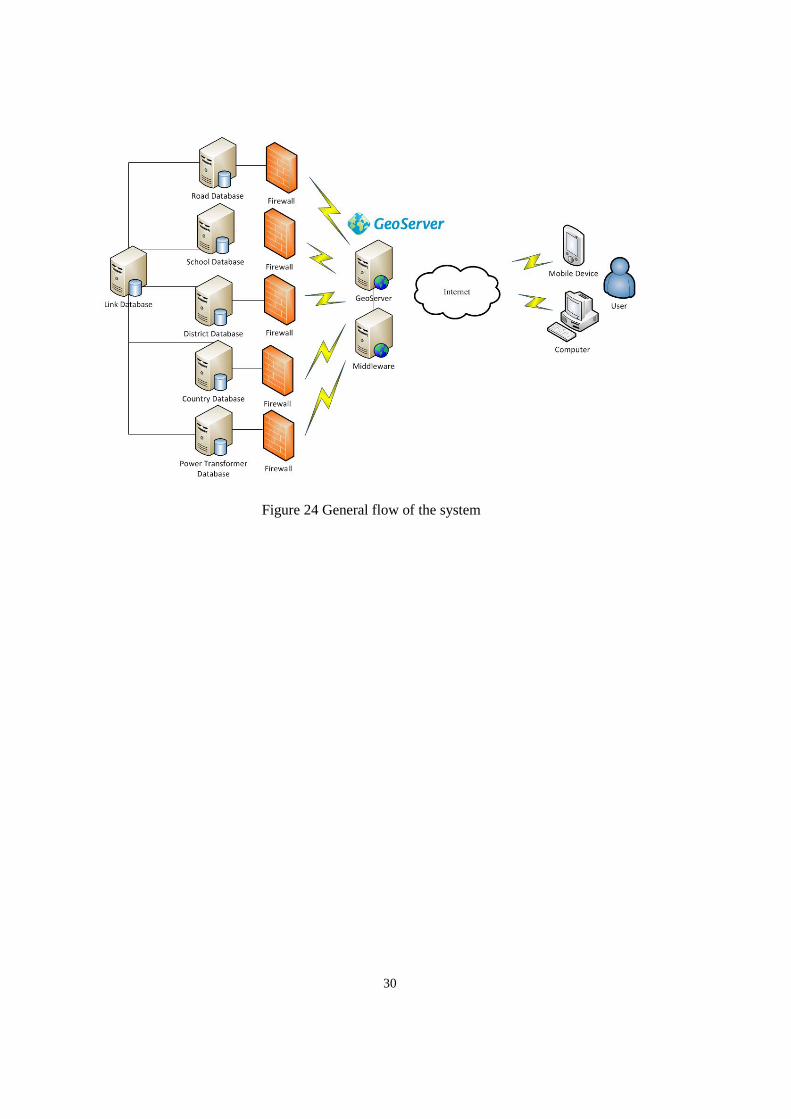
30
Figure 24 General flow of the system

31
CHAPTER 4
IMPLEMENTATION DETAILS
In this chapter, implementation details of applications used to present the performance of
the developed system are briefly described. In the previous chapter, main architecture that
is based on client/server model was mentioned. All client and server implementations are
based on java technologies and in addition, open source libraries and frameworks are
chosen for the study. In this chapter, initially four sub parts are given. Firstly, pre-
requirements’ section is described, then developed web application is described deeply,
then service infrastructure and finally developed mobile application are demonstrated. After
all, summary of implementation, case study and areas of use are given for last parts in this
chapter.
4.1 Pre-requirements
There are some prerequisites to run the system without any error. In this part, these
prerequisites are examined.
4.2 Database Setup
A database is required to store the data in the system. In our work PostgreSQL product is
used. PostgreSQL is an open source object relational database management system (URL
16). For management of geospatial data a product called PostGIS that is the extension of
PostgreSQL is also used.
4.3 Map Server Setup
Map server is a critical tool in our work. Because that map server product can be
considered as a gateway between middleware and database. In our work, GeoServer is used
as a map server. GeoServer is an open source map server product written by java and it
provides to share and edit geospatial data confirming the OGC. For more information about
the product, site link can give extra information (URL 6).
GeoServer supports to define data store objects. A Data store is a typical connection
provider to make connection between GeoServer and Database. Actually a data store stands
database access information about a layer. These data stores can be customized using
GeoServer application user interface. In our work, we define the data stores about city of
Ankara layer data. Then, these data stores are used in the system.
32
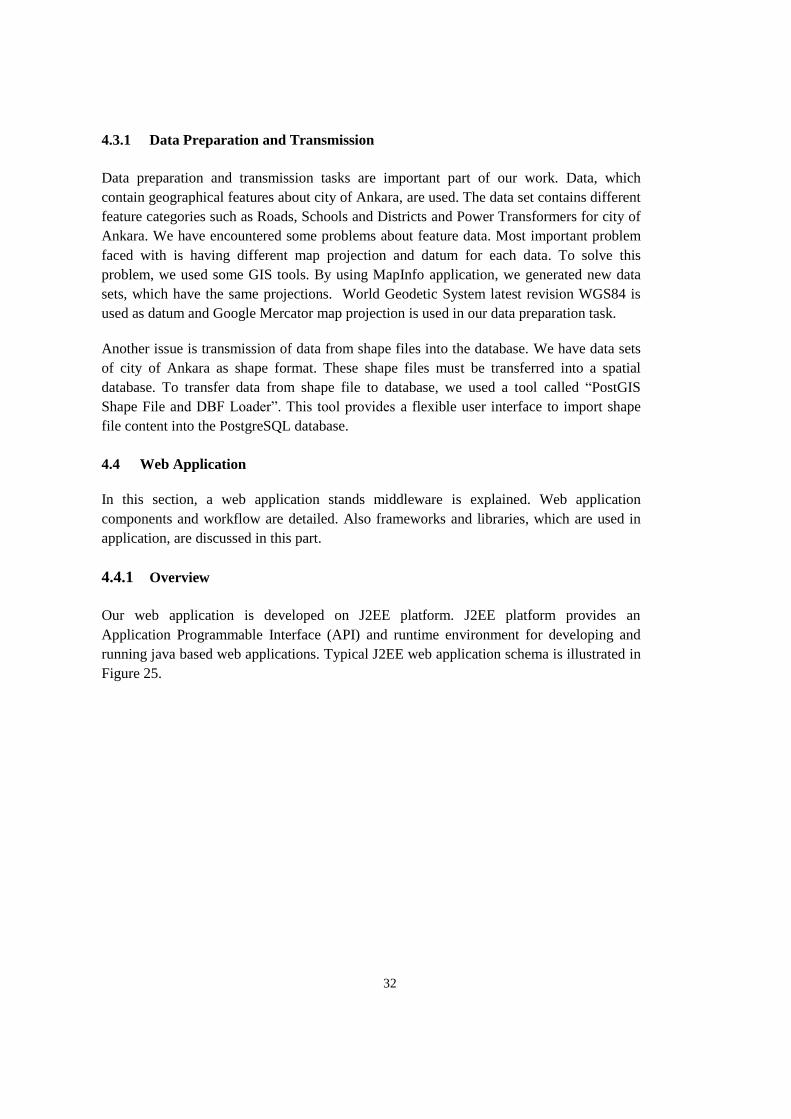
4.3.1 Data Preparation and Transmission
Data preparation and transmission tasks are important part of our work. Data, which
contain geographical features about city of Ankara, are used. The data set contains different
feature categories such as Roads, Schools and Districts and Power Transformers for city of
Ankara. We have encountered some problems about feature data. Most important problem
faced with is having different map projection and datum for each data. To solve this
problem, we used some GIS tools. By using MapInfo application, we generated new data
sets, which have the same projections. World Geodetic System latest revision WGS84 is
used as datum and Google Mercator map projection is used in our data preparation task.
Another issue is transmission of data from shape files into the database. We have data sets
of city of Ankara as shape format. These shape files must be transferred into a spatial
database. To transfer data from shape file to database, we used a tool called “PostGIS
Shape File and DBF Loader”. This tool provides a flexible user interface to import shape
file content into the PostgreSQL database.
4.4 Web Application
In this section, a web application stands middleware is explained. Web application
components and workflow are detailed. Also frameworks and libraries, which are used in
application, are discussed in this part.
4.4.1 Overview
Our web application is developed on J2EE platform. J2EE platform provides an
Application Programmable Interface (API) and runtime environment for developing and
running java based web applications. Typical J2EE web application schema is illustrated in
Figure 25.
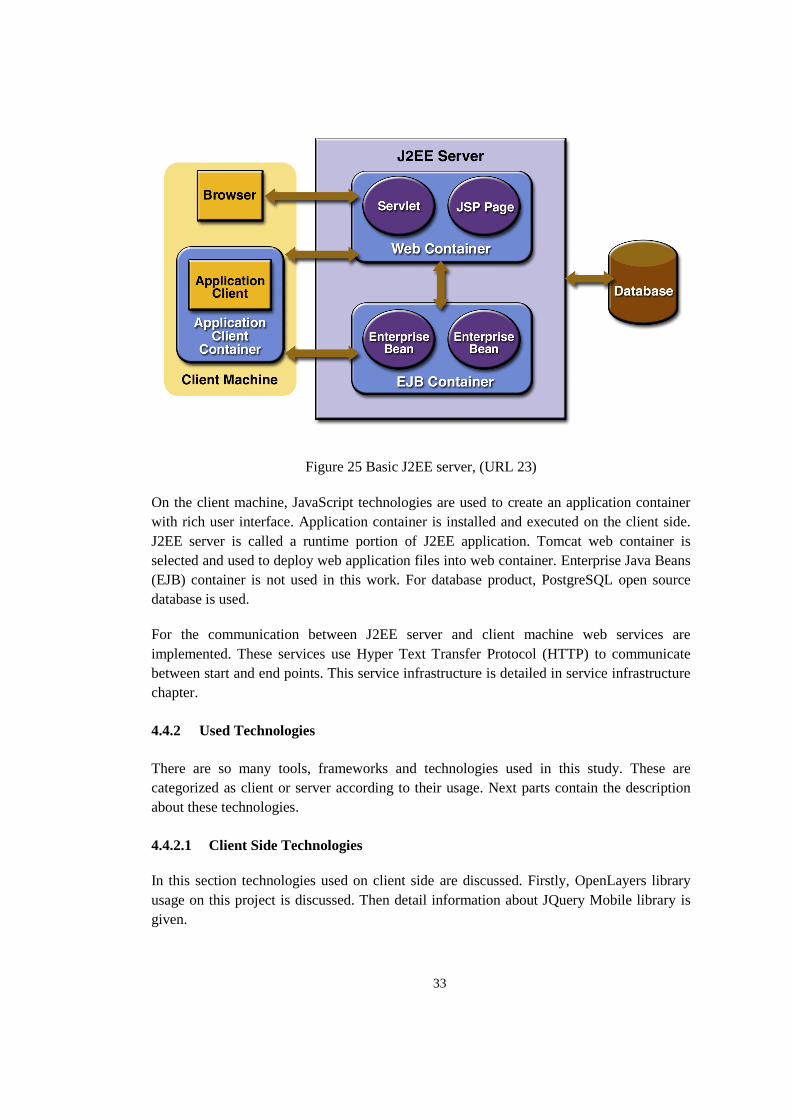
33
Figure 25 Basic J2EE server, (URL 23)
On the client machine, JavaScript technologies are used to create an application container
with rich user interface. Application container is installed and executed on the client side.
J2EE server is called a runtime portion of J2EE application. Tomcat web container is
selected and used to deploy web application files into web container. Enterprise Java Beans
(EJB) container is not used in this work. For database product, PostgreSQL open source
database is used.
For the communication between J2EE server and client machine web services are
implemented. These services use Hyper Text Transfer Protocol (HTTP) to communicate
between start and end points. This service infrastructure is detailed in service infrastructure
chapter.
4.4.2 Used Technologies
There are so many tools, frameworks and technologies used in this study. These are
categorized as client or server according to their usage. Next parts contain the description
about these technologies.
4.4.2.1 Client Side Technologies
In this section technologies used on client side are discussed. Firstly, OpenLayers library
usage on this project is discussed. Then detail information about JQuery Mobile library is
given.
34
OpenLayers is an open source JavaScript library. It provides users an API for generating
web based rich user interface for geographical information systems applications.
OpenLayers support formats that GeoRSS, KML, GeoJSON or map data from any data
source, which are using OGC standard as Web Map Service (WMS) and Web Feature
Service (WFS). Detailed OpenLayers API documentation can be obtained from official
OpenLayers web site (URL 15).
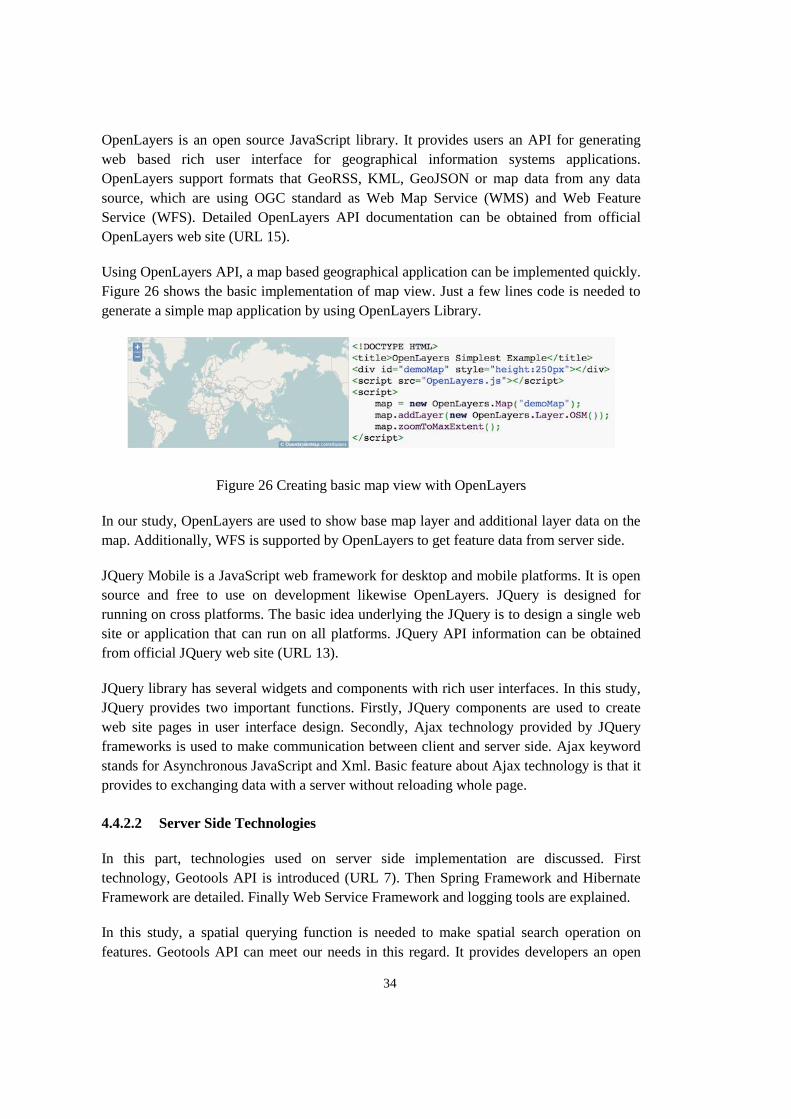
Using OpenLayers API, a map based geographical application can be implemented quickly.
Figure 26 shows the basic implementation of map view. Just a few lines code is needed to
generate a simple map application by using OpenLayers Library.
Figure 26 Creating basic map view with OpenLayers
In our study, OpenLayers are used to show base map layer and additional layer data on the
map. Additionally, WFS is supported by OpenLayers to get feature data from server side.
JQuery Mobile is a JavaScript web framework for desktop and mobile platforms. It is open
source and free to use on development likewise OpenLayers. JQuery is designed for
running on cross platforms. The basic idea underlying the JQuery is to design a single web
site or application that can run on all platforms. JQuery API information can be obtained
from official JQuery web site (URL 13).
JQuery library has several widgets and components with rich user interfaces. In this study,
JQuery provides two important functions. Firstly, JQuery components are used to create
web site pages in user interface design. Secondly, Ajax technology provided by JQuery
frameworks is used to make communication between client and server side. Ajax keyword
stands for Asynchronous JavaScript and Xml. Basic feature about Ajax technology is that it
provides to exchanging data with a server without reloading whole page.
4.4.2.2 Server Side Technologies
In this part, technologies used on server side implementation are discussed. First
technology, Geotools API is introduced (URL 7). Then Spring Framework and Hibernate
Framework are detailed. Finally Web Service Framework and logging tools are explained.
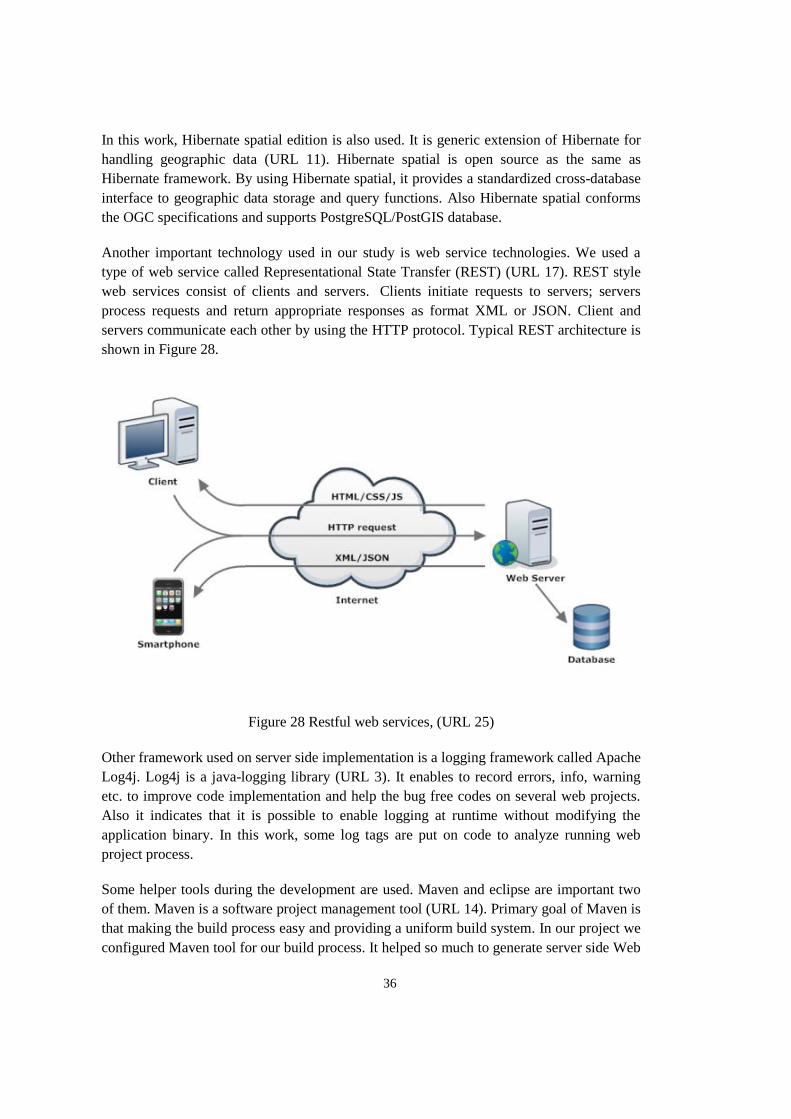
In this study, a spatial querying function is needed to make spatial search operation on
features. Geotools API can meet our needs in this regard. It provides developers an open
35
source development kit. In addition, Geotools library conform the Open Geospatial
Consortium standards. By using Geotools functions, we generated spatial filtering methods
to filter feature data according to the spatial parameters latitude, longitude, bounds etc.
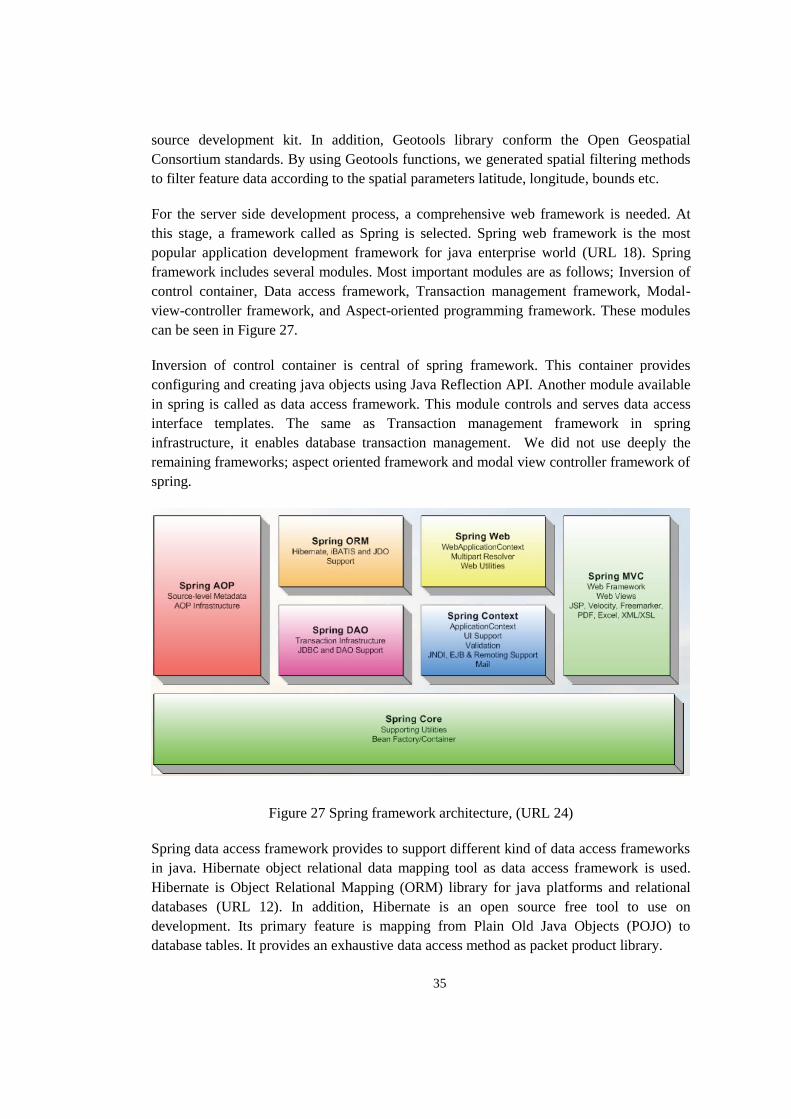
For the server side development process, a comprehensive web framework is needed. At
this stage, a framework called as Spring is selected. Spring web framework is the most
popular application development framework for java enterprise world (URL 18). Spring
framework includes several modules. Most important modules are as follows; Inversion of
control container, Data access framework, Transaction management framework, Modal-
view-controller framework, and Aspect-oriented programming framework. These modules
can be seen in Figure 27.
Inversion of control container is central of spring framework. This container provides
configuring and creating java objects using Java Reflection API. Another module available
in spring is called as data access framework. This module controls and serves data access
interface templates. The same as Transaction management framework in spring
infrastructure, it enables database transaction management. We did not use deeply the
remaining frameworks; aspect oriented framework and modal view controller framework of
spring.
Figure 27 Spring framework architecture, (URL 24)
Spring data access framework provides to support different kind of data access frameworks
in java. Hibernate object relational data mapping tool as data access framework is used.
Hibernate is Object Relational Mapping (ORM) library for java platforms and relational
databases (URL 12). In addition, Hibernate is an open source free tool to use on
development. Its primary feature is mapping from Plain Old Java Objects (POJO) to
database tables. It provides an exhaustive data access method as packet product library.
36
In this work, Hibernate spatial edition is also used. It is generic extension of Hibernate for
handling geographic data (URL 11). Hibernate spatial is open source as the same as
Hibernate framework. By using Hibernate spatial, it provides a standardized cross-database
interface to geographic data storage and query functions. Also Hibernate spatial conforms
the OGC specifications and supports PostgreSQL/PostGIS database.
Another important technology used in our study is web service technologies. We used a
type of web service called Representational State Transfer (REST) (URL 17). REST style
web services consist of clients and servers. Clients initiate requests to servers; servers
process requests and return appropriate responses as format XML or JSON. Client and
servers communicate each other by using the HTTP protocol. Typical REST architecture is
shown in Figure 28.
Figure 28 Restful web services, (URL 25)
Other framework used on server side implementation is a logging framework called Apache
Log4j. Log4j is a java-logging library (URL 3). It enables to record errors, info, warning
etc. to improve code implementation and help the bug free codes on several web projects.
Also it indicates that it is possible to enable logging at runtime without modifying the
application binary. In this work, some log tags are put on code to analyze running web
project process.
Some helper tools during the development are used. Maven and eclipse are important two
of them. Maven is a software project management tool (URL 14). Primary goal of Maven is
that making the build process easy and providing a uniform build system. In our project we
configured Maven tool for our build process. It helped so much to generate server side Web
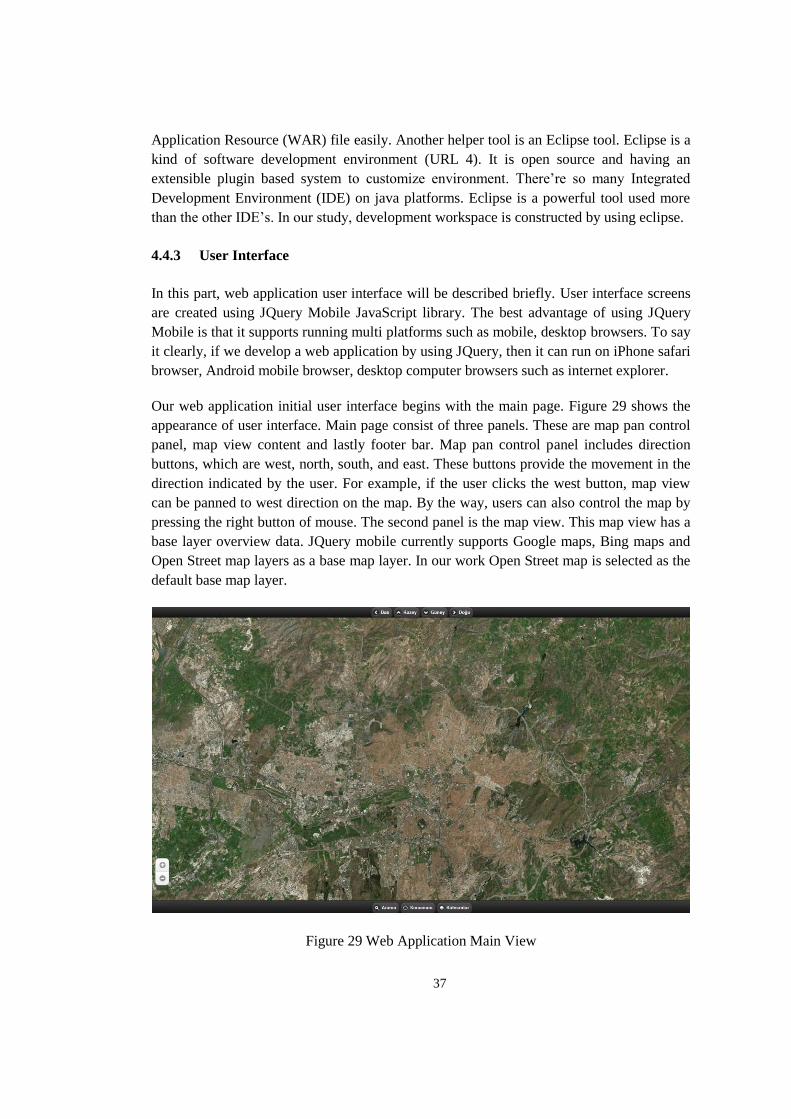
37
Application Resource (WAR) file easily. Another helper tool is an Eclipse tool. Eclipse is a
kind of software development environment (URL 4). It is open source and having an
extensible plugin based system to customize environment. There’re so many Integrated
Development Environment (IDE) on java platforms. Eclipse is a powerful tool used more
than the other IDE’s. In our study, development workspace is constructed by using eclipse.
4.4.3 User Interface
In this part, web application user interface will be described briefly. User interface screens
are created using JQuery Mobile JavaScript library. The best advantage of using JQuery
Mobile is that it supports running multi platforms such as mobile, desktop browsers. To say
it clearly, if we develop a web application by using JQuery, then it can run on iPhone safari
browser, Android mobile browser, desktop computer browsers such as internet explorer.
Our web application initial user interface begins with the main page. Figure 29 shows the
appearance of user interface. Main page consist of three panels. These are map pan control
panel, map view content and lastly footer bar. Map pan control panel includes direction
buttons, which are west, north, south, and east. These buttons provide the movement in the
direction indicated by the user. For example, if the user clicks the west button, map view
can be panned to west direction on the map. By the way, users can also control the map by
pressing the right button of mouse. The second panel is the map view. This map view has a
base layer overview data. JQuery mobile currently supports Google maps, Bing maps and
Open Street map layers as a base map layer. In our work Open Street map is selected as the
default base map layer.
Figure 29 Web Application Main View

38
In Figure 29, a zoom control widget located at the left bottom side can be seen. This widget
helps increasing and decreasing the map zoom level on map view. Lastly, a footer panel
can be seen. “Search”, “My Location” and “Layer” buttons are located at center of this
panel. Search and my location buttons are currently inactive. Only the layer button works
and by clicking this button, a layer view page is opened.
Layer control page appearance can be seen in Figure 30. On this page, a grouped list view
widget is used. Two groups are hosted on the list as “Base layers”, “Overlay layers”. Users
can change the base layers by selecting a new row from list item cell. In the same way,
users can change the overlay layers status by clicking the row on the list. As additional
information, inactive layers could not be seen on the map view.
Figure 30 Web application layer selection view
In our application, system gets the active layer data from server. After getting feature data,
a sample screen shot can be seen in Figure 31. On this screen, each layer on the map is
represented on the map according to the layer visualization characteristics such as layer
symbol, layer item color, layer item shape, feature type etc.

39
Figure 31 Active layers data preview
Each item on the map has a clickable interface. If a user clicks the feature on the map, a
detail panel is opened. Detail panel represents the feature name, identifier and other
attributes. Selected feature’s detail information is presented in Figure 32. A tooltip widget
is presented as a detail panel in our user interface.
Figure 32 Selected feature’s detail
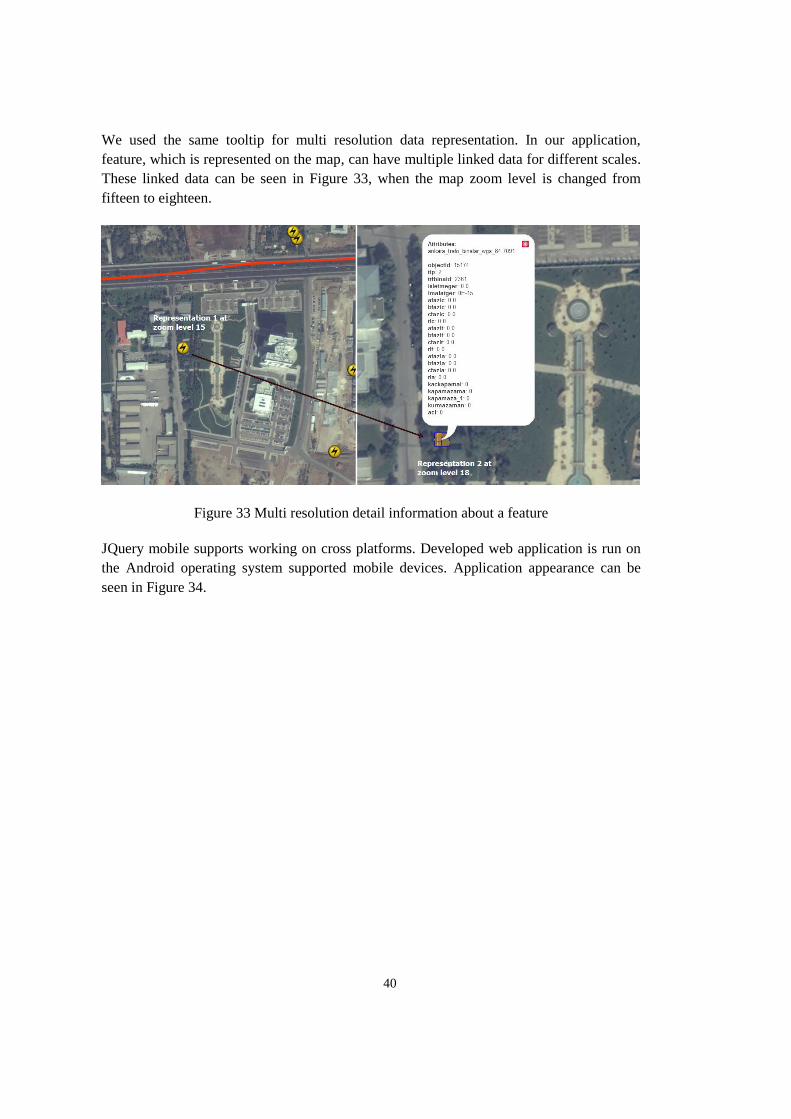
40
We used the same tooltip for multi resolution data representation. In our application,
feature, which is represented on the map, can have multiple linked data for different scales.
These linked data can be seen in Figure 33, when the map zoom level is changed from
fifteen to eighteen.
Figure 33 Multi resolution detail information about a feature
JQuery mobile supports working on cross platforms. Developed web application is run on
the Android operating system supported mobile devices. Application appearance can be
seen in Figure 34.
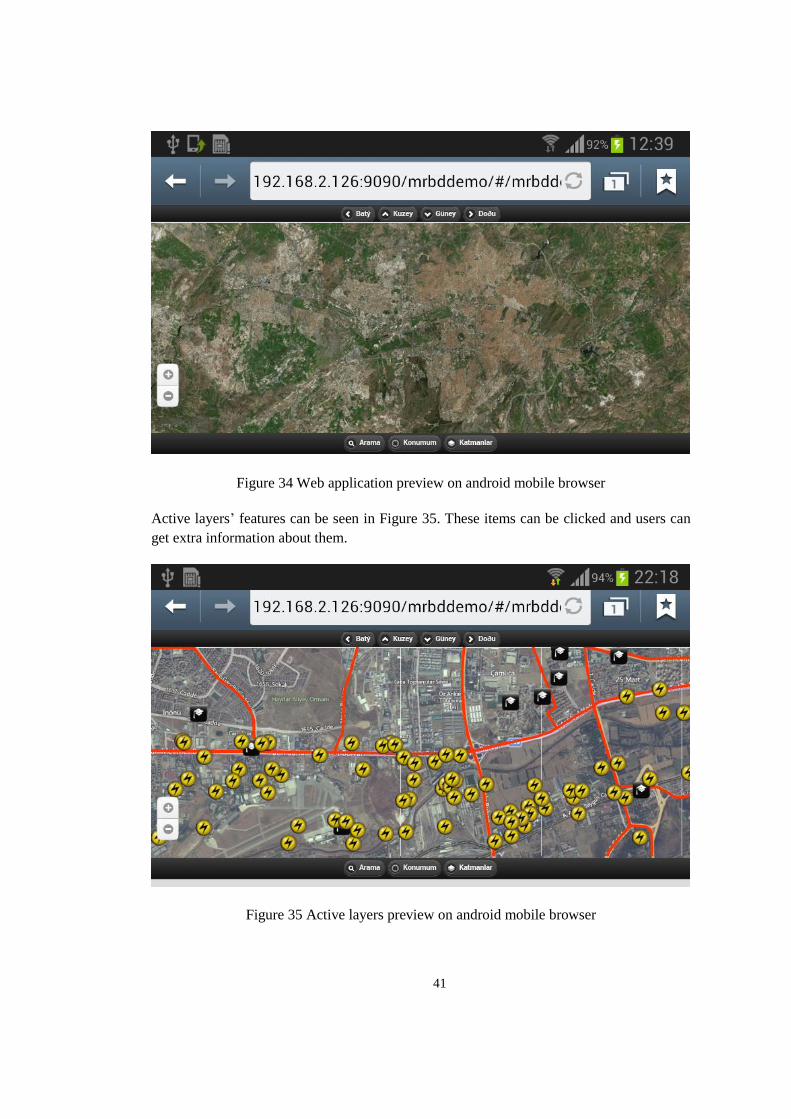
41
Figure 34 Web application preview on android mobile browser
Active layers’ features can be seen in Figure 35. These items can be clicked and users can
get extra information about them.
Figure 35 Active layers preview on android mobile browser

42
4.4.4 Application Work Flow
In this section, web application flow is described. Then, software modules used in
application are indicated. Scale control manager and link module are explained. These
modules manage the application flow entirely.
Basically a web application starts with opening a browser and typing the web site Uniform
Resource Locater (URL). After opening and typing the URL, web client starts. Initially,
web client requests layer data from web service defined in server. After then, web service
responds to web client with queried layer data. Application flow is entirely figured in
Figure 36.
Figure 36 Application flow chart
There is a sub module called map user interaction engine in scale control manager. This
module monitors the user events such as pan and zoom while the application runs. If any
map pan event occurs, user interaction engine controls the layer bounds with current
43
bounds. If current map bounds cover any layer boundaries, a web feature service request is
prepared according to the layer property and is sent to the server. Server responds the web
client with feature list. After getting the data, features are displayed on map according to
their type and symbol.
Map user interaction engine controls the zoom level changes. User can change the zoom
level by using zoom level widget located at left bottom of the view. Figure 28 shows the
zoom control widget on the view. Also mouse can change the level of zoom in the
application. After detection of zoom change, link module prepares an HTTP request, which
demands multi resolution data from server. On the server side, request is received and
processed. Then if any results are found, these found data are responded to the client. Link
module gets the results and refreshes linked data features on the map. At every zoom level
change on the client side, this process is performed.
4.5 Service Infrastructure
In this part, service layer on server side is deeply described. Service infrastructure is a heart
component of the middleware. It provides the communication between client applications
and middleware. There are two types of service implementations in infrastructure, which
are Restful Web Services (REST) and Web Feature Services (WFS).
REST web services are created using Jersey library. Jersey is a reference implementation of
REST services on java platform. There are two service classes implemented in our study.
These are called layer and feature. In the service contract section, implementation details
are given.
4.5.1 Data Contracts
Several data contracts are implemented. Data contracts are important for client side
implementation. Because that signature of data contract is expected from the client side as
the same as within the server side contract, if any update on the data contracts content can
raise the error during data exchange between client and server. There are four data contract
classes, which are constructed for services. These classes are showed in Figure 37. First
class of them is Layer. Layer class keeps several properties such as database connection
parameters which are needed to make connection between layer database, geographical
features for instance; projection, bounds, feature type, feature representation symbol etc.
Other contract is called feature item. This class keeps feature specific attributes examples of
identifier, type, location and relational properties. Geometry item data contract is dedicated
for keeping location attributes. Each coordinate object consists of geographical latitude,
longitude and height value. Finally feature detail contract class keeps linked feature
attributes. It includes feature item and geometry item attributes. In addition, there are
several detail attributes such as address, phone, web site URL, email address.
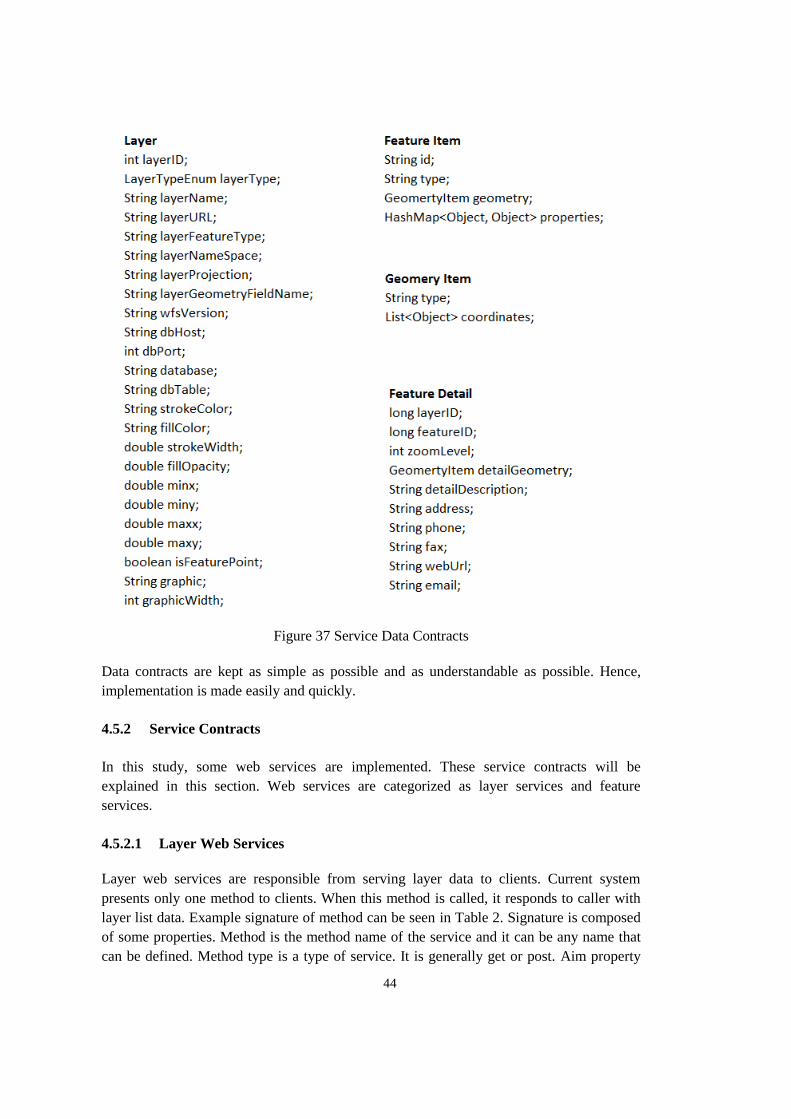
44
Figure 37 Service Data Contracts
Data contracts are kept as simple as possible and as understandable as possible. Hence,
implementation is made easily and quickly.
4.5.2 Service Contracts
In this study, some web services are implemented. These service contracts will be
explained in this section. Web services are categorized as layer services and feature
services.
4.5.2.1 Layer Web Services
Layer web services are responsible from serving layer data to clients. Current system
presents only one method to clients. When this method is called, it responds to caller with
layer list data. Example signature of method can be seen in Table 2. Signature is composed
of some properties. Method is the method name of the service and it can be any name that
can be defined. Method type is a type of service. It is generally get or post. Aim property
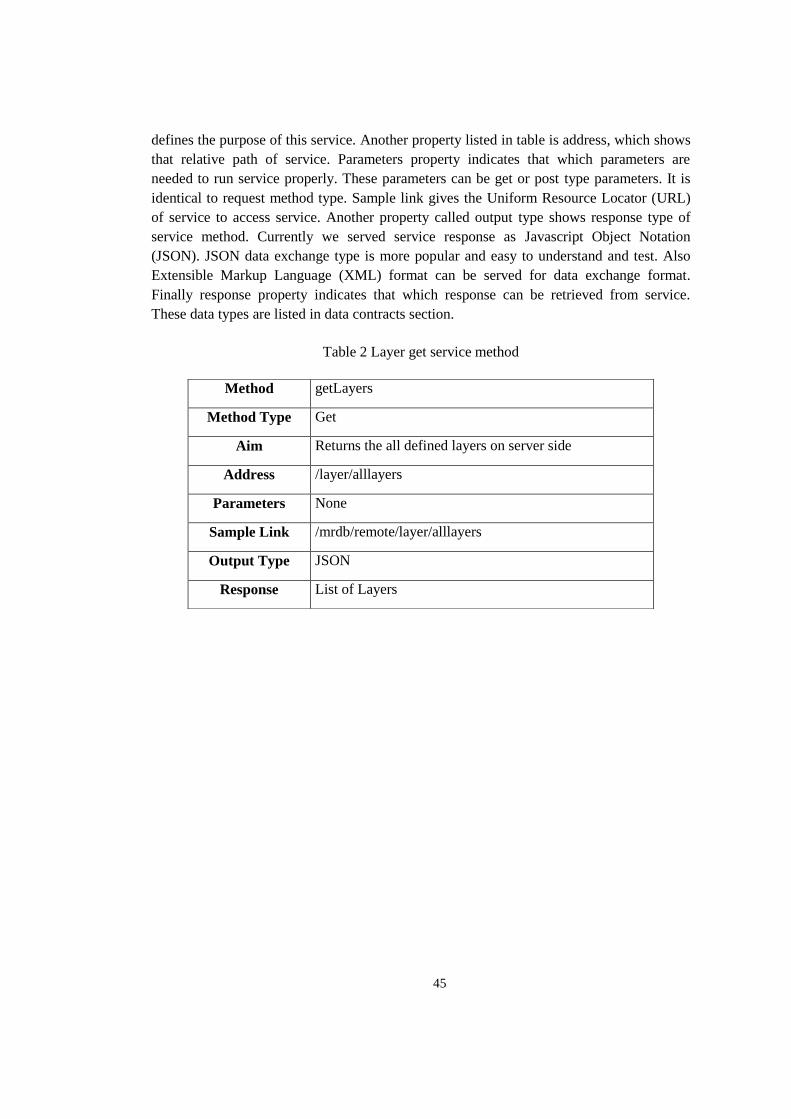
45
defines the purpose of this service. Another property listed in table is address, which shows
that relative path of service. Parameters property indicates that which parameters are
needed to run service properly. These parameters can be get or post type parameters. It is
identical to request method type. Sample link gives the Uniform Resource Locator (URL)
of service to access service. Another property called output type shows response type of
service method. Currently we served service response as Javascript Object Notation
(JSON). JSON data exchange type is more popular and easy to understand and test. Also
Extensible Markup Language (XML) format can be served for data exchange format.
Finally response property indicates that which response can be retrieved from service.
These data types are listed in data contracts section.
Table 2 Layer get service method
Method getLayers
Method Type Get
Aim Returns the all defined layers on server side
Address /layer/alllayers
Parameters None
Sample Link /mrdb/remote/layer/alllayers
Output Type JSON
Response List of Layers
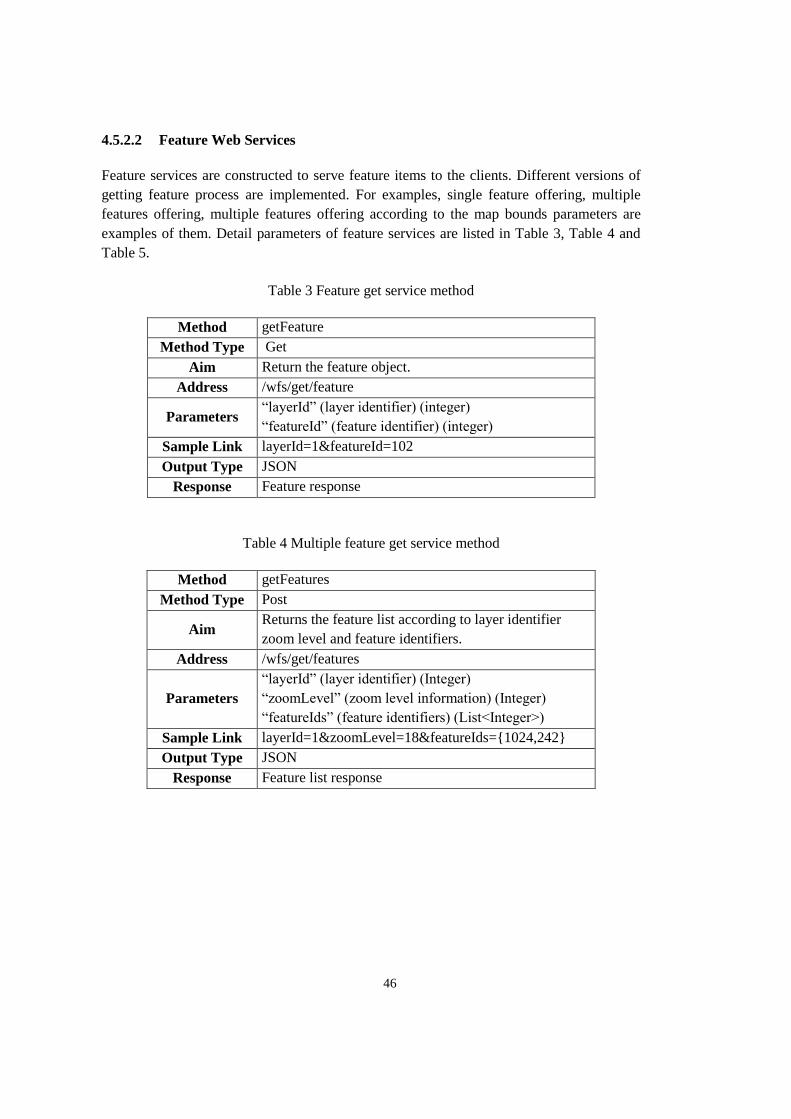
46
4.5.2.2 Feature Web Services
Feature services are constructed to serve feature items to the clients. Different versions of
getting feature process are implemented. For examples, single feature offering, multiple
features offering, multiple features offering according to the map bounds parameters are
examples of them. Detail parameters of feature services are listed in Table 3, Table 4 and
Table 5.
Table 3 Feature get service method
Method getFeature
Method Type Get
Aim Return the feature object.
Address /wfs/get/feature
Parameters “layerId” (layer identifier) (integer)
“featureId” (feature identifier) (integer)
Sample Link layerId=1&featureId=102
Output Type JSON
Response Feature response
Table 4 Multiple feature get service method
Method getFeatures
Method Type Post
Aim Returns the feature list according to layer identifier
zoom level and feature identifiers.
Address /wfs/get/features
Parameters
“layerId” (layer identifier) (Integer)
“zoomLevel” (zoom level information) (Integer)
“featureIds” (feature identifiers) (List<Integer>)
Sample Link layerId=1&zoomLevel=18&featureIds={1024,242}
Output Type JSON
Response Feature list response
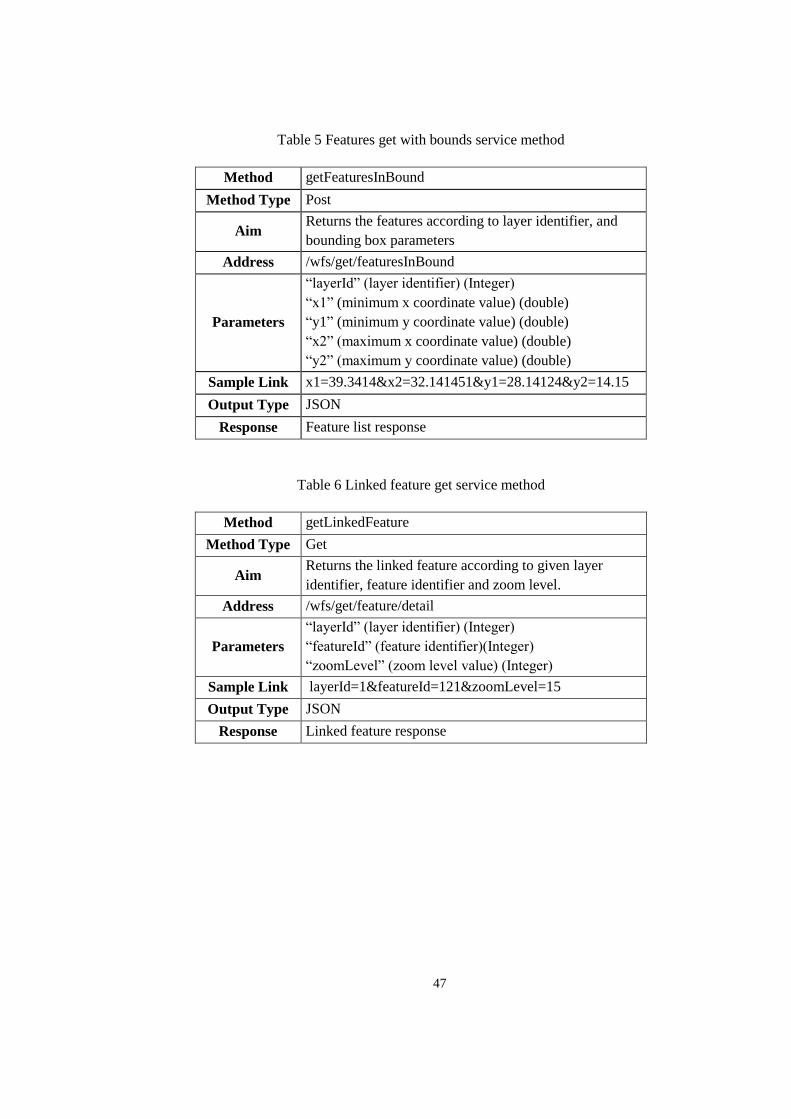
47
Table 5 Features get with bounds service method
Method getFeaturesInBound
Method Type Post
Aim Returns the features according to layer identifier, and
bounding box parameters
Address /wfs/get/featuresInBound
Parameters
“layerId” (layer identifier) (Integer)
“x1” (minimum x coordinate value) (double)
“y1” (minimum y coordinate value) (double)
“x2” (maximum x coordinate value) (double)
“y2” (maximum y coordinate value) (double)
Sample Link x1=39.3414&x2=32.141451&y1=28.14124&y2=14.15
Output Type JSON
Response Feature list response
Table 6 Linked feature get service method
Method getLinkedFeature
Method Type Get
Aim Returns the linked feature according to given layer
identifier, feature identifier and zoom level.
Address /wfs/get/feature/detail
Parameters
“layerId” (layer identifier) (Integer)
“featureId” (feature identifier)(Integer)
“zoomLevel” (zoom level value) (Integer)
Sample Link layerId=1&featureId=121&zoomLevel=15
Output Type JSON
Response Linked feature response
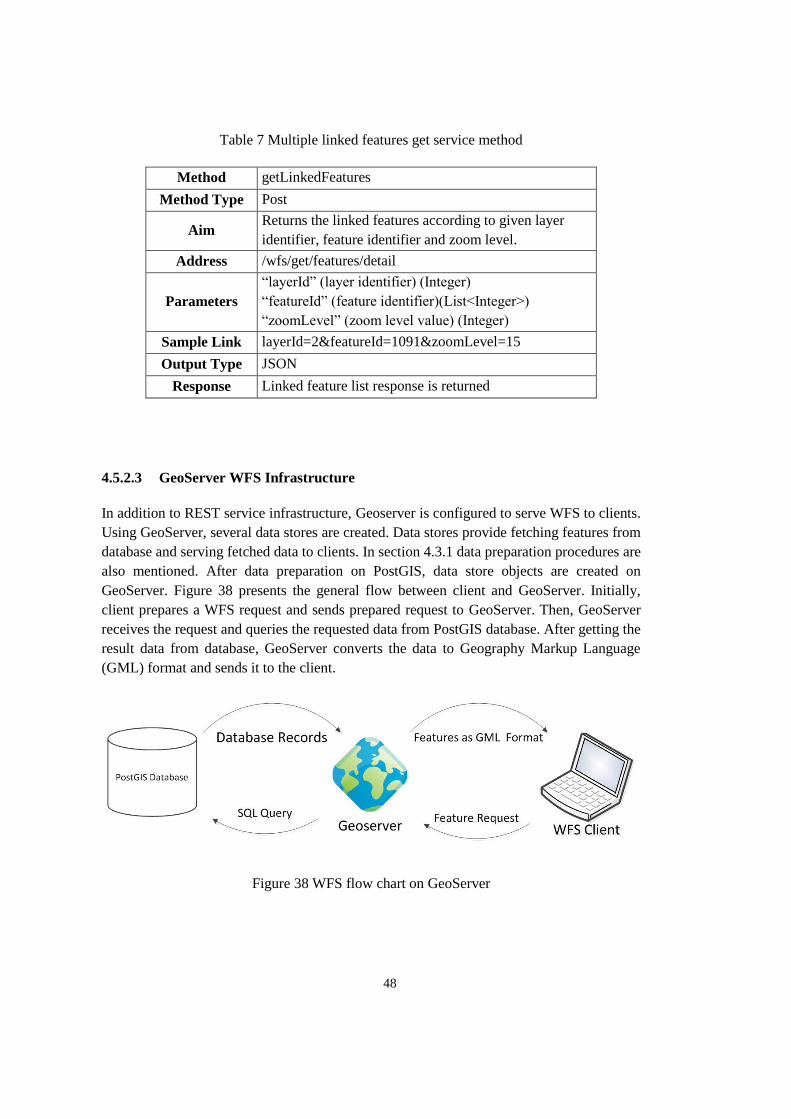
48
Table 7 Multiple linked features get service method
Method getLinkedFeatures
Method Type Post
Aim Returns the linked features according to given layer
identifier, feature identifier and zoom level.
Address /wfs/get/features/detail
Parameters
“layerId” (layer identifier) (Integer)
“featureId” (feature identifier)(List<Integer>)
“zoomLevel” (zoom level value) (Integer)
Sample Link layerId=2&featureId=1091&zoomLevel=15
Output Type JSON
Response Linked feature list response is returned
4.5.2.3 GeoServer WFS Infrastructure
In addition to REST service infrastructure, Geoserver is configured to serve WFS to clients.
Using GeoServer, several data stores are created. Data stores provide fetching features from
database and serving fetched data to clients. In section 4.3.1 data preparation procedures are
also mentioned. After data preparation on PostGIS, data store objects are created on
GeoServer. Figure 38 presents the general flow between client and GeoServer. Initially,
client prepares a WFS request and sends prepared request to GeoServer. Then, GeoServer
receives the request and queries the requested data from PostGIS database. After getting the
result data from database, GeoServer converts the data to Geography Markup Language
(GML) format and sends it to the client.
Figure 38 WFS flow chart on GeoServer
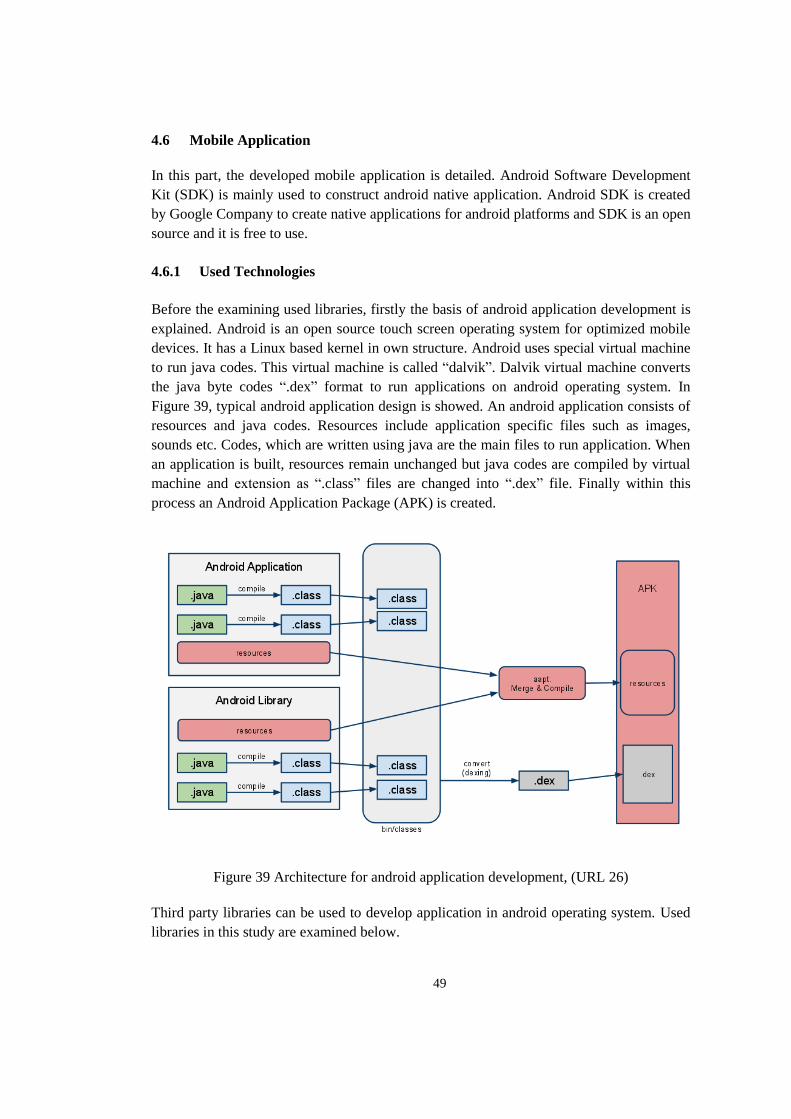
49
4.6 Mobile Application
In this part, the developed mobile application is detailed. Android Software Development
Kit (SDK) is mainly used to construct android native application. Android SDK is created
by Google Company to create native applications for android platforms and SDK is an open
source and it is free to use.
4.6.1 Used Technologies
Before the examining used libraries, firstly the basis of android application development is
explained. Android is an open source touch screen operating system for optimized mobile
devices. It has a Linux based kernel in own structure. Android uses special virtual machine
to run java codes. This virtual machine is called “dalvik”. Dalvik virtual machine converts
the java byte codes “.dex” format to run applications on android operating system. In
Figure 39, typical android application design is showed. An android application consists of
resources and java codes. Resources include application specific files such as images,
sounds etc. Codes, which are written using java are the main files to run application. When
an application is built, resources remain unchanged but java codes are compiled by virtual
machine and extension as “.class” files are changed into “.dex” file. Finally within this
process an Android Application Package (APK) is created.
Figure 39 Architecture for android application development, (URL 26)
Third party libraries can be used to develop application in android operating system. Used
libraries in this study are examined below.
50
In this work, first used library is Acra. Acra library is a bug control framework (URL 1). It
catches the exceptions thrown in developed android application then exceptions can be
logged or sent on network. It is an open source and free library to use. We have used this
framework to make bug free and stable android application during the development.
Developed application depends on the Internet connection to run properly. Therefore there
is a need for an http framework. An http management library called http handler is
constructed during the development. This framework is based on Apache Http Client API.
Http client API provides execution of http request, making authentication infrastructure,
connection management etc.
Gson library is another useful library to be used in application (URL 10). All data exchange
between server and client are JSON formatted data. Thus, Gson meets all the needs for data
conversion in our study. Gson can capable to convert JSON string to Java objects and vice
versa. In service contract section, we insisted service data contracts. These contracts are
constructed both on client side and server side. By using Gson, data manipulation between
server and client can be made quickly in proper format.
Last technology used in this study is called Google maps android API. Google maps API
provides adding Google maps into the own native android application. Map view covers a
large part of visual sense of the application. Therefore map framework is important for
development. Google maps integration for Android is easy part of the development.
Difficult part is the management of map items on Google map. Currently Google maps API
supports marker adding, drawing line, multiline, polygons, circles. Before using API, an
important thing to be known that an API key is needed to use maps API on your own
application. API key can be obtained from official Google maps web site (URL 9).
4.6.2 User Interface
In this part, example user interfaces from developed Android application are given.
Android software development kit includes several rich user interface widgets and tools
(URL 2). Some widgets are designed such as dialog, popups and option menus by using
this development kit.
Developed native android application is a map-based application. It means a map view
covers all view area and user can interact with items on the map. Figure 40 shows the
application main view. Google map is used as base map layer in our study. On this view,
there is an overlay view. This view has a zoom control widget on the bottom and center of
screen, a locate button at left top of the screen and finally a satellite icon at right top of the
screen. Zoom control buttons can increase or decrease scale of map according to pressing
zoom in and zoom out. Locate button makes map center position to user device position
provided by Global Positioning System (GPS) sensor on device. Satellite icon can change
the map type. Currently two map types as standard, satellite modes can be supported in our
application.

51
In Figure 40, a blue dot point in the screen indicates location of user on the map. In
addition, a menu can be seen when a user presses the android menu button. This menu is
showed in Figure 40. Menu tooltip includes a layer button and a server settings button.
Figure 40 Application main view, (left) Main menu items (right)
When pressing the layer button a dialog, which lists layers info is shown. In the layer list,
items can be selected or unselected according to user interaction. Layer selection dialog is
depicted in Figure 41. If user clicks the server settings button, a page with a text field is
appeared. In this screen, server address should be set to make connection established
between application and server.
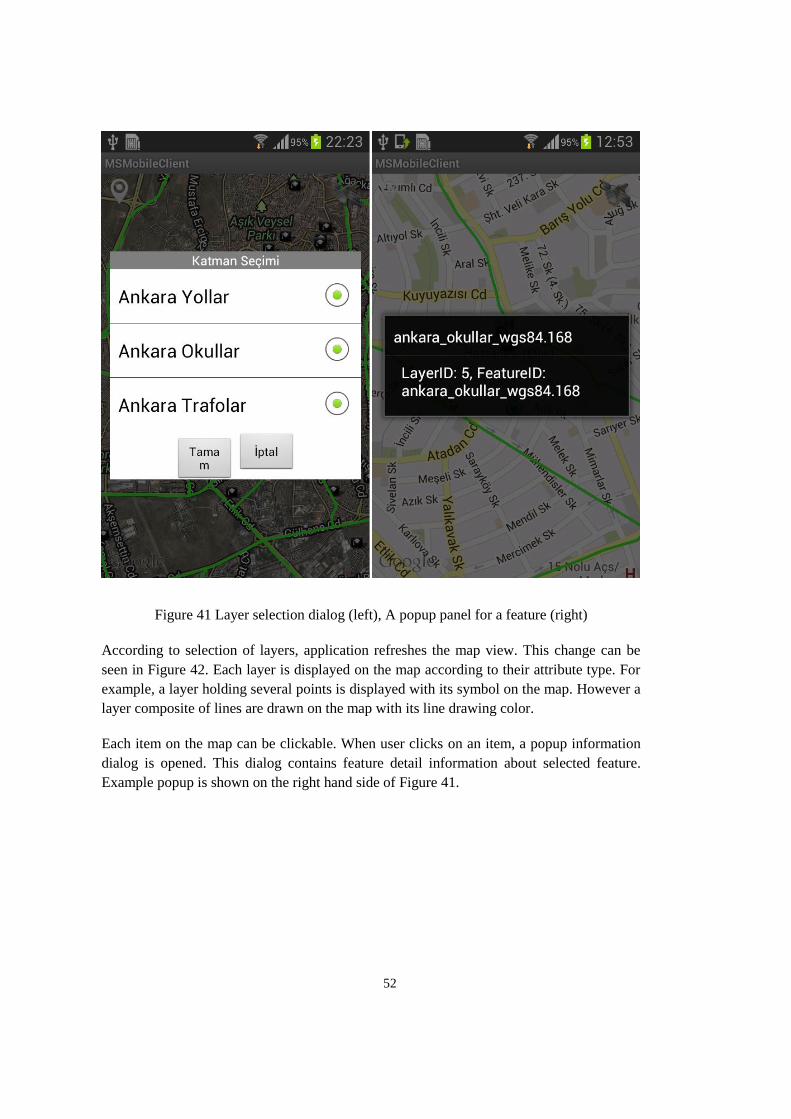
52
Figure 41 Layer selection dialog (left), A popup panel for a feature (right)
According to selection of layers, application refreshes the map view. This change can be
seen in Figure 42. Each layer is displayed on the map according to their attribute type. For
example, a layer holding several points is displayed with its symbol on the map. However a
layer composite of lines are drawn on the map with its line drawing color.
Each item on the map can be clickable. When user clicks on an item, a popup information
dialog is opened. This dialog contains feature detail information about selected feature.
Example popup is shown on the right hand side of Figure 41.
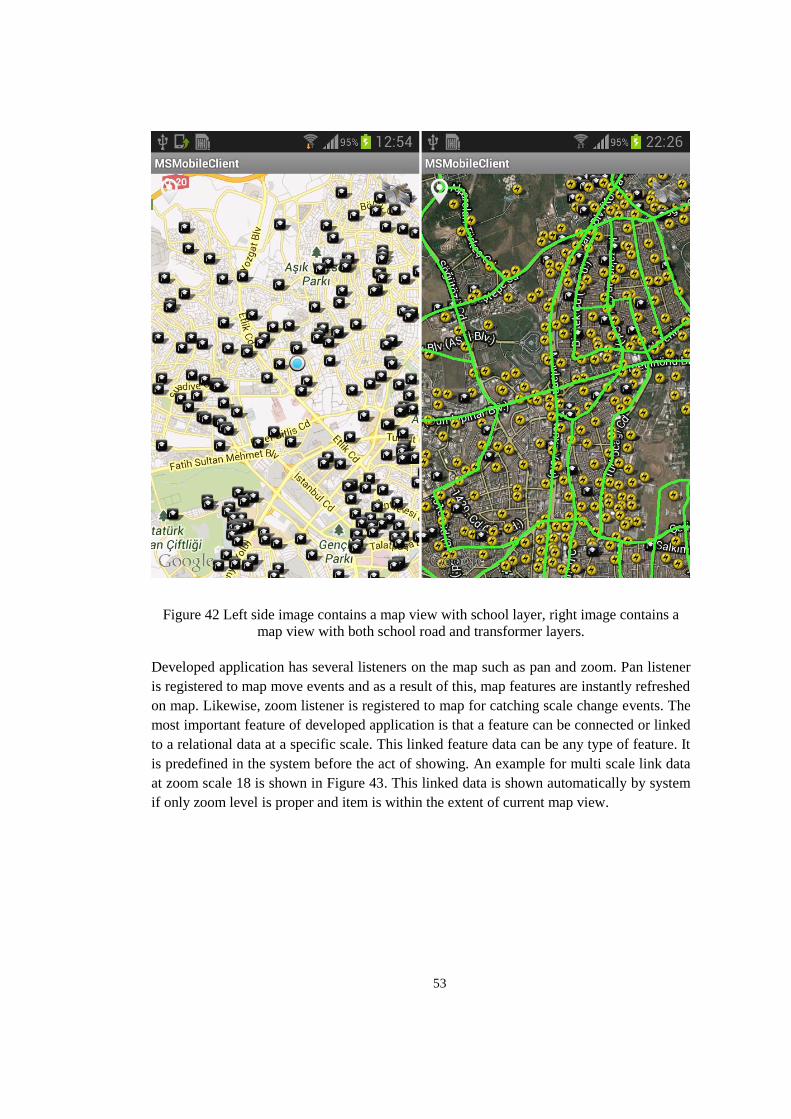
53
Figure 42 Left side image contains a map view with school layer, right image contains a
map view with both school road and transformer layers.
Developed application has several listeners on the map such as pan and zoom. Pan listener
is registered to map move events and as a result of this, map features are instantly refreshed
on map. Likewise, zoom listener is registered to map for catching scale change events. The
most important feature of developed application is that a feature can be connected or linked
to a relational data at a specific scale. This linked feature data can be any type of feature. It
is predefined in the system before the act of showing. An example for multi scale link data
at zoom scale 18 is shown in Figure 43. This linked data is shown automatically by system
if only zoom level is proper and item is within the extent of current map view.
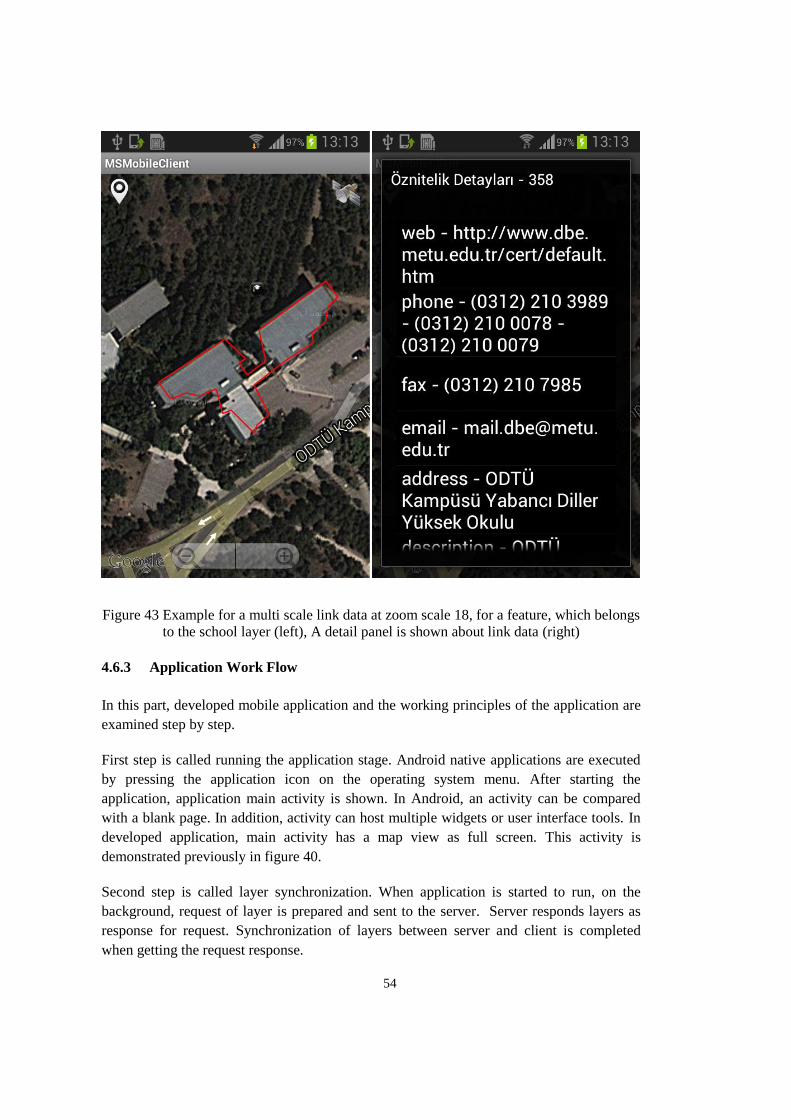
54
Figure 43 Example for a multi scale link data at zoom scale 18, for a feature, which belongs
to the school layer (left), A detail panel is shown about link data (right)
4.6.3 Application Work Flow
In this part, developed mobile application and the working principles of the application are
examined step by step.
First step is called running the application stage. Android native applications are executed
by pressing the application icon on the operating system menu. After starting the
application, application main activity is shown. In Android, an activity can be compared
with a blank page. In addition, activity can host multiple widgets or user interface tools. In
developed application, main activity has a map view as full screen. This activity is
demonstrated previously in figure 40.
Second step is called layer synchronization. When application is started to run, on the
background, request of layer is prepared and sent to the server. Server responds layers as
response for request. Synchronization of layers between server and client is completed
when getting the request response.

55
Third step is about the event listening mechanism. Current event listening has capability of
catching two different kinds of events. First of them is pan event. It is occurred when map
moves. Second is called zoom change event. When any type of event occurs, application
controls the current map bounds with each layer’s bounds. If any layer’s range is within the
current map range, application prepares feature request for the layer that is in bound.
Feature request with bound properties is shown in Table 5. After Server responds,
application refreshes map view with received features. A map view with both school layer
and road layer as an example are depicted in Figure 42.
Feature request using map bound parameters can get a list that contains identifier of
features. After getting the list of identifiers, for each feature a feature detail request is
prepared to get detail of feature. Request properties for getting feature detail are shown in
Table 3.
Application refreshes map items when any event occurs on the map. Third step and fourth
step are repeated according to refresh the process. In addition, there is an extraordinary
task. This task observes any map scale changes. If change is observed, multi scale link data
is requested from server for each feature in the current map bounds. Multi scale data
request properties are shown in Table 7. After getting the multi scale link data, this data is
represented on the map automatically. Figure 43 can be given an example of this task. This
figure demonstrates that a feature, which is element of school layer, is represented by layer
symbol and zoom level at 18 on the map. If map zoom level can be changed from eighteen
to twenty, then application queries linked detail data for zoom level value twenty from
server. If any linked data is found then application receives queried data and represents on
the map.
4.7 Summary of Implementation
To sum up the system properties, a feature can have different geographical representations.
These representations possibly have type of point, polygon, multi polygon, line or multi
line etc. Implemented server side and mobile application support multiple representation of
single feature. In Figure 44, a crossroad can be seen as named “real representation” in the
real world. Each representation can have its geometric type and representation type of
feature depending on development requirements.
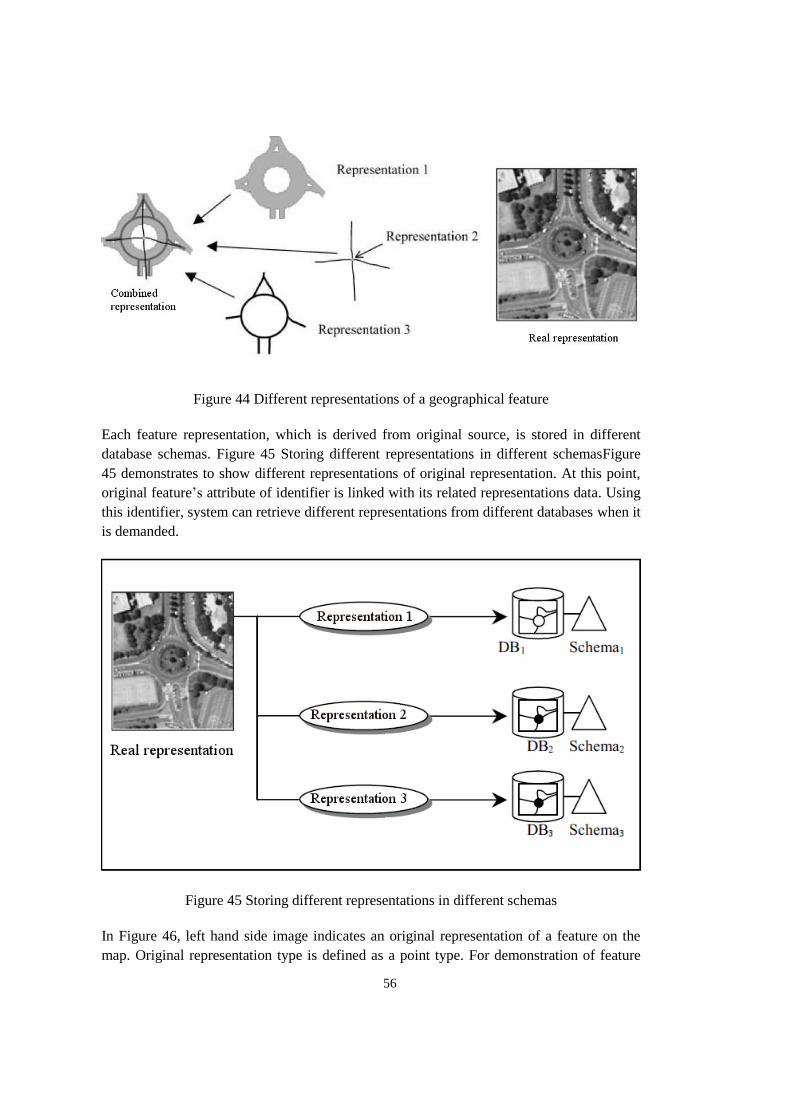
56
Figure 44 Different representations of a geographical feature
Each feature representation, which is derived from original source, is stored in different
database schemas. Figure 45 Storing different representations in different schemasFigure
45 demonstrates to show different representations of original representation. At this point,
original feature’s attribute of identifier is linked with its related representations data. Using
this identifier, system can retrieve different representations from different databases when it
is demanded.
Figure 45 Storing different representations in different schemas
In Figure 46, left hand side image indicates an original representation of a feature on the
map. Original representation type is defined as a point type. For demonstration of feature
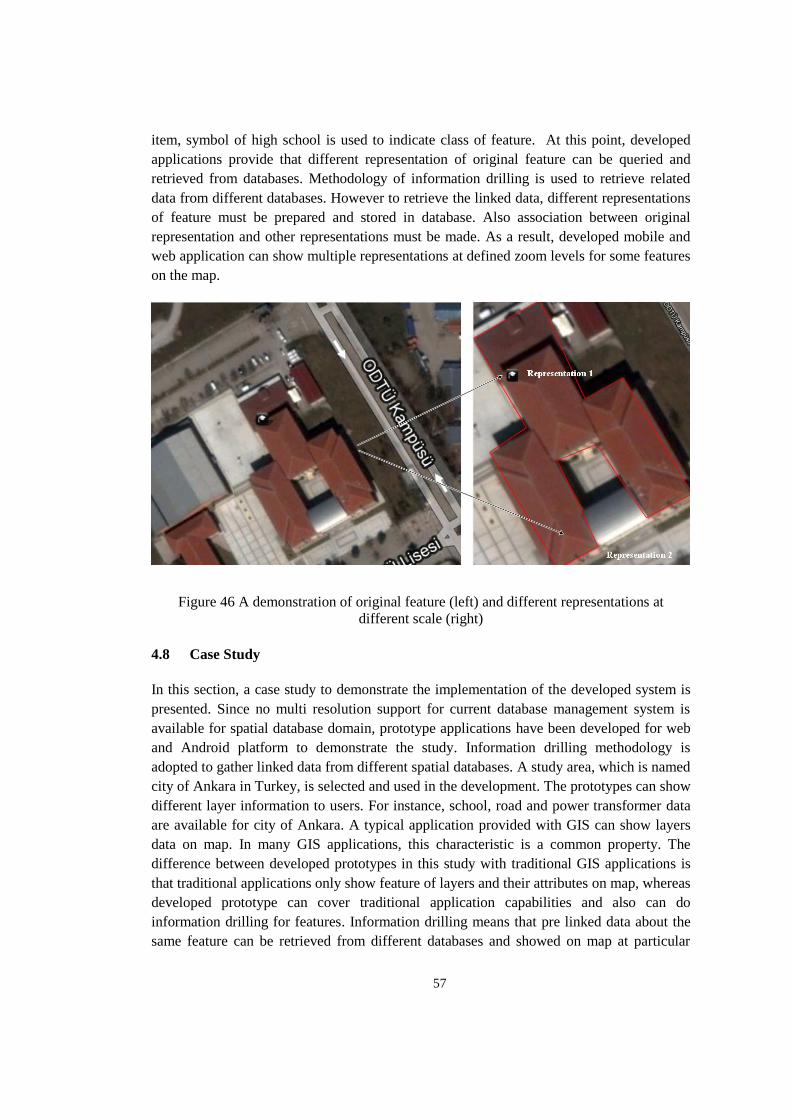
57
item, symbol of high school is used to indicate class of feature. At this point, developed
applications provide that different representation of original feature can be queried and
retrieved from databases. Methodology of information drilling is used to retrieve related
data from different databases. However to retrieve the linked data, different representations
of feature must be prepared and stored in database. Also association between original
representation and other representations must be made. As a result, developed mobile and
web application can show multiple representations at defined zoom levels for some features
on the map.
Figure 46 A demonstration of original feature (left) and different representations at
different scale (right)
4.8 Case Study
In this section, a case study to demonstrate the implementation of the developed system is
presented. Since no multi resolution support for current database management system is
available for spatial database domain, prototype applications have been developed for web
and Android platform to demonstrate the study. Information drilling methodology is
adopted to gather linked data from different spatial databases. A study area, which is named
city of Ankara in Turkey, is selected and used in the development. The prototypes can show
different layer information to users. For instance, school, road and power transformer data
are available for city of Ankara. A typical application provided with GIS can show layers
data on map. In many GIS applications, this characteristic is a common property. The
difference between developed prototypes in this study with traditional GIS applications is
that traditional applications only show feature of layers and their attributes on map, whereas
developed prototype can cover traditional application capabilities and also can do
information drilling for features. Information drilling means that pre linked data about the
same feature can be retrieved from different databases and showed on map at particular
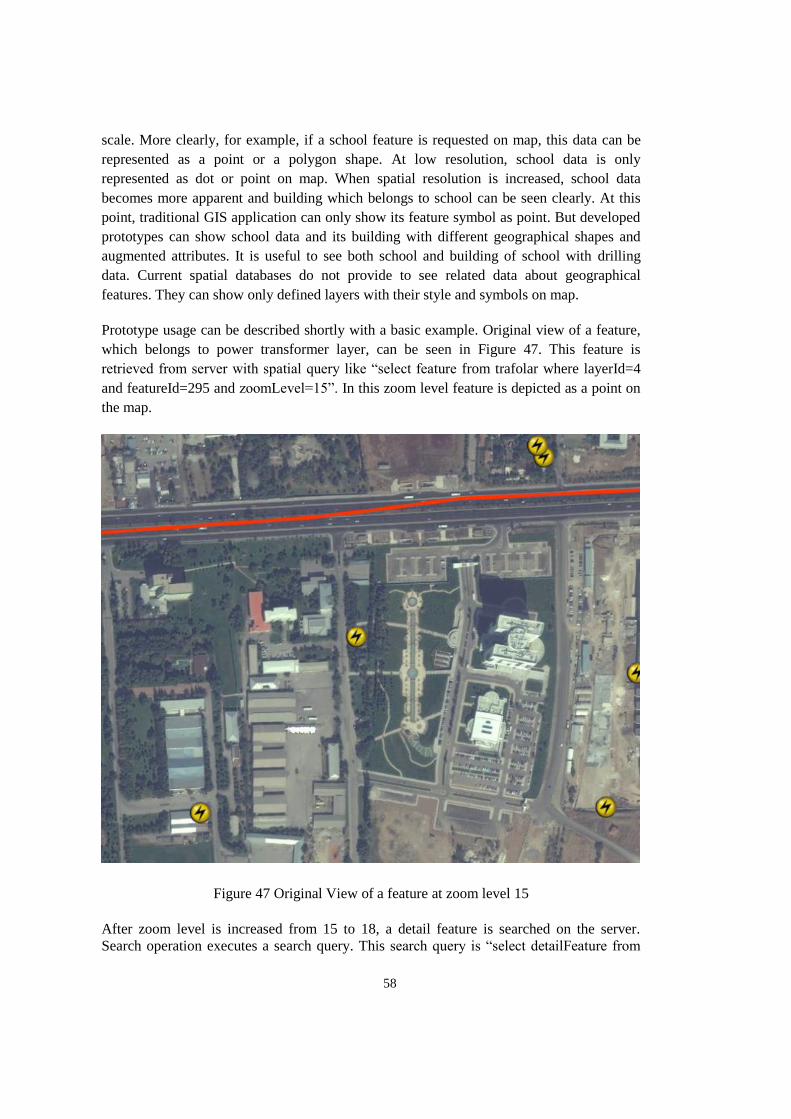
58
scale. More clearly, for example, if a school feature is requested on map, this data can be
represented as a point or a polygon shape. At low resolution, school data is only
represented as dot or point on map. When spatial resolution is increased, school data
becomes more apparent and building which belongs to school can be seen clearly. At this
point, traditional GIS application can only show its feature symbol as point. But developed
prototypes can show school data and its building with different geographical shapes and
augmented attributes. It is useful to see both school and building of school with drilling
data. Current spatial databases do not provide to see related data about geographical
features. They can show only defined layers with their style and symbols on map.
Prototype usage can be described shortly with a basic example. Original view of a feature,
which belongs to power transformer layer, can be seen in Figure 47. This feature is
retrieved from server with spatial query like “select feature from trafolar where layerId=4
and featureId=295 and zoomLevel=15”. In this zoom level feature is depicted as a point on
the map.
Figure 47 Original View of a feature at zoom level 15
After zoom level is increased from 15 to 18, a detail feature is searched on the server.
Search operation executes a search query. This search query is “select detailFeature from

59
multiResolutionDB where layerId=4 and featureId=295 and zoomLevel=18”. After getting the search result, detail feature is drawn on the map as in Figure 48. Also detail feature is
presented as polygon shape on the map. This feature has some extra attributes about
original feature. Extra attributes can be depicted in popup view in Figure 48.
Figure 48 Detail view of feature at zoom level 18
In the future, developed prototype can be enhanced with different data sources or providers.
Current system only supports data for city of Ankara. Also optimization is needed for some
situations for prototypes. For example at low resolution, map boundary of map view covers
a wide area. This means that the number of features brought is quite crowd. This causes
decreasing in render performance in the application and usability of the application is
affected obviously.
4.9 Areas of Use
Navigation system is one of the most popular applications for small computers like mobile
devices and tablets. However, the limitations of small displays enforce the development of

60
intelligent methods for efficiently communicating spatial information. In a navigation
application, visualizing a map with several thousands of map items possibly leads a display
problem in mobile devices. Because of that, mobile devices have limited capacity and
display size.
Having the possibility to access different levels of spatial objects using the MRDB can
opens the way for new visualization alternatives. For example, in a low resolution,
navigation applications show hundreds of spatial objects in map. This situation leads to
confusion in the small screens. Using MRDB, These hundreds of spatial objects can be
grouped into one spatial object. When higher resolution is demanded, grouped object is
separated into different objects by gathering link information between low resolution and
high-resolution data.
61
CHAPTER 5
CONCLUSIONS AND RECOMMENDATIONS
Multi resolution or multi representation database stores and links the same geographical
object or phenomena at different levels of precision, accuracy and resolution. Unfortunately
current spatial database management systems do not have multi resolution and multi
representation support. MRDB concept still is an open problem in GIS domain. There are
several approaches of creating multi scale databases. Research projects aim real-time
generalization methodology and after the generalization process an automatic linking
process is covered to support MRDB. Information drilling methodology is another
demonstration in MRDB concept. Drilling provides linking different spatial databases and
generates an augmented data for geographical objects in MRDB applications.
All developed prototyped applications in this study are created using open source libraries.
Open source libraries are used because, in open source development, everyone collaborates,
information, which is used in development are shared with everyone who developed
software and there is no additional cost needed during the development. These conditions
have leaded us to develop prototype applications by using open source frameworks or
libraries.
City of Ankara is selected for test area. This area contains layer information such as roads,
schools, districts and power transformers. In the future, the data used in prototype
application can be expanded for different countries or areas. Developed prototype can be on
different data.
Resolution based feature linking is implemented for this study. This means that each feature
can have multiple related features at specific resolution level in spatial database. Currently
our system can give multiple links for a feature at some scale. We did not implement map
generalization techniques. Because the map generalization is not our focusing task and map
generating for specific scale is not within the scope of this study. Our motivation is to make
information drilling for specific features on the map. After the drilling, feature content can
be augmented with more detailed information.
In GIS, navigation systems are widely used. A navigation system provides getting location
and time information in the world. The most common problem in Navigation Systems is
that sometimes necessity of rendering too many features at the same time on the map occur
a performance problem. In lower resolutions, usually number of features rendered is too
much. This problem may be solved with usage of MRDB concept. The data structure in

62
terms of MRDB can easily allow integrating different representations of the data in
different resolutions. If MRDB is used in a navigation system at lower resolution, rather to
have all data shown, only generalized version of data are shown. Generalized data are
created by using links between multi representation objects in different resolutions in
MRDB structure.
The developed system can be also used for organizations dealing with similar data but
storing them in different way and scale in their own databases. With the help of information
drilling, it can be possible to retrieve detailed information, which is not available in a
coarse representation without integrating databases.
A mobile client application is implemented in our study. This application is compatible
with devices, which operates in Android operating systems. Android native application is a
map-based application. Application is configured to consume REST services from
middleware. Layer and feature synchronization can be made with using REST service
infrastructure. We select the Android operating system because, the development of
application is free and codes are open source in Android operating system.
The difficulties encountered are as follows; firstly controlling of large data sets is hard.
Also updating object status in MRDB structures is a non-trivial task. Association update
operation requires much effort and it is very important to keep right link connection
between features. Mismatch of map projection of different data sets is a problem also,
which is encountered. To solve the problem, data sets are prepared on common map
projection. Another problem is about the usage performance of prototype system. When
huge amount of features are rendered on map, there is a bit slowness and hesitation on flow
of system. To overcome this issue, feature-clustering algorithms should be analyzed and
implemented. Finally, making connection between separated spatial databases is not an
easy task. Manuel linking task for feature interconnection are used. However this
methodology is difficult for large datasets. In the future, it should be changed from manual
linking to automatic linking procedure.
To see the extra information using information drilling methodology for features by the
users can be considered as the main benefit of the study. With the developed system non-
limited feature attributes access can be made. That means information, which the user can
get, is not limited to the attributes stored with a certain feature. Because of the links
between the objects in the database, related information can be accessed directly from the
feature information stored in different databases.
To sum up, MRDB concept has not been adequately considered in the past to improve the
performance of spatial data management and query processing. According to this
deficiency, to make support of MRDB usage: Information drilling on spatial objects,
association between multiple spatial databases and on demand linked data retrieval for
features at the specific scale are developed.
63
REFERENCES
WEB REFERENCES
URL 1, Acra official web site, from (http://acra.ch/) last accessed on 29/05/13
URL 2, Android developer site, from (http://developer.android.com/sdk/index.html) last
accessed on 01/06/13
URL 3, Apache Log4j site, from (http://logging.apache.org/log4j/1.2/) last accessed on
25/05/13
URL 4, Eclipse IDE site, from (http://www.eclipse.org/) last accessed on 15/05/13
URL 5, from (http://gitta.info/Generalisati/en/html/GenProcedure_learningObject7.html)
last accessed on 25/05/13
URL 6, Geoserver official site, from (http://geoserver.org/display/GEOS/Welcome) last
accessed on 28/05/13
URL 7, Geotools site, from (http://docs.geotools.org/) last accessed on 29/05/13
URL 8, GiMoDig project site, from (http://gimodig.fgi.fi/summary.php.html) last accessed
on 25/05/13
URL 9, from (http://developer.android.com/google/play-services/maps.html) last accessed
on 22/04/13
URL 10, Gson library site, from (https://code.google.com/p/google-gson/) last accessed on
01/06/13
URL 11, Hibernate spatial site, from (http://www.hibernatespatial.org/) last accessed on
29/05/13
URL 12, Hibernate site, from (http://www.hibernate.org/) last accessed on 29/05/13
URL 13, JQuery Official library site, from (https://jquery.org/) last accessed on 21/05/13
URL 14, Maven site, from (http://maven.apache.org/index.html) last accessed on 19/03/13
URL 15, Openlayers site, from (http://openlayers.org/) last accessed on 22/05/13
URL 16, PostgreSQL site, from (http://www.postgresql.org/about/) last accessed on
28/05/13

64
URL 17, from (http://searchsoa.techtarget.com/definition/REST) last accessed on 14/05/13
URL 18, Spring official site, from (http://www.springsource.org/) last accessed on 25/05/13
URL 19, from (http://upload.wikimedia.org/wikipedia/commons/c/c9/Client-server-
model.svg) last accessed on 22/04/13
URL 20, from (http://www.codeproject.com/Articles/22769/Introduction-to-Object-
Oriented-Programming-Concep) last accessed on 20/04/13
URL 21, from (http://www3.ntu.edu.sg/home/programming/JavaNativeInterface.html) last
accessed on 24/04/13
URL 22, from (http://geoportal.icimod.org/TrainingandEducation/GISforBeginners/p1ch8/)
last accessed on 17/07/13
URL 23, from (http://docs.oracle.com/javaee/1.3/tutorial/doc/Overview4.html) last
accessed on 10/07/13
URL 24, from (http://www.developersbook.com/spring/spring-tutorials/spring-
tutorials.php) last accessed on 22/05/13
URL 25, from (http://di-side.com/di-side/services/web-solutions/rest-webservice-symfony/)
last accessed on 20/05/13
URL 26, from (http://i.stack.imgur.com/Vjx6y.png) last accessed on 12/06/13
URL 27, from (http://www.vividsolutions.com/jts/discussion.htm) last accessed on
19/04/13
URL 28, from (http://gitta.info/Generalisati/en/html/GenProcedure_learningObject5.html)
last accessed on 21/07/13
URL 29, from (http://blog.simcrest.com/what-is-3-tier-architecture-and-why-do-you-need-
it/) last accessed on 01/08/13
OFFLINE REFERENCES
Devogele, T., Trevisan, J., and Raynal, L., Building a Multiscale Database with Scale-
Transition Relationships, Advances in GIS Resarch 2, Delft, 1996
Gabay, Y., and Sester, M., Forming and utilizing communication between two spatial
representations at different scales, Geoinformatica, 2002
Hampe, M., Heinrich, K., and Sester, M., MRDB Applications for Data Revision and Real-
Time Generalisation, University of Hannover, Germany, 2003
65
Hampe, M., and Sester, M., Generating and Using A Multi-Representation Database For
Mobile Applications, ICA Workshop on Generalisation and Multiple Representation,
Leicester, 2004
Jenks, F., Lines, Computers and Human Frailties, Annals of the Association of American
Geographers, Vol 71, 1981
Shea, S., and McMaster, R., Cartographic Generalization In A Digital Environment When
And How To Generalize, New York, 1989
Nickerson, T., Bradford, G., Herbert, R., and Freeman, K., Development of a Rule-based
System Automatic Map Generalization, Second International Symposium on Spatial Data
Handling, Seattle, Washington, 1986
McMaster, R., and Veregin, H., Visualizing cartographic generalization, University of
Minnesota, Department of Geography, 2010
Sester, M., Optimizing Approaches for Generalization and Data Abstraction, International
Journal of Geographic Information Science, 2004
Sester, M., Generalization Based on Least Squares Adjustment, Amsterdam: International
Archives of Photogrammetry and Remote Sensing, 2000
Zour, S., and Jones, C., A Multi-Representation Spatial Data Model, Cardiff, 2003.
Sheth, A., and Larson, J., Federated Database Systems for Managing Distributed,
Heterogenous, and Autonomous Databases, ACM Computing Surveys, 1990
Spaccapietra, S., Parent, C., and Vangenot, C., GIS Databases: From Multiscale to
MultiRepresentation, Swiss Federal Institute Of Technology Lausanne, Switzerland, 2000
Stern, B., Hurni, L., Werner, M., and Wiesmann, S., Generalisation of Map Data,
Geographic Information Technology Training Alliance, 2012
Töpfer, F., and Pillewizer, W., The Principles of Selection, A Means of Cartographic
Generalisation, Cartographic Journal, 1966
Zhou, X., Prasher, S., Sun, S., and Xu, K., Multiresolution Spatial Databases: Making Web-
based Spatial Applications Faster, School of Information Technology and Electrical
Engineering University of Queensland, 2004