multi-select securities puerto rico fund -...
TRANSCRIPT
ab
Multi-Select SecuritiesPuerto Rico Fund
A Puerto Rico mutual fund that provides you diversificationoutside Puerto Rico, professional management, investmentflexibility and tax advantages.
Multi-Select Securities Puerto Rico Fund from UBS Financial ServicesIncorporated of Puerto Rico is an open-end fund which invests in equities with a unique combination of features and characteristics.
UBS Financial Services Incorporated of Puerto Rico

Building a Secure Financial Foundation
Success in pursuing your futureinvestment goals o�en relies onthe strength of the foundationyou build and the investmentdecisions you make today.
In order to develop a well-designed financial plan,today’s investors are faced with the daunting task of sorting through a myriad of investment options. In addition, Puerto Rico investors may wish to take advantage of the tax benefits available to them through a Puerto Rico investment. Finding the appropriate blend of investments that can helpyou pursue these goals can be overwhelming. Theseare just a few of the reasons why the Multi-SelectSecurities Puerto Rico Fund was developed.
This brochure must be accompanied or preceded by a current Prospectus. The Prospectus contains detailsabout risks, charges and expenses and should be read carefully before you invest or send money.
Fund Units are being offered for sale exclusively toPuerto Rico residents. The Fund is not a registeredinvestment company under the U.S. InvestmentCompany Act of 1940, and investors in the Fund do not benefit from the regulatory scheme provided by the statute.
The Multi-Select Securities Puerto Rico Fund is anopen-end fund registered under the Puerto RicoInvestment Companies Act that currently consists of 11 separate portfolios, each dedicated to investingin a specific equity investment style. These portfolioscan be combined to reflect your specific goals andobjectives.1
Developed exclusively for residents of Puerto Rico,each portfolio of the Fund will invest up to 80% of itsassets in U.S. equities, exchange traded funds (ETFs),or American Depository Receipts (ADRs)2 ofinternational companies (the “Equity Portion”).
According to Puerto Rico law, each portfolio alsomust invest at least 20% of its total assets in PuertoRico taxable securities (the “Puerto Rico SecuritiesPortion”). Each portfolio will invest the Puerto RicoSecurities Portion mostly in cash equivalents and mayinvest a portion of its Equity Portion in stock indexfutures contracts (“Futures Contracts”) which reflectthe investment strategy of the relevant portfolio. Byinvesting in Futures Contracts, the Investment Adviser(UBS Asset Managers of Puerto Rico, a division of UBS Trust Company of Puerto Rico)3 is attempting toachieve a risk and return profile that approximatesthat of investing the assets of the Puerto RicoSecurities Portion in each Portfolio’s benchmark index.The Investment Adviser selects a benchmark index foreach Portfolio according to its individual investmentstyle, for example, the S&P 500 Index, Russell 1000Growth Index, Russell 1000 Value Index, Russell MidCap Index, Russell 2000 Index, and MSCI EAFE Index.
The Multi-Select Securities Puerto Rico Fundprovides Puerto Rico investors with: • Exposure to U.S. and International Equities• Investment Flexibility• Professional Management• Potential Tax Advantages
1
A Different Type of Mutual Fund
1 The Fund may be appropriate for long-term investors seeking long-term growth of capital. No assurance can be given that any of the portfolios willachieve this investment objective. The Fund should not be used as a vehicle for trading purposes. There can be no guarantee that the performanceof any of the Fund’s portfolios will be positive for any period of time. The Fund will be subject to investment risk, including, but not limited to, risksof investing in equity and fixed income securities, Puerto Rico securities, small and mid cap companies, foreign securities, and derivatives. The Fundis also subject to the risks associated with manager selection, manager oversight, conflicts of interest, and portfolio non-diversification. The overallsuccess of your investment in the Fund also may depend on your ability to choose successfully from among the portfolios.
2 International portfolios invest in American Depository Receipts. An ADR is a receipt, typically issued by a U.S. bank, evidencing ownership of an underlying foreign security. ADRs trade on the U.S. stock exchanges and are quoted in U.S. dollars.
3 UBS Trust Company of Puerto Rico is an affiliate of UBS Financial Services Incorporated of Puerto Rico.
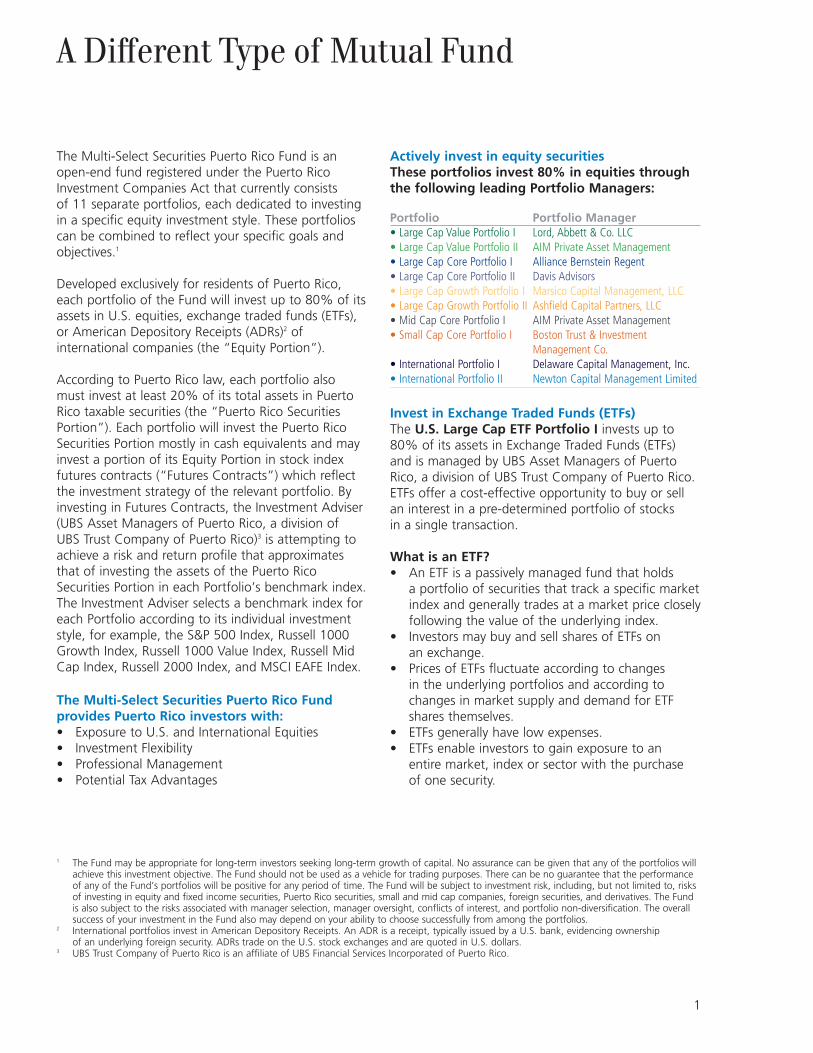
Actively invest in equity securitiesThese portfolios invest 80% in equities throughthe following leading Portfolio Managers:
Portfolio Portfolio Manager• Large Cap Value Portfolio I Lord, Abbett & Co. LLC• Large Cap Value Portfolio II AIM Private Asset Management• Large Cap Core Portfolio I Alliance Bernstein Regent• Large Cap Core Portfolio II Davis Advisors• Large Cap Growth Portfolio I Marsico Capital Management, LLC• Large Cap Growth Portfolio II Ashfield Capital Partners, LLC• Mid Cap Core Portfolio I AIM Private Asset Management• Small Cap Core Portfolio I Boston Trust & Investment
Management Co.• International Portfolio I Delaware Capital Management, Inc.• International Portfolio II Newton Capital Management Limited
Invest in Exchange Traded Funds (ETFs)The U.S. Large Cap ETF Portfolio I invests up to80% of its assets in Exchange Traded Funds (ETFs)and is managed by UBS Asset Managers of PuertoRico, a division of UBS Trust Company of Puerto Rico.ETFs offer a cost-effective opportunity to buy or sellan interest in a pre-determined portfolio of stocks in a single transaction.
What is an ETF?• An ETF is a passively managed fund that holds
a portfolio of securities that track a specific marketindex and generally trades at a market price closelyfollowing the value of the underlying index.
• Investors may buy and sell shares of ETFs on an exchange.
• Prices of ETFs fluctuate according to changes in the underlying portfolios and according tochanges in market supply and demand for ETFshares themselves.
• ETFs generally have low expenses.• ETFs enable investors to gain exposure to an
entire market, index or sector with the purchase of one security.
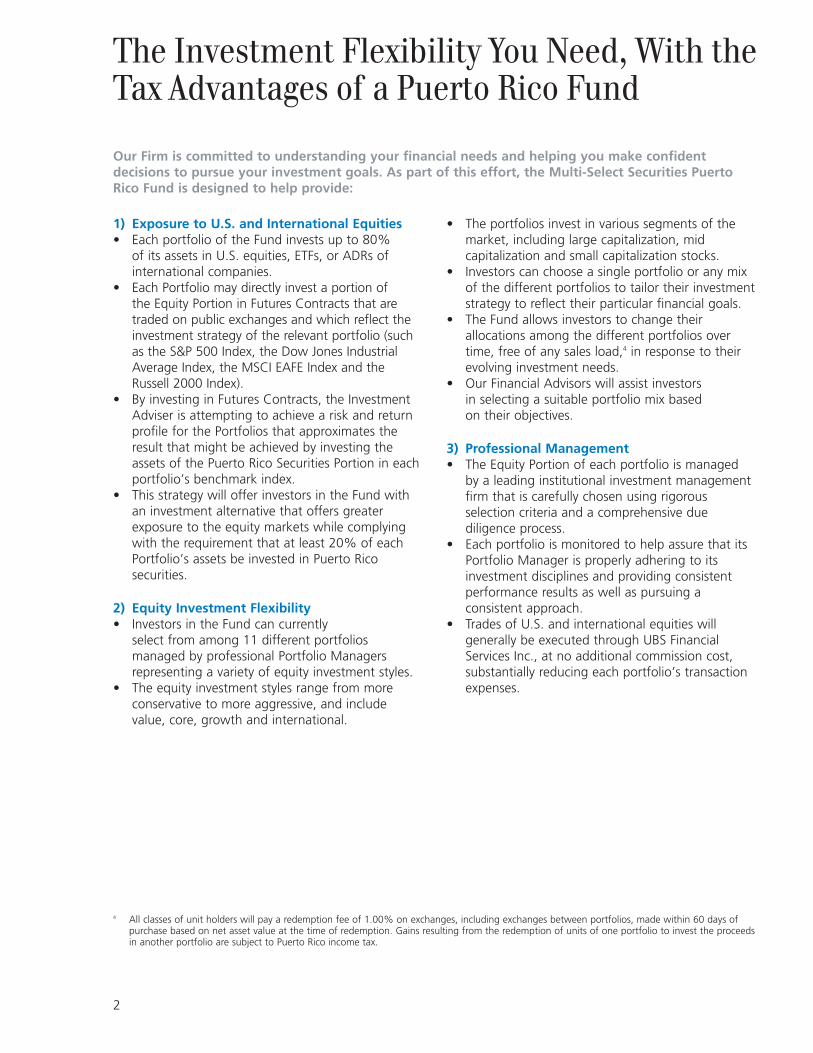
1) Exposure to U.S. and International Equities• Each portfolio of the Fund invests up to 80%
of its assets in U.S. equities, ETFs, or ADRs ofinternational companies.
• Each Portfolio may directly invest a portion of the Equity Portion in Futures Contracts that aretraded on public exchanges and which reflect theinvestment strategy of the relevant portfolio (suchas the S&P 500 Index, the Dow Jones IndustrialAverage Index, the MSCI EAFE Index and theRussell 2000 Index).
• By investing in Futures Contracts, the InvestmentAdviser is attempting to achieve a risk and returnprofile for the Portfolios that approximates theresult that might be achieved by investing theassets of the Puerto Rico Securities Portion in eachportfolio’s benchmark index.
• This strategy will offer investors in the Fund withan investment alternative that offers greaterexposure to the equity markets while complyingwith the requirement that at least 20% of eachPortfolio’s assets be invested in Puerto Ricosecurities.
2) Equity Investment Flexibility• Investors in the Fund can currently
select from among 11 different portfoliosmanaged by professional Portfolio Managersrepresenting a variety of equity investment styles.
• The equity investment styles range from moreconservative to more aggressive, and includevalue, core, growth and international.
• The portfolios invest in various segments of themarket, including large capitalization, midcapitalization and small capitalization stocks.
• Investors can choose a single portfolio or any mixof the different portfolios to tailor their investmentstrategy to reflect their particular financial goals.
• The Fund allows investors to change theirallocations among the different portfolios overtime, free of any sales load,4 in response to theirevolving investment needs.
• Our Financial Advisors will assist investors in selecting a suitable portfolio mix based on their objectives.
3) Professional Management• The Equity Portion of each portfolio is managed
by a leading institutional investment managementfirm that is carefully chosen using rigorousselection criteria and a comprehensive duediligence process.
• Each portfolio is monitored to help assure that itsPortfolio Manager is properly adhering to itsinvestment disciplines and providing consistentperformance results as well as pursuing aconsistent approach.
• Trades of U.S. and international equities willgenerally be executed through UBS FinancialServices Inc., at no additional commission cost,substantially reducing each portfolio’s transactionexpenses.
Our Firm is committed to understanding your financial needs and helping you make confidentdecisions to pursue your investment goals. As part of this effort, the Multi-Select Securities PuertoRico Fund is designed to help provide:
2
The Investment Flexibility You Need, With theTax Advantages of a Puerto Rico Fund
4 All classes of unit holders will pay a redemption fee of 1.00% on exchanges, including exchanges between portfolios, made within 60 days ofpurchase based on net asset value at the time of redemption. Gains resulting from the redemption of units of one portfolio to invest the proceedsin another portfolio are subject to Puerto Rico income tax.
3
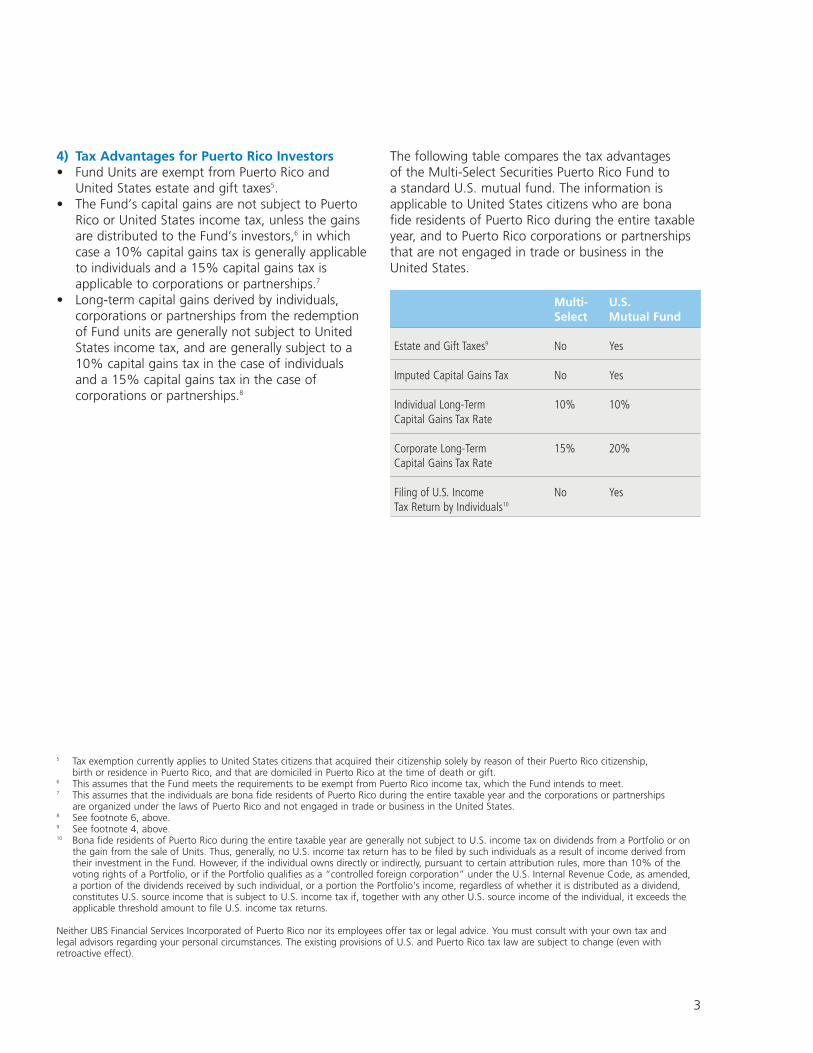
4) Tax Advantages for Puerto Rico Investors• Fund Units are exempt from Puerto Rico and
United States estate and gift taxes5.• The Fund’s capital gains are not subject to Puerto
Rico or United States income tax, unless the gainsare distributed to the Fund’s investors,6 in whichcase a 10% capital gains tax is generally applicableto individuals and a 15% capital gains tax isapplicable to corporations or partnerships.7
• Long-term capital gains derived by individuals,corporations or partnerships from the redemptionof Fund units are generally not subject to UnitedStates income tax, and are generally subject to a10% capital gains tax in the case of individualsand a 15% capital gains tax in the case ofcorporations or partnerships.8
The following table compares the tax advantages of the Multi-Select Securities Puerto Rico Fund to a standard U.S. mutual fund. The information isapplicable to United States citizens who are bona fide residents of Puerto Rico during the entire taxableyear, and to Puerto Rico corporations or partnershipsthat are not engaged in trade or business in theUnited States.
Multi- U.S. Select Mutual Fund
Estate and Gift Taxes9 No Yes
Imputed Capital Gains Tax No Yes
Individual Long-Term 10% 10%Capital Gains Tax Rate
Corporate Long-Term 15% 20%Capital Gains Tax Rate
Filing of U.S. Income No YesTax Return by Individuals10
5 Tax exemption currently applies to United States citizens that acquired their citizenship solely by reason of their Puerto Rico citizenship, birth or residence in Puerto Rico, and that are domiciled in Puerto Rico at the time of death or gift.
6 This assumes that the Fund meets the requirements to be exempt from Puerto Rico income tax, which the Fund intends to meet.7 This assumes that the individuals are bona fide residents of Puerto Rico during the entire taxable year and the corporations or partnerships
are organized under the laws of Puerto Rico and not engaged in trade or business in the United States. 8 See footnote 6, above.9 See footnote 4, above.10 Bona fide residents of Puerto Rico during the entire taxable year are generally not subject to U.S. income tax on dividends from a Portfolio or on
the gain from the sale of Units. Thus, generally, no U.S. income tax return has to be filed by such individuals as a result of income derived fromtheir investment in the Fund. However, if the individual owns directly or indirectly, pursuant to certain attribution rules, more than 10% of thevoting rights of a Portfolio, or if the Portfolio qualifies as a “controlled foreign corporation” under the U.S. Internal Revenue Code, as amended, a portion of the dividends received by such individual, or a portion the Portfolio’s income, regardless of whether it is distributed as a dividend,constitutes U.S. source income that is subject to U.S. income tax if, together with any other U.S. source income of the individual, it exceeds theapplicable threshold amount to file U.S. income tax returns.
Neither UBS Financial Services Incorporated of Puerto Rico nor its employees offer tax or legal advice. You must consult with your own tax and legal advisors regarding your personal circumstances. The existing provisions of U.S. and Puerto Rico tax law are subject to change (even withretroactive effect).

No single asset class performs best in all economicenvironments. Therefore, experts suggest that asound investment portfolio should be diversified—that is, invested in a variety of asset classes that have distinct, yet complementary, characteristics.
Balancing Your Goals Versus Your Tolerance for RiskAs you can see in the chart below, in general, overthe long-term, low-risk investments such as T-billstend to achieve lower returns, while higher-riskinvestments, such as common stocks, tend to achieve higher returns.
However, the concept of investment risk takes manyforms. While some investors view risk as the loss ofcapital, others view risk as the possibility of beingunable to meet future financial obligations or the loss of the purchasing power of their assets due toinflation. These investors may be willing to accept ahigher degree of risk in an effort to achieve greaterlong-term returns.
The Need for Diversification—Why Include Stocks in Your Portfolio
4
The big picture: stocks outperform other asset classesGrowth of $10,000 from 1925 – December 31, 2007
Note: $10,000 may not be representative of a typical investment in 1925.
* Source: Ned Davis Research; used with permission. The chart is shown for illustrative purposes only, and is not meant to show the returnsof any particular investment offered by UBS Financial Services Incorporated of Puerto Rico. Stocks represented by Standard & Poor’s (S&P)500 Index, long-term government bonds by 20-year U.S. Treasury bonds, 90-day U.S. Treasury bills and inflation by the Consumer Price Index. TheS&P 500 Index is an unmanaged, weighted index comprising 500 widely held common stocks varying in composition. Returns consist of income,capital appreciation (or depreciation) and currency gains (or losses). Certain markets have experienced significant year-to-year fluctuations andnegative returns from time to time. Stocks are more volatile and subject to greater risks than other asset classes. Indexes are not available for directinvestment. Past performance is not a guarantee of future results.
$100,000,000
$10,000,000
$1,000,000
$100,000
$10,000
$1,000
1925 1930 1935 1940 1945 1950 1955 1960 1965 1970 1975 1980 1985 1990 1995 2000 2005
–– S&P 500 Index $30,770,710
–– U.S. LT Gov’t $790,090*
–– 90-Day U.S. T-bill $224,610
–– U.S. Inflation $117,417*
5
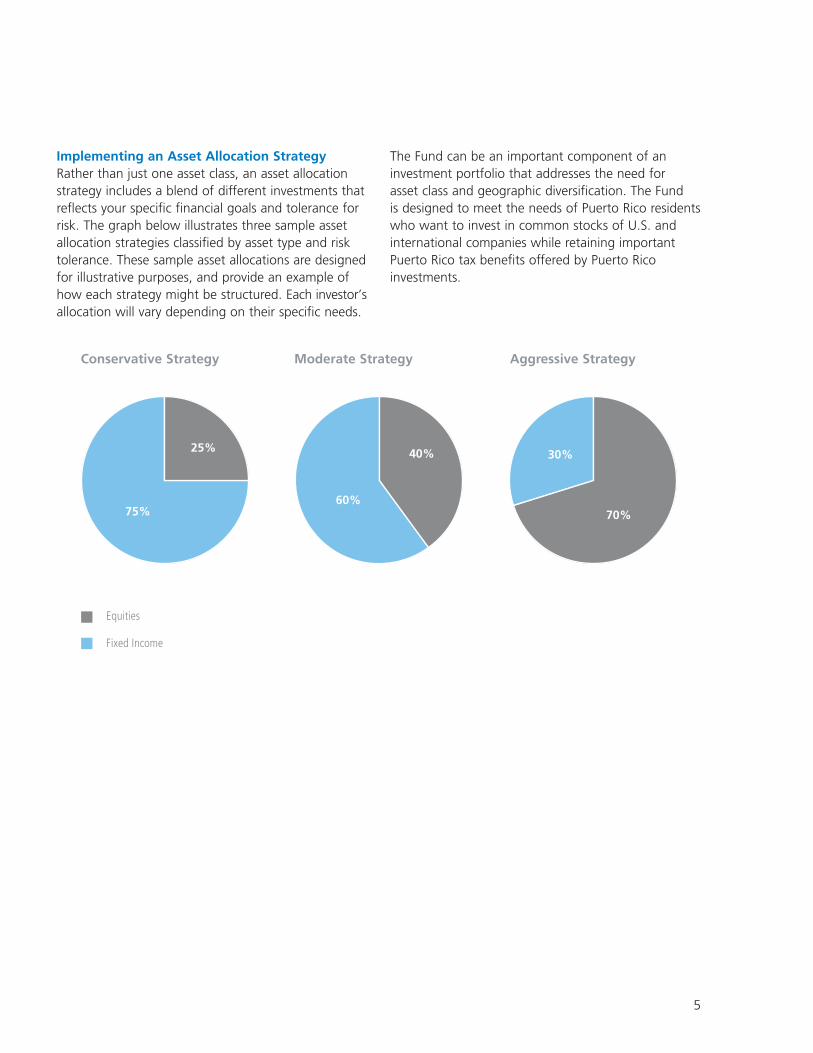
Implementing an Asset Allocation StrategyRather than just one asset class, an asset allocationstrategy includes a blend of different investments thatreflects your specific financial goals and tolerance forrisk. The graph below illustrates three sample assetallocation strategies classified by asset type and risktolerance. These sample asset allocations are designedfor illustrative purposes, and provide an example ofhow each strategy might be structured. Each investor’sallocation will vary depending on their specific needs.
The Fund can be an important component of aninvestment portfolio that addresses the need for asset class and geographic diversification. The Fund is designed to meet the needs of Puerto Rico residentswho want to invest in common stocks of U.S. andinternational companies while retaining importantPuerto Rico tax benefits offered by Puerto Ricoinvestments.
25%
75%
40%
60%
30%
70%
Equities
Fixed Income
Conservative Strategy Moderate Strategy Aggressive Strategy

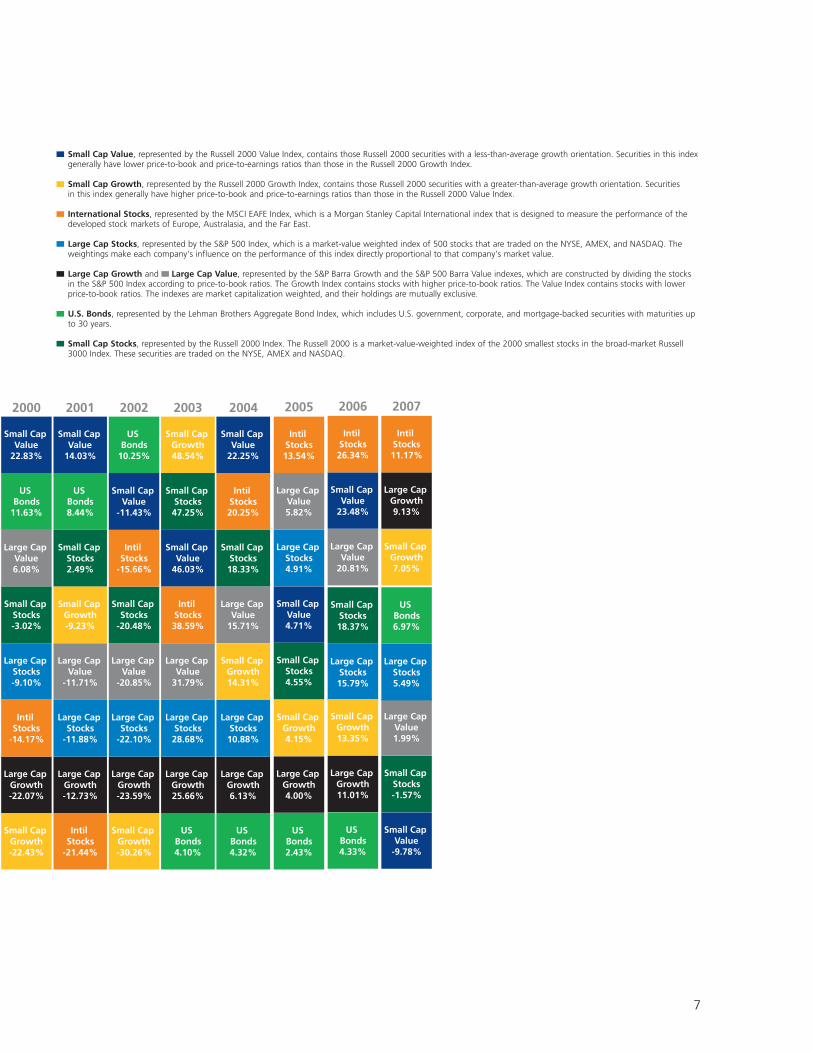
Just as important as diversification among assetclasses is diversification among investment styles. Inthe chart below, each major equity investment style isrepresented by a different color. For each given year,these styles are ranked by return in descending order.As you can see, the table illustrates how oftendifferent equity styles rotate in market leadership overtime. That is why developing a strategy that includesa variety of styles may help you to manage overallinvestment risk while enhancing potential returns.
The Multi-Select Securities Puerto Rico Fund enables you to factor in the interplay between equity investment styles and to counterbalancevarious investments with others as you create your own portfolio mix based on your uniqueinvestment objectives.
Style Diversification
6
Historical Performance of Selected Investment Styles
Source: Data from the Callan Periodic Table. Callan Associates, Inc., 2008. Used with permission.Data as of 12/31/07. For illustrative purposes only. Security indices are unmanaged. They assume reinvestment of distributions and interest paymentsand do not take into account fees, taxes and other charges. Such fees and charges would reduce performance. It is not possible to invest directly inan index. Past performance does not guarantee future results.
1987 19891988 19911990 19931992 19951994 19971996 19991998
Intíl Stocks24.64%
Large Cap Growth36.40%
Small Cap Value
29.47%
Small Cap Growth51.18%
US Bonds8.96%
Intíl Stocks32.57%
Small Cap Value
29.15%
Large Cap Growth38.13%
Intíl Stocks7.78%
Large Cap Growth36.52%
Large Cap Growth23.97%
Small Cap Growth43.09%
Large Cap Growth42.16%
Large Cap Growth6.50%
Large Cap Stocks31.69%
Intíl Stocks28.26%
Small Cap Stocks46.05%
Large Cap Growth0.20%
Small Cap Value
23.86%
Small Cap Stocks18.42%
Large Cap Stocks37.58%
Large Cap Growth3.13%
Large Cap Stocks33.36%
Large Cap Stocks22.96%
Large Cap Growth28.24%
Large Cap Stocks28.58%
Large Cap Stocks5.25%
Large Cap Value
26.13%
Small Cap Stocks24.89%
Small Cap Value
41.70%
Large Cap Stocks-3.11%
Small Cap Stocks18.89%
Large Cap Value
10.52%
Large Cap Value
36.99%
Large Cap Stocks1.52%
Small Cap Value
31.78%
Large Cap Value
22.00%
Intíl Stocks26.96%
Intíl Stocks20.00%
Large Cap Value3.68%
Small Cap Growth20.16%
Large Cap Value
21.67%
Large Cap Growth38.37%
Large Cap Value
-6.85%
Large Cap Value
18.61%
Small Cap Growth7.77%
Small Cap Growth31.04%
Large Cap Value
-0.64%
Large Cap Value
29.98%
Small Cap Value
21.37%
Small Cap Stocks21.26%
Large Cap Value
14.69%
US Bonds2.75%
Small Cap Stocks16.25%
Small Cap Growth20.38%
Large Cap Stocks30.47%
Small Cap Growth-17.42%
Small Cap Growth13.37%
Large Cap Stocks7.62%
Small Cap Stocks28.44%
Small Cap Value
-1.55%
Small Cap Stocks22.36%
Small Cap Stocks16.53%
Large Cap Stocks21.04%
US Bonds8.70%
Small Cap Value
-7.12%
US Bonds
14.53%
Large Cap Stocks16.61%
Large Cap Value
22.56%
Small Cap Stocks
-19.50%
Large Cap Stocks10.08%
US Bonds7.40%
Small Cap Value
25.75%
Small Cap Stocks-1.81%
Small Cap Growth12.93%
Small Cap Growth11.32%
Large Cap Value
12.73%
Small Cap Growth1.23%
Small Cap Stocks-8.76%
Small Cap Value
12.43%
Large Cap Growth11.95%
US Bonds
16.00%
Small Cap Value
-21.77%
US Bonds9.75%
Large Cap Growth5.06%
US Bonds
18.46%
Small Cap Growth-2.44%
US Bonds9.64%
Intíl Stocks6.05%
US Bonds-0.82%
Small Cap Stocks-2.55%
Small Cap Growth-10.48%
Intíl Stocks10.53%
US Bonds7.89%
Intíl Stocks12.14%
Intíl Stocks
-23.45%
Large Cap Growth1.68%
Intíl Stocks
-12.18%
Intíl Stocks11.21%
US Bonds-2.92%
Intíl Stocks1.78%
US Bonds3.64%
Small Cap Value
-1.48%
Small Cap Value
-6.46%
7
200520012000 20032002 2004 2006 2007
US Bonds6.97%
Large Cap Growth9.13%
Small Cap Growth7.05%
Large Cap Value
20.81%
Small Cap Value
23.48%
Small Cap Stocks18.37%
Large Cap Stocks15.79%
Small Cap Value
14.03%
Small Cap Value
22.83%
Small Cap Growth48.54%
US Bonds
10.25%
US Bonds8.44%
US Bonds
11.63%
Small Cap Stocks47.25%
Small Cap Value
-11.43%
Small Cap Stocks2.49%
Large Cap Value6.08%
Small Cap Value
46.03%
Intíl Stocks
-15.66%
Small Cap Growth-9.23%
Small Cap Stocks-3.02%
Intíl Stocks38.59%
Small Cap Stocks
-20.48%
Large Cap Value
-11.71%
Large Cap Stocks-9.10%
Large Cap Value
31.79%
Large Cap Value
-20.85%
Large Cap Stocks
-11.88%
Intíl Stocks
-14.17%
Large Cap Stocks28.68%
Large Cap Stocks
-22.10%
Large Cap Growth-12.73%
Large Cap Growth-22.07%
Large Cap Growth25.66%
Large Cap Growth-23.59%
Intíl Stocks
-21.44%
Small Cap Growth-22.43%
US Bonds4.10%
Small Cap Growth-30.26%
Small Cap Value4.71%
Large Cap Value5.82%
Small Cap Stocks4.55%
Intíl Stocks13.54%
US Bonds2.43%
Large Cap Stocks4.91%
Large Cap Growth4.00%
Small Cap Growth4.15%
Small Cap Value
22.25%
Intíl Stocks20.25%
Small Cap Stocks18.33%
Large Cap Value
15.71%
Small Cap Growth14.31%
Large Cap Stocks10.88%
Large Cap Growth6.13%
US Bonds4.32%
Intíl Stocks26.34%
US Bonds4.33%
Large Cap Growth11.01%
Small Cap Growth13.35%
Large Cap Value1.99%
Small Cap Value
-9.78%
Small Cap Stocks-1.57%
Large Cap Stocks5.49%
Intíl Stocks11.17%
Small Cap Value, represented by the Russell 2000 Value Index, contains those Russell 2000 securities with a less-than-average growth orientation. Securities in this indexgenerally have lower price-to-book and price-to-earnings ratios than those in the Russell 2000 Growth Index.
Small Cap Growth, represented by the Russell 2000 Growth Index, contains those Russell 2000 securities with a greater-than-average growth orientation. Securities in this index generally have higher price-to-book and price-to-earnings ratios than those in the Russell 2000 Value Index.
International Stocks, represented by the MSCI EAFE Index, which is a Morgan Stanley Capital International index that is designed to measure the performance of thedeveloped stock markets of Europe, Australasia, and the Far East.
Large Cap Stocks, represented by the S&P 500 Index, which is a market-value weighted index of 500 stocks that are traded on the NYSE, AMEX, and NASDAQ. Theweightings make each company’s influence on the performance of this index directly proportional to that company’s market value.
Large Cap Growth and Large Cap Value, represented by the S&P Barra Growth and the S&P 500 Barra Value indexes, which are constructed by dividing the stocks in the S&P 500 Index according to price-to-book ratios. The Growth Index contains stocks with higher price-to-book ratios. The Value Index contains stocks with lowerprice-to-book ratios. The indexes are market capitalization weighted, and their holdings are mutually exclusive.
U.S. Bonds, represented by the Lehman Brothers Aggregate Bond Index, which includes U.S. government, corporate, and mortgage-backed securities with maturities upto 30 years.
Small Cap Stocks, represented by the Russell 2000 Index. The Russell 2000 is a market-value-weighted index of the 2000 smallest stocks in the broad-market Russell3000 Index. These securities are traded on the NYSE, AMEX and NASDAQ.

To facilitate the process of creating and implementinga diversified plan, the Fund currently offers 11portfolios that invest in a variety of asset classes andequity investment styles, ranging from conservative toaggressive.
The Fund is designed to help you pursue your long-term financial goals by enabling you to select thecombination of portfolios that best matches yourinvestment goals and tolerance for risk.
Based on your unique objectives, your FinancialAdvisor can help you develop an investment plan that includes a portfolio mix that will work togetherto pursue your long-term goals. The following chartillustrates the styles that will be available through theFund’s current 11 portfolios.
Investment Flexibility—A Variety of Styles
8
Portfolio Equity Investment Styles Range From Conservative to Aggressive
Large Cap Value
Large Cap Core
Mid Cap Core
Large Cap Growth
Small Cap Core
International Equity
Risk
Retu
rn
9
Professional Investment Management
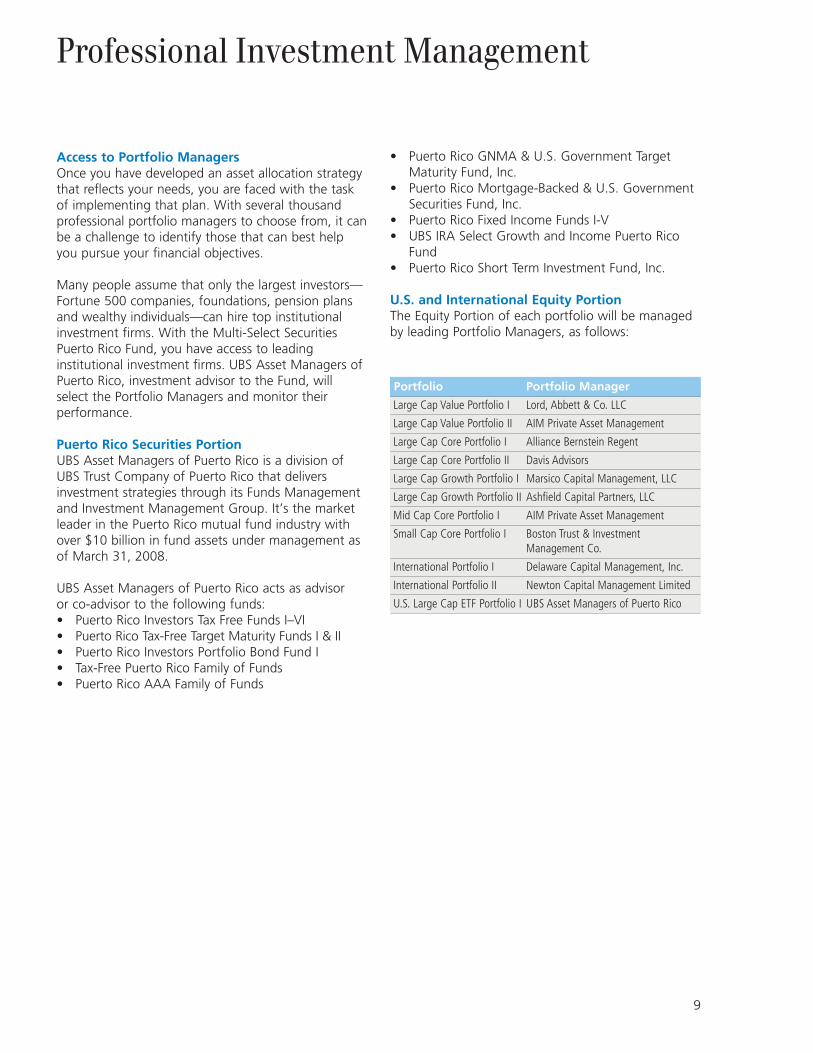
Access to Portfolio ManagersOnce you have developed an asset allocation strategythat reflects your needs, you are faced with the taskof implementing that plan. With several thousandprofessional portfolio managers to choose from, it canbe a challenge to identify those that can best helpyou pursue your financial objectives.
Many people assume that only the largest investors—Fortune 500 companies, foundations, pension plansand wealthy individuals—can hire top institutionalinvestment firms. With the Multi-Select SecuritiesPuerto Rico Fund, you have access to leadinginstitutional investment firms. UBS Asset Managers ofPuerto Rico, investment advisor to the Fund, willselect the Portfolio Managers and monitor theirperformance.
Puerto Rico Securities PortionUBS Asset Managers of Puerto Rico is a division ofUBS Trust Company of Puerto Rico that deliversinvestment strategies through its Funds Managementand Investment Management Group. It’s the marketleader in the Puerto Rico mutual fund industry withover $10 billion in fund assets under management asof March 31, 2008.
UBS Asset Managers of Puerto Rico acts as advisor or co-advisor to the following funds:• Puerto Rico Investors Tax Free Funds I–VI• Puerto Rico Tax-Free Target Maturity Funds I & II• Puerto Rico Investors Portfolio Bond Fund I• Tax-Free Puerto Rico Family of Funds• Puerto Rico AAA Family of Funds
• Puerto Rico GNMA & U.S. Government TargetMaturity Fund, Inc.
• Puerto Rico Mortgage-Backed & U.S. GovernmentSecurities Fund, Inc.
• Puerto Rico Fixed Income Funds I-V• UBS IRA Select Growth and Income Puerto Rico
Fund• Puerto Rico Short Term Investment Fund, Inc.
U.S. and International Equity PortionThe Equity Portion of each portfolio will be managedby leading Portfolio Managers, as follows:
Portfolio Portfolio Manager
Large Cap Value Portfolio I Lord, Abbett & Co. LLC
Large Cap Value Portfolio II AIM Private Asset Management
Large Cap Core Portfolio I Alliance Bernstein Regent
Large Cap Core Portfolio II Davis Advisors
Large Cap Growth Portfolio I Marsico Capital Management, LLC
Large Cap Growth Portfolio II Ashfield Capital Partners, LLC
Mid Cap Core Portfolio I AIM Private Asset Management
Small Cap Core Portfolio I Boston Trust & Investment Management Co.
International Portfolio I Delaware Capital Management, Inc.
International Portfolio II Newton Capital Management Limited
U.S. Large Cap ETF Portfolio I UBS Asset Managers of Puerto Rico

In order to help provide high quality management,the Fund has selected equity Portfolio Managers.These Portfolio Managers undergo an in-depth reviewby UBS Financial Services Inc. The group has madesubstantial commitment in terms of resources andpersonnel in an effort to identify some of the leadinginvestment management firms in the industry.
Candidate managers must meet rigorousstandards regarding:• Soundness of the organization• Continuity of the investment team• Investment philosophy and process• Long-term performance• Operations and trading• Compliance
The chart describes the comprehensive ManagerResearch Model followed by UBS Financial ServicesInc. and the Fund in selecting Portfolio Managers. Thepurpose of this effort is to help assure that the qualityof investment management is maintained over time.
Professional Equity Management—Portfolio Manager Selection and Review
10
UnderstandTheir
Philosophyand Process
Collect andAnalyze
Information
Discussionand
Decision byCommittee
OngoingDue
Diligence
IdentifyCandidates
Verify andBuild
Conviction

11
The Multi-Select Securities Puerto Rico Fund can be an important part of a comprehensive investmentplan. It can provide Puerto Rico investors withincreased geographic, asset class and equityinvestment style diversification while retaining the tax-advantaged status of a Puerto Rico investmentcompany. Investors may create, with the assistance of their Financial Advisor, their own portfolio mix inaccordance with their risk tolerance, investing timehorizon and financial goals. The following chartsillustrate four different sample portfolio combinationsfor individuals seeking to invest in U.S. andinternational equities.
These first three examples represent conservative,moderate and aggressive investment strategies usingthe variety of actively managed portfolios offered bythe Fund. These samples are designed for illustrativepurposes, and provide an example of how each equityinvestment strategy might be structured.
The fourth example represents an ETF basedinvestment strategy, which consists of the U.S. LargeCap ETF Portfolio I, complemented by two activelymanaged portfolios for small cap and internationalequity exposure.
Your Financial Advisor can help you develop acustomized plan designed to reflect your unique goalsand objectives.
Implementing Your Investment Strategy
21%—Large Cap Core II
8%—Mid Cap Core I
25%—Large Cap Growth II
6%—Small Cap Core I20%—International I
20%—Large Cap Value I
Conservative Strategy
Moderate Strategy
Aggressive Strategy
ETF Strategy
9%—Mid Cap Core I
10%—Large Cap Core I
8%—Small Cap Core I
10%—Large Cap Core II18%—Large Cap Value I
20%—Large Cap Growth I
25%—International II
10%—Mid Cap Core I
16%—Large Cap Value II
18%—Large Cap Core I
8%—Small Cap Core I18%—Large Cap Growth I
30%—International II
65%—U.S. Large Cap ETF I
10%—Small Cap Core I
25%—International I
Note: Each investor’s allocation will vary depending on their specific needs, such as risk tolerance, time horizon and investment objectives. Each of these sample portfolio combinations represents only a portion of a comprehensive investment plan, which presumably would include investmentsoutside the Multi-Select Securities Puerto Rico Fund including other fixed income and equity products. The sample portfolio combinations or portfoliomixes shown were constructed utilizing modern portfolio theory and commonly accepted investment principles that state that one needs to diversifyamong asset classes and investment styles if one wants to control risk in an investment portfolio. The four portfolio mixes shown, while investingmainly in equities, try to diversify among different equity investment styles such as value, growth, large cap, small cap, and mid cap and internationalequity. It is a commonly accepted industry principle, based on historical data, that small and mid cap equities, as well as international equities, haveadditional risks and more volatility than more liquid U.S. large cap equities. Growth investing also tends to have more risk and volatility than valueinvesting, which tends to invest in a more conservative group of companies. As one assumes that risk tolerance increases from conservative tomoderate to aggressive strategies, the amounts allocated to small/mid cap and to international equities increase. In addition, the historical volatility of each manager has been considered. More conservative managers have been used in the conservative portfolio mix, and more aggressive managershave been utilized in the moderate and aggressive strategies. The sample investment strategies represent four ways, among many other possiblealternatives, in which an investor may combine Multi-Select Securities Puerto Rico Fund Portfolios. However, they do not consider the particularcircumstances and risk tolerance of each particular investor. For customized recommendations, you should speak to your Financial Advisor.

To take advantage of the features available through the Fund, contact your Financial Advisor.Your Financial Advisor can provide you with theinformation to develop a diversified asset allocationstrategy based on your goals and help you to startinvesting today.
It is important that you have all the information youneed to make sound investment decisions. Beforeinvesting in the Fund, please read the enclosedProspectus carefully. The Prospectus includes adiscussion of risks, charges, expenses and othermatters of interest pertaining to the Fund.
San Juan: 787-250-3600Condado: 787-977-0333Caparra: 787-775-4300Ponce: 787-843-8905Mayagüez: 787-805-0300
12
Getting Started


UBS Financial Services Incorporated of Puerto Ricowww.ubs.com/financialservicesinc080512-1163
Investment products offered by UBS Financial Services Incorporated of Puerto Rico are not FDIC insured, have no bank guarantee and may lose value.UBS Financial Services Incorporated of Puerto Rico is a subsidiary of UBS Financial Services Inc.
ab
©2008 UBS Financial Services Incorporated of Puerto Rico. All Rights Reserved. Member SIPC.
Fund units are being offered for sale exclusively to Puerto Rico residents, by prospectus. Fund units are not registered under the U.S. Securities Act of 1933,as amended, and the Fund is not a registered investment company under the U.S. Investment Company Act of 1940, as amended. This advertisement shall notconstitute an offer to sell or solicitation of an offer to buy Fund units. The Fund prospectus includes a discussion of the Fund’s investment objectives, risks, charges, expensesand other matters of interest. Please read the prospectus carefully before you invest or send money. An investment in the Fund is not a deposit or obligation of UBS FinancialServices Incorporated of Puerto Rico, and is not insured by the FDIC, the Federal Reserve Board, or any other U.S. Government instrumentality. An investment in the Fundmay lose value. For a copy of the prospectus, please contact your Financial Advisor.
MULTI-SELECT SECURITIES PUERTO RICO FUND
PROSPECTUS DECEMBER 8, 2008
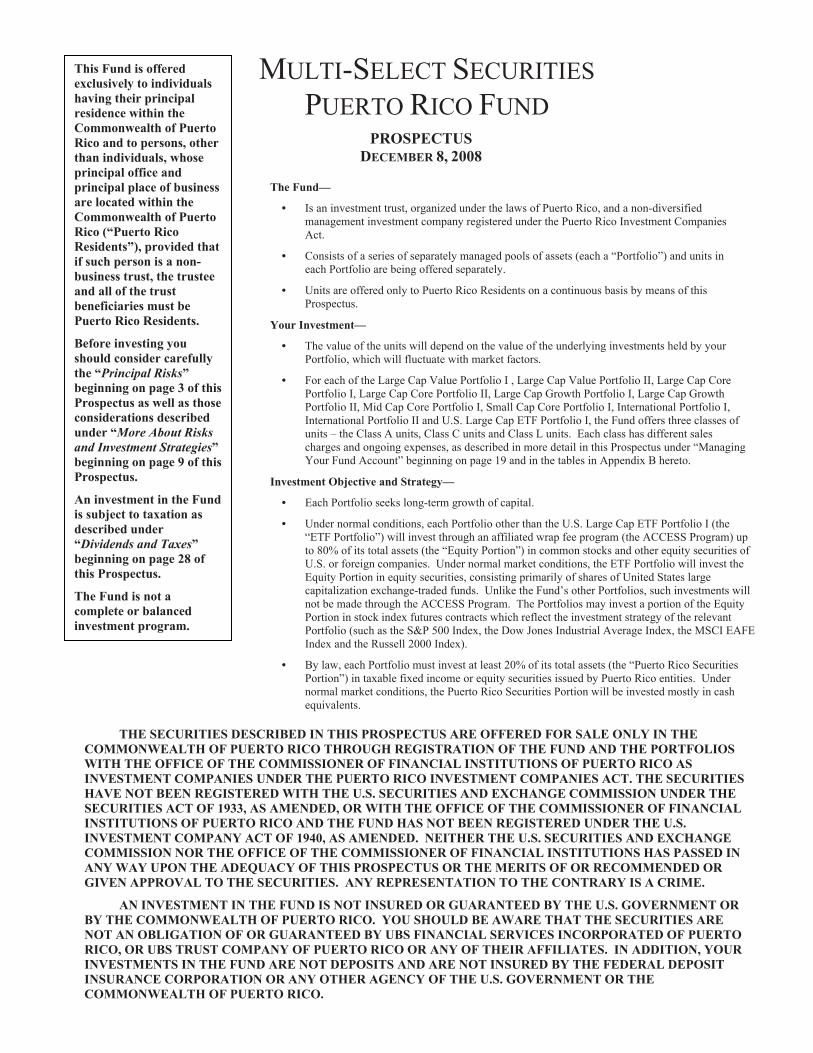
The Fund—
• Is an investment trust, organized under the laws of Puerto Rico, and a non-diversified management investment company registered under the Puerto Rico Investment Companies Act.
• Consists of a series of separately managed pools of assets (each a “Portfolio”) and units in each Portfolio are being offered separately.
• Units are offered only to Puerto Rico Residents on a continuous basis by means of this Prospectus.
Your Investment—
• The value of the units will depend on the value of the underlying investments held by your Portfolio, which will fluctuate with market factors.
• For each of the Large Cap Value Portfolio I , Large Cap Value Portfolio II, Large Cap Core Portfolio I, Large Cap Core Portfolio II, Large Cap Growth Portfolio I, Large Cap Growth Portfolio II, Mid Cap Core Portfolio I, Small Cap Core Portfolio I, International Portfolio I, International Portfolio II and U.S. Large Cap ETF Portfolio I, the Fund offers three classes of units – the Class A units, Class C units and Class L units. Each class has different sales charges and ongoing expenses, as described in more detail in this Prospectus under “Managing Your Fund Account” beginning on page 19 and in the tables in Appendix B hereto.
Investment Objective and Strategy—
• Each Portfolio seeks long-term growth of capital.
• Under normal conditions, each Portfolio other than the U.S. Large Cap ETF Portfolio I (the “ETF Portfolio”) will invest through an affiliated wrap fee program (the ACCESS Program) up to 80% of its total assets (the “Equity Portion”) in common stocks and other equity securities of U.S. or foreign companies. Under normal market conditions, the ETF Portfolio will invest the Equity Portion in equity securities, consisting primarily of shares of United States large capitalization exchange-traded funds. Unlike the Fund’s other Portfolios, such investments will not be made through the ACCESS Program. The Portfolios may invest a portion of the Equity Portion in stock index futures contracts which reflect the investment strategy of the relevant Portfolio (such as the S&P 500 Index, the Dow Jones Industrial Average Index, the MSCI EAFE Index and the Russell 2000 Index).
• By law, each Portfolio must invest at least 20% of its total assets (the “Puerto Rico Securities Portion”) in taxable fixed income or equity securities issued by Puerto Rico entities. Under normal market conditions, the Puerto Rico Securities Portion will be invested mostly in cash equivalents.
THE SECURITIES DESCRIBED IN THIS PROSPECTUS ARE OFFERED FOR SALE ONLY IN THE
COMMONWEALTH OF PUERTO RICO THROUGH REGISTRATION OF THE FUND AND THE PORTFOLIOS WITH THE OFFICE OF THE COMMISSIONER OF FINANCIAL INSTITUTIONS OF PUERTO RICO AS INVESTMENT COMPANIES UNDER THE PUERTO RICO INVESTMENT COMPANIES ACT. THE SECURITIES HAVE NOT BEEN REGISTERED WITH THE U.S. SECURITIES AND EXCHANGE COMMISSION UNDER THE SECURITIES ACT OF 1933, AS AMENDED, OR WITH THE OFFICE OF THE COMMISSIONER OF FINANCIAL INSTITUTIONS OF PUERTO RICO AND THE FUND HAS NOT BEEN REGISTERED UNDER THE U.S. INVESTMENT COMPANY ACT OF 1940, AS AMENDED. NEITHER THE U.S. SECURITIES AND EXCHANGE COMMISSION NOR THE OFFICE OF THE COMMISSIONER OF FINANCIAL INSTITUTIONS HAS PASSED IN ANY WAY UPON THE ADEQUACY OF THIS PROSPECTUS OR THE MERITS OF OR RECOMMENDED OR GIVEN APPROVAL TO THE SECURITIES. ANY REPRESENTATION TO THE CONTRARY IS A CRIME.
AN INVESTMENT IN THE FUND IS NOT INSURED OR GUARANTEED BY THE U.S. GOVERNMENT OR BY THE COMMONWEALTH OF PUERTO RICO. YOU SHOULD BE AWARE THAT THE SECURITIES ARE NOT AN OBLIGATION OF OR GUARANTEED BY UBS FINANCIAL SERVICES INCORPORATED OF PUERTO RICO, OR UBS TRUST COMPANY OF PUERTO RICO OR ANY OF THEIR AFFILIATES. IN ADDITION, YOUR INVESTMENTS IN THE FUND ARE NOT DEPOSITS AND ARE NOT INSURED BY THE FEDERAL DEPOSIT INSURANCE CORPORATION OR ANY OTHER AGENCY OF THE U.S. GOVERNMENT OR THE COMMONWEALTH OF PUERTO RICO.
This Fund is offered exclusively to individuals having their principal residence within the Commonwealth of Puerto Rico and to persons, other than individuals, whose principal office and principal place of business are located within the Commonwealth of Puerto Rico (“Puerto Rico Residents”), provided that if such person is a non-business trust, the trustee and all of the trust beneficiaries must be Puerto Rico Residents.
Before investing you should consider carefully the “Principal Risks” beginning on page 3 of this Prospectus as well as those considerations described under “More About Risks and Investment Strategies” beginning on page 9 of this Prospectus.
An investment in the Fund is subject to taxation as described under “Dividends and Taxes” beginning on page 28 of this Prospectus.
The Fund is not a complete or balanced investment program.

i
Contents MULTI-SELECT SECURITIES PUERTO RICO FUND
What every investor should know about the Fund and its Portfolios
1 1 1 1 3 8 8 9
Investment Objective, Strategies and Risks — About the Fund — Investment Objective — Principal Investment Strategies — Principal Risks Performance Expenses and Fee Table More About Investment Strategies and Risks
11 17
— Principal Risks — Additional Risks
YOUR INVESTMENT Information for managing your Fund account
19 20 20 20 21 21 22 22 23 23 24 24 24 25 25 25 25
Managing Your Fund Account — Class A Units — Sales Charge Reductions for Class A Units — Class C Units — Initial Sales Charge Waivers – Class A and Class C Units — Class L Units — Class Selection Factors — Buying Units — Minimum Investments and Account Size — Exchanges From One Portfolio to Another — Distribution Reinvestment — Market Timers — Selling Units — Redemption Procedure — Redemption Fees — Additional Information — Pricing and Valuation
ADDITIONAL INFORMATION Additional important information about the Fund and its Portfolios
27 28
Management Dividends and Taxes
32 Financial Highlights Information about ACCESS and the Portfolios
A-1 B-1
About ACCESS About the Portfolios
Representation Letters C-1 Puerto Rico Residency Representation Letters Where to learn more about the Fund Back Cover
The Fund is not a complete or balanced investment program.

Multi-Select Securities Puerto Rico Fund
I N V E S T M E N T O B J E C T I V E , S T R A T E G I E S A N D R I S K S About the Fund
The Fund is an open-end investment trust, organized under the laws of Puerto Rico, and a non-diversified management investment company registered under the Puerto Rico Investment Companies Act, as amended. Units of the Fund are offered only to Puerto Rico Residents, as described below, on a continuous basis by means of this Prospectus. The Fund consists of a series of separately managed pools of assets, each a Portfolio, and units in each Portfolio are being offered separately.
Investment Objective
Each Portfolio’s investment objective is long-term growth of capital. No assurance can be given that the Portfolios will achieve this investment objective.
Principal Investment Strategies
The Fund’s current Portfolios are: • Large Cap Value Portfolio I • Large Cap Value Portfolio II • Large Cap Core Portfolio I • Large Cap Core Portfolio II • Large Cap Growth Portfolio I • Large Cap Growth Portfolio II • Mid Cap Core Portfolio I • Small Cap Core Portfolio I • International Portfolio I • International Portfolio II • U.S. Large Cap ETF Portfolio I Each Portfolio is open to investment exclusively to Puerto Rico Residents. The Portfolios
Under normal conditions, each Portfolio will invest up to 80% of its total assets in common stocks and other equity securities of U.S. or foreign companies (this portion of each Portfolio will be referred to as the Equity Portion). The Equity Portion of the ETF Portfolio will be invested primarily in shares of United States large capitalization exchange-traded funds. A portion of the Equity Portion of each Portfolio may be invested in stock index futures contracts. According to Puerto Rico law, each Portfolio also must invest at least 20% of its total assets in equity or taxable fixed-income securities
issued by Puerto Rico entities (this portion of each Portfolio will be referred to as the Puerto Rico Securities Portion). Under normal market conditions, the Puerto Rico Securities Portion will be invested mostly in cash equivalents. This requirement may limit the Portfolios’ ability to achieve their investment objective. Although securities held in each Portfolio may be issued by Puerto Rico or U.S. issuers, generally the Portfolios invest primarily in securities of U.S. issuers, with the exception of International Portfolio I and II, which primarily invest in sponsored or unsponsored American Depositary Receipts representing interests in securities of foreign issuers.
• Equity Portion (except the ETF Portfolio) – With regard to the Equity Portion of each Portfolio (other than the ETF Portfolio which will be entirely managed by the Fund’s Investment Adviser), the Fund intends to use a variation of what has been termed a “multi-manager” approach. The Fund will indirectly engage different investment advisers for each Portfolio’s Equity Portion (other than the ETF Portfolio) by opening accounts in ACCESSSM, a wrap fee advisory program offered by UBS Financial Services Inc., an affiliate of the Fund’s Investment Adviser (each referred to as an Equity Portion Portfolio Manager). The Fund, on behalf of each applicable Portfolio, will be an advisory client in the ACCESS program and will be entitled to the range of services it offers; individual unitholders in such Portfolios, however, will not be considered clients of the ACCESS program, nor be entitled to individualized services from the program. The Fund’s Investment Adviser, UBS Asset Managers of Puerto Rico, a division of UBS Trust Company of Puerto Rico, has established the specific investment style for the Equity Portion of each Portfolio and has selected each Equity Portion Portfolio Manager from the options offered by the ACCESS program, subject to approval by the Fund’s Board of Directors. Appendix A describes the ACCESS program generally, including certain risks associated with investing through the ACCESS program. Consequently, in light of the fact that most of the assets of the Portfolios (other than the ETF Portfolio) generally will be managed through the ACCESS program, investors that are eligible to enroll directly

2
in the ACCESS program should consider under their individual circumstances whether the relative costs and benefits, including tax advantages, make investment in the Fund more beneficial than direct investment in the ACCESS program. The Equity Portion Portfolio Managers may include affiliates of the Investment Adviser. The Fund may also offer Portfolios in the future that engage subadvisers directly, without participation in the ACCESS program.
In choosing the Equity Portion Portfolio Managers for the various Portfolios, the Investment Adviser considers a range of criteria, including but not limited to the following: investment management experience; the historical performance; the investment styles and strategies employed; the quality and stability of each Equity Portion Portfolio Manager’s organization; and the ability to consistently and effectively apply its investment approach. The Fund presently offers Portfolios advised by the Equity Portion Portfolio Managers described in Appendix B to this Prospectus. The Fund may offer additional Portfolios advised by different Equity Portion Portfolio Managers from time to time.
The Fund may discontinue offering a given Portfolio, or remove or replace an Equity Portion Portfolio Manager for a given Portfolio, subject to the approval of the Fund’s Board of Directors in each case. In order for the Fund to remove or replace an Equity Portion Portfolio Manager, the Investment Adviser would select a different Equity Portion Portfolio Manager to manage the Portfolio’s account in the ACCESS program. Equity Portion Portfolio Managers could also be removed from the ACCESS program by UBS Financial Services Inc., in its sole discretion, in which event the Equity Portion Portfolio Manager may be removed from the Portfolio without the approval of the Investment Adviser or the Board of Directors. If an Equity Portion Portfolio Manager for a Portfolio in which you invest is to be removed or replaced, you will be notified and entitled to either remain in your current Portfolio under the management of a new Equity Portion Portfolio Manager selected by the Investment Adviser, exchange your investments for units in another Portfolio or redeem your units without additional charge at a date specified in the notice. There will be no refund, however, of sales charges or other fees previously paid. If an investor fails to provide instructions within the period indicated in the notice, or if the Fund does not receive notice of the removal of an Equity Portion Portfolio Manager in sufficient time to provide the affected unitholders with advance notice, such unitholder’s investments will remain in the Portfolio, the Equity Portion of which will be under the management of a new Equity Portion Portfolio Manager selected by the Investment Adviser, which may differ from the previous Equity Portion Portfolio Manager in investment style or
other factors, until such notice can be provided and instructions are received from the unitholder.
You will have the opportunity to allocate and reallocate your investments among the Portfolios at your own discretion and based on your individual investment needs and goals, subject, in certain cases, to the conditions set forth on page 23 under the section “Exchanges from One Portfolio to Another.”
• Equity Portion of ETF Portfolio – Under normal market conditions, the ETF Portfolio will invest the Equity Portion in equity securities, consisting primarily of shares of United States large capitalization exchange-traded funds. Unlike the Fund’s other Portfolios, such investments are not made through the ACCESS Program.
The Investment Adviser has elected not to open an account for the ETF Portfolio in the ACCESS Program because it is of the view that an Equity Portion Portfolio Manager would not prove advantageous in maximizing the ETF Portfolio’s return. As discussed in greater detail below, exchange-traded funds track closely the performance of corresponding market indices or baskets of securities. The Investment Adviser believes it has the ability to directly select exchange-traded funds for the ETF Portfolio to purchase. Purchases of exchange-traded funds are made through UBS Financial Services, Inc., which will not charge the ETF Portfolio per trade brokerage commissions.
Exchange-traded funds invest in portfolios of equity securities that are designed to track closely the performance of corresponding market indices or baskets of securities. An index generally is an unmanaged group of securities whose overall performance is used as a standard to measure the investment performance of a particular market or market segment. Exchange-traded funds trade on exchanges and therefore the price of their shares may fluctuate throughout the trading day. The ETF Portfolio, however, reserves the right to pursue its investment objectives by investing all or a portion of the ETF Portfolio’s assets directly in individual equity securities. If the Investment Adviser chooses to invest the Equity Portion directly in individual equity securities, it shall notify unitholders and the ETF Portfolio’s name may be changed.
To the extent the Equity Portion is invested in stock index futures contracts, the amounts invested in common stock or other equity securities of U.S. or foreign companies by the Equity Portion Portfolio Manager (or in exchange traded funds by the Investment Adviser, in the case of the ETF Portfolio) will be correspondingly reduced. The amount used to enter into futures contracts (i.e., the margin) will at no time exceed 5% of the value of the Portfolio’s total assets (after taking into account unrealized gains and losses on such futures contracts).
3
• Puerto Rico Securities Portion – Each Portfolio will invest at least 20% of its total assets in equity or taxable fixed-income securities issued by Puerto Rico entities. Under normal market conditions, the Puerto Rico Securities Portion will be invested mostly in cash equivalents. By investing in stock index futures contracts, the Investment Adviser is attempting to achieve a risk and return profile for the Portfolios that approximate the result that might be achieved by (i) investing the assets of the Puerto Rico Securities Portion in the securities comprising the stock index used as a benchmark for the relevant investment strategy and (ii) investing the assets of the Equity Portion in the assets selected by the Equity Portion Portfolio Manager or the Investment Adviser, as the case may be. No assurance can be given that such strategy will be successful or such results attained. The Fund’s Investment Adviser will manage this portion of each Portfolio directly.
Investment Strategies:
• Temporary and Other Investments – Each Portfolio may make certain short-term high quality investments of up to 100% of its assets for temporary or defensive purposes, subject to certain conditions. It is anticipated that temporary investments of each Portfolio will be invested in money market funds advised by affiliates of the Investment Adviser. Further, each Portfolio may invest in other affiliated or unaffiliated short-term cash management pooled investment vehicles and may lend its securities to qualified buyers. Each Portfolio also may invest in repurchase agreements, derivative instruments, when-issued and delayed delivery securities with respect to its Puerto Rico Securities Portion. In addition, the Fund, on behalf of a Portfolio, may borrow money in an amount up to 5% of such Portfolio’s total assets for temporary purposes and to meet redemptions.
• Investments in Affiliated Short-Term Cash Management Pooled Investment Vehicles – As discussed above, available cash balances may be automatically invested in money market mutual funds or in the Puerto Rico Short-Term Investment Fund, which are, as permitted by law, affiliated with the Fund, the Investment Adviser and UBS Financial Services Inc. and for which UBS affiliates receive compensation for services in addition to the fees charged by the Fund and by ACCESS.
Principal Risks – All Portfolios
The following is a summary discussion of the principal risks of investing in any Portfolio of the Fund. There can be no guarantee that the Fund will meet its investment objective or that the performance of any of its Portfolios will be positive for any period of time. An investment in the Fund is not guaranteed. You may lose money by investing in the Fund.
• Portfolio Risk – There is no assurance that the investment approaches used by the Investment Adviser or any or all of the Equity Portion Portfolio Managers selected by the Investment Adviser, or any subadvisers hired directly by the Investment Adviser, will be successful, and certain Portfolios may be more or less successful than others. The overall success of your investment in the Fund also may depend on your ability to choose successfully from among the Portfolios.
An investment in the units offered by the Fund is designed primarily, and is suitable only, for long-term investors, and may not be suitable for all investors. Further, an investment in the Fund is not equivalent to an investment in the underlying securities of the Fund and investors in the units should not view the Fund as a vehicle for trading purposes.
Any claim by a Fund investor against the Fund, its directors or officers will be subject to the jurisdiction of the Puerto Rico courts, and therefore arbitration proceedings will not be the sole forum to resolve any claims.
• Conflicts of Interest Risk – UBS Financial Services Incorporated of Puerto Rico and its affiliates, including the Investment Adviser, may have interests that compete with those of the Fund and any given Portfolio, for example, because they may engage in transactions directly with the Fund. Those entities and the Equity Portion Portfolio Managers also may have interests in, or business relationships with, a company in which a Portfolio invests and those interests may conflict with those of the Portfolio.
The Investment Adviser and its affiliates also have other business relationships with the Equity Portion Portfolio Managers, including but not limited to the participation by the Equity Portion Portfolio Managers in the ACCESS program, and the Equity Portion Portfolio Managers may include affiliates of the Investment Adviser. The Fund’s use of affiliated Equity Portion Portfolio Managers (or, for temporary investment, affiliated cash management vehicles, including affiliated money market funds) and its receipt of other services through the ACCESS program, which is sponsored by an affiliate of the Investment Adviser, will cause an increase in the overall compensation and profitability of the Fund to the Investment Adviser and its affiliates. Consequently, there is an inherent conflict of interest in the Fund’s use of the ACCESS program and the selection of affiliated Equity Portion Portfolio Managers. See Appendix A for further discussion of the conflicts of interest associated with investment in a Portfolio that utilizes an ACCESS account.
• Equity Risk – Common stocks and other similar equity securities generally are the riskiest investment
4
in a company and they fluctuate in value more than bonds. A Portfolio could lose all of its investment in a company’s stock.
• Puerto Rico Securities Risk – Under normal conditions, each Portfolio will invest the Puerto Rico Securities Portion in cash equivalents. However, to the extent the Portfolios invest in other Puerto Rico securities, they will be more susceptible to economic, political, regulatory or other factors adversely affecting issuers in Puerto Rico than funds that invest to a lesser degree in Puerto Rico issuers.
There presently are a limited number of participants in the market for certain securities of Puerto Rico issuers. As a result, changes in the market value of a single investment in the Puerto Rico Securities Portion of each Portfolio could cause significant fluctuations in the Portfolio’s net asset value price. In addition, the investments in the Puerto Rico Securities Portion had previously been concentrated in the stocks of Puerto Rico financial services companies. Because market risk may affect a single issuer, industry (such as Puerto Rico financial services companies), or sector of the economy, the Portfolio may experience greater price volatility than if it held more diversified investments. For example, during the past four years the price of Puerto Rico stocks (as measured by the Government Development Bank’s Puerto Rico Stock Index (“PRSI”)) has experienced significant volatility, including substantial price declines, primarily due to issues common to many of the Puerto Rico financial services firms, including restatements of earnings and resulting regulatory investigations and lawsuits.
In addition, certain Puerto Rico Securities may have periods of illiquidity. These factors may affect the Portfolios’ ability to acquire or dispose of such securities, as well as the price paid or received upon such acquisition or disposition. In addition, investment by a Portfolio in such securities is subject to their availability in the open market.
If a Portfolio is unable to maintain the requisite level of Puerto Rico Securities, it will be restricted from further allocation of investments to the Equity Portion of such Portfolio until the requisite allocation to Puerto Rico Securities is achieved. However, the Investment Adviser and/or Equity Portion Portfolio Manager, if applicable, will not be required to dispose of equity portfolio securities in order to maintain the requisite allocation to Puerto Rico Securities.
• Futures – Each Portfolio may invest a portion of its Equity Portion in futures contracts in the relevant stock index for that Portfolio. There are several risks accompanying the utilization of futures contracts. First, positions in futures contracts may be closed only on an exchange or board of trade that furnishes a secondary market for such contracts. While the
Portfolios plan to utilize futures contracts only if there exists an active market for such contracts, there is no guarantee that a liquid market will exist for the contracts at a specified time. Furthermore, because, by definition, futures contracts look to projected price levels in the future and not to current levels or valuation, market circumstances may result in there being a discrepancy between the price of the future and the movement in the underlying instrument or index. The absence of a perfect price correlation between the futures contract and its underlying instrument or index could stem from investors choosing to close futures contracts by offsetting transactions, rather than satisfying additional margin requirements. This could result in a distortion of the relationship between the index and futures market. In addition, because the futures market imposes less burdensome margin requirements than the securities market, an increased amount of participation by speculators in the futures market could result in price fluctuations.
• Industry Concentration Risk – Certain Portfolios may concentrate their investments in a given industry or business segment. Such concentration may increase a Portfolio’s costs or fluctuations in the value of its investment portfolio.
• Credit and Interest Rate Risks – The Portfolios are authorized with respect to their Puerto Rico Securities Portions to invest in bonds and other income-producing securities, such as preferred stock. These securities are subject to credit risk and interest rate risk.
Credit risk is the risk that the issuer of a bond will not make principal or interest payments when they are due. Even if an issuer does not default on a payment, a bond’s value may decline if the market anticipates that the issuer has become less able, or less willing, to make payments on time. Even high quality bonds are subject to some credit risk. However, credit risk is higher for lower quality bonds. Bonds that are not investment grade involve high credit risk and are considered speculative. The Portfolios may invest in preferred stock and subordinated debt of Puerto Rico issuers that may be unrated or rated below investment grade, provided that either (i) the issuer of such preferred stock or subordinated debt has senior unsecured debt rated investment grade by a nationally recognized statistical rating organization or (ii) if such issuer does not have senior unsecured debt rated investment grade, the Fund’s Investment Adviser determines that such issuer’s senior unsecured debt is of comparable credit quality. The Portfolios also may invest in other debt securities rated below investment grade, or that the Fund’s Investment Adviser determines to be below investment grade quality, provided that the amount invested in such debt securities may not exceed 5% of the Puerto Rico Securities Portion of a Portfolio’s total assets.
5
The value of bonds generally can be expected to fall when interest rates rise and to rise when interest rates fall. Interest rate risk is the risk that interest rates will rise, so that the value of a Portfolio’s investments in bonds will fall. The impact of changes in the general level of interest rates on lower quality bonds may be greater or less than the impact on higher quality bonds.
• Derivatives Risk – The Portfolios may use financial instruments referred to as derivatives with respect to their Puerto Rico Securities Portions, which derive their value from another security, a commodity (such as gold or oil) or an index (a measure of value or rates). A Portfolio’s investments in derivatives may fall more rapidly than other investments.
• Non-Diversification Risk – Certain Portfolios may be non-diversified. Non-diversification risk is the risk that large positions in a small number of issuers may cause greater fluctuations in a Portfolio’s net asset value as a result of changes in the market’s assessment of the financial condition of those issuers.
• Illiquid Securities – Each Portfolio may invest up to 15% of its net assets in illiquid securities. Illiquid securities face the risk that they may not be readily sold, particularly at times when it is advisable to do so to avoid Portfolio losses. It is presently anticipated that illiquid investments may be made with respect to the Puerto Rico Securities Portion of each Portfolio.
• Other Investment Companies – Each Portfolio may invest, to the extent consistent with applicable law, in other investment companies including exchange traded funds and affiliated or unaffiliated money market funds. The return on investments in other investment companies will be reduced by the operating expenses, including investment advisory and administration fees, of such investment companies and there will be a layering of certain fees and expenses.
Unlike traditional open-end mutual funds, the shares of exchange traded funds are bought and sold based on market values throughout each trading day. For this reason, shares may trade at a premium or a discount to their net asset value. If an exchange traded fund held by a Portfolio trades at a discount to net asset value, the Portfolio could lose money even if the securities held by the exchange traded fund appreciate in value.
• Segregation of Portfolios – The Fund intends to segregate the assets of each Portfolio so that you have the exclusive right to the assets, income, and profits from the Portfolio(s) in which you invest, and only bear the expenses, deductions and costs properly attributable or allocated to those Portfolio(s).
Similarly, if one Portfolio has less than 20% of its assets invested in Puerto Rico Securities, it shall not affect the ability of another Portfolio to make further investment allocations to the Equity Portion of such other Portfolio.
The Fund also intends that creditors of any Portfolio only will have recourse to the assets in that Portfolio. There can be no assurance, however, that efforts to effect this segregation of assets and liabilities will be successful, nor that a court, in the event of the Fund’s or a Portfolio’s bankruptcy, would regard the Portfolios as separate entities for purposes of determining the bankruptcy estate.
• Dilution or Suspension of Unitholder Voting Rights – According to Puerto Rico law, beginning one year after the initial issuance of a given Portfolio’s units, at no time shall less than six individuals own directly or indirectly more than 50% of the outstanding voting units of such Portfolio. Under the terms of the Deed of Trust, the voting rights of certain unitholders may be automatically suspended to the extent necessary to maintain compliance with this requirement. Voting rights of the unitholders owning the largest number of units of the applicable Portfolio will be suspended first, in descending order until compliance with the requirement is achieved. Voting rights of such affected unitholders will be automatically reinstated to the extent possible while remaining in compliance with the requirement, beginning with unitholders owning the smallest number of units in the applicable Portfolio. Unitholders whose voting rights become suspended will be notified as soon as practicable and permitted to redeem or exchange their affected units without additional charge. There will be no refund, however, of sales charges or other fees previously paid, unless such charges or fees were assessed in connection with the same unit purchase that triggers the unitholder’s suspension of voting rights.
Principal Risks – Portfolios using ACCESS
The following is a summary of the additional principal risks of investing in a Portfolio of the Fund which uses ACCESS. For a description of additional important information associated with such Portfolio’s participation in the ACCESS program, please see Appendix A.
• Portfolio Manager Selection Risk – Presently, for the Equity Portion of the Portfolios (other than the ETF Portfolio), the Fund offers a selection of managers chosen from among those available under the ACCESS program. While the Fund might not have available certain other subadvisers that it might otherwise have sought to retain and which might have performed differently from the Equity Portion Portfolio Managers, the Fund’s use of the ACCESS program provides investors with Fund management options that may not have been otherwise available

6
due to high minimum account balance requirements and expenses associated with direct retention of many subadvisers. The Investment Adviser generally relies on certain due diligence performed by UBS Financial Services Inc. in connection with selecting and evaluating Equity Portion Portfolio Managers from among those offered by the ACCESS program. The limited availability of direct due diligence could result in risks similar to those described below under “Equity Portion Portfolio Manager Oversight Risks.”
• Equity Portion Portfolio Manager Oversight Risks – Because each Equity Portion Portfolio Manager, or subadviser engaged directly by the Investment Adviser, makes trading decisions on behalf of the applicable Portfolio independently, the Investment Adviser may not always have access to information concerning the securities positions of a Portfolio at a given point in time. Delays in receipt of such information may hinder the Investment Adviser’s oversight of the Equity Portion Portfolio Managers and subadvisers. Additionally, the Investment Adviser may have more limited access to information regarding the activities of the Equity Portion Portfolio Managers indirectly engaged by the Fund through the ACCESS program, such as their trading practices, including best execution and soft dollar practices, than it would if it retained such Equity Portion Portfolio Managers directly, or than is typically the case for an investment adviser that engages a subadviser in connection with a U.S. investment company registered under the U.S. Investment Company Act of 1940 (the “1940 Act”), as amended. UBS Financial Services Inc. also might not have available relevant information concerning an Equity Portion Portfolio Manager at any given time. Consequently, among other things, the Investment Adviser may be less likely to be aware of any potential regulatory, compliance, or other issues related to the Equity Portion Portfolio Managers’ management of the Portfolios, which could cause an investor to lose money. In addition, the Investment Adviser lacks direct contractual authority over the activities of the Equity Portion Portfolio Managers, and has no ability to affect such activities other than by withdrawing the respective Portfolio’s ACCESS account investments from the applicable Equity Portion Portfolio Manager, even though UBS Financial Services Inc. is an affiliate of the Investment Adviser. The Investment Adviser also does not control the amount paid to a given Equity Portion Portfolio Manager by UBS Financial Services Inc.
• Mid and Small Cap Company Risk – The Mid Cap Core I Portfolio and the Small Cap Core I Portfolio may invest to a significant degree in common stocks of mid and small cap companies, respectively. These companies present greater risks because they generally are more vulnerable to adverse business or economic developments and they
may have more limited resources. In general, these risks are greater for small cap companies than for mid cap companies.
• Foreign Securities Risk – The International Portfolio I and International Portfolio II invest primarily in American Depositary Receipts (ADRs) representing interests in securities of foreign issuers. While ADRs are not necessarily denominated in the currencies of the foreign securities that they represent, they are subject to many of the risks associated with foreign securities. Such risks can increase the chances that the applicable Portfolios will lose money. These risks include difficulties in pricing securities, defaults on foreign government securities, difficulties enforcing favorable legal judgments in foreign courts and political and social instability. The issuers of unsponsored depositary receipts are not obligated to disclose material information in the United States. Therefore, there may be less information available regarding these issuers and there may not be a correlation between such information and the market value of the depositary receipts.
Principal Risks – ETF Portfolio
The following is a summary of the additional principal risks of investing in the ETF Portfolio.
• Fund of Fund Risks – The ETF Portfolio pursues its investment objective by investing its assets primarily in underlying exchange-traded funds rather than investing directly in stocks or other investments. The ETF Portfolio’s investment performance depends heavily on the investment performance of the underlying exchange-traded funds in which it invests. An investment in the ETF Portfolio, because it is a fund of funds, is subject to the risks associated with investments in the underlying exchange-traded funds in which it invests. The ETF Portfolio will indirectly pay a proportional share of the asset-based fees of the underlying exchange-traded funds in which it invests.
There is a risk that the Investment Adviser’s evaluation and assumptions regarding a broad asset class or the underlying exchange-traded funds in which the ETF Portfolio invests may be incorrect based on actual market conditions. In addition, at times the segment of the market represented by an underlying exchange-traded fund may be out of favor and under perform other segments. There can be no assurance that the underlying exchange-traded funds will achieve their investment objectives, and the performance of the underlying exchange-traded funds may be lower than the asset class that they were selected to represent. The underlying funds may change their investment objectives or policies without the approval of the ETF Portfolio. If that were to occur, the ETF Portfolio might be forced to withdraw its investment from the underlying

7
exchange-traded fund at a time that is unfavorable to the ETF Portfolio.
• Exchange-Traded Funds – An investment in the ETF Portfolio is not equivalent to an investment in the underlying assets held by the ETF Portfolio because of the operational fees and expenses incurred by the ETF Portfolio. The ETF Portfolio currently anticipates that the Equity Portion will invest primarily in shares of exchange-traded index funds. Index funds invest in a portfolio of securities that are designed to track closely the price and yield performance of the corresponding market indexes or segments. However, index funds will never be able to do so exactly because of operational fees and expenses incurred by the fund or because of the temporary unavailability of certain of the securities underlying the index. The market price of exchange-traded fund’s shares on the securities exchange on which they are traded may be lower than their net asset value.
An active trading market for exchange-traded fund shares may not develop or be maintained. Trading of exchange-traded shares may be halted if the listing exchange’s officials deem such action
appropriate. Exchange-traded funds are not actively managed and may not fulfill their objective of tracking the performance of an index they seek to track. Exchange-traded funds would not necessarily sell a security because the issuer of the security was in financial trouble unless the security is removed from the corresponding index that the fund seeks to track. The value of an investment in exchange-traded fund shares will decline, more or less, in correlation with any decline in the value of the index they seek to track. In addition, a significant percentage of certain exchange-traded funds may be comprised of issuers in a single industry or sector of the economy, which may present more risks than if it such funds were broadly diversified over numerous industries or sectors of the economy.
• Management Risk – The Investment Adviser has no previous experience directly managing a broad portfolio of equity securities, including securities of exchange-traded funds.
More general information about these and other risks of investing in the Fund is provided below in “More About Risks and Investment Strategies.”
8
PERFORMANCE Risk/Return Bar Charts and Tables
Appendix B contains separate Risk/Return Bar Charts and Tables for each Portfolio.
EXPENSES AND FEE TABLE Fees and Expenses
Appendix B contains separate Fees and Expenses Tables for each Portfolio, providing the fees and expenses you may be charged as an investor in the Fund.
Each Portfolio offers Class A units, Class C units and Class L units. Class A and Class C units are available only to purchasers meeting the initial aggregate investment requirement of $5,000 or more, with a minimum of $500 in a given Portfolio, and are subject to a minimum balance requirement of $500 in a given Portfolio. Class L units are available only to purchasers meeting the initial aggregate investment requirement of $1,000,000 or more, with a minimum of $500 in a given Portfolio, and are subject to a minimum balance requirement of $500 in a given Portfolio. Subsequent purchases of Class A, Class C and Class L units in a given Portfolio must be made in amounts of at least $100. Although your money will be invested the same way within a particular Portfolio regardless of which class of units you own, there are differences among the fees and expenses associated with each class. The Fund’s fees and expenses, including amounts paid to the Trustee and its affiliates, may be increased without the consent of the holders of the Fund’s units.
Examples
Examples are provided in Appendix B to assist you in understanding the various costs that you, as a unitholder of a particular Portfolio, will bear directly or indirectly and to help you compare the cost of investing in a particular Portfolio with the cost of investing in other mutual funds. The examples also provide a means for you to compare expense levels of investment companies with different fee structures over varying investment periods.

9
MORE ABOUT INVESTMENT STRATEGIES AND RISKS
Investment Strategies of the Non-ETF Portfolios The various Portfolios (other than the ETF Portfolio) may use a number of professional money management techniques to respond to changing economic and money market conditions and to shifts in fiscal and monetary policies. Information about each Equity Portion Portfolio Manager’s specific investment style is included in Appendix B. Other general techniques that the various Portfolios may employ are discussed below.
Defensive Positions; Cash Reserves. In order to protect itself from adverse market conditions, a Portfolio may take a temporary defensive position that is different from its normal investment strategy. This means that the Portfolio may temporarily invest a larger-than-normal portion, or even all, of its assets in cash, money market instruments or other temporary investments as described above. In addition, if the Investment Adviser (with the approval of the Board of Directors) selects a new Equity Portion Portfolio Manager to manage a Portfolio’s investments, the Portfolio may increase its cash reserves to facilitate the transition to the investment style and strategies of the new Equity Portion Portfolio Manager. Since these investments provide relatively low income, a defensive or transitional position may not be consistent with achieving the Fund’s investment objective. Each Portfolio also may invest a certain portion, generally not more than 10%, of its total assets, in cash or money market instruments as a cash reserve for liquidity or as part of its ordinary investment strategy. Such investments typically lack the capital appreciation potential of equity securities. While such investments are generally designed to limit losses, they can prevent the Portfolio from achieving its investment objective.
Portfolio Turnover. Each Portfolio may engage in frequent trading to achieve the Fund’s investment objective. Normally, frequent trading results in portfolio turnover and increased brokerage costs (high portfolio turnover). To the extent that the Portfolios (other than the ETF Portfolio) invest through the ACCESS program, this risk is reduced because it is anticipated that most trades will be made through UBS Financial Services Inc., which will not involve payment of per trade brokerage commissions, but rather will be covered by the fee paid by the Investment Adviser out of its investment advisory fee to UBS Financial Services Inc. As noted in more detail in Appendix A, however, Equity Portion
Portfolio Managers have the flexibility to trade with other brokers or dealers, which would involve separate brokerage costs.
Portfolio Transactions. The Investment Adviser, Equity Portion Portfolio Managers and entities within the ACCESS program are responsible for the execution of the Portfolio’s portfolio transactions (except for the ETF Portfolio for which the Investment Adviser is solely responsible). The execution of transactions under the direction of the Investment Adviser is subject to any such policies as may be established by the Board of Directors. Although the Investment Adviser does not have the ability to control the execution of transactions entered into by Equity Portion Portfolio Managers on behalf of a Portfolio by entities within the ACCESS program, both the Investment Adviser and entities within the ACCESS program, including the Equity Portion Portfolio Managers, seek to obtain the best net results for the Portfolios, taking into account such factors as the price (including the applicable dealer spread or brokerage commission), size of order, difficulty of execution, and operational facilities of the firm involved. While the Investment Adviser and entities within the ACCESS program, including the Equity Portion Portfolio Managers, generally seek the best price in placing orders, the applicable Portfolio may not necessarily be paying the lowest price available. Each of the Investment Adviser and the Equity Portion Portfolio Managers may allocate among advisory clients, including the Fund and other investment companies for which they act as investment adviser, the opportunity to purchase or sell a security or investment that may be both desirable and suitable for them. There can be no assurance of equality of treatment among the advisory clients according to any particular or predetermined standards or criteria.
Investment Strategies of the ETF Portfolio
The Equity Portion will be primarily invested in exchange-traded funds which invest principally in large capitalization U.S. stocks.
The Investment Adviser has elected not to open an account for the ETF Portfolio in the ACCESS Program because it is of the view that an Equity Portion Portfolio Manager would not prove advantageous in maximizing the ETF Portfolio’s return. As discussed in greater detail below, exchange-traded funds track closely the performance of corresponding market indices or baskets of

10
securities. The Investment Adviser believes it has the ability to directly select exchange-traded funds for the ETF Portfolio to purchase. Purchases of exchange-traded funds are made through UBS Financial Services, Inc., which will not charge the ETF Portfolio per trade brokerage commissions.
The Investment Adviser intends to pursue the ETF Portfolio’s investment objectives by investing primarily in shares of common stock of exchange-traded funds instead of investing in individual stocks. The Investment Adviser reserves the right to change this strategy and pursue the ETF Portfolio’s investment objectives by investing directly in individual equity securities. If the Investment Adviser chooses to invest the Equity Portion directly in individual equity securities, it shall notify unitholders and the ETF Portfolio’s name may be changed.
Each share of an exchange-traded fund represents and undivided ownership interest in the portfolio of stocks held by the exchange-traded fund. Exchange-traded funds are trusts or similar vehicles that acquire and hold either:
• shares of all of the companies that are represented by a particular index in the same proportion that is represented in the indices themselves; or
• shares of a sampling of the companies that are represented by a particular index in a proportion meant to track the performance of the entire index.
Exchange-traded funds are intended to provide investment results that, before expenses, generally correspond to the price and yield performance of the corresponding market index, and the value of their shares should, under normal circumstances, closely track the value of the index’s underlying component stocks. Exchange-traded funds generally do not buy or sell securities, except to the extent necessary to conform their portfolio to the corresponding index. Because an exchange-traded fund has operating expenses and transactions costs, while a market index does not, exchange-traded funds that track particular indices typically will be unable to match the performance of the index exactly.
Exchange-traded funds generally do not sell or redeem their shares for cash, and most investors do not purchase or redeem shares directly from an exchange-traded fund. Instead, the exchange-traded fund issues and redeems its shares in large blocks (typically 50,000 of its shares) called “creation units.” Creation units are issued to anyone who deposits a specified portfolio of the exchange-traded fund’s underlying securities, as well as a cash
payment generally equal to accumulated dividends of the securities (net of expenses) up to the time of deposits, and creation units are redeemed in kind for a portfolio of the underlying securities (based on the exchange-traded fund’s net asset value) together with a cash payment generally equal to accumulated dividends as of the date of the redemption. Most exchange-traded fund investors, however, purchase and sell exchange-traded fund shares in the secondary trading market on a securities exchange, in lots of any size, at any time during the trading day.
Among the shares of exchange-traded funds in which ETF Portfolio may invest are “iShares,” which are listed for trading on the American Stock Exchange, the New York Stock Exchange, the NYSE Arca, Inc., and the Chicago Board Options Exchange, among other exchanges. iShares represent an investment in a fund which seeks investment results that correspond generally to the price and yield performance, before fees and expenses, of a particular equity market index compiled by one of various index providers, including, but not limited to, Standard & Poor’s (a division of McGraw-Hill Companies, Inc.), Dow Jones & Company, Inc., the Frank Russell Company and Morgan Stanley Capital International.
Another similar investment vehicle in which the ETF Portfolio may invest is the Standard & Poor’s Depository Receipts (“SPDRs”), which represent interests in unit investment trusts that are designed to track the price and yield performance of particular market indexes provided by Standard & Poor’s (a division of the McGraw-Hill Companies, Inc.). SPDRs are also currently listed for trading on the American Stock Exchange.
Exchange-traded funds attempt not to concentrate its investments of equity securities in any particular industry or group of industries and will attempt to diversify their holdings among as many different industries and market segments as deemed appropriate in light of conditions prevailing at any given time.
Although equity securities have historically demonstrated long-term growth in value, their prices fluctuate based on changes, among other variables, in a company’s financial condition and general economic conditions. This is especially true in the case of smaller companies. Stock markets tend to move in cycles, with periods of rising stock prices and periods of falling stock prices.
Futures Strategies
The Portfolios may enter into stock index futures contracts that are traded on public exchanges. Under normal market conditions, the Puerto Rico Securities

11
Portion will be invested mostly in cash equivalents. By investing in futures contracts, the Investment Adviser is attempting to achieve a risk and return profile for the Portfolios that approximates the result that might be achieved by (i) investing the assets of the Puerto Rico Securities Portion in the securities comprising the stock index used as a benchmark for the relevant investment strategy and (ii) investing the assets of the Equity Portion in the assets selected by the Portfolio Manager or the Investment Adviser, as the case may be. No assurance can be given that such strategy will be successful or such results attained.
This strategy will offer the investor an investment alternative that offers greater exposure to the equity markets while complying with the requirement that at least 20% of the Portfolio’s assets be invested in Puerto Rico Securities.
The aggregate margin required to enter into futures contracts will at no time exceed 5% of the value of the Portfolio’s total assets (after taking into account unrealized gains and losses on such futures contracts).
Futures contracts provide for the future sale by one party and purchase by another party of a specified amount of a specific security at a specified future time and at a specified price. Stock index futures contracts are based on indices that reflect the market value of common stock of the firms included in the indices. By its terms, a futures contract provides for a specified settlement month in which, in the case of futures contracts, the difference between the price at which the contract was entered into and the contract’s closing value is settled between the purchaser and seller in cash. Futures contracts differ from options in that they are bilateral agreements, with both the purchaser and the seller equally obligated to complete the transaction. Futures contracts call for settlement only on the expiration date and cannot be “exercised” at any other time during their term. However, the vast majority of futures contracts are liquidated in advance by entering into an offsetting transaction.
The purchase or sale of a futures contract differs from the purchase or sale of a security or the purchase of an option in that no purchase price is paid or received. Instead, an amount of cash or cash equivalents, which varies but may be as low as 5% or less of the value of the contract, must be deposited with the broker as “initial margin.” Subsequent payments to and from the broker, referred to as “variation margin,” are made on a daily basis as the value of the futures contract fluctuates, making positions in the futures contract more or less valuable – a process known as “mark-to-market.” Assets
committed to futures contracts as margin will be segregated at the Portfolio’s custodian to the extent required by law.
Up to 100% of the Puerto Rico Securities Portion and, under normal market conditions, up to 5% of the Equity Portion may be held from time to time in cash equivalents (e.g., short-term money market securities such as prime-rated commercial paper, certificates of deposit, variable rate demand notes or repurchase agreements).
Principal Risks – All Portfolios
The following describes various general risks associated with the Portfolios. Each Portfolio may face different risks because each is independently managed, potentially resulting in significantly different portfolio compositions and performance results.
Other risks of investing in the Fund and its particular Portfolios, along with further detail about some of the risks described below, are discussed in the Fund’s Statement of Additional Information. Information on how you can obtain the Statement of Additional Information is on the back cover of this Prospectus.
Portfolio Risk. The performance of each Portfolio is highly dependent on the expertise and abilities of the Investment Adviser and, except for the ETF Portfolio, its respective Equity Portion Portfolio Manager, or any subadviser hired directly by the Investment Adviser, as applicable. The death, incapacity or retirement of its portfolio management team or a key member thereof could adversely affect its performance. There is no assurance that the investment approach used by the Investment Adviser or any or all of the Equity Portion Portfolio Managers or any subadvisers retained in the future will be successful, and certain Portfolios may be more or less successful than others. The overall success of investing in the Fund may depend on your ability to choose successfully from among the Portfolios.
An investment in the units offered by the Fund is designed primarily, and is suitable only, for long-term investors, and may not be suitable for all investors. Further, an investment in the Fund is not equivalent to an investment in the underlying securities of the Fund and investors in the units should not view the Fund as a vehicle for trading purposes.
Conflicts of Interest Risk. The Fund is not registered under the 1940 Act, and therefore is not subject to the restrictions regarding, among other things, transactions between the Fund and UBS Financial Services Incorporated of Puerto Rico or its affiliates,

12
including the Investment Adviser, or investment in or deposits with those of other affiliates of the Fund. It is anticipated that such transactions will take place, including instances in which one of the Fund’s affiliated entities may be the only dealer, or one of few dealers in the securities being purchased or sold by a Portfolio. In that event, independent sources for valuation or liquidity of a security may be limited or nonexistent. Each Portfolio may invest a substantial portion of its assets in those securities.
Each Portfolio may invest in securities issued by affiliates of the Investment Adviser and the Fund, or make deposits with those affiliates. In addition, each Portfolio generally will invest in equity securities using UBS Financial Services Inc. or other affiliates of the Investment Adviser as broker. A Portfolio’s use of an affiliated Equity Portion Portfolio Manager (or, for temporary investment, affiliated cash management vehicles, including affiliated money market funds) and its receipt of other services through the ACCESS program, which is sponsored by an affiliate of the Investment Adviser, will cause an increase in the overall compensation and profitability of the Fund to the Investment Adviser and its affiliates. Consequently, there is an inherent conflict of interest in a Portfolio’s use of the ACCESS program and the selection of affiliated Equity Portion Portfolio Managers. See Appendix A for a discussion of other conflicts of interest associated with investment in a Portfolio that utilizes an ACCESS account in connection with its Equity Portion.
The Investment Adviser, its affiliates, and certain of its employees may have and make investments with or engage in other transactions with certain of the Equity Portion Portfolio Managers or with portfolio managers that may be retained by the Fund or the Equity Portion Portfolio Managers now or in the future. The Investment Adviser and the Fund may have an incentive to select and retain Equity Portion Portfolio Managers, as well as subadvisers retained directly by the Investment Adviser, with which they make such investments or have other business relationships as opposed to other available investment managers.
As a result of the transactions and other dealings referred to above, the interests of the Investment Adviser may conflict with those of the Fund or a particular Portfolio or Portfolios.
In addition, while the Investment Adviser, the Equity Portion Portfolio Managers, and any other such subadvisers as the Investment Adviser may retain, will seek to allocate potential investments among the Fund and their other advisory clients in an equitable
manner, the procedures used may on occasion adversely affect one or more Portfolios or the Fund as a whole. See Appendix A for a discussion of the conflicts of interest associated with investment in a Portfolio that utilizes an ACCESS account.
Equity Risks. Common stocks and other equity securities generally are the riskiest investments in a company and their prices fluctuate more than those of other investments. They reflect changes in the issuing company’s financial condition and changes in overall market and economic conditions. It is possible that a Portfolio investing in equity securities may lose a substantial part, or even all, of its investment in a company’s stock.
Risks Associated with Investment in Puerto Rico Securities. Under normal conditions, each Portfolio will invest the Puerto Rico Securities Portion in cash equivalents. However, to the extent the Portfolios invest in other Puerto Rico securities, they will be more susceptible to economic, political, regulatory or other factors adversely affecting issuers in Puerto Rico than funds that invest to a lesser degree in Puerto Rico issuers. Each Portfolio’s ability to comply with certain legal and regulatory investment requirements is dependent upon the availability of securities of Puerto Rico issuers.
As a result, changes in the market value of a single investment in the Puerto Rico Securities Portion of each Portfolio could cause significant fluctuations in the Portfolio’s net asset value price. In addition, the investments in the Puerto Rico Securities Portion had previously been concentrated in the stocks of Puerto Rico financial institutions. Because market risk may affect a single issuer, industry (such as a Puerto Rico financial institution), or sector of the economy, the Portfolio may experience greater price volatility than if it held more diversified investments. For example, during the past four years, the PRSI has experienced significant volatility, including substantial price declines, due primarily to issues common to many of the Puerto Rico financial services firms, including restatements of earnings and resulting regulatory investigations and lawsuits.
Except for temporary defensive purposes or upon the proven scarcity of such securities, within six months following the initial issuance of a given Portfolio’s units, that Portfolio is required to invest at least 20% of its total assets in Puerto Rico Securities. There can be no assurance that Puerto Rico’s Office of the Commissioner of Financial Institutions will concur with the Investment Adviser’s assessment that such securities are unavailable because of their unreasonably high price or interest rates inconsistent with the Portfolios’ investment objectives. Any such
13
discrepancy between the assessment of the Investment Adviser and the Office of the Commissioner of Financial Institutions may possibly have a material adverse effect on the Portfolio’s over-all performance and its future operations.
If a Portfolio is unable to maintain the requisite level of Puerto Rico Securities, it will be restricted from further allocation of investments to the Equity Portion of such Portfolio until the requisite allocation to Puerto Rico Securities is achieved. In such case, the Investment Adviser and/or applicable Equity Portion Portfolio Manager are not required to dispose of equity portfolio securities in order to maintain the requisite allocation to Puerto Rico Securities. However, the Portfolio will not be permitted to invest the proceeds of newly-issued units in equity portfolio securities unless the applicable Portfolio’s Puerto Rico Securities represent at least 20% of its total assets at such time.
There presently are a limited number of participants in the market for certain securities of Puerto Rico issuers. In addition, certain Puerto Rico Securities may have periods of illiquidity. These factors may affect a Portfolio’s ability to acquire or dispose of such securities, as well as the price paid or received upon such acquisition or disposition. In addition, investment by a Portfolio in such securities is subject to their availability in the open market.
The obligations of certain issuers of Puerto Rico securities (and of fixed-income securities generally) are subject to the provisions of bankruptcy, insolvency and other laws affecting the rights and remedies of creditors. In the event of a bankruptcy of such an issuer, a Portfolio could experience delays and limitations with respect to the collection of principal and interest on such securities, and in some circumstances, the Portfolio might not be able to collect all principal and interest to which it is entitled. In addition, enforcement of the Portfolio’s rights in the event of a payment default by an issuer might increase the Portfolio’s operating expenses.
Futures. Each Portfolio may invest a portion of its Equity Portion in futures contract in the relevant stock index for that Portfolio. There are several risks accompanying the utilization of futures contracts. First, positions in futures contracts may be closed only on an exchange or board of trade that furnishes a secondary market for such contracts. While the Portfolios plan to utilize futures contracts only if there exists an active market for such contracts, there is no guarantee that a liquid market will exist for the contracts at a specified time. If there is no liquid market, then the entire Equities Portion will be invested with the Equity Portion Portfolio Manager
(or in ETFs, as the case may be) and the Puerto Rico Securities Portion will remain invested mostly in cash equivalents. As a result, the risk and return profile of the relevant Portfolio will no longer approximate the result that might be achieved by (i) investing the assets of the Puerto Rico Securities Portion in the securities comprising the stock index used as benchmark for the relevant investment strategy and (ii) investing the assets of the Equity Portion in the assets selected by the Equity Portion Portfolio Manager or Investment Adviser, as the case may be. Furthermore, because, by definition, futures contracts look to projected price levels in the future and not to current levels or valuation, market circumstances may result in there being a discrepancy between the price of the future and the movement in the underlying instrument or index. The absence of a perfect price correlation between the futures contract and its underlying instrument or index could stem from investors choosing to close futures contracts by offsetting transactions, rather than satisfying additional margin requirements. This could result in a distortion of the relationship between the index and futures market. In addition, because the futures market imposes less burdensome margin requirements than the securities market, an increased amount of participation by speculators in the futures market could result in price fluctuations. Also, the Portfolio will not be able to replicate exactly the performance of the relevant stock index because of the operational fees and expenses that the ETF Portfolio may incur or because of the temporary unavailability of certain of the securities underlying the index.
Because of the low margin deposits required, a relatively small price movement in a Futures Contract may result in immediate and substantial loss or gain to the investor. For example, if, at the time of purchase, 10% of the value of the Futures Contract is deposited as margin, a subsequent 10% decrease in the value of the Futures Contract would result in a total loss of the margin deposit, before any deduction for the transactions costs, if the account were then closed out. A 15% decrease would result in a loss equal to 150% of the original margin deposit if the Futures Contract were closed out. Thus, a purchase or sale of a Futures Contract may result in losses in excess of the amount invested in the Futures Contract. The Portfolio, however, would presumably have sustained comparable losses if, instead of the Futures Contract, it had invested in the underlying financial instrument and sold it after the decline.
Each Portfolio will enter into futures contracts in the stock index which reflects the investment strategy of the relevant Portfolio. By investing in futures
14
contracts, the Investment Advisor is attempting to achieve a return and risk profile for the Portfolio that approximates the result that might be achieved by (i) investing the assets of the Puerto Rico Securities Portion in the securities comprising the relevant stock index and (ii) investing the assets of the Equity Portion of each Portfolio in the applicable funds selected by the Equity Portion Portfolio Manager (except for the ETF Portfolio which is managed by the Investment Advisor), while still complying with the requirement to invest at least 20% of its assets in Puerto Rico assets. However, the Portfolios will not be able to replicate exactly the performance of the relevant stock index because of the operational fees and expenses that each Portfolio may incur or because of the temporary unavailability of certain of the securities underlying the index.
Most U.S. futures exchanges limit the amount of fluctuation permitted in Futures Contract prices during a single trading day. The daily limit establishes the maximum amount that the price of a Futures Contract may vary either up or down from the previous day’s settlement price at the end of a trading session. Once the daily limit has been reached in a particular type of Futures Contract, no trades may be made on that day at a price beyond that limit. The daily limit governs only price movement during a particular trading day and therefore does not limit potential losses, because the limit may prevent the liquidation of unfavorable positions. Futures Contract prices have occasionally moved to the daily limit of several consecutive trading days with little or no trading, thereby preventing prompt liquidation of futures positions and subjecting some futures traders to substantial losses.
Futures contracts are purchased in minimum sizes, which are determined by the applicable exchange. As a result, it is possible that Portfolio will not have sufficient assets to purchase the minimum amount of futures contracts. In addition, the minimum size requirement may result in an exposure to futures contracts which is somewhat greater, or less than, the result that would be achieved if the assets of the Puerto Rico Securities Portion were invested in the securities comprising the relevant stock index.
Industry Concentration Risk. Each Portfolio may concentrate its investments in a particular industry or business segment. To the extent that a Portfolio assumes a large position in a particular industry or business segment, that Portfolio will be more exposed to the price movements of companies in that industry more than a more broadly diversified investment and that Portfolio may perform poorly during a downturn in that industry.
Credit and Interest Rate Risks. Under normal market conditions, the Puerto Rico Securities Portion will be invested mostly in cash equivalents. The Portfolios are also authorized with respect to their Puerto Rico Securities Portions to invest in bonds and other income-producing securities, such as preferred stock. These securities are subject to credit risk and interest rate risk.
Credit risk is the risk that the issuer of a bond will not make principal or interest payments when they are due. Even if an issuer does not default on a payment, a bond’s value may decline if the market anticipates that the issuer has become less able, or less willing, to make payments on time. Even high quality bonds are subject to some credit risk. However, credit risk is higher for lower quality bonds. Bonds that are not investment grade involve high credit risk and are considered speculative. The Portfolios may invest in preferred stock and subordinated debt of Puerto Rico issuers that may be unrated or rated below investment grade, provided that either (i) the issuer of such preferred stock or subordinated debt has senior unsecured debt rated investment grade by a nationally recognized statistical rating organization or (ii) if such issuer does not have senior unsecured debt rated investment grade, the Fund’s Investment Adviser determines that such issuer’s senior unsecured debt is of comparable credit quality. The Portfolios also may invest in other debt securities rated below investment grade, or that the Fund’s Investment Adviser determines to be below investment grade quality, provided that the amount invested in such debt securities may not exceed 5% of the Puerto Rico Securities Portion of a Portfolio’s total assets.
The value of bonds generally can be expected to fall when interest rates rise and to rise when interest rates fall. Interest rate risk is the risk that interest rates will rise, so that the value of a Portfolio’s investments in bonds will fall. The impact of changes in the general level of interest rates on lower quality bonds may be greater or less than the impact on higher quality bonds.
Derivatives Risk. Each Portfolio may use derivatives with respect to the Puerto Rico Securities Portion. The use of derivatives, including structured securities, because of their increased volatility and potential leveraging effect, may adversely affect a Portfolio. For example, securities linked to an index and inverse floating rate securities may subject a Portfolio to the risks associated with changes in the particular indices, which may include reduced or eliminated interest payments and losses of invested principal. Such investments, in effect, may also be leveraged, magnifying the risk of loss. Even when
15
derivative instruments are used for hedging purposes, there can be no assurance that the hedging transactions will be successful or will not result in losses, and those losses may exceed the percentage of a Portfolio’s assets actually invested in such instruments. The Portfolios are not required to use hedging and may choose not to do so.
Non-Diversification Risk. One or more of the Portfolios may be non-diversified, in that it invests in securities of a smaller number of issuers. In that event the Portfolio’s risk is increased because developments affecting an individual issuer may have a greater impact on the Portfolio’s performance.
It is also possible that two or more Portfolios in which you invest may on occasion take substantial positions in the same security or group of securities at the same time. A possible lack of diversification caused by these factors could result in rapid changes in the value of your investment.
Illiquid Securities. Each Portfolio may invest up to 15% of its net assets in illiquid securities. Illiquid securities face the risk that they may not be readily sold, particularly at times when it is advisable to do so to avoid Portfolio losses. It is presently anticipated that illiquid investments may be made with respect to the Puerto Rico Securities Portion of each Portfolio.
Repurchase Agreement Risk. The Puerto Rico Securities Portion of each Portfolio may invest in securities as part of a repurchase agreement, where such Portfolio buys a security from a counter-party, which agrees to repurchase the security at a mutually agreed upon time and price in a specified currency. If a counter-party to a repurchase agreement defaults, a Portfolio may suffer time delays and incur costs or possible losses in connection with the disposition of the securities underlying the repurchase agreement. In the event of default, instead of the contractual fixed rate of return, the rate of return to a Portfolio will depend on intervening fluctuations of the market values of the underlying securities and the accrued interest on the underlying securities. In that event, a Portfolio would have rights against the counter-party for breach of contract with respect to any losses resulting from those market fluctuations.
• Other Investment Companies – Each Portfolio may invest, to the extent consistent with applicable law, in other investment companies including exchange traded funds and affiliated or unaffiliated money market funds. The return on investments in other investment companies will be reduced by the operating expenses, including investment advisory and administration fees, of such investment
companies and there will be a layering of certain fees and expenses.
Unlike traditional open-end mutual funds, the shares of exchange traded funds are bought and sold based on market values throughout each trading day. For this reason, shares may trade at a premium or a discount to their net asset value. If an exchange traded fund held by a Portfolio trades at a discount to net asset value, the Portfolio could lose money even if the securities held by the exchange traded fund appreciate in value.
Reverse Repurchase Agreement Risk. Each Portfolio with respect to its Puerto Rico Securities Portion may also engage in reverse repurchase agreements, where the Portfolio sells a security to a counter-party and agrees to buy it back at a specified time and price in a specified currency. Reverse repurchase agreements involve the risk that the buyer of the securities sold by a Portfolio might be unable to deliver the securities when a Portfolio seeks to repurchase them and may be unable to replace the securities or only at a higher cost. If the buyer of securities under a reverse repurchase agreement files for bankruptcy or becomes insolvent, the buyer may receive an extension of time to determine whether to enforce a Portfolio’s obligation to repurchase the securities, and such Portfolio’s use of the proceeds of the reverse repurchase agreement may be severely restricted during that extension period.
Segregation of Portfolios. The Fund intends to segregate the assets of each Portfolio to the fullest extent possible. The Fund intends that unitholders of a specific Portfolio have the exclusive right to the assets, income, gains and profits derived from that Portfolio. Additionally, the expenses, deductions and costs properly attributable or allocated to each Portfolio, including any administrative and portfolio management fees, will be deducted only from the assets of such Portfolio. The Fund also intends that creditors of any Portfolio only will have recourse to the assets in that Portfolio. There can be no assurance, however, that efforts to effect this segregation of assets and liabilities will be successful, nor that a court, in the event of the Fund’s or a Portfolio’s bankruptcy, would regard the Portfolios as separate entities for purposes of determining the bankruptcy estate.
Principal Risks – Portfolios using ACCESS
The following describes various risks of investing in a Portfolio of the Fund which uses ACCESS. For a description of additional important information associated such Portfolio’s participation in the ACCESS Program, please see Appendix A.

16
Equity Portion Portfolio Manager Selection Risk. Presently, for the Equity Portion of the Portfolios (other than the ETF Portfolio), the Fund offers a selection of managers chosen exclusively from among those available under the ACCESS program. While the Fund might not have available certain other subadvisers that it might otherwise have sought to retain and which might have performed differently from the Equity Portion Portfolio Managers, the Fund’s use of the ACCESS program provides investors with management options that may not have been otherwise available due to high minimum account balance requirements and expenses associated with direct retention of many subadvisers. The Investment Adviser generally relies on certain due diligence performed by UBS Financial Services Inc. in connection with selecting and evaluating Equity Portion Portfolio Managers from among those offered by the ACCESS program. The limited availability of direct due diligence could result in risks similar to those described below under Equity Portion Portfolio Manager Oversight Risks.
Equity Portion Portfolio Manager Oversight Risks. Except for the ETF Portfolio, the Investment Adviser does not control the day-to-day management of the Equity Portion of the Portfolios’ assets and thus may not have access to information concerning the securities positions of each Portfolio at any given point in time. Furthermore, each Equity Portion Portfolio Manager or subadviser makes trading decisions on behalf of its Portfolio independently, creating the possibility that one or more Portfolios could take positions which may be opposite of positions taken by other Portfolios. Also, although the Investment Adviser receives detailed information about the Equity Portion Portfolio Managers and subadvisers on a continuing basis regarding performance and investment strategies, any time delay in receiving that information may make it more difficult for the Investment Adviser to monitor the performance of such Equity Portion Portfolio Manager or subadviser and its compliance with the Fund’s investment policies and restrictions. Additionally, the Investment Adviser may have more limited access to information that might be relevant to monitoring the activities of the Equity Portion Portfolio Managers engaged by the Fund through the ACCESS program, such as their trading practices, including best execution and soft dollar practices, because the Investment Adviser will not directly engage such Equity Portion Portfolio Managers. UBS Financial Services Inc. also might not have available relevant information concerning an Equity Portion Portfolio Manager at any given time. Consequently, among other things, the Investment
Adviser may be less likely to be aware of any potential regulatory, compliance, or other issues related to the Equity Portion Portfolio Managers’ management of the Portfolios, which could cause investors to lose money. In addition, the Investment Adviser lacks direct contractual authority over the activities of the Equity Portion Portfolio Managers, and has no ability to affect such activities other than by withdrawing the respective Portfolio’s ACCESS account investments from the applicable Equity Portion Portfolio Manager, even though UBS Financial Services Inc. is an affiliate of the Investment Adviser. The Investment Adviser does not control the amount paid to a given Equity Portion Portfolio Manager by UBS Financial Services Inc.
Small and Mid Cap Company Risk. Certain Portfolios may invest to a significant degree in securities of mid and small cap companies which may generally involve greater risk than securities of larger capitalization companies because they may be more vulnerable to adverse business or economic developments. Small cap companies may also have limited product lines, markets or financial resources, and they may be dependent on a relatively small management group. Securities of small cap companies may be less liquid and more volatile than securities of larger companies or the market averages in general. In addition, small cap companies may not be well-known to the investing public, may not have institutional ownership and may have only cyclical, static or moderate growth prospects.
Foreign Securities Risk. The international Portfolios invest primarily in sponsored and unsponsored ADRs representing interests in underlying securities issued by foreign issuers. ADRs are receipts typically issued by a U.S. bank or trust company evidencing ownership of the underlying securities of foreign issuers. Generally, ADRs in registered form are denominated in U.S. dollars and are designed for use in the U.S. securities markets. Thus, these securities are not denominated in the same currency as the securities into which they may be converted. ADRs and securities issued by foreign issuers are subject to certain risks. These risks include many of the risks applicable to foreign securities generally, such as difficulties in pricing securities, defaults on foreign government securities, difficulties enforcing favorable legal judgments in foreign courts and political and social instability, as well as the risk of confiscatory taxation or nationalization, and less comprehensive disclosure requirements for the underlying security. In addition, the issuers of the securities underlying unsponsored ADRs are not obligated to disclose material information in the United States and, as a result, there may be less

17
information available regarding such issuers and there may not be a correlation between such information and the market value of the ADRs.
Principal Risks – ETF Portfolios
The following describes various risks of investing in the ETF Portfolio.
Fund of Fund Risks – The ETF Portfolio pursues its investment objective by investing its assets primarily in underlying exchange-traded funds rather than investing directly in stocks or other investments. The ETF Portfolio’s investment performance depends heavily on the investment performance of the underlying exchange-traded funds in which it invests. An investment in the ETF Portfolio, because it is a fund of funds, is subject to the risks associated with investments in the underlying exchange-traded funds in which it invests. The ETF Portfolio will indirectly pay a proportional share of the asset-based fees of the underlying exchange-traded funds in which it invests.
There is a risk that the Investment Adviser’s evaluation and assumptions regarding a broad asset class or the underlying exchange-traded funds in which the ETF Portfolio invests may be incorrect based on actual market conditions. In addition, at times the segment of the market represented by an underlying exchange-traded fund may be out of favor and under perform other segments. There can be no assurance that the underlying exchange-traded funds will achieve their investment objectives, and the performance of the underlying exchange-traded funds may be lower than the asset class that they were selected to represent. The underlying funds may change their investment objectives or policies without the approval of the ETF Portfolio. If that were to occur, the ETF Portfolio might be forced to withdraw its investment from the underlying exchange-traded fund at a time that is unfavorable to the ETF Portfolio.
Exchange-Traded Funds. An investment in the ETF Portfolio is not equivalent to an investment in the underlying assets held by the ETF Portfolio because of the operational fees and expenses incurred by the ETF Portfolio. The ETF Portfolio currently anticipates that the portion of its assets invested in equity securities will be primarily invested in shares of exchange-traded index funds. Index funds invest in a portfolio of securities that are designed to track closely the price and yield performance of different market indexes or segments. However, such funds will never be able to do so exactly because of operational fees and expenses incurred by the fund or because of the temporary unavailability of certain of the securities underlying the index. The market price
of this type of investment on the securities exchange on which they are traded may be lower than their net asset value. The difference in price may be due to the fact that the supply and demand in the market for shares in the investment vehicle at any time is not always identical to the supply and demand in the market for the basket of securities underlying the particular index.
Investors should also be aware that by investing in the ETF Portfolio, they may, in effect, incur the costs of two levels of investment management fees, (1) the fees charged for services provided by the Investment Adviser to the ETF Portfolio and (2) the fees charged for services provided by the managers or advisers of the various funds in which the ETF Portfolio may invest.
• Management Risk – The Investment Adviser has no previous experience directly managing a broad portfolio of equity securities, including securities of exchange-traded funds.
Additional Risks
Restrictions on Offer, Purchase, Liquidity and Transfer of Fund Units. Units of the Fund have not been registered with the U.S. Securities and Exchange Commission under the U.S. Securities Act of 1933, as amended, and the Fund has not been registered under the 1940 Act. Consequently, Fund units may be offered, sold or otherwise transferred exclusively to Puerto Rico Residents, meaning individuals whose principal residence is in Puerto Rico and corporations and other business organizations whose principal office and place of business are in Puerto Rico, provided that if such person is a trust, the trustee and all of the trustee beneficiaries must be Puerto Rico Residents. Any sale or transfer to a person (whether an individual or entity) who is not a Puerto Rico Resident will be deemed null and void and the Fund will not recognize the ownership rights of such person. Prior to the initial sale and each subsequent purchase of Fund units, including exchanges from one Portfolio to another, you will be required to represent in writing that the above conditions to purchase are satisfied or, in the case of purchases through UBS Financial Services Incorporated of Puerto Rico, to follow such other procedures as required for determining residency. Appendix C to this Prospectus contains, in letter form, the substance of representations that must be made. In addition, transfers of Fund units are not permitted except by operation of law and with the express written permission of the Administrator, and the transferee must first submit a letter in substantially the form

18
attached as Appendix C in the manner referred to above. Any investor failing to submit the requisite representation letter will be deemed to have accepted and acknowledged all of the terms included in the letter attached as Appendix C and the Fund reserves the right not to recognize such investor’s ownership and voting rights as unitholders of the Fund. In addition, such investor’s units may be involuntarily redeemed at the lower of cost or the then current net asset value of the investor’s units. If you cease to be a Puerto Rico Resident (or your trustee or beneficiaries cease to be Puerto Rico Residents, if applicable), you will no longer be able to invest in Fund units, except units issued in connection with automatic dividend reinvestment and you must, within 30 days from the occurrence of such event, notify your Financial Advisor, the Fund’s Transfer Agent or other securities dealer, as applicable, and redeem your units as soon as it becomes economically feasible to do so. Your units may also be redeemed involuntarily by the Fund or its Administrator in their sole discretion at net asset value. These restrictions shall remain in effect until such time as the Fund shall determine, based on an opinion of counsel, that the restrictions are no longer necessary in order to preserve an exemption from the registration requirements of the U.S. Securities Act of 1933, as amended or the U.S. Investment Company Act of 1940, as amended. In addition, if you do not satisfy the definition of Puerto Rico Investor (as defined in “Dividends and Taxes” beginning on p. 21), or not all of your beneficiaries are Puerto Rico Individuals, as defined in “Dividends and Taxes,” if applicable, you may no longer have available the tax benefits that make the Fund an attractive investment. When-Issued Securities and Delayed Delivery Transactions. Each Portfolio with respect to its Puerto Rico Securities Portion may invest in securities on a when-issued or delayed delivery basis. The purchase of securities on a when-issued or delayed delivery basis involves the risk that, as a result of an increase in yields available in the marketplace, the value of the securities purchased will decline prior to the settlement date. The sale of securities for delayed delivery involves the risk that the prices available in the market on the delivery date may be greater than those obtained in the sale transaction. At the time a Portfolio enters into a transaction on a when-issued or delayed delivery basis, it will segregate with the custodian cash or liquid instruments with a value not less than the value of the when-issued or delayed delivery securities.
The value of these assets will be monitored weekly to ensure that their marked to market value will at all times exceed the corresponding obligations of the Portfolio. There is always a risk that the securities may not be delivered, and the Portfolio may incur a loss.
Valuation Risk. There may be few or no dealers making a market in certain securities in which the Portfolios invest, particularly with respect to fixed-income securities of Puerto Rico issuers. Dealers making a market in those securities may not be willing to provide quotations on a regular basis to the Fund’s Investment Adviser or Equity Portion Portfolio Managers. It therefore may be particularly difficult to value those securities. In addition, since fees paid to the Investment Adviser or to an Equity Portion Portfolio Manager are based on the value of assets, there could be a conflict of interest in providing valuation information. Any inaccuracies in valuation could cause dilution of the Portfolio’s unit value if units of such Portfolio are purchased or redeemed at a higher or lower than accurate price.
In addition, to the extent that an Equity Portion Portfolio Manager of a given Portfolio must provide valuation information to the Fund in connection with valuing the assets of such Portfolio, the accuracy of the Portfolio’s valuation could be affected by factors outside the Fund’s or the Investment Adviser’s control.
Legislative and Regulatory Risk. Legislation affecting Puerto Rico Securities, assets other than Puerto Rico Securities, Puerto Rico and United States investment companies, taxes, and other matters related to the business of the Fund are continually being considered by the Legislature of Puerto Rico and the United States Congress. Moreover, the Office of the Commissioner of Financial Institutions of Puerto Rico has granted certain waivers and rulings to the Fund which do not constitute a precedent binding thereon. There can be no assurance that legislation enacted or regulations promulgated, or other governmental actions, after the date of the initial issuance of the units of the Fund will not have an adverse effect on the operations of the Fund, the economic value of the units of the Fund, or the tax consequences of the acquisition or the redemption of units in the Fund. For example, current tax law in the United States will reduce and may eventually permanently eliminate U.S. estate tax. In that event, the tax advantages for an investment in the Fund may be reduced.
Each Portfolio’s status as an investment company under the Puerto Rico Investment Companies Act is subject to certain legal requirements, including the
19
requirement that (i) each Portfolio at no time shall have fewer than eleven individual unitholders and (ii) the requirement that each Portfolio at no time shall have less than six persons owning more than 50% of the voting units of such Portfolio. These requirements become applicable one year after the initial issuance of units of a given Portfolio. In order to maintain its status as an investment company under the Puerto Rico Investment Companies Act, a Portfolio may need to take certain remedial steps, such as suspension or dilution of the voting rights of certain unitholders (as described under Dilution or Suspension of Unitholder Voting Rights), suspension or termination of redemption rights or mandatory liquidation of such Portfolio if the total number of unitholders decreases to the prohibited level.
In addition, while the Fund has adopted certain measures to mitigate certain risks, since the Fund is not an investment company registered under the 1940 Act, investors in the Fund do not have the benefit of the regulatory protections applicable to such companies. Those protections include, among other things, prohibitions on affiliated transactions, certain custody requirements for safekeeping of assets, various corporate governance matters, requirements for detailed compliance procedures, asset and share (or unit) valuation requirements, portfolio holding reporting requirements, and internal controls and procedures. For this reason, the Fund may be exposed to the risks that these protections are
designed to avoid, including dilution of unit values and arrangements that are detrimental to Fund.
Securities Lending. Although the Fund does not presently intend to engage in securities lending, the Portfolios are permitted to lend their securities in order to generate additional income pursuant to agreements that require that the loan be continuously secured by collateral consisting of cash or securities of the U.S. government or its agencies equal to a least 100% of the market value of the loaned securities. Collateral is marked to market weekly. There may be risks of delay in recovery of the securities or even loss of rights in the collateral, among other things, should the borrower of the securities fail financially or become insolvent or if investments made with cash collateral are unsuccessful.
Borrowings. The Fund, on behalf of each Portfolio, is permitted to borrow up to 5% of the Portfolio’s total assets from banks, including affiliates of the Fund, or other financial institutions for temporary or emergency purposes, including to meet redemptions of such Portfolio’s units. Borrowing by a Portfolio would create leverage and would entail speculative factors similar to those applicable to the issuance of preferred units, commercial paper or other debt securities. If borrowings are made on a secured basis, the custodian will segregate the pledged assets of such Portfolio for the benefit of the lender or arrangements will be made with a suitable sub-custodian, which may include the lender.
M A N A G I N G Y O U R F U N D A C C O U N T The Fund offers three classes of units for each Portfolio– the Class A units, Class C units and Class L units. Each class has different sales charges and ongoing expenses and they also may differ within each class as to those matters depending on the amount you invest. Investors should inquire as to the availability of any lower “breakpoint” charges or applicable sales charge waivers prior to making an investment.
Class A and Class C units are available only to purchasers meeting the initial aggregate investment requirement of $5,000 or more, with a minimum of $500 in a given Portfolio, and are subject to a minimum balance requirement of $500 in a given Portfolio. Class L units are available only to purchasers meeting the initial aggregate investment requirement of $1,000,000 or more, with a minimum of $500 in a given Portfolio, and are subject to a
minimum balance requirement of $500 in a given Portfolio.
Subsequent purchases of Class A, Class C or Class L units in a given Portfolio must be made in amounts of at least $100.
The Fund has adopted a unitholder distribution and servicing plan with respect to the Fund under which the Fund pays fees for services provided to its unitholders. Separately, the Fund has agreed to reimburse dealer expenses incurred in retaining an independent agent to provide customer recordkeeping and certain other services to the dealers.
The Fund initially pays for any advertising and other marketing expenses, subject to the Distributor’s obligation to reimburse the Fund within ten (10) days of the first business day of the month after which such expenses were incurred.
20
Units in each of the Portfolios may not be acquired in connection with any individual retirement account, or for any employee benefit plan subject to Section 406 of the Employee Retirement Income Security Act of 1974, as amended, or to Section 4975 of the Internal Revenue Code of 1986, as amended, or to any comparable provisions of any subsequent law, or by a trustee of any such plan.
Class A Units
Class A units are sold at the net asset value of the particular Portfolio’s Class A units next calculated after the purchase order is placed, plus an initial sales charge of up to 5.00%. Class A units of the Portfolios are subject to an annual unitholder servicing fee, payable monthly, of 0.25% and an annual distribution fee, payable monthly, of 0.10% of the average weekly net assets of Class A units. The initial sales charge may be reduced or waived for certain purchases.
Class A unitholders will pay a redemption fee of 1.00% on exchanges, including exchanges between Portfolios, made within 60 days of purchase based on net asset value at the time of redemption. Each acquisition of units in a new Portfolio upon an exchange will be considered a new purchase. The redemption fee will not apply to units acquired through dividend reinvestments if they are being redeemed as part of an exchange between Portfolios. The redemption fee will, however, subsequently be applicable to those units that are acquired in exchanges between Portfolios if such units are redeemed within the applicable periods.
The sales charges applicable to purchases of Class A units of the Portfolios are as follows:
Class A Unit Sales Charges
Amount Of
Investment
% of Offering
Price
% of Amount Invested
Dealer’s Reallowance
As % of Offering Price
Less than $50,000 5.00% 5.26% 4.25% $50,000 – $99,999 4.50% 4.71% 3.75%
$100,000 – $249,999 4.00% 4.17% 3.25% $250,000 – $999,999 3.50% 3.63% 2.75% $1,000,000 and over 2.50% 2.56% 2.00%
The sales charges shown above apply to the aggregate of purchases of Class A units by any individual, his or her spouse and children under age 21 whose principal residence is within Puerto Rico purchasing units for his or her own account(s). Investors should inquire as to the availability of lower “breakpoint” charges prior to making an investment. To determine whether you qualify for a reduction or waiver of sales charges on sales of Class
A units, see “Initial Sales Charge Waivers - Class A and Class C Units” and “Sales Charge Reductions for Class A Units.”
Sales Charge Reductions for Class A Units
If you purchase under a Right of Accumulation, you are permitted to obtain a reduced sales charge by aggregating the dollar amount of the new purchase and the total net asset value (using the higher of the purchase price or the current net asset value) of all Class A units or shares designated class A, class B, class C or class Y of certain other UBS-sponsored funds (as specifically listed in the Fund’s Statement of Additional Information) that you already hold and applying the sales charge applicable to such aggregate.
Class C Units
Class C units are sold at net asset value of the particular Portfolio’s Class C units next calculated after the purchase order is placed, plus an initial sales charge of up to 1.00% which includes a dealer’s reallowance of 0.50%. Under the terms of the Dealer Agreement, the Dealer is authorized to collect the gross proceeds from the sale of Class C units, remit to UBS Financial Services Incorporated of Puerto Rico (the Distributor) the difference between the sales charge and the reallowance, and retain the reallowance.
Class C units will be subject to an annual service fee, payable monthly, of 0.25% of the average weekly net assets and an annual distribution fee, payable monthly, of 0.75% of the average weekly net asset value of the Class C units. Class C unitholders will pay a redemption fee of 1.25% on redemptions made within six months of purchase, 1.00% on redemptions made after six months but within twelve months of purchase, and 0.50% on redemptions made after twelve months but within eighteen months of purchase, in each case based on the lower of the net asset value at the time of purchase or the net asset value at the time of redemption. No redemption fee is charged on redemptions of Class C units occurring after eighteen months of purchase. The redemption fee schedule above will not apply to redemptions made as part of an exchange between Portfolios. In the case of redemptions made as part of such an exchange, Class C unitholders will pay a redemption fee of 1.00% on exchanges made within 60 days of purchase based on net asset value at the time of redemption. No redemption fee is charged on exchanges of Class C units occurring after 60 days of purchase.

21
Initial Sales Charge Waivers – Class A and Class C Units
Investors should inquire as to the availability of sales charge waivers prior to making an investment. You will qualify for a waiver of sales charges on sales of Class A or Class C units if you:
• represent that the purchase (i) of Class A units will be made with the proceeds from the redemption or sale of class A or class B shares or units, and (ii) of Class C units will be made with the proceeds from the redemption or sale of the same class shares or units, and that such shares or units are of: (a) any investment company registered under the 1940 Act for which UBS Global Asset Management or any of its affiliates serves as principal underwriter or (b) any UBS Financial Services Incorporated of Puerto Rico-sponsored fund that seeks to provide its investors capital growth;
• notify the Distributor prior to such redemption or sale; and
• purchase the Class A or Class C units within 60 days of such redemption or sale. Pending such purchase, the redemption or sale proceeds must be held in cash or cash equivalents.
You will also qualify for a waived sales charge on purchases of Class A or Class C units in the following circumstances:
• You are an employee of UBS AG or its subsidiaries or are a member of the employee’s immediate family;
• You are a unitholder of any other investment company in connection with the combination of such company with the Fund or a Portfolio by merger, acquisition of assets or otherwise;
• You acquired your units through reinvestment of capital gains distributions and dividends;
• If your financial advisor is a UBS Financial Services Incorporated of Puerto Rico Financial Advisor who was formerly employed as an investment executive with a competing brokerage firm, and
– you were the financial advisor’s client at the competing brokerage firm;
– within 90 days of buying units in the Portfolio, you sell shares or units of one or more mutual funds that were principally underwritten by the competing brokerage firm or its affiliates, and you either paid a sales charge to buy those shares, pay a
contingent deferred sales charge when selling them or held those shares until the contingent deferred sales charge was waived; and
– you purchase an amount that does not exceed the total amount of money you received from the sale of the other mutual fund; or
• You have redeemed Class A or Class C units after holding such units in a given Portfolio for at least 60 days before redeeming and wish to reinvest those redemption proceeds in the Fund within 60 calendar days of the redemption.
• The purchase is made by or on behalf of financial intermediaries for clients that pay the financial intermediaries’ fees in connection with fee-based programs, provided that the financial intermediaries or their trading agents have entered into special arrangements with the Fund and/or UBS Financial Services Incorporated of Puerto Rico specifically for such purchases.
In order to obtain such discounts, you must provide sufficient information at the time of purchase to permit verification that the purchase would qualify for the elimination of the sales charge and that you comply with the Puerto Rico residency requirements of investing in the Fund. The Fund reserves the right to modify the waiver criteria described above upon sixty days advance notice to unitholders.
Class L Units
Class L units in the Portfolios are sold at net asset value next calculated after the purchase order is placed. Class L units are subject to a much higher minimum investment than other classes of units. Class L will be subject to an annual service fee, payable monthly, of 0.25% of the average weekly net assets and an annual distribution fee, payable monthly, of 0.50% of the average weekly net asset value of the Class L units. Class L unitholders will pay a redemption fee of 1.25% on redemptions made within six months of purchase, 1.00% on redemptions made after six months but within twelve months of purchase, and 0.50% on redemptions made after twelve months but within eighteen months of purchase, in each case based on the lower of the net asset value at the time of purchase or the net asset value at the time of redemption. No redemption fee is charged on redemptions of Class L units occurring after eighteen months of purchase. The redemption fee schedule above will not apply to redemptions made as part of an exchange between Portfolios. In

22
the case of redemptions made as part of such an exchange, Class L unitholders will pay a redemption fee of 1.00% on exchanges made within 60 days of purchase based on net asset value at the time of redemption. No redemption fee is charged on exchanges of Class L units occurring after 60 days of purchase.
Class Selection Factors
Each Portfolio offers three classes of units, Classes A, Class C and Class L, each of which represent interests in the particular portfolio of securities. All unit classes charge annual fees to cover expenses, with Class A units having the lowest overall annual fees of the three Fund classes. Annual Fund fees include management fees, 12b-1 distribution fees, administration fees and other Fund expenses.
In addition to the annual fees, the Class A and Class C units also impose an initial sales charge, which can be as high as 5.00% for Class A units in the Portfolios. Class C units charge an initial sales charge of 1.00%. Class A units impose redemption fees that may be as high as 1.00%. The Class C and Class L units impose redemption fees that may be as high as 1.25%.
The initial sales charges can be reduced or eliminated depending upon the amount of your total investments in the Fund or based on other factors listed above (See “Initial Sales Charge Waivers - Class A and Class C Units”). The redemption fees can be reduced or eliminated based on how long you hold the Portfolio’s units.
When you purchase units of any given Portfolio, you should consider the size of your investment and how long you plan to hold your units. Your Financial Advisor or selected securities dealer can help you determine which class of units is best suited to your financial goals.
Buying Units
Important Information About Procedures for Opening a New Account. To help the United States government fight the funding of terrorism and money laundering activities, United States Federal law requires all financial institutions to obtain, verify, and record information that identifies each person who opens an account.
When you open an account, we will ask for your name, address, date of birth and other information that will allow us to identify you. We may also ask to see your driver’s license or other identifying documents. If you do not provide the information requested, the Fund may not be able to maintain your account. If the Fund is unable to verify your identity,
the Fund reserves the right to close your account and/or take such action it deems reasonable or required by law. If your account is opened with a dealer rather than directly with the Fund, similar requirements will apply.
Purchasing Portfolio Units. To purchase Portfolio units, you must be a Puerto Rico Resident (as described above). Purchasers of units in the Portfolios must purchase the units through a brokerage account maintained with UBS Financial Services Incorporated of Puerto Rico, as dealer, or in Puerto Rico with another dealer that has entered into a selected dealer agreement with the Distributor or directly through the Transfer Agent (which is also UBS Financial Services Incorporated of Puerto Rico, referred to herein as the “Distributor”).
UBS Financial Services Incorporated of Puerto Rico and certain other dealers may charge their clients an annual account maintenance fee.
Purchase orders for Fund units are priced according to the net asset value next determined after the order is placed, calculated every Wednesday (or next business day thereafter if such Wednesday is not a business day), for each class of each Portfolio as of the close of trading on the New York Stock Exchange, unless otherwise disclosed in the applicable Appendix B section for a particular Portfolio. The Fund is deemed to have received a purchase or redemption order when the Distributor or selected dealer receives the order in good form. It is the responsibility of such financial institution to send your order to the Fund promptly. Payment is due on the business day on which the order is priced and the purchase will be affected as of that day. Payments received in advance of such date will not be invested until the next calculation of the Fund’s weekly pricing occurs. Payments will be held in your brokerage account until such time as they are invested in the Fund. A business day is any day that the New York Stock Exchange is open for trading. The New York Stock Exchange is not open for trading on: New Year’s Day, Martin Luther King, Jr. Day, Presidents’ Day, Good Friday, Memorial Day, Independence Day, Labor Day, Thanksgiving Day and Christmas Day.
Fund units purchased through the Distributor or other dealer may be held by such entity as nominee for each unitholder. Fund units purchased will in that case be registered in the name of the nominee by the Fund’s Transfer Agent, UBS Trust Company of Puerto Rico. Each beneficial owner of Fund units must nevertheless deliver to the Distributor or to such other dealer a letter of representation in the form of Appendix C, which the Distributor or other dealer
23
will be contractually obligated to the Fund to obtain in proper form, or, if purchasing units directly through the Distributor, must comply with any other procedures that the Distributor adopts to verify residency. Notwithstanding the foregoing, if a purchaser of Fund units fails to deliver such letter of representation, any such purchase of Fund units will be deemed to constitute an acceptance and acknowledgment of all of the terms of such letter of representation. Portfolio unit certificates are issued only to unitholders maintaining at least a $1,000,000 aggregate investment in the Fund and only upon a unitholder’s written request to the Fund.
The Fund and the Distributor reserve the right to reject a purchase order or suspend the offering of Fund units.
Minimum Investments and Account Size
Investors may open an account with respect to the Class A and Class C units of the Fund by making a minimum initial investment of at least $5,000 in the Fund and at least $500 in each Portfolio selected by investors. Investors who wish to open a Class L account of the Fund, may do so only by making a minimum initial investment of $1,000,000 in the Fund and at least $500 in each Portfolio selected by such investors. Subsequent investments may be made of at least $100 for Class A, Class C and Class L units.
In addition, investors may invest in Class L units by means of a written Letter of Intent, which expresses the investor’s intention to invest at least $1,000,000 within a period of 13 months in Class L units of one or more Portfolios. Such Class L Units will be exchanged for Class A units if the full amount indicated is not purchased within 13 months, and the investor will owe the fees that would have been charged if it had purchased Class A units. Class L units may be redeemed from the investor’s account to cover the amount owed. The exchange of Class L units to Class A units may result in a taxable gain or loss. Investors are urged to consult their own tax advisors with specific reference to their own tax situations.
Investors will not receive credit for units purchased by the reinvestment of distributions.
The Letter of Intent is not a binding obligation upon the investor to purchase the full amount indicated; subject to the imposition of the sales charges described herein. The minimum initial investment under a Letter of Intent is $50,000, which must be invested immediately. Class L units purchased with the first $50,000 will be held in escrow to secure payment of the sales charge applicable to the Class A
units actually purchased if the full amount indicated is not purchased. When the full amount indicated has been purchased, the escrow will be released. If an investor desires to redeem escrowed Class L units before the full amount has been purchased, the Class L units will be released only if the investor pays the sales charge that, without regard to the Letter of Intent, would have been charged if Class A units had been purchased.
Letter of Intent forms may be obtained from UBS Financial Services Incorporated of Puerto Rico. Investors should read the Letter of Intent carefully.
The Fund reserves the right to change minimum investment requirements in connection with any offering, to decline any order to purchase Portfolio units and to determine at any time not to offer Portfolio units or to terminate an offering. The Fund has the right to reject any purchase or additional purchases.
Exchanges From One Portfolio to Another
You may exchange units of one Portfolio for units of the same class in another Portfolio without charge by contacting a Financial Advisor, other selected dealer or the Transfer Agent, except that a redemption fee of 1.00% will be applicable for exchanges of units made within 60 days of the initial purchase.
Consult your Financial Advisor or the selected securities dealer to determine which exchanges are permissible. You may effect an exchange through the Transfer Agent by writing to the Transfer Agent at the address listed under the caption “Management — Administrator and Transfer Agent” in this Prospectus. Your letter must include:
• your name and address;
• the name of the Portfolio whose units you are selling, the Class of such units and the name of the Portfolio whose units you want to buy;
• your account number;
• the number or dollar amount of units to be sold; and
• the signature of each registered owner exactly as the units are registered.
Units may not be exchanged unless the unitholder is a Puerto Rico Resident and a letter in the form attached as Appendix C is provided to the Distributor or other selected securities dealer at the time of such exchange or, if purchasing units directly through the Distributor, the unitholder complies with any other procedures that the Distributor adopts to verify such unitholder’s residency. The Fund reserves the right

24
to modify this exchange privilege upon sixty days advance notice to unitholders.
Distribution Reinvestment
Distributions on units will be reinvested automatically in full or fractional units of the same Portfolio at the net asset value per unit next determined after declaration of such distribution. You may at any time request to receive distributions in cash by contacting the Fund, your Financial Advisor at UBS Financial Services Incorporated of Puerto Rico or other selected securities dealer.
Market Timers
The interests of the Fund’s long-term unitholders and its ability to manage its investments may be adversely affected when its units are repeatedly bought and sold in response to short-term market fluctuations―also known as “market timing.” Market timing may cause a Portfolio to have difficulty implementing long-term investment strategies, because it cannot predict how much cash it will have to invest. Market timing also may force a Portfolio to sell portfolio securities at disadvantageous times to raise the cash needed to buy a market timer’s Fund units. These factors may hurt a Portfolio’s performance and its unitholders. The Fund presently does not have in place any procedures to monitor such activity and, as a result, the Fund remains subject to the above-mentioned risks.
The Fund, however, assesses redemption fees on redemptions and/or exchanges within certain periods in order to protect the Fund from the costs of short-term trading. Additionally, Fund management believes that market timing risk is mitigated because the Fund only permits weekly purchases and redemptions, resulting in a more limited opportunity for unit value arbitrage and an automatic holding period for unitholders generally of at least one week after the purchase of a unit.
Selling Units
You may redeem for cash all full and fractional Fund units every Wednesday (or the next business day thereafter, if such Wednesday is not a business day) at the unit price equal to the next calculated net asset value per unit of the relevant Portfolio after your order is received in good form. Both redemption orders that are received on days when the redemption option is not offered, and redemption orders received on a redemption date after the calculation of the applicable Portfolio’s net asset value on that date, will be effected on the next occurring redemption date at the unit price calculated on that date for the relevant Portfolio. Payment will generally be made
within seven days thereafter. It is possible that there will be delays in payments by the Fund upon redemption because, among other things, the relevant Portfolio may hold illiquid securities.
You may request a redemption in either oral or written form, provided that the Fund and UBS Trust Company of Puerto Rico, as Transfer Agent, and any dealer reserve the right to require such proof of ownership or other documentation as they deem appropriate. All redemption orders, including telephone redemptions, must be made through a financial advisor of a dealer. Redemption orders received may be rejected by the Fund at any time prior to their acceptance on the redemption date. If you are liquidating your holdings, you will receive upon redemption all distributions reinvested through the date of redemption. The value of Fund units at the time of redemption may be more or less than your initial cost, depending on the market value of the securities held by the relevant Portfolio at such time.
If you hold Fund units in more than one Class or Portfolio, any request for redemption must specify both the Portfolio and the Class being redeemed. In the event of a failure to specify which Portfolio and/or Class, or if you own fewer units of the Portfolio and/or Class than specified, the redemption request will be delayed until you provide further instructions to your Financial Advisor or other selected securities dealer. Certain redemptions may be subject to a redemption fee. The proceeds of redemption will be satisfied solely out of the assets of the Portfolio(s) in which you are invested and that you indicate in your redemption request, or the sale of such assets or borrowings by the Fund on behalf of such indicated Portfolio(s).
There may be instances in which the Fund may not be able to liquidate its investments due to, without limitation, market disruption or lack of economic feasibility. The Fund may suspend or modify redemptions at any time, including suspensions or modifications made in order to preserve a Portfolio’s status as an investment company under the Puerto Rico Investment Companies Act. The Fund may suspend redemption privileges for more than seven days only during periods when Puerto Rico or U.S. banks or the New York Stock Exchange are closed or trading on the New York Stock Exchange is restricted, or when an emergency exists that makes it not reasonably practicable for the relevant Portfolio to dispose of securities owned by it or to determine fairly the market value of its assets.
Portfolio units are generally not transferable except in special circumstances by operation of law and may
25
not be generally disposed of, except through redemption at the times specified.
Redemption Procedure You may redeem units only through your Financial Advisor, the Fund’s Transfer Agent or other selected securities dealer, as applicable. If you submit your redemption request in writing, your request must include:
• the Portfolio, the Class and number or dollar amount of units you want to redeem;
• your account number; and • the signature of each registered owner exactly as
the units are registered.
The Transfer Agent or a dealer may establish certain procedures for telephone or other redemption orders. If you request a redemption other than by mail, you must deliver such request no later than the redemption date.
If you are redeeming units through the Transfer Agent and (i) the units have an aggregate net asset value in excess of $10,000 or (ii) if you have made more than one redemption request in any 10 day period, your request must include a guarantee of each registered owner’s signature. A signature guarantee may be obtained from a financial institution, broker, dealer or clearing agency that is a participant in one of the medallion programs recognized by the Securities Transfer Agents Association. These are: Securities Transfer Agents Medallion Program (STAMP), Stock Exchanges Medallion Program (SEMP) and the New York Stock Exchange Medallion Signature Program (MSP). The Transfer Agent may not accept signature guarantees that are not a part of these programs.
Unless you direct your financial advisor otherwise, payment will be credited to your account within seven days of receipt of a proper notice of redemption as set forth above. If you purchased units directly through the Transfer Agent, payment will be mailed to your address of record within seven days of receipt of a proper notice of redemption as set forth above. However, such payment may be delayed, for example, because the Fund may be unable to sell sufficient assets of the relevant Portfolio or to borrow a sufficient amount of funds on behalf of such Portfolio.
The financial advisor and Transfer Agent may require additional supporting documents for redemptions made by corporations, executors, administrators, trustees or guardians. A redemption request will not be deemed properly received until the dealer and
Transfer Agent, as applicable, receive all required documents in a timely manner and in proper form.
Redemption Fees
If you exchange Class A units or redeem or exchange Class C or Class L units within specified periods after you purchase them, a redemption fee may be applicable, to be deducted at the time of the transaction as described above. This amount will be paid to the applicable Portfolio, not to the Investment Adviser. The redemption fee is designed to offset the costs associated with fluctuations in Portfolio asset levels and cash flow caused by short-term unitholder trading. Units held the longest will be redeemed first for purposes of calculating the redemption fee.
Additional Information
It costs the Fund money to maintain unitholder accounts. Therefore, the Fund and dealers reserve the right to repurchase all units in any account that has a net asset value of less than $500 per Portfolio. If the Fund elects to do this with your account, it will notify you that you can increase the amount invested to the applicable required amount or more within 60 days. This notice may appear on your account statement.
The Fund also has the right, at its, the Administrator’s or the dealers’ discretion, to involuntarily redeem or repurchase any units held by an investor that either of them reasonably believes has ceased to be a Puerto Rico Resident.
If you want to redeem Fund units that you purchased recently, the Fund may delay payment to assure that it has received good payment. If you purchased units by check, this can take up to 15 days.
Pricing and Valuation
The price of your Fund units is based on the net asset value of the Portfolio(s) in which you invest. Each Portfolio of the Fund calculates net asset value once each Wednesday (or the next business day thereafter if such a Wednesday is not a business day), as of the close of the New York Stock Exchange (generally 4 p.m. New York time). For purposes of determining the net asset value of a unit, the value of the securities held by the Portfolio plus any cash or other assets (including interest accrued but not yet received) minus all liabilities (including borrowings and accrued interest thereon and other accrued expenses) is divided by the total number of units outstanding at such time. Expenses, including the fees payable to the Investment Adviser, the Distributor and the Administrator, are accrued daily and paid monthly.
26
The net asset value per Portfolio unit is based solely on the value of the assets in the applicable Portfolio. In addition, the net asset value of each class of each Portfolio will differ as a result of differences in annual operating expenses (e.g., unitholder distribution and servicing fees) and will be computed separately. Your price for buying or selling Portfolio units will be the net asset value of the applicable Portfolio that is next calculated after the Fund accepts your order. Your Financial Advisor or other selected securities dealer is responsible for making sure that your order is promptly sent to the Fund when units are purchased in a manner other than through the automatic distribution reinvestment program described above.
Each Portfolio’s assets will be valued by the Administrator, with the assistance of the Investment Adviser, in good faith and under the supervision of the Portfolio’s Board of Directors. Securities that are listed or traded on a securities exchange are valued at the last available sale price on the principal exchange on which they are listed, and securities traded on the NASDAQ System are valued at the last sale price reported as of the close of trading on the NYSE on such Business Day. Portfolio securities traded in other over-the-counter markets are valued at the last available bid price in the over-the-counter market prior to the time of valuation. When market quotations for securities held by the Portfolios are not readily available, they will be valued at fair value by or under the direction of the Board of Directors utilizing quotations and other information concerning similar securities derived from recognized dealers in those securities or, in the case of fixed income securities, information regarding the trading spreads quoted by recognized dealers between such securities and U.S. Treasury securities whose maturities are determined to be most closely matched to the average life of the Fund’s securities. Dealers providing pricing information may include the Distributor, and in the case of certain securities held by the Portfolios, the Distributor might be the sole or best source of pricing information.
In determining net asset value, the Portfolios also may utilize the valuations of portfolio securities furnished by a pricing service approved by the Board of Directors. The pricing service typically values portfolio securities at the bid price or the yield equivalent when quotations are readily available. Portfolio securities for which quotations are not readily available are valued at fair market value on a consistent basis as determined by the pricing service using a matrix system to determine valuations.
The procedures of the pricing service and its valuations will be reviewed by the officers of the Portfolios under the general supervision of the Board of Directors. Prior to using a pricing service, the Board of Directors will determine in good faith that the use of a pricing service is a fair method of determining the valuation of portfolio securities.
Notwithstanding the above, fixed income securities for which market quotations are not readily available with maturities of 60 days or less, generally will be valued at amortized cost if their original term to maturity was 60 days or less, or by amortizing the difference between their fair value as of the 61st day prior to maturity and their maturity value if their original term to maturity exceeded 60 days, unless in either case the Board of Directors or an authorized committee hereof determines that this valuation method does not represent fair value. All other securities of the Portfolios for which quotations are not readily available from any source, will be valued at fair value utilizing quotations and other information concerning similar securities obtained by the Investment Adviser from recognized dealers in those securities or information regarding the trading spreads quoted by recognized dealers between such securities and United States Treasury securities whose maturities are determined by the Investment Adviser to most closely match the maturity or average life of the Portfolio’s securities for which market quotations are not readily available. These trading spreads are required to be confirmed weekly in writing to the Administrator by independent market makers. The price assigned to these securities will be verified periodically by the Board of Directors of the Portfolios.
When a Portfolio writes a call option, the amount of the premium received is recorded on the books of the Portfolio as an asset and an equivalent liability. The amount of the liability is subsequently valued to reflect the current market value of the option written, based upon the last sale price in the case of exchange-traded options or, in the case of options traded in the over-the-counter market, the last asked price. Options purchased by a Portfolio are valued at their last sale price in the case of exchange-traded options or, in the case of options traded in the over-the-counter market, the last bid price. Positions in futures contracts and options on futures are valued at settlement prices for such contracts established by the exchange on which they are traded, or if market quotations are not readily available, are valued at fair value on a consistent basis using methods determined in god faith by the Board of Directors.

27
M A N A G E M E N T
Investment Adviser
UBS Asset Managers of Puerto Rico, a division of UBS Trust Company of Puerto Rico, is the Investment Adviser of the Fund. The Investment Adviser is located at American International Plaza, Tenth Floor, 250 Muñoz Rivera Avenue, San Juan, Puerto Rico 00918. As of November 30, 2008, UBS Asset Managers of Puerto Rico serves as investment adviser or co-investment adviser to funds with combined portfolio assets of approximately $9.7 billion.
Leslie Highley, Jr. and Luis Cabrera are the portfolio managers of the Puerto Rico Securities Portion of each Portfolio.
Mr. Highley has been a Managing Director of UBS Trust Company of Puerto Rico since 2006 and a Senior Vice President of the Puerto Rico Investors Tax-Free Family of Funds since inception in 1995. From 1985 to 1993, Mr. Highley was the President of Dean Witter Puerto Rico, Inc. and a senior officer responsible for Corporate and Public Finance. Prior thereto, he was Executive Vice President of the Government Development Bank for Puerto Rico where he managed Investment and Treasury Operations, and also supervised Private Lending and the issuance of all Puerto Rico Government debt from 1977 to 1985.
Luis Cabrera has been a Director of UBS Trust Company of Puerto Rico since September 2007. Prior to joining UBS Trust Company of Puerto Rico, Mr. Cabrera was Adviser, Executive Vice President, Chief Investment Officer and Treasurer of FirstBank Puerto Rico, the second largest bank in Puerto Rico. Prior to his 10 year tenure at FirstBank, he was Director of the Asset Management Department of the Government Development Bank for Puerto Rico.
Leslie Highley, Jr. and Luis Cabrera are also the portfolio managers for the ETF Portfolio and are primarily responsible for the day-to-day management of its portfolio.
For information about other accounts managed by Messrs. Highley and Cabrera and their ownership of Fund units, please see the Statement of Additional Information.
The activities of the Investment Adviser and its affiliates may give rise to other conflicts of interest that could disadvantage the Fund and its unitholders. See the Statement of Additional Information for further information.
Information about the ACCESS program is provided in Appendix A. Information about the Equity Portion Portfolio Managers responsible for the day-to-day management of the Equity Portion of each Portfolio is provided in Appendix B.
Advisory Fees
Each Portfolio pays advisory fees to the Investment Adviser at a fixed annual rate based on the Portfolio’s average weekly net assets. The Investment Adviser pays fees to ACCESS in connection with investment advisory and other services provided to the Portfolios by the Equity Portion Portfolio Managers. The effective rate of compensation paid to the Investment Adviser and the amount paid to ACCESS for the previous fiscal year of the applicable Portfolio is provided in Appendix B.
Administrator and Transfer Agent
UBS Trust Company of Puerto Rico serves as Administrator and Transfer Agent of the Fund. UBS Trust Company of Puerto Rico is located at American International Plaza, Tenth Floor, 250 Muñoz Rivera Avenue, San Juan, Puerto Rico 00918. UBS Trust Company of Puerto Rico is a trust company organized and validly existing under the laws of Puerto Rico. UBS Trust Company of Puerto Rico may retain one or more sub-administrators and/or sub-transfer agents for the Fund.
Custodian
UBS Trust Company of Puerto Rico serves as Custodian of the Fund’s securities and cash. UBS Trust Company may retain one or more sub-custodians for the Fund. UBS Financial Services Inc. will act as sub-custodian for most securities purchased for a Portfolio by the Equity Portion Portfolio Managers.
Distributor
UBS Financial Services Incorporated of Puerto Rico serves as the Distributor of the units in the Portfolios.
Settlor and Trustee(s)
The Settlor of the Fund is UBS Financial Services Incorporated of Puerto Rico.
In selling units to its customers, however, it acts in its capacity as a dealer. The Trustee of the Fund is UBS Trust Company of Puerto Rico.

28
Disclosure of Portfolio Holdings
The Fund makes its top ten holdings, top five best performing stocks and five worst performing stocks
for the Equity Portion of each Portfolio available on a quarterly basis by posting the Fund’s Quarterly Review at www.ubs.com/financialservicesinc [search: Puerto Rico funds].
D I V I D E N D S A N D T A X E S
Dividends
Each Portfolio intends to distribute to its unitholders substantially all of the Portfolio’s net investment income. However, a Portfolio may elect to distribute less of its net investment income if, in the judgment of the Investment Adviser, such reduced distribution is in the best economic interests of the Portfolio’s unitholders. Such distributions, if any, shall be paid by the Fund on no less than an annual basis.
Units earn dividends on the day after they are purchased but not on the day they are sold.
You will receive dividends in additional units of the Portfolio (“Units”), unless you elect to receive them in cash. Contact your Financial Advisor at UBS Financial Services Incorporated of Puerto Rico or your selected securities dealer if you prefer to receive dividends in cash.
Taxes
THIS SECTION IS NOT TO BE CONSTRUED AS A SUBSTITUTE FOR CAREFUL TAX PLANNING. PROSPECTIVE INVESTORS ARE URGED TO CONSULT THEIR OWN TAX ADVISORS WITH SPECIFIC REFERENCE TO THEIR OWN TAX SITUATIONS, INCLUDING THE APPLICATION AND EFFECT OF OTHER TAX LAWS AND ANY POSSIBLE CHANGES IN THE TAX LAWS AFTER THE DATE OF THIS PROSPECTUS.
The following discussion is a summary of the material Puerto Rico and U.S. federal tax considerations that may be relevant to prospective investors in the Fund. The discussion in connection with the Puerto Rico tax considerations is based on the current provisions of the Puerto Rico Internal Revenue Code of 1994, as amended (the “Puerto Rico Code”), the regulations promulgated or applicable thereunder (the “Puerto Rico Code Regulations”), and the administrative pronouncements issued by the Puerto Rico Treasury Department (the “Treasury Department”); the Puerto Rico Municipal Property Tax Act of 1991, as amended (the “MPTA”) and the regulations promulgated thereunder; the Municipal License Tax
Act, as amended (the “MLTA”) and the regulations promulgated thereunder; and the Puerto Rico Investment Companies Act, as amended (the “PR-ICA”). The U.S. federal tax discussion is based on the current provisions of the Internal Revenue Code of 1986, as amended (the “Code”), the regulations promulgated thereunder (the “Code Regulations”) and administrative pronouncements issued by the US Internal Revenue Service (the “IRS”).
This discussion assumes that (i) the investors will be (a) individuals who for the entire taxable year (including the taxable year during which the Units are acquired) are bona fide residents of Puerto Rico for purposes of section 933 of the Code and residents of Puerto Rico for purposes of the Puerto Rico Code, who do not own 10% or more of the voting units of the Portfolio (the “Puerto Rico Individuals”), (b) corporations and partnerships organized under the laws of Puerto Rico, other than corporations and partnerships subject to a special tax regime under the Puerto Rico Code (the “Puerto Rico Entities”) and (c) trusts (other than business trusts), all of the beneficiaries of which are Puerto Rico Individuals, as described above (the “PR Trusts,” and jointly with the Puerto Rico Entities and the Puerto Rico Individuals, the “Puerto Rico Investors”), (ii) the Puerto Rico Entities will not be subject at any time to any special tax regime under the Code including, without limitation, the provisions of the Code that apply to “controlled foreign corporations,” “passive foreign investment companies,” or “personal holding companies,” and (iii) for each taxable year that Dividends (as defined below) are distributed by a Portfolio to its investors, the Portfolio will meet the 90% Distribution Requirement (as defined below). The Fund may not be a suitable investment for individuals who are not Puerto Rico Individuals. Unitholders who are corporations, business trusts or partnerships organized outside of Puerto Rico are urged to consult their own tax advisors with respect to the tax implications of the investment under the laws of the jurisdiction where they are organized.
Generally, an individual is a bona fide resident of Puerto Rico under the Code if he or she (i) is physically present in Puerto Rico for at least 183 days

29
during the taxable year, (ii) does not have a regular place of business in Puerto Rico, and (iii) has more significant contacts with Puerto Rico than with the United States or a foreign country. Prospective investors should consult their tax advisers as to whether they qualify as “bona fide residents of Puerto Rico” under the Code.
This discussion does not purport to deal with all aspects of Puerto Rico and U.S. federal taxation that may be relevant to other types of investors, particular investors in light of their investment circumstances, or to certain types of investors subject to special treatment under the Puerto Rico Code or the Code (e.g., banks, insurance companies or tax-exempt organizations). Unless otherwise noted, the references in this discussion to the Puerto Rico regular income tax will include the alternative minimum tax imposed on Puerto Rico Entities by the Puerto Rico Code.
The existing provisions of the statutes, regulations, judicial decisions, and administrative pronouncements, on which this discussion is based, are subject to change (even with retroactive effect).
The statements herein have been opined on by Adsuar Muñiz Goyco Seda & Pérez-Ochoa, P.S.C., counsel to the Fund. A prospective investor should be aware that an opinion of counsel represents only such counsel’s best legal judgment and that it is not binding on the Treasury Department, the Municipal Revenue Collection Center, any other agency or municipality of Puerto Rico, the IRS, or the courts. Accordingly, there can be no assurance that the opinions set forth herein, if challenged, would be sustained.
Puerto Rico Taxation
Taxation of the Fund
Income Taxes. In the opinion of Adsuar Muñiz Goyco Seda & Pérez-Ochoa, P.S.C., each Portfolio will be treated as a separate registered investment company under the Puerto Rico Code. As such, each Portfolio should be exempt from the regular income tax imposed by the Puerto Rico Code for each taxable year that it distributes as Taxable Dividends (as defined below) an amount equal to at least 90% of its net income for such year within the time period provided by the Puerto Rico Code (the “90% Distribution Requirement”). In determining its net income for purposes of the 90% Distribution Requirement, the Portfolio is not required to take into account capital gains and losses. Each Portfolio intends to meet the 90% Distribution Requirement to
be exempt from the income tax imposed by the Puerto Rico Code.
Since an opinion from counsel is not binding on the Treasury Department or the Puerto Rico courts, it is possible that the Treasury Department or the courts could disagree with counsel’s conclusion. If it is ultimately determined that each Portfolio is not a separate registered investment company under the Puerto Rico Code, and the Fund and its Portfolios are treated as only one registered investment company under the Puerto Rico Code, each Portfolio would still be exempt from the Puerto Rico regular income tax, provided that each of the Portfolios meets the 90% Distribution Requirement. However, the treatment of the Fund and its Portfolios as one registered investment company may adversely affect the earnings and profits of each of the Portfolios and the Puerto Rico income tax treatment of the distributions received by the Puerto Rico Investors. Each Puerto Rico Investor should consult its own tax advisor with respect to the impact of the treatment of the Fund and its Portfolios as one registered investment company.
Property Taxes. Each Portfolio will be subject to personal property taxes under the MPTA. However, the shares of stock, bonds, participations, notes, and other securities or debt instruments issued by Puerto Rico or non-Puerto Rico corporations, partnerships or companies held by a Portfolio will be exempt from personal property taxes under the MPTA.
Municipal License Taxes. Under the MLTA and the PR-ICA, each Portfolio will be subject to a municipal license tax of up to 1.5% on its net taxable income that is not distributed to its Puerto Rico Investors.
Taxation of Puerto Rico Investors
Income Taxes. Each Portfolio may make distributions out of its current or accumulated earnings and profits attributable to (i) income that is included in the Portfolio’s gross income for purposes of the Puerto Rico Code, other than gains from the sale or exchange of property (the “Taxable Dividends”), or (ii) net gains derived from the sale or exchange of property (the “Capital Gain Dividends” and jointly with the Taxable Dividends, the “Dividends”).
Taxable Dividends Distributed to Puerto Rico Individuals. Taxable Dividends distributed to Puerto Rico Individuals will be subject to a 10% withholding tax (the “10% Puerto Rico Withholding Tax”).
30
Unless otherwise designated by the Fund, its istributions of Dividends to Puerto Rico Individuals will consist of Taxable Dividends subject to the 10% Puerto Rico Withholding Tax.
By purchasing units of a Portfolio each Puerto Rico Individual, estate or trust, will be irrevocably agreeing to the 10% Puerto Rico Withholding Tax on all Taxable Dividends paid by the Portfolio and will irrevocably waive the right to elect not to be subject to the 10% Withholding Tax.
Taxable Dividends Distributed to Puerto Rico Entities. Puerto Rico Entities receiving or accruing Taxable Dividends during a taxable year are entitled to claim an 85% dividend received deduction with respect to such distributions (the “Dividend Received Deduction”). The Dividend Received Deduction may not exceed 85% of the Puerto Rico Entity’s net taxable income for such taxable year. The remaining 15% of such dividends is subject to income tax at the regular corporate income tax rates.
Unless otherwise designated by the Fund, its distributions of Dividends to Puerto Rico Entities will consist of Taxable Dividends subject to the Dividend Received Deduction.
Special rules applicable to Taxable Dividends distributed to Puerto Rico Entities that are “special partnerships,” “corporations of individuals,” life insurance companies, mutual insurance companies and non-mutual insurance companies under the Puerto Rico Code are discussed in the Statement of Additional Information.
Capital Gain Dividends. Capital Gain Dividends will be subject to a 10% capital gains tax, in the case of Puerto Rico Individuals and PR Trusts, and to a 15% capital gains tax in the case of Puerto Rico Entities.
Distributions of Principal. Distributions made by a Portfolio during a taxable year, will be treated as Dividends to the extent that for such year the Portfolio has current or accumulated earnings and profits, as determined under the Puerto Rico Code. Distributions in excess of current and accumulated earnings and profits will be treated as a tax-free return of capital to the Puerto Rico Investor to the extent of such investor’s tax basis in such Portfolio’s Units. To the extent that such distributions exceed the Fund’s current and accumulated earnings and profits and the Puerto Rico Investor’s tax basis in the Units, such excess will be treated as a gain derived from the sale, exchange or other disposition of such Units. If the Units have been held by the Puerto Rico Investor for more than six months and they constitute a capital asset in the hands of the Puerto Rico
Investor, the gain will qualify as a long- term capital gain. The Puerto Rico Code provides long-term capital gains rates for Puerto Rico Individuals and Puerto Rico Entities for long-term capital gains realized from the sale or exchange of Units of a Portfolio . See, "Sale, Exchange or Other Disposition of the Units."
Sale, Exchange or Other Disposition of the Units. Gains from the sale, exchange or other disposition of Units which have been held by a Puerto Rico Investor for more than six months, and constitute capital assets in the hands of the Puerto Rico Investor, will be subject to a 10% capital gains tax, in the case of Puerto Rico Individuals and PR Trusts, and a 15% capital gains tax in the case of Puerto Rico Entities.
Puerto Rico Investors may elect to treat such gains as ordinary income subject to regular income tax instead of the applicable capital gains tax.
Losses from the sale, exchange or other disposition of Units that constitute capital assets in the hands of Puerto Rico Investors are deductible only to the extent of gains from the sale, exchange or other disposition of capital assets; except that Puerto Rico Individuals may also deduct up to $1,000 of such losses from ordinary income.
Redemption of Units. The partial or total redemption of Units is generally treated as a sale or exchange of Units, unless the redemption is “essentially equivalent to a dividend.” If a redemption of Units is treated as “essentially equivalent to a dividend,” then the redemption is treated as a Dividend to the extent of the Portfolio’s current and accumulated earnings and profits. In determining whether a stock redemption should be treated as “essentially equivalent to a dividend,” the Puerto Rico Code Regulations provide that (i) pro-rata redemptions of Units are generally treated as essentially equivalent to a dividend, and (ii) redemptions that terminate a shareholder’s interest are not to be treated as “essentially equivalent to a dividend.” However, neither the Puerto Rico Code nor the Puerto Rico Code Regulations set forth guidelines to determine which other redemptions are not essentially equivalent to a dividend distribution. In the absence of Puerto Rico guidelines, the Treasury Department generally follows the principles established under the Code, the Code Regulations, rulings and other administrative pronouncements of the IRS, and federal court decisions.
Estate and Gift Taxes. The transfer of Units by gift by a Puerto Rico Individual will not be subject to gift taxes under the Puerto Rico Code if such individual is domiciled in Puerto Rico at the time the gift is made.

31
The Units will not be subject to Puerto Rico estate taxes if held by a Puerto Rico Individual who is a citizen of the United States that acquired his or her citizenship solely by reason of his or her Puerto Rico citizenship, birth or residence in Puerto Rico and was domiciled in Puerto Rico at the time of death.
Municipal License Taxes. Distributions made to Puerto Rico Entities are subject to a municipal license tax of up to 1.5% in the case of Puerto Rico Entities engaged in a financial business, and up to 0.5% in the case of Puerto Rico Entities engaged in a non-financial business, as defined in the MLTA. Distributions to Puerto Rico Individuals are not subject to municipal license tax.
Property Taxes. The Units are exempt from Puerto Rico personal property taxes in the hands of the Puerto Rico Investors.
United States Taxation
IRS CIRCULAR 230 DISCLOSURE. THE UNITED STATES TAX DISCUSSION IN THIS PROSPECTUS IS GENERAL IN NATURE AND IS NOT INTENDED TO BE TAX ADVICE. THE UNITED STATES TAX DISCUSSION WAS PREPARED TO SUPPORT THE PROMOTION OR MARKETING OF THE UNITS. SPECIFIC TAX CONSEQUENCES MAY VARY WIDELY DEPENDING ON A PARTICULAR TAXPAYER’S INDIVIDUAL CIRCUMSTANCES. THE UNITED STATES TAX DISCUSSION IS NOT INTENDED TO CONSTITUTE OR WRITTEN TO BE USED, AND CANNOT BE USED OR RELIED UPON BY ANY TAXPAYER, FOR THE PURPOSE OF AVOIDING PENALTIES THAT MAY BE IMPOSED BY THE UNITED STATES INTERNAL REVENUE SERVICE. Taxation of the Fund
In the opinion of Adsuar Muñiz Goyco Seda & Pérez-Ochoa, P.S.C., based on certain representations made by the Fund and the Investment Adviser, each Portfolio will be treated under the Code as a foreign corporation not engaged in a U.S. trade or business. As a foreign corporation not engaged in a U.S. trade or business, each Portfolio is not subject to U.S. federal income tax on gains derived from the sale or exchange of personal property (except for gains from the disposition of a “United States Real Property Interest,” as defined in section 897 of the Code). Each Portfolio is, however, subject to a U.S. federal income tax of 10% on its dividend income from sources within the United States and may be subject
to a 30% federal income tax on other income from sources within the United States.
An opinion of counsel is not binding on the IRS and it is possible that the IRS or the courts could disagree with the opinion of counsel. If it were to be concluded that a Portfolio is engaged in business in the U.S., its net income effectively connected with its U.S. trade or business would be subject to U.S. federal corporate income tax and to a 30% branch profit tax upon the repatriation of its effectively connected earnings profits.
Taxation of Puerto Rico Individuals and Puerto Rico Entities
Dividends. Under Code section 933, Puerto Rico Individuals will not be subject to U.S. federal income tax on dividends distributed by a Portfolio that constitute income from sources within Puerto Rico. The dividends distributed by a Portfolio should constitute income from sources within Puerto Rico not subject to U.S. federal income tax in the hands of a Puerto Rico Individual.
Puerto Rico Investors should note that the regulations under section 937(b) of the Code addressing “conduit arrangements” may impact the source of income of dividends distributed by the Portfolios. The IRS has not issued guidance to interpret these rules and the status of law in this area is currently unclear. Therefore, the determination as to whether or not the Portfolios are “conduit arrangements,” as well as the impact of the rules on the source of dividends distributed by the Portfolios, is not currently determinable, notwithstanding the aforementioned general rule. However, in the opinion of Adsuar Muñiz Goyco Seda & Pérez-Ochoa, P.S.C., counsel to the Fund, it is more likely than not that the Portfolios will not be considered “conduit arrangements” under the Code’s regulations. The Fund does not plan to request a ruling from the IRS with respect to the non applicability of such conduit rule to the Portfolios and no assurance can be given that the IRS or the courts will agree with the opinion of Adsuar Muñiz Goyco Seda & Pérez-Ochoa, P.S.C. You should consult your tax advisor as to this matter.
Foreign corporations not engaged in a U.S. trade or business are generally not subject to U.S. federal income tax on amounts received from sources outside the U.S. Corporations incorporated in Puerto Rico are treated as foreign corporations under the Code. Because dividends distributed by the Fund to Puerto Rico corporations should constitute income from sources within Puerto Rico, Puerto Rico corporations not engaged in a U.S. trade or business will not be subject to U.S. taxation on dividends received from a
32
Portfolio. Dividends received or accrued by a Puerto Rico corporate investor that is engaged in a U.S. trade or business will be subject to U.S. federal income tax only if such dividends are effectively connected to its U.S. trade or business. The Code provides special rules for Puerto Rico Entities that are treated as partnerships for U.S. federal income tax purposes.
Sales, Exchange or Disposition of Units. Gain, if any, from the sale, exchange or other disposition of the Units by a Puerto Rico Individual, including an exchange of Units of one Portfolio for Units of another Portfolio, will generally be treated as Puerto Rico source income and, therefore, exempt from federal income taxation.
A Puerto Rico corporation that invests in a Portfolio will be subject to U.S. federal income tax on a gain from a disposition of Units only if the gain is effectively connected to a U.S. trade or business carried on by the Puerto Rico corporation. The Code provides special rules for Puerto Rico Entities that are subject to federal income tax as partnerships.
PFIC Rules. Each Portfolio will likely be treated as a passive foreign investment company (“PFIC”) for U.S. federal income tax purposes. Under the PFIC rules, a Unitholder that is a U.S. person (i.e., a citizen or resident of the U.S., a U.S. domestic corporation or partnership, or an estate or trust that is taxed as a resident of the U.S.) (such a Unitholder is referred to as a “U.S. Unitholder”), that disposes of its PFIC stock at a gain, is treated as receiving an “excess distribution” equal to such gain. In addition, if a U.S. Unitholder receives a distribution from a PFIC in excess of 125% of the average amount of distributions such Unitholder received from the PFIC during the three preceding taxable years (or shorter period if the U.S. Unitholder has not held the stock
for three years), the U.S. Unitholder is also treated as receiving an “excess distribution” equal to such excess. In general, an “excess distribution” is taxed as ordinary income, and to the extent it is attributed to earlier years in which the PFIC stock was held, is subject to an interest charge which the Code refers to as the “deferred tax amount.”
Prop. Reg. Sec. 1.1291-1(f) states that a “deferred tax amount” will be determined under Section 1291 of the Code on amounts derived from sources within Puerto Rico by Puerto Rico Individuals only to the extent such amounts are allocated to a taxable year in the Unitholder’s holding period during which the Unitholder was not entitled to the benefits of section 933 thereof. Thus, under the proposed regulations, Puerto Rico Individuals will not be subject to the PFIC provisions if they are entitled to the benefits of section 933 of the Code for each entire taxable year that they hold the Units. Puerto Rico corporations are not U.S. Unitholders for purposes of the PFIC provisions.
Estate and Gift Taxes
Under the provisions of the Code, the Units will not be subject to U.S. estate and gift taxes if held by a Puerto Rico Individual who is a citizen of the U.S. who acquired his or her citizenship solely by reason of his or her Puerto Rico citizenship, birth or residence in Puerto Rico and was domiciled in Puerto Rico, in the case of estate taxes, at the time of death, and in the case of gift taxes, at the time the gift was made.
Potential investors are advised to consult their own tax advisers as to the consequences of an investment in a Portfolio under the tax laws of Puerto Rico and the U.S., including the consequences of the sale or redemption of Units.
F INANCIAL HIGHLIGHTS
The Financial Highlights tables are intended to help you understand each Portfolio’s financial performance for the periods shown. Certain information reflects the financial results for a single Fund unit. The total returns in the table represent the rate that an investor would have earned or lost on an investment in the Portfolio (assuming reinvestment of
all dividends) without taking into consideration commissions. The information in the Financial Highlights tables has been obtained from the Fund’s audited financial statements, which are included in the Fund’s Annual Report. A copy of the Annual Report is available upon request
.

33
Multi-Select Securities Puerto Rico FundThe following table includes selected data for a share outstanding throughout each period and other performance information derived from the financialstatements. It should be read in conjunction with the financial statements and notes thereto.International Portfolio I - Financial Highlights
Increase (Decrease) in Net Asset Value:
Per Unit Net asset value, beginning of period $13.66 $12.35 $11.05 $10.00Operating Net investment income 0.37 0.21 0.30 0.05Performance: (a) Net realized gain (loss) and unrealized appreciation (depreciation) on investments (1.08) 1.38 1.03 1.00
Total from investment operations (0.71) 1.59 1.33 1.05Less: Dividends from net investment income to unitholders (0.24) (0.28) (0.03) (0.00)Net asset value, end of period $12.71 $13.66 $12.35 $11.05
Total InvestmentReturn^: (b) Based on net asset value per unit (5.37%) 13.29% 12.12% 10.50%
Ratios: (c)(d)(e) Expenses to average net assets - net of waived fees and reimbursed expenses 1.75% 1.75% 1.75% 1.75%Net investment income to average net assets - net of waived fees and reimbursed expenses 2.74% 1.68% 2.67% 0.89%
Supplemental Net assets, end of period (in thousands) $23,498 $29,610 $28,779 $19,302Data: Portfolio turnover 13.85% 21.80% 15.31% 15.09%
* Date of issuance of units.^ Total investment return excludes the effects of sales charges and is not annualized.
(a)(b)(c)(d)(e)
Increase (Decrease) in Net Asset Value:
Per Unit Net asset value, beginning of period $13.54 $12.25 $11.00 $10.00Operating Net investment income 0.29 0.14 0.22 0.02Performance: (a) Net realized gain (loss) and unrealized appreciation (depreciation) on investments (1.05) 1.36 1.04 0.98
Total from investment operations (0.76) 1.50 1.26 1.00Less: Dividends from net investment income to unitholders (0.18) (0.22) (0.01) (0.00)Redemption fees 0.00 0.01 0.00 0.00Net asset value, end of period $12.60 $13.54 $12.25 $11.00
Total InvestmentReturn^: (b) Based on net asset value per unit (5.69%) 12.66% 11.48% 10.00%
Ratios: (c)(d)(e) Expenses to average net assets - net of waived fees and reimbursed expenses 2.40% 2.40% 2.40% 2.40%Net investment income to average net assets - net of waived fees and reimbursed expenses 2.11% 1.11% 1.94% 0.44%
Supplemental Net assets, end of period (in thousands) $388 $929 $1,237 $704Data: Portfolio turnover 13.85% 21.80% 15.31% 15.09%
* Date of issuance of units.^ Total investment return excludes the effects of sales charges and is not annualized.
(a)(b)(c)(d)(e)
Increase (Decrease) in Net Asset Value:
Per Unit Net asset value, beginning of period $13.59 $12.29 $11.01 $10.00Operating Net investment income 0.32 0.16 0.25 0.02Performance: (a) Net realized gain (loss) and unrealized appreciation (depreciation) on investments (1.09) 1.40 1.04 0.99
Total from investment operations (0.77) 1.56 1.29 1.01Less: Dividends from net investment income to unitholders (0.44) (0.27) (0.02) (0.00)Redemption fees 0.00 0.01 0.01 0.00Net asset value, end of period $12.38 $13.59 $12.29 $11.01
Total InvestmentReturn^: (b) Based on net asset value per unit (5.91%) 13.12% 11.84% 10.10%
Ratios: (c)(d)(e) Expenses to average net assets - net of waived fees and reimbursed expenses 2.15% 2.15% 2.15% 2.15%Net investment income to average net assets - net of waived fees and reimbursed expenses 2.41% 1.29% 2.16% 0.72%
Supplemental Net assets, end of period (in thousands) $2,520 $2,693 $9,049 $7,901Data: Portfolio turnover 13.85% 21.80% 15.31% 15.09%
* Date of issuance of units.^ Total investment return excludes the effects of sales charges and is not annualized.
(a)(b)(c)(d)(e)
Based on average outstanding units of 209,312; 540,928; 824,103 and 287,201 for the periods ended March 31, 2008, March 31, 2007, March 31, 2006 and March 31, 2005, respectively.
The effect of the expenses waived for the periods ended March 31, 2008, March 31, 2007, March 31, 2006 and March 31, 2005 was to decrease the expense ratios, thus increasing the net investment income ratio toaverage net assets applicable to common shareholders by 0.20%, 0.19%, 0.13% and 0.70%, respectively.
The effect of the expenses waived for the periods ended March 31, 2008, March 31, 2007, March 31, 2006, and March 31, 2005 was to decrease the expense ratios, thus increasing the net investment income ratioto average net assets applicable to common shareholders by 0.21%, 0.17%, 0.15% and 0.71%, respectively.
For the fiscal year ended March 31, 2007
For the fiscal year ended March 31, 2006
Ratios for the period ended March 31, 2005 were annualized using a 365 day base.
Ratios for the period ended March 31, 2005 were annualized using a 365 day base.The effect of the expenses waived for the periods ended March 31, 2008, March 31, 2007, March 31, 2006, and March 31, 2005 was to decrease the expense ratios, thus increasing the net investment income ratioto average net assets applicable to common shareholders by 0.25%, 0.20%, 0.14% and 0.70%, respectively.
Calculation is based on beginning and end of period net asset values and assumes reinvestment of dividends.
For the fiscal year ended March 31, 2007
For the fiscal year ended March 31, 2006
Based on average outstanding units of 1,981,793; 2,321,452; 2,252,935 and 1,094,356 for the periods ended March 31, 2008, March 31, 2007, March 31, 2006 and March 31, 2005, respectively.Calculation is based on beginning and end of period net asset values and assumes reinvestment of dividends.Based on average net assets of $27,025,845; $29,648,771; $25,725,723 and $11,803,317 for the periods ended March 31, 2008, March 31, 2007, March 31, 2006 and March 31, 2005, respectively.
For the fiscal year ended March 31, 2007
Based on average outstanding units of 53,605; 84,169; 101,667 and 35,773 for the periods ended March 31, 2008, March 31, 2007, March 31, 2006, and March 31, 2005, respectively.Calculation is based on beginning and end of period net asset values and assumes reinvestment of dividends. Based on average net assets of $729,994, $1,062,071; $1,153,914 and $386,690 for the periods ended March 31, 2008, March 31, 2007, March 31, 2006 and March 31, 2005, respectively.
For the period from June 22, 2004* through
March 31, 2005
Ratios for the period ended March 31, 2005 were annualized using a 365 day base.
Based on average net assets of $2,794,421, $6,767,116; $9,348,557 and $3,192,598 for the periods ended March 31, 2008, March 31, 2007, March 31, 2006 and March 31, 2005, respectively.
For the fiscal year ended March 31, 2006
Class A Units
For the fiscal year ended March 31, 2008
Class C Units
For the fiscal year ended March 31, 2008
Class L Units
For the period from June 22, 2004* through
March 31, 2005
For the period from June 24, 2004* through
March 31, 2005
For the fiscal year ended March 31, 2008

34
The following table includes selected data for a share outstanding throughout each period and other performance information derived from the financialstatements. It should be read in conjunction with the financial statements and notes thereto.International Portolio II - Financial Highlights
Increase (Decrease) in Net Asset Value:
Per Unit Net asset value, beginning of period $12.91 $11.75 $10.74 $10.00Operating Net investment income 0.26 0.22 0.13 0.03Performance: (a) Net realized gain (loss) and unrealized appreciation (depreciation) on investments (1.52) 1.15 0.91 0.71
Total from investment operations (1.26) 1.37 1.04 0.74Less: Dividends from net investment income to unitholders (0.38) (0.21) (0.03) (0.00)Net asset value, end of period $11.27 $12.91 $11.75 $10.74
Total InvestmentReturn^: (b) Based on net asset value per unit (10.14%) 11.98% 9.69% 7.40%
Ratios: (c)(d)(e) Expenses to average net assets - net of waived fees and reimbursed expenses 1.75% 1.75% 1.75% 1.75%Net investment income to average net assets - net of waived fees and reimbursed expenses 2.11% 1.81% 1.20% 0.42%
Supplemental Net assets, end of period (in thousands) $411 $900 $1,428 $2,307Data: Portfolio turnover 42.04% 9.63% 43.79% 23.02%
* Date of issuance of units.^ Total investment return excludes the effects of sales charges and is not annualized.
(a)(b)(c)(d)(e)
Increase (Decrease) in Net Asset Value:
Per Unit Net asset value, beginning of period $12.38 $11.17 $10.00Operating Net investment income 0.18 0.16 0.05Performance: (a) Net realized gain (loss) and unrealized appreciation (depreciation) on investments (1.52) 1.12 1.11
Total from investment operations (1.34) 1.28 1.16Less: Dividends from net investment income to unitholders (0.18) (0.07) (0.00)Redemption fees 0.00 0.00 0.01Net asset value, end of period $10.86 $12.38 $11.17
Total InvestmentReturn^: (b) Based on net asset value per unit (11.02%) 11.59% 11.70%
Ratios: (c)(d)(e) Expenses to average net assets - net of waived fees and reimbursed expenses 2.40% 2.40% 2.40%Net investment income to average net assets - net of waived fees and reimbursed expenses 1.49% 1.38% 0.49%
Supplemental Net assets, end of period (in thousands) $8 $23 $33Data: Portfolio turnover 42.04% 9.63% 43.79%
* Date of issuance of units.^ Total investment return excludes the effects of sales charges and is not annualized.
(a)(b)(c)(d)(e) The effect of the expenses waived for the periods ended March 31, 2008, March 31, 2007, and March 31, 2006 was to decrease the expense ratios, thus increasing the net investment income ratio to average net assets
applicable to common shareholders by 2.51% 0.80% and 0.86%, respectively.
Ratios for the period ended March 31, 2006 were annualized using a 365 day base.
Based on average outstanding units of 1,648; 2,054 and 3,050 for the periods ended March 31, 2008, March 31, 2007 and March 31, 2006, respectively.Calculation is based on beginning and end of period net asset values and assumes reinvestment of dividends. Based on average net assets of $20,061, $23,705 and $31,757 for the periods ended March 31, 2008, March 31, 2007 and March 31, 2006, respectively.
Multi-Select Securities Puerto Rico Fund
Ratios for the period ended March 31, 2005 were annualized using a 365 day base.
Based on average outstanding units of 51,496; 99,652; 192,568 and 175,909 for the periods ended March 31, 2008, March 31, 2007, March 31, 2006 and March 31, 2005, respectively.Calculation is based on beginning and end of period net asset values and assumes reinvestment of dividends. Based on average net assets of $644,820, $1,196,900; $2,103,090 and $1,821,991 for the periods ended March 31, 2008, March 31, 2007, March 31, 2006 and March 31, 2005, respectively.
For the fiscal year ended March 31, 2007
For the fiscal year ended March 31, 2006
For the period from June 22, 2004* through
March 31, 2005
For the fiscal year ended March 31, 2008
For the fiscal year ended March 31, 2008
Class A Units
Class C Units
For the period from May 5, 2005* through March
31, 2006For the fiscal year
ended March 31, 2007
The effect of the expenses waived for the periods ended March 31, 2008, March 31, 2007, March 31, 2006, and March 31, 2005 was to decrease the expense ratios, thus increasing the net investment income ratio toaverage net assets applicable to common shareholders by 2.34%, 0.76%, 0.69% and 4.20%, respectively.

35
Multi-Select Securities Puerto Rico FundThe following table includes selected data for a share outstanding throughout each period and other performance information derived from the financialstatements. It should be read in conjunction with the financial statements and notes thereto.Large Cap Core Portfolio I - Financial Highlights
Increase (Decrease) in Net Asset Value:
Per Unit Net asset value, beginning of period $11.05 $11.35 $10.12 $10.00Operating Net investment income (loss) 0.01 0.01 0.02 (0.02)Performance: (a) Net realized gain (loss) and unrealized appreciation (depreciation) on investments (0.53) (0.29) 1.21 0.14
Total from investment operations (0.52) (0.28) 1.23 0.12Less: Dividends from net investment income to unitholders (0.01) (0.02) 0.00 0.00Net asset value, end of period $10.52 $11.05 $11.35 $10.12
Total InvestmentReturn^: (b) Based on net asset value per unit (4.74%) (2.45%) 12.15% 1.20%
Ratios: (c)(d)(e) Expenses to average net assets - net of waived fees and reimbursed expenses 1.75% 1.75% 1.75% 1.75%Net investment income (loss) to average net assets - net of waived fees and reimbursed expenses 0.08% 0.05% 0.21% (0.39%)
Supplemental Net assets, end of period (in thousands) $3,978 $5,778 $7,808 $4,677Data: Portfolio turnover 93.25% 81.39% 60.85% 67.35%
* Date of issuance of units.^ Total investment return excludes the effects of charges loads and is not annualized.
(a)(b)(c)(d)(e)
Increase (Decrease) in Net Asset Value:
Per Unit Net asset value, beginning of period $10.89 $11.23 $10.06 $10.00Operating Net investment loss (0.06) (0.06) (0.05) (0.04)Performance: (a) Net realized gain (loss) and unrealized appreciation (depreciation) on investments (0.26) (0.29) 1.22 0.10
Total from investment operations (0.32) (0.35) 1.17 0.06Less: Dividends from net investment income to unitholders 0.00 0.00 0.00 0.00Redemption fees 0.00 0.01 0.00 0.00Net asset value, end of period $10.57 $10.89 $11.23 $10.06
Total InvestmentReturn^: (b) Based on net asset value per unit (2.94%) (3.03%) 11.63% 0.60%
Ratios: (c)(d)(e) Expenses to average net assets - net of waived fees and reimbursed expenses 2.40% 2.40% 2.40% 2.40%Net investment loss to average net assets - net of waived fees and reimbursed expenses (0.53%) (0.57%) (0.47%) (0.96%)
Supplemental Net assets, end of period (in thousands) $98 $223 $301 $271Data: Portfolio turnover 93.25% 81.39% 60.85% 67.35%
* Date of issuance of units.^ Total investment return excludes the effects of charges loads and is not annualized.
(a)(b)(c)(d)(e)
Increase (Decrease) in Net Asset Value:
Per Unit Net asset value, beginning of period $10.39 $9.18 $10.00Operating Net investment loss (0.02) (0.00) (0.00)Performance: (a) Net realized gain (loss) and unrealized appreciation (depreciation) on investments 0.00 1.20 (0.82)
Total from investment operations (0.02) 1.20 (0.82)Less: Dividends from net investment income to unitholders 0.00 0.00 0.00Redemption fees 0.03 0.01 0.00Net asset value, end of period $10.40 $10.39 $9.18
Total InvestmentReturn^: (b) Based on net asset value per unit 0.10% 13.18% (8.20%)
Ratios: (c)(d)(e) Expenses to average net assets - net of waived fees and reimbursed expenses 2.13% 2.15% 2.15%Net investment loss to average net assets - net of waived fees and reimbursed expenses (0.27%) (0.02%) (0.17%)
Supplemental Net assets, end of period (in thousands) $0 $445 $325Data: Portfolio turnover 81.39% 60.85% 67.35%
* Date of issuance of units.** Date when units were redeemed.^ Total investment return excludes the effects of sales charges and is not annualized.
(a)(b)(c)(d)(e)
The effect of the expenses waived for the periods ended March 31, 2008, March 31, 2007, March 31, 2006, and March 31, 2005 was to decrease the expense ratios, thus increasing the net investment income ratio toaverage net assets applicable to common shareholders by 0.57%, 0.54%, 0.26% and 2.16%, respectively.
The effect of the expenses waived for the periods ended February 14, 2007, March 31, 2006, and March 31, 2005 was to decrease the expense ratios, thus increasing the net investment income ratio to average net assetsapplicable to common shareholders by 0.35%, 0.40% and 1.64%, respectively.
Ratios for the periods ended February 14, 2007 and March 31, 2005 were annualized using a 365 day base.Based on average net assets of $299,313; $446,286 and $214,447 for the periods ended February 14, 2007, March 31, 2006, and March 31, 2005, respectively.
Based on average outstanding units of 30,805; 45,403 and 22,483 for the periods ended February 14, 2007, March 31, 2006, and March 31, 2005, respectively.Calculation is based on beginning and end of period net asset values and assumes reinvestment of dividends.
Class L Units
For the period from April 1, 2006 through February 14, 2007**
For the fiscal year ended March 31, 2006
For the period from December 26, 2004*
through March 31, 2005
Based on average outstanding units of 15,631; 23,753; 28,098 and 15,380 for the periods ended March 31, 2008, March 31, 2007, March 31, 2006, and March 31, 2005, respectively.Calculation is based on beginning and end of period net asset values and assumes reinvestment of dividends. Based on average net assets of $177,243, $253,556; $299,639 and $157,430 for the periods ended March 31, 2008, March 31, 2007, March 31, 2006 and March 31, 2005, respectively.Ratios for the period ended March 31, 2005 were annualized using a 365 day base.
For the fiscal year ended March 31, 2006
For the period from June 24, 2004* through
March 31, 2005
For the fiscal year ended March 31, 2007
For the fiscal year ended March 31, 2008
Class C Units
For the fiscal year ended March 31, 2007
For the fiscal year ended March 31, 2006
For the period from June 22, 2004* through
March 31, 2005
Calculation is based on beginning and end of period net asset values and assumes reinvestment of dividends. Based on average net assets of $5,191,973, $6,729,501; $6,985,128 and $2,927,248 for the periods ended March 31, 2008, March 31, 2007, March 31, 2006, and March 31, 2005, respectively.Ratios for the period ended March 31, 2005 were annualized using a 365 day base.The effect of the expenses waived for the periods ended March 31, 2008, March 31, 2007, March 31, 2006, and March 31, 2005 was to decrease the expense ratios, thus increasing the net investment income ratio toaverage net assets applicable to common shareholders by 0.54%, 0.44%, 0.24% and 2.36%, respectively.
For the fiscal year ended March 31, 2008
Class A Units
Based on average outstanding units of 453,646; 622,976; 647,037 and 287,014 for the periods ended March 31, 2008, March 31, 2007, March 31, 2006 and March 31, 2005, respectively.

36
Multi-Select Securities Puerto Rico FundThe following table includes selected data for a share outstanding throughout each period and other performance information derived from the financialstatements. It should be read in conjunction with the financial statements and notes thereto.Large Cap Core Portfolio II - Financial Highlights
Increase (Decrease) in Net Asset Value:
Per Unit Net asset value, beginning of period $11.33 $10.81 $10.33 $10.00Operating Net investment income 0.08 0.08 0.03 0.00Performance: (a) Net realized gain (loss) and unrealized appreciation (depreciation) on investments (0.95) 0.48 0.45 0.33
Total from investment operations (0.87) 0.56 0.48 0.33Less: Dividends from net investment income to unitholders (0.08) (0.04) 0.00 0.00Net asset value, end of period $10.38 $11.33 $10.81 $10.33
Total InvestmentReturn^: (b) Based on net asset value per unit (7.77%) 5.18% 4.65% 3.30%
Ratios: (c)(d)(e) Expenses to average net assets - net of waived fees and reimbursed expenses 1.75% 1.75% 1.75% 1.75%Net investment income to average net assets - net of waived fees and reimbursed expenses 0.68% 0.75% 0.30% 0.05%
Supplemental Net assets, end of period (in thousands) $5,347 $6,531 $5,068 $5,335Data: Portfolio turnover 10.81% 33.64% 21.36% 7.51%
* Date of issuance of units.^ Total investment return excludes the effects of sales charges and is not annualized.
(a)(b)(c)(d)(e)
Increase (Decrease) in Net Asset Value:
Per Unit Net asset value, beginning of period $11.15 $10.65 $10.23 $10.00Operating Net investment loss 0.01 (0.00) (0.03) (0.02)Performance: (a) Net realized gain (loss) and unrealized appreciation (depreciation) on investments (0.61) 0.48 0.45 0.25
Total from investment operations (0.60) 0.48 0.42 0.23Less: Dividends from net investment income to unitholders 0.00 0.00 0.00 0.00Redemption fees 0.00 0.02 0.00 0.00Net asset value, end of period $10.55 $11.15 $10.65 $10.23
Total InvestmentReturn^: (b) Based on net asset value per unit (5.38%) 4.69% 4.11% 2.30%
Ratios: (c)(d)(e) Expenses to average net assets - net of waived fees and reimbursed expenses 2.40% 2.40% 2.40% 2.40%Net investment loss to average net assets - net of waived fees and reimbursed expenses 0.07% (0.01%) (0.30%) (0.49%)
Supplemental Net assets, end of period (in thousands) $61 $385 $561 $281Data: Portfolio turnover 10.81% 33.64% 21.36% 7.51%
* Date of issuance of units.^ Total investment return excludes the effects of sales charges and is not annualized.
(a)(b)(c)(d)(e)
Increase (Decrease) in Net Asset Value:
Per Unit Net asset value, beginning of period $11.22 $10.71 $10.26 $10.00Operating Net investment income (loss) 0.03 (0.01) (0.01) (0.01)Performance: (a) Net realized gain (loss) and unrealized appreciation (depreciation) on investments (0.93) 0.52 0.46 0.27
Total from investment operations (0.90) 0.51 0.45 0.26Less: Dividends from net investment income to unitholders 0.00 0.00 0.00 0.00Redemption fees 0.00 0.00 0.00 0.00Net asset value, end of period $10.32 $11.22 $10.71 $10.26
Total InvestmentReturn^: (b) Based on net asset value per unit (8.02%) 4.76% 4.39% 2.60%
Ratios: (c)(d)(e) Expenses to average net assets - net of waived fees and reimbursed expenses 2.15% 2.15% 2.15% 2.15%Net investment income (loss) to average net assets - net of waived fees and reimbursed expenses 0.29% (0.06%) (0.08%) (0.22%)
Supplemental Net assets, end of period (in thousands) $584 $892 $4,870 $4,229Data: Portfolio turnover 10.81% 33.64% 21.36% 7.51%
* Date of issuance of units.^ Total investment return excludes the effects of sales charges and is not annualized.
(a)(b)(c)(d)(e)
Ratios for the period ended March 31, 2005 were annualized using a 365 day base.
The effect of the expenses waived for the periods ended March 31, 2008, March 31, 2007, March 31, 2006, and March 31, 2005 was to decrease the expense ratios, thus increasing the net investment income ratio toaverage net assets applicable to common shareholders by 0.33%, 0.28%, 0.15% and 1.29%, respectively.
The effect of the expenses waived for the periods ended March 31, 2008, March 31, 2007, March 31, 2006, and March 31, 2005 was to decrease the expense ratios, thus increasing the net investment income ratio toaverage net assets applicable to common shareholders by 0.26%, 0.25%, 0.16% and 1.43%, respectively.
The effect of the expenses waived for the periods ended March 31, 2008, March 31, 2007, March 31, 2006, and March 31, 2005 was to decrease the expense ratios, thus increasing the net investment income ratio toaverage net assets applicable to common shareholders by 0.31%, 0.18%, 0.17% and 0.72%, respectively.
Based on average outstanding units of 70,753; 304,420; 453,064 and 19,895 for the periods ended March 31, 2008, March 31, 2007, March 31, 2006, and March 31, 2005, respectively.Calculation is based on beginning and end of period net asset values and assumes reinvestment of dividends. Based on average net assets of $791,441; $3,261,055; $4,724,011 and $2,087,448 for the periods ended March 31, 2008, March 31, 2007, March 31, 2006 and March 31, 2005, respectively.
Ratios for the period ended March 31, 2005 were annualized using a 365 day base.
For the fiscal year ended March 31, 2007
For the fiscal year ended March 31, 2006
For the period from June 24, 2004* through
March 31, 2005
Based on average outstanding units of 23,340; 43,610; 52,293 and 17,546 for the periods ended March 31, 2008, March 31, 2007, March 31, 2006 and March 31, 2005, respectively.Calculation is based on beginning and end of period net asset values and assumes reinvestment of dividends. Based on average net assets of $263,960, $470,303; $544,709 and $179,137 for the periods ended March 31, 2008, March 31, 2007, March 31, 2006 and March 31, 2005, respectively.
Calculation is based on beginning and end of period net asset values and assumes reinvestment of dividends. Based on average net assets of $6,059,429; $5,857,331; $5,784,278 and $3,950,455 for the periods ended March 31, 2008, March 31, 2007, March 31, 2006 and March 31, 2005, respectively.Ratios for the period ended March 31, 2005 were annualized using a 365 day base.
For the fiscal year ended March 31, 2007
For the fiscal year ended March 31, 2006
For the period from June 24, 2004* through
March 31, 2005
For the fiscal year ended March 31, 2008
Class A Units
For the fiscal year ended March 31, 2008
For the fiscal year ended March 31, 2008
Class L Units
Class C Units
For the fiscal year ended March 31, 2007
For the fiscal year ended March 31, 2006
For the period from June 22, 2004* through
March 31, 2005
Based on average outstanding units of 537,760; 530,231; 550,133 and 384,534 for the periods ended March 31, 2008, March 31, 2007, March 31, 2006, and March 31, 2005, respectively.

37
Multi-Select Securities Puerto Rico FundThe following table includes selected data for a share outstanding throughout each period and other performance information derived from the financialstatements. It should be read in conjunction with the financial statements and notes thereto.Large Cap Growth Portfolio I - Financial Highlights
Increase (Decrease) in Net Asset Value:
Per Unit Net asset value, beginning of period $11.27 $11.45 $10.49 $10.00Operating Net investment income (loss) 0.02 (0.00) (0.03) (0.03)Performance: (a) Net realized gain (loss) and unrealized appreciation (depreciation) on investments (0.57) (0.18) 0.99 0.52
Total from investment operations (0.55) (0.18) 0.96 0.49Less: Dividends from net investment income to unitholders 0.00 0.00 0.00 0.00Net asset value, end of period $10.72 $11.27 $11.45 $10.49
Total InvestmentReturn^: (b) Based on net asset value per unit (4.88%) (1.57%) 9.15% 4.90%
Ratios: (c)(d)(e) Expenses to average net assets - net of waived fees and reimbursed expenses 1.75% 1.75% 1.75% 1.75%Net investment income (loss) to average net assets - net of waived fees and reimbursed expenses 0.18% (0.03%) (0.24%) (0.50%)
Supplemental Net assets, end of period (in thousands) $16,487 $21,188 $25,650 $17,652Data: Portfolio turnover 59.07% 44.69% 69.61% 63.97%
* Date of issuance of units.^ Total investment return excludes the effects of sales charges and is not annualized.
(a)(b)(c)(d)(e)
Increase (Decrease) in Net Asset Value:
Per Unit Net asset value, beginning of period $11.09 $11.33 $10.43 $10.00Operating Net investment loss (0.05) (0.07) (0.10) (0.05)Performance: (a) Net realized gain (loss) and unrealized appreciation (depreciation) on investments (0.41) (0.18) 1.00 0.48
Total from investment operations (0.46) (0.25) 0.90 0.43Less: Dividends from net investment income to unitholders 0.00 0.00 0.00 0.00Redemption fees 0.00 0.01 0.00 0.00Net asset value, end of period $10.63 $11.09 $11.33 $10.43
Total InvestmentReturn^: (b) Based on net asset value per unit (4.15%) (2.12%) 8.63% 4.30%
Ratios: (c)(d)(e) Expenses to average net assets - net of waived fees and reimbursed expenses 2.40% 2.40% 2.40% 2.40%Net investment loss to average net assets - net of waived fees and reimbursed expenses (0.42%) (0.68%) (0.89%) (1.12%)
Supplemental Net assets, end of period (in thousands) $269 $661 $1,037 $736Data: Portfolio turnover 59.07% 44.69% 69.61% 63.97%
* Date of issuance of units.^ Total investment return excludes the effects of sales charges and is not annualized.
(a)(b)(c)(d)(e)
Increase (Decrease) in Net Asset Value:
Per Unit Net asset value, beginning of period $11.17 $11.39 $10.45 $10.00Operating Net investment loss (0.02) (0.06) (0.07) (0.02)Performance: (a) Net realized gain (loss) and unrealized appreciation (depreciation) on investments (0.57) (0.17) 0.99 0.47
Total from investment operations (0.59) (0.23) 0.92 0.45Less: Dividends from net investment income to unitholders 0.00 0.00 0.00 0.00Redemption fees 0.00 0.01 0.02 0.00Net asset value, end of period $10.58 $11.17 $11.39 $10.45
Total InvestmentReturn^: (b) Based on net asset value per unit (5.28%) (1.93%) 9.00% 4.50%
Ratios: (c)(d)(e) Expenses to average net assets - net of waived fees and reimbursed expenses 2.15% 2.15% 2.15% 2.15%Net investment loss to average net assets - net of waived fees and reimbursed expenses (0.21%) (0.51%) (0.65%) (0.83%)
Supplemental Net assets, end of period (in thousands) $1,686 $2,352 $8,619 $7,996Data: Portfolio turnover 59.07% 44.69% 69.61% 63.97%
* Date of issuance of units.^ Total investment return excludes the effects of sales charges and is not annualized.
(a)(b)(c)(d)(e)
Ratios for the period ended March 31, 2005 were annualized using a 365 day base.
The effect of the expenses waived for the periods ended March 31, 2008, March 31, 2007, March 31, 2006, and March 31, 2005 was to decrease the expense ratios, thus increasing the net investment income ratio toaverage net assets applicable to common shareholders by 0.25% 0.21%, 0.12% and 0.69%, respectively.
The effect of the expenses waived for the periods ended March 31, 2008, March 31, 2007, March 31, 2006, and March 31, 2005 was to decrease the expense ratios, thus increasing the net investment income ratio toaverage net assets applicable to common shareholders by 0.09%, 0.22%, 0.12% and 0.70%, respectively.
The effect of the expenses waived for the periods ended March 31, 2008, March 31, 2007, March 31, 2006, and March 31, 2005 was to decrease the expense ratios, thus increasing the net investment income ratio toaverage net assets applicable to common shareholders by 0.29%, 0.19%, 0.13% and 0.71%, respectively.
Based on average outstanding units of 180,057; 565,148; 936,671 and 258,687 for the periods ended March 31, 2008, March 31, 2007, March 31, 2006 and March 31, 2005, respectively.Calculation is based on beginning and end of period net asset values and assumes reinvestment of dividends. Based on average net assets of $2,078,729; $6,164,269; $10,271,069 and $2,782,992 for the periods ended March 31, 2008, March 31, 2007, March 31, 2006 and March 31, 2005, respectively.
Ratios for the period ended March 31, 2005 were annualized using a 365 day base.
For the fiscal year ended March 31, 2007
For the fiscal year ended March 31, 2006
For the period from June 24, 2004* through
March 31, 2005
Class L Units
For the fiscal year ended March 31, 2008
Based on average outstanding units of 45,836; 74,929; 93,830 and 40,414 for the periods ended March 31, 2008, March 31, 2007, March 31, 2006, and March 31, 2005, respectively.Calculation is based on beginning and end of period net asset values and assumes reinvestment of dividends. Based on average net assets of $528,794; $816,916; $1,028,713 and $426,349 for the periods ended March 31, 2008, March 31, 2007, March 31, 2006 and March 31, 2005, respectively.
Ratios for the period ended March 31, 2005 were annualized using a 365 day base.
For the fiscal year ended March 31, 2007
For the fiscal year ended March 31, 2006
For the period from June 24, 2004* through
March 31, 2005
For the fiscal year ended March 31, 2008
Class A Units
For the fiscal year ended March 31, 2008
Class C Units
For the fiscal year ended March 31, 2007
For the fiscal year ended March 31, 2006
For the period from June 22, 2004* through
March 31, 2005
Based on average outstanding units of 1,680,780; 2,103,825; 2,186,634 and 1,058,744 for the periods ended March 31, 2008; March 31, 2007, March 31, 2006, and March 31, 2005, respectively.Calculation is based on beginning and end of period net asset values and assumes reinvestment of dividends. Based on average net assets of $19,609,551; $23,283,280; $24,154,725 and $11,153,479 for the periods ended March 31, 2008, March 31, 2007, March 31, 2006 and March 31, 2005, respectively.

38
Multi-Select Securities Puerto Rico FundThe following table includes selected data for a share outstanding throughout each period and other performance information derived from the financialstatements. It should be read in conjunction with the financial statements and notes thereto.Large Cap Growth Portfolio II - Financial Highlights
Increase (Decrease) in Net Asset Value:
Per Unit Net asset value, beginning of period $10.37 $9.91 $9.77 $10.00Operating Net investment income 0.03 0.02 0.01 0.00Performance: (a) Net realized gain (loss) and unrealized appreciation (depreciation) on investments (0.35) 0.45 0.13 (0.23)
Total from investment operations (0.32) 0.47 0.14 (0.23)Less: Dividends from net investment income to unitholders (0.04) (0.01) (0.00)** 0.00Net asset value, end of period $10.01 $10.37 $9.91 $9.77
Total InvestmentReturn^: (b) Based on net asset value per unit (3.12%) 4.85% 1.45% (2.30%)
Ratios: (c)(d)(e) Expenses to average net assets - net of waived fees and reimbursed expenses 1.75% 1.75% 1.75% 1.75%Net investment income to average net assets - net of waived fees and reimbursed expenses 0.30% 0.25% 0.11% 0.03%
Supplemental Net assets, end of period (in thousands) $439 $966 $1,724 $2,814Data: Portfolio turnover 21.98% 98.70% 82.80% 33.22%
* Date of issuance of units.** Dividend is less than $0.005 per share.^ Total investment return excludes the effects of sales charges and is not annualized.
(a)(b)(c)(d)(e)
Increase (Decrease) in Net Asset Value:
Per Unit Net asset value, beginning of period $9.89 $9.45 $9.27 $10.00Operating Net investment loss (0.06) (0.02) (0.04) (0.01)Performance: (a) Net realized gain (loss) and unrealized appreciation (depreciation) on investments (0.23) 0.46 0.19 (0.72)
Total from investment operations (0.29) 0.44 0.15 (0.73)Less: Dividends from net investment income to unitholders 0.00 0.00 0.00 0.00Redemption fees 0.00 0.00 0.03 0.00Net asset value, end of period $9.60 $9.89 $9.45 $9.27
Total InvestmentReturn^: (b) Based on net asset value per unit (2.93%) 4.66% 1.94% (7.30%)
Ratios: (c)(d)(e) Expenses to average net assets - net of waived fees and reimbursed expenses 2.40% 2.40% 2.40% 2.40%Net investment loss to average net assets - net of waived fees and reimbursed expenses (0.62%) (0.21%) (0.47%) (0.18%)
Supplemental Net assets, end of period (in thousands) $1 $17 $24 $73Data: Portfolio turnover 21.98% 98.70% 82.80% 33.22%
* Date of issuance of units.^ Total investment return excludes the effects of sales charges and is not annualized.
(a)(b)(c)(d)(e)
Ratios for the period ended March 31, 2005 were annualized using a 365 day base.
The effect of the expenses waived for the periods ended March 31, 2008, March 31, 2007, March 31, 2006, and March 31, 2005 was to decrease the expense ratios, thus increasing the net investment income ratio toaverage net assets applicable to common shareholders by 1.97%, 0.77%, 0.53% and 3.08%, respectively.
The effect of the expenses waived for the periods ended March 31, 2008, March 31, 2007, March 31, 2006, and March 31, 2005 was to decrease the expense ratios, thus increasing the net investment income ratio toaverage net assets applicable to common shareholders by 1.71%, 0.81%, 0.70% and 21.18%, respectively.
Based on average outstanding units of 443; 2,336; 7,930 and 3,840 for the periods ended March 31, 2008, March 31, 2007, March 31, 2006 and March 31, 2005, respectively.Calculation is based on beginning and end of period net asset values and assumes reinvestment of dividends. Based on average net assets of $4,501; $21,935; $73,400 and $36,945 for the periods ended March 31, 2008, March 31, 2007, March 31, 2006 and March 31, 2005, respectively.
Ratios for the period ended March 31, 2005 were annualized using a 365 day base.
For the fiscal year ended March 31, 2007
For the fiscal year ended March 31, 2006
For the period from December 26, 2004*
through March 31, 2005
For the fiscal year ended March 31, 2008
Class A Units
For the fiscal year ended March 31, 2008
Class C Units
For the fiscal year ended March 31, 2007
For the fiscal year ended March 31, 2006
For the period from June 22, 2004* through
March 31, 2005
Based on average outstanding units of 73,175; 142,479; 290,793 and 234,143 for the periods ended March 31, 2008, March 31, 2007, March 31, 2006, and March 31, 2005, respectively.Calculation is based on beginning and end of period net asset values and assumes reinvestment of dividends. Based on average net assets of $776,580; $1,400,967; $2,848,709 and $2,328,964 for the periods ended March 31, 2008, March 31, 2007, March 31, 2006 and March 31, 2005, respectively.

39
Multi-Select Securities Puerto Rico FundThe following table includes selected data for a share outstanding throughout each period and other performance information derived from the financialstatements. It should be read in conjunction with the financial statements and notes thereto.Large Cap Value Portfolio I - Financial Highlights
Increase (Decrease) in Net Asset Value:
Per Unit Net asset value, beginning of period $11.41 $10.84 $10.38 $10.00Operating Net investment income 0.09 0.11 0.06 0.00Performance: (a) Net realized gain (loss) and unrealized appreciation (depreciation) on investments (0.99) 0.52 0.40 0.38
Total from investment operations (0.90) 0.63 0.46 0.38Less: Dividends from net investment income to unitholders (0.13) (0.06) 0.00 0.00Net asset value, end of period $10.38 $11.41 $10.84 $10.38
Total InvestmentReturn^: (b) Based on net asset value per unit (8.06%) 5.88% 4.43% 3.80%
Ratios: (c)(d)(e) Expenses to average net assets - net of waived fees and reimbursed expenses 1.75% 1.75% 1.75% 1.75%Net investment income to average net assets - net of waived fees and reimbursed expenses 0.78% 0.96% 0.61% 0.06%
Supplemental Net assets, end of period (in thousands) $9,141 $14,002 $15,095 $9,409Data: Portfolio turnover 64.17% 27.14% 32.36% 15.15%
* Date of issuance of units.^ Total investment return excludes the effects of sales charges and is not annualized.
(a)(b)(c)(d)(e)
Increase (Decrease) in Net Asset Value:
Per Unit Net asset value, beginning of period $11.28 $10.71 $10.31 $10.00Operating Net investment income (loss) 0.02 0.03 (0.00) (0.02)Performance: (a) Net realized gain (loss) and unrealized appreciation (depreciation) on investments (0.88) 0.52 0.40 0.33
Total from investment operations (0.86) 0.55 0.40 0.31Less: Dividends from net investment income to unitholders (0.04) 0.00 0.00 0.00Redemption fees 0.00 0.02 0.00 0.00Net asset value, end of period $10.38 $11.28 $10.71 $10.31
Total InvestmentReturn^: (b) Based on net asset value per unit (7.65%) 5.32% 3.88% 3.10%
Ratios: (c)(d)(e) Expenses to average net assets - net of waived fees and reimbursed expenses 2.40% 2.40% 2.40% 2.40%Net investment income (loss) to average net assets - net of waived fees and reimbursed expenses 0.20% 0.28% (0.01%) (0.46%)
Supplemental Net assets, end of period (in thousands) $104 $463 $695 $359Data: Portfolio turnover 64.17% 27.14% 32.36% 15.15%
* Date of issuance of units.^ Total investment return excludes the effects of sales charges and is not annualized.
(a)(b)(c)(d)(e)
Increase (Decrease) in Net Asset Value:
Per Unit Net asset value, beginning of period $11.33 $10.74 $10.32 $10.00Operating Net investment income (loss) 0.05 0.04 0.02 (0.01)Performance: (a) Net realized gain (loss) and unrealized appreciation (depreciation) on investments (1.01) 0.56 0.40 0.33
Total from investment operations (0.96) 0.60 0.42 0.32Less: Dividends from net investment income to unitholders (0.13) (0.02) 0.00 0.00Redemption fees 0.00 0.01 0.00 0.00Net asset value, end of period $10.24 $11.33 $10.74 $10.32
Total InvestmentReturn^: (b) Based on net asset value per unit (8.61%) 5.71% 4.07% 3.20%
Ratios: (c)(d)(e) Expenses to average net assets - net of waived fees and reimbursed expenses 2.15% 2.15% 2.15% 2.15%Net investment income (loss) to average net assets - net of waived fees and reimbursed expenses 0.41% 0.38% 0.22% (0.27%)
Supplemental Net assets, end of period (in thousands) $1,117 $1,783 $7,099 $5,047Data: Portfolio turnover 64.17% 27.14% 32.36% 15.15%
* Date of issuance of units.^ Total investment return excludes the effects of sales charges and is not annualized.
(a)(b)(c)(d)(e)
Ratios for the period ended March 31, 2005 were annualized using a 365 day base.
The effect of the expenses waived for the periods ended March 31, 2008, March 31, 2007, March 31, 2006, and March 31, 2005 was to decrease the expense ratios, thus increasing the net investment income ratio to averagenet assets applicable to common shareholders by 0.32%, 0.26%, 0.14% and 0.78%, respectively.
The effect of the expenses waived for the periods ended March 31, 2008, March 31, 2007, March 31, 2006, and March 31, 2005 was to decrease the expense ratios, thus increasing the net investment income ratio to averagenet assets applicable to common shareholders by 0.24%, 0.25%, 0.13% and 0.71%, respectively.
The effect of the expenses waived for the periods ended March 31, 2008, March 31, 2007, March 31, 2006, and March 31, 2005 was to decrease the expense ratios, thus increasing the net investment income ratio to averagenet assets applicable to common shareholders by 0.30%, 0.22%, 0.15% and 0.72%, respectively.
Based on average outstanding units of 129,234; 490,275; 645,183 and 208,507 for the periods ended March 31, 2008, March 31, 2007, March 31, 2006 and March 31, 2005, respectively.Calculation is based on beginning and end of period net asset values and assumes reinvestment of dividends. Based on average net assets of $1,468,904; $5,324,913; $6,661,017 and $2,215,453 for the periods ended March 31, 2008, March 31, 2007, March 31, 2006 and March 31, 2005, respectively.
Based on average net assets of $342,720; $577,047; $670,745 and $156,093 for the periods ended March 31, 2008, March 31, 2007, March 31, 2006 and March 31, 2005, respectively.Ratios for the period ended March 31, 2005 were annualized using a 365 day base.
For the fiscal year ended March 31, 2007
For the fiscal year ended March 31, 2006
For the period from June 24, 2004* through
March 31, 2005
Based on average outstanding units of 1,021,621; 1,329,754; 1,400,476 and 620,994 for the periods ended March 31, 2008, March 31, 2007, March 31, 2006 and March 31, 2005, respectively.Calculation is based on beginning and end of period net asset values and assumes reinvestment of dividends. Based on average net assets of $11,722,540; $14,697,831; $14,587,695 and $6,463,056 for the periods ended March 31, 2008, March 31, 2007, March 31, 2006 and March 31, 2005, respectively.Ratios for the period ended March 31, 2005 were annualized using a 365 day base.
For the fiscal year ended March 31, 2007
For the fiscal year ended March 31, 2006
For the period from June 22, 2004* through
March 31, 2005
Class A Units
For the fiscal year ended March 31, 2008
For the fiscal year ended March 31, 2008
Class C Units
For the fiscal year ended March 31, 2008
Class L Units
For the fiscal year ended March 31, 2007
For the fiscal year ended March 31, 2006
For the period from June 24, 2004* through
March 31, 2005
Based on average outstanding units of 29,766; 52,994; 65,018 and 14,916 for the periods ended March 31, 2008, March 31, 2007, March 31, 2006 and March 31, 2005, respectively.Calculation is based on beginning and end of period net asset values and assumes reinvestment of dividends.
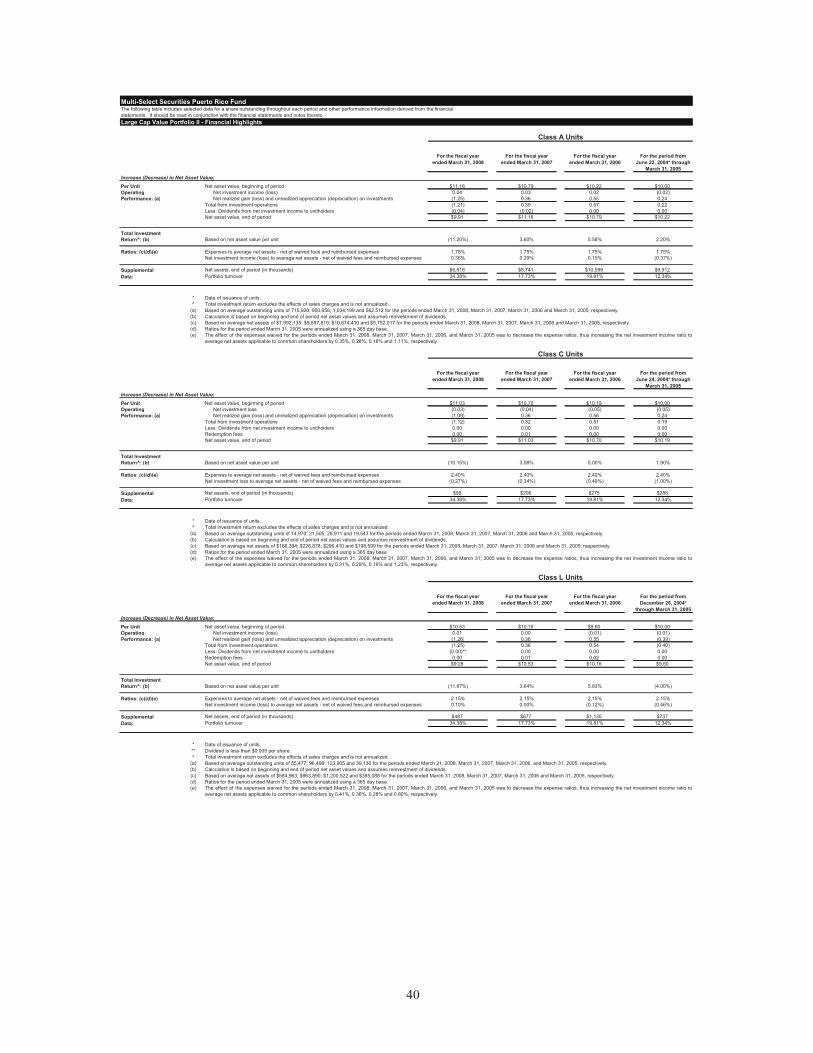
40
Multi-Select Securities Puerto Rico FundThe following table includes selected data for a share outstanding throughout each period and other performance information derived from the financialstatements. It should be read in conjunction with the financial statements and notes thereto.Large Cap Value Portfolio II - Financial Highlights
Increase (Decrease) in Net Asset Value:
Per Unit Net asset value, beginning of period $11.16 $10.79 $10.22 $10.00Operating Net investment income (loss) 0.04 0.03 0.02 (0.02)Performance: (a) Net realized gain (loss) and unrealized appreciation (depreciation) on investments (1.25) 0.36 0.55 0.24
Total from investment operations (1.21) 0.39 0.57 0.22Less: Dividends from net investment income to unitholders (0.04) (0.02) 0.00 0.00Net asset value, end of period $9.91 $11.16 $10.79 $10.22
Total InvestmentReturn^: (b) Based on net asset value per unit (11.20%) 3.60% 5.58% 2.20%
Ratios: (c)(d)(e) Expenses to average net assets - net of waived fees and reimbursed expenses 1.75% 1.75% 1.75% 1.75%Net investment income (loss) to average net assets - net of waived fees and reimbursed expenses 0.36% 0.29% 0.15% (0.37%)
Supplemental Net assets, end of period (in thousands) $6,618 $8,741 $10,599 $9,912Data: Portfolio turnover 34.38% 17.73% 19.81% 12.34%
* Date of issuance of units.^ Total investment return excludes the effects of sales charges and is not annualized.
(a)(b)(c)(d)(e)
Increase (Decrease) in Net Asset Value:
Per Unit Net asset value, beginning of period $11.03 $10.70 $10.19 $10.00Operating Net investment loss (0.03) (0.04) (0.05) (0.05)Performance: (a) Net realized gain (loss) and unrealized appreciation (depreciation) on investments (1.09) 0.36 0.56 0.24
Total from investment operations (1.12) 0.32 0.51 0.19Less: Dividends from net investment income to unitholders 0.00 0.00 0.00 0.00Redemption fees 0.00 0.01 0.00 0.00Net asset value, end of period $9.91 $11.03 $10.70 $10.19
Total InvestmentReturn^: (b) Based on net asset value per unit (10.15%) 3.08% 5.00% 1.90%
Ratios: (c)(d)(e) Expenses to average net assets - net of waived fees and reimbursed expenses 2.40% 2.40% 2.40% 2.40%Net investment loss to average net assets - net of waived fees and reimbursed expenses (0.27%) (0.34%) (0.49%) (1.00%)
Supplemental Net assets, end of period (in thousands) $95 $206 $275 $288Data: Portfolio turnover 34.38% 17.73% 19.81% 12.34%
* Date of issuance of units.^ Total investment return excludes the effects of sales charges and is not annualized.
(a)(b)(c)(d)(e)
Increase (Decrease) in Net Asset Value:
Per Unit Net asset value, beginning of period $10.53 $10.16 $9.60 $10.00Operating Net investment income (loss) 0.01 0.00 (0.01) (0.01)Performance: (a) Net realized gain (loss) and unrealized appreciation (depreciation) on investments (1.26) 0.36 0.55 (0.39)
Total from investment operations (1.25) 0.36 0.54 (0.40)Less: Dividends from net investment income to unitholders (0.00)** 0.00 0.00 0.00Redemption fees 0.00 0.01 0.02 0.00Net asset value, end of period $9.28 $10.53 $10.16 $9.60
Total InvestmentReturn^: (b) Based on net asset value per unit (11.87%) 3.64% 5.83% (4.00%)
Ratios: (c)(d)(e) Expenses to average net assets - net of waived fees and reimbursed expenses 2.15% 2.15% 2.15% 2.15%Net investment income (loss) to average net assets - net of waived fees and reimbursed expenses 0.10% 0.00% (0.12%) (0.46%)
Supplemental Net assets, end of period (in thousands) $487 $677 $1,135 $737Data: Portfolio turnover 34.38% 17.73% 19.81% 12.34%
* Date of issuance of units.** Dividend is less than $0.005 per share.^ Total investment return excludes the effects of sales charges and is not annualized.
(a)(b)(c)(d)(e)
Based on average outstanding units of 715,920; 900,656; 1,034,199 and 562,512 for the periods ended March 31, 2008, March 31, 2007, March 31, 2006 and March 31, 2005, respectively.Calculation is based on beginning and end of period net asset values and assumes reinvestment of dividends. Based on average net assets of $7,992,135; $9,597,819; $10,674,410 and $5,752,017 for the periods ended March 31, 2008, March 31, 2007, March 31, 2006 and March 31, 2005, respectively.
For the fiscal year ended March 31, 2007
For the fiscal year ended March 31, 2006
For the period from June 22, 2004* through
March 31, 2005
For the fiscal year ended March 31, 2008
Ratios for the period ended March 31, 2005 were annualized using a 365 day base.
For the fiscal year ended March 31, 2007
For the fiscal year ended March 31, 2006
For the period from June 24, 2004* through
March 31, 2005
The effect of the expenses waived for the periods ended March 31, 2008, March 31, 2007, March 31, 2006, and March 31, 2005 was to decrease the expense ratios, thus increasing the net investment income ratio toaverage net assets applicable to common shareholders by 0.35%, 0.28%, 0.18% and 1.11%, respectively.
Class L Units
For the fiscal year ended March 31, 2008
Based on average outstanding units of 14,970; 21,505; 28,911 and 19,543 for the periods ended March 31, 2008, March 31, 2007, March 31, 2006 and March 31, 2005, respectively.Calculation is based on beginning and end of period net asset values and assumes reinvestment of dividends. Based on average net assets of $166,394; $226,878; $296,410 and $198,599 for the periods ended March 31, 2008, March 31, 2007, March 31, 2006 and March 31, 2005, respectively.
Based on average outstanding units of 55,477; 96,498; 123,905 and 39,130 for the periods ended March 31, 2008, March 31, 2007, March 31, 2006, and March 31, 2005, respectively.Calculation is based on beginning and end of period net asset values and assumes reinvestment of dividends. Based on average net assets of $584,963; $963,890; $1,200,522 and $385,088 for the periods ended March 31, 2008, March 31, 2007, March 31, 2006 and March 31, 2005, respectively.
The effect of the expenses waived for the periods ended March 31, 2008, March 31, 2007, March 31, 2006, and March 31, 2005 was to decrease the expense ratios, thus increasing the net investment income ratio toaverage net assets applicable to common shareholders by 0.41%, 0.36%, 0.28% and 0.80%, respectively.
Class A Units
For the fiscal year ended March 31, 2008
Class C Units
Ratios for the period ended March 31, 2005 were annualized using a 365 day base.
Ratios for the period ended March 31, 2005 were annualized using a 365 day base.
For the fiscal year ended March 31, 2007
For the fiscal year ended March 31, 2006
For the period from December 26, 2004*
through March 31, 2005
The effect of the expenses waived for the periods ended March 31, 2008, March 31, 2007, March 31, 2006, and March 31, 2005 was to decrease the expense ratios, thus increasing the net investment income ratio toaverage net assets applicable to common shareholders by 0.31%, 0.29%, 0.19% and 1.23%, respectively.

41
Multi-Select Securities Puerto Rico FundThe following table includes selected data for a share outstanding throughout each period and other performance information derived from the financialstatements. It should be read in conjunction with the financial statements and notes thereto.Mid Cap Core Portfolio I - Financial Highlights
Increase (Decrease) in Net Asset Value:
Per Unit Net asset value, beginning of period $11.66 $10.90 $10.22 $10.00Operating Net investment income (loss) 0.08 0.06 (0.00) (0.02)Performance: (a) Net realized gain (loss) and unrealized appreciation (depreciation) on investments (0.68) 0.70 0.68 0.24
Total from investment operations (0.60) 0.76 0.68 0.22Less: Dividends from net investment income to unitholders (0.07) 0.00 0.00 0.00Net asset value, end of period $10.99 $11.66 $10.90 $10.22
Total InvestmentReturn^: (b) Based on net asset value per unit (5.19%) 6.97% 6.65% 2.20%
Ratios: (c)(d)(e) Expenses to average net assets - net of waived fees and reimbursed expenses 1.75% 1.75% 1.75% 1.75%Net investment income (loss) to average net assets - net of waived fees and reimbursed expenses 0.65% 0.52% (0.03%) (0.39%)
Supplemental Net assets, end of period (in thousands) $3,369 $4,885 $6,657 $6,800Data: Portfolio turnover 39.78% 58.31% 66.25% 56.29%
* Date of issuance of units.^ Total investment return excludes the effects of sales charges and is not annualized.
(a)(b)(c)(d)(e)
Increase (Decrease) in Net Asset Value:
Per Unit Net asset value, beginning of period $11.48 $10.78 $10.15 $10.00Operating Net investment income (loss) 0.01 (0.01) (0.07) (0.04)Performance: (a) Net realized gain (loss) and unrealized appreciation (depreciation) on investments (0.39) 0.70 0.70 0.19
Total from investment operations (0.38) 0.69 0.63 0.15Less: Dividends from net investment income to unitholders 0.00 0.00 0.00 0.00Redemption fees 0.00 0.01 0.00 0.00Net asset value, end of period $11.10 $11.48 $10.78 $10.15
Total InvestmentReturn^: (b) Based on net asset value per unit (3.31%) 6.49% 6.21% 1.50%
Ratios: (c)(d)(e) Expenses to average net assets - net of waived fees and reimbursed expenses 2.40% 2.40% 2.40% 2.40%Net investment income (loss) to average net assets - net of waived fees and reimbursed expenses 0.09% (0.07%) (0.63%) (0.99%)
Supplemental Net assets, end of period (in thousands) $92 $395 $454 $280Data: Portfolio turnover 39.78% 58.31% 66.25% 56.29%
* Date of issuance of units.^ Total investment return excludes the effects of sales charges and is not annualized.
(a)(b)(c)(d)(e)
Increase (Decrease) in Net Asset Value:
Per Unit Net asset value, beginning of period $11.55 $10.83 $10.18 $10.00Operating Net investment income (loss) 0.03 (0.03) (0.04) (0.02)Performance: (a) Net realized gain (loss) and unrealized appreciation (depreciation) on investments (0.62) 0.74 0.68 0.20
Total from investment operations (0.59) 0.71 0.64 0.18Less: Dividends from net investment income to unitholders 0.00 0.00 0.00 0.00Redemption fees 0.00 0.01 0.01 0.00Net asset value, end of period $10.96 $11.55 $10.83 $10.18
Total InvestmentReturn^: (b) Based on net asset value per unit (5.11%) 6.65% 6.39% 1.80%
Ratios: (c)(d)(e) Expenses to average net assets - net of waived fees and reimbursed expenses (2.18%) 2.15% 2.15% 2.15%Net investment income (loss) to average net assets - net of waived fees and reimbursed expenses 2.46% (0.26%) (0.41%) (0.73%)
Supplemental Net assets, end of period (in thousands) $136 $212 $2,807 $2,640Data: Portfolio turnover 39.78% 58.31% 66.25% 56.29%
* Date of issuance of units.** Date when units were redeemed.^ Total investment return excludes the effects of sales charges and is not annualized.
(a)(b)(c)(d)(e)
Based on average outstanding units of 376,277; 516,045; 684,607 and 481,898 for the periods ended March 31, 2008, March 31, 2007, March 31, 2006, and March 31, 2005, respectively.Calculation is based on beginning and end of period net asset values and assumes reinvestment of dividends. Based on average net assets of $4,435,039; $5,599,806; $7,186,202 and $4,878,432 for the periods ended March 31, 2008, March 31, 2007, March 31, 2006 and March 31, 2005, respectively.
For the fiscal year ended March 31, 2007
For the fiscal year ended March 31, 2006
For the period from June 22, 2004* through
March 31, 2005
For the fiscal year ended March 31, 2008
Ratios for the period ended March 31, 2005 were annualized using a 365 day base.
For the fiscal year ended March 31, 2007
For the fiscal year ended March 31, 2006
For the period from June 24, 2004* through
March 31, 2005
The effect of the expenses waived for the periods ended March 31, 2008, March 31, 2007, March 31, 2006, and March 31, 2005 was to decrease the expense ratios, thus increasing the net investment income ratio toaverage net assets applicable to common shareholders by 0.52%, 0.38%, 0.21% and 1.18%, respectively.
Based on average outstanding units of 25,015; 38,409; 43,035 and 15,589 for the periods ended March 31, 2008, March 31, 2007, March 31, 2006, and March 31, 2005, respectively.Calculation is based on beginning and end of period net asset values and assumes reinvestment of dividends. Based on average net assets of $293,954; $411,641; $448,910 and $158,096 for the periods ended March 31, 2008, March 31, 2007, March 31, 2006 and March 31, 2005, respectively.
Ratios for the periods ended January 30, 2008 were annualized using a 366 day base. Ratios for the period ended March 31, 2005 were annualized using a 365 day base.
Based on average outstanding units of 14,222; 172,602; 278,215 and 109,985 for the periods ended January 30, 2008, March 31, 2007, March 31, 2006, and March 31, 2005, respectively.Calculation is based on beginning and end of period net asset values and assumes reinvestment of dividends. Based on average net assets of $168,195; $1,826,874; $2,902,371 and $1,131,923 for the periods ended January 30, 2008, March 31, 2007, March 31, 2006 and March 31, 2005, respectively.
The effect of the expenses waived for the periods ended January 30, 2008, March 31, 2007, March 31, 2006, and March 31, 2005 was to decrease the expense ratios, thus increasing the net investment income ratio toaverage net assets applicable to common shareholders by0.21%, 0.28%, 0.22% and 0.71%, respectively.
Class A Units
For the period from April 1, 2007 through
January 30, 2008**
Class L Units
Class C Units
For the fiscal year ended March 31, 2008
Ratios for the period ended March 31, 2005 were annualized using a 365 day base.
For the fiscal year ended March 31, 2007
For the fiscal year ended March 31, 2006
For the period from June 24, 2004* through
March 31, 2005
The effect of the expenses waived for the periods ended March 31, 2008, March 31, 2007, March 31, 2006 and March 31, 2005 was to decrease the expense ratios, thus increasing the net investment income ratio toaverage net assets applicable to common shareholders by 0.47%, 0.42%, 0.20% and 1.05%, respectively.

42
Multi-Select Securities Puerto Rico FundThe following table includes selected data for a share outstanding throughout each period and other performance information derived from the financialstatements. It should be read in conjunction with the financial statements and notes thereto.Small Cap Core Portfolio I - Financial Highlights
Increase (Decrease) in Net Asset Value:
Per Unit Net asset value, beginning of period $10.47 $10.90 $10.01 $10.00Operating Net investment income (loss) 0.01 (0.01) (0.02) (0.03)Performance: (a) Net realized gain (loss) and unrealized appreciation (depreciation) on investments (1.33) (0.42) 0.91 0.04
Total from investment operations (1.32) (0.43) 0.89 0.01Less: Dividends from net investment income to unitholders 0.00 0.00 0.00 0.00Net asset value, end of period $9.15 $10.47 $10.90 $10.01
Total InvestmentReturn^: (b) Based on net asset value per unit (12.61%) (3.94%) 8.89% 0.10%
Ratios: (c)(d)(e) Expenses to average net assets - net of waived fees and reimbursed expenses 1.75% 1.75% 1.75% 1.75%Net investment income (loss) to average net assets - net of waived fees and reimbursed expenses 0.11% (0.07%) (0.17%) (0.61%)
Supplemental Net assets, end of period (in thousands) $2,125 $7,953 $11,518 $8,766Data: Portfolio turnover 55.85% 31.84% 46.99% 23.87%
* Date of issuance of units.^ Total investment return excludes the effects of sales charges and is not annualized.
(a)(b)(c)(d)(e)
Increase (Decrease) in Net Asset Value:
Per Unit Net asset value, beginning of period $10.31 $10.78 $9.96 $10.00Operating Net investment loss (0.05) (0.07) (0.08) (0.06)Performance: (a) Net realized gain (loss) and unrealized appreciation (depreciation) on investments (1.06) (0.43) 0.89 0.02
Total from investment operations (1.11) (0.50) 0.81 (0.04)Less: Dividends from net investment income to unitholders 0.00 0.00 0.00 0.00Redemption fees (0.01) 0.03 0.01 0.00Net asset value, end of period $9.19 $10.31 $10.78 $9.96
Total InvestmentReturn^: (b) Based on net asset value per unit (10.86%) (4.36%) 8.23% (0.40%)
Ratios: (c)(d)(e) Expenses to average net assets - net of waived fees and reimbursed expenses 2.40% 2.40% 2.40% 2.40%Net investment loss to average net assets - net of waived fees and reimbursed expenses (0.51%) (0.75%) (0.81%) (1.23%)
Supplemental Net assets, end of period (in thousands) $62 $160 $348 $252Data: Portfolio turnover 55.85% 31.84% 46.99% 23.87%
* Date of issuance of units.^ Total investment return excludes the effects of sales charges and is not annualized.
(a)(b)(c)(d)(e)
Increase (Decrease) in Net Asset Value:
Per Unit Net asset value, beginning of period $10.56 $11.03 $10.17 $10.00Operating Net investment loss (0.03) (0.06) (0.07) (0.02)Performance: (a) Net realized gain (loss) and unrealized appreciation (depreciation) on investments (1.35) (0.42) 0.91 0.19
Total from investment operations (1.38) (0.48) 0.84 0.17Less: Dividends from net investment income to unitholders 0.00 0.00 0.00 0.00Redemption fees 0.00 0.01 0.02 0.00Net asset value, end of period $9.18 $10.56 $11.03 $10.17
Total InvestmentReturn^: (b) Based on net asset value per unit (13.07%) (4.26%) 8.46% 1.70%
Ratios: (c)(d)(e) Expenses to average net assets - net of waived fees and reimbursed expenses 2.15% 2.15% 2.15% 2.15%Net investment loss to average net assets - net of waived fees and reimbursed expenses (0.32%) (0.56%) (0.65%) (0.92%)
Supplemental Net assets, end of period (in thousands) $660 $1,269 $3,164 $2,864Data: Portfolio turnover 55.85% 31.84% 46.99% 23.87%
* Date of issuance of units.^ Total investment return excludes the effects of sales charges and is not annualized.
(a)(b)(c)(d)(e)
Based on average outstanding units of 492,644; 942,658; 1,098,026 and 578,462 for the periods ended March 31, 2008, March 31, 2007, March 31, 2006, and March 31, 2005, respectively.Calculation is based on beginning and end of period net asset values and assumes reinvestment of dividends. Based on average net assets of $5,144,922; $9,573,741; $11,226,916 and $5,915,202 for the periods ended March 31, 2008, March 31, 2007, March 31, 2006 and March 31, 2005, respectively.
For the fiscal year ended March 31, 2007
For the fiscal year ended March 31, 2006
For the period from June 22, 2004* through
March 31, 2005
For the fiscal year ended March 31, 2008
Ratios for the period ended March 31, 2005 were annualized using a 365 day base.
For the fiscal year ended March 31, 2007
For the fiscal year ended March 31, 2006
For the period from June 24, 2004* through
March 31, 2005
The effect of the expenses waived for the periods ended March 31, 2008, March 31, 2007, March 31, 2006, and March 31, 2005 was to decrease the expense ratios, thus increasing the net investment income ratio toaverage net assets applicable to common shareholders by 0.59%, 0.27%, 0.18% and 0.99%, respectively.
For the fiscal year ended March 31, 2007
For the fiscal year ended March 31, 2006
For the period from June 24, 2004* through
March 31, 2005
The effect of the expenses waived for the periods ended March 31, 2008, March 31, 2007, March 31, 2006, and March 31, 2005 was to decrease the expense ratios, thus increasing the net investment income ratio toaverage net assets applicable to common shareholders by 0.57%, 0.26%, 0.16% and 0.97%, respectively.
For the fiscal year ended March 31, 2008
Ratios for the period ended March 31, 2005 were annualized using a 365 day base.
Based on average outstanding units of 89,152; 227,148; 372,980 and 120,377 for the periods ended March 31, 2008 March 31, 2007, March 31, 2006 and March 31, 2005, respectively.Calculation are based on beginning and end of period net asset values and assumes reinvestment of dividends. Based on average net assets of $926,862; $2,327,584; $3,858,797 and $1,274,386 for the periods ended March 31, 2008, March 31, 2007, March 31, 2006 and March 31, 2005, respectively.
The effect of the expenses waived for the periods ended March 31, 2008, March 31, 2007, March 31, 2006, and March 31, 2005 was to decrease the expense ratios, thus increasing the net investment income ratio toaverage net assets applicable to common shareholders by 0.69%, 0.22%, 0.16% and 0.70%, respectively.
Class A Units
For the fiscal year ended March 31, 2008
Class C Units
Class L Units
Ratios for the period ended March 31, 2005 were annualized using a 365 day base.
Based on average outstanding units of 11,790; 23,719; 35,417 and 16,041 for the periods ended March 31, 2008, March 31, 2007, March 31, 2006 and March 31, 2005, respectively.Calculation is based on beginning and end of period net asset values and assumes reinvestment of dividends. Based on average net assets of $120,333; $237,461; $359,511 and $163,793 for the periods ended March 31, 2008, March 31, 2007, March 31, 2006 and March 31, 2005, respectively.
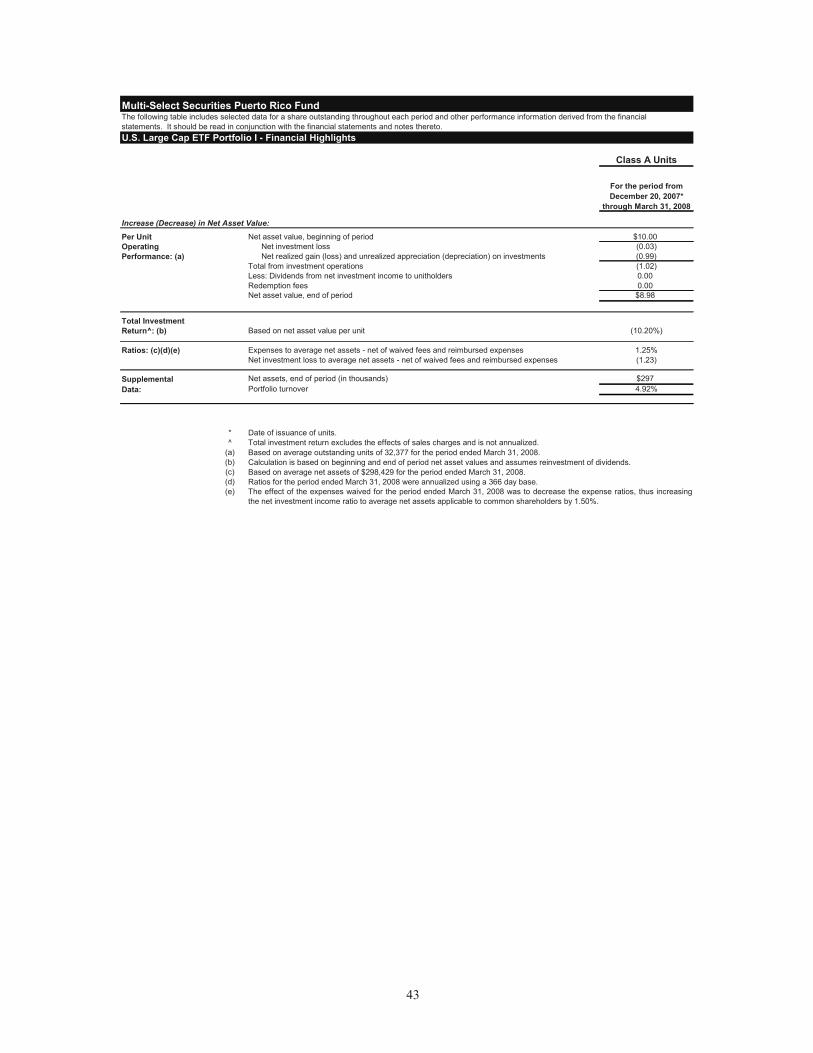
43
The following table includes selected data for a share outstanding throughout each period and other performance information derived from the financialstatements. It should be read in conjunction with the financial statements and notes thereto.U.S. Large Cap ETF Portfolio I - Financial Highlights
Class A Units
Increase (Decrease) in Net Asset Value:
Per Unit Net asset value, beginning of period $10.00Operating Net investment loss (0.03)Performance: (a) Net realized gain (loss) and unrealized appreciation (depreciation) on investments (0.99)
Total from investment operations (1.02)Less: Dividends from net investment income to unitholders 0.00Redemption fees 0.00Net asset value, end of period $8.98
Total InvestmentReturn^: (b) Based on net asset value per unit (10.20%)
Ratios: (c)(d)(e) Expenses to average net assets - net of waived fees and reimbursed expenses 1.25%Net investment loss to average net assets - net of waived fees and reimbursed expenses (1.23)
Supplemental Net assets, end of period (in thousands) $297Data: Portfolio turnover 4.92%
* Date of issuance of units.^ Total investment return excludes the effects of sales charges and is not annualized.
(a)(b)(c)(d)(e)
Multi-Select Securities Puerto Rico Fund
For the period from December 20, 2007*
through March 31, 2008
Ratios for the period ended March 31, 2008 were annualized using a 366 day base.The effect of the expenses waived for the period ended March 31, 2008 was to decrease the expense ratios, thus increasingthe net investment income ratio to average net assets applicable to common shareholders by 1.50%.
Based on average outstanding units of 32,377 for the period ended March 31, 2008.Calculation is based on beginning and end of period net asset values and assumes reinvestment of dividends. Based on average net assets of $298,429 for the period ended March 31, 2008.

[This page intentionally left blank.]
A-1
APPENDIX A
ABOUT ACCESSSM
The Fund consists of a series of separately managed pools of assets. Each of the Large Cap Value Portfolio I , Large Cap Value Portfolio II, Large Cap Core Portfolio I, Large Cap Core Portfolio II, Large Cap Growth Portfolio I, Large Cap Growth Portfolio II, Mid Cap Core Portfolio I, Small Cap Core Portfolio I, International Portfolio , International Portfolio II and U.S. Large Cap ETF Portfolio I (each, a “Portfolio”) is divided into a Puerto Rico Securities Portion and an Equity Portion. The Fund uses a variation of what has been termed a “multi-manager” approach with regard to the Equity Portion of each Portfolio except for the U.S. Large Cap ETF Portfolio I. The Fund has initially established ten accounts (one for each Portfolio other than the U.S. Large Cap ETF Portfolio I, each an “Account”) in ACCESSSM, a wrap fee third party manager program (the “ACCESS program” or “Program”) offered by UBS Financial Services Inc. (“UBS-FS”). Each of the Portfolios in the ACCESS Program has its own Account. The Fund’s Investment Adviser establishes the specific investment style for each Account and chooses the investment managers from those managers available in the ACCESS program.
The Fund, on behalf of the applicable Portfolios, is the client of the ACCESS program, and as such is the account holder and the beneficial owner of all securities in the Accounts. No ACCESS services will be available directly to investors in the Fund and such investors are not considered clients of the ACCESS program.
This Appendix contains a more detailed description of the ACCESS program as relevant to the Fund and the risks associated with an investment made through the ACCESS program. This description is based on and generally quotes or paraphrases disclosure about UBS-FS and the ACCESS program contained in the brochure and other documents used in connection with that program as of the date of this prospectus. The Fund and the Investment Adviser have relied on such brochure and other documents without independent verification. Information regarding the ACCESS program included in the related brochure is subject to change in the discretion of UBS-FS. Additional information about UBS-FS (including certain financial and other information) and the ACCESS program is contained in the program’s brochure, which is available free of charge upon request by contacting the Fund at 1 787 773 3888.
The following description of the ACCESS third party manager wrap fee program does not apply to the U.S. Large Cap ETF Portfolio I, as such Portfolio is solely managed by the Investment Adviser.
About UBS-FS
UBS-FS is one of the nation’s leading securities firms, serving the investment and capital needs of individual, corporate and institutional clients. UBS-FS is a member of all principal securities and commodities exchanges in the United States and the New York Stock Exchange (“NYSE”). Its parent company, UBS AG (“UBS”), is a global, integrated investment services firm and one of the world’s leading banks. With its affiliates, it is registered to act as a broker-dealer, investment adviser, futures commission merchant, commodity pool operator and commodity trading advisor.
UBS-FS provides investment advisory services to individuals, banks, thrift institutions, mutual funds and other investment companies, pension and employee benefit plans, trusts, estates, charities, corporations and other business and government entities. Its advisory services cover most types of debt and equity or equity-related securities of U.S. and foreign companies and national and local government issuers, both those that are exchange-listed and those traded over-the-counter. UBS-FS also provides consulting, brokerage and advisory services relating to rights and warrants, securities options and futures; mortgage-backed securities; certificates of deposit; commodities and commodity options and futures contracts, including financial futures; commercial paper; bankers’ acceptances; variable annuities; variable life insurance; open and closed-end funds; exchange traded funds; real estate investment trusts; American Depository Shares; foreign ordinary shares and publicly traded master limited partnerships.
As a registered adviser, UBS-FS completes a Form ADV, which contains additional information about its business and its affiliates. Certain information is available through publicly available filings at the Securities and Exchange Commission at www.adviserinfo.sec.gov.

A-2
The information is current as of the date of this document and is subject to change at UBS-FS’s discretion.
Conducting Business with UBS-FS: Investment Advisory and Broker Dealer Services
As a firm providing wealth management services to clients in the United States, UBS-FS is registered with the U.S. Securities and Exchange Commission (SEC) as a broker-dealer and an investment adviser, offering both investment advisory and brokerage services.
It is important to understand that investment advisory and brokerage services are separate and distinct and each is governed by different laws and separate contracts. While there are similarities among the brokerage and advisory services UBS-FS provides to its clients, depending on the capacity in which UBS-FS acts, its contractual relationship and legal duties to its clients are subject to a number of important differences.
UBS-FS’s Services as an Investment Adviser and Relationship With the Fund
UBS-FS offers a number of investment advisory programs to clients, acting in the capacity as an investment adviser, including comprehensive financial planning, discretionary account management, non-discretionary investment advisory programs, and advice on the selection of investment managers and mutual funds offered through its investment advisory programs.
When UBS-FS acts as investment adviser, it enters into a written agreement expressly acknowledging its investment advisory relationship with the client and describing its obligations in such capacity.
UBS-FS’s Fiduciary Responsibilities as an Investment Adviser
As an investment adviser to the Fund’s ACCESS account, UBS-FS is considered to have a fiduciary relationship with the Fund in such capacity and is held to legal standards under the Investment Advisers Act of 1940 and state laws, where applicable, that reflect this high standard. These standards include:
• Obligations to disclose to the Fund all material conflicts between UBS-FS’s interests and the Fund’s interests.
• If UBS-FS or its affiliates receive additional compensation from the Fund or a third-party as a result of its relationship with the Fund, it must disclose that to the Fund.
• UBS-FS must obtain informed consent before engaging in transactions with the Fund for its own account or that of an affiliate or another client when it acts in an advisory capacity.
• UBS-FS must treat the Fund and other advisory clients fairly and equitably and cannot unfairly advantage one client to the disadvantage of another.
• The investment decisions or recommendations UBS-FS makes for the Fund must be suitable and appropriate for the Fund and consistent with its investment objectives and goals and any restrictions placed on UBS-FS.
• UBS-FS must act in what it reasonably believes to be the Fund’s best interests and in the event of a conflict of interest, must place the Fund’s interests before its own.
UBS-FS’s Services as a Broker-Dealer and Relationship With the Fund
As a full-service broker-dealer, UBS-FS’s services are not limited to taking customer orders and executing securities transactions. As a broker-dealer, UBS-FS provides a variety of services relating to investments in securities, including providing investment research, executing trades and providing custody services. UBS-FS also makes recommendations to brokerage clients about whether to buy, sell or hold securities. UBS-FS considers these recommendations to be part of its brokerage services and does not charge a separate fee for this advice. UBS-FS’s recommendations must be suitable for each client, in light of the client’s particular financial circumstances, goals and tolerance for risk.
UBS-FS’s Financial Advisors can assist clients in identifying overall investment needs and goals and creating investment strategies that are designed to pursue those investment goals. The advice and service it provides to clients with respect to their brokerage accounts is an integral part of its services offered as a broker-dealer.

A-3
In its capacity as broker-dealer, UBS-FS does not make investment decisions for clients or manage their accounts on a discretionary basis. UBS-FS will only buy or sell securities for brokerage clients based on specific directions from such clients.
UBS-FS’s Responsibilities as a Broker-Dealer
When UBS-FS acts as a broker, it is held to the legal standards of the Securities Exchange Act of 1934, the Securities Act of 1933, the rules of self-regulatory organizations such as the Financial Industry Regulatory Authority (“FINRA”), the NYSE and state laws, where applicable.
• As a broker-dealer, UBS-FS has a duty to deal fairly with the Fund. Consistent with UBS-FS’s duty of fairness, UBS-FS is obligated to make sure that the prices the Fund receives when it executes transactions for the Fund are reasonable and fair in light of prevailing market conditions and that the commissions and other fees UBS-FS charges the Fund are not excessive.
• UBS-FS must have a reasonable basis for believing that any securities recommendations it makes to the Fund are suitable and appropriate for the Fund, given its financial circumstances, needs and goals.
• UBS-FS is permitted to trade with the Fund for its own account or for an affiliate or another client and may earn a profit on those trades. When UBS-FS engages in these trades, it discloses the capacity in which it acted on the confirmation, though it is not required to communicate this or obtain consent in advance, or to inform the Fund of the profit earned on the trades.
• It is important to note that when UBS-FS acts as broker-dealer to the Fund, it does not enter into a fiduciary relationship with the Fund. Absent special circumstances, UBS-FS is not held to the same legal standards that apply when UBS-FS has a fiduciary relationship with a client, as it does when providing investment advisory services. UBS-FS’s legal obligations to disclose detailed information to its clients about the nature and scope of its business, personnel, fees, conflicts between its interests and client interests and other matters are more limited than when UBS-FS has fiduciary duties with respect to such client.
ACCESSSM
The following describes the ACCESS* third party manager “wrap fee” advisory program. UBS-FS acts as sponsor for the ACCESS program.
The ACCESS program offers the portfolio management services of a select, pre-screened group of investment managers. The Fund has selected one or more of such investment managers as investment managers (who may or may not be affiliated with UBS-FS or the Fund) for the Accounts of certain Portfolios. The Fund’s Investment Adviser selects a particular investment manager as being available to manage a Portfolio’s assets, and specifies the Portfolio’s investment restrictions to the investment manager prior to the investment manager accepting the account. The Fund does not, however, have an agreement directly with such investment manager. UBS-FS does not represent that the investment managers presented will be the best available managers either in the industry or offered through UBS-FS.
The investment managers have sole authority to manage the Portfolios’ Accounts and will make all investment decisions for the Account without discussing these transactions with the Fund, the Investment Adviser or UBS-FS. Neither the Fund nor the Investment Adviser may enter into securities transactions for the Portfolio’s ACCESS Accounts. However, UBS-FS will accept the Fund’s written instructions for transactions associated with tax planning (i.e., tax gain or loss sales), provided those instructions are consistent with the investment manager’s strategy.
UBS-FS is not responsible for the Fund’s choice of investment managers, an investor’s selection of a Portfolio, or the investment managers’ day-to-day investment decisions, performance, compliance with applicable laws, rules or regulations, including compliance with execution obligations or other matters within the investment manager’s control. UBS-FS does not restrict clients’ ability to engage investment managers directly rather than through the ACCESS program during the selection process or thereafter.
* ACCESS is a service mark of UBS Financial Services Inc.
A-4
ACCESS Manager Research Process. UBS-FS selects investment managers to participate in the ACCESS program to give clients a wide choice of investment capitalizations and styles, including, among others, value, growth, growth and income, income, contrarian, sector rotation, tactical asset allocation, strategic asset allocation (through multi-style accounts), interest rate anticipation, municipals, global, international, convertible bonds, long/short investing and strategies with real estate investment trusts. Some investment managers in turn, delegate their management responsibilities to affiliated and non-affiliated subadvisers.
Before being allowed to participate in the ACCESS program, each investment manager undergoes a research due diligence process performed by UBS-FS’s Manager Research Group. In summary, the Manager Research Group begins the screening process by using publicly available databases industry contacts of the Manager Research Group or others at UBS-FS and from managers approaching the Manager Research Group or an unsolicited basis. General screens such as assets under management and portfolio manager “longevity” and investment style are used to narrow the field.
Once the field of candidates has been narrowed via the general screens, the Manager Research Group determines whether each potential candidate is interested in working within the ACCESS program, typically by calling the investment manager. Some main reasons why investment managers may opt out of our searches are: (1) wrap fee programs are technology intensive, and the manager may not be interested in spending money to establish the appropriate technological and administrative support; (2) the manager simply is not interested based on our program’s minimum account size; or (3) the manager is unwilling to provide its investment management services at a pre-negotiated, institutional rate.
UBS-FS’s selection procedure includes an examination of investment philosophy and process, onsite interviews with principals and key staff members, and a review of trading practices and portfolio performance. UBS-FS may use third parties to help gather and analyze information used in the review. UBS-FS reviews investment managers periodically to confirm and validate its earlier conclusions. That process includes visits with the investment manager as well as ongoing performance-monitoring based upon composite results of the ACCESS accounts. UBS-FS retains the authority to remove any investment manager from the ACCESS program at any time and, replace it in whole or in part, or hold the existing assets in a client’s account until further instructions are received from the client if, in its discretion, this action is warranted. Circumstances under which these actions might be taken include (but are not limited to) poor performance, significant departure from the investment manager’s stated investment discipline, or material changes in the investment manager’s organization.
All active managers in its ACCESS program are asked to contribute to UBS-FS’s overall training and education costs for Financial Advisors in the UBS-FS managed accounts programs. The amount of these payments is based on the manager’s assets in the ACCESS program, and how long they have been available in the program. See "Additional Compensation -- Manager Contributions to Training and Education Expenses". Neither contribution towards these educational expenses, nor lack thereof, is considered as a factor in analyzing or determining whether a manager should be included or should remain in the ACCESS program; no manager has ever been removed from the ACCESS program because of its unwillingness to contribute to UBS-FS’s educational expenses
Included in Appendix B are certain portions of the descriptive profiles of the Equity Portion Portfolio Managers, provided to the Fund by UBS-FS that include past performance information. While UBS-FS believes this information is accurate, UBS-FS and the Fund do not independently verify or guarantee it. Please note that UBS-FS cannot assure that any past performance information provided has been calculated on a uniform or consistent basis.
ACCESS Program Fees. The ACCESS Program charges a wrap fee, which for the Portfolios is .50% of the assets of each Portfolio that is invested in ACCESS. This fee covers UBS-FS’s execution, custodial and related services, as well as the investment management services of the investment manager.

A-5
ACCESS Manager Fees. UBS-FS pays a portion of the program fee to the investment manager as compensation for their services. The range of annual fees paid to investment managers for equity accounts is 0.35% to 0.75% of assets under management.
The amount of the program fee paid to each investment manager is a function of that manager's investment style as well as their total amount of assets under management in the ACCESS program. The percentage of the program fee payable to the manager was determined as of January 1 of each year based on the investment style, and the overall equity/balanced assets under management in our programs, as of December 31 of the preceding year. Within the classification of equity managers, those managing specialized investment strategies, international strategies, multiple style accounts or small cap strategies may receive a higher percentage of the program fee than other equity or balanced managers. A manager's performance, increase or decrease in assets during the year will not increase or decrease the compensation percentage payable to the manager for that year. The compensation payable to external money managers is higher for equity and balanced strategies than it is for fixed income strategies.
General Information
Investment Strategies; Eligible and Ineligible Assets. UBS-FS employs a variety of investment strategies in connection with its wrap fee and other investment advisory services, depending upon the type of client involved, the program chosen and the objective selected by the client. These strategies may involve the use of proprietary models or research blends, long- and short-term investments and covered option writing, but may also include in special circumstances, short sales, and option or other hedging techniques. UBS-FS, in its sole discretion, may expand the offerings in its programs to include multiple style accounts, and investment strategies that include the purchase and sale of mutual funds, exchange-traded funds, alternative investment vehicles also known as hedge funds or the use of margin and short sales and option strategies. UBS-FS may impose special suitability and investment requirements with respect to these portfolios. UBS-FS requires that the Fund hold only eligible, managed assets in its advisory accounts. Generally, with respect to the programs described herein, the investment manager may purchase and sell securities of any kind which may include U.S. and foreign stocks, bonds, options, American Depository Receipts†, foreign Ordinary Shares, and (at prescribed levels in certain programs) open and closed-end funds, eligible UITs, exchange traded funds, money market funds, and public real estate investment trusts (collectively, “eligible assets”). Insurance and annuity products, limited partnership interests, private placements, IPOs, syndicate offerings, alternative investments, UBS securities, auction rate preferred securities, structured products, floating rate securities, listed or OTC index warrants, commodities and futures, and, for those programs which permit open-end mutual funds, B and C class shares, (collectively, “Ineligible Assets”) are not eligible for our advisory programs. The list of Eligible and Ineligible Investments can change at any time in UBS-FS’s discretion. Diversification. Unless the investment strategy the Fund selected is identified as a fully diversified strategy, an investment in that strategy should not be considered as a diversified asset allocation plan to investing, but should be viewed only as the equity portion of an investor’s overall portfolio. Investment Restrictions. The Fund may impose investment restrictions on the management of its account including restrictions as to permissible securities, industries, industry sectors or credit ratings. Restrictions apply only to the eligible program assets in such account. Depending on the structure of the program the Fund selected, UBS-FS or the applicable investment manager, as the case may be, will seek to adhere to these restrictions on a reasonable basis. However, if the strategy the Fund selected utilizes commingled vehicles (for example, mutual funds, exchange traded funds or alternative investments), any restrictions the Fund places on its account will not flow through to the securities owned by those commingled vehicles. † From time to time, investment managers that invest in U.S. equities may also purchase certain ADRs as part of their investment strategy, as long as those securities are generally consistent with the investment manager’s strategy and the relevant program’s policies and procedures.
A-6
Accounts with investment restrictions may perform differently from accounts without restrictions and performance may be poorer. UBS-FS obtains information about company classifications, credit ratings, and industry groupings from third parties. Although UBS-FS believes this information to be reliable, it does not independently verify or guarantee the accuracy of the information. The change of the classification of a company, the grouping of an industry or the credit rating of a security may force the investment manager to sell securities in a client's account at an inopportune time, possibly causing a taxable event to the client. Investment Policy Statements. Since a managed account is generally only one component of a client’s overall portfolio, UBS-FS will not approve or otherwise monitor compliance with investment policy statements when provided in connection with the opening of an account in the programs described herein, at account conversion (for acquisitions) or otherwise. In connection with these accounts, UBS-FS will not be responsible for ensuring that the Fund’s investment policy statement and asset allocation choices comply with all specific legal, actuarial or other requirements that apply to it. That responsibility rests solely with the Fund.
The fees and/or commissions charged by UBS-FS in the ACCESS program are negotiable and may differ from client to client based on a number of factors. These factors include, but are not limited to, the type and size of the account, and the number and range of supplemental advisory and client-related services to be provided to the account. Fees, as well as other account requirements, may vary as a result of the application of prior policies depending upon customer account inception date. From time to time, the fees for certain advisory services described in its brochure may be reduced for specific clients, branch offices, ACCESS program employees, certain family members or employees of its affiliates.
The Fund and, indirectly, investors in the Fund may pay more or less by using the ACCESS program than might otherwise be paid if sub-advisory and other program services were purchased separately by the Fund. Several factors affect whether costs are more or less in a wrap fee program, including: size of the portfolio; types of investments made by the investment manager; the amount of trading effected by the investment manager; and the actual costs of the services if purchased separately.
Services Included in Your Program Fee: The wrap fee that the Fund pays under the programs described herein cover trading and execution, custody, performance reporting and related account services that UBS-FS provides to the applicable Portfolios and portfolio management. Portfolios not in the ACCESS program may directly pay for the foregoing services.
Fees/Other Charges Not Covered by Your Program Fee. The Fund may pay other charges in addition to the wrap fee, many of which may add to the compensation that UBS-FS receives. Program fees will not be reduced or offset by these fees. These additional fees will reduce the overall return of the Fund’s account. UBS-FS’s Program fees do not include (i) commission charges for transactions for the Fund’s account that the manager or UBS-FS, at the Fund’s direction, may effect through other broker-dealers; (ii) mark-ups/mark-downs on principal transactions with UBS-FS or other broker-dealers; (iii) internal trust fees; (iv) charges imposed by law; (v) costs relating to trading in foreign securities (other than commissions otherwise payable to UBS-FS); (vi) other specialized charges, such as transfer taxes, exchange and SEC transaction fees. Clients also may be charged additional fees for specific account services, such as ACAT transfers and wire transfer charges.
UBS-FS will not be liable for losses caused directly or indirectly by government restrictions, exchange
controls, exchange or market rulings, suspension of trading, act of war, strikes or other conditions beyond UBS-FS’s control, including but not limited to, extreme market volatility or trading volumes. In addition, UBS-FS will not be responsible to the Fund for the purchases or sale of a security by the ACCESS Manager prior to UBS-FS’s receipt of written request for termination. Liquidations from the Fund’s account will be executed free of commission charges. Any transactions initiated by the Equity Portion Portfolio Manager on the day of termination will be processed, if practicable. Liquidation of accounts will depend upon market conditions at the time and, absent unusual circumstances, generally will be processed by the end of the next business day after instructions have been received by UBS-FS. However, certain ACCESS Managers may take longer to liquidate securities for terminated accounts, including high yield securities, convertible securities, and other less liquid securities. Refer to the applicable ACCESS Manager profile for details.
A-7
The ACCESS program agreement may be terminated by the Investment Adviser on behalf of the Fund within (5) five business days from the date the agreement is accepted by UBS-FS and receive a full refund of advisory fees. The Investment Adviser will return those fees without rebate to the Fund. Thereafter, if an agreement is terminated by the Investment Adviser on behalf of the Fund or by UBS-FS, a pro-rated refund of fees paid in advance will be made, or, if no fees have been paid, a pro-rated fee will be imposed. Upon termination, the Investment Adviser will be responsible for the investment of assets in the account, and neither UBS-FS nor the ACCESS Manager will have further obligations to act or advise with respect to these assets.
Note that termination will end the investment advisory fiduciary relationship with the Fund as it pertains to that account and, will cause such account to be converted to and designated as a “brokerage” account only. The investment advisory agreement will no longer apply to that account and it will be governed solely by the terms and conditions of the brokerage account agreement with the Fund.
Debiting/Invoicing Program Fees. Program fees are debited from the Fund’s account.
Uninvested Cash Balances. Generally, some portion of accounts will be held in cash, cash equivalents or money market mutual funds as part of the overall investment strategy for the account. Program fees apply to cash and cash alternatives investments in the account. Uninvested cash balances are automatically invested in money market mutual funds including, as permitted by law, those affiliated with UBS-FS for which it and/or its affiliates receive compensation for services rendered in addition to the fees payable under the program. UBS-FS serves as investment adviser and administrator to several of the money market funds. In such instances, UBS-FS or its affiliates will only receive reimbursement for its direct costs and expenses for providing management and administrative services to the money market fund. Direct costs and expenses exclude overhead costs and profit charges. Please see Additional Compensation “Affiliated Money Market Funds” for a description of the advisory fees UBS-FS and its affiliates receive from the money market funds. Proxy Voting. By executing the relevant program application, the Fund designates its investment manager to receive and vote all proxy and related materials for securities held in its Program account. The Fund may change or cancel this instruction at any time by giving UBS-FS prior written notice. When the Fund delegates proxy voting authority to its investment manager, they will vote on matters requiring a proxy vote for the securities held in the Fund’s program account. The manager will also vote on other corporate actions, like tender offers, which do not require a proxy or are not solicited via a proxy. Neither UBS-FS nor the investment manager will vote on behalf of the Fund with respect to class action lawsuits, legal proceedings and bankruptcy proceedings involving an issuer whose equity or debt securities are held in the Fund’s account. The Fund will be responsible for voting in such cases even in instances in which it delegated proxy voting authority to its investment manager. Correspondence with respect to such lawsuits will be mailed to the Fund directly. None of UBS-FS or the investment manager will be authorized to respond to such correspondence. Copies of the investment manager’s voting policies and procedures are available to the Fund upon its request. The Fund may also request specific information as to how proxies for its securities were voted. Some of the information, format, and period covered by the proxy reports will vary depending on the individual investment manager’s policies and procedures. UBS-FS has no authority, direct or implicit, and accepts no responsibility for taking any action or rendering any advice with respect to the voting of proxies related to securities held in the Fund’s Account. UBS-FS’s obligations with respect to any such solicitation shall be limited exclusively to forwarding, within a reasonable period of time, to the investment manager any materials or other information received by UBS-FS with respect to such solicitation.
Trading Practices, Best Execution and Trading Errors. Please see the section entitled “Participation or Interest in Client Transactions – Trading and Execution Practices” for a description of UBS-FS’s trading practices.
A-8
Best Execution. UBS-FS provides managers in the ACCESS program with a proprietary trading system to administer, maintain, reconcile and place trades with UBS-FS for accounts managed in the ACCESS program. Investment managers have the option to trade through UBS-FS or with other financial institutions, in accordance with the investment manager’s obligation to achieve best execution on all trades for the account. Although use of UBS-FS’s proprietary trading system is not required for a manager to participate in the ACCESS program, the system makes it easier, and therefore encourages, a manager to place trades for ACCESS accounts with UBS-FS instead of with other financial institutions. Investment managers typically will place transactions through UBS-FS on an unsolicited basis, as the Manager deems appropriate.
The ACCESS program fee covers the costs of trades executed with UBS-FS but not the costs of trades executed elsewhere. Trades on which UBS-FS is not the executing broker are referred to as “step out trades”. These transactions are generally traded from broker to broker and are usually cleared net, without any commissions. However, under certain circumstances, an account may be assessed other trading related costs in addition to its ACCESS fee, if the selected investment manager trades with another firm. For this reason, investment managers may find that placing account trades with UBS-FS is often the most favorable trading option for its accounts. However, investment managers may direct transactions to other broker-dealers (for additional fees or sometimes, commissions) if they decide that best execution obligations so require. Some managers have historically directed 100% of their trades to outside broker-dealers.
Each investment manager is solely responsible for meeting its best execution obligations to its accounts. UBS-FS does not analyze or evaluate whether investment managers are meeting their best execution obligations on trades executed for ACCESS accounts. See “Participation or Interest in Client Transactions – Execution of Transactions for Your Account” for a description of execution and order routing practices.
Trade Errors. UBS-FS has a trade error procedure, pursuant to which it resolves trading errors that may occur from time to time. UBS-FS requires the appropriate supervisory personnel to review and approve the correction. The correction must be processed on a timely basis and may not adversely affect a client absent a de minimus exception. The firm maintains an error account to facilitate handling trading errors. Gains may be offset by losses in the error account. If an outside investment adviser causes a trade error, the outside investment adviser's trade error procedure will govern, unless it conflicts with UBS-FS’s internal procedure. Valuation and Other Information. To determine the value of securities in the Fund’s account, UBS-FS generally relies on third party quotation services. If a price is unavailable or believed to be unreliable, UBS-FS may determine the price in good faith and may use other sources such as the last recorded transaction. When securities are held at another custodian, UBS-FS will generally rely on the value provided by that custodian. Valuation data for certain private or illiquid investments may not be provided to us in a timely manner, resulting in valuations that are not current in the Fund’s statements.
Methods Of Analysis, Sources Of Information And Investment Strategy Used For Investment Management Purposes
UBS-FS obtains information from various sources, including financial publications, inspections of
corporate activities, company press releases, research material prepared by its affiliates and third parties, rating or timing services, regulatory and self-regulatory reports and other public sources. In addition, UBS-FS receives a broad range of research and information about the economy, industries, groups of securities and individual companies, statistical information, market data, accounting and tax law interpretations, political developments, pricing and appraisal services, credit analysis, risk measurement analysis, performance analysis and other information which may affect the economy or securities prices. Research can be received in the form of written reports, telephone contacts and personal meetings with research analysts, economists, government representatives and corporate and industry spokespersons. UBS-FS may receive research services generated by its affiliates, third parties, by or through brokers or dealers.
A-9
Although the Fund has access to UBS-FS’s research and that of certain affiliates, the third-party managers in UBS-FS’s advisory programs are not required to use UBS research as the source of their investment decisions. Investment managers participating in the ACCESS Account programs may utilize various fundamental, technical, quantitative or statistical research, tools and valuation methodologies in order to determine which securities to purchase for the Fund’s program account(s). They may rely on their proprietary research, and/or they may receive research from a variety of sources, including UBS-FS or one of its affiliates, as part of their investment process. Any research that UBS-FS or one of its affiliates may provide to an investment manager is separate and apart from UBS-FS’s advisory programs and does not affect or otherwise limit the manager’s discretionary investment responsibility with respect to the Fund’s program account.
Education And Business Standards
Generally, UBS-FS requires its professional personnel who provide investment advisory services to clients to have a college degree or securities industry experience.
Consulting Services and Other Business Activities
As a full service broker-dealer and investment adviser, UBS-FS offers its customers and investment advisory clients a broad range of financial services and products, and is engaged in various aspects of the securities and investment business. Its financial services include: underwriting securities offerings; acting as a market maker in securities; trading for its own account; acting as a clearing firm for other broker-dealers; buying or selling securities, commodity futures contracts and other financial instruments for customers as their broker or buying them from or selling them to clients, acting as principal for its own account; providing investment advice and managing investment accounts or portfolios; and acting as a commodity pool operator, futures commission merchant or commodity trading advisor and providing custodial services. Through its affiliates, UBS-FS provides clients with trust and custodial services; and manages, sponsors and distributes registered investment companies and other public and private pooled investment vehicles, including hedge funds, whose shares or other interests are sold to clients. Currently, its principal business, in terms of its revenues and personnel, is that of a broker-dealer in securities.
Financial Planning Services. Financial planning is an investment advisory service separate and distinct from UBS-FS’s brokerage services and other investment advisory services. Clients may select among four distinct financial planning services based on their objectives, levels of wealth and the overall complexity of their financial needs. UBS-FS provides clients with a personalized report to help them assess their current and projected financial situation and their ability to pursue specific financial goals. UBS-FS’s financial planning services do not include initial or on-going advice regarding specific securities or other investments. Recommendations and types of analysis (including asset allocation strategies) may vary depending on the asset allocation model and the software used for the analysis. Some services are provided free of charge. For those services where a fee is assessed, the fee is negotiable.
Although UBS-FS acts as an investment adviser in providing a client with a financial plan, this does not affect any other relationship the client may have with UBS-FS. The nature of any existing UBS-FS accounts, the rights and obligations relating to these accounts, and the terms and conditions of any UBS-FS account agreement in effect do not change in any way. Financial planning services end upon UBS-FS’s delivery of the plan to the client. Clients are not required to establish accounts, purchase products that UBS-FS distributes, or otherwise transact business with UBS-FS or any of its affiliates. If a client decides that they would like UBS-FS to help them implement an investment strategy, the capacity in which UBS-FS acts will depend on, and vary by, the nature of the accounts (i.e., brokerage or advisory accounts) used for such implementation.
Financial Education Program. UBS-FS also offers a financial education program where an employer or other sponsoring entity, such as an adult education organization, can have a Financial Advisor provide one or a series of financial education seminars to their employees or members (generally, but not always, free of charge to the employees or members) or to the public for a fee. Seminars offered through this program are generic in nature and do not contain recommendations to invest in any particular security. These seminars focus on educating attendees about such topics as asset allocation, the definition of various asset classes, potential risks and rewards, the advantages of tax-deferred or tax-free investing, options available when receiving a retirement plan distribution and other general subjects.
A-10
Consulting Services. Consulting services may also be available to retirement plans, institutions and corporate clients for an asset-based fee, a fixed fee, mutual fund distribution and finder’s fees or brokerage commissions, as well as a combination of a consulting fee with a brokerage offset or transaction fee. Certain services may be available for fixed hourly rates for some programs. The compensation structure may create financial incentives for Financial Advisors to encourage clients to purchase multiple products and services, or to choose a method of payment for, products and services generates compensation in excess of that for other products. In addition, Financial Advisors’ compensation may be connected to the referral or cross-selling of additional UBS-FS products and services to clients.
Consulting services may include, but are not limited to, helping a client establish or amend investment policies and objectives; assisting in an investment manager search; aiding in asset allocation planning; providing asset/liability analysis for defined benefit plans; providing investment evaluation and education materials, including enrollment seminars; determining the number and type of investment alternatives to be offered to plan participants; developing criteria to select and evaluate service providers; and providing performance evaluations. In these cases, investment decisions are made by the client.
UBS-FS’s Subsidiaries and Other Affiliates. UBS-FS has a number of related persons that may provide investment management and other financial services and products to its investment advisory clients that may be material to its advisory business.
UBS-FS, its subsidiaries or its affiliates act in one or more capacities, including investment adviser, subadviser, consultant, administrator and principal underwriter (as applicable) to a number of open-end and closed-end investment companies with varying investment objectives. As a futures commission merchant, commodity pool operator and commodity trading advisor, UBS-FS or an affiliate also provide advice on commodities and commodity related products. Certain of UBS-FS’s subsidiaries, affiliates and related entities include the following:
• PaineWebber Properties Incorporated and PaineWebber Development Corp. create, market, distribute or act as general partner for a number of limited partnerships which invest in commercial and residential properties, oil and gas interests and research and development activities.
• UBS Financial Services Insurance Agency, Inc. • UBS Financial Services Incorporated of Puerto Rico, a separately registered broker-dealer. • UBS Insurance Agency of Puerto Rico Incorporated. • Trust-related services are available through the UBS Fiduciary Trust Company, the UBS Trust
Company, N.A. and UBS Trust Company of Puerto Rico. • UBS Credit Corp. provides loans to clients that are either secured by securities or other financial
instruments. These loans may be used to buy securities or for other purposes. These loans are not subject to the maintenance requirements and potential capital charges that are imposed on broker-dealers.
UBS AG (UBS-FS’s ultimate parent) offers investment advisory services through a variety of direct and
indirect subsidiaries. These entities are separately registered investment advisers and, in some cases, registered broker-dealers and commodity trading advisers. Their principal lines of business range from developing and distributing investment products, including wrap fee products, mutual funds, closed-end funds, privately placed funds and other pooled investment products; providing investment advice to individuals, pension and other employee benefit plans; other tax-exempt organizations, insurance companies, investment companies, commingled trust funds, corporations, and other institutional investors; and serving as investment managers, administrators, distributors and/or placement agents for a number of funds, including (in the case of UBS Global Asset Management (US) Inc., the UBS PACE Select Advisors Trust and a number of UBS-FS and UBS Global Asset Management-advised mutual funds. Certain of the investment advisers listed below may serve as investment managers for clients participating in the ACCESS program.
The UBS AG subsidiaries registered as investment advisers in the United States include:
• Alternative Investment Solutions; • DSI International Management Inc.;
A-11
• UBS Agrivest LLC; • UBS Global Asset Management (Americas) Inc.; • UBS Global Asset Management (US) Inc.; • UBS International Inc.; • UBS Investment Advisors Ltd.; • UBS O’Connor LLC; • UBS O’Connor Limited; • UBS Realty Investors LLC; • UBS Securities LLC; • UBS Swiss Financial Advisers; and • UBS Fund Advisor, LLC, a separately registered investment adviser, is the managing member of five
additional registered investments. These are: UBS Juniper Management, L.L.C.; UBS Tamarack Management, L.L.C.; UBS Eucalyptus Management, LLC; UBS Enso Management, LLC; and UBS Willow-Management, LLC.
These entities manage the assets of, or serve as general partners or managers of, registered investment
companies and private investment funds that may be offered and sold to UBS-FS advisory clients. Information on those investment vehicles can be found on the respective Form ADV of each affiliated adviser.
Additional Sources of Compensation to UBS-FS
Manager Contributions to Training and Education Expenses. Historically, investment managers in ACCESS contributed funds to support UBS-FS’s managed accounts education programs based on their assets under management and their date of entry into ACCESS. Starting January 2008, UBS-FS will request contributions on an event by event basis. As such, from time to time, investment managers participating in ACCESS subsidize a portion of the cost of training seminars UBS-FS offers to Financial Advisors through specialized firm-wide programs and consulting training forums. These seminars are designed to provide training and education to Financial Advisors who regularly solicit clients to participate in our advisory programs. Neither contribution towards these training and educational expenses, nor lack thereof, is considered as a factor in analyzing or determining whether an investment manager should be included or should remain in ACCESS; no manager has ever been removed from ACCESS because of its unwillingness to contribute to UBS-FS’s educational expenses.
The subsidies may vary among investment managers, and no investment manager is required to participate in the seminars or to contribute to the costs of the seminars in order to participate in the programs. Because these seminars often include Financial Advisors who sell UBS-FS’s products as well as those of its affiliates, UBS affiliated companies often contribute substantially more to the costs of these seminars. Financial Advisors do not receive a portion of these payments.
Directed Brokerage Compensation from Managers Available in our Advisory Programs. Financial Advisors who recommend or, otherwise solicit the hiring of investment managers in UBS-FS’s advisory programs, including but not limited to ACCESS, are prohibited from receiving any directed commission income or other transaction revenue from any investment manager who is also employed in any of their account relationships. However, UBS-FS and other Financial Advisors may execute securities transactions directed to them by affiliated and unaffiliated investment managers for other clients. These transactions and the compensation UBS-FS receives may not be pursuant to any specific oral or written arrangement between UBS-FS and any of the affiliated and unaffiliated investment managers.
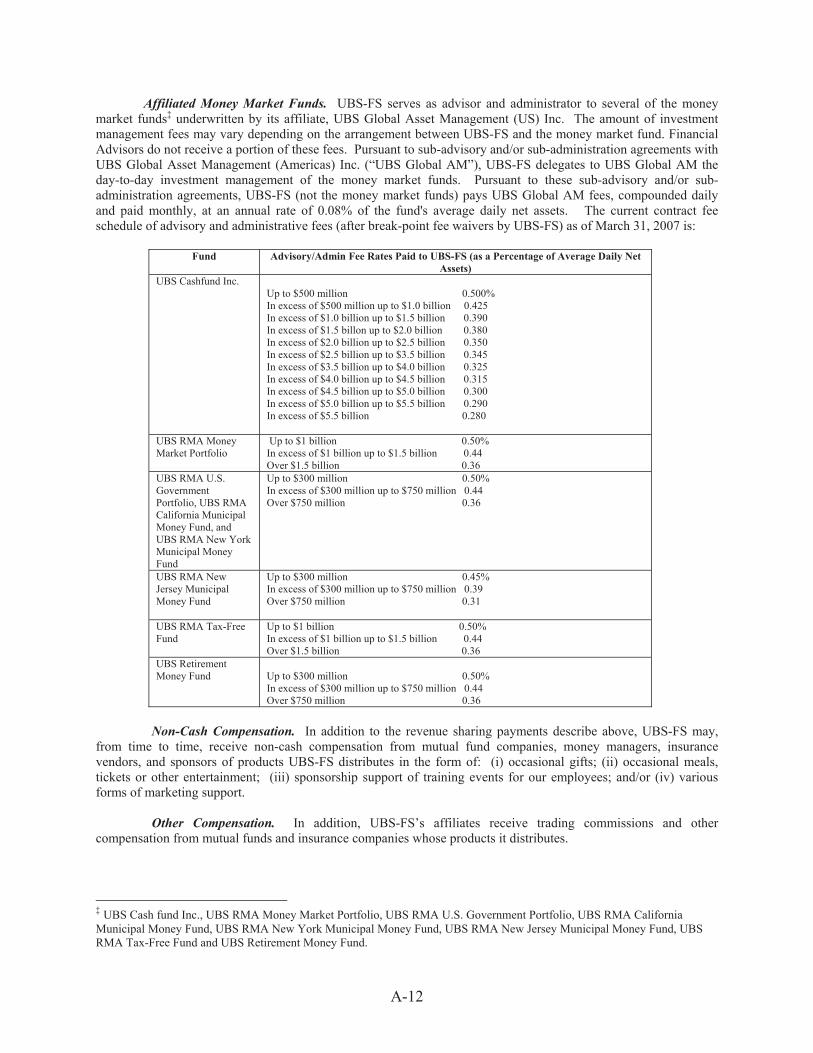
A-12
Affiliated Money Market Funds. UBS-FS serves as advisor and administrator to several of the money market funds‡ underwritten by its affiliate, UBS Global Asset Management (US) Inc. The amount of investment management fees may vary depending on the arrangement between UBS-FS and the money market fund. Financial Advisors do not receive a portion of these fees. Pursuant to sub-advisory and/or sub-administration agreements with UBS Global Asset Management (Americas) Inc. (“UBS Global AM”), UBS-FS delegates to UBS Global AM the day-to-day investment management of the money market funds. Pursuant to these sub-advisory and/or sub-administration agreements, UBS-FS (not the money market funds) pays UBS Global AM fees, compounded daily and paid monthly, at an annual rate of 0.08% of the fund's average daily net assets. The current contract fee schedule of advisory and administrative fees (after break-point fee waivers by UBS-FS) as of March 31, 2007 is:
Fund Advisory/Admin Fee Rates Paid to UBS-FS (as a Percentage of Average Daily Net
Assets) UBS Cashfund Inc.
Up to $500 million 0.500% In excess of $500 million up to $1.0 billion 0.425 In excess of $1.0 billion up to $1.5 billion 0.390 In excess of $1.5 billon up to $2.0 billion 0.380 In excess of $2.0 billion up to $2.5 billion 0.350 In excess of $2.5 billion up to $3.5 billion 0.345 In excess of $3.5 billion up to $4.0 billion 0.325 In excess of $4.0 billion up to $4.5 billion 0.315 In excess of $4.5 billion up to $5.0 billion 0.300 In excess of $5.0 billion up to $5.5 billion 0.290 In excess of $5.5 billion 0.280
UBS RMA Money Market Portfolio
Up to $1 billion 0.50% In excess of $1 billion up to $1.5 billion 0.44 Over $1.5 billion 0.36
UBS RMA U.S. Government Portfolio, UBS RMA California Municipal Money Fund, and UBS RMA New York Municipal Money Fund
Up to $300 million 0.50% In excess of $300 million up to $750 million 0.44 Over $750 million 0.36
UBS RMA New Jersey Municipal Money Fund
Up to $300 million 0.45% In excess of $300 million up to $750 million 0.39 Over $750 million 0.31
UBS RMA Tax-Free Fund
Up to $1 billion 0.50% In excess of $1 billion up to $1.5 billion 0.44 Over $1.5 billion 0.36
UBS Retirement Money Fund
Up to $300 million 0.50% In excess of $300 million up to $750 million 0.44 Over $750 million 0.36
Non-Cash Compensation. In addition to the revenue sharing payments describe above, UBS-FS may, from time to time, receive non-cash compensation from mutual fund companies, money managers, insurance vendors, and sponsors of products UBS-FS distributes in the form of: (i) occasional gifts; (ii) occasional meals, tickets or other entertainment; (iii) sponsorship support of training events for our employees; and/or (iv) various forms of marketing support. Other Compensation. In addition, UBS-FS’s affiliates receive trading commissions and other compensation from mutual funds and insurance companies whose products it distributes.
‡ UBS Cash fund Inc., UBS RMA Money Market Portfolio, UBS RMA U.S. Government Portfolio, UBS RMA California Municipal Money Fund, UBS RMA New York Municipal Money Fund, UBS RMA New Jersey Municipal Money Fund, UBS RMA Tax-Free Fund and UBS Retirement Money Fund.
A-13
UBS-FS or certain of its affiliates may engage in a variety of transactions with or provide other services to the investment managers and mutual funds or to their affiliates or service providers presented to the Fund or already held by the Fund for which UBS-FS receives compensation. Those transactions and services may include but will not be limited to effecting transactions in securities or other instruments, as broker or as dealer for UBS-FS’s own account and research, consulting, performance evaluation, investment banking, banking or insurance services.
Code of Ethics and Participation or Interest In Client Transactions
Code of Ethics. UBS-FS maintains and enforces a written Code of Ethics (the “Code”) pursuant to Rule 204A-1 under the Investment Advisers Act of 1940. The Code, and any subsequent amendments, is provided to all employees of UBS-FS and each employee is responsible for acknowledging receipt.
The Code, which supplements UBS-FS’s WM US Code of Conduct, has a dual purpose: to set forth standards of conduct that apply to all employees of UBS-FS including UBS-FS’ s fiduciary obligation to its clients; and, to address conflicts of interest associated with the personal trading activities of a subset of employees defined as “access persons.” Employees are required to promptly report any suspected violation of the Code. Violations of the Code may result in discipline, up to and including termination. Clients or prospective clients may obtain a copy of the Code of Ethics upon request.
Trading and Execution Practices. This section is a general summary of the execution practices of UBS-FS as they relate to brokerage and advisory accounts. Investors should note that in order to comply with principal trade restrictions, orders for the ACCESS program are routed for agency execution. Where permissible by applicable law, and after complying with applicable regulatory requirements, UBS-FS may route orders for its advisory clients for execution as principal.
Execution of Transactions. UBS-FS uses automated systems to route and execute orders for the purchase and sale of securities for all advisory accounts, unless the client directs us otherwise. Generally, an order is routed to an execution center that UBS-FS believes will provide the best execution. Certain large orders that may require special handling may be routed to a market center for execution via the telephone. UBS-FS regularly monitors existing and potential execution venues and may route orders in exchange listed or OTC securities to other venues if it believes that such routing is consistent with best execution principles. In determining the best way to execute an order for a client, UBS-FS evaluates (i) speed and certainty of execution; (ii) price and size improvement; and (iii) overall execution quality.
Exchange Listed Securities, NASDAQ and OTC Securities
The vast majority of UBS-FS’s exchange listed securities and over the counter (OTC) order flow is routed for execution to its affiliate, UBS Securities LLC. Orders routed to UBS Securities LLC are executed by UBS Securities LLC as principal or as agent, depending on the circumstances and type of program involved. For orders requiring agency execution, UBS Securities LLC routes the orders to unaffiliated market makers for execution. In some instances, however, for certain securities, UBS-FS places over-the-counter orders directly with unaffiliated market makers for execution in accordance with principles of best execution.
If UBS-FS (or another investment manager managing the portfolio) executes securities transactions through other broker-dealers, it may choose brokers who provide it with research services if the commissions charged by these broker-dealers are reasonable in relation to the value of the brokerage and/or research services. UBS-FS does not try to place specific dollar value on the research or brokerage services of any broker-dealer, or to allocate the relative costs or benefits of research, because its believes that the research we receive is beneficial in fulfilling our overall responsibilities to clients. Accordingly, research received for a particular client’s brokerage commissions may not be used for that client’s account or may be useful not only for that client but for other clients’ accounts as well. Similarly, clients may benefit from the research received for the commission of other clients.
Aggregation of Trades for Advisory Clients. UBS-FS may aggregate transactions for advisory clients for execution under appropriate circumstances. This practice will not ordinarily affect or otherwise reduce fees, commissions or other costs charged to clients for these transactions but may provide price improvement. Partial fill of a block security transaction may be allocated among advisory clients’ accounts randomly, pro rata, or by some
A-14
other equitable procedure adopted by the investment manager. In certain cases, investment managers may use a computer system that allocates purchases and sales transactions either on a random or pro rata basis. In any case, clients may pay higher or lower prices for securities than may otherwise have been obtained.
Payment for Order Flow. At this time, UBS-FS has determined not to direct the order flow from our advisory programs to specific destinations in exchange for payment for that order flow (payment for order flow is defined to include any monetary payment, service, property or benefit that results from remuneration, compensation or consideration to a broker-dealer from another broker-dealer in return for routing customer orders to that broker-dealer.) UBS-FS may route orders to electronic communication networks (“ECNs”) or similar enterprises in which we may have a minority ownership interest. If we direct orders for our advisory programs’ accounts to such a trading network, we may receive indirect compensation from the ECN with respect to these trades due to our ownership interest. These arrangements will not cause you to pay additional fees directly to us. UBS-FS believes that, in the course of executing trades for our clients, we may be able to obtain best execution through other exchanges or trading networks. UBS-FS may direct order flow for these programs to trading networks in which we have an interest in the future if we determine that it is in the interest of our clients and consistent with our obligations under applicable laws.
Principal Transactions and Agency Cross Trades. UBS-FS may enter into principal transactions for some investment advisory clients after making appropriate disclosure and obtaining client consent when necessary. In accordance with the provisions of Section 11(a) of the Securities Exchange Act of 1934, as amended, UBS-FS may execute transactions on the floors of national or regional securities exchanges for managed client accounts where appropriate.
Additionally, if appropriate client consent is obtained and required disclosure is made, “agency cross” transactions may be effected for customer accounts to the extent permitted by law. “Agency cross” transactions are transactions in which UBS-FS or its affiliates act as broker for the party or parties on both sides of the transactions. In these circumstances, UBS-FS will receive compensation from parties on both sides of these transactions (the amount of which may vary) and, consequently, UBS-FS will have a potentially conflicting division of loyalties and responsibilities. Consent to “agency cross” transactions may be revoked at any time by written notice to UBS-FS.
Sweep Vehicles; Money Market Funds. UBS-FS may use affiliated money market funds for its managed client accounts as permitted by law, in “sweep” arrangements, for cash allocation, temporary investment purposes or otherwise. UBS-FS or its affiliates, including its Financial Advisors earn advisory, distribution or other fees for providing services to these funds. This compensation is in addition to the fees paid by clients for investment advice described herein. UBS-FS or an affiliated broker-dealer may also benefit from its possession and temporary investment of cash balances in client accounts prior to investment or other use.
Other Activities. UBS-FS and its affiliates provide investment banking, research, brokerage, investment advisory and other services for different types of clients, and may give advice to or take actions for those clients or for its or its affiliates’ own accounts that differs from advice given to, or the timing and nature of, actions taken for accountholders. UBS-FS and its affiliates may buy and sell securities for its own or other accounts or act as market maker or an underwriter for securities recommended, purchased or sold. UBS-FS and its affiliates, from time to time, may not be free to divulge or act upon certain information in their possession on behalf of investment advisory or other clients. UBS-FS is not obligated to effect any transaction for accounts that it believes to be improper under applicable law or rules or contrary to its own policies. In particular, you should note that some of its programs may recommend asset allocations or analyze markets and the economy in a different way than would be recommended by some of its research, trading or other departments.
UBS-FS has adopted policies and procedures that limit transactions for its proprietary accounts and the accounts of its employees. These policies and procedures are designed to prevent, among other things, improper or abusive conduct when there may be a potential conflict with the interests of a client.

A-15
Regulatory Orders
UBS-FS is required to disclose to you the following orders which have been entered against UBS-FS but which, pursuant to a no-action letter issued by the Securities and Exchange Commission, do not preclude UBS-FS from receiving the compensation under our referral arrangements with affiliated and non-affiliated third parties:
1. On February 28, 2008, FINRA accepted a Letter of Acceptance, Waiver, and Consent ("AWC") in which UBS-FS, without admitting or denying the allegations or findings consented to the finding that from January 1, 2002 through May 31, 2003, UBS-FS effected transactions in Class B share mutual funds to certain customers, where an equal investment in Class A share mutual funds would have been more advantageous to these customers. UBS-FS also consented to the finding that, from January 1, 2002 through September 30, 2003, UBS-FS effected transactions in Class C share mutual funds to certain customers, where an equal investment in Class A share mutual funds would have been more advantageous to these customers. Also included within this AWC, yet unrelated to the Class B and Class C share matter, UBS-FS consented to the finding that, from January 1, 2002 through June 30, 2004, UBS-FS did not provide certain investors the opportunity to purchase Class A shares of certain mutual funds at Net Asset Value ("NAV") where the relevant mutual funds had a NAV transfer program applicable to those particular transactions. In addition, UBS-FS consented to the finding that, from January 1, 2002 through June 30, 2004, UBS-FS did not establish, maintain and enforce supervisory systems and procedures reasonably designed to identify NAV transfer programs offered by the mutual funds that UBS-FS sold to its customers, and provide, on a consistent basis, consideration to the benefits of the various mutual fund share classes as they applied to individual customers. UBS-FS consented to a censure, fine of $1,000,000, and an undertaking to provide remediation to certain customers who either purchased Class B or Class C shares of mutual funds, or who did not receive the benefit of the NAV transfer program. UBS-FS further agreed to augment its training relative to the receipt and handling of customer inquiries concerning the NAV transfer program, or Class B/C share mutual fund purchases. UBS-FS also consented to engage a third-party to review UBS-FS's compliance with these remediation efforts.
2. On December 3, 2007, UBS-FS, without admitting or denying the allegations or findings, accepted a Consent Order from the State of Missouri alleging that from January 1999 to May 2001, UBS-FS failed to reasonably supervise two former financial advisors regarding seminars offered to the public, and certain recommendations to their customers concerning B-share mutual funds. UBS-FS was 1) censured, 2) required to pay $247,680 to the Missouri Secretary of State's Investor Restitution Fund, 3) required to disgorge commissions received from certain purchases of B-share mutual funds in the amount of $135,946 paid directly to the Missouri Secretary of State's Investor Restitution Fund, 4) required to pay a civil penalty of $75,000, 5) required to pay $230,000 to the Investor Education and Protection Fund, and 6) required to pay $8,584 for the cost of the investigation.
3. On October 24, 2007, FINRA accepted a Letter of Acceptance, Waiver, and Consent wherein UBS-FS, without admitting or denying the allegations or findings consented to the finding that, from January 1, 2002 to December 31, 2004, it did not file, or did not file on a timely basis certain amendments to Forms U4 and U5, and did not have adequate supervisory systems in place to achieve compliance with the rules requiring that it do so. UBS-FS also consented to a finding that, from January 1, 2002 to June 18, 2003, it did not file certain Forms U5 on a timely basis and with accurate termination dates. UBS-FS consented to a censure and a fine of $370,000 and an undertaking to conduct an audit of its reporting procedures.
4. On October 2, 2007, UBS-FS, without admitting or denying guilt, consented to NYSE findings that it a) violated NYSE Rule 401(a) by not ensuring delivery of prospectuses in connection with sales of certain registered securities and b) violated NYSE Rule 342 by not providing for, establishing or maintaining appropriate procedures of supervision and control. UBS-FS

A-16
consented to a censure and fine of $500,000 and an undertaking to provide enforcement, within 90 days, with a written certification that UBS-FS's current policies and procedures are reasonably designed to ensure compliance with the federal securities laws and NYSE rules applicable to the delivery of prospectuses and product descriptions.
5. On September 7, 2007, without admitting or denying the findings by FINRA that during the period January 1, 2005 - March 31, 2005 in five customer transactions, UBS Financial Services Inc. did not use reasonable diligence to ascertain the best inter-dealer market, UBS-FS signed a Letter of Acceptance, Waiver and Consent and consented to the following sanctions: a censure, a $30,000 fine and restitution to the five customers in the total amount of $11,630, plus interest.
6. On July 16, 2007, UBS-FS entered into a settlement agreement with the Attorney General of the State of New York relating to a civil complaint filed on December 12, 2006. The complaint alleged that non-discretionary fee-based brokerage accounts were unsuitable for certain clients based on the fees generated in relation to the potential commissions those clients would have been assessed in a strictly commission-based brokerage account. UBS-FS denied the allegations in the complaint and was not sanctioned. UBS-FS, however, agreed to pay $21,300,000 towards a remediation pool for approximately 3,100 current and former customers of UBS-FS that maintained fee-based brokerage accounts. UBS-FS further agreed to pay a penalty of $2,000,000 to the Attorney General of the State of New York.
7. On April 16, 2007, UBS-FS, without admitting or denying the allegations or findings, signed a Consent Order with the State of Connecticut Department of Banking relating to the market timing of mutual funds and variable insurance products. It was alleged that UBS-FS failed to keep certain books and records pertaining to sub-account transfers within variable insurance products and that UBS-FS failed to reasonably supervise agents regarding market timing. UBS-FS paid fines in total of $1,500,000, and was ordered to make the following additional payments: $1,250,000 to the State of Connecticut Department of Education in order to promote financial literacy initiatives in public schools, $1,000,000 to the State of Connecticut Department of Higher Education in order to promote financial literacy initiatives in colleges and universities, $1,500,000 to the State of Connecticut Department of Social Services in order to promote financial literacy initiatives for the benefit of lower income and elderly persons, and $250,000 to the National White Collar Crime Center for the purpose of training Connecticut Regulatory and Law Enforcement personnel.
8. On February 1, 2007, UBS-FS, without admitting or denying allegations made by the State of Virginia, accepted a Settlement Order with the State for $100,000 ($83,000 penalty/$17,000 cost of investigation) in connection with the activities of a former Financial Advisor during the period of 2000 and 2001. The allegations include failure to properly maintain certain books and records in the branch office and inadequate supervision of the Financial Advisor.
9. On November 3, 2006, the National Association of Securities Dealers’ (“NASD”) Office of Disciplinary Affairs and the National Adjudicatory Council accepted a Letter of Acceptance, Waiver, and Consent (“AWC”), wherein UBS-FS, without admitting or denying the findings, consented to the entry of the findings that it violated NASD Conduct Rules 2110 and 2320, in that, in 27 transactions it failed to use reasonable diligence to ascertain the best interdealer market and failed to buy or sell in such market so that the resultant price to its customer was as favorable as possible under prevailing market conditions. UBS-FS consented to a censure, a fine of $10,000 and restitution in the amount of $938.99, plus interest.
10. On May 26, 2006, UBS-FS, without admitting or denying any allegations or findings, entered into a Stipulation of Facts and Consent to Penalty with the New York Stock Exchange (“NYSE”) relating to discrete issues identified in various branch offices during the NYSE Member Firm Regulation’s annual sales practice examinations in 2003 and 2004. The Stipulation resulted in NYSE Hearing Board Decision 06-116, which was finalized on August 2, 2006, and which censures UBS-FS and imposes a fine of $175,000. The Decision indicates that, during 2003 and

A-17
2004 in certain branches, UBS-FS did not: 1) exercise reasonable supervision and control, including a separate system of follow-up and review, with respect to the review of certain communications, trade corrections, review of trades in customer accounts, records of customer addresses, and restrictions of accounts in which customer had reneged on trades; 2) obtain appropriate supervisory approval for certain account designation changes prior to effecting such changes; 3) freeze or restrict certain customer accounts in which customers had reneged on trades; 4) maintain adequate memoranda of certain orders that contained all of the required elements; and 5) exercise due diligence in certain accounts that used post office box addresses, and where account documents were sent to a third party.
11. On January 11, 2006, UBS-FS, without admitting or denying the findings, signed a Stipulation of Facts and Consent to Penalty with the NYE relating to the market timing of mutual funds and variable insurance products. NYSE alleged that UBS-FS failed to supervise brokers who with their clients engaged in deceptive marketing timing of mutual funds. Through the Stipulation and Consent Order, UBS-FS was fined $23.7 million which included censure and civil penalty of $5 million for failure to supervise, plus $750,000 for books and records violations and $18 million in disgorgement.
At the same time, UBS-FS entered into an Agreed Consent Order with the New Jersey Bureau of Securities covering the same matters as that NYSE Order. Pursuant to the NJBS Order, UBS-FS was fined $24.7 million which included censure and civil penalty of $12 million for failure to supervise, plus $750,000 for books and records violations, $12 million for investigation costs and investor education and other enforcement initiatives. Pursuant to both orders, UBS-FS also agreed to retain outside counsel to review procedures related to the alleged failures and violations.
12. On May 6, 2005, UBS-FS, without admitting or denying the findings, signed a Letter of Acceptance, Waiver and Consent with the NNASD relating to UBS-FS’s marketing and sale of a non-proprietary managed futures fund to certain customers. The NASD reviewed the period January 2002 to December 2003, during which time more than 4,000 UBS customers purchased the fund. The NASD found that 14 customers made investments in the fund that exceeded 10% of their net worth, which was not permitted by the prospectus. The NASD also found that UBS-FS did not maintain certain records disclosing the basis upon which suitability determinations were made when the fund was recommended to customers, did not establish and maintain a supervisory system related to maintaining these records and did not adequately describe certain of the risks of investing in managed futures on UBS-FS’s public website. To resolve this matter, UBS-FS agreed to a censure, a fine of $175,000, and agreed to offer restitution to the 14 affected customers. UBS-FS also agreed to determine whether another group of customers’ purchases of the fund exceeded the net worth limitation set forth in the fund’s prospectus and, if so, to offer them restitution.
13. On July 7, 2004, UBS-FS, without admitting or denying the findings, settled with the NASD an action relating to UBS-FS's sales literature for privately placed registered investment companies. The NASD found that, between July 2002 and May 2003, UBS-FS distributed a number of pieces of sales literature to its customers that did not comply with NASD conduct Rules 2210(d)(1)(A) and 2110. These included one sales presentation which stated that the fund was seeking a targeted rate of return without providing a substantiated basis for the target, and twenty-two fund updates which did not contain adequate risk disclosure. To resolve these charges, UBS-FS agreed to a censure, a fine of $85,000, and to submit certain sales literature relating to privately placed registered investment companies to the NASD for review within 30 days of July 7, 2004.
14. On June 28, 2004, UBS-FS, along with 7 other firms, without admitting or denying the findings, settled with the NASD an action concerning UBS-FS’s reliance on broker’s brokers to determine the fair market value of certain of its customers’ bonds. In particular, the NASD identified eleven instances during the period from August 6, 2002 through June 4, 2003 where a client requested that UBS-FS sell a bond in which UBS-FS does not make a market. UBS-FS, following industry practice, contacted a broker’s broker and obtained bids for the customers’ securities, and then bought the bonds from the customers at the bid price. Subsequent trading of the customer’s bonds
A-18
occurred at prices higher than the customers had originally received, indicating that the customers had not received fair prices for the bonds the customers sold. Along with other firms in the group settling with the NASD, UBS-FS was found to have violated MSRB Rules G-17 and G-30 by relying solely on the prices provided by the broker’s brokers to determine the fair market values of the bonds. To resolve the actions, all eight firms agreed to make restitution, pay fines in an amount roughly equal to the restitution amount, and update their written supervisory procedures relating to the determination of the fair market value of municipal securities being bought or sold from a public customer. UBS-FS paid a fine of $100,000, made restitution to the impacted customers, and updated its written supervisory procedures.
15. On February 12, 2004, UBS-FS, along with 6 other firms, without admitting or denying the findings, settled with both the SEC and the NASD actions relating to UBS-FS's failure to uniformly provide breakpoint discounts to clients during 2001 and 2002. Breakpoint discounts are volume discounts applicable to front-end sales charges on Class A mutual fund shares. The SEC and NASD each brought cases against a group of 7 firms, and the NASD separately brought actions against 8 other firms. To resolve the actions, all fifteen firms agreed to review all front-end load mutual fund trades in excess of $2,500 between January 1, 2001 and November 3, 2003, to provide written notification of the breakpoints problem to each customer who purchased Class A shares from January 1, 1999 to November 3, 2002 to advise these customers that they may be entitled to a refund; to provide refunds where appropriate; and to pay a fine equal to the amount of UBS-FS's projected overcharges. Along with other firms in the group settling with both the SEC and NASD, UBS-FS was found to have violated Section 17(a)(2) of the Securities Act of 1933 and Rule 10b-10 under the Securities Exchange Act of 1934. The NASD charged all fifteen firms with violations of its just and equitable principles of trade rule. UBS-FS will pay a fine of $4,621,768, split evenly between the SEC and NASD.
16. In August 2003, UBS-FS consented, without admitting or denying the matters set forth therein, to the entry by the SEC of an Order Instituting Proceedings, Making Findings and Imposing Remedial Actions. The Order alleges that during the period from 1994 to 1998, UBS-FS failed to reasonably supervise a former registered representative who had carried out an extended fraud that caused clients substantial losses. Pursuant to the Order, UBS-FS was censured under Section 15(b) of the Exchange Act and ordered to pay civil penalties of $500,000 to the United States Treasury.
17. On April 6, 2000, The SEC brought and settled civil administrative charges against ten brokerage firms, including UBS-FS, resolving its investigation of the pricing of Government Securities by Broker-Dealers in Municipal Bond advanced refunding transactions during the period 1990 through 1994. Consistent with the SEC orders involving the other Broker-Dealers in the settlement, The UBS-FS order contains findings that UBS-FS violated Securities Act Sections 17(a)(2) and 17(a)(3) by effecting defeasance escrow transactions with municipalities at prices deemed not reasonably related to the current wholesale market prices for the securities under the particular facts and circumstances. UBS-FS neither admitted nor denied the findings in the Order. Pursuant to the terms of the Order, UBS-FS paid $21,571,057.72 to the United States Treasury under an agreement simultaneously entered into among UBS-FS, the Internal Revenue Service and the United States Attorney for the Southern District of New York, and also must make certain payments totaling $4,608,326.23 to certain specified municipal issuers. The SEC settlements are part of a global resolution involving 17 brokerage firms and the SEC, NASD regulation, INC., the United States Attorney for the Southern District of New York and the Internal Revenue Service. The Global resolution requires UBS-FS to pay a total of more than $135 million.
18. In January 1999, UBS-FS consented, without admitting or denying the matters set forth therein, to the entry by the SEC of the Order Making Findings and Imposing Sanctions. The SEC’s order makes findings that, in certain market-making activities in connection with specified NASDAQ securities traded on the NASDAQ market on specified dates, UBS-FS engaged in or cause the coordinated entry of quotations; entered or caused to be entered fictitious quotations; engaged in or caused other manipulative conducts; failed, or caused the failure, to provide best execution in the handling of customer orders; and, together with certain other securities firms and traders, and a

A-19
former UBS-FS investment executive, engaged in manipulative conduct. The SEC order also makes findings that UBS-FS failed to keep and maintain accurate books and records and failed reasonably to supervise its NASDAQ market-making activities. Without admitting or denying the above findings, UBS-FS consented to cease and desist from committing or causing any violation of, and committing or causing any future violation of certain provisions of the Securities Exchange Act of 1934 and the rules promulgated thereunder and to pay a civil penalty in the amount of $6,300,000 and disgorgement in the amount of $381,685. UBS-FS also agreed to cooperate with an independent consultant appointed by the SEC to review UBS-FS’s policies, procedures and practices relating to the matters alleged in the order. Admin. Proc. File No. 3-9803 (Jan. 11, 1999).

[This page intentionally left blank.]
B-1
APPENDIX B
ABOUT THE PORTFOLIOS
This Appendix contains descriptions of each Portfolio, including information on the Equity Portion Portfolio Manager managing the Equity Portion of each Portfolio and the particular investment style that the Equity Portion Portfolio Manager employs. The information profile provided in connection with the Equity Portion of each Portfolio was prepared by UBS Financial Services Inc. in connection with, among other things, the ACCESS program, based on information provided by the Equity Portion Portfolio Managers, and has not been verified by UBS Financial Services Inc., the Investment Adviser or the Fund. The Fund and the Investment Adviser have relied on representations by the Equity Portion Portfolio Managers and UBS Financial Services Inc. without independent verification, and disclaim responsibility as to the accuracy of the following information to the extent consistent with applicable law.
Multi-Select Securities Puerto Rico Fund—Large Cap Value Portfolio I ..................... B-3
Multi-Select Securities Puerto Rico Fund—Large Cap Value Portfolio II ................... B-9
Multi-Select Securities Puerto Rico Fund—Large Cap Core Portfolio I ...................... B-15
Multi-Select Securities Puerto Rico Fund—Large Cap Core Portfolio II ..................... B-21
Multi-Select Securities Puerto Rico Fund—Large Cap Growth Portfolio I ................. B-27
Multi-Select Securities Puerto Rico Fund—Large Cap Growth Portfolio II ................ B-33
Multi-Select Securities Puerto Rico Fund—Mid Cap Core Portfolio I ......................... B-39
Multi-Select Securities Puerto Rico Fund—Small Cap Core Portfolio I ....................... B-45
Multi-Select Securities Puerto Rico Fund—International Portfolio I ........................... B-51
Multi-Select Securities Puerto Rico Fund—International Portfolio II .......................... B-57
Multi-Select Securities Puerto Rico Fund—U.S. Large Cap ETF Portfolio ................. B-63

B-2
[This page intentionally left blank.]

B-3
Multi-Select Securities Puerto Rico Fund—Large Cap Value Portfolio I
Investment Objective – The Portfolio’s investment objective is long-term growth of capital. No assurance can be given that the Portfolio will achieve this investment objective.
Principal Investment Strategies – Under normal conditions, the Portfolio will invest up to 80% of its total assets in common stocks and other equity securities of U.S. companies (the “Equity Portion”). According to Puerto Rico law, the Portfolio also must invest at least 20% of its total assets in equity or taxable fixed-income securities issued by Puerto Rico entities (the “Puerto Rico Securities Portion”). This requirement may limit the Portfolio’s ability to achieve its investment objective.
Puerto Rico Securities Portion – The Portfolio will invest at least 20% of its total assets in equity or taxable fixed-income securities issued by Puerto Rico entities. The Fund’s Investment Adviser will manage this portion of the Portfolio directly.
Equity Portion – With regard to the Equity Portion of the Portfolio, the Fund intends to use a variation of what has been termed a “multi-manager” approach. The Fund has indirectly engaged different investment advisers (each a “Equity Portion Portfolio Manager”) for each Portfolio’s Equity Portion by opening accounts with ACCESSSM, a wrap fee advisory program offered by UBS Financial Services Inc., an affiliate of the Fund’s Investment Adviser. The following information profile describes the Equity Portion Portfolio Manager selected to manage the Equity Portion of the Portfolio, Lord, Abbett & Co. LLC, and the Equity Portion Portfolio Manager’s investment philosophy and process.

LAR
GE
CA
P V
ALU
E PO
RTF
OLI
O I
– EQ
UIT
Y P
OR
TIO
N M
AN
AG
ER
B-4
Lor
d, A
bbet
t & C
o. L
LC
90
Hud
son
Stre
et
Jers
ey C
ity, N
J 07
302
Foun
ded:
19
29
Ass
ets U
nder
Man
agem
ent:
$9
6.8
Bill
ion
Staf
f (To
tal/P
rofe
ssio
nal):
83
8/13
1
Ow
ners
hip:
L
imite
d L
iabi
lity
Com
pany
Inve
stm
ent S
tyle
: L
arge
Cap
Val
ue
Inve
stm
ent P
roce
ss:
Bot
tom
-up/
Fund
amen
tal
Ave
rage
Num
ber o
f Equ
ity H
oldi
ngs:
55
-65
Prim
arily
Lis
ted
on:
N
YSE
Initi
al In
vest
men
t Per
iod:
1
wee
k
Ave
rage
Ann
ual T
urno
ver R
ange
(%):
40
-50
AC
CES
S In
cept
ion:
20
03
Key
Per
sonn
el
Eli M
. Sal
zman
n Pa
rtner
and
Dire
ctor
of L
arge
C
ap V
alue
Equ
ity M
anag
emen
t Jo
ined
firm
: 199
7 B
.A.,
Prin
ceto
n U
nive
rsity
M
.B.A
., N
ew Y
ork
Uni
vers
ity
Yea
rs o
f exp
erie
nce:
22
Ric
hard
C. L
arse
n, C
FA
Partn
er &
Res
earc
h A
naly
st
Join
ed fi
rm:
1984
B
.A.,
Blo
omfie
ld C
olle
ge
M.B
.A.,
Rut
gers
Uni
vers
ity
Yea
rs o
f exp
erie
nce:
37
Ken
neth
G. F
ulle
r, C
FA
Partn
er a
nd L
arge
Cap
Por
tfolio
M
anag
er,
Larg
e C
ap V
alue
Jo
ined
firm
: 200
2 B
.A.,
Tem
ple
Uni
vers
ity
M.B
.A.,
Col
umbi
a U
nive
rsity
Y
ears
of e
xper
ienc
e: 3
3
Phill
ip A
. Kau
kone
n, C
FA
Res
earc
h A
naly
st
Join
ed fi
rm:
1994
B
.A.,
UC
SD
M.B
.A.,
Uni
vers
ity o
f Mic
higa
n Y
ears
of e
xper
ienc
e: 2
2 La
wre
nce
D. S
achs
R
esea
rch
Ana
lyst
Jo
ined
firm
: 200
1 B
.A.,
Hof
stra
Uni
vers
ity
M.B
.A.,
New
Yor
k U
nive
rsity
J.D
., Fo
rdha
m U
nive
rsity
Sch
ool o
f La
w
Yea
rs o
f Exp
erie
nce:
8
U
BS
Fina
ncia
l Ser
vice
s Inc
.
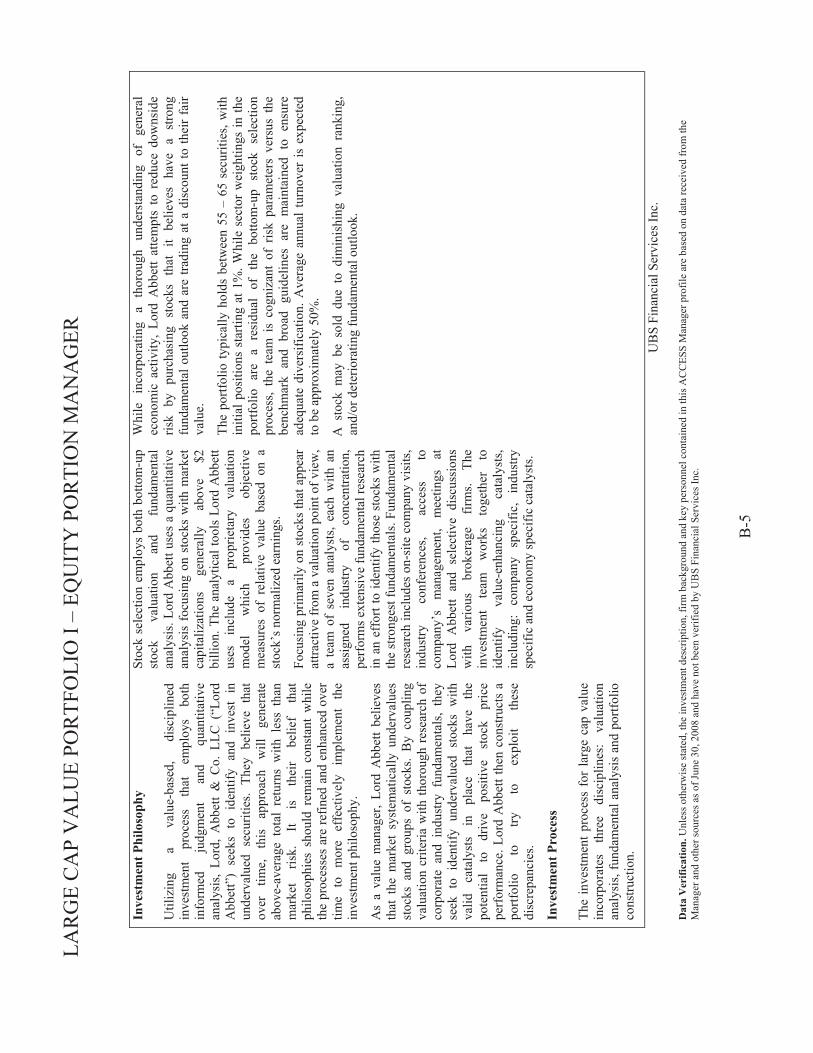
LAR
GE
CA
P V
ALU
E PO
RTF
OLI
O I
– EQ
UIT
Y P
OR
TIO
N M
AN
AG
ER
B-5
Inve
stm
ent P
hilo
soph
y
Util
izin
g a
valu
e-ba
sed,
di
scip
lined
in
vest
men
t pr
oces
s th
at
empl
oys
both
in
form
ed
judg
men
t an
d qu
antit
ativ
e an
alys
is,
Lord
, A
bbet
t &
Co.
LLC
(“L
ord
Abb
ett”
) se
eks
to i
dent
ify a
nd i
nves
t in
un
derv
alue
d se
curit
ies.
They
bel
ieve
tha
t ov
er
time,
th
is
appr
oach
w
ill
gene
rate
ab
ove-
aver
age
tota
l re
turn
s w
ith l
ess
than
m
arke
t ris
k.
It is
th
eir
belie
f th
at
philo
soph
ies
shou
ld r
emai
n co
nsta
nt w
hile
th
e pr
oces
ses
are
refin
ed a
nd e
nhan
ced
over
tim
e to
m
ore
effe
ctiv
ely
impl
emen
t th
e in
vest
men
t phi
loso
phy.
As
a va
lue
man
ager
, Lo
rd A
bbet
t be
lieve
s th
at t
he m
arke
t sy
stem
atic
ally
und
erva
lues
st
ocks
and
gro
ups
of s
tock
s. B
y co
uplin
g va
luat
ion
crite
ria w
ith th
orou
gh r
esea
rch
of
corp
orat
e an
d in
dust
ry f
unda
men
tals
, th
ey
seek
to
iden
tify
unde
rval
ued
stoc
ks w
ith
valid
ca
taly
sts
in
plac
e th
at
have
th
e po
tent
ial
to
driv
e po
sitiv
e st
ock
pric
e pe
rfor
man
ce. L
ord
Abb
ett t
hen
cons
truct
s a
portf
olio
to
try
to
ex
ploi
t th
ese
disc
repa
ncie
s.
Inve
stm
ent P
roce
ss
The
inve
stm
ent p
roce
ss f
or la
rge
cap
valu
e in
corp
orat
es
thre
e di
scip
lines
: va
luat
ion
anal
ysis
, fun
dam
enta
l ana
lysi
s an
d po
rtfol
io
cons
truct
ion.
Stoc
k se
lect
ion
empl
oys
both
bot
tom
-up
stoc
k va
luat
ion
and
fund
amen
tal
anal
ysis
. Lor
d A
bbet
t use
s a
quan
titat
ive
anal
ysis
foc
usin
g on
sto
cks
with
mar
ket
capi
taliz
atio
ns
gene
rally
ab
ove
$2
billi
on. T
he a
naly
tical
tool
s Lo
rd A
bbet
t us
es
incl
ude
a pr
oprie
tary
va
luat
ion
mod
el
whi
ch
prov
ides
ob
ject
ive
mea
sure
s of
rel
ativ
e va
lue
base
d on
a
stoc
k’s n
orm
aliz
ed e
arni
ngs.
Focu
sing
prim
arily
on
stoc
ks th
at a
ppea
r at
tract
ive
from
a v
alua
tion
poin
t of v
iew
, a
team
of
seve
n an
alys
ts,
each
with
an
assi
gned
in
dust
ry
of
conc
entra
tion,
pe
rfor
ms e
xten
sive
fund
amen
tal r
esea
rch
in a
n ef
fort
to id
entif
y th
ose
stoc
ks w
ith
the
stro
nges
t fun
dam
enta
ls. F
unda
men
tal
rese
arch
incl
udes
on-
site
com
pany
vis
its,
indu
stry
co
nfer
ence
s, ac
cess
to
co
mpa
ny’s
m
anag
emen
t, m
eetin
gs
at
Lord
Abb
ett
and
sele
ctiv
e di
scus
sion
s w
ith
vario
us
brok
erag
e fir
ms.
The
inve
stm
ent
team
w
orks
to
geth
er
to
iden
tify
valu
e-en
hanc
ing
cata
lyst
s, in
clud
ing:
co
mpa
ny
spec
ific,
in
dust
ry
spec
ific
and
econ
omy
spec
ific
cata
lyst
s.
Whi
le
inco
rpor
atin
g a
thor
ough
un
ders
tand
ing
of
gene
ral
econ
omic
act
ivity
, Lo
rd A
bbet
t at
tem
pts
to r
educ
e do
wns
ide
risk
by p
urch
asin
g st
ocks
tha
t it
belie
ves
have
a
stro
ng
fund
amen
tal o
utlo
ok a
nd a
re tr
adin
g at
a d
isco
unt t
o th
eir
fair
valu
e.
The
portf
olio
typi
cally
hol
ds b
etw
een
55 –
65
secu
ritie
s, w
ith
initi
al p
ositi
ons
star
ting
at 1
%. W
hile
sec
tor
wei
ghtin
gs in
the
portf
olio
are
a r
esid
ual
of t
he b
otto
m-u
p st
ock
sele
ctio
n pr
oces
s, th
e te
am i
s co
gniz
ant
of r
isk
para
met
ers
vers
us t
he
benc
hmar
k an
d br
oad
guid
elin
es a
re m
aint
aine
d to
ens
ure
adeq
uate
div
ersi
ficat
ion.
Ave
rage
ann
ual t
urno
ver
is e
xpec
ted
to b
e ap
prox
imat
ely
50%
.
A s
tock
may
be
sold
due
to
dim
inis
hing
val
uatio
n ra
nkin
g,
and/
or d
eter
iora
ting
fund
amen
tal o
utlo
ok.
U
BS
Fina
ncia
l Ser
vice
s Inc
.
Dat
a V
erifi
catio
n. U
nles
s oth
erw
ise
stat
ed, t
he in
vest
men
t des
crip
tion,
firm
bac
kgro
und
and
key
pers
onne
l con
tain
ed in
this
AC
CES
S M
anag
er p
rofil
e ar
e ba
sed
on d
ata
rece
ived
from
the
Man
ager
and
oth
er so
urce
s as o
f Jun
e 30
, 200
8 an
d ha
ve n
ot b
een
verif
ied
by U
BS
Fina
ncia
l Ser
vice
s Inc
.
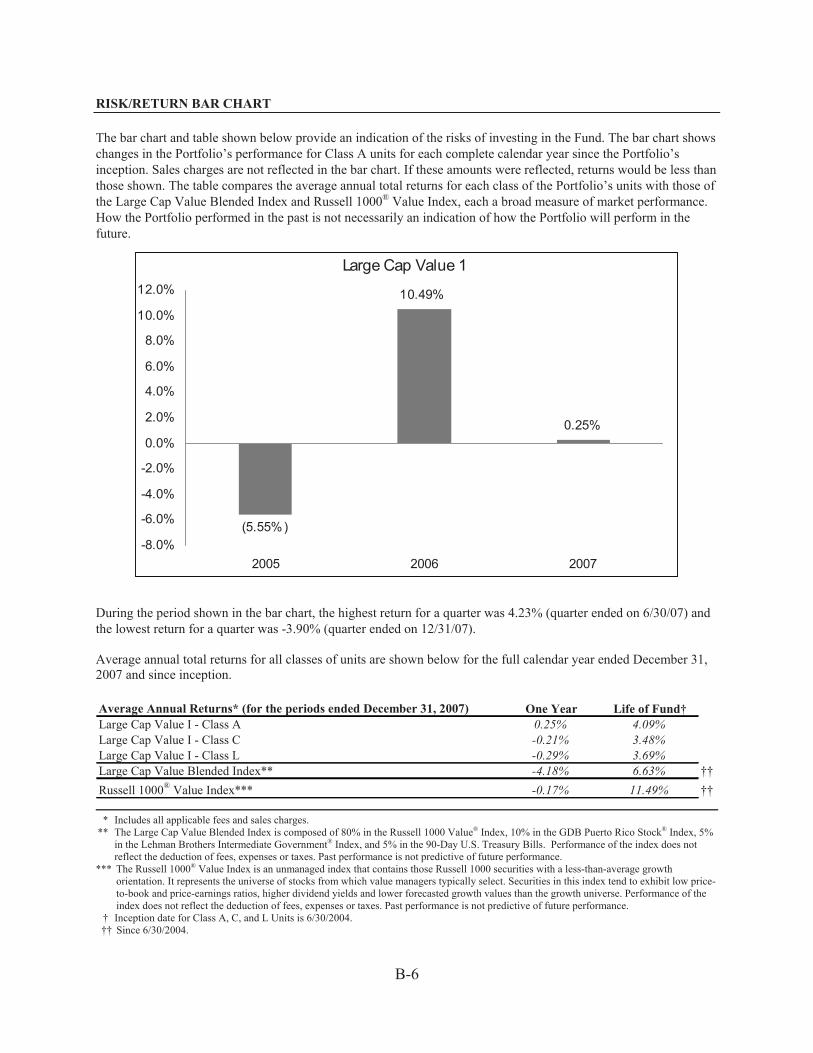
B-6
RISK/RETURN BAR CHART The bar chart and table shown below provide an indication of the risks of investing in the Fund. The bar chart shows changes in the Portfolio’s performance for Class A units for each complete calendar year since the Portfolio’s inception. Sales charges are not reflected in the bar chart. If these amounts were reflected, returns would be less than those shown. The table compares the average annual total returns for each class of the Portfolio’s units with those of the Large Cap Value Blended Index and Russell 1000® Value Index, each a broad measure of market performance. How the Portfolio performed in the past is not necessarily an indication of how the Portfolio will perform in the future.
Large Cap Value 1
(5.55%)
10.49%
0.25%
-8.0%
-6.0%
-4.0%
-2.0%
0.0%
2.0%
4.0%
6.0%
8.0%
10.0%
12.0%
2005 2006 2007
During the period shown in the bar chart, the highest return for a quarter was 4.23% (quarter ended on 6/30/07) and the lowest return for a quarter was -3.90% (quarter ended on 12/31/07). Average annual total returns for all classes of units are shown below for the full calendar year ended December 31, 2007 and since inception. Average Annual Returns* (for the periods ended December 31, 2007) One Year Life of Fund†Large Cap Value I - Class A 0.25% 4.09%Large Cap Value I - Class C -0.21% 3.48%Large Cap Value I - Class L -0.29% 3.69%Large Cap Value Blended Index** -4.18% 6.63% ††Russell 1000® Value Index*** -0.17% 11.49% ††
* Includes all applicable fees and sales charges.
** The Large Cap Value Blended Index is composed of 80% in the Russell 1000 Value® Index, 10% in the GDB Puerto Rico Stock® Index, 5% in the Lehman Brothers Intermediate Government® Index, and 5% in the 90-Day U.S. Treasury Bills. Performance of the index does not reflect the deduction of fees, expenses or taxes. Past performance is not predictive of future performance.
*** The Russell 1000® Value Index is an unmanaged index that contains those Russell 1000 securities with a less-than-average growth orientation. It represents the universe of stocks from which value managers typically select. Securities in this index tend to exhibit low price-to-book and price-earnings ratios, higher dividend yields and lower forecasted growth values than the growth universe. Performance of the index does not reflect the deduction of fees, expenses or taxes. Past performance is not predictive of future performance.
† Inception date for Class A, C, and L Units is 6/30/2004. †† Since 6/30/2004.

B-7
EXPENSES AND FEE TABLE Fees and Expenses This table describes the maximum fees and expenses that you may pay if you buy and hold Fund units.
Unitholder Transaction Expenses (fees paid directly from your investment): Class A Class C Class L Maximum Sales Charge (Load) Imposed on Purchases (as a % of offering price) ........ 5.00% 1.00% None Maximum Contingent Deferred Sales Charge (Load) (as a % of offering price) ........... None None None Maximum Sales Charge (Load) Imposed on Reinvested Dividends (as a % of offering price) ................................................................................................................. None None None Redemption Fee .............................................................................................................. 1.00%(1) 1.25%(2) 1.25%(2) Annual Portfolio Operating Expenses (expenses that are deducted from Portfolio assets)(3):
Management Fees(4) ....................................................................................................... 1.01% 1.01% 1.01% Distribution and/or Service (12b-1) Fees(5) .................................................................... 0.35% 0.93% 0.75% Administration Fees ....................................................................................................... 0.15% 0.15% 0.15% Other Expenses(6) ........................................................................................................... 0.56% 0.54% 0.54% Total Annual Portfolio Operating Expenses(7) ............................................................... 2.07% 2.64% 2.45%
Waived Fees and Reimbursed Expenses(3) ............................................................. 0.32% 0.24% 0.30%
Net Total Annual Portfolio Operating Expenses (showing the effect of applicable waiver/reimbursement agreement)(3) ..................................................... 1.75% 2.40% 2.15%
__________ (1) Class A redemption fees are applicable only to exchanges made between Portfolios within 60 days of purchase based on net asset value at the time of redemption. See “Managing Your Fund Account.”
(2) Class C and Class L unitholders will pay a redemption fee of 1.25% on redemptions made within six months of purchase, 1.00% on redemptions made after six months but within twelve months of purchase, and 0.50% on redemptions made after twelve months but within eighteen months of purchase, in each case based on the lower of the net asset value at the time of purchase and the net asset value at the time of redemption. Such redemption fee schedule will not apply to redemptions made as part of an exchange between Portfolios. In the case of redemptions made as part of such an exchange, Class C and L unitholders will pay a redemption fee of 1.00% on exchanges made within 60 days of purchase based on net asset value at the time of redemption. See “Managing Your Fund Account.”
(3) UBS Trust Company of Puerto Rico and the Fund have entered into an agreement whereby UBS Trust Company of Puerto Rico will pay the Fund’s Other Expenses, subject to future reimbursement by the Fund, in order to ensure that Total Annual Portfolio Operating Expenses do not exceed the amounts set forth in this Prospectus. The Fund will reimburse UBS Trust Company of Puerto Rico for Other Expenses paid by UBS Trust Company of Puerto Rico when Total Annual Operating Expenses fall below current Net Total Annual Operating Expenses, provided that such reimbursement does not cause the Fund’s total annual operating expenses to exceed the current Net Total Annual Operating Expenses and the reimbursement is made within three years after UBS Trust Company of Puerto Rico paid the expense. This Expense Limitation and Reimbursement Agreement is effective through June 30, 2009, and may be voluntarily continued at the discretion of the Investment Adviser, the Administrator or their affiliates. (4) The Investment Adviser receives a maximum annual investment advisory fee of 1.00% of the average weekly net assets of the Portfolio, payable monthly. The Investment Adviser will be separately invoiced and will pay the ACCESS fees as applicable, currently estimated to be: (i) initially, upon the opening of each ACCESS account, an annual fee of 0.50% of the net assets of any Equity Portion that is invested in such ACCESS account, pro-rated to cover the period from the date such account is opened through the end of the next full calendar quarter, and (ii) thereafter an annual fee of 0.50% of the net assets of any Equity Portion that is invested in such ACCESSSM account as of the last business day of each quarter, to be paid by the following business day, as well as a pro rata fee for additional assets invested in such ACCESSSM accounts based upon the number of days remaining in the period. For the fiscal year ended March 31, 2008, the Investment Adviser paid approximately $54,261.59 in ACCESS fees on behalf of the Portfolio.
(5) Distribution fees are used to compensate the Fund’s distributor, UBS Financial Services Incorporated of Puerto Rico (the “Distributor”), and selected dealers whose activities support the distribution of Fund units, including payments to sales personnel and printing prospectuses and reports and the preparation, printing and distribution of sales literature and advertising material. Service fees are used to compensate the Underwriter and selected dealers for account maintenance and other unitholder services.
(6) “Other Expenses” include fees for certain unitholder services, custodial and transfer agency fees, legal, regulatory and accounting fees, printing costs and registration fees. The Fund initially pays for any advertising and other marketing expenses, subject to the Distributor’s obligation to reimburse the Fund within ten (10) days of the first business day of the month after which such expenses were incurred.
(7) In addition, the Fund will incur additional indirect expenses, which are not expected to be significant, because the Fund’s available cash balances are automatically invested in money market mutual funds, including, as permitted by law, those affiliated with the Fund, the Investment Adviser and UBS Financial Services Inc. Such affiliated money market funds either have no sales load, distribution fees or service
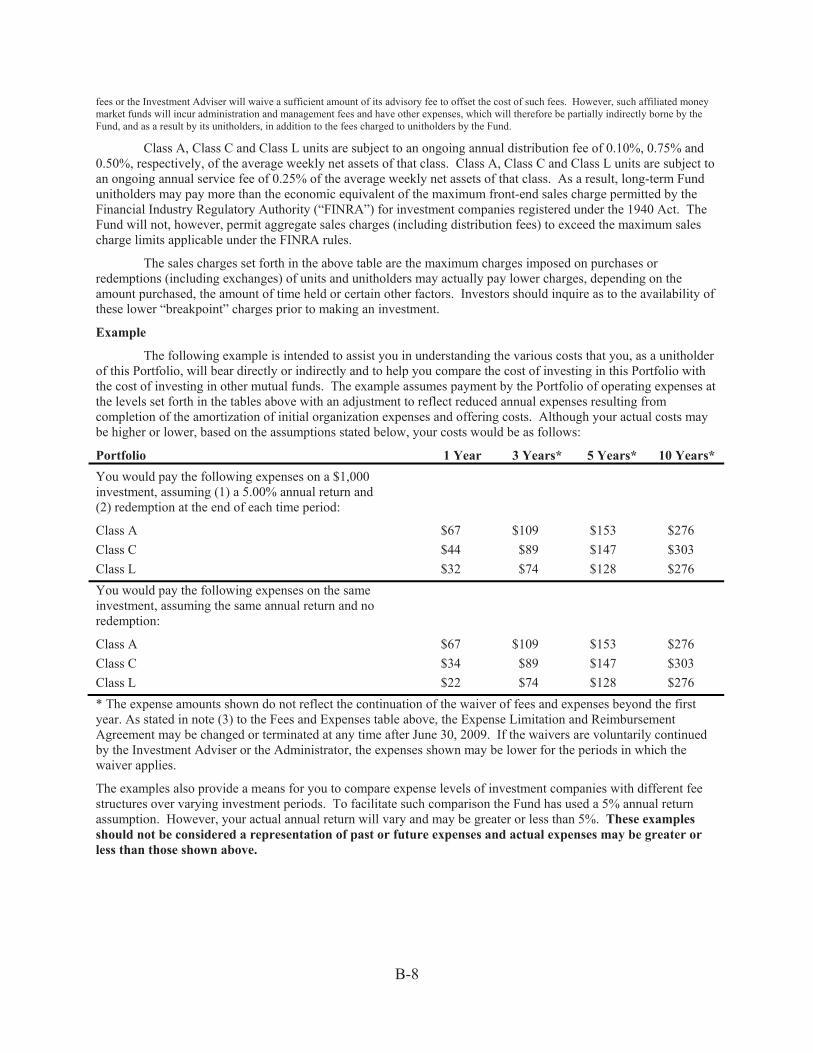
B-8
fees or the Investment Adviser will waive a sufficient amount of its advisory fee to offset the cost of such fees. However, such affiliated money market funds will incur administration and management fees and have other expenses, which will therefore be partially indirectly borne by the Fund, and as a result by its unitholders, in addition to the fees charged to unitholders by the Fund.
Class A, Class C and Class L units are subject to an ongoing annual distribution fee of 0.10%, 0.75% and 0.50%, respectively, of the average weekly net assets of that class. Class A, Class C and Class L units are subject to an ongoing annual service fee of 0.25% of the average weekly net assets of that class. As a result, long-term Fund unitholders may pay more than the economic equivalent of the maximum front-end sales charge permitted by the Financial Industry Regulatory Authority (“FINRA”) for investment companies registered under the 1940 Act. The Fund will not, however, permit aggregate sales charges (including distribution fees) to exceed the maximum sales charge limits applicable under the FINRA rules.
The sales charges set forth in the above table are the maximum charges imposed on purchases or redemptions (including exchanges) of units and unitholders may actually pay lower charges, depending on the amount purchased, the amount of time held or certain other factors. Investors should inquire as to the availability of these lower “breakpoint” charges prior to making an investment.
Example
The following example is intended to assist you in understanding the various costs that you, as a unitholder of this Portfolio, will bear directly or indirectly and to help you compare the cost of investing in this Portfolio with the cost of investing in other mutual funds. The example assumes payment by the Portfolio of operating expenses at the levels set forth in the tables above with an adjustment to reflect reduced annual expenses resulting from completion of the amortization of initial organization expenses and offering costs. Although your actual costs may be higher or lower, based on the assumptions stated below, your costs would be as follows:
Portfolio 1 Year 3 Years* 5 Years* 10 Years* You would pay the following expenses on a $1,000 investment, assuming (1) a 5.00% annual return and (2) redemption at the end of each time period:
Class A $67 $109 $153 $276 Class C $44 $89 $147 $303 Class L $32 $74 $128 $276 You would pay the following expenses on the same investment, assuming the same annual return and no redemption:
Class A $67 $109 $153 $276 Class C $34 $89 $147 $303 Class L $22 $74 $128 $276 * The expense amounts shown do not reflect the continuation of the waiver of fees and expenses beyond the first year. As stated in note (3) to the Fees and Expenses table above, the Expense Limitation and Reimbursement Agreement may be changed or terminated at any time after June 30, 2009. If the waivers are voluntarily continued by the Investment Adviser or the Administrator, the expenses shown may be lower for the periods in which the waiver applies.
The examples also provide a means for you to compare expense levels of investment companies with different fee structures over varying investment periods. To facilitate such comparison the Fund has used a 5% annual return assumption. However, your actual annual return will vary and may be greater or less than 5%. These examples should not be considered a representation of past or future expenses and actual expenses may be greater or less than those shown above.

B-9
Multi-Select Securities Puerto Rico Fund—Large Cap Value Portfolio II
Investment Objective – The Portfolio’s investment objective is long-term growth of capital. No assurance can be given that the Portfolio will achieve this investment objective.
Principal Investment Strategies – Under normal conditions, the Portfolio will invest up to 80% of its total assets in common stocks and other equity securities of U.S. companies (the “Equity Portion”). According to Puerto Rico law, the Portfolio also must invest at least 20% of its total assets in equity or taxable fixed-income securities issued by Puerto Rico entities (the “Puerto Rico Securities Portion”). This requirement may limit the Portfolio’s ability to achieve its investment objective.
Puerto Rico Securities Portion – The Portfolio will invest at least 20% of its total assets in equity or taxable fixed-income securities issued by Puerto Rico entities. The Fund’s Investment Adviser will manage this portion of the Portfolio directly.
Equity Portion – With regard to the Equity Portion of the Portfolio, the Fund intends to use a variation of what has been termed a “multi-manager” approach. The Fund has indirectly engaged different investment advisers (each a “Equity Portion Portfolio Manager”) for each Portfolio’s Equity Portion by opening accounts with ACCESSSM, a wrap fee advisory program offered by UBS Financial Services Inc., an affiliate of the Fund’s Investment Adviser. The following information profile describes the Equity Portion Portfolio Manager selected to manage the Equity Portion of the Portfolio, Invesco AIM Private Asset Management, and the Equity Portion Portfolio Manager’s investment philosophy and process.

LAR
GE
CA
P V
ALU
E PO
RTF
OLI
O II
– E
QU
ITY
PO
RTI
ON
MA
NA
GER
B-1
0
Inve
sco
AIM
Pri
vate
Ass
et M
anag
emen
t 11
Gre
enw
ay P
laza
, Sui
te 1
00
Hou
ston
, TX
770
46
Foun
ded:
19
76
Ass
ets U
nder
Man
agem
ent:
$4
61 B
illio
n
Min
imum
New
Acc
ount
Siz
e O
utsi
de A
CC
ESS:
$1
Mill
ion
Staf
f (To
tal/P
rofe
ssio
nal):
16
00/1
24
Ow
ners
hip:
In
vesc
o, L
td.
Inve
stm
ent S
tyle
: L
arge
Cap
Val
ue
Inve
stm
ent P
roce
ss:
Bot
tom
-up
Ave
rage
Num
ber o
f Equ
ity H
oldi
ngs:
40
-60
Prim
arily
Lis
ted
on:
NY
SE
Initi
al In
vest
men
t Per
iod:
1-
3 da
ys
Ave
rage
Ann
ual T
urno
ver R
ange
(%):
20
-40
AC
CES
S In
cept
ion:
20
00
Key
Per
sonn
el
Bre
t W. S
tanl
ey, C
FA
Seni
or P
ortfo
lio M
anag
er
Join
ed fi
rm:
1998
B
.B.A
., U
nive
rsity
of T
exas
(A
ustin
) M
.S.,
Uni
vers
ity o
f Hou
ston
Y
ears
of e
xper
ienc
e: 2
0
Mat
thew
W. S
eins
heim
er, C
FA
Seni
or P
ortfo
lio M
anag
er
Join
ed fi
rm:
1998
B
.B.A
., So
uthe
rn M
etho
dist
U
nive
rsity
M
.B.A
., U
nive
rsity
of T
exas
(A
ustin
) Y
ears
of e
xper
ienc
e: 1
6
Mic
hael
Sim
on, C
FA
Seni
or P
ortfo
lio M
anag
er
Join
ed fi
rm:
2001
B
.B.A
., Te
xas C
hris
tian
Uni
vers
ity
M.B
.A.,
Uni
vers
ity o
f Chi
cago
Y
ears
of e
xper
ienc
e: 1
9
R. C
anno
n C
olem
an II
, CFA
Po
rtfol
io M
anag
er
Join
ed fi
rm:
2000
B
.S.,M
.S.,
Uni
vers
ity o
f Flo
rida
M.B
.A.,
Wha
rton
Scho
ol a
t the
U
nive
rsity
of P
enns
ylva
nia
Yea
rs o
f exp
erie
nce:
9
Lynn
Ber
nard
Se
nior
Clie
nt P
ortfo
lio M
anag
er
Join
ed fi
rm:
2000
B
.A.,
Van
derb
ilt U
nive
rsity
M
.B.A
., U
nive
rsity
of T
exas
at
Aus
tin
Yea
rs o
f exp
erie
nce:
30
UB
S Fi
nanc
ial S
ervi
ces I
nc.
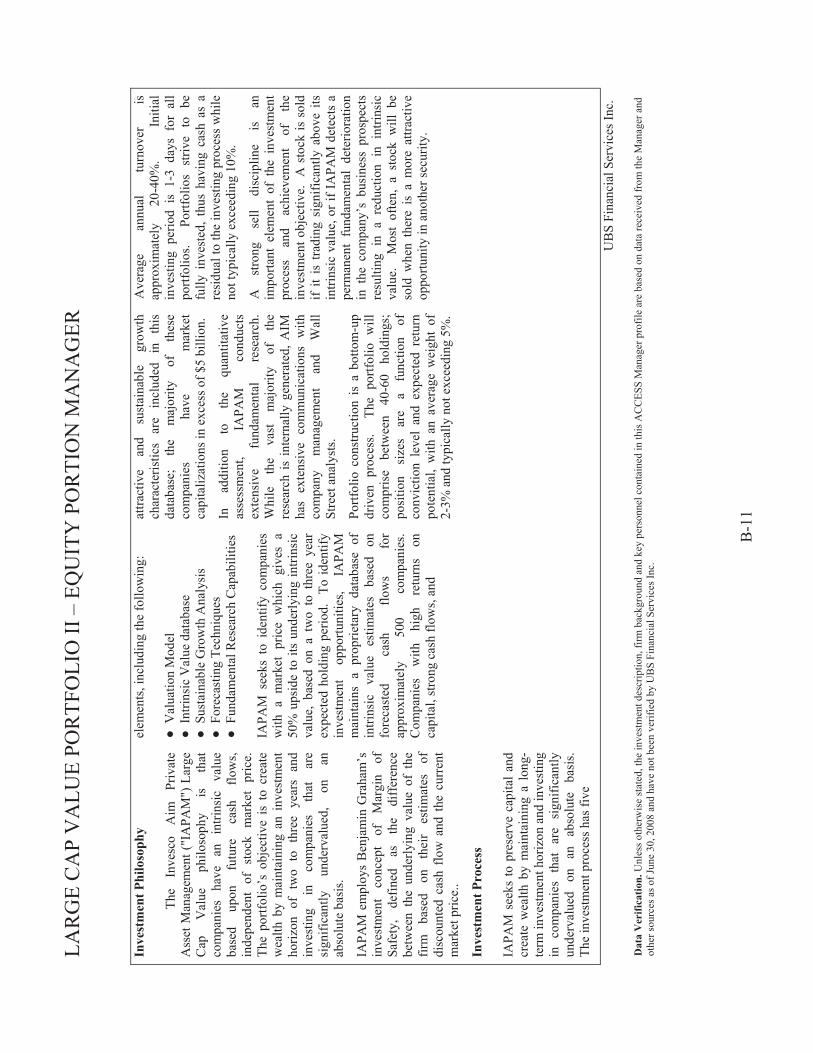
LAR
GE
CA
P V
ALU
E PO
RTF
OLI
O II
– E
QU
ITY
PO
RTI
ON
MA
NA
GER
B-1
1
Inve
stm
ent P
hilo
soph
y
The
Inve
sco
Aim
Pr
ivat
e A
sset
Man
agem
ent (
"IA
PAM
") L
arge
C
ap
Val
ue
philo
soph
y is
th
at
com
pani
es
have
an
in
trins
ic
valu
e ba
sed
upon
fu
ture
ca
sh
flow
s, in
depe
nden
t of
sto
ck m
arke
t pr
ice.
Th
e po
rtfol
io’s
obj
ectiv
e is
to
crea
te
wea
lth b
y m
aint
aini
ng a
n in
vest
men
t ho
rizon
of
two
to t
hree
yea
rs a
nd
inve
stin
g in
co
mpa
nies
th
at
are
sign
ifica
ntly
un
derv
alue
d,
on
an
abso
lute
bas
is.
IAPA
M e
mpl
oys
Ben
jam
in G
raha
m’s
in
vest
men
t co
ncep
t of
M
argi
n of
Sa
fety
, de
fined
as
th
e di
ffer
ence
be
twee
n th
e un
derly
ing
valu
e of
the
fir
m
base
d on
th
eir
estim
ates
of
di
scou
nted
cas
h flo
w a
nd t
he c
urre
nt
mar
ket p
rice.
.
Inve
stm
ent P
roce
ss
IAPA
M s
eeks
to p
rese
rve
capi
tal a
nd
crea
te w
ealth
by
mai
ntai
ning
a l
ong-
term
inve
stm
ent h
oriz
on a
nd in
vest
ing
in c
ompa
nies
tha
t ar
e si
gnifi
cant
ly
unde
rval
ued
on
an
abso
lute
ba
sis.
Th
e in
vest
men
t pro
cess
has
five
elem
ents
, inc
ludi
ng th
e fo
llow
ing:
●
Val
uatio
n M
odel
●
Intri
nsic
Val
ue d
atab
ase
● S
usta
inab
le G
row
th A
naly
sis
● F
orec
astin
g Te
chni
ques
●
Fun
dam
enta
l Res
earc
h C
apab
ilitie
s
IAPA
M s
eeks
to
iden
tify
com
pani
es
with
a m
arke
t pr
ice
whi
ch g
ives
a
50%
ups
ide
to it
s un
derly
ing
intri
nsic
va
lue,
bas
ed o
n a
two
to t
hree
yea
r ex
pect
ed h
oldi
ng p
erio
d.
To id
entif
y in
vest
men
t op
portu
nitie
s, IA
PAM
m
aint
ains
a p
ropr
ieta
ry d
atab
ase
of
intri
nsic
va
lue
estim
ates
ba
sed
on
fore
cast
ed
cash
flo
ws
for
appr
oxim
atel
y 50
0 co
mpa
nies
. C
ompa
nies
w
ith
high
re
turn
s on
ca
pita
l, st
rong
cas
h flo
ws,
and
attra
ctiv
e an
d su
stai
nabl
e gr
owth
ch
arac
teris
tics
are
incl
uded
in
th
is
data
base
; th
e m
ajor
ity
of
thes
e co
mpa
nies
ha
ve
mar
ket
capi
taliz
atio
ns in
exc
ess o
f $5
billi
on.
In
addi
tion
to
the
quan
titat
ive
asse
ssm
ent,
IAPA
M
cond
ucts
ex
tens
ive
fund
amen
tal
rese
arch
. W
hile
th
e va
st
maj
ority
of
th
e re
sear
ch is
inte
rnal
ly g
ener
ated
, AIM
ha
s ex
tens
ive
com
mun
icat
ions
with
co
mpa
ny
man
agem
ent
and
Wal
l St
reet
ana
lyst
s.
Portf
olio
con
stru
ctio
n is
a b
otto
m-u
p dr
iven
pro
cess
. T
he p
ortfo
lio w
ill
com
pris
e be
twee
n 40
-60
hold
ings
; po
sitio
n si
zes
are
a fu
nctio
n of
co
nvic
tion
leve
l an
d ex
pect
ed r
etur
n po
tent
ial,
with
an
aver
age
wei
ght
of
2-3%
and
typi
cally
not
exc
eedi
ng 5
%.
Ave
rage
an
nual
tu
rnov
er
is
appr
oxim
atel
y 20
-40%
.
Initi
al
inve
stin
g pe
riod
is 1
-3 d
ays
for
all
portf
olio
s.
Portf
olio
s st
rive
to
be
fully
inv
este
d, t
hus
havi
ng c
ash
as a
re
sidu
al to
the
inve
stin
g pr
oces
s w
hile
no
t typ
ical
ly e
xcee
ding
10%
.
A
stro
ng
sell
disc
iplin
e is
an
im
porta
nt e
lem
ent
of t
he i
nves
tmen
t pr
oces
s an
d ac
hiev
emen
t of
th
e in
vest
men
t obj
ectiv
e. A
sto
ck is
sol
d if
it is
tra
ding
sig
nific
antly
abo
ve i
ts
intri
nsic
val
ue, o
r if I
APA
M d
etec
ts a
pe
rman
ent
fund
amen
tal
dete
riora
tion
in t
he c
ompa
ny’s
bus
ines
s pr
ospe
cts
resu
lting
in
a re
duct
ion
in i
ntrin
sic
valu
e.
Mos
t of
ten,
a s
tock
will
be
sold
whe
n th
ere
is a
mor
e at
tract
ive
oppo
rtuni
ty in
ano
ther
secu
rity.
U
BS
Fina
ncia
l Ser
vice
s Inc
.
Dat
a V
erifi
catio
n. U
nles
s oth
erw
ise
stat
ed, t
he in
vest
men
t des
crip
tion,
firm
bac
kgro
und
and
key
pers
onne
l con
tain
ed in
this
AC
CES
S M
anag
er p
rofil
e ar
e ba
sed
on d
ata
rece
ived
from
the
Man
ager
and
ot
her s
ourc
es a
s of J
une
30, 2
008
and
have
not
bee
n ve
rifie
d by
UB
S Fi
nanc
ial S
ervi
ces I
nc.
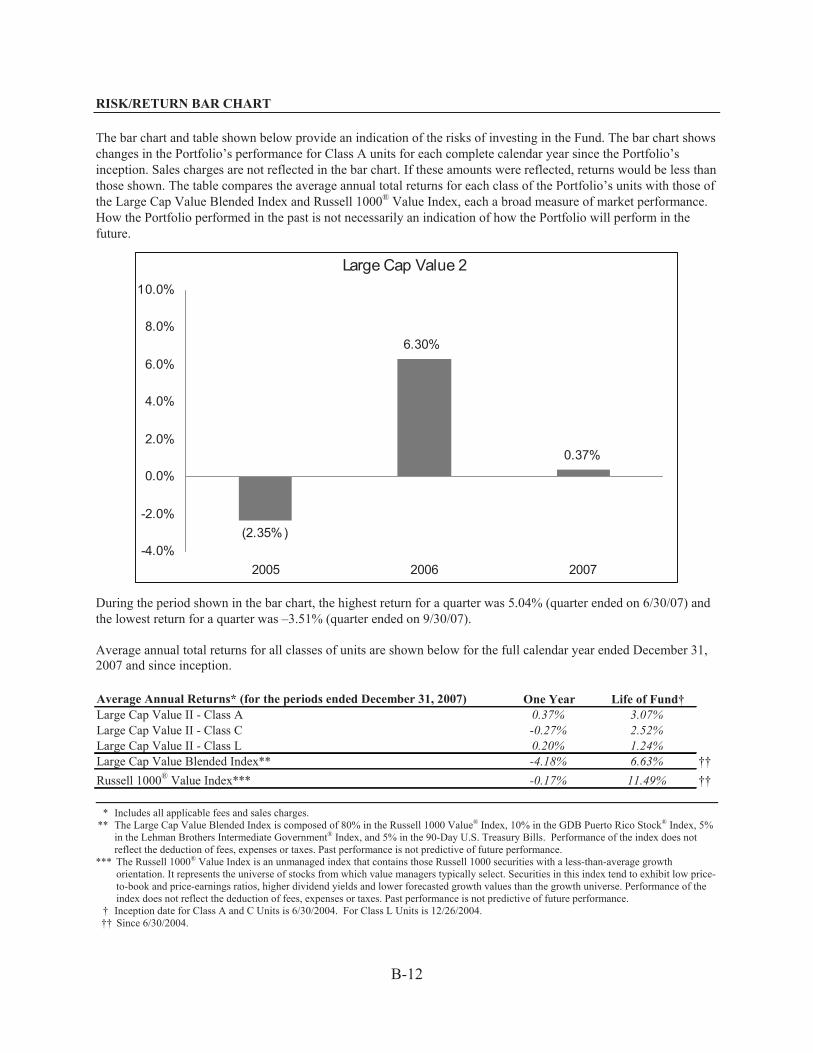
B-12
RISK/RETURN BAR CHART The bar chart and table shown below provide an indication of the risks of investing in the Fund. The bar chart shows changes in the Portfolio’s performance for Class A units for each complete calendar year since the Portfolio’s inception. Sales charges are not reflected in the bar chart. If these amounts were reflected, returns would be less than those shown. The table compares the average annual total returns for each class of the Portfolio’s units with those of the Large Cap Value Blended Index and Russell 1000® Value Index, each a broad measure of market performance. How the Portfolio performed in the past is not necessarily an indication of how the Portfolio will perform in the future.
Large Cap Value 2
(2.35%)
6.30%
0.37%
-4.0%
-2.0%
0.0%
2.0%
4.0%
6.0%
8.0%
10.0%
2005 2006 2007
During the period shown in the bar chart, the highest return for a quarter was 5.04% (quarter ended on 6/30/07) and the lowest return for a quarter was –3.51% (quarter ended on 9/30/07). Average annual total returns for all classes of units are shown below for the full calendar year ended December 31, 2007 and since inception. Average Annual Returns* (for the periods ended December 31, 2007) One Year Life of Fund†Large Cap Value II - Class A 0.37% 3.07%Large Cap Value II - Class C -0.27% 2.52%Large Cap Value II - Class L 0.20% 1.24%Large Cap Value Blended Index** -4.18% 6.63% ††Russell 1000® Value Index*** -0.17% 11.49% ††
* Includes all applicable fees and sales charges.
** The Large Cap Value Blended Index is composed of 80% in the Russell 1000 Value® Index, 10% in the GDB Puerto Rico Stock® Index, 5% in the Lehman Brothers Intermediate Government® Index, and 5% in the 90-Day U.S. Treasury Bills. Performance of the index does not reflect the deduction of fees, expenses or taxes. Past performance is not predictive of future performance.
*** The Russell 1000® Value Index is an unmanaged index that contains those Russell 1000 securities with a less-than-average growth orientation. It represents the universe of stocks from which value managers typically select. Securities in this index tend to exhibit low price-to-book and price-earnings ratios, higher dividend yields and lower forecasted growth values than the growth universe. Performance of the index does not reflect the deduction of fees, expenses or taxes. Past performance is not predictive of future performance.
† Inception date for Class A and C Units is 6/30/2004. For Class L Units is 12/26/2004. †† Since 6/30/2004.

B-13
EXPENSES AND FEE TABLE Fees and Expenses This table describes the maximum fees and expenses that you may pay if you buy and hold Fund units.
Unitholder Transaction Expenses (fees paid directly from your investment): Class A Class C Class L Maximum Sales Charge (Load) Imposed on Purchases (as a % of offering price) ........ 5.00% 1.00% None Maximum Contingent Deferred Sales Charge (Load) (as a % of offering price) ........... None None None Maximum Sales Charge (Load) Imposed on Reinvested Dividends (as a % of offering price) ................................................................................................................. None None None Redemption Fee .............................................................................................................. 1.00%(1) 1.25%(2) 1.25%(2) Annual Portfolio Operating Expenses (expenses that are deducted from Portfolio assets)(3):
Management Fees(4) ....................................................................................................... 1.01% 1.01% 1.01% Distribution and/or Service (12b-1) Fees(5) .................................................................... 0.35% 0.97% 0.76% Administration Fees ....................................................................................................... 0.15% 0.15% 0.15% Other Expenses(6) ........................................................................................................... 0.59% 0.58% 0.64% Total Annual Portfolio Operating Expenses(7) ............................................................... 2.10% 2.71% 2.56%
Waived Fees and Reimbursed Expenses(3) ............................................................. 0.35% 0.31% 0.41%
Net Total Annual Portfolio Operation Expenses (showing the applicable waiver/reimbursement agreement)(3) ...................................................................... 1.75% 2.40% 2.15%
__________ (1) Class A redemption fees are applicable only to exchanges made between Portfolios within 60 days of purchase based on net asset value at the time of redemption. See “Managing Your Fund Account.”
(2) Class C and Class L unitholders will pay a redemption fee of 1.25% on redemptions made within six months of purchase, 1.00% on redemptions made after six months but within twelve months of purchase, and 0.50% on redemptions made after twelve months but within eighteen months of purchase, in each case based on the lower of the net asset value at the time of purchase and the net asset value at the time of redemption. Such redemption fee schedule will not apply to redemptions made as part of an exchange between Portfolios. In the case of redemptions made as part of such an exchange, Class C and L unitholders will pay a redemption fee of 1.00% on exchanges made within 60 days of purchase based on net asset value at the time of redemption. See “Managing Your Fund Account.”
(3) UBS Trust Company of Puerto Rico and the Fund have entered into an agreement whereby UBS Trust Company of Puerto Rico will pay the Fund’s Other Expenses, subject to future reimbursement by the Fund, in order to ensure that Total Annual Portfolio Operating Expenses do not exceed the amounts set forth in this Prospectus. The Fund will reimburse UBS Trust Company of Puerto Rico for Other Expenses paid by UBS Trust Company of Puerto Rico when Total Annual Operating Expenses fall below current Net Total Annual Operating Expenses, provided that such reimbursement does not cause the Fund’s total annual operating expenses to exceed the current Net Total Annual Operating Expenses and the reimbursement is made within three years after UBS Trust Company of Puerto Rico paid the expense. This Expense Limitation and Reimbursement Agreement is effective through June 30, 2009, and may be voluntarily continued at the discretion of the Investment Adviser, the Administrator or their affiliates. (4) The Investment Adviser receives a maximum annual investment advisory fee of 1.00% of the average weekly net assets of the Portfolio, payable monthly. The Investment Adviser will be separately invoiced and will pay the ACCESS fees as applicable, currently estimated to be: (i) initially, upon the opening of each ACCESS account, an annual fee of 0.50% of the net assets of any Equity Portion that is invested in such ACCESS account, pro-rated to cover the period from the date such account is opened through the end of the next full calendar quarter, and (ii) thereafter an annual fee of 0.50% of the net assets of any Equity Portion that is invested in such ACCESSSM account as of the last business day of each quarter, to be paid by the following business day, as well as a pro rata fee for additional assets invested in such ACCESSSM accounts based upon the number of days remaining in the period. For the fiscal year ended March 31, 2008, the Investment Adviser paid approximately $35,059.02 in ACCESS fees on behalf of the applicable Portfolio.
(5) Distribution fees are used to compensate the Fund’s distributor, UBS Financial Services Incorporated of Puerto Rico (the “Distributor”), and selected dealers whose activities support the distribution of Fund units, including payments to sales personnel and printing prospectuses and reports and the preparation, printing and distribution of sales literature and advertising material. Service fees are used to compensate the Underwriter and selected dealers for account maintenance and other unitholder services.
(6) “Other Expenses” includes fees for certain unitholder services, custodial and transfer agency fees, legal, regulatory and accounting fees, printing costs and registration fees. The Fund initially pays for any advertising and other marketing expenses, subject to the Distributor’s obligation to reimburse the Fund within ten (10) days of the first business day of the month after which such expenses were incurred.
(7) In addition, the Fund will incur additional indirect expenses, which are not expected to be significant, because the Fund’s available cash balances are automatically invested in money market mutual funds, including, as permitted by law, those affiliated with the Fund, the Investment Adviser and UBS Financial Services Inc. Such affiliated money market funds either have no sales load, distribution fees or service

B-14
fees or the Investment Adviser will waive a sufficient amount of its advisory fee to offset the cost of such fees. However, such affiliated money market funds will incur administration and management fees and have other expenses, which will therefore be partially indirectly borne by the Fund, and as a result by its unitholders, in addition to the fees charged to unitholders by the Fund.
Class A, Class C and Class L units are subject to an ongoing annual distribution fee of 0.10%, 0.75% and 0.50%, respectively, of the average weekly net assets of that class. Class A, Class C and Class L units are subject to an ongoing annual service fee of 0.25% of the average weekly net assets of that class. As a result, long-term Fund unitholders may pay more than the economic equivalent of the maximum front-end sales charge permitted by the Financial Industry Regulatory Authority (“FINRA”) for investment companies registered under the 1940 Act. The Fund will not, however, permit aggregate sales charges (including distribution fees) to exceed the maximum sales charge limits applicable under the FINRA rules.
The sales charges set forth in the above table are the maximum charges imposed on purchases or redemptions (including exchanges) of units and unitholders may actually pay lower charges, depending on the amount purchased, the amount of time held or certain other factors. Investors should inquire as to the availability of these lower “breakpoint” charges prior to making an investment.
Example
The following example is intended to assist you in understanding the various costs that you, as a unitholder of this Portfolio, will bear directly or indirectly and to help you compare the cost of investing in this Portfolio with the cost of investing in other mutual funds. The example assumes payment by the Portfolio of operating expenses at the levels set forth in the tables above with an adjustment to reflect reduced annual expenses resulting from completion of the amortization of initial organization expenses and offering costs. Although your actual costs may be higher or lower, based on the assumptions stated below, your costs would be as follows:
Portfolio 1 Year 3 Years* 5 Years* 10 Years* You would pay the following expenses on a $1,000 investment, assuming (1) a 5.00% annual return and (2) redemption at the end of each time period:
Class A $67 $109 $154 $278 Class C $44 $90 $149 $309 Class L $32 $76 $132 $286
You would pay the following expenses on the same investment, assuming the same annual return and no redemption:
Class A $67 $109 $154 $278 Class C $34 $90 $149 $309 Class L $22 $76 $132 $286
* The expense amounts shown do not reflect the continuation of the waiver of fees and expenses beyond the first year. As stated in note (3) to the Fees and Expenses table above, the Expense Limitation and Reimbursement Agreement may be changed or terminated at any time after June 30, 2009. If the waivers are voluntarily continued by the Investment Adviser or the Administrator, the expenses shown may be lower for the periods in which the waiver applies.
The examples also provide a means for you to compare expense levels of investment companies with different fee structures over varying investment periods. To facilitate such comparison the Fund has used a 5% annual return assumption. However, your actual annual return will vary and may be greater or less than 5%. These examples should not be considered a representation of past or future expenses and actual expenses may be greater or less than those shown above.

B-15
Multi-Select Securities Puerto Rico Fund—Large Cap Core Portfolio I
Investment Objective – The Portfolio’s investment objective is long-term growth of capital. No assurance can be given that the Portfolio will achieve this investment objective.
Principal Investment Strategies – Under normal conditions, the Portfolio will invest up to 80% of its total assets in common stocks and other equity securities of U.S. companies (the “Equity Portion”). According to Puerto Rico law, the Portfolio also must invest at least 20% of its total assets in equity or taxable fixed-income securities issued by Puerto Rico entities (the “Puerto Rico Securities Portion”). This requirement may limit the Portfolio’s ability to achieve its investment objective.
Puerto Rico Securities Portion – The Portfolio will invest at least 20% of its total assets in equity or taxable fixed-income securities issued by Puerto Rico entities. The Fund’s Investment Adviser will manage this portion of the Portfolio directly.
Equity Portion – With regard to the Equity Portion of the Portfolio, the Fund intends to use a variation of what has been termed a “multi-manager” approach. The Fund has indirectly engaged different investment advisers (each a “Equity Portion Portfolio Manager”) for each Portfolio’s Equity Portion by opening accounts with ACCESSSM, a wrap fee advisory program offered by UBS Financial Services Inc., an affiliate of the Fund’s Investment Adviser. The following information profile describes the Equity Portion Portfolio Manager selected to manage the Equity Portion of the Portfolio, AllianceBernstein Strategic Research, and the Equity Portion Portfolio Manager’s investment philosophy and process.
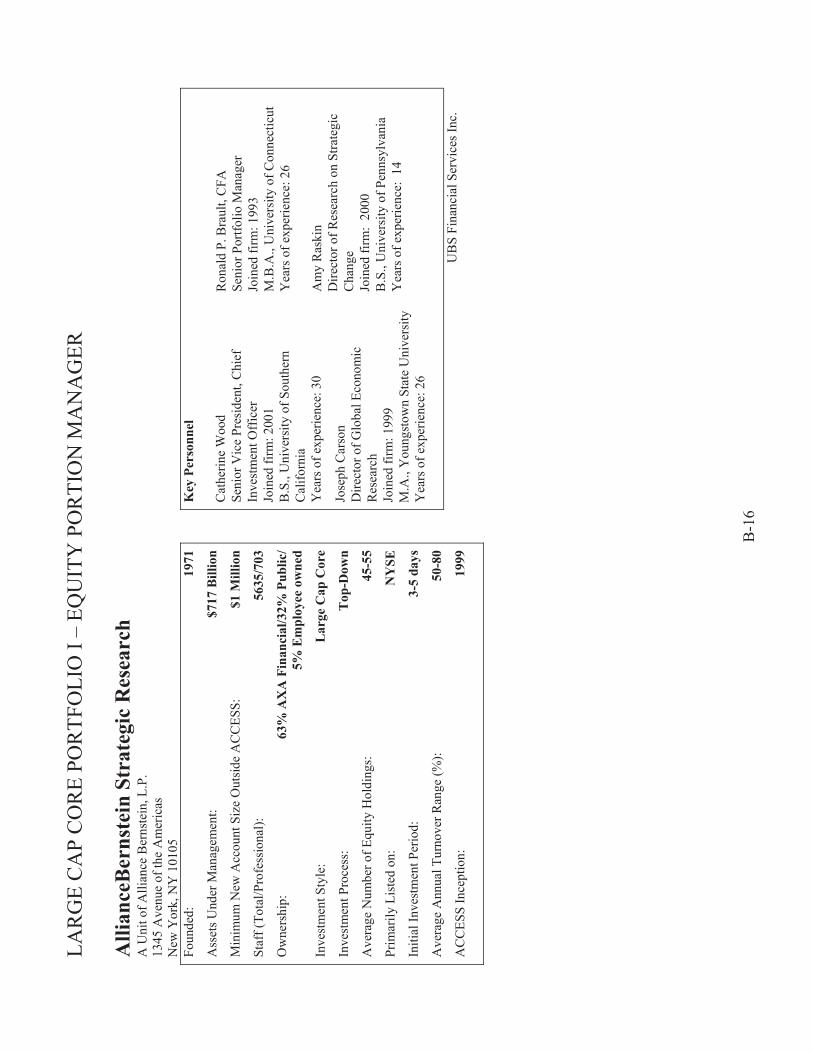
LAR
GE
CA
P C
OR
E PO
RTF
OLI
O I
– EQ
UIT
Y P
OR
TIO
N M
AN
AG
ER
B-1
6
Alli
ance
Ber
nste
in S
trat
egic
Res
earc
h A
Uni
t of A
llian
ce B
erns
tein
, L.P
. 13
45 A
venu
e of
the
Am
eric
as
New
Yor
k, N
Y 1
0105
Fo
unde
d:
1971
Ass
ets U
nder
Man
agem
ent:
$717
Bill
ion
Min
imum
New
Acc
ount
Siz
e O
utsi
de A
CC
ESS:
$1
Mill
ion
Staf
f (To
tal/P
rofe
ssio
nal):
56
35/7
03
Ow
ners
hip:
63
% A
XA
Fin
anci
al/3
2% P
ublic
/
5% E
mpl
oyee
ow
ned
Inve
stm
ent S
tyle
: L
arge
Cap
Cor
e
Inve
stm
ent P
roce
ss:
Top
-Dow
n
Ave
rage
Num
ber o
f Equ
ity H
oldi
ngs:
45
-55
Prim
arily
Lis
ted
on:
NY
SE
Initi
al In
vest
men
t Per
iod:
3-
5 da
ys
Ave
rage
Ann
ual T
urno
ver R
ange
(%):
50-8
0
AC
CES
S In
cept
ion:
19
99
Key
Per
sonn
el
Cat
herin
e W
ood
Seni
or V
ice
Pres
iden
t, C
hief
In
vest
men
t Off
icer
Jo
ined
firm
: 200
1 B
.S.,
Uni
vers
ity o
f Sou
ther
n C
alifo
rnia
Y
ears
of e
xper
ienc
e: 3
0
Jose
ph C
arso
n D
irect
or o
f Glo
bal E
cono
mic
R
esea
rch
Join
ed fi
rm: 1
999
M.A
., Y
oung
stow
n St
ate
Uni
vers
ity
Yea
rs o
f exp
erie
nce:
26
Ron
ald
P. B
raul
t, C
FA
Seni
or P
ortfo
lio M
anag
er
Join
ed fi
rm: 1
993
M.B
.A.,
Uni
vers
ity o
f Con
nect
icut
Y
ears
of e
xper
ienc
e: 2
6 A
my
Ras
kin
Dire
ctor
of R
esea
rch
on S
trate
gic
Cha
nge
Join
ed fi
rm:
2000
B
.S.,
Uni
vers
ity o
f Pen
nsyl
vani
a Y
ears
of e
xper
ienc
e: 1
4
UB
S Fi
nanc
ial S
ervi
ces I
nc.
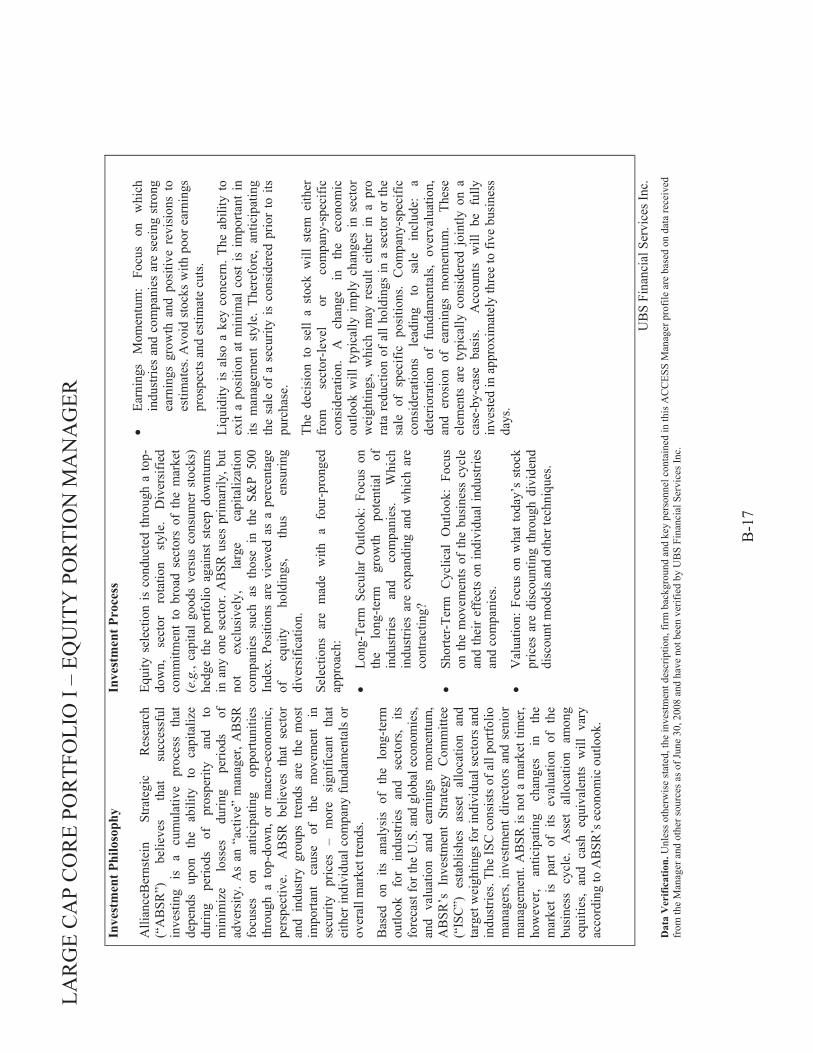
LAR
GE
CA
P C
OR
E PO
RTF
OLI
O I
– EQ
UIT
Y P
OR
TIO
N M
AN
AG
ER
B-1
7
Inve
stm
ent P
hilo
soph
y
Alli
ance
Ber
nste
in
Stra
tegi
c R
esea
rch
(“A
BSR
”)
belie
ves
that
su
cces
sful
in
vest
ing
is
a cu
mul
ativ
e pr
oces
s th
at
depe
nds
upon
th
e ab
ility
to
ca
pita
lize
durin
g pe
riods
of
pr
ospe
rity
and
to
min
imiz
e lo
sses
du
ring
perio
ds
of
adve
rsity
. As
an “
activ
e” m
anag
er, A
BSR
fo
cuse
s on
an
ticip
atin
g op
portu
nitie
s th
roug
h a
top-
dow
n, o
r m
acro
-eco
nom
ic,
pers
pect
ive.
A
BSR
bel
ieve
s th
at s
ecto
r an
d in
dust
ry g
roup
s tre
nds
are
the
mos
t im
porta
nt
caus
e of
th
e m
ovem
ent
in
secu
rity
pric
es
– m
ore
sign
ifica
nt
that
ei
ther
indi
vidu
al c
ompa
ny fu
ndam
enta
ls o
r ov
eral
l mar
ket t
rend
s.
Bas
ed o
n its
ana
lysi
s of
the
lon
g-te
rm
outlo
ok
for
indu
strie
s an
d se
ctor
s, its
fo
reca
st fo
r the
U.S
. and
glo
bal e
cono
mie
s, an
d va
luat
ion
and
earn
ings
mom
entu
m,
AB
SR’s
Inv
estm
ent
Stra
tegy
Com
mitt
ee
(“IS
C”)
est
ablis
hes
asse
t al
loca
tion
and
targ
et w
eigh
tings
for i
ndiv
idua
l sec
tors
and
in
dust
ries.
The
ISC
con
sist
s of
all
portf
olio
m
anag
ers,
inve
stm
ent d
irect
ors
and
seni
or
man
agem
ent.
AB
SR is
not
a m
arke
t tim
er,
how
ever
, an
ticip
atin
g ch
ange
s in
th
e m
arke
t is
par
t of
its
eva
luat
ion
of t
he
busi
ness
cy
cle.
A
sset
al
loca
tion
amon
g eq
uitie
s, an
d ca
sh e
quiv
alen
ts w
ill v
ary
acco
rdin
g to
AB
SR’s
eco
nom
ic o
utlo
ok.
Inve
stm
ent P
roce
ss
Equi
ty s
elec
tion
is c
ondu
cted
thro
ugh
a to
p-do
wn,
se
ctor
ro
tatio
n st
yle.
D
iver
sifie
d co
mm
itmen
t to
bro
ad s
ecto
rs o
f th
e m
arke
t (e
.g.,
capi
tal
good
s ve
rsus
con
sum
er s
tock
s)
hedg
e th
e po
rtfol
io a
gain
st s
teep
dow
ntur
ns
in a
ny o
ne s
ecto
r. A
BSR
use
s pr
imar
ily, b
ut
not
excl
usiv
ely,
la
rge
capi
taliz
atio
n co
mpa
nies
suc
h as
tho
se i
n th
e S&
P 50
0 In
dex.
Pos
ition
s ar
e vi
ewed
as
a pe
rcen
tage
of
eq
uity
ho
ldin
gs,
thus
en
surin
g di
vers
ifica
tion.
Sele
ctio
ns a
re
mad
e w
ith a
fou
r-pr
onge
d ap
proa
ch:
• Lo
ng-T
erm
Sec
ular
Out
look
: Fo
cus
on
the
long
-term
gr
owth
po
tent
ial
of
indu
strie
s an
d co
mpa
nies
. W
hich
in
dust
ries
are
expa
ndin
g an
d w
hich
are
co
ntra
ctin
g?
• Sh
orte
r-Te
rm C
yclic
al O
utlo
ok:
Focu
s on
the
mov
emen
ts o
f th
e bu
sine
ss c
ycle
an
d th
eir e
ffec
ts o
n in
divi
dual
indu
strie
s an
d co
mpa
nies
.
• V
alua
tion:
Foc
us o
n w
hat t
oday
’s s
tock
pr
ices
are
dis
coun
ting
thro
ugh
divi
dend
di
scou
nt m
odel
s and
oth
er te
chni
ques
.
• Ea
rnin
gs
Mom
entu
m:
Focu
s on
w
hich
in
dust
ries
and
com
pani
es a
re s
eein
g st
rong
ea
rnin
gs g
row
th a
nd p
ositi
ve r
evis
ions
to
estim
ates
. Avo
id s
tock
s w
ith p
oor e
arni
ngs
pros
pect
s and
est
imat
e cu
ts.
Liqu
idity
is a
lso
a ke
y co
ncer
n. T
he a
bilit
y to
ex
it a
posi
tion
at m
inim
al c
ost i
s im
porta
nt in
its
man
agem
ent
styl
e. T
here
fore
, an
ticip
atin
g th
e sa
le o
f a
secu
rity
is c
onsi
dere
d pr
ior
to it
s pu
rcha
se.
The
deci
sion
to
sell
a st
ock
will
ste
m e
ither
fr
om
sect
or-le
vel
or
com
pany
-spe
cific
co
nsid
erat
ion.
A
ch
ange
in
th
e ec
onom
ic
outlo
ok w
ill t
ypic
ally
im
ply
chan
ges
in s
ecto
r w
eigh
tings
, w
hich
may
res
ult
eith
er i
n a
pro
rata
red
uctio
n of
all
hold
ings
in a
sec
tor
or th
e sa
le o
f sp
ecifi
c po
sitio
ns.
Com
pany
-spe
cific
co
nsid
erat
ions
le
adin
g to
sa
le
incl
ude:
a
dete
riora
tion
of f
unda
men
tals
, ov
erva
luat
ion,
an
d er
osio
n of
ear
ning
s m
omen
tum
. T
hese
el
emen
ts a
re t
ypic
ally
con
side
red
join
tly o
n a
case
-by-
case
bas
is.
Acc
ount
s w
ill b
e fu
lly
inve
sted
in a
ppro
xim
atel
y th
ree
to fi
ve b
usin
ess
days
.
U
BS
Fina
ncia
l Ser
vice
s Inc
. D
ata
Ver
ifica
tion.
Unl
ess o
ther
wis
e st
ated
, the
inve
stm
ent d
escr
iptio
n, fi
rm b
ackg
roun
d an
d ke
y pe
rson
nel c
onta
ined
in th
is A
CC
ESS
Man
ager
pro
file
are
base
d on
dat
a re
ceiv
ed
from
the
Man
ager
and
oth
er so
urce
s as o
f Jun
e 30
, 200
8 an
d ha
ve n
ot b
een
verif
ied
by U
BS
Fina
ncia
l Ser
vice
s Inc
.
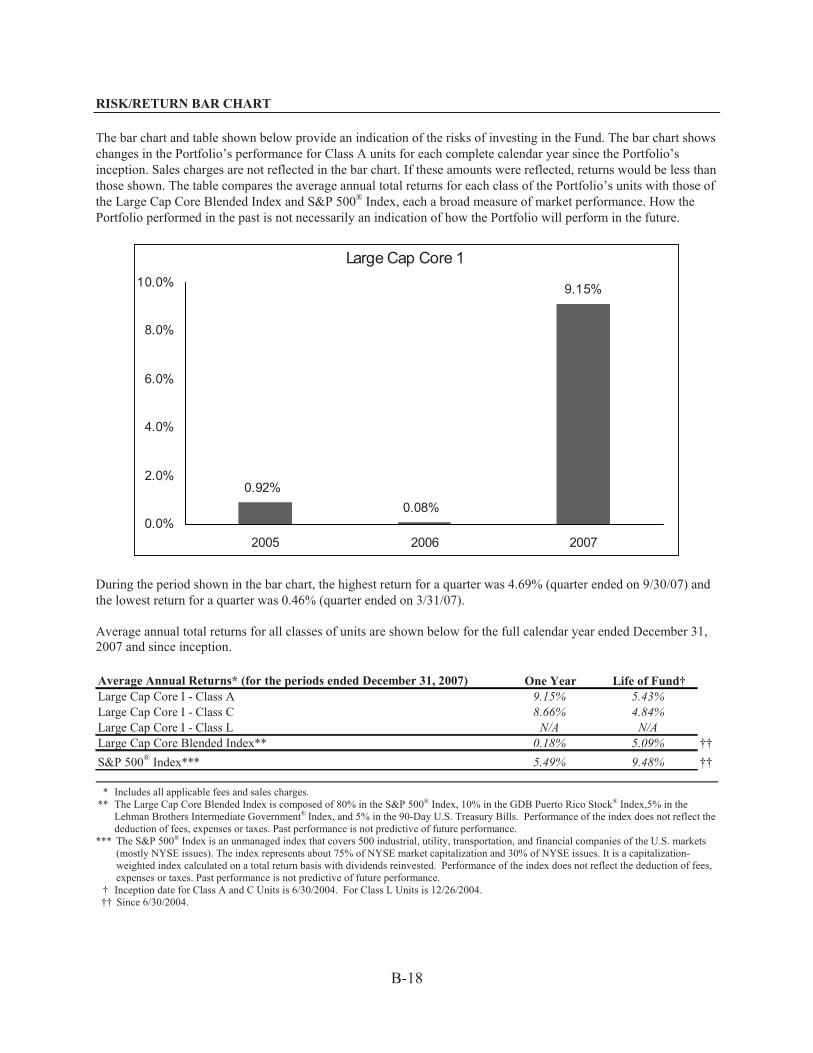
B-18
RISK/RETURN BAR CHART The bar chart and table shown below provide an indication of the risks of investing in the Fund. The bar chart shows changes in the Portfolio’s performance for Class A units for each complete calendar year since the Portfolio’s inception. Sales charges are not reflected in the bar chart. If these amounts were reflected, returns would be less than those shown. The table compares the average annual total returns for each class of the Portfolio’s units with those of the Large Cap Core Blended Index and S&P 500® Index, each a broad measure of market performance. How the Portfolio performed in the past is not necessarily an indication of how the Portfolio will perform in the future.
Large Cap Core 1
0.92%0.08%
9.15%
0.0%
2.0%
4.0%
6.0%
8.0%
10.0%
2005 2006 2007
During the period shown in the bar chart, the highest return for a quarter was 4.69% (quarter ended on 9/30/07) and the lowest return for a quarter was 0.46% (quarter ended on 3/31/07). Average annual total returns for all classes of units are shown below for the full calendar year ended December 31, 2007 and since inception. Average Annual Returns* (for the periods ended December 31, 2007) One Year Life of Fund†Large Cap Core I - Class A 9.15% 5.43%Large Cap Core I - Class C 8.66% 4.84%Large Cap Core I - Class L N/A N/ALarge Cap Core Blended Index** 0.18% 5.09% ††S&P 500® Index*** 5.49% 9.48% ††
* Includes all applicable fees and sales charges.
** The Large Cap Core Blended Index is composed of 80% in the S&P 500® Index, 10% in the GDB Puerto Rico Stock® Index,5% in the Lehman Brothers Intermediate Government® Index, and 5% in the 90-Day U.S. Treasury Bills. Performance of the index does not reflect the deduction of fees, expenses or taxes. Past performance is not predictive of future performance.
*** The S&P 500® Index is an unmanaged index that covers 500 industrial, utility, transportation, and financial companies of the U.S. markets (mostly NYSE issues). The index represents about 75% of NYSE market capitalization and 30% of NYSE issues. It is a capitalization-weighted index calculated on a total return basis with dividends reinvested. Performance of the index does not reflect the deduction of fees, expenses or taxes. Past performance is not predictive of future performance.
† Inception date for Class A and C Units is 6/30/2004. For Class L Units is 12/26/2004. †† Since 6/30/2004.
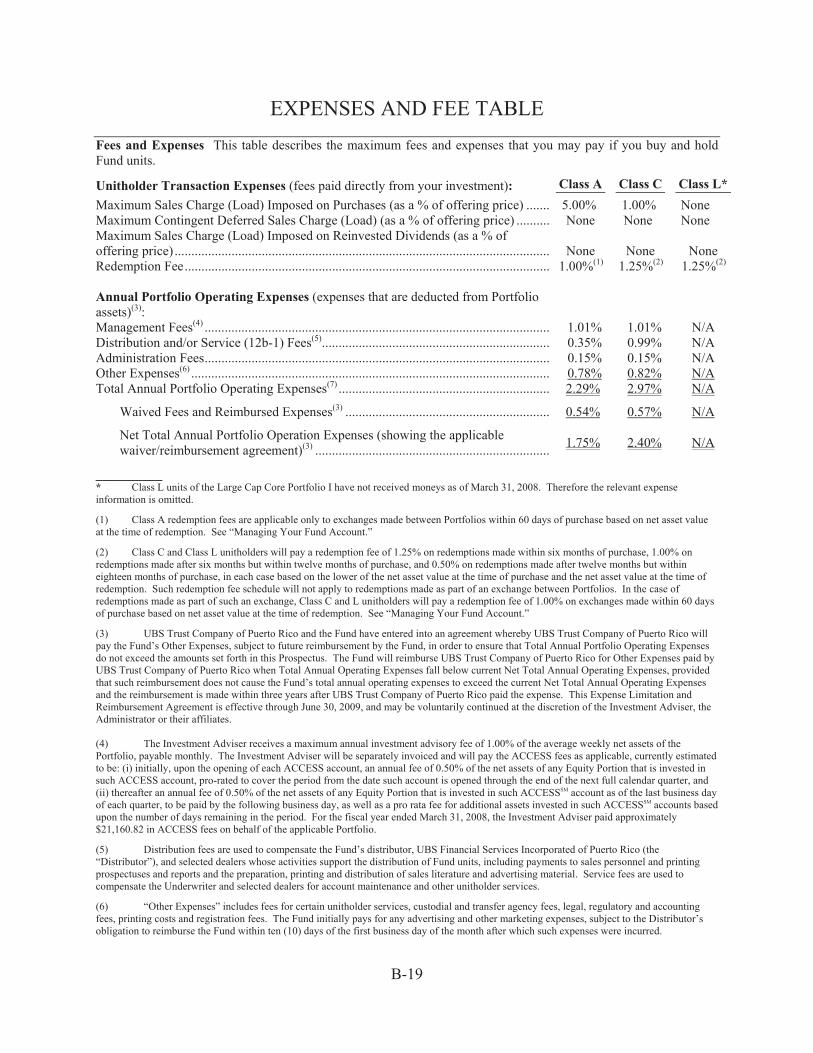
B-19
EXPENSES AND FEE TABLE Fees and Expenses This table describes the maximum fees and expenses that you may pay if you buy and hold Fund units.
Unitholder Transaction Expenses (fees paid directly from your investment): Class A Class C Class L* Maximum Sales Charge (Load) Imposed on Purchases (as a % of offering price) ........ 5.00% 1.00% None Maximum Contingent Deferred Sales Charge (Load) (as a % of offering price) ........... None None None Maximum Sales Charge (Load) Imposed on Reinvested Dividends (as a % of offering price) ................................................................................................................. None None None Redemption Fee .............................................................................................................. 1.00%(1) 1.25%(2) 1.25%(2) Annual Portfolio Operating Expenses (expenses that are deducted from Portfolio assets)(3):
Management Fees(4) ....................................................................................................... 1.01% 1.01% N/A Distribution and/or Service (12b-1) Fees(5) .................................................................... 0.35% 0.99% N/A Administration Fees ....................................................................................................... 0.15% 0.15% N/A Other Expenses(6) ........................................................................................................... 0.78% 0.82% N/A Total Annual Portfolio Operating Expenses(7) ............................................................... 2.29% 2.97% N/A
Waived Fees and Reimbursed Expenses(3) ............................................................. 0.54% 0.57% N/A
Net Total Annual Portfolio Operation Expenses (showing the applicable waiver/reimbursement agreement)(3) ...................................................................... 1.75% 2.40% N/A
__________ * Class L units of the Large Cap Core Portfolio I have not received moneys as of March 31, 2008. Therefore the relevant expense information is omitted.
(1) Class A redemption fees are applicable only to exchanges made between Portfolios within 60 days of purchase based on net asset value at the time of redemption. See “Managing Your Fund Account.”
(2) Class C and Class L unitholders will pay a redemption fee of 1.25% on redemptions made within six months of purchase, 1.00% on redemptions made after six months but within twelve months of purchase, and 0.50% on redemptions made after twelve months but within eighteen months of purchase, in each case based on the lower of the net asset value at the time of purchase and the net asset value at the time of redemption. Such redemption fee schedule will not apply to redemptions made as part of an exchange between Portfolios. In the case of redemptions made as part of such an exchange, Class C and L unitholders will pay a redemption fee of 1.00% on exchanges made within 60 days of purchase based on net asset value at the time of redemption. See “Managing Your Fund Account.”
(3) UBS Trust Company of Puerto Rico and the Fund have entered into an agreement whereby UBS Trust Company of Puerto Rico will pay the Fund’s Other Expenses, subject to future reimbursement by the Fund, in order to ensure that Total Annual Portfolio Operating Expenses do not exceed the amounts set forth in this Prospectus. The Fund will reimburse UBS Trust Company of Puerto Rico for Other Expenses paid by UBS Trust Company of Puerto Rico when Total Annual Operating Expenses fall below current Net Total Annual Operating Expenses, provided that such reimbursement does not cause the Fund’s total annual operating expenses to exceed the current Net Total Annual Operating Expenses and the reimbursement is made within three years after UBS Trust Company of Puerto Rico paid the expense. This Expense Limitation and Reimbursement Agreement is effective through June 30, 2009, and may be voluntarily continued at the discretion of the Investment Adviser, the Administrator or their affiliates. (4) The Investment Adviser receives a maximum annual investment advisory fee of 1.00% of the average weekly net assets of the Portfolio, payable monthly. The Investment Adviser will be separately invoiced and will pay the ACCESS fees as applicable, currently estimated to be: (i) initially, upon the opening of each ACCESS account, an annual fee of 0.50% of the net assets of any Equity Portion that is invested in such ACCESS account, pro-rated to cover the period from the date such account is opened through the end of the next full calendar quarter, and (ii) thereafter an annual fee of 0.50% of the net assets of any Equity Portion that is invested in such ACCESSSM account as of the last business day of each quarter, to be paid by the following business day, as well as a pro rata fee for additional assets invested in such ACCESSSM accounts based upon the number of days remaining in the period. For the fiscal year ended March 31, 2008, the Investment Adviser paid approximately $21,160.82 in ACCESS fees on behalf of the applicable Portfolio.
(5) Distribution fees are used to compensate the Fund’s distributor, UBS Financial Services Incorporated of Puerto Rico (the “Distributor”), and selected dealers whose activities support the distribution of Fund units, including payments to sales personnel and printing prospectuses and reports and the preparation, printing and distribution of sales literature and advertising material. Service fees are used to compensate the Underwriter and selected dealers for account maintenance and other unitholder services.
(6) “Other Expenses” includes fees for certain unitholder services, custodial and transfer agency fees, legal, regulatory and accounting fees, printing costs and registration fees. The Fund initially pays for any advertising and other marketing expenses, subject to the Distributor’s obligation to reimburse the Fund within ten (10) days of the first business day of the month after which such expenses were incurred.
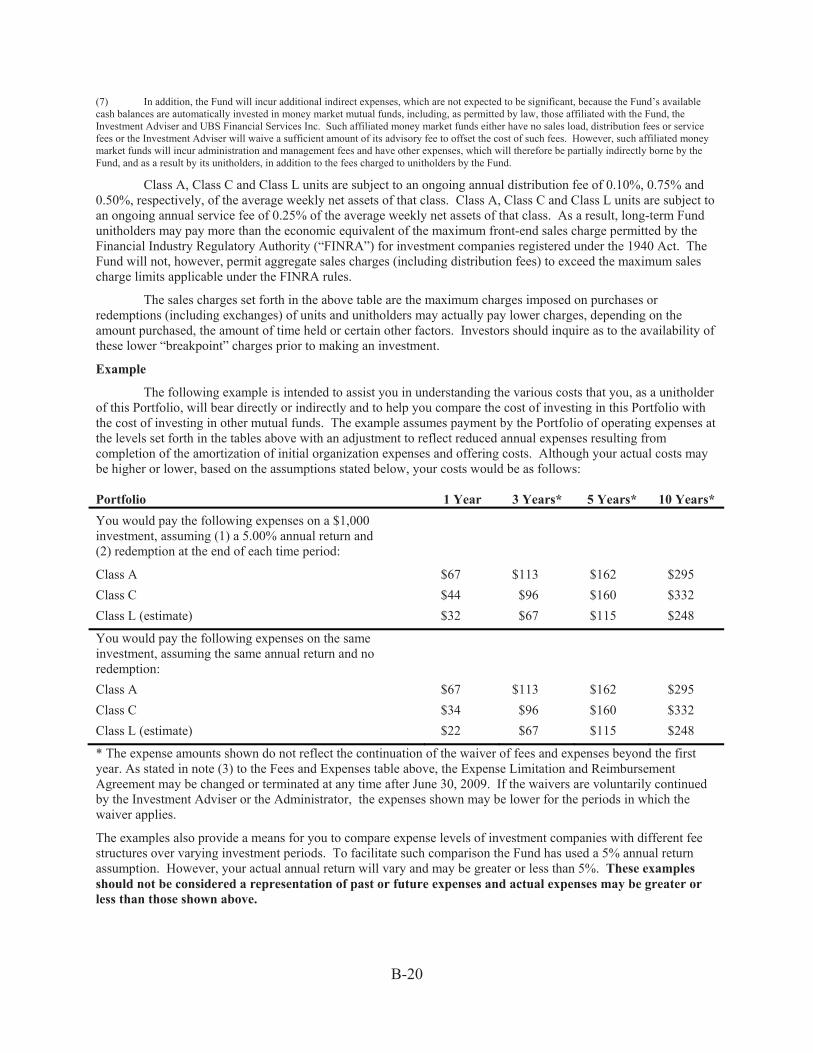
B-20
(7) In addition, the Fund will incur additional indirect expenses, which are not expected to be significant, because the Fund’s available cash balances are automatically invested in money market mutual funds, including, as permitted by law, those affiliated with the Fund, the Investment Adviser and UBS Financial Services Inc. Such affiliated money market funds either have no sales load, distribution fees or service fees or the Investment Adviser will waive a sufficient amount of its advisory fee to offset the cost of such fees. However, such affiliated money market funds will incur administration and management fees and have other expenses, which will therefore be partially indirectly borne by the Fund, and as a result by its unitholders, in addition to the fees charged to unitholders by the Fund.
Class A, Class C and Class L units are subject to an ongoing annual distribution fee of 0.10%, 0.75% and 0.50%, respectively, of the average weekly net assets of that class. Class A, Class C and Class L units are subject to an ongoing annual service fee of 0.25% of the average weekly net assets of that class. As a result, long-term Fund unitholders may pay more than the economic equivalent of the maximum front-end sales charge permitted by the Financial Industry Regulatory Authority (“FINRA”) for investment companies registered under the 1940 Act. The Fund will not, however, permit aggregate sales charges (including distribution fees) to exceed the maximum sales charge limits applicable under the FINRA rules.
The sales charges set forth in the above table are the maximum charges imposed on purchases or redemptions (including exchanges) of units and unitholders may actually pay lower charges, depending on the amount purchased, the amount of time held or certain other factors. Investors should inquire as to the availability of these lower “breakpoint” charges prior to making an investment.
Example
The following example is intended to assist you in understanding the various costs that you, as a unitholder of this Portfolio, will bear directly or indirectly and to help you compare the cost of investing in this Portfolio with the cost of investing in other mutual funds. The example assumes payment by the Portfolio of operating expenses at the levels set forth in the tables above with an adjustment to reflect reduced annual expenses resulting from completion of the amortization of initial organization expenses and offering costs. Although your actual costs may be higher or lower, based on the assumptions stated below, your costs would be as follows: Portfolio 1 Year 3 Years* 5 Years* 10 Years* You would pay the following expenses on a $1,000 investment, assuming (1) a 5.00% annual return and (2) redemption at the end of each time period:
Class A $67 $113 $162 $295 Class C $44 $96 $160 $332 Class L (estimate) $32 $67 $115 $248
You would pay the following expenses on the same investment, assuming the same annual return and no redemption:
Class A $67 $113 $162 $295 Class C $34 $96 $160 $332 Class L (estimate) $22 $67 $115 $248
* The expense amounts shown do not reflect the continuation of the waiver of fees and expenses beyond the first year. As stated in note (3) to the Fees and Expenses table above, the Expense Limitation and Reimbursement Agreement may be changed or terminated at any time after June 30, 2009. If the waivers are voluntarily continued by the Investment Adviser or the Administrator, the expenses shown may be lower for the periods in which the waiver applies.
The examples also provide a means for you to compare expense levels of investment companies with different fee structures over varying investment periods. To facilitate such comparison the Fund has used a 5% annual return assumption. However, your actual annual return will vary and may be greater or less than 5%. These examples should not be considered a representation of past or future expenses and actual expenses may be greater or less than those shown above.

B-21
Multi-Select Securities Puerto Rico Fund—Large Cap Core Portfolio II Investment Objective – The Portfolio’s investment objective is long-term growth of capital. No assurance
can be given that the Portfolio will achieve this investment objective.
Principal Investment Strategies – Under normal conditions, the Portfolio will invest up to 80% of its total assets in common stocks and other equity securities of U.S. companies (the “Equity Portion”). According to Puerto Rico law, the Portfolio also must invest at least 20% of its total assets in equity or taxable fixed-income securities issued by Puerto Rico entities (the “Puerto Rico Securities Portion”). This requirement may limit the Portfolio’s ability to achieve its investment objective.
Puerto Rico Securities Portion – The Portfolio will invest at least 20% of its total assets in equity or taxable fixed-income securities issued by Puerto Rico entities. The Fund’s Investment Adviser will manage this portion of the Portfolio directly.
Equity Portion – With regard to the Equity Portion of the Portfolio, the Fund intends to use a variation of what has been termed a “multi-manager” approach. The Fund has indirectly engaged different investment advisers (each a “Equity Portion Portfolio Manager”) for each Portfolio’s Equity Portion by opening accounts with ACCESSSM, a wrap fee advisory program offered by UBS Financial Services Inc., an affiliate of the Fund’s Investment Adviser. The following information profile describes the Equity Portion Portfolio Manager selected to manage the Equity Portion of the Portfolio, Davis Advisors, and the Equity Portion Portfolio Manager’s investment philosophy and process.

LAR
GE
CA
P C
OR
E PO
RTF
OLI
O II
– E
QU
ITY
PO
RTI
ON
MA
NA
GER
B
-22
Dav
is A
dvis
ors
609
Fifth
Ave
nue,
11t
h Fl
oor
New
Yor
k, N
ew Y
ork
1001
7 Fo
unde
d:
1969
Ass
ets U
nder
Man
agem
ent:
$94.
0 B
illio
n
Min
imum
New
Acc
ount
Siz
e O
utsi
de A
CC
ESS:
$1
0 M
illio
n
Staf
f (To
tal/P
rofe
ssio
nal):
28
0/19
Ow
ners
hip:
L
imite
d pa
rtne
rshi
p,
em
ploy
ee-o
wne
d
Inve
stm
ent S
tyle
: L
arge
Cap
Cor
e
Inve
stm
ent P
roce
ss:
Top
-dow
n/B
otto
m-u
p
Ave
rage
Num
ber o
f Equ
ity H
oldi
ngs:
40
-50
Prim
arily
Lis
ted
on:
NY
SE
Initi
al In
vest
men
t Per
iod:
1-
2 da
ys
Ave
rage
Ann
ual T
urno
ver R
ange
(%):
15-2
5
AC
CES
S In
cept
ion:
19
99
Key
Per
sonn
el
Chr
isto
pher
C. D
avis
Po
rtfol
io M
anag
er
Join
ed fi
rm: 1
989
M
.A.,
Uni
vers
ity o
f St.
And
rew
s (S
cotla
nd)
Yea
rs o
f exp
erie
nce:
21
Ken
neth
C. F
einb
erg
Portf
olio
Man
ager
Jo
ined
firm
: 199
4 B
.A.,
John
s Hop
kins
Uni
vers
ity
M.B
.A.,
Col
umbi
a U
nive
rsity
Y
ears
of e
xper
ienc
e: 1
4
Shel
by M
.C. D
avis
A
dvis
or
Join
ed fi
rm: 1
969
B.A
., Pr
ince
ton
Uni
vers
ity
Yea
rs o
f exp
erie
nce:
50
U
BS
Fina
ncia
l Ser
vice
s Inc
.

LAR
GE
CA
P C
OR
E PO
RTF
OLI
O II
– E
QU
ITY
PO
RTI
ON
MA
NA
GER
B
-23
Inve
stm
ent P
hilo
soph
y
Dav
is A
dvis
ors
(“D
avis
”) L
arge
Cap
Cor
e pr
oduc
t inv
ests
in d
urab
le la
rge
com
pani
es a
t va
lue
pric
es. T
he f
irm’s
goa
l is
to b
oth
grow
an
d pr
eser
ve w
ealth
for
the
ben
efit
of i
ts
clie
nts.
Ther
efor
e, m
anag
ing
risk
is th
e ke
y to
de
liver
ing
supe
rior
long
-term
in
vest
men
t re
sults
.
Dav
is
inve
sts
in
dura
ble
busi
ness
es
with
po
tent
ial f
or lo
ng-te
rm g
row
th. D
avis
adh
eres
to
a ri
goro
us p
rice
disc
iplin
e, a
nd p
ays
care
ful
atte
ntio
n to
th
e va
luat
ions
an
d ea
rnin
gs
mul
tiple
s of
ev
ery
pros
pect
ive
inve
stm
ent.
Dav
is
belie
ves
in
patie
nt,
long
-term
in
vest
men
t pr
actic
es,
and
is
war
y of
in
vest
men
t “f
ads.”
For
thi
s re
ason
, po
rtfol
io
man
ager
s an
d an
alys
ts
conc
entra
te
on
the
unde
rlyin
g ec
onom
ic
and
busi
ness
fu
ndam
enta
ls o
f eac
h in
vest
men
t.
Inve
stm
ent P
roce
ss
The
portf
olio
man
ager
s an
d re
sear
ch a
naly
sts
track
a
sele
ct
univ
erse
of
du
rabl
e la
rge
capi
taliz
atio
n co
mpa
nies
. Th
is
univ
erse
cl
osel
y co
rres
pond
s to
the
lar
ger,
uppe
r-tie
r m
embe
rs o
f th
e S&
P 50
0 In
dex,
with
an
emph
asis
on
bu
sine
sses
w
ith
stro
ng
inte
rnat
iona
l br
and
nam
es.
Dav
is
has
iden
tifie
d te
n ch
arac
teris
tics
that
the
y be
lieve
fo
ster
sust
aina
ble
long
-term
bus
ines
s gro
wth
:
His
toric
al M
anag
emen
t Suc
cess
:
• St
rong
His
toric
al T
rack
Rec
ord
• Si
gnifi
cant
A
lignm
ent
of
Inte
rest
s in
B
usin
ess
• Sm
art
App
licat
ion
of
Tech
nolo
gy
to
Impr
ove
Bus
ines
s and
Low
er C
osts
Stro
ng H
isto
rical
Con
ditio
n an
d Sa
tisfa
ctor
y Pr
ofita
bilit
y:
• St
rong
Bal
ance
She
et
• Lo
w C
ost S
truct
ure
• H
igh
Ret
urns
on
Cap
ital
Stro
ng C
ompe
titiv
e Po
sitio
ning
:
• N
on-o
bsol
esce
nt P
rodu
cts/
Serv
ices
•
Dom
inan
t or G
row
ing
Mar
ket S
hare
•
Glo
bal P
rese
nce
and
Bra
nd N
ames
Ther
e ar
e se
vera
l st
eps
to
the
portf
olio
m
anag
emen
t pro
cess
:
1.
The
inve
stm
ent
team
re
sear
ches
co
mpa
nies
on
a ca
se-b
y-ca
se b
asis
, bu
t al
so
atte
mpt
s to
fo
cus
thei
r re
sear
ch
effo
rts
base
d on
br
oade
r, lo
ng-te
rm
mac
ro-e
cono
mic
tre
nds
that
in
fluen
ce
the
grow
th
pote
ntia
l of
pr
ospe
ctiv
e in
vest
men
ts.
Ther
efor
e,
they
em
ploy
bo
th b
otto
m-u
p an
d to
p-do
wn
stra
tegi
es.
2.
Ana
lyst
s co
nduc
t int
ensi
ve re
sear
ch in
to
com
pany
fun
dam
enta
ls. T
hey
freq
uent
ly
mee
t an
d in
terv
iew
th
e m
anag
emen
t te
ams,
empl
oyee
s, an
d co
mpe
titor
s of
pr
ospe
ctiv
e co
mpa
nies
.
3.
Portf
olio
m
anag
ers
defin
e an
“a
ppro
ved
list”
of
com
pani
es t
hat
they
wou
ld p
urch
ase
unde
r the
righ
t ci
rcum
stan
ces a
nd v
alua
tions
.
4.
Posi
tions
ar
e bu
ilt
stra
tegi
cally
, ba
sed
on c
ompa
ny v
alua
tions
. Onc
e an
inv
estm
ent
is m
ade,
Dav
is w
ill
cons
tant
ly
re-e
valu
ate
the
man
agem
ent,
long
-term
ea
rnin
gs
pros
pect
s, an
d va
luat
ions
of
in
vest
men
ts.
5.
Posi
tions
are
hel
d fo
r th
e lo
ng-te
rm
(gen
eral
ly 4
to 7
yea
rs o
n av
erag
e).
Dav
is w
ill s
trate
gica
lly s
ell
or t
rim
posi
tions
ba
sed
on
exce
ssiv
e va
luat
ions
, de
terio
ratin
g fu
ndam
enta
ls,
or m
ater
ial
chan
ges
in a
com
pany
’s b
usin
ess
oper
atio
ns
or p
ract
ices
.
Turn
over
for t
he p
ortfo
lio is
15-
25%
and
w
ill t
ypic
ally
tak
e on
e da
y to
be
fully
in
vest
ed,
depe
ndin
g on
th
e m
arke
t en
viro
nmen
t.
U
BS
Fina
ncia
l Ser
vice
s Inc
. D
ata
Ver
ifica
tion.
Unl
ess o
ther
wis
e st
ated
, the
inve
stm
ent d
escr
iptio
n, fi
rm b
ackg
roun
d an
d ke
y pe
rson
nel c
onta
ined
in th
is A
CC
ESS
Man
ager
pro
file
are
base
d on
dat
a re
ceiv
ed fr
om th
e M
anag
er a
nd o
ther
sour
ces a
s of J
une
30, 2
008
and
have
not
bee
n ve
rifie
d by
UB
S Fi
nanc
ial S
ervi
ces I
nc.

B-24
RISK/RETURN BAR CHART The bar chart and table shown below provide an indication of the risks of investing in the Fund. The bar chart shows changes in the Portfolio’s performance for Class A units for each complete calendar year since the Portfolio’s inception. Sales charges are not reflected in the bar chart. If these amounts were reflected, returns would be less than those shown. The table compares the average annual total returns for each class of the Portfolio’s units with those of the Large Cap Core Blended Index and S&P 500® Index, each a broad measure of market performance. How the Portfolio performed in the past is not necessarily an indication of how the Portfolio will perform in the future.
Large Cap Core 2
(0.09%)
7.15%
-1.15%-2.0%
0.0%
2.0%
4.0%
6.0%
8.0%
10.0%
2005 2006 2007
During the period shown in the bar chart, the highest return for a quarter was 3.63% (quarter ended on 6/30/07) and the lowest return for a quarter was -2.74% (quarter ended on 9/30/07). Average annual total returns for all classes of units are shown below for the full calendar year ended December 31, 2007 and since inception. Average Annual Returns* (for the periods ended December 31, 2007) One Year Life of Fund†Large Cap Core II - Class A -1.15% 3.66%Large Cap Core II - Class C -1.51% 2.99%Large Cap Core II - Class L -0.89% 3.15%Large Cap Core Blended Index** 0.18% 5.09% ††S&P 500® Index*** 5.49% 9.48% ††
* Includes all applicable fees and sales charges.
** The Large Cap Core Blended Index is composed of 80% in the S&P 500® Index, 10% in the GDB Puerto Rico Stock® Index,5% in the Lehman Brothers Intermediate Government® Index, and 5% in the 90-Day U.S. Treasury Bills. Performance of the index does not reflect the deduction of fees, expenses or taxes. Past performance is not predictive of future performance.
*** The S&P 500® Index is an unmanaged index that covers 500 industrial, utility, transportation, and financial companies of the U.S. markets (mostly NYSE issues). The index represents about 75% of NYSE market capitalization and 30% of NYSE issues. It is a capitalization-weighted index calculated on a total return basis with dividends reinvested. Performance of the index does not reflect the deduction of fees, expenses or taxes. Past performance is not predictive of future performance.
† Inception date for Class A, C, and L Units is 6/30/2004. †† Since 6/30/2004.

B-25
EXPENSES AND FEE TABLE Fees and Expenses This table describes the maximum fees and expenses that you may pay if you buy and hold Fund units.
Unitholder Transaction Expenses (fees paid directly from your investment): Class A Class C Class L Maximum Sales Charge (Load) Imposed on Purchases (as a % of offering price) ........ 5.00% 1.00% None Maximum Contingent Deferred Sales Charge (Load) (as a % of offering price) ........... None None None Maximum Sales Charge (Load) Imposed on Reinvested Dividends (as a % of offering price) ................................................................................................................. None None None Redemption Fee .............................................................................................................. 1.00%(1) 1.25%(2) 1.25%(2) Annual Portfolio Operating Expenses (expenses that are deducted from Portfolio assets)(3):
Management Fees(4) ....................................................................................................... 0.99% 0.99% 0.99% Distribution and/or Service (12b-1) Fees(5) .................................................................... 0.35% 0.96% 0.79% Administration Fees ....................................................................................................... 0.15% 0.15% 0.15% Other Expenses(6) ........................................................................................................... 0.58% 0.56% 0.52% Total Annual Portfolio Operating Expenses(7) ............................................................... 2.08% 2.66% 2.46%
Waived Fees and Reimbursed Expenses(3) ............................................................. 0.33% 0.26% 0.31%
Net Total Annual Portfolio Operation Expenses (showing the applicable waiver/reimbursement agreement)(3) ...................................................................... 1.75% 2.40% 2.15%
__________ (1) Class A redemption fees are applicable only to exchanges made between Portfolios within 60 days of purchase based on net asset value at the time of redemption. See “Managing Your Fund Account.”
(2) Class C and Class L unitholders will pay a redemption fee of 1.25% on redemptions made within six months of purchase, 1.00% on redemptions made after six months but within twelve months of purchase, and 0.50% on redemptions made after twelve months but within eighteen months of purchase, in each case based on the lower of the net asset value at the time of purchase and the net asset value at the time of redemption. Such redemption fee schedule will not apply to redemptions made as part of an exchange between Portfolios. In the case of redemptions made as part of such an exchange, Class C and L unitholders will pay a redemption fee of 1.00% on exchanges made within 60 days of purchase based on net asset value at the time of redemption. See “Managing Your Fund Account.”
(3) UBS Trust Company of Puerto Rico and the Fund have entered into an agreement whereby UBS Trust Company of Puerto Rico will pay the Fund’s Other Expenses, subject to future reimbursement by the Fund, in order to ensure that Total Annual Portfolio Operating Expenses do not exceed the amounts set forth in this Prospectus. The Fund will reimburse UBS Trust Company of Puerto Rico for Other Expenses paid by UBS Trust Company of Puerto Rico when Total Annual Operating Expenses fall below current Net Total Annual Operating Expenses, provided that such reimbursement does not cause the Fund’s total annual operating expenses to exceed the current Net Total Annual Operating Expenses and the reimbursement is made within three years after UBS Trust Company of Puerto Rico paid the expense. This Expense Limitation and Reimbursement Agreement is effective through June 30, 2009, and may be voluntarily continued at the discretion of the Investment Adviser, the Administrator or their affiliates. (4) The Investment Adviser receives a maximum annual investment advisory fee of 1.00% of the average weekly net assets of the Portfolio, payable monthly. The Investment Adviser will be separately invoiced and will pay the ACCESS fees as applicable, currently estimated to be: (i) initially, upon the opening of each ACCESS account, an annual fee of 0.50% of the net assets of any Equity Portion that is invested in such ACCESS account, pro-rated to cover the period from the date such account is opened through the end of the next full calendar quarter, and (ii) thereafter an annual fee of 0.50% of the net assets of any Equity Portion that is invested in such ACCESSSM account as of the last business day of each quarter, to be paid by the following business day, as well as a pro rata fee for additional assets invested in such ACCESSSM accounts based upon the number of days remaining in the period. For the fiscal year ended March 31, 2008, the Investment Adviser paid approximately $28,394.90 in ACCESS fees on behalf of the applicable Portfolio.
(5) Distribution fees are used to compensate the Fund’s distributor, UBS Financial Services Incorporated of Puerto Rico (the “Distributor”), and selected dealers whose activities support the distribution of Fund units, including payments to sales personnel and printing prospectuses and reports and the preparation, printing and distribution of sales literature and advertising material. Service fees are used to compensate the Underwriter and selected dealers for account maintenance and other unitholder services.
(6) “Other Expenses” includes fees for certain unitholder services, custodial and transfer agency fees, legal, regulatory and accounting fees, printing costs and registration fees. The Fund initially pays for any advertising and other marketing expenses, subject to the Distributor’s obligation to reimburse the Fund within ten (10) days of the first business day of the month after which such expenses were incurred.
(7) In addition, the Fund will incur additional indirect expenses, which are not expected to be significant, because the Fund’s available cash balances are automatically invested in money market mutual funds, including, as permitted by law, those affiliated with the Fund, the Investment Adviser and UBS Financial Services Inc. Such affiliated money market funds either have no sales load, distribution fees or service

B-26
fees or the Investment Adviser will waive a sufficient amount of its advisory fee to offset the cost of such fees. However, such affiliated money market funds will incur administration and management fees and have other expenses, which will therefore be partially indirectly borne by the Fund, and as a result by its unitholders, in addition to the fees charged to unitholders by the Fund.
Class A, Class C and Class L units are subject to an ongoing annual distribution fee of 0.10%, 0.75% and 0.50%, respectively, of the average weekly net assets of that class. Class A, Class C and Class L units are subject to an ongoing annual service fee of 0.25% of the average weekly net assets of that class. As a result, long-term Fund unitholders may pay more than the economic equivalent of the maximum front-end sales charge permitted by the Financial Industry Regulatory Authority (“FINRA”) for investment companies registered under the 1940 Act. The Fund will not, however, permit aggregate sales charges (including distribution fees) to exceed the maximum sales charge limits applicable under the FINRA rules.
The sales charges set forth in the above table are the maximum charges imposed on purchases or redemptions (including exchanges) of units and unitholders may actually pay lower charges, depending on the amount purchased, the amount of time held or certain other factors. Investors should inquire as to the availability of these lower “breakpoint” charges prior to making an investment.
Example
The following example is intended to assist you in understanding the various costs that you, as a unitholder of this Portfolio, will bear directly or indirectly and to help you compare the cost of investing in this Portfolio with the cost of investing in other mutual funds. The example assumes payment by the Portfolio of operating expenses at the levels set forth in the tables above with an adjustment to reflect reduced annual expenses resulting from completion of the amortization of initial organization expenses and offering costs. Although your actual costs may be higher or lower, based on the assumptions stated below, your costs would be as follows:
Portfolio 1 Year 3 Years* 5 Years* 10 Years* You would pay the following expenses on a $1,000 investment, assuming (1) a 5.00% annual return and (2) redemption at the end of each time period:
Class A $67 $109 $153 $277 Class C $44 $89 $147 $304 Class L $32 $74 $128 $277
You would pay the following expenses on the same investment, assuming the same annual return and no redemption:
Class A $67 $109 $153 $277 Class C $34 $89 $147 $304 Class L $22 $74 $128 $277
* The expense amounts shown do not reflect the continuation of the waiver of fees and expenses beyond the first year. As stated in note (3) to the Fees and Expenses table above, the Expense Limitation and Reimbursement Agreement may be changed or terminated at any time after June 30, 2009. If the waivers are voluntarily continued by the Investment Adviser or the Administrator, the expenses shown may be lower for the periods in which the waiver applies.
The examples also provide a means for you to compare expense levels of investment companies with different fee structures over varying investment periods. To facilitate such comparison the Fund has used a 5% annual return assumption. However, your actual annual return will vary and may be greater or less than 5%. These examples should not be considered a representation of past or future expenses and actual expenses may be greater or less than those shown above.

B-27
Multi-Select Securities Puerto Rico Fund—Large Cap Growth Portfolio I
Investment Objective – The Portfolio’s investment objective is long-term growth of capital. No assurance can be given that the Portfolio will achieve this investment objective.
Principal Investment Strategies – Under normal conditions, the Portfolio will invest up to 80% of its total assets in common stocks and other equity securities of U.S. companies (the “Equity Portion”). According to Puerto Rico law, the Portfolio also must invest at least 20% of its total assets in equity or taxable fixed-income securities issued by Puerto Rico entities (the “Puerto Rico Securities Portion”). This requirement may limit the Portfolio’s ability to achieve its investment objective.
Puerto Rico Securities Portion – The Portfolio will invest at least 20% of its total assets in equity or taxable fixed-income securities issued by Puerto Rico entities. The Fund’s Investment Adviser will manage this portion of the Portfolio directly.
Equity Portion – With regard to the Equity Portion of the Portfolio, the Fund intends to use a variation of what has been termed a “multi-manager” approach. The Fund has indirectly engaged different investment advisers (each a “Equity Portion Portfolio Manager”) for each Portfolio’s Equity Portion by opening accounts with ACCESSSM, a wrap fee advisory program offered by UBS Financial Services Inc., an affiliate of the Fund’s Investment Adviser. The following information profile describes the Equity Portion Portfolio Manager selected to manage the Equity Portion of the Portfolio, Marsico Capital Management, LLC/Columbia, and the Equity Portion Portfolio Manager’s investment philosophy and process.
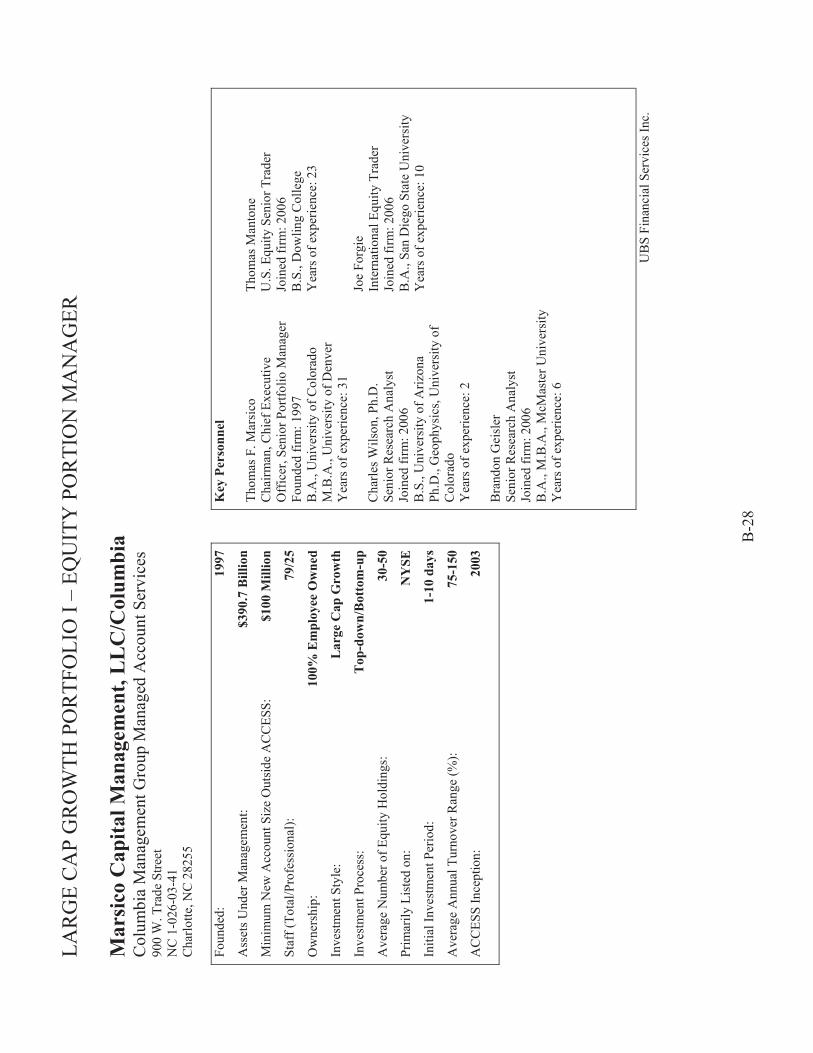
LAR
GE
CA
P G
RO
WTH
PO
RTF
OLI
O I
– EQ
UIT
Y P
OR
TIO
N M
AN
AG
ER
B
-28
Mar
sico
Cap
ital M
anag
emen
t, L
LC
/Col
umbi
a C
olum
bia
Man
agem
ent G
roup
Man
aged
Acc
ount
Ser
vice
s 90
0 W
. Tra
de S
treet
N
C 1
-026
-03-
41
Cha
rlotte
, NC
282
55
Foun
ded:
19
97
Ass
ets U
nder
Man
agem
ent:
$390
.7 B
illio
n
Min
imum
New
Acc
ount
Siz
e O
utsi
de A
CC
ESS:
$1
00 M
illio
n
Staf
f (To
tal/P
rofe
ssio
nal):
79
/25
Ow
ners
hip:
10
0% E
mpl
oyee
Ow
ned
Inve
stm
ent S
tyle
: L
arge
Cap
Gro
wth
Inve
stm
ent P
roce
ss:
Top
-dow
n/B
otto
m-u
p
Ave
rage
Num
ber o
f Equ
ity H
oldi
ngs:
30
-50
Prim
arily
Lis
ted
on:
NY
SE
Initi
al In
vest
men
t Per
iod:
1-
10 d
ays
Ave
rage
Ann
ual T
urno
ver R
ange
(%):
75-1
50
AC
CES
S In
cept
ion:
20
03
Key
Per
sonn
el
Thom
as F
. Mar
sico
C
hairm
an, C
hief
Exe
cutiv
e O
ffic
er, S
enio
r Por
tfolio
Man
ager
Fo
unde
d fir
m: 1
997
B.A
., U
nive
rsity
of C
olor
ado
M.B
.A.,
Uni
vers
ity o
f Den
ver
Yea
rs o
f exp
erie
nce:
31
Cha
rles W
ilson
, Ph.
D.
Seni
or R
esea
rch
Ana
lyst
Jo
ined
firm
: 200
6 B
.S.,
Uni
vers
ity o
f Ariz
ona
Ph.D
., G
eoph
ysic
s, U
nive
rsity
of
Col
orad
o Y
ears
of e
xper
ienc
e: 2
B
rand
on G
eisl
er
Seni
or R
esea
rch
Ana
lyst
Jo
ined
firm
: 200
6 B
.A.,
M.B
.A.,
McM
aste
r Uni
vers
ity
Yea
rs o
f exp
erie
nce:
6
Thom
as M
anto
ne
U.S
. Equ
ity S
enio
r Tra
der
Join
ed fi
rm: 2
006
B.S
., D
owlin
g C
olle
ge
Yea
rs o
f exp
erie
nce:
23
Joe
Forg
ie
Inte
rnat
iona
l Equ
ity T
rade
r Jo
ined
firm
: 200
6 B
.A.,
San
Die
go S
tate
Uni
vers
ity
Yea
rs o
f exp
erie
nce:
10
UB
S Fi
nanc
ial S
ervi
ces I
nc.
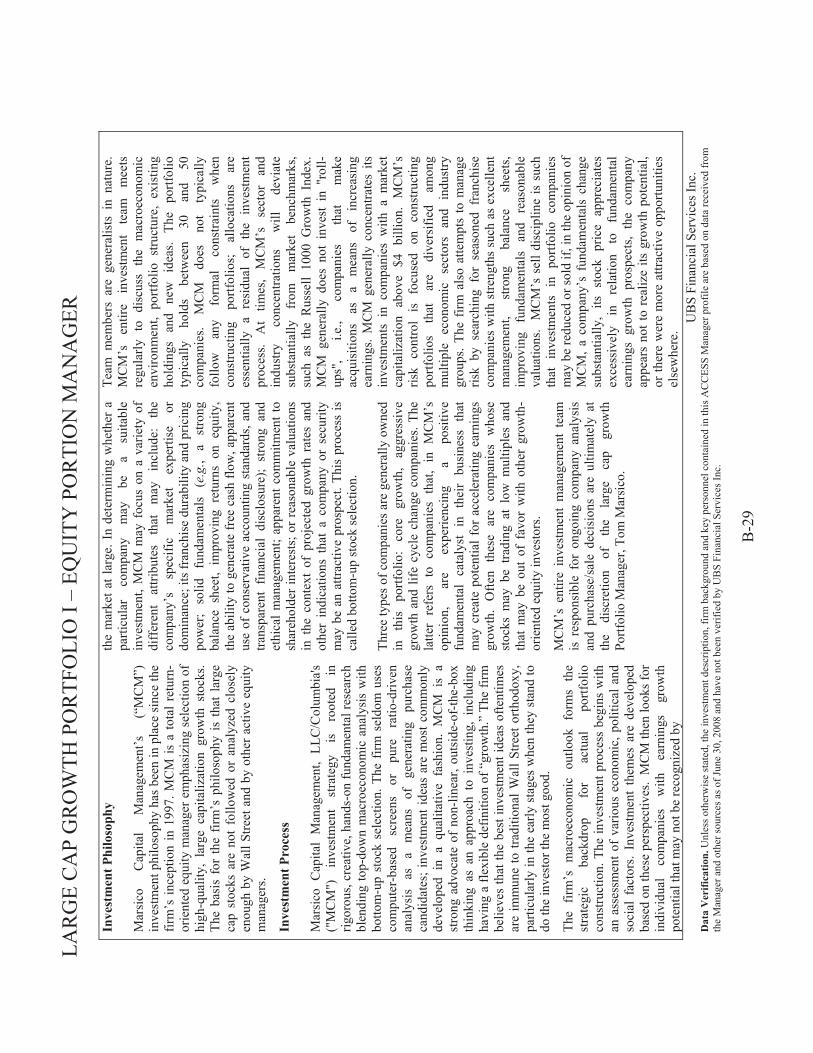
LAR
GE
CA
P G
RO
WTH
PO
RTF
OLI
O I
– EQ
UIT
Y P
OR
TIO
N M
AN
AG
ER
B
-29
Inve
stm
ent P
hilo
soph
y
Mar
sico
C
apita
l M
anag
emen
t’s
(“M
CM
”)
inve
stm
ent p
hilo
soph
y ha
s bee
n in
pla
ce si
nce
the
firm
’s in
cept
ion
in 1
997.
MC
M is
a to
tal r
etur
n-or
ient
ed e
quity
man
ager
em
phas
izin
g se
lect
ion
of
high
-qua
lity,
lar
ge c
apita
lizat
ion
grow
th s
tock
s. Th
e ba
sis
for
the
firm
’s p
hilo
soph
y is
tha
t la
rge
cap
stoc
ks a
re n
ot f
ollo
wed
or
anal
yzed
clo
sely
en
ough
by
Wal
l Stre
et a
nd b
y ot
her a
ctiv
e eq
uity
m
anag
ers.
Inve
stm
ent P
roce
ss
Mar
sico
Cap
ital
Man
agem
ent,
LLC
/Col
umbi
a's
("M
CM
")
inve
stm
ent
stra
tegy
is
ro
oted
in
rig
orou
s, cr
eativ
e, h
ands
-on
fund
amen
tal r
esea
rch
blen
ding
top-
dow
n m
acro
econ
omic
ana
lysi
s w
ith
botto
m-u
p st
ock
sele
ctio
n. T
he f
irm s
eldo
m u
ses
com
pute
r-ba
sed
scre
ens
or
pure
ra
tio-d
riven
an
alys
is
as
a m
eans
of
ge
nera
ting
purc
hase
ca
ndid
ates
; inv
estm
ent i
deas
are
mos
t com
mon
ly
deve
lope
d in
a q
ualit
ativ
e fa
shio
n. M
CM
is
a st
rong
adv
ocat
e of
non
-line
ar, o
utsi
de-o
f-th
e-bo
x th
inki
ng a
s an
app
roac
h to
inv
estin
g, i
nclu
ding
ha
ving
a fl
exib
le d
efin
ition
of “
grow
th.”
The
firm
be
lieve
s th
at th
e be
st in
vest
men
t ide
as o
ftent
imes
ar
e im
mun
e to
trad
ition
al W
all S
treet
orth
odox
y,
parti
cula
rly in
the
early
sta
ges
whe
n th
ey s
tand
to
do th
e in
vest
or th
e m
ost g
ood.
The
firm
’s m
acro
econ
omic
out
look
for
ms
the
stra
tegi
c ba
ckdr
op
for
actu
al
portf
olio
co
nstru
ctio
n. T
he in
vest
men
t pro
cess
beg
ins
with
an
ass
essm
ent o
f va
rious
eco
nom
ic, p
oliti
cal a
nd
soci
al f
acto
rs.
Inve
stm
ent
them
es a
re d
evel
oped
ba
sed
on th
ese
pers
pect
ives
. M
CM
then
look
s for
in
divi
dual
co
mpa
nies
w
ith
earn
ings
gr
owth
po
tent
ial t
hat m
ay n
ot b
e re
cogn
ized
by
the
mar
ket a
t lar
ge. I
n de
term
inin
g w
heth
er a
pa
rticu
lar
com
pany
m
ay
be
a su
itabl
e in
vest
men
t, M
CM
may
foc
us o
n a
varie
ty o
f di
ffer
ent
attri
bute
s th
at
may
in
clud
e:
the
com
pany
’s
spec
ific
mar
ket
expe
rtise
or
do
min
ance
; its
fran
chis
e du
rabi
lity
and
pric
ing
pow
er;
solid
fu
ndam
enta
ls
(e.g
., a
stro
ng
bala
nce
shee
t, im
prov
ing
retu
rns
on e
quity
, th
e ab
ility
to g
ener
ate
free
cas
h flo
w, a
ppar
ent
use
of c
onse
rvat
ive
acco
untin
g st
anda
rds,
and
trans
pare
nt f
inan
cial
dis
clos
ure)
; st
rong
and
et
hica
l man
agem
ent;
appa
rent
com
mitm
ent t
o sh
areh
olde
r int
eres
ts; o
r rea
sona
ble
valu
atio
ns
in t
he c
onte
xt o
f pr
ojec
ted
grow
th r
ates
and
ot
her
indi
catio
ns t
hat
a co
mpa
ny o
r se
curit
y m
ay b
e an
attr
activ
e pr
ospe
ct. T
his
proc
ess
is
calle
d bo
ttom
-up
stoc
k se
lect
ion.
Th
ree
type
s of c
ompa
nies
are
gen
eral
ly o
wne
d in
th
is
portf
olio
: co
re
grow
th,
aggr
essi
ve
grow
th a
nd li
fe c
ycle
cha
nge
com
pani
es. T
he
latte
r re
fers
to
com
pani
es t
hat,
in M
CM
’s
opin
ion,
ar
e ex
perie
ncin
g a
posi
tive
fund
amen
tal
cata
lyst
in
thei
r bu
sine
ss t
hat
may
cre
ate
pote
ntia
l for
acc
eler
atin
g ea
rnin
gs
grow
th.
Ofte
n th
ese
are
com
pani
es w
hose
st
ocks
may
be
tradi
ng a
t lo
w m
ultip
les
and
that
may
be
out
of f
avor
with
oth
er g
row
th-
orie
nted
equ
ity in
vest
ors.
MC
M’s
ent
ire i
nves
tmen
t m
anag
emen
t te
am
is r
espo
nsib
le f
or o
ngoi
ng c
ompa
ny a
naly
sis
and
purc
hase
/sal
e de
cisi
ons
are
ultim
atel
y at
th
e di
scre
tion
of
the
larg
e ca
p gr
owth
Po
rtfol
io M
anag
er, T
om M
arsi
co.
Team
mem
bers
are
gen
eral
ists
in
natu
re.
MC
M’s
en
tire
inve
stm
ent
team
m
eets
re
gula
rly t
o di
scus
s th
e m
acro
econ
omic
en
viro
nmen
t, po
rtfol
io s
truct
ure,
exi
stin
g ho
ldin
gs
and
new
id
eas.
The
portf
olio
ty
pica
lly
hold
s be
twee
n 30
an
d 50
co
mpa
nies
. M
CM
do
es
not
typi
cally
fo
llow
an
y fo
rmal
co
nstra
ints
w
hen
cons
truct
ing
portf
olio
s;
allo
catio
ns
are
esse
ntia
lly a
res
idua
l of
the
inv
estm
ent
proc
ess.
At
times
, M
CM
’s
sect
or
and
indu
stry
co
ncen
tratio
ns
will
de
viat
e su
bsta
ntia
lly
from
m
arke
t be
nchm
arks
, su
ch a
s th
e R
usse
ll 10
00 G
row
th I
ndex
. M
CM
gen
eral
ly d
oes
not
inve
st i
n "r
oll-
ups"
, i.e
., co
mpa
nies
th
at
mak
e ac
quis
ition
s as
a
mea
ns
of
incr
easi
ng
earn
ings
. M
CM
gen
eral
ly c
once
ntra
tes
its
inve
stm
ents
in
com
pani
es w
ith a
mar
ket
capi
taliz
atio
n ab
ove
$4 b
illio
n. M
CM
’s
risk
cont
rol
is
focu
sed
on
cons
truct
ing
portf
olio
s th
at
are
dive
rsifi
ed
amon
g m
ultip
le
econ
omic
se
ctor
s an
d in
dust
ry
grou
ps. T
he f
irm a
lso
atte
mpt
s to
man
age
risk
by s
earc
hing
for
sea
sone
d fr
anch
ise
com
pani
es w
ith s
treng
ths
such
as
exce
llent
m
anag
emen
t, st
rong
ba
lanc
e sh
eets
, im
prov
ing
fund
amen
tals
an
d re
ason
able
va
luat
ions
. M
CM
’s s
ell d
isci
plin
e is
suc
h th
at i
nves
tmen
ts i
n po
rtfol
io c
ompa
nies
m
ay b
e re
duce
d or
sold
if, i
n th
e op
inio
n of
M
CM
, a
com
pany
’s f
unda
men
tals
cha
nge
subs
tant
ially
, its
sto
ck p
rice
appr
ecia
tes
exce
ssiv
ely
in
rela
tion
to
fund
amen
tal
earn
ings
gro
wth
pro
spec
ts,
the
com
pany
ap
pear
s no
t to
real
ize
its g
row
th p
oten
tial,
or th
ere
wer
e m
ore
attra
ctiv
e op
portu
nitie
s el
sew
here
.
UB
S Fi
nanc
ial S
ervi
ces I
nc.
Dat
a V
erifi
catio
n. U
nles
s oth
erw
ise
stat
ed, t
he in
vest
men
t des
crip
tion,
firm
bac
kgro
und
and
key
pers
onne
l con
tain
ed in
this
AC
CES
S M
anag
er p
rofil
e ar
e ba
sed
on d
ata
rece
ived
from
th
e M
anag
er a
nd o
ther
sour
ces a
s of J
une
30, 2
008
and
have
not
bee
n ve
rifie
d by
UB
S Fi
nanc
ial S
ervi
ces I
nc.

B-30
RISK/RETURN BAR CHART The bar chart and table shown below provide an indication of the risks of investing in the Fund. The bar chart shows changes in the Portfolio’s performance for Class A units for each complete calendar year since the Portfolio’s inception. Sales charges are not reflected in the bar chart. If these amounts were reflected, returns would be less than those shown. The table compares the average annual total returns for each class of the Portfolio’s units with those of the Large Cap Growth Blended Index and Russell 1000® Growth Index, each a broad measure of market performance. How the Portfolio performed in the past is not necessarily an indication of how the Portfolio will perform in the future.
Large Cap Growth 1
0.18% 0.18%
7.63%
0.0%
2.0%
4.0%
6.0%
8.0%
10.0%
2005 2006 2007
During the period shown in the bar chart, the highest return for a quarter was 3.90% (quarter ended on 6/30/07) and the lowest return for a quarter was -0.08% (quarter ended on 12/31/07). Average annual total returns for all classes of units are shown below for the full calendar year ended December 31, 2007 and since inception. Average Annual Returns* (for the periods ended December 31, 2007) One Year Life of Fund†Large Cap Growth I - Class A 7.63% 5.66%Large Cap Growth I - Class C 7.11% 5.09%Large Cap Growth I - Class L 7.62% 5.36%Large Cap Growth Blended Index** 5.00% 4.30% ††Russell 1000® Growth Index*** 11.81% 8.43% ††
* Includes all applicable fees and sales charges.
** The Large Cap Growth Blended Index is composed of 80% in the Russell 1000 Growth® Index, 10% in the GDB Puerto Rico Stock® Index, 5% in the Lehman Brothers Intermediate Government® Index, and 5% in the 90-Day U.S. Treasury Bills. Performance of the index does not reflect the deduction of fees, expenses or taxes. Past performance is not predictive of future performance.
*** The Russell 1000® Growth Index is an unmanaged index that contains those Russell 1000 securities with a greater-than-average growth orientation. Securities in this index tend to exhibit higher price-to-book and price-earnings ratios and higher forecasted growth values than the value universe. Performance of the index does not reflect the deduction of fees, expenses or taxes. Past performance is not predictive of future performance.
† Inception date for Class A, C, and L Units is 6/30/2004 †† Since 6/30/2004.
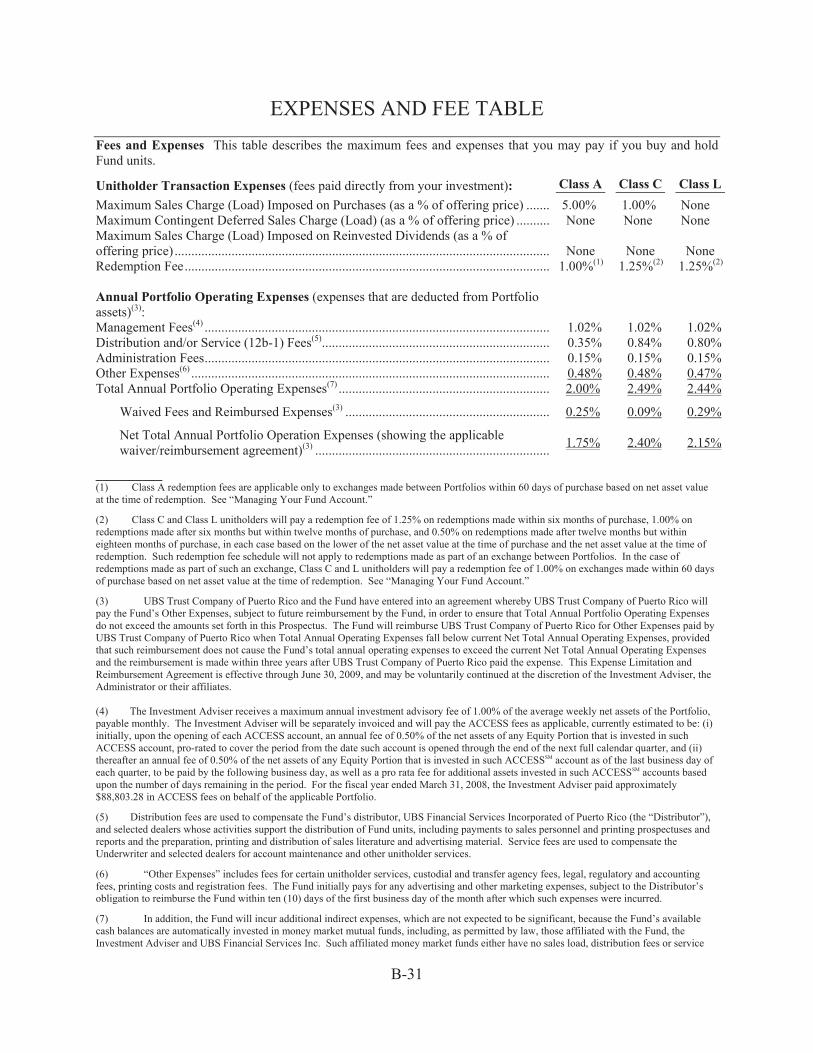
B-31
EXPENSES AND FEE TABLE Fees and Expenses This table describes the maximum fees and expenses that you may pay if you buy and hold Fund units.
Unitholder Transaction Expenses (fees paid directly from your investment): Class A Class C Class L Maximum Sales Charge (Load) Imposed on Purchases (as a % of offering price) ........ 5.00% 1.00% None Maximum Contingent Deferred Sales Charge (Load) (as a % of offering price) ........... None None None Maximum Sales Charge (Load) Imposed on Reinvested Dividends (as a % of offering price) ................................................................................................................. None None None Redemption Fee .............................................................................................................. 1.00%(1) 1.25%(2) 1.25%(2) Annual Portfolio Operating Expenses (expenses that are deducted from Portfolio assets)(3):
Management Fees(4) ....................................................................................................... 1.02% 1.02% 1.02% Distribution and/or Service (12b-1) Fees(5) .................................................................... 0.35% 0.84% 0.80% Administration Fees ....................................................................................................... 0.15% 0.15% 0.15% Other Expenses(6) ........................................................................................................... 0.48% 0.48% 0.47% Total Annual Portfolio Operating Expenses(7) ............................................................... 2.00% 2.49% 2.44%
Waived Fees and Reimbursed Expenses(3) ............................................................. 0.25% 0.09% 0.29%
Net Total Annual Portfolio Operation Expenses (showing the applicable waiver/reimbursement agreement)(3) ...................................................................... 1.75% 2.40% 2.15%
__________ (1) Class A redemption fees are applicable only to exchanges made between Portfolios within 60 days of purchase based on net asset value at the time of redemption. See “Managing Your Fund Account.”
(2) Class C and Class L unitholders will pay a redemption fee of 1.25% on redemptions made within six months of purchase, 1.00% on redemptions made after six months but within twelve months of purchase, and 0.50% on redemptions made after twelve months but within eighteen months of purchase, in each case based on the lower of the net asset value at the time of purchase and the net asset value at the time of redemption. Such redemption fee schedule will not apply to redemptions made as part of an exchange between Portfolios. In the case of redemptions made as part of such an exchange, Class C and L unitholders will pay a redemption fee of 1.00% on exchanges made within 60 days of purchase based on net asset value at the time of redemption. See “Managing Your Fund Account.”
(3) UBS Trust Company of Puerto Rico and the Fund have entered into an agreement whereby UBS Trust Company of Puerto Rico will pay the Fund’s Other Expenses, subject to future reimbursement by the Fund, in order to ensure that Total Annual Portfolio Operating Expenses do not exceed the amounts set forth in this Prospectus. The Fund will reimburse UBS Trust Company of Puerto Rico for Other Expenses paid by UBS Trust Company of Puerto Rico when Total Annual Operating Expenses fall below current Net Total Annual Operating Expenses, provided that such reimbursement does not cause the Fund’s total annual operating expenses to exceed the current Net Total Annual Operating Expenses and the reimbursement is made within three years after UBS Trust Company of Puerto Rico paid the expense. This Expense Limitation and Reimbursement Agreement is effective through June 30, 2009, and may be voluntarily continued at the discretion of the Investment Adviser, the Administrator or their affiliates. (4) The Investment Adviser receives a maximum annual investment advisory fee of 1.00% of the average weekly net assets of the Portfolio, payable monthly. The Investment Adviser will be separately invoiced and will pay the ACCESS fees as applicable, currently estimated to be: (i) initially, upon the opening of each ACCESS account, an annual fee of 0.50% of the net assets of any Equity Portion that is invested in such ACCESS account, pro-rated to cover the period from the date such account is opened through the end of the next full calendar quarter, and (ii) thereafter an annual fee of 0.50% of the net assets of any Equity Portion that is invested in such ACCESSSM account as of the last business day of each quarter, to be paid by the following business day, as well as a pro rata fee for additional assets invested in such ACCESSSM accounts based upon the number of days remaining in the period. For the fiscal year ended March 31, 2008, the Investment Adviser paid approximately $88,803.28 in ACCESS fees on behalf of the applicable Portfolio.
(5) Distribution fees are used to compensate the Fund’s distributor, UBS Financial Services Incorporated of Puerto Rico (the “Distributor”), and selected dealers whose activities support the distribution of Fund units, including payments to sales personnel and printing prospectuses and reports and the preparation, printing and distribution of sales literature and advertising material. Service fees are used to compensate the Underwriter and selected dealers for account maintenance and other unitholder services.
(6) “Other Expenses” includes fees for certain unitholder services, custodial and transfer agency fees, legal, regulatory and accounting fees, printing costs and registration fees. The Fund initially pays for any advertising and other marketing expenses, subject to the Distributor’s obligation to reimburse the Fund within ten (10) days of the first business day of the month after which such expenses were incurred.
(7) In addition, the Fund will incur additional indirect expenses, which are not expected to be significant, because the Fund’s available cash balances are automatically invested in money market mutual funds, including, as permitted by law, those affiliated with the Fund, the Investment Adviser and UBS Financial Services Inc. Such affiliated money market funds either have no sales load, distribution fees or service

B-32
fees or the Investment Adviser will waive a sufficient amount of its advisory fee to offset the cost of such fees. However, such affiliated money market funds will incur administration and management fees and have other expenses, which will therefore be partially indirectly borne by the Fund, and as a result by its unitholders, in addition to the fees charged to unitholders by the Fund.
Class A, Class C and Class L units are subject to an ongoing annual distribution fee of 0.10%, 0.75% and 0.50%, respectively, of the average weekly net assets of that class. Class A, Class C and Class L units are subject to an ongoing annual service fee of 0.25% of the average weekly net assets of that class. As a result, long-term Fund unitholders may pay more than the economic equivalent of the maximum front-end sales charge permitted by the Financial Industry Regulatory Authority (“FINRA”) for investment companies registered under the 1940 Act. The Fund will not, however, permit aggregate sales charges (including distribution fees) to exceed the maximum sales charge limits applicable under the FINRA rules.
The sales charges set forth in the above table are the maximum charges imposed on purchases or redemptions (including exchanges) of units and unitholders may actually pay lower charges, depending on the amount purchased, the amount of time held or certain other factors. Investors should inquire as to the availability of these lower “breakpoint” charges prior to making an investment.
Example
The following example is intended to assist you in understanding the various costs that you, as a unitholder of this Portfolio, will bear directly or indirectly and to help you compare the cost of investing in this Portfolio with the cost of investing in other mutual funds. The example assumes payment by the Portfolio of operating expenses at the levels set forth in the tables above with an adjustment to reflect reduced annual expenses resulting from completion of the amortization of initial organization expenses and offering costs. Although your actual costs may be higher or lower, based on the assumptions stated below, your costs would be as follows:
Portfolio 1 Year 3 Years* 5 Years* 10 Years* You would pay the following expenses on a $1,000 investment, assuming (1) a 5.00% annual return and (2) redemption at the end of each time period:
Class A $67 $107 $150 $269 Class C $44 $86 $140 $289 Class L $32 $73 $127 $275
You would pay the following expenses on the same investment, assuming the same annual return and no redemption:
Class A $67 $107 $150 $269 Class C $34 $86 $140 $289 Class L $22 $73 $127 $275
* The expense amounts shown do not reflect the continuation of the waiver of fees and expenses beyond the first year. As stated in note (3) to the Fees and Expenses table above, the Expense Limitation and Reimbursement Agreement may be changed or terminated at any time after June 30, 2009. If the waivers are voluntarily continued by the Investment Adviser or the Administrator, the expenses shown may be lower for the periods in which the waiver applies.
The examples also provide a means for you to compare expense levels of investment companies with different fee structures over varying investment periods. To facilitate such comparison the Fund has used a 5% annual return assumption. However, your actual annual return will vary and may be greater or less than 5%. These examples should not be considered a representation of past or future expenses and actual expenses may be greater or less than those shown above.
B-33
Multi-Select Securities Puerto Rico Fund—Large Cap Growth Portfolio II Investment Objective – The Portfolio’s investment objective is long-term growth of capital. No assurance
can be given that the Portfolio will achieve this investment objective.
Principal Investment Strategies – Under normal conditions, the Portfolio will invest up to 80% of its total assets in common stocks and other equity securities of U.S. companies (the “Equity Portion”). According to Puerto Rico law, the Portfolio also must invest at least 20% of its total assets in equity or taxable fixed-income securities issued by Puerto Rico entities (the “Puerto Rico Securities Portion”). This requirement may limit the Portfolio’s ability to achieve its investment objective.
Puerto Rico Securities Portion – The Portfolio will invest at least 20% of its total assets in equity or taxable fixed-income securities issued by Puerto Rico entities. The Fund’s Investment Adviser will manage this portion of the Portfolio directly.
Equity Portion – With regard to the Equity Portion of the Portfolio, the Fund intends to use a variation of what has been termed a “multi-manager” approach. The Fund has indirectly engaged different investment advisers (each a “Equity Portion Portfolio Manager”) for each Portfolio’s Equity Portion by opening accounts with ACCESSSM, a wrap fee advisory program offered by UBS Financial Services Inc., an affiliate of the Fund’s Investment Adviser. The following information profile describes the Equity Portion Portfolio Manager selected to manage the Equity Portion of the Portfolio, Ashfield Capital Partners, LLC, and the Equity Portion Portfolio Manager’s investment philosophy and process.
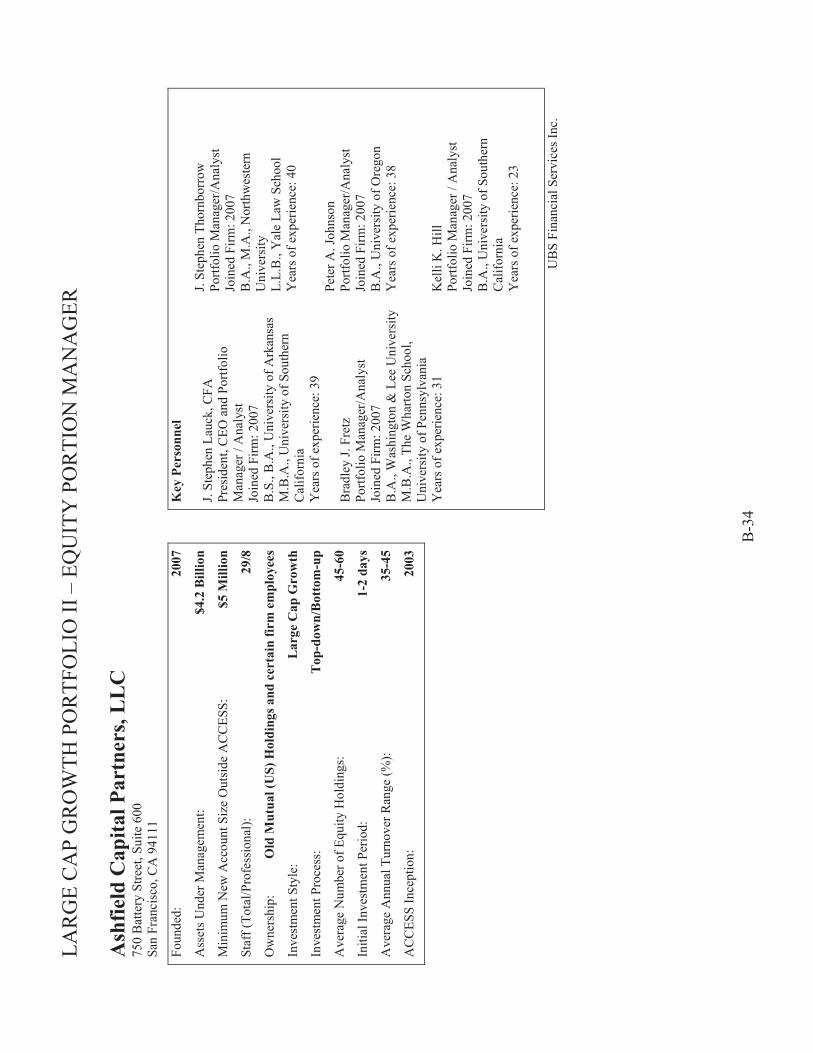
LAR
GE
CA
P G
RO
WTH
PO
RTF
OLI
O II
– E
QU
ITY
PO
RTI
ON
MA
NA
GER
B
-34
Ash
field
Cap
ital P
artn
ers,
LL
C
750
Bat
tery
Stre
et, S
uite
600
Sa
n Fr
anci
sco,
CA
941
11
Foun
ded:
20
07
Ass
ets U
nder
Man
agem
ent:
$4
.2 B
illio
n
Min
imum
New
Acc
ount
Siz
e O
utsi
de A
CC
ESS:
$5
Mill
ion
Staf
f (To
tal/P
rofe
ssio
nal):
29
/8
Ow
ners
hip:
O
ld M
utua
l (U
S) H
oldi
ngs a
nd c
erta
in fi
rm e
mpl
oyee
s
Inve
stm
ent S
tyle
: L
arge
Cap
Gro
wth
Inve
stm
ent P
roce
ss:
Top
-dow
n/B
otto
m-u
p
Ave
rage
Num
ber o
f Equ
ity H
oldi
ngs:
45
-60
Initi
al In
vest
men
t Per
iod:
1-
2 da
ys
Ave
rage
Ann
ual T
urno
ver R
ange
(%):
35
-45
AC
CES
S In
cept
ion:
20
03
Key
Per
sonn
el
J. St
ephe
n La
uck,
CFA
Pr
esid
ent,
CEO
and
Por
tfolio
M
anag
er /
Ana
lyst
Jo
ined
Firm
: 200
7 B
.S.,
B.A
., U
nive
rsity
of A
rkan
sas
M.B
.A.,
Uni
vers
ity o
f Sou
ther
n C
alifo
rnia
Y
ears
of e
xper
ienc
e: 3
9 B
radl
ey J.
Fre
tz
Portf
olio
Man
ager
/Ana
lyst
Jo
ined
Firm
: 200
7 B
.A.,
Was
hing
ton
& L
ee U
nive
rsity
M
.B.A
., Th
e W
harto
n Sc
hool
, U
nive
rsity
of P
enns
ylva
nia
Yea
rs o
f exp
erie
nce:
31
J. St
ephe
n Th
ornb
orro
w
Portf
olio
Man
ager
/Ana
lyst
Jo
ined
Firm
: 200
7 B
.A.,
M.A
., N
orth
wes
tern
U
nive
rsity
L.
L.B
., Y
ale
Law
Sch
ool
Yea
rs o
f exp
erie
nce:
40
Pete
r A. J
ohns
on
Portf
olio
Man
ager
/Ana
lyst
Jo
ined
Firm
: 200
7 B
.A.,
Uni
vers
ity o
f Ore
gon
Yea
rs o
f exp
erie
nce:
38
Kel
li K
. Hill
Po
rtfol
io M
anag
er /
Ana
lyst
Jo
ined
Firm
: 200
7 B
.A.,
Uni
vers
ity o
f Sou
ther
n C
alifo
rnia
Y
ears
of e
xper
ienc
e: 2
3
UB
S Fi
nanc
ial S
ervi
ces I
nc.
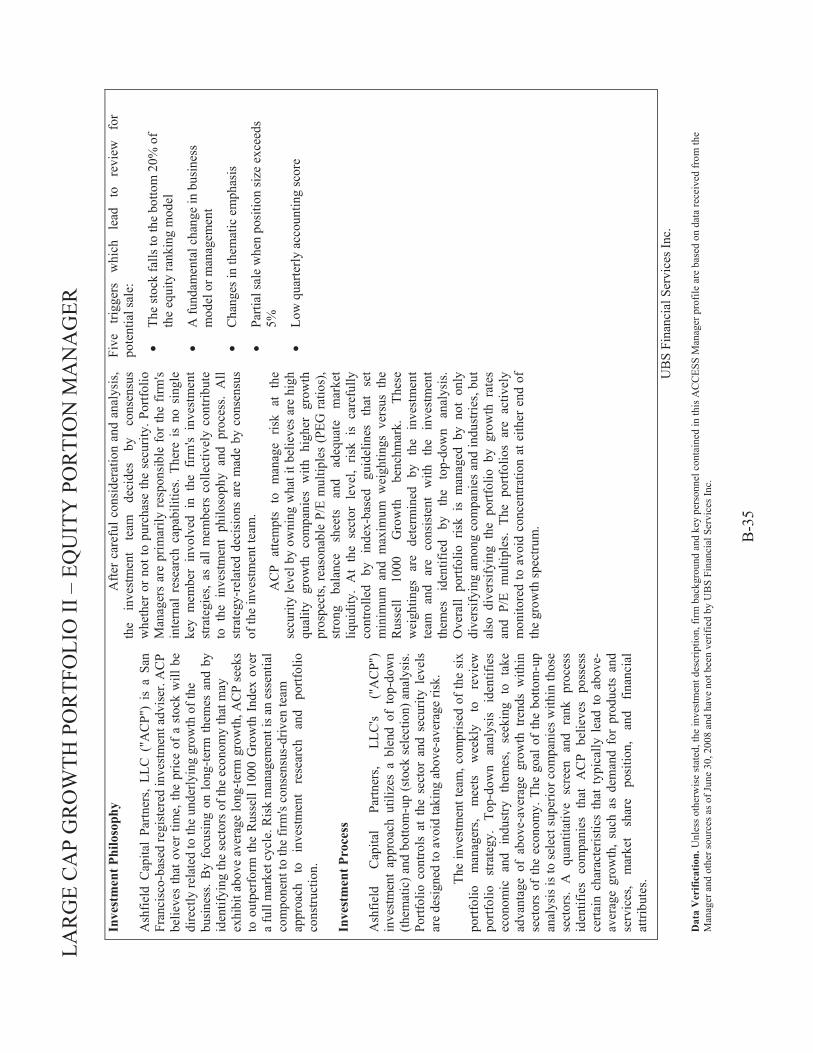
LAR
GE
CA
P G
RO
WTH
PO
RTF
OLI
O II
– E
QU
ITY
PO
RTI
ON
MA
NA
GER
B
-35
Inve
stm
ent P
hilo
soph
y
Ash
field
Cap
ital
Partn
ers,
LLC
("A
CP"
) is
a S
an
Fran
cisc
o-ba
sed
regi
ster
ed in
vest
men
t adv
iser
. AC
Pbe
lieve
s th
at o
ver
time,
the
pric
e of
a s
tock
will
be
dire
ctly
rela
ted
to th
e un
derly
ing
grow
th o
f the
bu
sine
ss. B
y fo
cusi
ng o
n lo
ng-te
rm th
emes
and
by
iden
tifyi
ng th
e se
ctor
s of t
he e
cono
my
that
may
ex
hibi
t abo
ve a
vera
ge lo
ng-te
rm g
row
th, A
CP
seek
s to
out
perf
orm
the
Rus
sell
1000
Gro
wth
Ind
ex o
ver
a fu
ll m
arke
t cyc
le. R
isk
man
agem
ent i
s an
esse
ntia
l co
mpo
nent
to th
e fir
m's
cons
ensu
s-dr
iven
team
ap
proa
ch
to
inve
stm
ent
rese
arch
an
d po
rtfol
io
cons
truct
ion.
In
vest
men
t Pro
cess
Ash
field
C
apita
l Pa
rtner
s, LL
C's
("A
CP"
) in
vest
men
t ap
proa
ch u
tiliz
es a
ble
nd o
f to
p-do
wn
(them
atic
) and
bot
tom
-up
(sto
ck s
elec
tion)
ana
lysi
s. Po
rtfol
io c
ontro
ls a
t th
e se
ctor
and
sec
urity
lev
els
are
desi
gned
to a
void
taki
ng a
bove
-ave
rage
risk
.
The
inve
stm
ent t
eam
, com
pris
ed o
f the
six
po
rtfol
io
man
ager
s, m
eets
w
eekl
y to
re
view
po
rtfol
io
stra
tegy
. To
p-do
wn
anal
ysis
id
entif
ies
econ
omic
and
ind
ustry
the
mes
, se
ekin
g to
tak
e ad
vant
age
of a
bove
-ave
rage
gro
wth
tre
nds
with
in
sect
ors
of th
e ec
onom
y. T
he g
oal o
f th
e bo
ttom
-up
anal
ysis
is to
sele
ct su
perio
r com
pani
es w
ithin
thos
e se
ctor
s. A
qua
ntita
tive
scre
en a
nd r
ank
proc
ess
iden
tifie
s co
mpa
nies
tha
t A
CP
belie
ves
poss
ess
certa
in c
hara
cter
istic
s th
at t
ypic
ally
lea
d to
abo
ve-
aver
age
grow
th,
such
as
dem
and
for
prod
ucts
and
se
rvic
es,
mar
ket
shar
e po
sitio
n,
and
finan
cial
at
tribu
tes.
Afte
r car
eful
con
side
ratio
n an
d an
alys
is,
the
inve
stm
ent
team
de
cide
s by
co
nsen
sus
whe
ther
or n
ot to
pur
chas
e th
e se
curit
y. P
ortfo
lio
Man
ager
s ar
e pr
imar
ily r
espo
nsib
le fo
r th
e fir
m's
inte
rnal
res
earc
h ca
pabi
litie
s. Th
ere
is n
o si
ngle
ke
y m
embe
r in
volv
ed i
n th
e fir
m's
inve
stm
ent
stra
tegi
es, a
s al
l mem
bers
col
lect
ivel
y co
ntrib
ute
to t
he i
nves
tmen
t ph
iloso
phy
and
proc
ess.
All
stra
tegy
-rel
ated
dec
isio
ns a
re m
ade
by c
onse
nsus
of
the
inve
stm
ent t
eam
.
AC
P at
tem
pts
to m
anag
e ris
k at
the
se
curit
y le
vel b
y ow
ning
wha
t it b
elie
ves
are
high
qu
ality
gro
wth
com
pani
es w
ith h
ighe
r gr
owth
pr
ospe
cts,
reas
onab
le P
/E m
ultip
les
(PEG
ratio
s),
stro
ng
bala
nce
shee
ts
and
adeq
uate
m
arke
t liq
uidi
ty.
At
the
sect
or l
evel
, ris
k is
car
eful
ly
cont
rolle
d by
in
dex-
base
d gu
idel
ines
th
at
set
min
imum
and
max
imum
wei
ghtin
gs v
ersu
s th
e R
usse
ll 10
00
Gro
wth
be
nchm
ark.
Th
ese
wei
ghtin
gs
are
dete
rmin
ed
by
the
inve
stm
ent
team
an
d ar
e co
nsis
tent
w
ith
the
inve
stm
ent
them
es
iden
tifie
d by
th
e to
p-do
wn
anal
ysis
. O
vera
ll po
rtfol
io r
isk
is m
anag
ed b
y no
t on
ly
dive
rsify
ing
amon
g co
mpa
nies
and
indu
strie
s, bu
t al
so d
iver
sify
ing
the
portf
olio
by
grow
th r
ates
an
d P/
E m
ultip
les.
The
portf
olio
s ar
e ac
tivel
y m
onito
red
to a
void
con
cent
ratio
n at
eith
er e
nd o
f th
e gr
owth
spec
trum
.
Five
tri
gger
s w
hich
le
ad
to
revi
ew
for
pote
ntia
l sal
e:
• Th
e st
ock
falls
to th
e bo
ttom
20%
of
the
equi
ty ra
nkin
g m
odel
• A
fund
amen
tal c
hang
e in
bus
ines
s m
odel
or m
anag
emen
t
• C
hang
es in
them
atic
em
phas
is
• Pa
rtial
sale
whe
n po
sitio
n si
ze e
xcee
ds
5%
• Lo
w q
uarte
rly a
ccou
ntin
g sc
ore
UB
S Fi
nanc
ial S
ervi
ces I
nc.
Dat
a V
erifi
catio
n. U
nles
s oth
erw
ise
stat
ed, t
he in
vest
men
t des
crip
tion,
firm
bac
kgro
und
and
key
pers
onne
l con
tain
ed in
this
AC
CES
S M
anag
er p
rofil
e ar
e ba
sed
on d
ata
rece
ived
from
the
Man
ager
and
oth
er so
urce
s as o
f Jun
e 30
, 200
8 an
d ha
ve n
ot b
een
verif
ied
by U
BS
Fina
ncia
l Ser
vice
s Inc
.
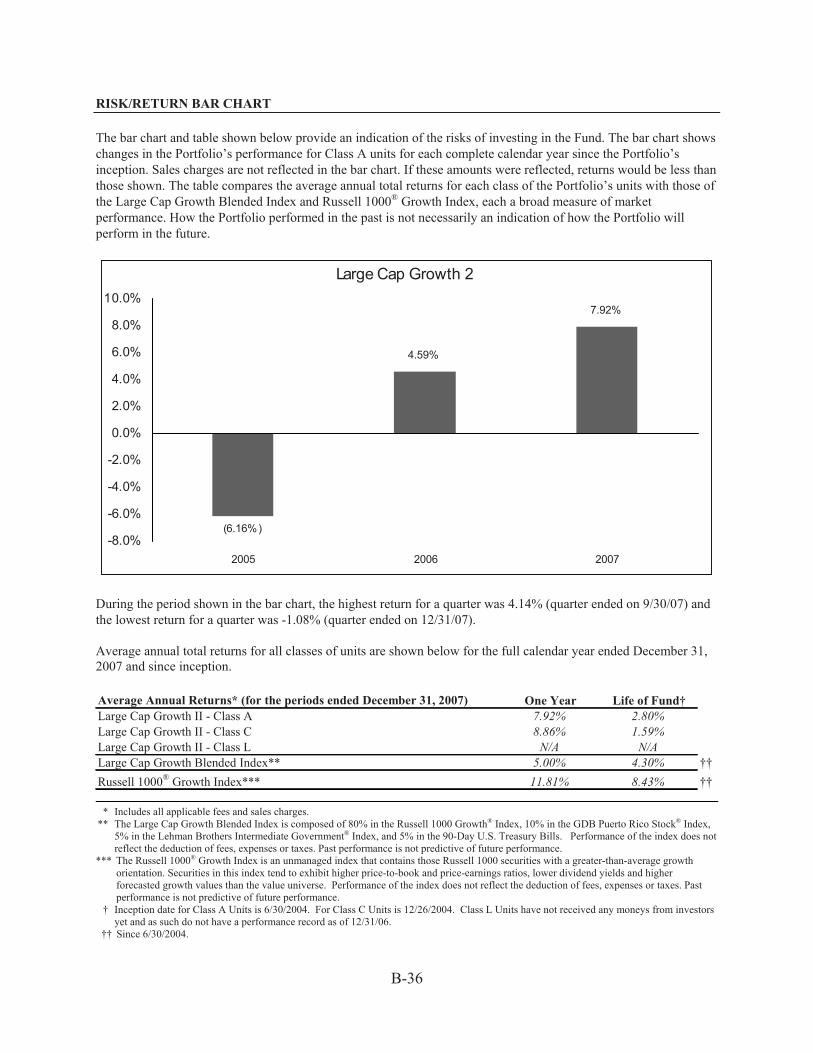
B-36
RISK/RETURN BAR CHART The bar chart and table shown below provide an indication of the risks of investing in the Fund. The bar chart shows changes in the Portfolio’s performance for Class A units for each complete calendar year since the Portfolio’s inception. Sales charges are not reflected in the bar chart. If these amounts were reflected, returns would be less than those shown. The table compares the average annual total returns for each class of the Portfolio’s units with those of the Large Cap Growth Blended Index and Russell 1000® Growth Index, each a broad measure of market performance. How the Portfolio performed in the past is not necessarily an indication of how the Portfolio will perform in the future.
Large Cap Growth 2
(6.16%)
4.59%
7.92%
-8.0%
-6.0%
-4.0%
-2.0%
0.0%
2.0%
4.0%
6.0%
8.0%
10.0%
2005 2006 2007
During the period shown in the bar chart, the highest return for a quarter was 4.14% (quarter ended on 9/30/07) and the lowest return for a quarter was -1.08% (quarter ended on 12/31/07). Average annual total returns for all classes of units are shown below for the full calendar year ended December 31, 2007 and since inception. Average Annual Returns* (for the periods ended December 31, 2007) One Year Life of Fund†Large Cap Growth II - Class A 7.92% 2.80%Large Cap Growth II - Class C 8.86% 1.59%Large Cap Growth II - Class L N/A N/ALarge Cap Growth Blended Index** 5.00% 4.30% ††Russell 1000® Growth Index*** 11.81% 8.43% ††
* Includes all applicable fees and sales charges.
** The Large Cap Growth Blended Index is composed of 80% in the Russell 1000 Growth® Index, 10% in the GDB Puerto Rico Stock® Index, 5% in the Lehman Brothers Intermediate Government® Index, and 5% in the 90-Day U.S. Treasury Bills. Performance of the index does not reflect the deduction of fees, expenses or taxes. Past performance is not predictive of future performance.
*** The Russell 1000® Growth Index is an unmanaged index that contains those Russell 1000 securities with a greater-than-average growth orientation. Securities in this index tend to exhibit higher price-to-book and price-earnings ratios, lower dividend yields and higher forecasted growth values than the value universe. Performance of the index does not reflect the deduction of fees, expenses or taxes. Past performance is not predictive of future performance.
† Inception date for Class A Units is 6/30/2004. For Class C Units is 12/26/2004. Class L Units have not received any moneys from investors yet and as such do not have a performance record as of 12/31/06.
†† Since 6/30/2004.

B-37
EXPENSES AND FEE TABLE Fees and Expenses This table describes the maximum fees and expenses that you may pay if you buy and hold Fund units.
Unitholder Transaction Expenses (fees paid directly from your investment): Class A Class C Class L*
Maximum Sales Charge (Load) Imposed on Purchases (as a % of offering price) ........ 5.00% 1.00% None Maximum Contingent Deferred Sales Charge (Load) (as a % of offering price) ........... None None None Maximum Sales Charge (Load) Imposed on Reinvested Dividends (as a % of offering price) ................................................................................................................. None None None Redemption Fee .............................................................................................................. 1.00%(1) 1.25%(2) 1.25%(2) Annual Portfolio Operating Expenses (expenses that are deducted from Portfolio assets)(3):
Management Fees(4) ....................................................................................................... 1.02% 1.02% N/A Distribution and/or Service (12b-1) Fees(5) .................................................................... 0.35% 0.90% N/A Administration Fees ....................................................................................................... 0.15% 0.15% N/A Other Expenses(6) ........................................................................................................... 2.21% 2.04% N/A Total Annual Portfolio Operating Expenses(7) ............................................................... 3.72% 4.11% N/A
Waived Fees and Reimbursed Expenses(3) ............................................................. 1.97% 1.71% N/A
Net Total Annual Portfolio Operation Expenses (showing the applicable waiver/reimbursement agreement)(3) ...................................................................... 1.75% 2.40% N/A
__________ * Class L units of the Large Cap Growth Portfolio II have not received moneys as of March 31, 2008. Therefore the relevant expense information is omitted.
(1) Class A redemption fees are applicable only to exchanges made between Portfolios within 60 days of purchase based on net asset value at the time of redemption. See “Managing Your Fund Account.”
(2) Class C and Class L unitholders will pay a redemption fee of 1.25% on redemptions made within six months of purchase, 1.00% on redemptions made after six months but within twelve months of purchase, and 0.50% on redemptions made after twelve months but within eighteen months of purchase, in each case based on the lower of the net asset value at the time of purchase and the net asset value at the time of redemption. Such redemption fee schedule will not apply to redemptions made as part of an exchange between Portfolios. In the case of redemptions made as part of such an exchange, Class C and L unitholders will pay a redemption fee of 1.00% on exchanges made within 60 days of purchase based on net asset value at the time of redemption. See “Managing Your Fund Account.”
(3) UBS Trust Company of Puerto Rico and the Fund have entered into an agreement whereby UBS Trust Company of Puerto Rico will pay the Fund’s Other Expenses, subject to future reimbursement by the Fund, in order to ensure that Total Annual Portfolio Operating Expenses do not exceed the amounts set forth in this Prospectus. The Fund will reimburse UBS Trust Company of Puerto Rico for Other Expenses paid by UBS Trust Company of Puerto Rico when Total Annual Operating Expenses fall below current Net Total Annual Operating Expenses, provided that such reimbursement does not cause the Fund’s total annual operating expenses to exceed the current Net Total Annual Operating Expenses and the reimbursement is made within three years after UBS Trust Company of Puerto Rico paid the expense. This Expense Limitation and Reimbursement Agreement is effective through June 30, 2009, and may be voluntarily continued at the discretion of the Investment Adviser, the Administrator or their affiliates. (4) The Investment Adviser receives a maximum annual investment advisory fee of 1.00% of the average weekly net assets of the Portfolio, payable monthly. The Investment Adviser will be separately invoiced and will pay the ACCESS fees as applicable, currently estimated to be: (i) initially, upon the opening of each ACCESS account, an annual fee of 0.50% of the net assets of any Equity Portion that is invested in such ACCESS account, pro-rated to cover the period from the date such account is opened through the end of the next full calendar quarter, and (ii) thereafter an annual fee of 0.50% of the net assets of any Equity Portion that is invested in such ACCESSSM account as of the last business day of each quarter, to be paid by the following business day, as well as a pro rata fee for additional assets invested in such ACCESSSM accounts based upon the number of days remaining in the period. For the fiscal year ended March 31, 2008, the Investment Adviser paid approximately $3,128.60 in ACCESS fees on behalf of the applicable Portfolio.
(5) Distribution fees are used to compensate the Fund’s distributor, UBS Financial Services Incorporated of Puerto Rico (the “Distributor”), and selected dealers whose activities support the distribution of Fund units, including payments to sales personnel and printing prospectuses and reports and the preparation, printing and distribution of sales literature and advertising material. Service fees are used to compensate the Underwriter and selected dealers for account maintenance and other unitholder services.
(6) “Other Expenses” includes fees for certain unitholder services, custodial and transfer agency fees, legal, regulatory and accounting fees, printing costs and registration fees. The Fund initially pays for any advertising and other marketing expenses, subject to the Distributor’s obligation to reimburse the Fund within ten (10) days of the first business day of the month after which such expenses were incurred.

B-38
(7) In addition, the Fund will incur additional indirect expenses, which are not expected to be significant, because the Fund’s available cash balances are automatically invested in money market mutual funds, including, as permitted by law, those affiliated with the Fund, the Investment Adviser and UBS Financial Services Inc. Such affiliated money market funds either have no sales load, distribution fees or service fees or the Investment Adviser will waive a sufficient amount of its advisory fee to offset the cost of such fees. However, such affiliated money market funds will incur administration and management fees and have other expenses, which will therefore be partially indirectly borne by the Fund, and as a result by its unitholders, in addition to the fees charged to unitholders by the Fund.
Class A, Class C and Class L units are subject to an ongoing annual distribution fee of 0.10%, 0.75% and 0.50%, respectively, of the average weekly net assets of that class. Class A, Class C and Class L units are subject to an ongoing annual service fee of 0.25% of the average weekly net assets of that class. As a result, long-term Fund unitholders may pay more than the economic equivalent of the maximum front-end sales charge permitted by the Financial Industry Regulatory Authority (“FINRA”) for investment companies registered under the 1940 Act. The Fund will not, however, permit aggregate sales charges (including distribution fees) to exceed the maximum sales charge limits applicable under the FINRA rules.
The sales charges set forth in the above table are the maximum charges imposed on purchases or redemptions (including exchanges) of units and unitholders may actually pay lower charges, depending on the amount purchased, the amount of time held or certain other factors. Investors should inquire as to the availability of these lower “breakpoint” charges prior to making an investment. Example
The following example is intended to assist you in understanding the various costs that you, as a unitholder of this Portfolio, will bear directly or indirectly and to help you compare the cost of investing in this Portfolio with the cost of investing in other mutual funds. The example assumes payment by the Portfolio of operating expenses at the levels set forth in the tables above with an adjustment to reflect reduced annual expenses resulting from completion of the amortization of initial organization expenses and offering costs. Although your actual costs may be higher or lower, based on the assumptions stated below, your costs would be as follows:
Portfolio 1 Year 3 Years* 5 Years* 10 Years* You would pay the following expenses on a $1,000 investment, assuming (1) a 5.00% annual return and (2) redemption at the end of each time period:
Class A $67 $141 $217 $415 Class C $44 $118 $204 $425 Class L (Estimate) $32 $67 $115 $248 You would pay the following expenses on the same investment, assuming the same annual return and no redemption:
Class A $67 $141 $217 $415 Class C $34 $118 $204 $425 Class L (Estimate) $22 $67 $115 $248 * The expense amounts shown do not reflect the continuation of the waiver of fees and expenses beyond the first year. As stated in note (3) to the Fees and Expenses table above, the Expense Limitation and Reimbursement Agreement may be changed or terminated at any time after June 30, 2009. If the waivers are voluntarily continued by the Investment Adviser or the Administrator, the expenses shown may be lower for the periods in which the waiver applies. The examples also provide a means for you to compare expense levels of investment companies with different fee structures over varying investment periods. To facilitate such comparison the Fund has used a 5% annual return assumption. However, your actual annual return will vary and may be greater or less than 5%. These examples should not be considered a representation of past or future expenses and actual expenses may be greater or less than those shown above.

B-39
Multi-Select Securities Puerto Rico Fund—Mid Cap Core Portfolio I
Investment Objective – The Portfolio’s investment objective is long-term growth of capital. No assurance can be given that the Portfolio will achieve this investment objective.
Principal Investment Strategies – Under normal conditions, the Portfolio will invest up to 80% of its total assets in common stocks and other equity securities of U.S. companies (the “Equity Portion”). According to Puerto Rico law, the Portfolio also must invest at least 20% of its total assets in equity or taxable fixed-income securities issued by Puerto Rico entities (the “Puerto Rico Securities Portion”). This requirement may limit the Portfolio’s ability to achieve its investment objective.
Puerto Rico Securities Portion – The Portfolio will invest at least 20% of its total assets in equity or taxable fixed-income securities issued by Puerto Rico entities. The Fund’s Investment Adviser will manage this portion of the Portfolio directly.
Equity Portion – With regard to the Equity Portion of the Portfolio, the Fund intends to use a variation of what has been termed a “multi-manager” approach. The Fund has indirectly engaged different investment advisers (each a “Equity Portion Portfolio Manager”) for each Portfolio’s Equity Portion by opening accounts with ACCESSSM, a wrap fee advisory program offered by UBS Financial Services Inc., an affiliate of the Fund’s Investment Adviser. The following information profile describes the Equity Portion Portfolio Manager selected to manage the Equity Portion of the Portfolio, Invesco AIM Private Asset Management, and the Equity Portion Portfolio Manager’s investment philosophy and process.
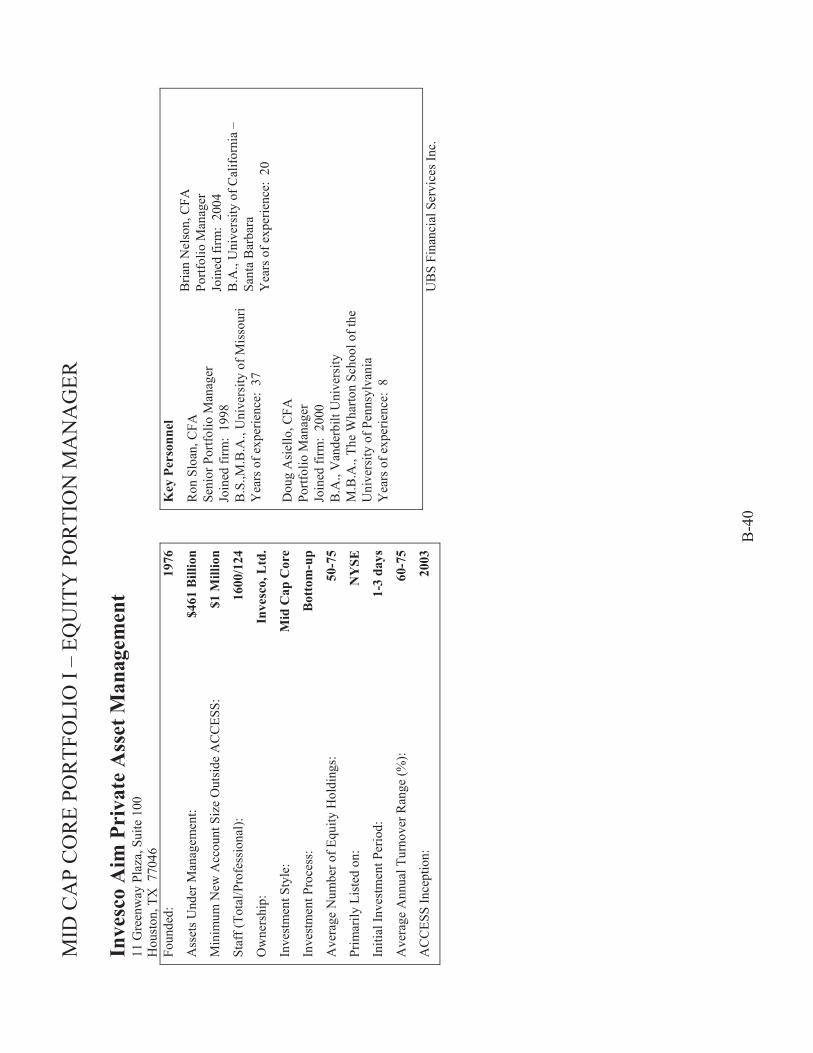
MID
CA
P C
OR
E PO
RTF
OLI
O I
– EQ
UIT
Y P
OR
TIO
N M
AN
AG
ER
B
-40
Inve
sco
Aim
Pri
vate
Ass
et M
anag
emen
t 11
Gre
enw
ay P
laza
, Sui
te 1
00
Hou
ston
, TX
770
46
Foun
ded:
19
76
Ass
ets U
nder
Man
agem
ent:
$461
Bill
ion
Min
imum
New
Acc
ount
Siz
e O
utsi
de A
CC
ESS:
$1
Mill
ion
Staf
f (To
tal/P
rofe
ssio
nal):
16
00/1
24
Ow
ners
hip:
In
vesc
o, L
td.
Inve
stm
ent S
tyle
: M
id C
ap C
ore
Inve
stm
ent P
roce
ss:
Bot
tom
-up
Ave
rage
Num
ber o
f Equ
ity H
oldi
ngs:
50
-75
Prim
arily
Lis
ted
on:
NY
SE
Initi
al In
vest
men
t Per
iod:
1-
3 da
ys
Ave
rage
Ann
ual T
urno
ver R
ange
(%):
60-7
5
AC
CES
S In
cept
ion:
20
03
Key
Per
sonn
el
Ron
Slo
an, C
FA
Seni
or P
ortfo
lio M
anag
er
Join
ed fi
rm:
1998
B
.S.,M
.B.A
., U
nive
rsity
of M
isso
uri
Yea
rs o
f exp
erie
nce:
37
Dou
g A
siel
lo, C
FA
Portf
olio
Man
ager
Jo
ined
firm
: 20
00
B.A
., V
ande
rbilt
Uni
vers
ity
M.B
.A.,
The
Wha
rton
Scho
ol o
f the
U
nive
rsity
of P
enns
ylva
nia
Yea
rs o
f exp
erie
nce:
8
Bria
n N
elso
n, C
FA
Portf
olio
Man
ager
Jo
ined
firm
: 20
04
B.A
., U
nive
rsity
of C
alifo
rnia
–
Sant
a B
arba
ra
Yea
rs o
f exp
erie
nce:
20
U
BS
Fina
ncia
l Ser
vice
s Inc
.
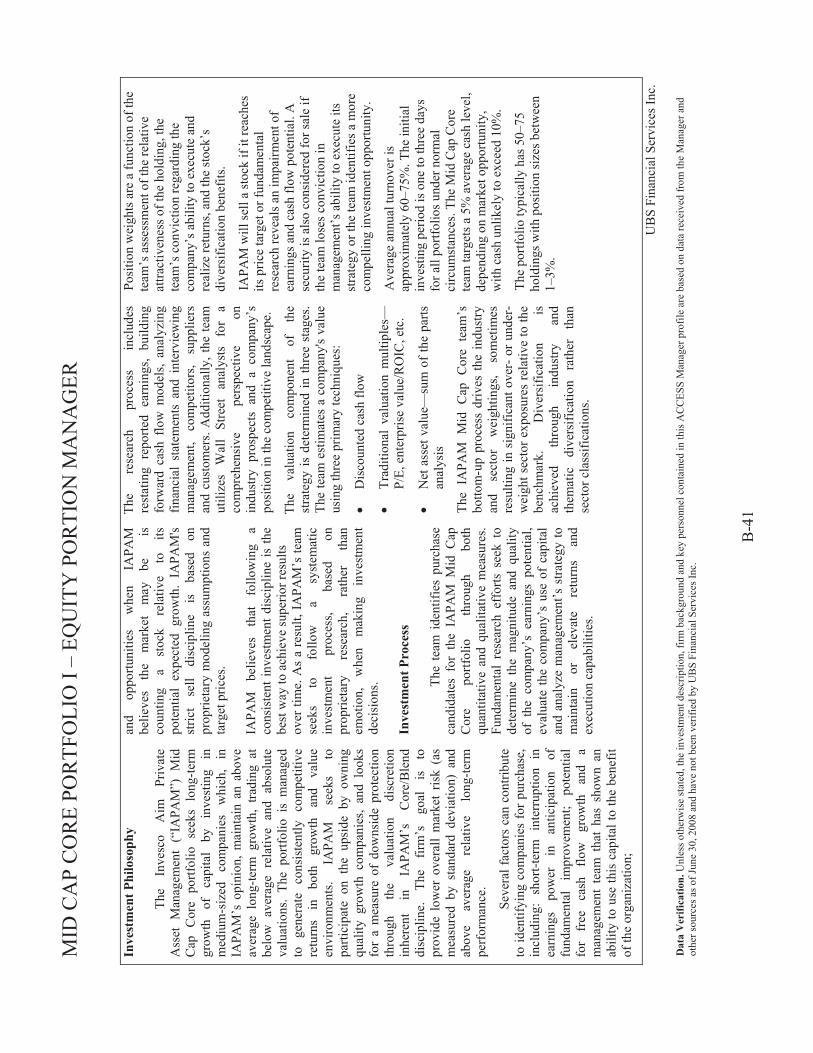
MID
CA
P C
OR
E PO
RTF
OLI
O I
– EQ
UIT
Y P
OR
TIO
N M
AN
AG
ER
B
-41
Inve
stm
ent P
hilo
soph
y
The
Inve
sco
Aim
Pr
ivat
e A
sset
Man
agem
ent
(“IA
PAM
”) M
id
Cap
Cor
e po
rtfol
io s
eeks
lon
g-te
rm
grow
th
of
capi
tal
by
inve
stin
g in
m
ediu
m-s
ized
co
mpa
nies
w
hich
, in
IA
PAM
’s o
pini
on, m
aint
ain
an a
bove
av
erag
e lo
ng-te
rm g
row
th,
tradi
ng a
t be
low
ave
rage
rel
ativ
e an
d ab
solu
te
valu
atio
ns.
The
portf
olio
is
man
aged
to
ge
nera
te
cons
iste
ntly
co
mpe
titiv
e re
turn
s in
bo
th
grow
th
and
valu
e en
viro
nmen
ts.
IAPA
M
seek
s to
pa
rtici
pate
on
the
upsi
de b
y ow
ning
qu
ality
gro
wth
com
pani
es,
and
look
s fo
r a
mea
sure
of
dow
nsid
e pr
otec
tion
thro
ugh
the
valu
atio
n di
scre
tion
inhe
rent
in
IA
PAM
’s
Cor
e/B
lend
di
scip
line.
Th
e fir
m’s
go
al
is
to
prov
ide
low
er o
vera
ll m
arke
t ris
k (a
s m
easu
red
by s
tand
ard
devi
atio
n) a
nd
abov
e av
erag
e re
lativ
e lo
ng-te
rm
perf
orm
ance
.
Seve
ral f
acto
rs c
an c
ontri
bute
to
iden
tifyi
ng c
ompa
nies
for p
urch
ase,
in
clud
ing:
sho
rt-te
rm i
nter
rupt
ion
in
earn
ings
po
wer
in
an
ticip
atio
n of
fu
ndam
enta
l im
prov
emen
t; po
tent
ial
for
free
ca
sh
flow
gr
owth
an
d a
man
agem
ent
team
tha
t ha
s sh
own
an
abili
ty to
use
this
cap
ital t
o th
e be
nefit
of
the
orga
niza
tion;
and
oppo
rtuni
ties
whe
n IA
PAM
be
lieve
s th
e m
arke
t m
ay
be
is
co
untin
g a
stoc
k re
lativ
e to
its
po
tent
ial
expe
cted
gro
wth
. IA
PAM
's st
rict
sell
disc
iplin
e is
ba
sed
on
prop
rieta
ry m
odel
ing
assu
mpt
ions
and
ta
rget
pric
es.
IAPA
M
belie
ves
that
fo
llow
ing
a co
nsis
tent
inve
stm
ent d
isci
plin
e is
the
best
way
to a
chie
ve su
perio
r res
ults
ov
er ti
me.
As
a re
sult,
IAPA
M’s
team
se
eks
to
follo
w
a sy
stem
atic
in
vest
men
t pr
oces
s, ba
sed
on
prop
rieta
ry
rese
arch
, ra
ther
th
an
emot
ion,
w
hen
mak
ing
inve
stm
ent
deci
sion
s. In
vest
men
t Pro
cess
The
team
ide
ntifi
es p
urch
ase
cand
idat
es f
or t
he I
APA
M M
id C
ap
Cor
e po
rtfol
io
thro
ugh
both
qu
antit
ativ
e an
d qu
alita
tive
mea
sure
s. Fu
ndam
enta
l re
sear
ch e
ffor
ts s
eek
to
dete
rmin
e th
e m
agni
tude
and
qua
lity
of t
he c
ompa
ny’s
ear
ning
s po
tent
ial,
eval
uate
the
com
pany
’s u
se o
f ca
pita
l an
d an
alyz
e m
anag
emen
t’s s
trate
gy to
m
aint
ain
or
elev
ate
retu
rns
and
exec
utio
n ca
pabi
litie
s.
The
rese
arch
pr
oces
s in
clud
es
rest
atin
g re
porte
d ea
rnin
gs,
build
ing
forw
ard
cash
flo
w m
odel
s, an
alyz
ing
finan
cial
sta
tem
ents
and
int
ervi
ewin
g m
anag
emen
t, co
mpe
titor
s, su
pplie
rs
and
cust
omer
s. A
dditi
onal
ly, t
he te
am
utili
zes
Wal
l St
reet
an
alys
ts
for
a co
mpr
ehen
sive
pe
rspe
ctiv
e on
in
dust
ry p
rosp
ects
and
a c
ompa
ny’s
po
sitio
n in
the
com
petit
ive
land
scap
e.
The
valu
atio
n co
mpo
nent
of
th
e st
rate
gy is
det
erm
ined
in th
ree
stag
es.
The
team
est
imat
es a
com
pany
's va
lue
usin
g th
ree
prim
ary
tech
niqu
es:
• D
isco
unte
d ca
sh fl
ow
• Tr
aditi
onal
val
uatio
n m
ultip
les—
P/E,
ent
erpr
ise
valu
e/R
OIC
, etc
.
• N
et a
sset
val
ue—
sum
of t
he p
arts
an
alys
is
The
IAPA
M M
id C
ap C
ore
team
’s
botto
m-u
p pr
oces
s dr
ives
the
indu
stry
an
d se
ctor
w
eigh
tings
, so
met
imes
re
sulti
ng in
sig
nific
ant o
ver-
or u
nder
-w
eigh
t sec
tor e
xpos
ures
rela
tive
to th
e be
nchm
ark.
D
iver
sific
atio
n is
ac
hiev
ed
thro
ugh
indu
stry
an
d th
emat
ic
dive
rsifi
catio
n ra
ther
th
an
sect
or c
lass
ifica
tions
.
Posi
tion
wei
ghts
are
a fu
nctio
n of
the
team
’s a
sses
smen
t of t
he re
lativ
e at
tract
iven
ess o
f the
hol
ding
, the
te
am’s
con
vict
ion
rega
rdin
g th
e co
mpa
ny’s
abi
lity
to e
xecu
te a
nd
real
ize
retu
rns,
and
the
stoc
k’s
dive
rsifi
catio
n be
nefit
s.
IAPA
M w
ill se
ll a
stoc
k if
it re
ache
s its
pric
e ta
rget
or f
unda
men
tal
rese
arch
reve
als a
n im
pairm
ent o
f ea
rnin
gs a
nd c
ash
flow
pot
entia
l. A
se
curit
y is
als
o co
nsid
ered
for s
ale
if th
e te
am lo
ses c
onvi
ctio
n in
m
anag
emen
t’s a
bilit
y to
exe
cute
its
stra
tegy
or t
he te
am id
entif
ies a
mor
e co
mpe
lling
inve
stm
ent o
ppor
tuni
ty.
Ave
rage
ann
ual t
urno
ver i
s ap
prox
imat
ely
60–7
5%. T
he in
itial
in
vest
ing
perio
d is
one
to th
ree
days
fo
r all
portf
olio
s und
er n
orm
al
circ
umst
ance
s. Th
e M
id C
ap C
ore
team
targ
ets a
5%
ave
rage
cas
h le
vel,
depe
ndin
g on
mar
ket o
ppor
tuni
ty,
with
cas
h un
likel
y to
exc
eed
10%
.
The
portf
olio
typi
cally
has
50–
75
hold
ings
with
pos
ition
size
s bet
wee
n 1–
3%.
UB
S Fi
nanc
ial S
ervi
ces I
nc.
Dat
a V
erifi
catio
n. U
nles
s oth
erw
ise
stat
ed, t
he in
vest
men
t des
crip
tion,
firm
bac
kgro
und
and
key
pers
onne
l con
tain
ed in
this
AC
CES
S M
anag
er p
rofil
e ar
e ba
sed
on d
ata
rece
ived
from
the
Man
ager
and
ot
her s
ourc
es a
s of J
une
30, 2
008
and
have
not
bee
n ve
rifie
d by
UB
S Fi
nanc
ial S
ervi
ces I
nc.
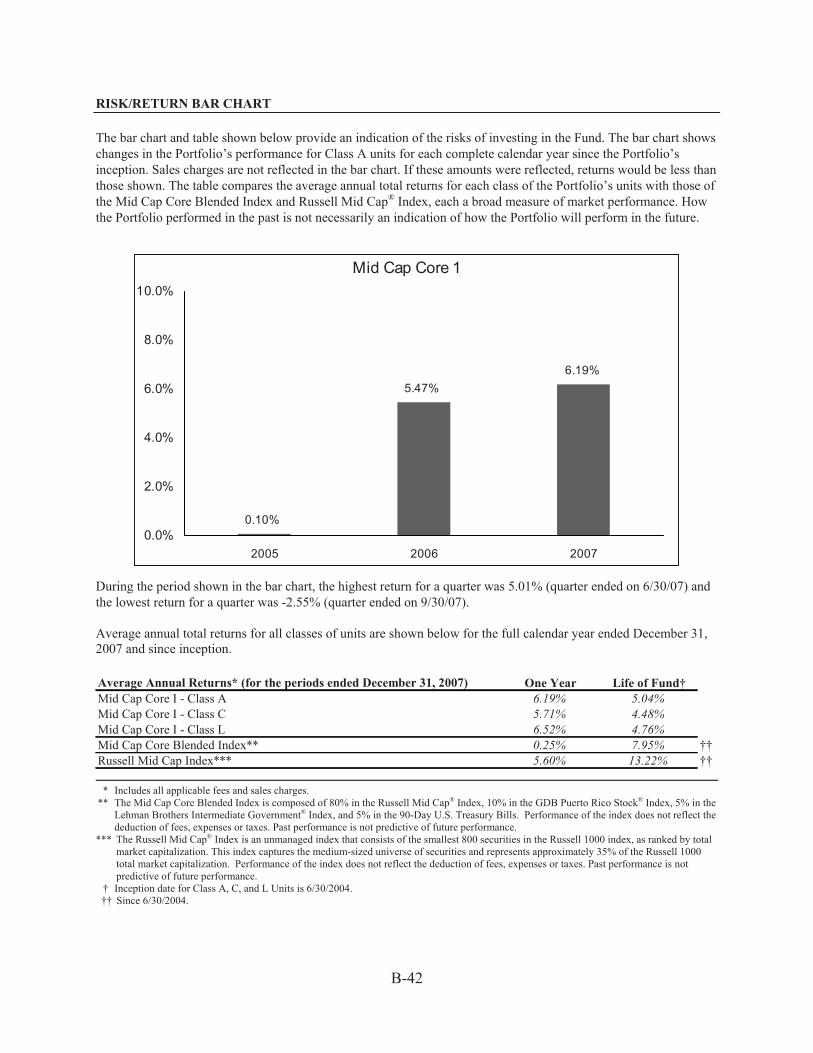
B-42
RISK/RETURN BAR CHART The bar chart and table shown below provide an indication of the risks of investing in the Fund. The bar chart shows changes in the Portfolio’s performance for Class A units for each complete calendar year since the Portfolio’s inception. Sales charges are not reflected in the bar chart. If these amounts were reflected, returns would be less than those shown. The table compares the average annual total returns for each class of the Portfolio’s units with those of the Mid Cap Core Blended Index and Russell Mid Cap® Index, each a broad measure of market performance. How the Portfolio performed in the past is not necessarily an indication of how the Portfolio will perform in the future.
Mid Cap Core 1
0.10%
5.47%6.19%
0.0%
2.0%
4.0%
6.0%
8.0%
10.0%
2005 2006 2007
During the period shown in the bar chart, the highest return for a quarter was 5.01% (quarter ended on 6/30/07) and the lowest return for a quarter was -2.55% (quarter ended on 9/30/07). Average annual total returns for all classes of units are shown below for the full calendar year ended December 31, 2007 and since inception. Average Annual Returns* (for the periods ended December 31, 2007) One Year Life of Fund†Mid Cap Core I - Class A 6.19% 5.04%Mid Cap Core I - Class C 5.71% 4.48%Mid Cap Core I - Class L 6.52% 4.76%Mid Cap Core Blended Index** 0.25% 7.95% ††Russell Mid Cap Index*** 5.60% 13.22% ††
* Includes all applicable fees and sales charges.
** The Mid Cap Core Blended Index is composed of 80% in the Russell Mid Cap® Index, 10% in the GDB Puerto Rico Stock® Index, 5% in the Lehman Brothers Intermediate Government® Index, and 5% in the 90-Day U.S. Treasury Bills. Performance of the index does not reflect the deduction of fees, expenses or taxes. Past performance is not predictive of future performance.
*** The Russell Mid Cap® Index is an unmanaged index that consists of the smallest 800 securities in the Russell 1000 index, as ranked by total market capitalization. This index captures the medium-sized universe of securities and represents approximately 35% of the Russell 1000 total market capitalization. Performance of the index does not reflect the deduction of fees, expenses or taxes. Past performance is not predictive of future performance.
† Inception date for Class A, C, and L Units is 6/30/2004. †† Since 6/30/2004.
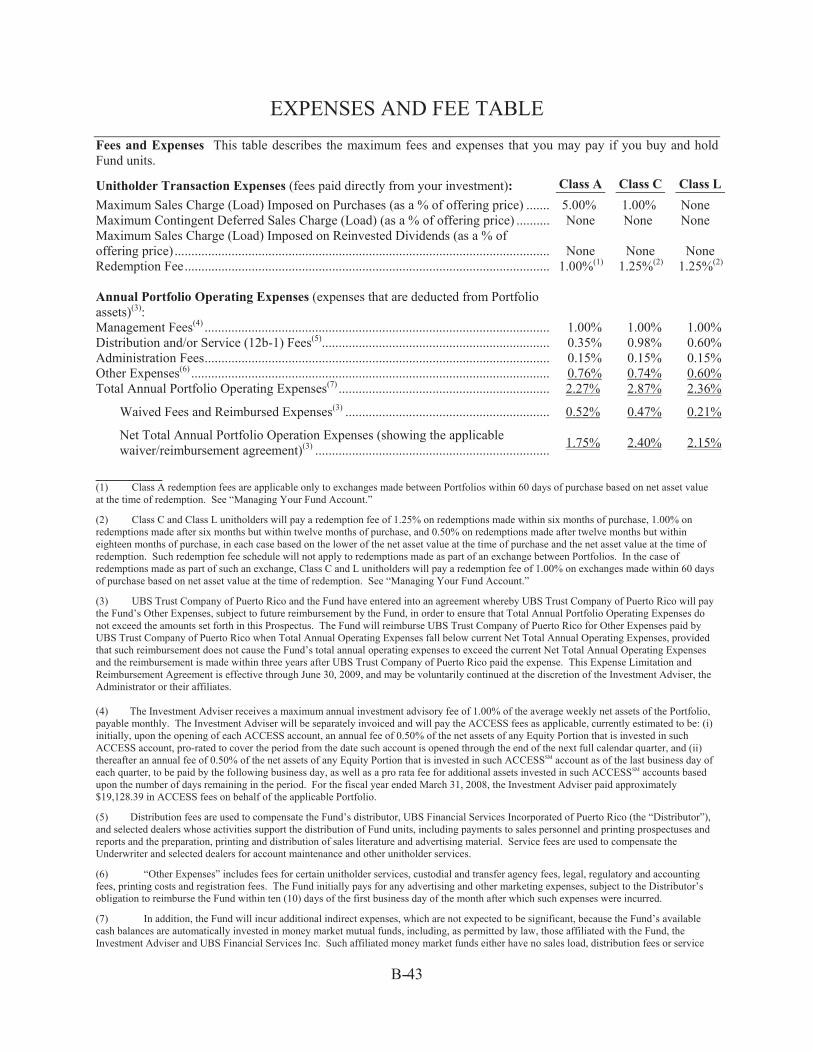
-
B-43
EXPENSES AND FEE TABLE Fees and Expenses This table describes the maximum fees and expenses that you may pay if you buy and hold Fund units.
Unitholder Transaction Expenses (fees paid directly from your investment): Class A Class C Class L Maximum Sales Charge (Load) Imposed on Purchases (as a % of offering price) ........ 5.00% 1.00% None Maximum Contingent Deferred Sales Charge (Load) (as a % of offering price) ........... None None None Maximum Sales Charge (Load) Imposed on Reinvested Dividends (as a % of offering price) ................................................................................................................. None None None Redemption Fee .............................................................................................................. 1.00%(1) 1.25%(2) 1.25%(2) Annual Portfolio Operating Expenses (expenses that are deducted from Portfolio assets)(3):
Management Fees(4) ....................................................................................................... 1.00% 1.00% 1.00% Distribution and/or Service (12b-1) Fees(5) .................................................................... 0.35% 0.98% 0.60% Administration Fees ....................................................................................................... 0.15% 0.15% 0.15% Other Expenses(6) ........................................................................................................... 0.76% 0.74% 0.60% Total Annual Portfolio Operating Expenses(7) ............................................................... 2.27% 2.87% 2.36%
Waived Fees and Reimbursed Expenses(3) ............................................................. 0.52% 0.47% 0.21%
Net Total Annual Portfolio Operation Expenses (showing the applicable waiver/reimbursement agreement)(3) ...................................................................... 1.75% 2.40% 2.15%
__________ (1) Class A redemption fees are applicable only to exchanges made between Portfolios within 60 days of purchase based on net asset value at the time of redemption. See “Managing Your Fund Account.”
(2) Class C and Class L unitholders will pay a redemption fee of 1.25% on redemptions made within six months of purchase, 1.00% on redemptions made after six months but within twelve months of purchase, and 0.50% on redemptions made after twelve months but within eighteen months of purchase, in each case based on the lower of the net asset value at the time of purchase and the net asset value at the time of redemption. Such redemption fee schedule will not apply to redemptions made as part of an exchange between Portfolios. In the case of redemptions made as part of such an exchange, Class C and L unitholders will pay a redemption fee of 1.00% on exchanges made within 60 days of purchase based on net asset value at the time of redemption. See “Managing Your Fund Account.”
(3) UBS Trust Company of Puerto Rico and the Fund have entered into an agreement whereby UBS Trust Company of Puerto Rico will pay the Fund’s Other Expenses, subject to future reimbursement by the Fund, in order to ensure that Total Annual Portfolio Operating Expenses do not exceed the amounts set forth in this Prospectus. The Fund will reimburse UBS Trust Company of Puerto Rico for Other Expenses paid by UBS Trust Company of Puerto Rico when Total Annual Operating Expenses fall below current Net Total Annual Operating Expenses, provided that such reimbursement does not cause the Fund’s total annual operating expenses to exceed the current Net Total Annual Operating Expenses and the reimbursement is made within three years after UBS Trust Company of Puerto Rico paid the expense. This Expense Limitation and Reimbursement Agreement is effective through June 30, 2009, and may be voluntarily continued at the discretion of the Investment Adviser, the Administrator or their affiliates. (4) The Investment Adviser receives a maximum annual investment advisory fee of 1.00% of the average weekly net assets of the Portfolio, payable monthly. The Investment Adviser will be separately invoiced and will pay the ACCESS fees as applicable, currently estimated to be: (i) initially, upon the opening of each ACCESS account, an annual fee of 0.50% of the net assets of any Equity Portion that is invested in such ACCESS account, pro-rated to cover the period from the date such account is opened through the end of the next full calendar quarter, and (ii) thereafter an annual fee of 0.50% of the net assets of any Equity Portion that is invested in such ACCESSSM account as of the last business day of each quarter, to be paid by the following business day, as well as a pro rata fee for additional assets invested in such ACCESSSM accounts based upon the number of days remaining in the period. For the fiscal year ended March 31, 2008, the Investment Adviser paid approximately $19,128.39 in ACCESS fees on behalf of the applicable Portfolio.
(5) Distribution fees are used to compensate the Fund’s distributor, UBS Financial Services Incorporated of Puerto Rico (the “Distributor”), and selected dealers whose activities support the distribution of Fund units, including payments to sales personnel and printing prospectuses and reports and the preparation, printing and distribution of sales literature and advertising material. Service fees are used to compensate the Underwriter and selected dealers for account maintenance and other unitholder services.
(6) “Other Expenses” includes fees for certain unitholder services, custodial and transfer agency fees, legal, regulatory and accounting fees, printing costs and registration fees. The Fund initially pays for any advertising and other marketing expenses, subject to the Distributor’s obligation to reimburse the Fund within ten (10) days of the first business day of the month after which such expenses were incurred.
(7) In addition, the Fund will incur additional indirect expenses, which are not expected to be significant, because the Fund’s available cash balances are automatically invested in money market mutual funds, including, as permitted by law, those affiliated with the Fund, the Investment Adviser and UBS Financial Services Inc. Such affiliated money market funds either have no sales load, distribution fees or service
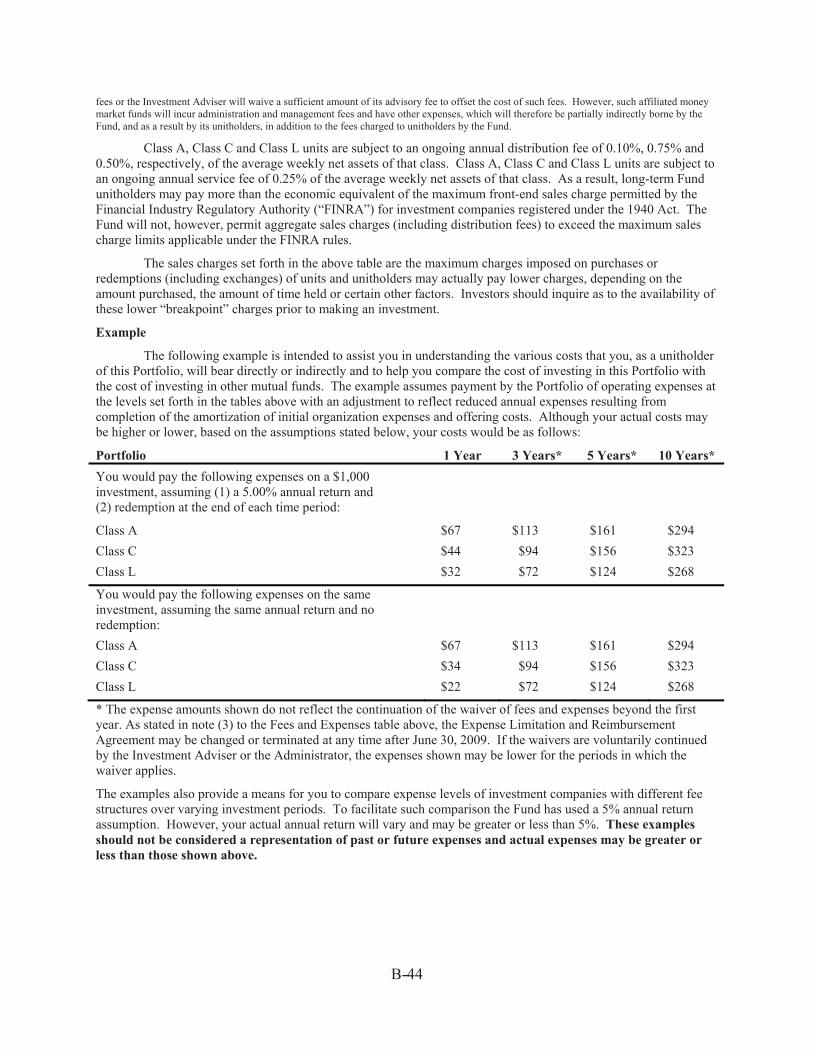
-
B-44
fees or the Investment Adviser will waive a sufficient amount of its advisory fee to offset the cost of such fees. However, such affiliated money market funds will incur administration and management fees and have other expenses, which will therefore be partially indirectly borne by the Fund, and as a result by its unitholders, in addition to the fees charged to unitholders by the Fund.
Class A, Class C and Class L units are subject to an ongoing annual distribution fee of 0.10%, 0.75% and 0.50%, respectively, of the average weekly net assets of that class. Class A, Class C and Class L units are subject to an ongoing annual service fee of 0.25% of the average weekly net assets of that class. As a result, long-term Fund unitholders may pay more than the economic equivalent of the maximum front-end sales charge permitted by the Financial Industry Regulatory Authority (“FINRA”) for investment companies registered under the 1940 Act. The Fund will not, however, permit aggregate sales charges (including distribution fees) to exceed the maximum sales charge limits applicable under the FINRA rules.
The sales charges set forth in the above table are the maximum charges imposed on purchases or redemptions (including exchanges) of units and unitholders may actually pay lower charges, depending on the amount purchased, the amount of time held or certain other factors. Investors should inquire as to the availability of these lower “breakpoint” charges prior to making an investment.
Example
The following example is intended to assist you in understanding the various costs that you, as a unitholder of this Portfolio, will bear directly or indirectly and to help you compare the cost of investing in this Portfolio with the cost of investing in other mutual funds. The example assumes payment by the Portfolio of operating expenses at the levels set forth in the tables above with an adjustment to reflect reduced annual expenses resulting from completion of the amortization of initial organization expenses and offering costs. Although your actual costs may be higher or lower, based on the assumptions stated below, your costs would be as follows:
Portfolio 1 Year 3 Years* 5 Years* 10 Years* You would pay the following expenses on a $1,000 investment, assuming (1) a 5.00% annual return and (2) redemption at the end of each time period:
Class A $67 $113 $161 $294 Class C $44 $94 $156 $323 Class L $32 $72 $124 $268
You would pay the following expenses on the same investment, assuming the same annual return and no redemption:
Class A $67 $113 $161 $294 Class C $34 $94 $156 $323 Class L $22 $72 $124 $268
* The expense amounts shown do not reflect the continuation of the waiver of fees and expenses beyond the first year. As stated in note (3) to the Fees and Expenses table above, the Expense Limitation and Reimbursement Agreement may be changed or terminated at any time after June 30, 2009. If the waivers are voluntarily continued by the Investment Adviser or the Administrator, the expenses shown may be lower for the periods in which the waiver applies.
The examples also provide a means for you to compare expense levels of investment companies with different fee structures over varying investment periods. To facilitate such comparison the Fund has used a 5% annual return assumption. However, your actual annual return will vary and may be greater or less than 5%. These examples should not be considered a representation of past or future expenses and actual expenses may be greater or less than those shown above.

B-45
Multi-Select Securities Puerto Rico Fund—Small Cap Core Portfolio I
Investment Objective – The Portfolio’s investment objective is long-term growth of capital. No assurance can be given that the Portfolio will achieve this investment objective.
Principal Investment Strategies – Under normal conditions, the Portfolio will invest up to 80% of its total assets in common stocks and other equity securities of U.S. companies (the “Equity Portion”). According to Puerto Rico law, the Portfolio also must invest at least 20% of its total assets in equity or taxable fixed-income securities issued by Puerto Rico entities (the “Puerto Rico Securities Portion”). This requirement may limit the Portfolio’s ability to achieve its investment objective. The Fund’s Investment Adviser may directly invest a portion of the Equity Portion in S&P 500 stock index futures contracts.
Puerto Rico Securities Portion – Under normal market conditions, the Puerto Rico Securities Portion will be invested mostly in cash equivalents. The Fund’s Investment Adviser will manage this portion of the Portfolio directly.
Equity Portion – The Fund has indirectly engaged an investment adviser (the “Equity Portion Portfolio Manager”) for the Portfolio’s Equity Portion by opening an account with ACCESSSM, a wrap fee advisory program offered by UBS Financial Services Inc., an affiliate of the Fund’s Investment Adviser. The following information profile describes the Equity Portion Portfolio Manager selected to manage the Equity Portion of the Portfolio, Boston Trust & Investment Management Co., and the Equity Portion Portfolio Manager’s investment philosophy and process.
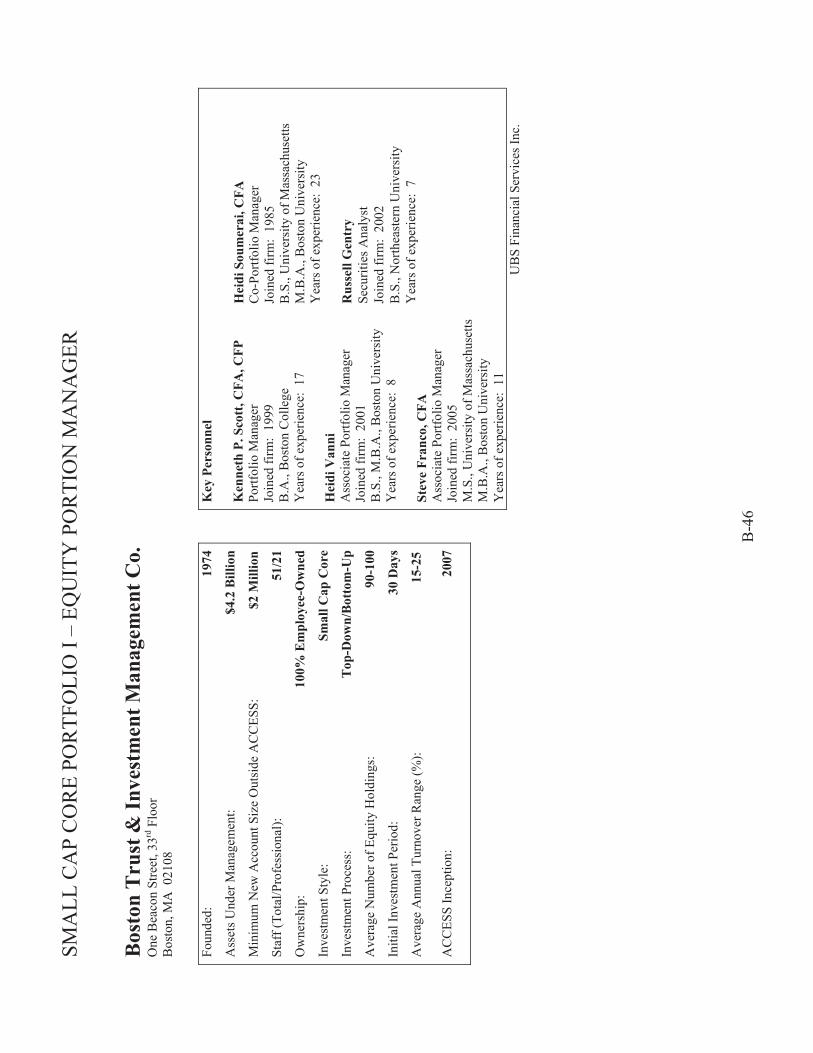
SMA
LL C
AP
CO
RE
POR
TFO
LIO
I –
EQU
ITY
PO
RTI
ON
MA
NA
GER
B
-46
Bos
ton
Tru
st &
Inve
stm
ent M
anag
emen
t Co.
O
ne B
eaco
n St
reet
, 33rd
Flo
or
Bos
ton,
MA
021
08
Foun
ded:
19
74
Ass
ets U
nder
Man
agem
ent:
$4.2
Bill
ion
Min
imum
New
Acc
ount
Siz
e O
utsi
de A
CC
ESS:
$2
Mill
ion
Staf
f (To
tal/P
rofe
ssio
nal):
51
/21
Ow
ners
hip:
10
0% E
mpl
oyee
-Ow
ned
Inve
stm
ent S
tyle
: Sm
all C
ap C
ore
Inve
stm
ent P
roce
ss:
Top
-Dow
n/B
otto
m-U
p
Ave
rage
Num
ber o
f Equ
ity H
oldi
ngs:
90
-100
Initi
al In
vest
men
t Per
iod:
30
Day
s
Ave
rage
Ann
ual T
urno
ver R
ange
(%):
15-
25 A
CC
ESS
Ince
ptio
n:
2007
Key
Per
sonn
el
Ken
neth
P. S
cott
, CFA
, CFP
Po
rtfol
io M
anag
er
Join
ed fi
rm:
1999
B
.A.,
Bos
ton
Col
lege
Y
ears
of e
xper
ienc
e: 1
7 H
eidi
Van
ni
Ass
ocia
te P
ortfo
lio M
anag
er
Join
ed fi
rm:
2001
B
.S.,
M.B
.A.,
Bos
ton
Uni
vers
ity
Yea
rs o
f exp
erie
nce:
8
Stev
e Fr
anco
, CFA
A
ssoc
iate
Por
tfolio
Man
ager
Jo
ined
firm
: 20
05
M.S
., U
nive
rsity
of M
assa
chus
etts
M.B
.A.,
Bos
ton
Uni
vers
ity
Yea
rs o
f exp
erie
nce:
11
Hei
di S
oum
erai
, CFA
C
o-Po
rtfol
io M
anag
er
Join
ed fi
rm:
1985
B
.S.,
Uni
vers
ity o
f Mas
sach
uset
ts
M.B
.A.,
Bos
ton
Uni
vers
ity
Yea
rs o
f exp
erie
nce:
23
Rus
sell
Gen
try
Secu
ritie
s Ana
lyst
Jo
ined
firm
: 20
02
B.S
., N
orth
east
ern
Uni
vers
ity
Yea
rs o
f exp
erie
nce:
7
UB
S Fi
nanc
ial S
ervi
ces I
nc.
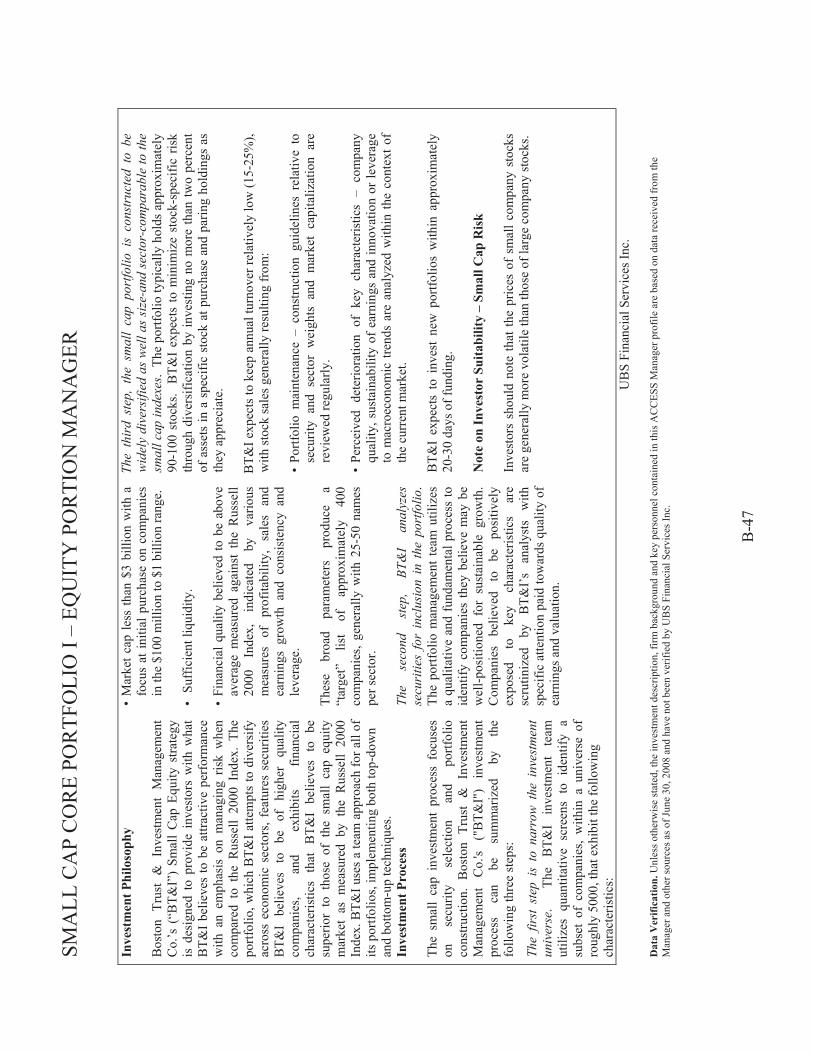
SMA
LL C
AP
CO
RE
POR
TFO
LIO
I –
EQU
ITY
PO
RTI
ON
MA
NA
GER
B
-47
Inve
stm
ent P
hilo
soph
y B
osto
n Tr
ust
& I
nves
tmen
t M
anag
emen
t C
o.’s
(“B
T&I”
) Sm
all
Cap
Equ
ity s
trate
gy
is d
esig
ned
to p
rovi
de i
nves
tors
with
wha
t B
T&I
belie
ves
to b
e at
tract
ive
perf
orm
ance
w
ith a
n em
phas
is o
n m
anag
ing
risk
whe
n co
mpa
red
to t
he R
usse
ll 20
00 I
ndex
. Th
e po
rtfol
io, w
hich
BT&
I atte
mpt
s to
div
ersi
fy
acro
ss e
cono
mic
sec
tors
, fea
ture
s se
curit
ies
BT&
I be
lieve
s to
be
of
hi
gher
qu
ality
co
mpa
nies
, an
d ex
hibi
ts
finan
cial
ch
arac
teris
tics
that
BT&
I be
lieve
s to
be
supe
rior
to t
hose
of
the
smal
l ca
p eq
uity
m
arke
t as
mea
sure
d by
the
Rus
sell
2000
In
dex.
BT&
I use
s a te
am a
ppro
ach
for a
ll of
its
por
tfolio
s, im
plem
entin
g bo
th to
p-do
wn
and
botto
m-u
p te
chni
ques
. In
vest
men
t Pro
cess
Th
e sm
all
cap
inve
stm
ent
proc
ess
focu
ses
on
secu
rity
sele
ctio
n an
d po
rtfol
io
cons
truct
ion.
Bos
ton
Trus
t &
Inv
estm
ent
Man
agem
ent
Co.
's ("
BT&
I")
inve
stm
ent
proc
ess
can
be
sum
mar
ized
by
th
e fo
llow
ing
thre
e st
eps:
The
first
ste
p is
to
narr
ow t
he i
nves
tmen
t un
iver
se.
Th
e B
T&I
inve
stm
ent
team
ut
ilize
s qu
antit
ativ
e sc
reen
s to
ide
ntify
a
subs
et o
f co
mpa
nies
, w
ithin
a u
nive
rse
of
roug
hly
5000
, tha
t exh
ibit
the
follo
win
g ch
arac
teris
tics:
• M
arke
t cap
less
than
$3
billi
on w
ith a
fo
cus
at in
itial
pur
chas
e on
com
pani
es
in th
e $1
00 m
illio
n to
$1
billi
on ra
nge.
•
Suf
ficie
nt li
quid
ity.
•
Fina
ncia
l qua
lity
belie
ved
to b
e ab
ove
aver
age
mea
sure
d ag
ains
t th
e R
usse
ll 20
00
Inde
x,
indi
cate
d by
va
rious
m
easu
res
of
prof
itabi
lity,
sa
les
and
earn
ings
gro
wth
and
con
sist
ency
and
le
vera
ge.
Thes
e br
oad
para
met
ers
prod
uce
a “t
arge
t”
list
of
appr
oxim
atel
y 40
0 co
mpa
nies
, gen
eral
ly w
ith 2
5-50
nam
es
per s
ecto
r. Th
e se
cond
st
ep,
BT&
I an
alyz
es
secu
ritie
s fo
r in
clus
ion
in t
he p
ortfo
lio.
The
portf
olio
man
agem
ent t
eam
util
izes
a
qual
itativ
e an
d fu
ndam
enta
l pro
cess
to
iden
tify
com
pani
es th
ey b
elie
ve m
ay b
e w
ell-p
ositi
oned
for
sus
tain
able
gro
wth
. C
ompa
nies
be
lieve
d to
be
po
sitiv
ely
expo
sed
to
key
char
acte
ristic
s ar
e sc
rutin
ized
by
B
T&I’
s an
alys
ts
with
sp
ecifi
c at
tent
ion
paid
tow
ards
qua
lity
of
earn
ings
and
val
uatio
n.
The
thir
d st
ep,
the
smal
l ca
p po
rtfo
lio i
s co
nstr
ucte
d to
be
wid
ely
dive
rsifi
ed a
s w
ell a
s si
ze-a
nd s
ecto
r-co
mpa
rabl
e to
the
smal
l cap
inde
xes.
The
por
tfolio
typi
cally
hol
ds a
ppro
xim
atel
y 90
-100
sto
cks.
BT&
I ex
pect
s to
min
imiz
e st
ock-
spec
ific
risk
thro
ugh
dive
rsifi
catio
n by
inve
stin
g no
mor
e th
an tw
o pe
rcen
t of
ass
ets
in a
spe
cific
sto
ck a
t pur
chas
e an
d pa
ring
hold
ings
as
they
app
reci
ate.
B
T&I e
xpec
ts to
kee
p an
nual
turn
over
rela
tivel
y lo
w (1
5-25
%),
with
stoc
k sa
les g
ener
ally
resu
lting
from
: •
Portf
olio
mai
nten
ance
– c
onst
ruct
ion
guid
elin
es r
elat
ive
to
secu
rity
and
sect
or w
eigh
ts a
nd m
arke
t ca
pita
lizat
ion
are
revi
ewed
regu
larly
. •
Perc
eive
d de
terio
ratio
n of
key
cha
ract
eris
tics
– co
mpa
ny
qual
ity, s
usta
inab
ility
of e
arni
ngs
and
inno
vatio
n or
leve
rage
to
mac
roec
onom
ic tr
ends
are
ana
lyze
d w
ithin
the
cont
ext o
f th
e cu
rren
t mar
ket.
B
T&I
expe
cts
to i
nves
t ne
w p
ortfo
lios
with
in a
ppro
xim
atel
y 20
-30
days
of f
undi
ng.
Not
e on
Inve
stor
Sui
tabi
lity
– Sm
all C
ap R
isk
Inve
stor
s sh
ould
not
e th
at th
e pr
ices
of
smal
l com
pany
sto
cks
are
gene
rally
mor
e vo
latil
e th
an th
ose
of la
rge
com
pany
stoc
ks.
U
BS
Fina
ncia
l Ser
vice
s Inc
.
Dat
a V
erifi
catio
n. U
nles
s oth
erw
ise
stat
ed, t
he in
vest
men
t des
crip
tion,
firm
bac
kgro
und
and
key
pers
onne
l con
tain
ed in
this
AC
CES
S M
anag
er p
rofil
e ar
e ba
sed
on d
ata
rece
ived
from
the
Man
ager
and
oth
er so
urce
s as o
f Jun
e 30
, 200
8 an
d ha
ve n
ot b
een
verif
ied
by U
BS
Fina
ncia
l Ser
vice
s Inc
.

-
B-48
RISK/RETURN BAR CHART The bar chart and table shown below provide an indication of the risks of investing in the Fund. The bar chart shows changes in the Portfolio’s performance for Class A units for each complete calendar year since the Portfolio’s inception. The Portfolio was managed by Neuberger Berman, Inc. from the Portfolio’s inception until March 17, 2008. Sales charges are not reflected in the bar chart. If these amounts were reflected, returns would be less than those shown. The table compares the average annual total returns for each class of the Portfolio’s units with those of the Small Cap Core Blended Index and Russell 2000® Index, each a broad measure of market performance. How the Portfolio performed in the past is not necessarily an indication of how the Portfolio will perform in the future.
Small Cap Core 1
(5.91%)
0.10%
(3.24%)
-8.0%
-6.0%
-4.0%
-2.0%
0.0%
2.0%
4.0%
6.0%
8.0%
10.0%
2005 2006 2007
During the period shown in the bar chart, the highest return for a quarter was 5.25% (quarter ended on 6/30/07) and the lowest return for a quarter was -6.08% (quarter ended on 9/30/07). Average annual total returns for all classes of units are shown below for the full calendar year ended December 31, 2007 and since inception. Average Annual Returns* (for the periods ended December 31, 2007) One Year Life of Fund†Small Cap Core I - Class A -3.24% -0.40%Small Cap Core I - Class C -3.88% -1.01%Small Cap Core I - Class L -3.60% -0.26%Small Cap Core Blended Index** -5.24% 4.70% ††Russell 2000 Index*** -1.57% 8.94% ††
* Includes all applicable fees and sales charges.
** The Small Cap Core Blended Index is composed of 80% in the Russell 2000® Index, 10% in the GDB Puerto Rico Stock® Index, 5% in the Lehman Brothers Intermediate Government® Index, and 5% in the 90-Day U.S. Treasury Bills. Performance of the index does not reflect the deduction of fees, expenses or taxes. Past performance is not predictive of future performance.
*** The Russell 2000® Index is an unmanaged index that consists of the smallest 2,000 securities in the Russell 3000 index, representing approximately 11% of the Russell 3000 total market capitalization. This index is widely regarded in the industry as the premier measure of small cap stocks. Performance of the index does not reflect the deduction of fees, expenses or taxes. Past performance is not predictive of future performance.
† Inception date for Class A and C Units is 6/30/2004. For Class L Units is 9/2/2004. †† Since 6/30/2004.

-
B-49
EXPENSES AND FEE TABLE Fees and Expenses This table describes the maximum fees and expenses that you may pay if you buy and hold Fund units.
Unitholder Transaction Expenses (fees paid directly from your investment): Class A Class C Class L Maximum Sales Charge (Load) Imposed on Purchases (as a % of offering price) ........ 5.00% 1.00% None Maximum Contingent Deferred Sales Charge (Load) (as a % of offering price) ........... None None None Maximum Sales Charge (Load) Imposed on Reinvested Dividends (as a % of offering price) ................................................................................................................. None None None Redemption Fee .............................................................................................................. 1.00%(1) 1.25%(2) 1.25%(2) Annual Portfolio Operating Expenses (expenses that are deducted from Portfolio assets)(3):
Management Fees(4) ....................................................................................................... 1.02% 1.02% 1.02% Distribution and/or Service (12b-1) Fees(5) .................................................................... 0.35% 0.88% 0.75% Administration Fees ....................................................................................................... 0.15% 0.15% 0.15% Other Expenses(6) ........................................................................................................... 0.82% 0.92% 0.92% Total Annual Portfolio Operating Expenses(7) ............................................................... 2.34% 2.97% 2.84%
Waived Fees and Reimbursed Expenses(3) ............................................................. 0.59% 0.57% 0.69%
Net Total Annual Portfolio Operation Expenses (showing the applicable waiver/reimbursement agreement)(3) ...................................................................... 1.75% 2.40% 2.15%
__________ (1) Class A redemption fees are applicable only to exchanges made between Portfolios within 60 days of purchase based on net asset value at the time of redemption. See “Managing Your Fund Account.”
(2) Class C and Class L unitholders will pay a redemption fee of 1.25% on redemptions made within six months of purchase, 1.00% on redemptions made after six months but within twelve months of purchase, and 0.50% on redemptions made after twelve months but within eighteen months of purchase, in each case based on the lower of the net asset value at the time of purchase and the net asset value at the time of redemption. Such redemption fee schedule will not apply to redemptions made as part of an exchange between Portfolios. In the case of redemptions made as part of such an exchange, Class C and L unitholders will pay a redemption fee of 1.00% on exchanges made within 60 days of purchase based on net asset value at the time of redemption. See “Managing Your Fund Account.”
(3) UBS Trust Company of Puerto Rico and the Fund have entered into an agreement whereby UBS Trust Company of Puerto Rico will pay the Fund’s Other Expenses, subject to future reimbursement by the Fund, in order to ensure that Total Annual Portfolio Operating Expenses do not exceed the amounts set forth in this Prospectus. The Fund will reimburse UBS Trust Company of Puerto Rico for Other Expenses paid by UBS Trust Company of Puerto Rico when Total Annual Operating Expenses fall below current Net Total Annual Operating Expenses, provided that such reimbursement does not cause the Fund’s total annual operating expenses to exceed the current Net Total Annual Operating Expenses and the reimbursement is made within three years after UBS Trust Company of Puerto Rico paid the expense. This Expense Limitation and Reimbursement Agreement is effective through June 30, 2009, and may be voluntarily continued at the discretion of the Investment Adviser, the Administrator or their affiliates. (4) The Investment Adviser receives a maximum annual investment advisory fee of 1.00% of the average weekly net assets of the Portfolio, payable monthly. The Investment Adviser will be separately invoiced and will pay the ACCESS fees as applicable, currently estimated to be: (i) initially, upon the opening of each ACCESS account, an annual fee of 0.50% of the net assets of any Equity Portion that is invested in such ACCESS account, pro-rated to cover the period from the date such account is opened through the end of the next full calendar quarter, and (ii) thereafter an annual fee of 0.50% of the net assets of any Equity Portion that is invested in such ACCESSSM account as of the last business day of each quarter, to be paid by the following business day, as well as a pro rata fee for additional assets invested in such ACCESSSM accounts based upon the number of days remaining in the period. For the fiscal year ended March 31, 2008, the Investment Adviser paid approximately $25,718.24 in ACCESS fees on behalf of the applicable Portfolio.
(5) Distribution fees are used to compensate the Fund’s distributor, UBS Financial Services Incorporated of Puerto Rico (the “Distributor”), and selected dealers whose activities support the distribution of Fund units, including payments to sales personnel and printing prospectuses and reports and the preparation, printing and distribution of sales literature and advertising material. Service fees are used to compensate the Underwriter and selected dealers for account maintenance and other unitholder services.
(6) “Other Expenses” includes fees for certain unitholder services, custodial and transfer agency fees, legal, regulatory and accounting fees, printing costs and registration fees. The Fund initially pays for any advertising and other marketing expenses, subject to the Distributor’s obligation to reimburse the Fund within ten (10) days of the first business day of the month after which such expenses were incurred.
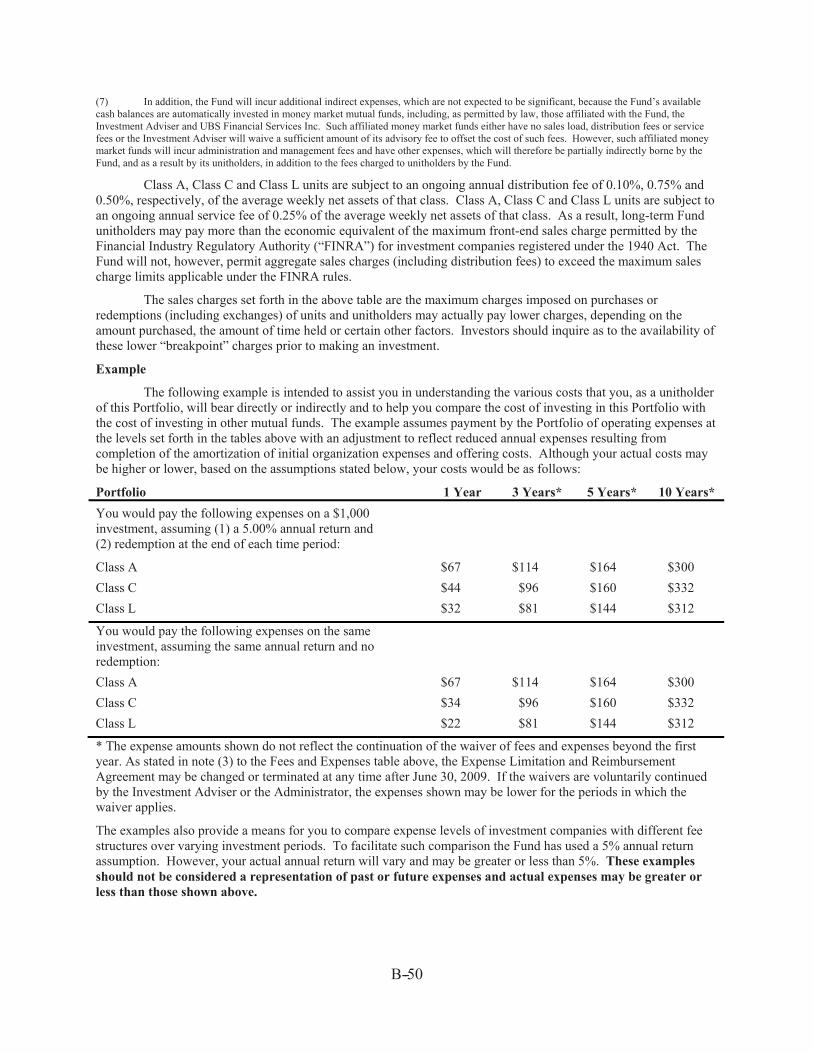
-
B-50
(7) In addition, the Fund will incur additional indirect expenses, which are not expected to be significant, because the Fund’s available cash balances are automatically invested in money market mutual funds, including, as permitted by law, those affiliated with the Fund, the Investment Adviser and UBS Financial Services Inc. Such affiliated money market funds either have no sales load, distribution fees or service fees or the Investment Adviser will waive a sufficient amount of its advisory fee to offset the cost of such fees. However, such affiliated money market funds will incur administration and management fees and have other expenses, which will therefore be partially indirectly borne by the Fund, and as a result by its unitholders, in addition to the fees charged to unitholders by the Fund.
Class A, Class C and Class L units are subject to an ongoing annual distribution fee of 0.10%, 0.75% and 0.50%, respectively, of the average weekly net assets of that class. Class A, Class C and Class L units are subject to an ongoing annual service fee of 0.25% of the average weekly net assets of that class. As a result, long-term Fund unitholders may pay more than the economic equivalent of the maximum front-end sales charge permitted by the Financial Industry Regulatory Authority (“FINRA”) for investment companies registered under the 1940 Act. The Fund will not, however, permit aggregate sales charges (including distribution fees) to exceed the maximum sales charge limits applicable under the FINRA rules.
The sales charges set forth in the above table are the maximum charges imposed on purchases or redemptions (including exchanges) of units and unitholders may actually pay lower charges, depending on the amount purchased, the amount of time held or certain other factors. Investors should inquire as to the availability of these lower “breakpoint” charges prior to making an investment.
Example
The following example is intended to assist you in understanding the various costs that you, as a unitholder of this Portfolio, will bear directly or indirectly and to help you compare the cost of investing in this Portfolio with the cost of investing in other mutual funds. The example assumes payment by the Portfolio of operating expenses at the levels set forth in the tables above with an adjustment to reflect reduced annual expenses resulting from completion of the amortization of initial organization expenses and offering costs. Although your actual costs may be higher or lower, based on the assumptions stated below, your costs would be as follows:
Portfolio 1 Year 3 Years* 5 Years* 10 Years* You would pay the following expenses on a $1,000 investment, assuming (1) a 5.00% annual return and (2) redemption at the end of each time period:
Class A $67 $114 $164 $300 Class C $44 $96 $160 $332 Class L $32 $81 $144 $312
You would pay the following expenses on the same investment, assuming the same annual return and no redemption:
Class A $67 $114 $164 $300 Class C $34 $96 $160 $332 Class L $22 $81 $144 $312
* The expense amounts shown do not reflect the continuation of the waiver of fees and expenses beyond the first year. As stated in note (3) to the Fees and Expenses table above, the Expense Limitation and Reimbursement Agreement may be changed or terminated at any time after June 30, 2009. If the waivers are voluntarily continued by the Investment Adviser or the Administrator, the expenses shown may be lower for the periods in which the waiver applies.
The examples also provide a means for you to compare expense levels of investment companies with different fee structures over varying investment periods. To facilitate such comparison the Fund has used a 5% annual return assumption. However, your actual annual return will vary and may be greater or less than 5%. These examples should not be considered a representation of past or future expenses and actual expenses may be greater or less than those shown above.
B-51
Multi-Select Securities Puerto Rico Fund—International Portfolio I
Investment Objective – The Portfolio’s investment objective is long-term growth of capital. No assurance can be given that the Portfolio will achieve this investment objective.
Principal Investment Strategies – Under normal conditions, the Portfolio will invest up to 80% of its total assets in American Depositary Receipts representing interests in securities of foreign issuers (the “Equity Portion”). According to Puerto Rico law, the Portfolio also must invest at least 20% of its total assets in equity or taxable fixed-income securities issued by Puerto Rico entities (the “Puerto Rico Securities Portion”). This requirement may limit the Portfolio’s ability to achieve its investment objective.
Puerto Rico Securities Portion – The Portfolio will invest at least 20% of its total assets in equity or taxable fixed-income securities issued by Puerto Rico entities. The Fund’s Investment Adviser will manage this portion of the Portfolio directly.
Equity Portion – With regard to the Equity Portion of the Portfolio, the Fund intends to use a variation of what has been termed a “multi-manager” approach. The Fund has indirectly engaged different investment advisers (each a “Equity Portion Portfolio Manager”) for each Portfolio’s Equity Portion by opening accounts with ACCESSSM, a wrap fee advisory program offered by UBS Financial Services Inc., an affiliate of the Fund’s Investment Adviser. The following information profile describes the Equity Portion Portfolio Manager selected to manage the Equity Portion of the Portfolio, Delaware Capital Management, and the Equity Portion Portfolio Manager’s investment philosophy and process.
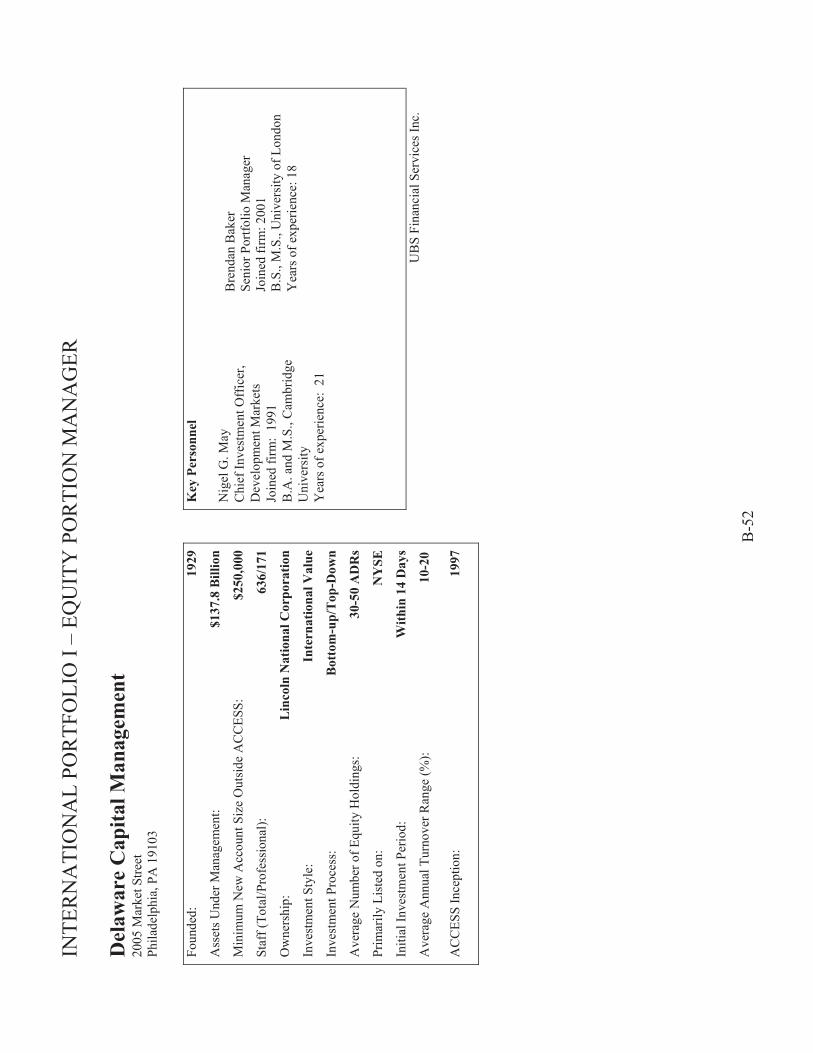
INTE
RN
ATI
ON
AL
POR
TFO
LIO
I –
EQU
ITY
PO
RTI
ON
MA
NA
GER
B
-52
Del
awar
e C
apita
l Man
agem
ent
2005
Mar
ket S
treet
Ph
ilade
lphi
a, P
A 1
9103
Fo
unde
d:
1929
Ass
ets U
nder
Man
agem
ent:
$137
.8 B
illio
n
Min
imum
New
Acc
ount
Siz
e O
utsi
de A
CC
ESS:
$2
50,0
00
Staf
f (To
tal/P
rofe
ssio
nal):
63
6/17
1
Ow
ners
hip:
L
inco
ln N
atio
nal C
orpo
ratio
n
Inve
stm
ent S
tyle
: In
tern
atio
nal V
alue
Inve
stm
ent P
roce
ss:
Bot
tom
-up/
Top
-Dow
n
Ave
rage
Num
ber o
f Equ
ity H
oldi
ngs:
30
-50
AD
Rs
Prim
arily
Lis
ted
on:
NY
SE
Initi
al In
vest
men
t Per
iod:
W
ithin
14
Day
s
Ave
rage
Ann
ual T
urno
ver R
ange
(%):
10-
20 A
CC
ESS
Ince
ptio
n:
1997
Key
Per
sonn
el
Nig
el G
. May
C
hief
Inve
stm
ent O
ffic
er,
Dev
elop
men
t Mar
kets
Jo
ined
firm
: 19
91
B.A
. and
M.S
., C
ambr
idge
U
nive
rsity
Y
ears
of e
xper
ienc
e: 2
1
Bre
ndan
Bak
er
Seni
or P
ortfo
lio M
anag
er
Join
ed fi
rm: 2
001
B.S
., M
.S.,
Uni
vers
ity o
f Lon
don
Yea
rs o
f exp
erie
nce:
18
UB
S Fi
nanc
ial S
ervi
ces I
nc.

INTE
RN
ATI
ON
AL
POR
TFO
LIO
I –
EQU
ITY
PO
RTI
ON
MA
NA
GER
B
-53
Inve
stm
ent P
hilo
soph
y
Del
awar
e C
apita
l M
anag
emen
t’s
(“D
CM
”) I
nter
natio
nal
Equi
ty A
DR
st
rate
gy
is
a va
lue-
orie
nted
co
nser
vativ
e st
yle.
The
firm
inve
sts
in
secu
ritie
s us
ing
divi
dend
di
scou
nt
anal
ysis
to id
entif
y po
tent
ial v
alue
in
term
s of
th
e lo
ng-te
rm
flow
of
in
com
e.
DC
M’s
inve
stm
ent a
ppro
ach
has t
hree
sp
ecifi
c in
vest
men
t ob
ject
ives
: to
pr
ovid
e a
rate
of
retu
rn m
eani
ngfu
lly
grea
ter t
han
the
clie
nt’s
dom
estic
rate
of
in
flatio
n;
to
stru
ctur
e cl
ient
po
rtfol
ios
that
pre
serv
e ca
pita
l dur
ing
prot
ract
ed
inte
rnat
iona
l m
arke
t de
clin
es;
and,
to
pr
ovid
e po
rtfol
io
perf
orm
ance
tha
t is
les
s vo
latil
e th
an
the
benc
hmar
k in
dex
as m
easu
red
by
Stan
dard
Dev
iatio
n.
DC
M’s
po
rtfol
ios
are
inve
sted
in
A
mer
ican
D
epos
itary
R
ecei
pts
(AD
Rs)
. An
AD
R is
a r
ecei
pt, i
ssue
d by
a U
.S. b
ank,
pro
vidi
ng o
wne
rshi
p of
an
un
derly
ing
fore
ign
secu
rity.
A
DR
s tra
de
on
the
U.S
. st
ock
exch
ange
s an
d ar
e qu
oted
in
U.S
. do
llars
.
AD
Rs
offe
r U
.S.
inve
stor
s in
tern
atio
nal
dive
rsifi
catio
n op
portu
nitie
s w
ith
gene
rally
lo
wer
ex
ecut
ion,
se
ttlem
ent
and
cust
odia
l co
sts
than
inv
estin
g di
rect
ly i
n th
e or
dina
ry sh
ares
of a
fore
ign
com
pany
.
Inve
stm
ent P
roce
ss
The
team
of
se
nior
in
vest
men
t pr
ofes
sion
als
divi
des
its
rese
arch
re
spon
sibi
litie
s by
re
gion
, al
low
ing
mem
bers
to
sp
ecia
lize
by
coun
try,
ther
eby
impr
ovin
g th
e te
am’s
in-d
epth
kn
owle
dge
of
the
com
pani
es
and
coun
tries
th
ey
rese
arch
. D
elaw
are
Cap
ital
Man
agem
ent
("D
CM
")
impl
emen
ts t
he i
nves
tmen
t de
cisi
ons
and
serv
ices
its
cl
ient
ba
se
from
Ph
ilade
lphi
a.
Secu
rity
sele
ctio
n is
th
e m
ost
impo
rtant
par
t of
DC
M’s
inv
estm
ent
proc
ess.
The
firm
us
es
the
sam
e di
vide
nd d
isco
unt v
alua
tion
mod
el o
f fu
ture
in
com
e st
ream
s ac
ross
al
l m
arke
ts
and
indu
strie
s. Th
eref
ore,
se
curit
ies
are
com
pare
d ag
ains
t a
com
mon
yar
dstic
k al
low
ing
DC
M t
o ev
alua
te
rela
tive
attra
ctiv
enes
s of
se
curit
ies
in d
iffer
ent c
ount
ries.
DC
M
belie
ves
this
is
supe
rior
to m
etho
ds
whi
ch v
ary
the
valu
atio
n cr
iteria
by
coun
try.
The
sele
ctio
n pr
oces
s be
gins
w
ith
scre
ens
of
vario
us
data
base
s co
ntai
ning
ov
er
2,00
0 co
mpa
nies
. Th
e sc
reen
s ar
e ta
ilore
d to
ea
ch
coun
try a
nd e
ach
sect
or t
o id
entif
y se
curit
ies
with
at
tract
ive
valu
atio
n m
easu
res
and
prov
ide
a lis
t of
300
co
mpa
nies
to e
valu
ate
furth
er. A
t thi
s po
int,
the
inve
stm
ent
team
beg
ins
a co
mpr
ehen
sive
re
sear
ch
proc
ess,
incl
udin
g co
mpa
ny
visi
ts,
of
dete
rmin
ing
whe
ther
the
sec
urity
is
unde
rval
ued.
Thi
s re
sear
ch r
esul
ts i
n a
list
of 7
0–10
0 se
curit
ies
appr
oved
fo
r bui
ldin
g cl
ient
por
tfolio
s.
At
the
coun
try l
evel
, eq
uity
mar
ket
valu
atio
ns
are
base
d on
in
flatio
n-ad
just
ed d
ivid
end
disc
ount
ana
lysi
s, co
uple
d w
ith
long
-term
pu
rcha
sing
po
wer
par
ity a
naly
sis
of c
urre
ncie
s. B
ased
up
on
this
re
sear
ch,
spec
ific
coun
try
wei
ghtin
gs
are
dete
rmin
ed
for c
lient
por
tfolio
s.
DC
M
Inte
rnat
iona
l A
DR
po
rtfol
ios
are
char
acte
rized
by
th
e fo
llow
ing
attri
bute
s: l
ow p
rice/
book
rat
ios,
low
pr
ice/
cash
flo
w
ratio
s, lo
w
pric
e/ea
rnin
gs r
atio
s, hi
gh d
ivid
end
yiel
d re
lativ
e to
oth
er m
anag
ers
and
hist
oric
ally
lo
w
portf
olio
tu
rnov
er
(10%
–20%
ann
ually
).
DC
M f
ollo
ws
a cl
ear
sell
disc
iplin
e fo
r st
ocks
, m
arke
ts a
nd c
urre
ncie
s. Sa
les a
re g
ener
ally
exe
cute
d w
hen:
• Pr
ice
appr
ecia
tion
lead
s to
si
gnifi
cant
ove
rval
uatio
n ag
ains
t a
pred
eter
min
ed v
alue
leve
l.
• A
ch
ange
in
th
e fu
ndam
enta
ls
occu
rs,
whi
ch a
dver
sely
aff
ects
ap
prai
sed
valu
e.
• M
ore
attra
ctiv
e al
tern
ativ
e in
vest
men
ts b
ecom
e av
aila
ble.
DC
M’s
Int
erna
tiona
l A
DR
por
tfolio
s ty
pica
lly h
old
30–5
0 po
sitio
ns.
This
leve
l of s
ecur
ity c
once
ntra
tion
enab
les
DC
M’s
po
rtfol
ios
to
capt
ure
the
attra
ctiv
e op
portu
nitie
s its
an
alys
is
has
high
light
ed w
hile
als
o ac
hiev
ing
reas
onab
le d
iver
sific
atio
n. A
ccou
nts
are
typi
cally
ful
ly i
nves
ted
with
a
1%–5
% c
ash
posi
tion.
Not
e on
In
vest
or
Suita
bilit
y –
Inte
rnat
iona
l Ris
k In
vest
ing
inte
rnat
iona
lly
pres
ents
ce
rtain
ris
ks
not
asso
ciat
ed
with
in
vest
ing
sole
ly i
n th
e U
.S.
such
as
curr
ency
flu
ctua
tion,
po
litic
al
and
econ
omic
ch
ange
, so
cial
un
rest
, ch
ange
s in
go
vern
men
t re
latio
ns,
diff
eren
ces
in
acco
untin
g an
d th
e le
sser
de
gree
of
ac
cura
te
publ
ic
info
rmat
ion
avai
labl
e.
UB
S Fi
nanc
ial S
ervi
ces I
nc.
Dat
a V
erifi
catio
n. U
nles
s oth
erw
ise
stat
ed, t
he in
vest
men
t des
crip
tion,
firm
bac
kgro
und
and
key
pers
onne
l con
tain
ed in
this
AC
CES
S M
anag
er p
rofil
e ar
e ba
sed
on d
ata
rece
ived
from
the
Man
ager
and
ot
her s
ourc
es a
s of J
une
30, 2
008
and
have
not
bee
n ve
rifie
d by
UB
S Fi
nanc
ial S
ervi
ces I
nc.
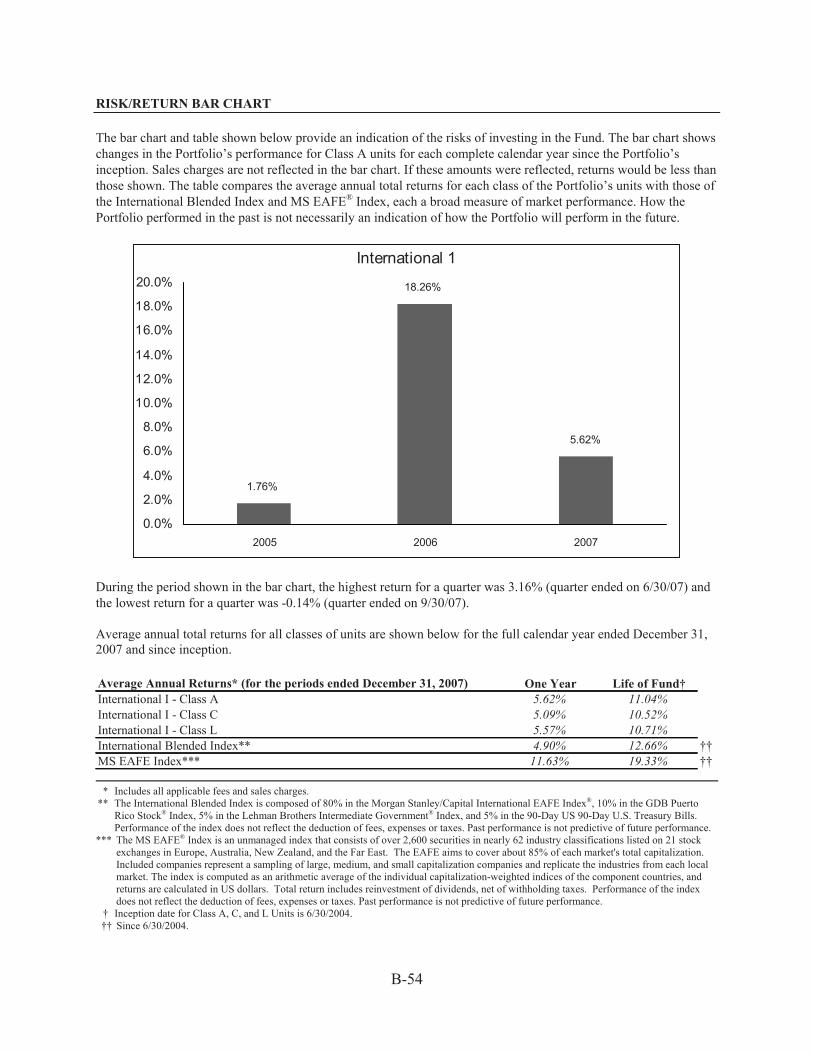
B-54
RISK/RETURN BAR CHART The bar chart and table shown below provide an indication of the risks of investing in the Fund. The bar chart shows changes in the Portfolio’s performance for Class A units for each complete calendar year since the Portfolio’s inception. Sales charges are not reflected in the bar chart. If these amounts were reflected, returns would be less than those shown. The table compares the average annual total returns for each class of the Portfolio’s units with those of the International Blended Index and MS EAFE® Index, each a broad measure of market performance. How the Portfolio performed in the past is not necessarily an indication of how the Portfolio will perform in the future.
International 1
1.76%
18.26%
5.62%
0.0%
2.0%
4.0%
6.0%
8.0%
10.0%
12.0%
14.0%
16.0%
18.0%
20.0%
2005 2006 2007
During the period shown in the bar chart, the highest return for a quarter was 3.16% (quarter ended on 6/30/07) and the lowest return for a quarter was -0.14% (quarter ended on 9/30/07). Average annual total returns for all classes of units are shown below for the full calendar year ended December 31, 2007 and since inception. Average Annual Returns* (for the periods ended December 31, 2007) One Year Life of Fund†International I - Class A 5.62% 11.04%International I - Class C 5.09% 10.52%International I - Class L 5.57% 10.71%International Blended Index** 4.90% 12.66% ††MS EAFE Index*** 11.63% 19.33% ††
* Includes all applicable fees and sales charges.
** The International Blended Index is composed of 80% in the Morgan Stanley/Capital International EAFE Index®, 10% in the GDB Puerto Rico Stock® Index, 5% in the Lehman Brothers Intermediate Government® Index, and 5% in the 90-Day US 90-Day U.S. Treasury Bills. Performance of the index does not reflect the deduction of fees, expenses or taxes. Past performance is not predictive of future performance.
*** The MS EAFE® Index is an unmanaged index that consists of over 2,600 securities in nearly 62 industry classifications listed on 21 stock exchanges in Europe, Australia, New Zealand, and the Far East. The EAFE aims to cover about 85% of each market's total capitalization. Included companies represent a sampling of large, medium, and small capitalization companies and replicate the industries from each local market. The index is computed as an arithmetic average of the individual capitalization-weighted indices of the component countries, and returns are calculated in US dollars. Total return includes reinvestment of dividends, net of withholding taxes. Performance of the index does not reflect the deduction of fees, expenses or taxes. Past performance is not predictive of future performance.
† Inception date for Class A, C, and L Units is 6/30/2004. †† Since 6/30/2004.

B-55
EXPENSES AND FEE TABLE Fees and Expenses This table describes the maximum fees and expenses that you may pay if you buy and hold Fund units.
Unitholder Transaction Expenses (fees paid directly from your investment): Class A Class C Class L Maximum Sales Charge (Load) Imposed on Purchases (as a % of offering price) ........ 5.00% 1.00% None Maximum Contingent Deferred Sales Charge (Load) (as a % of offering price) ........... None None None Maximum Sales Charge (Load) Imposed on Reinvested Dividends (as a % of offering price) ................................................................................................................. None None None Redemption Fee .............................................................................................................. 1.00%(1) 1.25%(2) 1.25%(2) Annual Portfolio Operating Expenses (expenses that are deducted from Portfolio assets)(3):
Management Fees(4) ....................................................................................................... 1.00% 1.00% 1.00% Distribution and/or Service (12b-1) Fees(5) .................................................................... 0.35% 0.97% 0.80% Administration Fees ....................................................................................................... 0.15% 0.15% 0.15% Other Expenses(6) ........................................................................................................... 0.50% 0.47% 0.41% Total Annual Portfolio Operating Expenses(7) ............................................................... 2.00% 2.60% 2.36%
Waived Fees and Reimbursed Expenses(3) ............................................................. 0.25% 0.20% 0.21%
Net Total Annual Portfolio Operation Expenses (showing the applicable waiver/reimbursement agreement)(3) ...................................................................... 1.75% 2.40% 2.15%
__________ (1) Class A redemption fees are applicable only to exchanges made between Portfolios within 60 days of purchase based on net asset value at the time of redemption. See “Managing Your Fund Account.”
(2) Class C and Class L unitholders will pay a redemption fee of 1.25% on redemptions made within six months of purchase, 1.00% on redemptions made after six months but within twelve months of purchase, and 0.50% on redemptions made after twelve months but within eighteen months of purchase, in each case based on the lower of the net asset value at the time of purchase and the net asset value at the time of redemption. Such redemption fee schedule will not apply to redemptions made as part of an exchange between Portfolios. In the case of redemptions made as part of such an exchange, Class C and L unitholders will pay a redemption fee of 1.00% on exchanges made within 60 days of purchase based on net asset value at the time of redemption. See “Managing Your Fund Account.”
(3) UBS Trust Company of Puerto Rico and the Fund have entered into an agreement whereby UBS Trust Company of Puerto Rico will pay the Fund’s Other Expenses, subject to future reimbursement by the Fund, in order to ensure that Total Annual Portfolio Operating Expenses do not exceed the amounts set forth in this Prospectus. The Fund will reimburse UBS Trust Company of Puerto Rico for Other Expenses paid by UBS Trust Company of Puerto Rico when Total Annual Operating Expenses fall below current Net Total Annual Operating Expenses, provided that such reimbursement does not cause the Fund’s total annual operating expenses to exceed the current Net Total Annual Operating Expenses and the reimbursement is made within three years after UBS Trust Company of Puerto Rico paid the expense. This Expense Limitation and Reimbursement Agreement is effective through June 30, 2009, and may be voluntarily continued at the discretion of the Investment Adviser, the Administrator or their affiliates. (4) The Investment Adviser receives a maximum annual investment advisory fee of 1.00% of the average weekly net assets of the Portfolio, payable monthly. The Investment Adviser will be separately invoiced and will pay the ACCESS fees as applicable, currently estimated to be: (i) initially, upon the opening of each ACCESS account, an annual fee of 0.50% of the net assets of any Equity Portion that is invested in such ACCESS account, pro-rated to cover the period from the date such account is opened through the end of the next full calendar quarter, and (ii) thereafter an annual fee of 0.50% of the net assets of any Equity Portion that is invested in such ACCESSSM account as of the last business day of each quarter, to be paid by the following business day, as well as a pro rata fee for additional assets invested in such ACCESSSM accounts based upon the number of days remaining in the period. For the fiscal year ended March 31, 2008, the Investment Adviser paid approximately $123,142.70 in ACCESS fees on behalf of the applicable Portfolio.
(5) Distribution fees are used to compensate the Fund’s distributor, UBS Financial Services Incorporated of Puerto Rico (the “Distributor”), and selected dealers whose activities support the distribution of Fund units, including payments to sales personnel and printing prospectuses and reports and the preparation, printing and distribution of sales literature and advertising material. Service fees are used to compensate the Underwriter and selected dealers for account maintenance and other unitholder services.
(6) “Other Expenses” includes fees for certain unitholder services, custodial and transfer agency fees, legal, regulatory and accounting fees, printing costs and registration fees. The Fund initially pays for any advertising and other marketing expenses, subject to the Distributor’s obligation to reimburse the Fund within ten (10) days of the first business day of the month after which such expenses were incurred.
(7) In addition, the Fund will incur additional indirect expenses, which are not expected to be significant, because the Fund’s available cash balances are automatically invested in money market mutual funds, including, as permitted by law, those affiliated with the Fund, the Investment Adviser and UBS Financial Services Inc. Such affiliated money market funds either have no sales load, distribution fees or service

-
B-56
fees or the Investment Adviser will waive a sufficient amount of its advisory fee to offset the cost of such fees. However, such affiliated money market funds will incur administration and management fees and have other expenses, which will therefore be partially indirectly borne by the Fund, and as a result by its unitholders, in addition to the fees charged to unitholders by the Fund.
Class A, Class C and Class L units are subject to an ongoing annual distribution fee of 0.10%, 0.75% and 0.50%, respectively, of the average weekly net assets of that class. Class A, Class C and Class L units are subject to an ongoing annual service fee of 0.25% of the average weekly net assets of that class. As a result, long-term Fund unitholders may pay more than the economic equivalent of the maximum front-end sales charge permitted by the Financial Industry Regulatory Authority (“FINRA”) for investment companies registered under the 1940 Act. The Fund will not, however, permit aggregate sales charges (including distribution fees) to exceed the maximum sales charge limits applicable under the FINRA rules.
The sales charges set forth in the above table are the maximum charges imposed on purchases or redemptions (including exchanges) of units and unitholders may actually pay lower charges, depending on the amount purchased, the amount of time held or certain other factors. Investors should inquire as to the availability of these lower “breakpoint” charges prior to making an investment.
Example
The following example is intended to assist you in understanding the various costs that you, as a unitholder of this Portfolio, will bear directly or indirectly and to help you compare the cost of investing in this Portfolio with the cost of investing in other mutual funds. The example assumes payment by the Portfolio of operating expenses at the levels set forth in the tables above with an adjustment to reflect reduced annual expenses resulting from completion of the amortization of initial organization expenses and offering costs. Although your actual costs may be higher or lower, based on the assumptions stated below, your costs would be as follows:
Portfolio 1 Year 3 Years* 5 Years* 10 Years* You would pay the following expenses on a $1,000 investment, assuming (1) a 5.00% annual return and (2) redemption at the end of each time period:
Class A $67 $107 $150 $269 Class C $44 $88 $145 $299 Class L $32 $72 $124 $268
You would pay the following expenses on the same investment, assuming the same annual return and no redemption:
Class A $67 $107 $150 $269 Class C $34 $88 $145 $299 Class L $22 $72 $124 $268
* The expense amounts shown do not reflect the continuation of the waiver of fees and expenses beyond the first year. As stated in note (3) to the Fees and Expenses table above, the Expense Limitation and Reimbursement Agreement may be changed or terminated at any time after June 30, 2009. If the waivers are voluntarily continued by the Investment Adviser or the Administrator, the expenses shown may be lower for the periods in which the waiver applies.
The examples also provide a means for you to compare expense levels of investment companies with different fee structures over varying investment periods. To facilitate such comparison the Fund has used a 5% annual return assumption. However, your actual annual return will vary and may be greater or less than 5%. These examples should not be considered a representation of past or future expenses and actual expenses may be greater or less than those shown above.
B-57
Multi-Select Securities Puerto Rico Fund—International Portfolio II
Investment Objective – The Portfolio’s investment objective is long-term growth of capital. No assurance can be given that the Portfolio will achieve this investment objective. Principal Investment Strategies – Under normal conditions, the Portfolio will invest up to 80% of its total assets in American Depositary Receipts (“ADRs”) representing interests in securities of foreign issuers and U.S. dollar denominated ordinary shares (“F Shares,” so called due to their ticker symbols which end in “F”). F-shares are ordinary shares that are a foreign company’s common stock and trade in their home (local), market but are customarily listed on the U.S. OTC market. The U.S. dollar quoted F-shares provide access to some of the foreign companies that do not currently have ADRs available to individual investors (the “Equity Portion”). According to Puerto Rico law, the Portfolio also must invest at least 20% of its total assets in equity or taxable fixed-income securities issued by Puerto Rico entities (the “Puerto Rico Securities Portion”). This requirement may limit the Portfolio’s ability to achieve its investment objective. The Fund’s Investment Adviser may directly invest a portion of the Equity Portion in stock index futures contracts which reflect the investment strategy of the Equity Portion. Puerto Rico Securities Portion – Under normal market conditions, the Puerto Rico Securities Portion will be invested mostly in cash equivalents. The Fund’s Investment Adviser will manage this portion of the Portfolio directly.
Equity Portion – The Fund has indirectly engaged an investment adviser (the “Equity Portion Portfolio Manager”) for the Portfolio’s Equity Portion by an opening account with ACCESSSM, a wrap fee advisory program offered by UBS Financial Services Inc., an affiliate of the Fund’s Investment Adviser. The following information profile describes the Equity Portion Portfolio Manager selected to mange the Equity Portion of the Portfolio, Newton Capital Management Limited, and the Equity Portion Portfolio Manager’s investment philosophy and process
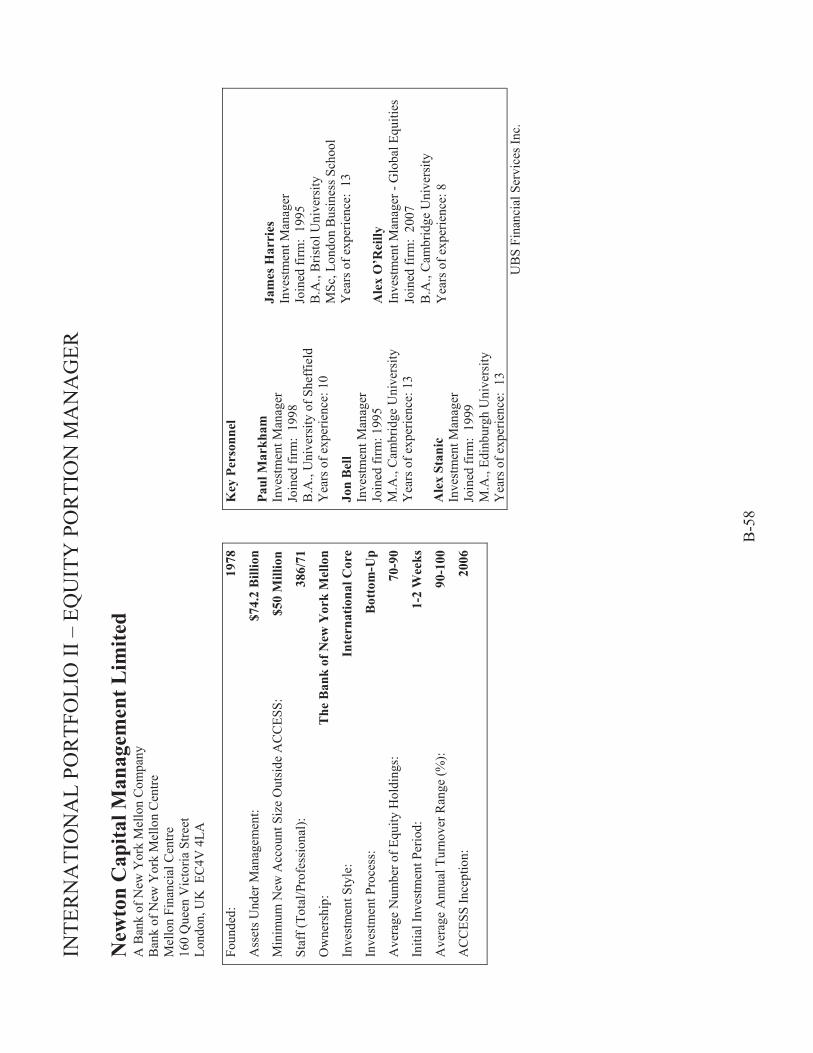
INTE
RN
ATI
ON
AL
POR
TFO
LIO
II –
EQ
UIT
Y P
OR
TIO
N M
AN
AG
ER
B
-58
New
ton
Cap
ital M
anag
emen
t Lim
ited
A B
ank
of N
ew Y
ork
Mel
lon
Com
pany
B
ank
of N
ew Y
ork
Mel
lon
Cen
tre
Mel
lon
Fina
ncia
l Cen
tre
160
Que
en V
icto
ria S
treet
Lo
ndon
, UK
EC
4V 4
LA
Foun
ded:
19
78
Ass
ets U
nder
Man
agem
ent:
$7
4.2
Bill
ion
Min
imum
New
Acc
ount
Siz
e O
utsi
de A
CC
ESS:
$50
Mill
ion
Staf
f (To
tal/P
rofe
ssio
nal):
38
6/71
Ow
ners
hip:
T
he B
ank
of N
ew Y
ork
Mel
lon
Inve
stm
ent S
tyle
: In
tern
atio
nal C
ore
Inve
stm
ent P
roce
ss:
Bot
tom
-Up
Ave
rage
Num
ber o
f Equ
ity H
oldi
ngs:
70
-90
Initi
al In
vest
men
t Per
iod:
1-
2 W
eeks
Ave
rage
Ann
ual T
urno
ver R
ange
(%):
90
-100
AC
CES
S In
cept
ion:
20
06
Key
Per
sonn
el
Paul
Mar
kham
In
vest
men
t Man
ager
Jo
ined
firm
: 19
98
B.A
., U
nive
rsity
of S
heff
ield
Y
ears
of e
xper
ienc
e: 1
0
Jon
Bel
l In
vest
men
t Man
ager
Jo
ined
firm
: 199
5 M
.A.,
Cam
brid
ge U
nive
rsity
Y
ears
of e
xper
ienc
e: 1
3 A
lex
Stan
ic
Inve
stm
ent M
anag
er
Join
ed fi
rm:
1999
M
.A.,
Edin
burg
h U
nive
rsity
Y
ears
of e
xper
ienc
e: 1
3
Jam
es H
arri
es
Inve
stm
ent M
anag
er
Join
ed fi
rm:
1995
B
.A.,
Bris
tol U
nive
rsity
M
Sc, L
ondo
n B
usin
ess S
choo
l Y
ears
of e
xper
ienc
e: 1
3 A
lex
O’R
eilly
In
vest
men
t Man
ager
- G
loba
l Equ
ities
Jo
ined
firm
: 20
07
B.A
., C
ambr
idge
Uni
vers
ity
Yea
rs o
f exp
erie
nce:
8
UB
S Fi
nanc
ial S
ervi
ces I
nc.
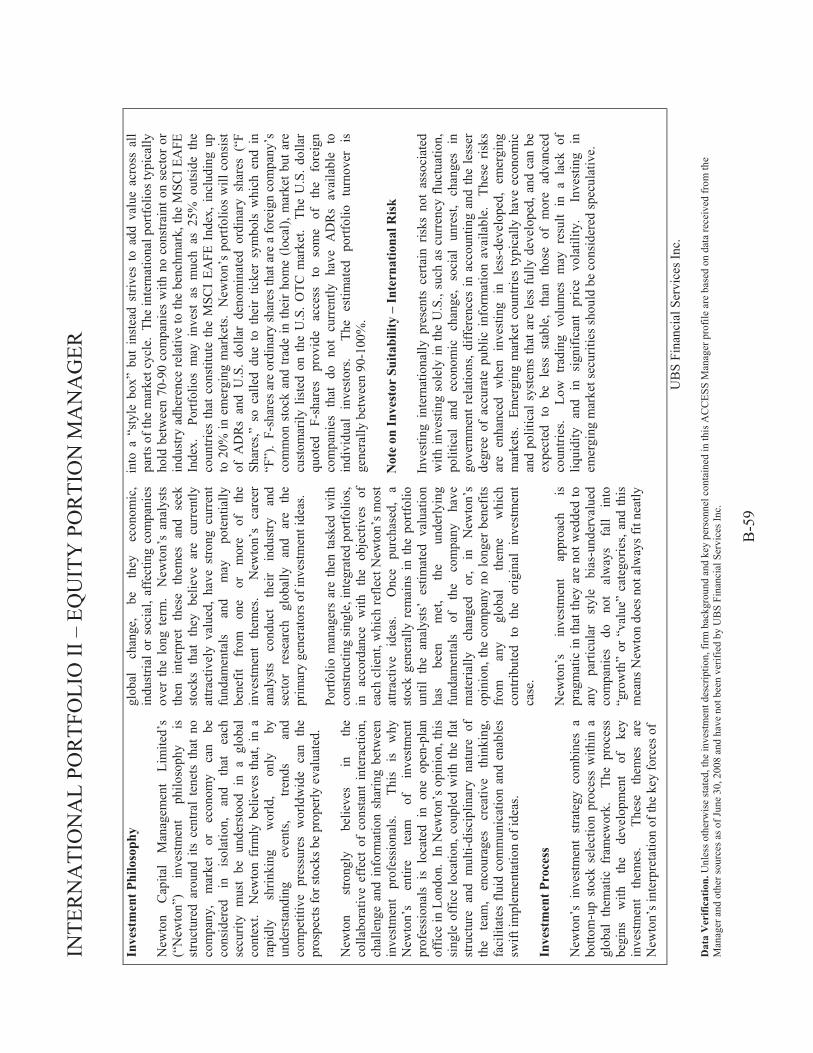
INTE
RN
ATI
ON
AL
POR
TFO
LIO
II –
EQ
UIT
Y P
OR
TIO
N M
AN
AG
ER
B-5
9
Inve
stm
ent P
hilo
soph
y N
ewto
n C
apita
l M
anag
emen
t Li
mite
d’s
(“N
ewto
n”)
inve
stm
ent
philo
soph
y is
st
ruct
ured
aro
und
its c
entra
l te
nets
tha
t no
co
mpa
ny,
mar
ket
or
econ
omy
can
be
cons
ider
ed
in
isol
atio
n,
and
that
ea
ch
secu
rity
mus
t be
und
erst
ood
in a
glo
bal
cont
ext.
New
ton
firm
ly b
elie
ves
that
, in
a ra
pidl
y sh
rinki
ng
wor
ld,
only
by
un
ders
tand
ing
even
ts,
trend
s an
d co
mpe
titiv
e pr
essu
res
wor
ldw
ide
can
the
pros
pect
s for
stoc
ks b
e pr
oper
ly e
valu
ated
. N
ewto
n st
rong
ly
belie
ves
in
the
colla
bora
tive
effe
ct o
f co
nsta
nt i
nter
actio
n,
chal
leng
e an
d in
form
atio
n sh
arin
g be
twee
n in
vest
men
t pr
ofes
sion
als.
Th
is
is
why
N
ewto
n’s
entir
e te
am
of
inve
stm
ent
prof
essi
onal
s is
loc
ated
in
one
open
-pla
n of
fice
in L
ondo
n. I
n N
ewto
n’s o
pini
on, t
his
sing
le o
ffic
e lo
catio
n, c
oupl
ed w
ith th
e fla
t st
ruct
ure
and
mul
ti-di
scip
linar
y na
ture
of
the
team
, en
cour
ages
cr
eativ
e th
inki
ng,
faci
litat
es f
luid
com
mun
icat
ion
and
enab
les
swift
impl
emen
tatio
n of
idea
s. In
vest
men
t Pro
cess
N
ewto
n’s
inve
stm
ent
stra
tegy
com
bine
s a
botto
m-u
p st
ock
sele
ctio
n pr
oces
s w
ithin
a
glob
al t
hem
atic
fra
mew
ork.
Th
e pr
oces
s be
gins
w
ith
the
deve
lopm
ent
of
key
inve
stm
ent
them
es.
Th
ese
them
es
are
New
ton’
s int
erpr
etat
ion
of th
e ke
y fo
rces
of
glob
al
chan
ge,
be
they
ec
onom
ic,
indu
stria
l or
soci
al, a
ffec
ting
com
pani
es
over
the
lon
g te
rm.
New
ton’
s an
alys
ts
then
int
erpr
et t
hese
the
mes
and
see
k st
ocks
tha
t th
ey b
elie
ve a
re c
urre
ntly
at
tract
ivel
y va
lued
, ha
ve s
trong
cur
rent
fu
ndam
enta
ls
and
may
po
tent
ially
be
nefit
fr
om
one
or
mor
e of
th
e in
vest
men
t th
emes
.
New
ton’
s ca
reer
an
alys
ts
cond
uct
thei
r in
dust
ry
and
sect
or
rese
arch
gl
obal
ly
and
are
the
prim
ary
gene
rato
rs o
f inv
estm
ent i
deas
. Po
rtfol
io m
anag
ers
are
then
task
ed w
ith
cons
truct
ing
sing
le, i
nteg
rate
d po
rtfol
ios,
in
acco
rdan
ce
with
th
e ob
ject
ives
of
ea
ch c
lient
, whi
ch re
flect
New
ton’
s mos
t at
tract
ive
idea
s.
Onc
e pu
rcha
sed,
a
stoc
k ge
nera
lly r
emai
ns i
n th
e po
rtfol
io
until
the
ana
lyst
s’ e
stim
ated
val
uatio
n ha
s be
en
met
, th
e un
derly
ing
fund
amen
tals
of
th
e co
mpa
ny
have
m
ater
ially
ch
ange
d or
, in
N
ewto
n’s
opin
ion,
the
com
pany
no
long
er b
enef
its
from
an
y gl
obal
th
eme
whi
ch
cont
ribut
ed t
o th
e or
igin
al i
nves
tmen
t ca
se.
New
ton’
s in
vest
men
t ap
proa
ch
is
prag
mat
ic in
that
they
are
not
wed
ded
to
any
parti
cula
r st
yle
bias
-und
erva
lued
co
mpa
nies
do
no
t al
way
s fa
ll in
to
“gro
wth
” or
“va
lue”
cat
egor
ies,
and
this
m
eans
New
ton
does
not
alw
ays f
it ne
atly
into
a “
styl
e bo
x” b
ut i
nste
ad s
trive
s to
add
val
ue a
cros
s al
l pa
rts o
f the
mar
ket c
ycle
. Th
e in
tern
atio
nal p
ortfo
lios t
ypic
ally
ho
ld b
etw
een
70-9
0 co
mpa
nies
with
no
cons
train
t on
sect
or o
r in
dust
ry a
dher
ence
rela
tive
to th
e be
nchm
ark,
the
MSC
I EA
FE
Inde
x.
Portf
olio
s m
ay i
nves
t as
muc
h as
25%
out
side
the
co
untri
es th
at c
onst
itute
the
MSC
I EA
FE I
ndex
, inc
ludi
ng u
p to
20%
in e
mer
ging
mar
kets
. N
ewto
n’s
portf
olio
s w
ill c
onsi
st
of A
DR
s an
d U
.S.
dolla
r de
nom
inat
ed o
rdin
ary
shar
es (
“F
Shar
es,”
so
calle
d du
e to
the
ir tic
ker
sym
bols
whi
ch e
nd i
n “F
”).
F-sh
ares
are
ord
inar
y sh
ares
that
are
a fo
reig
n co
mpa
ny’s
co
mm
on s
tock
and
trad
e in
thei
r ho
me
(loca
l), m
arke
t but
are
cu
stom
arily
lis
ted
on t
he U
.S. O
TC m
arke
t. T
he U
.S. d
olla
r qu
oted
F-
shar
es
prov
ide
acce
ss
to
som
e of
th
e fo
reig
n co
mpa
nies
tha
t do
not
cur
rent
ly h
ave
AD
Rs
avai
labl
e to
in
divi
dual
in
vest
ors.
Th
e es
timat
ed
portf
olio
tu
rnov
er
is
gene
rally
bet
wee
n 90
-100
%.
Not
e on
Inve
stor
Sui
tabi
lity
– In
tern
atio
nal R
isk
Inve
stin
g in
tern
atio
nally
pre
sent
s ce
rtain
ris
ks n
ot a
ssoc
iate
d w
ith in
vest
ing
sole
ly in
the
U.S
., su
ch a
s cu
rren
cy fl
uctu
atio
n,
polit
ical
an
d ec
onom
ic
chan
ge,
soci
al
unre
st,
chan
ges
in
gove
rnm
ent r
elat
ions
, diff
eren
ces
in a
ccou
ntin
g an
d th
e le
sser
de
gree
of
accu
rate
pub
lic i
nfor
mat
ion
avai
labl
e.
Thes
e ris
ks
are
enha
nced
whe
n in
vest
ing
in l
ess-
deve
lope
d, e
mer
ging
m
arke
ts.
Emer
ging
mar
ket c
ount
ries
typi
cally
hav
e ec
onom
ic
and
polit
ical
sys
tem
s th
at a
re le
ss f
ully
dev
elop
ed, a
nd c
an b
e ex
pect
ed t
o be
les
s st
able
, th
an t
hose
of
mor
e ad
vanc
ed
coun
tries
. L
ow t
radi
ng v
olum
es m
ay r
esul
t in
a l
ack
of
liqui
dity
an
d in
si
gnifi
cant
pr
ice
vola
tility
.
Inve
stin
g in
em
ergi
ng m
arke
t sec
uriti
es sh
ould
be
cons
ider
ed sp
ecul
ativ
e.
U
BS
Fina
ncia
l Ser
vice
s Inc
.
Dat
a V
erifi
catio
n. U
nles
s oth
erw
ise
stat
ed, t
he in
vest
men
t des
crip
tion,
firm
bac
kgro
und
and
key
pers
onne
l con
tain
ed in
this
AC
CES
S M
anag
er p
rofil
e ar
e ba
sed
on d
ata
rece
ived
from
the
Man
ager
and
oth
er so
urce
s as o
f Jun
e 30
, 200
8 an
d ha
ve n
ot b
een
verif
ied
by U
BS
Fina
ncia
l Ser
vice
s Inc
.

B-60
RISK/RETURN BAR CHART The bar chart and table shown below provide an indication of the risks of investing in the Fund. The bar chart shows changes in the Portfolio’s performance for Class A units for each complete calendar year since the Portfolio’s inception. The Portfolio was managed by UBS Global Asset Management (Americas) Inc. from its inception until March 31, 2008. Sales charges are not reflected in the bar chart. If these amounts were reflected, returns would be less than those shown. The table compares the average annual total returns for each class of the Portfolio’s units with those of the International Blended Index and MS EAFE® Index, each a broad measure of market performance. How the Portfolio performed in the past is not necessarily an indication of how the Portfolio will perform in the future.
International 2
0.63%
15.57%
-0.15%-1.0%
1.0%
3.0%
5.0%
7.0%
9.0%
11.0%
13.0%
15.0%
17.0%
19.0%
2005 2006 2007
During the period shown in the bar chart, the highest return for a quarter was 2.62% (quarter ended on 6/30/07) and the lowest return for a quarter was -3.46% (quarter ended on 12/31/07). Average annual total returns for all classes of units are shown below for the full calendar year ended December 31, 2007 and since inception. Average Annual Returns* (for the periods ended December 31, 2007) One Year Life of Fund†International II - Class A -0.15% 7.38%International II - Class C -0.73% 5.68%International II - Class L N/A N/AInternational Blended Index** 4.90% 12.66% ††MS EAFE Index*** 11.63% 19.33% ††
* Includes all applicable fees and sales charges.
** The International Blended Index is composed of 80% in the Morgan Stanley/Capital International EAFE Index®, 10% in the GDB Puerto Rico Stock® Index, 5% in the Lehman Brothers Intermediate Government® Index, and 5% in the 90-Day US 90-Day U.S. Treasury Bills. Performance of the index does not reflect the deduction of fees, expenses or taxes. Past performance is not predictive of future performance.
*** The MS EAFE® Index is an unmanaged index that consists of over 2,600 securities in nearly 62 industry classifications listed on 21 stock exchanges in Europe, Australia, New Zealand, and the Far East. The EAFE aims to cover about 85% of each market's total capitalization. Included companies represent a sampling of large, medium, and small capitalization companies and replicate the industries from each local market. The index is computed as an arithmetic average of the individual capitalization-weighted indices of the component countries, and returns are calculated in US dollars. Total return includes reinvestment of dividends, net of withholding taxes. Performance of the index does not reflect the deduction of fees, expenses or taxes. Past performance is not predictive of future performance.
† Inception date for Class A Units is 6/30/2004. For Class C Units is 5/5/2005. Class L Units have not received any moneys from investors yet and as such do not have a performance record as of 12/31/06.
†† Since 6/30/2004.
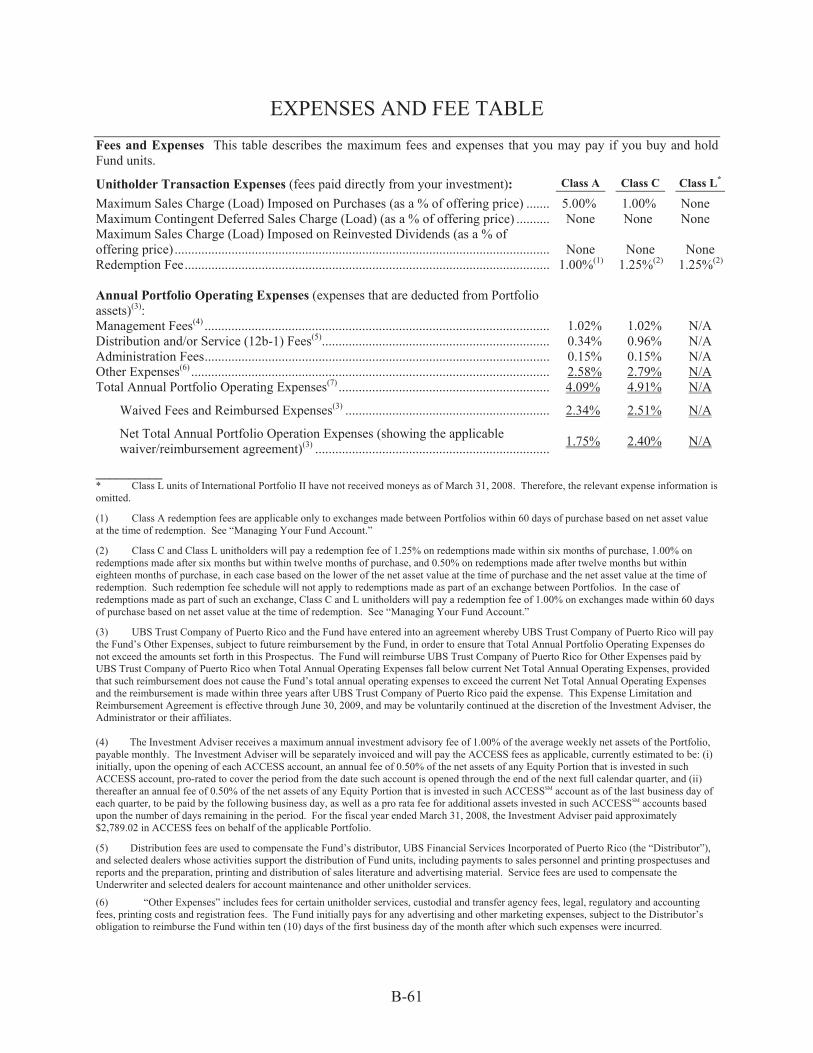
B-61
EXPENSES AND FEE TABLE Fees and Expenses This table describes the maximum fees and expenses that you may pay if you buy and hold Fund units.
Unitholder Transaction Expenses (fees paid directly from your investment): Class A Class C Class L*
Maximum Sales Charge (Load) Imposed on Purchases (as a % of offering price) ........ 5.00% 1.00% None Maximum Contingent Deferred Sales Charge (Load) (as a % of offering price) ........... None None None Maximum Sales Charge (Load) Imposed on Reinvested Dividends (as a % of offering price) ................................................................................................................. None None None Redemption Fee .............................................................................................................. 1.00%(1) 1.25%(2) 1.25%(2) Annual Portfolio Operating Expenses (expenses that are deducted from Portfolio assets)(3):
Management Fees(4) ....................................................................................................... 1.02% 1.02% N/A Distribution and/or Service (12b-1) Fees(5) .................................................................... 0.34% 0.96% N/A Administration Fees ....................................................................................................... 0.15% 0.15% N/A Other Expenses(6) ........................................................................................................... 2.58% 2.79% N/A Total Annual Portfolio Operating Expenses(7) ............................................................... 4.09% 4.91% N/A
Waived Fees and Reimbursed Expenses(3) ............................................................. 2.34% 2.51% N/A
Net Total Annual Portfolio Operation Expenses (showing the applicable waiver/reimbursement agreement)(3) ...................................................................... 1.75% 2.40% N/A
__________ * Class L units of International Portfolio II have not received moneys as of March 31, 2008. Therefore, the relevant expense information is omitted.
(1) Class A redemption fees are applicable only to exchanges made between Portfolios within 60 days of purchase based on net asset value at the time of redemption. See “Managing Your Fund Account.”
(2) Class C and Class L unitholders will pay a redemption fee of 1.25% on redemptions made within six months of purchase, 1.00% on redemptions made after six months but within twelve months of purchase, and 0.50% on redemptions made after twelve months but within eighteen months of purchase, in each case based on the lower of the net asset value at the time of purchase and the net asset value at the time of redemption. Such redemption fee schedule will not apply to redemptions made as part of an exchange between Portfolios. In the case of redemptions made as part of such an exchange, Class C and L unitholders will pay a redemption fee of 1.00% on exchanges made within 60 days of purchase based on net asset value at the time of redemption. See “Managing Your Fund Account.”
(3) UBS Trust Company of Puerto Rico and the Fund have entered into an agreement whereby UBS Trust Company of Puerto Rico will pay the Fund’s Other Expenses, subject to future reimbursement by the Fund, in order to ensure that Total Annual Portfolio Operating Expenses do not exceed the amounts set forth in this Prospectus. The Fund will reimburse UBS Trust Company of Puerto Rico for Other Expenses paid by UBS Trust Company of Puerto Rico when Total Annual Operating Expenses fall below current Net Total Annual Operating Expenses, provided that such reimbursement does not cause the Fund’s total annual operating expenses to exceed the current Net Total Annual Operating Expenses and the reimbursement is made within three years after UBS Trust Company of Puerto Rico paid the expense. This Expense Limitation and Reimbursement Agreement is effective through June 30, 2009, and may be voluntarily continued at the discretion of the Investment Adviser, the Administrator or their affiliates. (4) The Investment Adviser receives a maximum annual investment advisory fee of 1.00% of the average weekly net assets of the Portfolio, payable monthly. The Investment Adviser will be separately invoiced and will pay the ACCESS fees as applicable, currently estimated to be: (i) initially, upon the opening of each ACCESS account, an annual fee of 0.50% of the net assets of any Equity Portion that is invested in such ACCESS account, pro-rated to cover the period from the date such account is opened through the end of the next full calendar quarter, and (ii) thereafter an annual fee of 0.50% of the net assets of any Equity Portion that is invested in such ACCESSSM account as of the last business day of each quarter, to be paid by the following business day, as well as a pro rata fee for additional assets invested in such ACCESSSM accounts based upon the number of days remaining in the period. For the fiscal year ended March 31, 2008, the Investment Adviser paid approximately $2,789.02 in ACCESS fees on behalf of the applicable Portfolio.
(5) Distribution fees are used to compensate the Fund’s distributor, UBS Financial Services Incorporated of Puerto Rico (the “Distributor”), and selected dealers whose activities support the distribution of Fund units, including payments to sales personnel and printing prospectuses and reports and the preparation, printing and distribution of sales literature and advertising material. Service fees are used to compensate the Underwriter and selected dealers for account maintenance and other unitholder services.
(6) “Other Expenses” includes fees for certain unitholder services, custodial and transfer agency fees, legal, regulatory and accounting fees, printing costs and registration fees. The Fund initially pays for any advertising and other marketing expenses, subject to the Distributor’s obligation to reimburse the Fund within ten (10) days of the first business day of the month after which such expenses were incurred.

B-62
(7) In addition, the Fund will incur additional indirect expenses, which are not expected to be significant, because the Fund’s available cash balances are automatically invested in money market mutual funds, including, as permitted by law, those affiliated with the Fund, the Investment Adviser and UBS Financial Services Inc. Such affiliated money market funds either have no sales load, distribution fees or service fees or the Investment Adviser will waive a sufficient amount of its advisory fee to offset the cost of such fees. However, such affiliated money market funds will incur administration and management fees and have other expenses, which will therefore be partially indirectly borne by the Fund, and as a result by its unitholders, in addition to the fees charged to unitholders by the Fund.
Class A, Class C and Class L units are subject to an ongoing annual distribution fee of 0.10%, 0.75% and 0.50%, respectively, of the average weekly net assets of that class. Class A, Class C and Class L units are subject to an ongoing annual service fee of 0.25% of the average weekly net assets of that class. As a result, long-term Fund unitholders may pay more than the economic equivalent of the maximum front-end sales charge permitted by the Financial Industry Regulatory Authority (“FINRA”) for investment companies registered under the 1940 Act. The Fund will not, however, permit aggregate sales charges (including distribution fees) to exceed the maximum sales charge limits applicable under the FINRA rules.
The sales charges set forth in the above table are the maximum charges imposed on purchases or redemptions (including exchanges) of units and unitholders may actually pay lower charges, depending on the amount purchased, the amount of time held or certain other factors. Investors should inquire as to the availability of these lower “breakpoint” charges prior to making an investment. Example
The following example is intended to assist you in understanding the various costs that you, as a unitholder of this Portfolio, will bear directly or indirectly and to help you compare the cost of investing in this Portfolio with the cost of investing in other mutual funds. The example assumes payment by the Portfolio of operating expenses at the levels set forth in the tables above with an adjustment to reflect reduced annual expenses resulting from completion of the amortization of initial organization expenses and offering cost. Although your actual costs may be higher or lower, based on the assumptions stated below, your costs would be as follows:
Portfolio 1 Year 3 Years* 5 Years* 10 Years* You would pay the following expenses on a $1,000 investment, assuming (1) a 5.00% annual return and (2) redemption at the end of each time period:
Class A $67 $148 $230 $443 Class C $44 $134 $234 $485 Class L (Estimate) $32 $67 $115 $248 You would pay the following expenses on the same investment, assuming the same annual return and no redemption:
Class A $67 $148 $230 $443 Class C $34 $134 $234 $485 Class L (Estimate) $22 $67 $115 $248 * The expense amounts shown do not reflect the continuation of the waiver of fees and expenses beyond the first year. As stated in note (3) to the Fees and Expenses table above, the Expense Limitation and Reimbursement Agreement may be changed or terminated at any time after June 30, 2009. If the waivers are voluntarily continued by the Investment Adviser or the Administrator, the expenses shown may be lower for the periods in which the waiver applies. The examples also provide a means for you to compare expense levels of investment companies with different fee structures over varying investment periods. To facilitate such comparison the Fund has used a 5% annual return assumption. However, your actual annual return will vary and may be greater or less than 5%. These examples should not be considered a representation of past or future expenses and actual expenses may be greater or less than those shown above.

B-63
Multi-Select Securities Puerto Rico Fund—U.S. Large Cap ETF Portfolio I
Investment Objective – The Portfolio’s investment objective is long-term growth of capital. No assurance can be given that the Portfolio will achieve this investment objective. Principal Investment Strategies – Under normal conditions, the Portfolio will invest up to 80% of its total assets in equity securities, consisting primarily of shares of United States large capitalization exchange-traded funds (the “Equity Portion”). Unlike the Fund’s other Portfolios, such investments will not be made through the ACCESS Program. According to Puerto Rico law, the Portfolio also must invest at least 20% of its total assets in equity or taxable fixed-income securities issued by Puerto Rico entities (the “Puerto Rico Securities Portion”). Under normal conditions, this portion will be invested mostly in cash equivalents. This requirement may limit the Portfolio’s ability to achieve its investment objective.
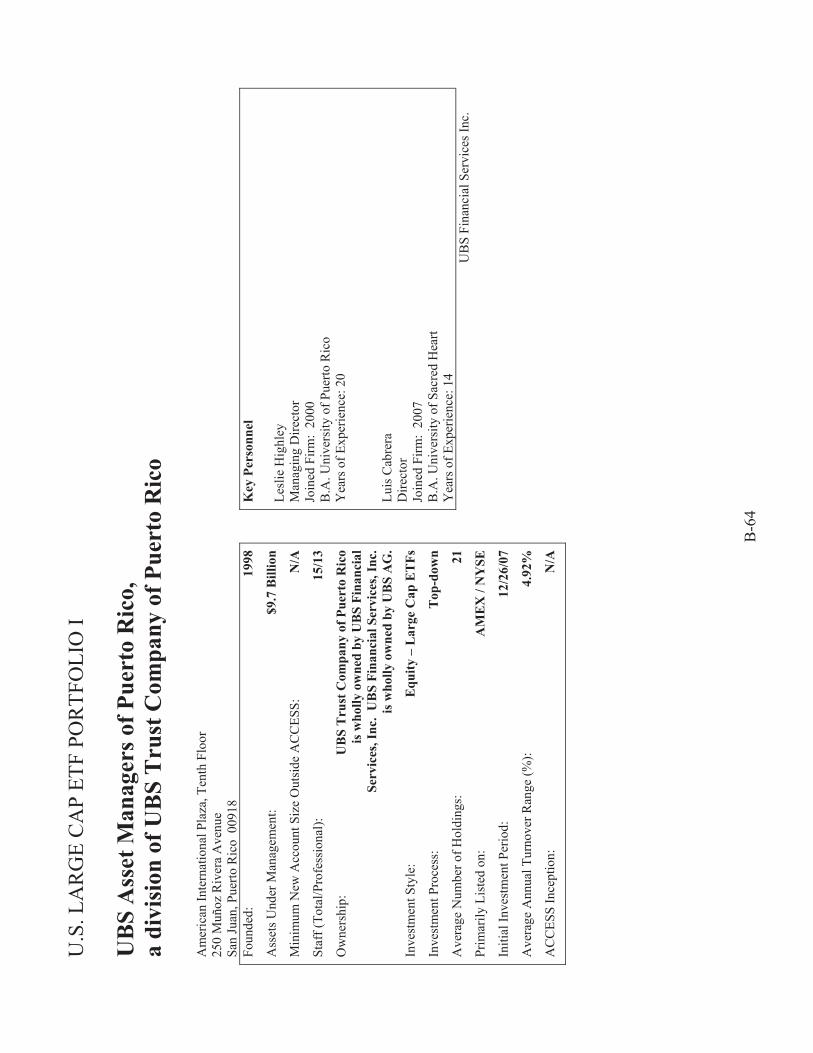
U.S
. LA
RG
E C
AP
ETF
POR
TFO
LIO
I
B-6
4
UB
S A
sset
Man
ager
s of P
uert
o R
ico,
a
divi
sion
of U
BS
Tru
st C
ompa
ny o
f Pue
rto
Ric
o A
mer
ican
Inte
rnat
iona
l Pla
za, T
enth
Flo
or
250
Muñ
oz R
iver
a A
venu
e Sa
n Ju
an, P
uerto
Ric
o 0
0918
Fo
unde
d:
1998
Ass
ets U
nder
Man
agem
ent:
$9
.7 B
illio
n
Min
imum
New
Acc
ount
Siz
e O
utsi
de A
CC
ESS:
N
/A
Staf
f (To
tal/P
rofe
ssio
nal):
15
/13
Ow
ners
hip:
U
BS
Tru
st C
ompa
ny o
f Pue
rto
Ric
o
is w
holly
ow
ned
by U
BS
Fina
ncia
l
Serv
ices
, Inc
. U
BS
Fina
ncia
l Ser
vice
s, In
c.
is
who
lly o
wne
d by
UB
S A
G.
Inve
stm
ent S
tyle
: E
quity
– L
arge
Cap
ET
Fs
Inve
stm
ent P
roce
ss:
Top
-dow
n
Ave
rage
Num
ber o
f Hol
ding
s:
21
Prim
arily
Lis
ted
on:
AM
EX /
NY
SE
Initi
al In
vest
men
t Per
iod:
12
/26/
07
Ave
rage
Ann
ual T
urno
ver R
ange
(%):
4.
92%
AC
CES
S In
cept
ion:
N
/A
Key
Per
sonn
el
Lesl
ie H
ighl
ey
Man
agin
g D
irect
or
Join
ed F
irm:
2000
B
.A. U
nive
rsity
of P
uerto
Ric
o
Yea
rs o
f Exp
erie
nce:
20
Luis
Cab
rera
D
irect
or
Join
ed F
irm:
2007
B
.A. U
nive
rsity
of S
acre
d H
eart
Yea
rs o
f Exp
erie
nce:
14
UB
S Fi
nanc
ial S
ervi
ces I
nc.

B
-65
Inve
stm
ent P
hilo
soph
y
UB
S A
sset
Man
ager
s of
Pue
rto R
ico,
a
divi
sion
of
UB
S Tr
ust C
ompa
ny o
f Pu
erto
R
ico,
is
th
e In
vest
men
t A
dvis
er o
f th
e U
.S.
Larg
e C
ap E
TF
Portf
olio
I
Fund
. Th
e In
vest
men
t A
dvis
er
is
loca
ted
at
Am
eric
an
Inte
rnat
iona
l Pl
aza,
Ten
th F
loor
, 250
M
uñoz
R
iver
a A
venu
e,
San
Juan
Pu
erto
Ric
o 00
918.
As
of N
ovem
ber
30,
2008
, U
BS
Ass
et M
anag
ers
of
Puer
to
Ric
o se
rves
as
in
vest
men
t ad
vise
r or
co-
inve
stm
ent
advi
ser
to
fund
s w
ith c
ombi
ned
portf
olio
ass
ets
of a
ppro
xim
atel
y $9
.7 b
illio
n.
Inve
stm
ent P
roce
ss
UB
S A
sset
Man
ager
s of
Pue
rto R
ico
atte
mpt
s to
out
perf
orm
its
benc
hmar
k by
ove
rwei
ghtin
g th
ose
sect
ors
whi
ch
belie
ves
will
ben
efit
the
mos
t w
hile
un
derw
eigh
ting
the
sect
ors
whi
ch
belie
ves
will
un
derp
erfo
rm.
The
Puer
to R
ico
Secu
ritie
s Po
rtion
of
this
Po
rtfol
io w
ill b
e in
vest
ed i
n Pu
erto
R
ico
cash
and
cas
h eq
uiva
lent
s an
d w
ill
purc
hase
S&
P 50
0®
inde
x fu
ture
s. Th
e ob
ject
ive
of t
he f
utur
es
stra
tegy
is to
ach
ieve
a ri
sk a
nd re
turn
pr
ofile
tha
t ap
prox
imat
es t
he r
esul
t th
at m
ight
be
achi
eved
by
inve
stin
g
the
asse
ts
of
the
Puer
to
Ric
o Se
curit
ies
Porti
on o
n th
e se
curit
ies
enco
mpa
ssed
in
the
S&P
500®
stoc
k in
dex.
The
adv
iser
bel
ieve
s th
is i
s a
cost
eff
ectiv
e w
ay o
f atta
inin
g si
mila
r re
sults
to
th
e S&
P 50
0®
whi
le
com
plyi
ng w
ith th
e re
quire
men
ts th
at
at l
east
20%
of
the
ETF
portf
olio
as
sets
be
in
vest
ed
in
Puer
to
Ric
o se
curit
ies.
UB
S Fi
nanc
ial S
ervi
ces I
nc.
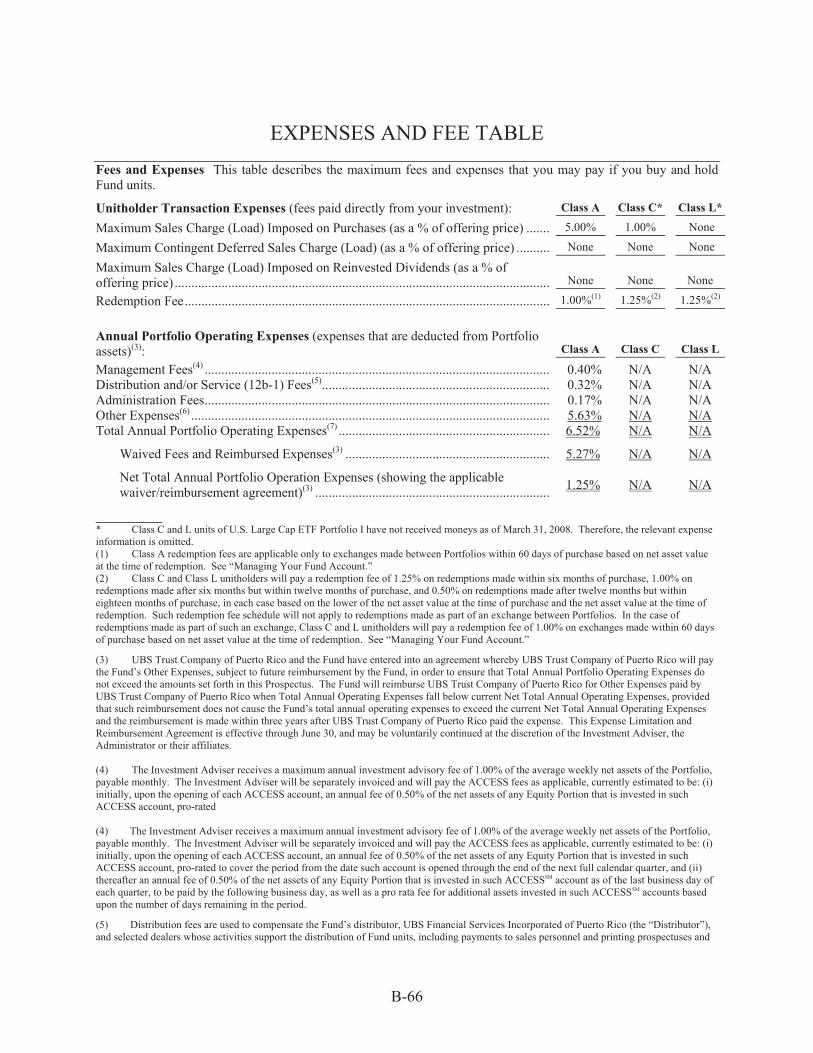
B-66
EXPENSES AND FEE TABLE
Fees and Expenses This table describes the maximum fees and expenses that you may pay if you buy and hold Fund units.
Unitholder Transaction Expenses (fees paid directly from your investment): Class A Class C* Class L*
Maximum Sales Charge (Load) Imposed on Purchases (as a % of offering price) ........ 5.00% 1.00% None
Maximum Contingent Deferred Sales Charge (Load) (as a % of offering price) ........... None None None
Maximum Sales Charge (Load) Imposed on Reinvested Dividends (as a % of offering price) ................................................................................................................. None
None None
Redemption Fee .............................................................................................................. 1.00%(1) 1.25%(2) 1.25%(2)
Annual Portfolio Operating Expenses (expenses that are deducted from Portfolio assets)(3): Class A
Class C Class L
Management Fees(4) ....................................................................................................... 0.40% N/A N/A Distribution and/or Service (12b-1) Fees(5) .................................................................... 0.32% N/A N/A Administration Fees ....................................................................................................... 0.17% N/A N/A Other Expenses(6) ........................................................................................................... 5.63% N/A N/A Total Annual Portfolio Operating Expenses(7) ............................................................... 6.52% N/A N/A
Waived Fees and Reimbursed Expenses(3) ............................................................. 5.27% N/A N/A
Net Total Annual Portfolio Operation Expenses (showing the applicable waiver/reimbursement agreement)(3) ...................................................................... 1.25% N/A N/A
__________ * Class C and L units of U.S. Large Cap ETF Portfolio I have not received moneys as of March 31, 2008. Therefore, the relevant expense information is omitted. (1) Class A redemption fees are applicable only to exchanges made between Portfolios within 60 days of purchase based on net asset value at the time of redemption. See “Managing Your Fund Account.” (2) Class C and Class L unitholders will pay a redemption fee of 1.25% on redemptions made within six months of purchase, 1.00% on redemptions made after six months but within twelve months of purchase, and 0.50% on redemptions made after twelve months but within eighteen months of purchase, in each case based on the lower of the net asset value at the time of purchase and the net asset value at the time of redemption. Such redemption fee schedule will not apply to redemptions made as part of an exchange between Portfolios. In the case of redemptions made as part of such an exchange, Class C and L unitholders will pay a redemption fee of 1.00% on exchanges made within 60 days of purchase based on net asset value at the time of redemption. See “Managing Your Fund Account.”
(3) UBS Trust Company of Puerto Rico and the Fund have entered into an agreement whereby UBS Trust Company of Puerto Rico will pay the Fund’s Other Expenses, subject to future reimbursement by the Fund, in order to ensure that Total Annual Portfolio Operating Expenses do not exceed the amounts set forth in this Prospectus. The Fund will reimburse UBS Trust Company of Puerto Rico for Other Expenses paid by UBS Trust Company of Puerto Rico when Total Annual Operating Expenses fall below current Net Total Annual Operating Expenses, provided that such reimbursement does not cause the Fund’s total annual operating expenses to exceed the current Net Total Annual Operating Expenses and the reimbursement is made within three years after UBS Trust Company of Puerto Rico paid the expense. This Expense Limitation and Reimbursement Agreement is effective through June 30, and may be voluntarily continued at the discretion of the Investment Adviser, the Administrator or their affiliates. (4) The Investment Adviser receives a maximum annual investment advisory fee of 1.00% of the average weekly net assets of the Portfolio, payable monthly. The Investment Adviser will be separately invoiced and will pay the ACCESS fees as applicable, currently estimated to be: (i) initially, upon the opening of each ACCESS account, an annual fee of 0.50% of the net assets of any Equity Portion that is invested in such ACCESS account, pro-rated (4) The Investment Adviser receives a maximum annual investment advisory fee of 1.00% of the average weekly net assets of the Portfolio, payable monthly. The Investment Adviser will be separately invoiced and will pay the ACCESS fees as applicable, currently estimated to be: (i) initially, upon the opening of each ACCESS account, an annual fee of 0.50% of the net assets of any Equity Portion that is invested in such ACCESS account, pro-rated to cover the period from the date such account is opened through the end of the next full calendar quarter, and (ii) thereafter an annual fee of 0.50% of the net assets of any Equity Portion that is invested in such ACCESSSM account as of the last business day of each quarter, to be paid by the following business day, as well as a pro rata fee for additional assets invested in such ACCESSSM accounts based upon the number of days remaining in the period.
(5) Distribution fees are used to compensate the Fund’s distributor, UBS Financial Services Incorporated of Puerto Rico (the “Distributor”), and selected dealers whose activities support the distribution of Fund units, including payments to sales personnel and printing prospectuses and

B-67
reports and the preparation, printing and distribution of sales literature and advertising material. Service fees are used to compensate the Underwriter and selected dealers for account maintenance and other unitholder services.
(6) “Other Expenses” includes fees for certain unitholder services, custodial and transfer agency fees, legal, regulatory and accounting fees, printing costs and registration fees. The Fund initially pays for any advertising and other marketing expenses, subject to the Distributor’s obligation to reimburse the Fund within ten (10) days of the first business day of the month after which such expenses were incurred.
(7) In addition, the Fund will incur additional indirect expenses, which are not expected to be significant, because the Fund’s available cash balances are automatically invested in money market mutual funds, including, as permitted by law, those affiliated with the Fund, the Investment Adviser and UBS Financial Services Inc. Such affiliated money market funds either have no sales load, distribution fees or service fees or the Investment Adviser will waive a sufficient amount of its advisory fee to offset the cost of such fees. However, such affiliated money market funds will incur administration and management fees and have other expenses, which will therefore be partially indirectly borne by the Fund, and as a result by its unitholders, in addition to the fees charged to unitholders by the Fund.
Class A, Class C and Class L units are subject to an ongoing annual distribution fee of 0.10%, 0.75% and 0.50%, respectively, of the average weekly net assets of that class. Class A, Class C and Class L units are subject to an ongoing annual service fee of 0.25% of the average weekly net assets of that class. As a result, long-term Fund unitholders may pay more than the economic equivalent of the maximum front-end sales charge permitted by the Financial Industry Regulatory Authority(“FINRA”) for investment companies registered under the 1940 Act. The Fund will not, however, permit aggregate sales charges (including distribution fees) to exceed the maximum sales charge limits applicable under the FINRA rules.
The sales charges set forth in the above table are the maximum charges imposed on purchases or redemptions (including exchanges) of units and unitholders may actually pay lower charges, depending on the amount purchased, the amount of time held or certain other factors. Investors should inquire as to the availability of these lower “breakpoint” charges prior to making an investment. Example
The following example is intended to assist you in understanding the various costs that you, as a unitholder of this Portfolio, will bear directly or indirectly and to help you compare the cost of investing in this Portfolio with the cost of investing in other mutual funds. The example assumes payment by the Portfolio of operating expenses at the levels set forth in the tables above with an adjustment to reflect reduced annual expenses resulting from completion of the amortization of initial organization expenses and offering cost. Although your actual costs may be higher or lower, based on the assumptions stated below, your costs would be as follows:
Portfolio 1 Year 3 Years* 5 Years* 10 Years* You would pay the following expenses on a $1,000 investment, assuming (1) a 5.00% annual return and (2) redemption at the end of each time period:
Class A $62 $189 $311 $602 Class C (Estimate) $39 $69 $112 $230 Class L (Estimate) $27 $52 $90 $195 You would pay the following expenses on the same investment, assuming the same annual return and no redemption:
Class A $62 $189 $311 $602 Class C (Estimate) $29 $69 $112 $230 Class L (Estimate) $16 $52 $90 $195 * The expense amounts shown do not reflect the continuation of the waiver of fees and expenses beyond the first year. As stated in note (3) to the Fees and Expenses table above, the Expense Limitation and Reimbursement Agreement may be changed or terminated at any time after June 30, 2009. If the waivers are voluntarily continued by the Investment Adviser or the Administrator, the expenses shown may be lower for the periods in which the waiver applies. The examples also provide a means for you to compare expense levels of investment companies with different fee structures over varying investment periods. To facilitate such comparison the Fund has used a 5% annual return assumption. However, your actual annual return will vary and may be greater or less than 5%. These examples should not be considered a representation of past or future expenses and actual expenses may be greater or less than those shown above.

[This page intentionally left blank.]

APPENDIX C
PUERTO RICO RESIDENCY REPRESENTATION LETTER (INDIVIDUAL)
TO: UBS Financial Services Incorporated of Puerto Rico San Juan, Puerto Rico
RE: Puerto Rico Residency Status
To Whom It May Concern:
I provide the following information and representations in connection with opening and maintaining my account with UBS Financial Services Incorporated of Puerto Rico. In my account I may hold or purchase certain investments, including, but not limited to, closed-end and open-end mutual funds, preferred stock, and debt securities, that are not registered under the U.S. Securities Act of 1933 or the U.S. Investment Company Act of 1940 (“Puerto Rico Investments”) and are exempt from registration under the U.S. Securities Act of 1933 and/or the U.S. Investment Company Act of 1940, based, in part, on the requirement that they be offered or sold only to individuals who have their principal residence in Puerto Rico (“Puerto Rico Residents”), all as disclosed in their respective prospectuses or offering materials.
Accordingly, I hereby represent to you that:
1. I have acquired or propose to acquire Puerto Rico Investments for my own account and will be the sole beneficial owner thereof.1
2. As of the date of this letter, I am an individual whose principal residence is in Puerto Rico.
3. If I cease to be a resident of Puerto Rico, I will (i) notify you or the Fund within 30 days of ceasing to be a resident of Puerto Rico, (ii) liquidate my holdings in any Puerto Rico Investment when such liquidation becomes economically feasible, and (iii) not acquire additional Puerto Rico Investments.
4. I hereby acknowledge that if at the time of purchase of Puerto Rico Investments I am not a Puerto Rico Resident, UBS may declare any such purchase to be null and void.
5. I acknowledge that any purchases of Puerto Rico Investments will not be made on behalf of a retirement plan subject to ERISA.
_________________________ ____________________ Signature Date
_________________________ ____________________ Name Account Number
1 If Puerto Rico Investments are purchased/held in a joint account, each co-owner must execute this Representation Letter.
C-1

PUERTO RICO RESIDENCY REPRESENTATION LETTER (FOR BUSINESS ORGANIZATIONS)
TO: UBS Financial Services Incorporated of Puerto Rico San Juan, Puerto Rico
RE: Puerto Rico Residency Status
To Whom It May Concern:
We provide the following information and representations in connection with opening and maintaining our account with UBS Financial Services Incorporated of Puerto Rico. In our account we may hold or purchase certain investments, including, but not limited to, closed-end and open-end mutual funds, preferred stock, and debt securities, that are not registered under the U.S. Securities Act of 1933 or the U.S. Investment Company Act of 1940 (“Puerto Rico Investments”) and are exempt from registration under the U.S. Securities Act of 1933 and/or the U.S. Investment Company Act of 1940, based, in part, on the requirement that they be offered or sold only to individuals who have their principal residence in Puerto Rico or to corporations or other business organizations that have their principal office and principal place of business within Puerto Rico (“Puerto Rico Residents”), all as disclosed in their respective prospectuses or offering materials.
Accordingly, we hereby represent to you that:
1. We have acquired or propose to acquire Puerto Rico Investments for our own account and will be the sole beneficial owner thereof.
2. As of the date of this letter, we are a corporation, partnership, or other form of business organization that has its principal office and principal place of business within Puerto Rico that has not been organized for the purpose of acquiring Puerto Rico Investments and, if organized as a trust, the trustee and all beneficiaries of the trust are residents of Puerto Rico.
3. If, as of the date of this letter we are organized as a non-business trust, the trust has its principal office and principal place of business within Puerto Rico and the trustee and all beneficiaries of the trust are Puerto Rico Residents.
4. If we cease to be a Puerto Rico Resident, we will (i) notify you within 30 days of ceasing to be a Puerto Rico Resident, (ii) liquidate our holdings in any Puerto Rico Investment when such liquidation becomes economically feasible, and (iii) not acquire additional Puerto Rico Investments.
5. We acknowledge that any purchases of Puerto Rico Investments will not be made on behalf of a retirement plan subject to ERISA.
C-2

5. We hereby acknowledge that if at the time of purchase of Puerto Rico Investments we are not Puerto Rico Residents, UBS may declare any such purchase null and void.
_________________________ ____________________ Signature Date
_________________________ ____________________ Name Account Number
_________________________ Business Organization
C-3

PUERTO RICO RESIDENCY REPRESENTATION LETTER FOR SECURITIES DEALERS
[Date]
TO: [Name of Underwriter or Dealer] Multi-Select Securities Puerto Rico Fund San Juan, Puerto Rico
RE: MULTI-SELECT SECURITIES PUERTO RICO FUND
Dear Sirs:
The Multi-Select Securities Puerto Rico Fund (the “Fund”) has represented in the Prospectus of the Fund that the Fund is exempt from registration under the Securities Act of 1933 and the U.S. Investment Company Act of 1940, and that Units of the Fund may only be sold in accordance with the Prospectus of the Fund, and then only to individuals who have (a) their principal residence in Puerto Rico or to corporations or other business organizations that have their principal office and principal place of business within Puerto Rico or to trusts all of whose beneficiaries are residents of Puerto Rico and (b) executed a Puerto Rico Residency Representation Letter. In addition, the Units of the Fund may be redeemed, but may not be resold or transferred except by operation of law to a Puerto Rico resident who has provided a similar letter. Any purported sale or transfer that does not comply with these restrictions will be null and void. We are a Puerto Rico securities dealer buying Units as an authorized dealer for the account of one of our clients (the “Client”). We and the Client will comply with the above restrictions. In addition, based on the information provided to us in writing by the Client, including a letter of representation substantially similar to this letter signed by the Client, and such other facts as reasonably are or should be known to us, we represent to you that:
1. The Client will be the sole beneficial owner of the Units.
2. At the time the Units were offered to us the Client was, and as of the date of this letter the Client is either (i) an individual whose principal residence is in Puerto Rico or (ii) a corporation, partnership, trust or other form of business organization that has its principal office and principal place of business within Puerto Rico, and that has not been organized for the purpose of acquiring the Units.
3. If we are informed that the Client has ceased to have its residence within Puerto Rico (in case the Client is an individual) or its principal office or principal place of business within Puerto Rico (in case the Client is a business organization), we will (i) notify you or the Fund within 30 days, (ii) require the Client to liquidate the investment in the Fund when such liquidation becomes economically feasible, and (iii) agree not to acquire additional Units for the account of the Client.
Very truly yours,
_______________________ Name: Title:
C-4

Printed on Recycled PaperIMAGEMASTER 800.452.5152
If you want more information about the Fund, the following documents are available free upon request:
Annual/Quarterly Reports
Additional information about the Fund’s investments is available in the Fund’s annual and quarterly report to unitholders.
Statement of Additional Information (SAI)
The SAI provides more detailed information about the Fund and is incorporated by reference into this Prospectus.
You may discuss your questions about the Fund by contacting your UBS Financial Advisor or other selected securities dealer. You may obtain free copies of annual and quarterly reports, and the SAI by contacting the Fund directly at 1-787-773-3888.
Prospectus
December 8, 2008