multi-state advanced manufacturing consortium taaccct
TRANSCRIPT

Multi-State Advanced Manufacturing Consortium TAACCCT Round II Grant – FINAL EVALUATION REPORT 1
Presented by Corporation for a Skilled Workforce (CSW) and the New Growth Group, LLC.
Multi-State Advanced Manufacturing
Consortium (M-SAMC) TAACCCT Round II Grant Final Evaluation Report
November 2016

Multi-State Advanced Manufacturing Consortium TAACCCT Round II Grant – FINAL EVALUATION REPORT 2
Multi-State Advanced Manufacturing Consortium (M-SAMC)
TAACCCT Grant Final Evaluation Report
Executive Summary
Overview
Corporation for a Skilled Workforce (CSW) and New Growth Group (New Growth) comprise the evaluation team for the Multi-State Advanced Manufacturing Consortium (M-SAMC). CSW was responsible for the implementation evaluation, and New Growth oversaw the outcomes and impact evaluation. Throughout, CSW and New Growth have collaborated closely with each other, with the consortium staff, and with the thirteen member colleges to assess progress against the grant expectations, as drawn from the funded project proposal and design, and to document examples of how the activities of individual colleges (or groups of colleges not constituting the total population) have advanced competency-based education. During the course of the grant, the evaluators met frequently with the project staff, primarily through video conference calls. These calls served to not only provide evaluation updates but also covered general consortium activities so that the evaluators were kept apprised of policy and product progress. The evaluators also conducted interviews and site visits, and participated in various consortium learning sessions to get a better perspective on the consortium’s achievements and challenges.
CSW and New Growth are pleased to present this final evaluation report covering the evaluation work completed over the life of the grant. The format largely follows the recommended elements of the Executive Summary provided by the Department of Labor in its August 2016 guidance. Each section, in addition to discussing the consortium’s efforts as a whole, gives specific examples of how individual colleges were successful in implementing a specific deliverable. These examples do not necessarily represent implementation at all colleges.
TAACCCT Program/Intervention Description and Activities
The Multi-State Advanced Manufacturing Consortium (M-SAMC) represents a collaboration of 13 partner colleges across 10 states whose shared aim is to design innovative program models to improve manufacturing education. Led by Henry Ford College, the M-SAMC consortium partners include: Rock Valley College, Oakland Community College, Rhodes State College, Bluegrass Community & Technical College, Bridge Valley Community & Technical College, Danville Community College, Jefferson Community & Technical College, Spartanburg Community College, Pellissippi State Community College, Gadsden State Community College, Tennessee College of Applied Technology at Murfreesboro, and Alamo Colleges.
In their Project Abstract, the M-SAMC consortium described their TAACCCT grant effort as an aim to “bridge the disconnect between the needs of the workplace and the content of manufacturing curriculum in most colleges, transform the face of manufacturing education in their institutions and establish a model for program transformation applicable to many industries. The program aims to use a competency-based model to develop new and modified industry-driven manufacturing curricula and credentials, transform instructional design and delivery systems to accelerate and contextualize learning; redesign student support, success and placement strategies to increase credential attainment; and develop administrative structures to support instructional design.”
This TAACCCT-funded project was a continuation of work begun under a National Science Foundation grant that brought automotive employers together to collectively impact community colleges’ responsiveness to industry needs through competency-based education. That NSF grant was the beginning of a partnership among some,
Multi-State Advanced Manufacturing Consortium TAACCCT Round II Grant – FINAL EVALUATION REPORT 3
but not all, of the M-SAMC consortium members. The subsequent TAACCCT grant support expanded the work started under the NSF grant through deeper exploration of how competency-based education could be taught across a broad array of community colleges.
The M-SAMC consortium’s application for TAACCCT funding described their approach to achieving this aim through the following strategies.
Strategy 1 - Use a competency-based model to develop new and modified industry-driven manufacturing curriculum and credentials. Strategy 1 outlined eight deliverables that defined how the consortium intended to implement the overall strategy.
Strategy 2 - Transform instructional design and delivery systems to accelerate and contextualize learning. Strategy 2 outlined five deliverables that defined how the consortium intended to implement the overall strategy.
Strategy 3 - Redesign student supports, success and placement strategies to increase credential attainment. Strategy 3 outlined five deliverables that defined how the consortium would implement the overall strategy. These deliverables were:
Strategy 4 - Develop administrative structures to support instructional redesign. Strategy 4 outlined three deliverables that defined how the consortium intended to implement the overall strategy. These deliverables were:
In total, the grant proposal outlined twenty-one separate deliverables (outlined in detail below). For the consortium, these deliverables represented the next steps in an ongoing effort to move manufacturing education to a competency-based delivery model. The work on this approach started with a previously mentioned National Science Foundation grant that had substantial industry input. Representative industries were important players in identifying the colleges that would make up the consortium. The original consortium model, as described in the approved proposal, was predicated on being able to build on the Automotive Manufacturing Technical Education Collaborative (AMTEC) related curricula development that was thought to be a good fit for the consortium’s objectives. Over a year was spent examining varying ways to actualize the AMTEC model.
The consortium ultimately faced the reality that the AMTEC model was not embraced by all colleges, and that as it was then structured it was not a good fit to transform manufacturing education to a competency-based delivery system. The consensus emerged that a new (improved) model was needed. This realization was the result of extensive examination of potential paths to follow and deep research by consortium workgroups and members. However, there was one key component of the AMTEC process that was uniformly supported by the consortium. It involved using the Integrated Manufacturing Systems Trainer (IMST) as a key vehicle to move to a competency-based model.
The consortium evolved to a somewhat bi-furcated implementation model, with a clear centralized emphasis on ensuring major industry standard equipment (the IMST) was purchased and in place at all colleges – a $4 million plus investment – and that, over the course of the grant, uniform training was provided to all colleges on how to incorporate that equipment into integrated manufacturing system simulations. The other key process the consortium followed was employing a de-centralized model aligned with the group’s motto of “National Innovation; Local Implementation”, designed prior to the group’s first meeting in 2012, to help consortium Implementation Facilitators understand their dual roles as both a Local Implementer, and a strategy team member in the development of national improved processes and tools to accelerate each local institution’s transition to competency-based education (CBE). This “National Innovation, Local Implementation” approach focused the central consortium work on research and development of general guidance and recommended approaches to achieve the proposed M-SAMC strategies. Each college was encouraged, but not required, to use
Multi-State Advanced Manufacturing Consortium TAACCCT Round II Grant – FINAL EVALUATION REPORT 4
the models developed. Much effort went into building on the successes of different colleges who were leaders in specific deliverables and ensuring all colleges were well acquainted with how those emerging models operated.
The consortium intentionally employed a collective approach to developing the models used as guidance. M-SAMC organized workgroups, representing all the member colleges, to develop the guidance and collaborative models. Three key central areas were identified: 1. Creating a better way to assess employer needs and potentially reflecting those needs in curricula decisions through development of Performance-Based Objectives (PBOs); 2. Incorporating integrated system troubleshooting at all colleges using the IMSTs; and 3. Improvements in student supports through the funding of newly created Participant Engagement Facilitators at each college. Each of these areas will be discussed in more depth later in this summary.
While not adopted by all colleges during the life of the grant, the Performance Based Objectives have become the crowning innovative achievement of the consortium. This new tool for automotive manufacturing education and training continues to be refined, using other funds, and work is underway to expand the process to totally unrelated disciplines. The M-SAMC website, www.msamc.org contains multiple videos and stories related to the development, importance, and implementation of PBOs.
Population Served The original population to be served, as identified in the grant, was TAA-like individuals (older, less skilled adult learners). While a limited number of such individuals were served, as is the case with many TAACCCT grantees, the demands of manufacturing for highly skilled, multi-faceted industrial maintenance workers demanded high entry level skills in order to complete the courses of study for this field. The consortium faced a conundrum encountered by many others – the skill shortages in advanced manufacturing are in the highly technical industrial maintenance field, where a technician is expected to be able to deal with a wide variety of complex, inter-related problems involving hydraulics, electrical, pneumatics, automation and controls technology and other aspects of the sophisticated manufacturing machinery of today.
For the most part, the pool of individuals who can grasp these complex concepts and operate in that environment are those with high aptitudes and solid academic backgrounds. That is the typical profile of M-SAMC consortium participants. There have been notable exceptions with efforts made to develop more aggressive career pathways and to create models for bridge programs but, within the time available for implementation, higher skilled applicants have been the primary pool from which to draw.
As will be explored in more depth below, the third year evaluation process included visits to four colleges to assess implementation processes, successes, and challenges. These four were chosen by the consortium staff as representative of the wide range of implementation progress and differing local contexts within the consortium. Looking across the current data for participants (see comment below about ongoing efforts to update the participant pool; data was available for only three colleges at the time of this writing), the picture is one of more than half of the participants having some college or a degree, indicating a more educated pool of participants being served than the typical profile of TAA-like individuals.
The evaluation team notes that the above conclusion is grounded in data available at the time of writing this report. It uses the grant requirement that for participants to be counted in the grant they must be enrolled in the program overall and specifically enrolled in courses or courses of study that are included in the Inventory of Products, which is the repository for grant impacted courses. These are the courses that are used in the final impact evaluation. During the development of this final implementation evaluation, efforts were still underway to build up the Inventory with courses that had been developed with grant support but were not as yet on the Inventory. There is expectation that the Inventory may expand right up until the final days of the grant. But for now the analysis is based on what is on the Inventory as of early September 2016. The vast majority of courses of study on the Inventory now are AAS degree oriented or quite high level certificate programs.

Multi-State Advanced Manufacturing Consortium TAACCCT Round II Grant – FINAL EVALUATION REPORT 5
It is worth noting that, beyond the specific boundaries of M-SAMC TAACCCT-funded activities that occurred uniformly across the consortium, there are many examples of approaches developed for and actively serving TAA-like populations. In addition to a solid bridge model developed by the consortium, there are examples of implementation successes - briefly cited here and explained in more detail in the full report - that include examples of services for TAA-like populations, such as:
A key grant sponsored program designed in partnership with industry and a workforce agency, SEMCA (South-East Community Alliance), is the UAW-Ford Welding Training program, designed specifically for displaced workers, veterans, and unemployed and low income individuals at Henry Ford College.
Henry Ford College’s (HFC), Michigan Technology Education Center (M-TEC), in conjunction with a local Workforce Innovation and Opportunity Act (WIOA) service provider, developed an “Advanced Manufacturing Awareness Program”.
Summary of Evidence-Based/Promising Models Used for Design The importance of competency-based education has been well documented. The majority of the consortium efforts, both through the use of common industry respected simulators, and through the consortium developed models, have been aimed at fundamentally strengthening the delivery of competency-based education.
Examples of how competency-based education has been implemented in consortium colleges include:
Kentucky and Michigan: Blue Grass Community & Technical College and Henry Ford College created new or significantly updated versions of comprehensive modularized curricula.
Michigan: M-SAMC partner colleges in Michigan designed and delivered a new accelerated cohort based training and education model which has become the statewide standard for competency-based education for occupational programs. The model is known as, MAT2, (“MAT Two”), or the Michigan Advanced Technician Training Program.
South Carolina: Spartanburg CC developed skills/task checkoff sheets in credit class labs to validate student skills in real-time demonstrating CBE based topic learning initially on general competencies, and later on PBO based course outcome topics appended to existing curricula.
Tennessee: Nissan successfully used AMTEC curricula materials working closely with the NSF sponsored AMTEC staff in Kentucky, resulting in an intense CBE based educational partnership over three years. All current and new Nissan manufacturing technician training will use AMTEC and M-SAMC educational tools for technician manufacturing skills development, company-wide.
10 Partner States/All College Partners: With tools for CBE based course implementation created through M-SAMC, and those developed by AMTEC, all schools are using the competency-based curricula/CBE “learning objects”, the (IMST) manufacturing simulator for systems understanding and troubleshooting training, and employing the comprehensive skills focused student evaluation and assessment rubrics for course completion.
Evaluation Design Summary
As stated in the RFP for this evaluation released by Henry Ford Community College, the overall purpose of the evaluation is to collect, analyze, and interpret data pertaining to the project that will (a) lead to continuous improvement and (b) determine the extent to which various program components are associated with positive outcomes and impacts in the lives of program participants.
Continuous improvement is defined to include activities that occurred within and beyond the grant period and/or had impact at specific colleges (not necessarily the entire group). Examples include:

Multi-State Advanced Manufacturing Consortium TAACCCT Round II Grant – FINAL EVALUATION REPORT 6
Industry aligned topic areas through the use of industry based PBOs (Performance Based Objectives), including Integrated Manufacturing Systems Troubleshooting skills on the new simulators at each school, represented a “disruptive innovation” at each school that will change the course or direction of programs towards industry and educational standards.
Overall, the key components of sustained industry engagement, faculty development, industry like lab equipment acquisition and integration, particularly the Integrated Manufacturing Systems Trainer simulators and their utilization, which require a team approach between local industry and educational partners, provide the long term foundation for continuous improvement in competency-based manufacturing education at M-SAMC schools and partners.
Implementation Evaluation
The SGA included four key implementation questions that were to drive the implementation evaluation. Summarized, they were: 1) How was the particular curriculum selected; 2) How were programs and program design improved or expanded using grant funds; 3) Did the grantee conduct in-depth assessment to select participants; and 4) What contributions did each of the partners make in terms of curriculum development, recruitment, training, placement, program management, leveraging resources, and commitment to program sustainability.
As a result of the consortium’s decision to recognize the AMTEC curriculum as one of several options to satisfy employer skills development requirements, many new approaches were developed. These focused on how to broaden the educational tools used to better engage and educationally service employers. The work of the consortium focused more on Competency Based Education (CBE) process modeling, organizational skills development, and instructional tool development instead of a set of specific and incomplete curricular mandates for member colleges to adopt the new CBE model.
Henry Ford College (the institution has transitioned to a new name since the grant was awarded) has been particularly aggressive in ensuring the deliverables have been implemented within its own structure and in sharing the lessons learned with other colleges. Based on the Inventory and the results of the evaluation products noted below, it has been a more mixed picture at other colleges - with movement on some of the deliverables, but not all. Based on the language in the grant, we interpret full achievement as all colleges having actually implemented the deliverables (i.e., students enrolled in grant supported courses, or put into practice local variations of the new operating models).
Some key examples of partial implementation include:
Two M-SAMC partner colleges, Tennessee College of Applied Technology (TCAT) in Murfreesboro and Pellissippi State Community College (PSCC) in Knoxville, developed articulation agreements through which students with non-credit bearing TCAT diplomas can earn PSCC credit towards a degree or certificate. This activity has sparked the interest of several other TCATs across the state of Tennessee, and is expected to become a statewide standard for articulation between TCATs and Tennessee colleges.
While not fully implemented to the same degree at every college, the IMST Simulators, and newly developed conversion kits that address a broader array and application of industry specific equipment, improve programs by focusing on integrated technological systems understanding, and are a keystone for employer-college CBE program alignment in manufacturing.
A clear trend demonstrating an increase in the companies and schools inside and outside the consortium utilizing PBOs as a basis for curricular skills outcomes, gap analyses between local employers and colleges, and more focused skills based educational programming.

Multi-State Advanced Manufacturing Consortium TAACCCT Round II Grant – FINAL EVALUATION REPORT 7
The four implementation questions are explored in more depth in the full report. In summary, the implementation evaluation included five components:
An end of 2013 series of phone interviews with all of the participating colleges, to assess how they were progressing on their local implementation strategies, their participation and support for the centralized model development and internal management of the consortium, and recommendations the colleges had for going forward. These interviews resulted in a status report to the consortium leadership on the perceptions, primarily, of the local program facilitators on their internal issues and their participation in the evolving consortium structure and processes. The product was a written report to the consortium.
A summer of 2014 series of phone interviews and limited surveys of faculty, employers, and students, focusing on three key areas that had emerged as the overall consortium signature products: 1) the development and implementation of Performance-Based Objectives (PBO) (to be described in more depth later but these were an innovative way of assessing actionable employer needs and methods to translate how to fill those needs into curriculum re-design); 2) the status of implementing advanced manufacturing troubleshooting into local courses using the IMSTs (later to be melded with the PBO process); and 3) the assimilation and value-add of Performance Enhancement Facilitators (PEFs) – positions funded from the central consortium to provide student supports and to augment local administrative structures working on data collection, especially the tasks of ensuring participant data was sufficient to meet DOL reporting requirements. The product of this work was both a written report and a PowerPoint presentation to all the colleges on the results.
A summer and fall of 2015 series of on-site case studies of four participating colleges to gather information about their progress on local implementation of the full array of grant deliverables. The colleges were selected by the consortium staff as a representative sample of differing stages of implementation and different approaches to the consortium signature products. The first major evaluation product was a PowerPoint presentation to all the colleges on the results of the case studies and implications for their own college level implementation assessments. A later product, the evaluators’ own capstone project, is an assessment of each case study college against the 21 deliverables in the grant. This was a way to see how each of the deliverables had or was rolling out within four different environments. As noted in the full report, this assessment was based information available at the timing of writing. The consortium was still working on increasing the accuracy of the Inventory of Products and other grant documents that could paint an improved picture when completed.
The evaluators also facilitated learning network video conference calls during early 2015 focused on three key areas: use of PBOs, use of IMSTs, and assimilation and duties of Participant Engagement Facilitators (PEFs). PEFs were staff brought on to all colleges at varying points in 2015, to provide enhanced student supports and assist in other administrative duties primarily aimed at increasing the number of completed Personal Information Forms, the key document used to verify program participation. Representatives from selected colleges participated in each of these calls so that each college was represented in at least one network call. The products from each of these calls were PPT presentations that were provided to all colleges and presented during the weekly coordinator calls, organized by project staff as information and grant activity progress tracking mechanisms.
Ongoing efforts to identify and capture information on selected colleges’ promising practices, such as participation in consortium learning forums, interviews with supporting partners who developed ways to support such efforts as labor market information dashboards, soft skills simulations, and equipment use innovations through virtual and on-line learning.

Multi-State Advanced Manufacturing Consortium TAACCCT Round II Grant – FINAL EVALUATION REPORT 8
M-SAMC Conceptual Framework The consortium’s logic model took two different forms. First was a proven change methodology model originating with Deming's Cycle, or a continuous quality improvement model consisting out of a logical sequence of five repetitive steps for continuous improvement and learning: [1] IDENTIFY (Present & Preferred States), [2] ANALYZE (Best-Fit Innovations), [3] PLAN (Action Steps against Time), [4] IMPLEMENT (Monitor and Recognize), and [5] EVALUATE (Determine the Next Preferred State).
Second, most often used in industry to manage change initiatives, the MSAMC consortium felt the most important aspect of leading large scale (institutional) change is the common agreement of the “Present” and “Preferred” states in the IDENTIFY phase. To help ensure the consortium was improving all critical areas of the Manufacturing Education process, a Manufacturing Education Process Model was used to isolate the critical success factors and align the essential elements of the grant. This served as the key framework for what the consortium was trying to accomplish through the grant. Elements in the framework were aimed at producing models to be implemented locally at the participating colleges. While not mandatory, they became the organizational targets for partners. In many cases they came to fruition late in the grant period and thus had limited effect on participants enrolled in grant supported programs but do clearly have lasting value for further work after the “countable” grant activity.
Both models are depicted in detail in the full report.
Impact Study Design
The primary goals of the Impact Evaluation are to determine the impacts of grant activities on participant employment-related outcomes, including participant earnings, job attainment and retention, and program-related outcomes, including program completion and credit hour attainment. Attempts were made to establish reasonable comparison groups within each college for each program. In most cases, a historical or parallel comparison group was determined, although not in all cases.
Impact Analysis Research Questions The impact research questions are based on the DOL reporting requirements for the annual performance report. For each question listed, we are comparing grant participants in the grant-affected programs of study to comparison group individuals:
1. How many unique participants/comparisons have been served?
2. How many individuals have completed a grant/comparison program of study?
a. Of those, how many are incumbent workers?
3. How many individuals are still retained in their program of study (or other grant-funded program)?
4. How many individuals are retained in other education programs?
5. How many credit hours have been completed?
a. How many students have completed credit hours?
6. How many credentials have been earned by participants/ comparisons?
a. How many students have earned certificates (<1 year)?
b. How many students have earned certificates (>1 year)?
c. How many students have earned degrees?
7. How many students are pursuing further education after program of study completion?

Multi-State Advanced Manufacturing Consortium TAACCCT Round II Grant – FINAL EVALUATION REPORT 9
8. How many participants/comparisons are employed after program of study completion?
9. How many participants/ comparisons are retained in employment for three quarters after program of study completion?
10. What are the earnings of participants/ comparisons relative to before enrollment?
a. How many of those employed at enrollment received a wage increase post-enrollment?
Design Methodology The study design is quasi-experimental. Each program is included in an analysis comparing it to at least one comparison group. Every grant program is matched to one comparison program that is either: 1) different but comparable to the grant program and housed at the same school and followed in parallel during the grant period, or 2) drawn from historical enrollments in the same program of study included in the grant. Comparability of the comparison program to the grant program is based on a) same department, b) same credit/non-credit status of program, c) similar duration of program, and d) similar demographics of individuals entering program. In a few cases, identifying a comparison group within a college’s set of current or historical programs was not possible, so grant programs were matched to other comparison programs within the consortium.
Data Used and Its Reliability Data comes from many different sources:
Students: at intake, students fill out a participant intake form with demographic and other baseline data
Colleges: on an ongoing basis, colleges submit data on their students, including information such as completions
State quarterly earnings records: at the end of the grant period, state wage agencies are contacted to obtain wage data on students
Participant surveys: In states where quarterly earnings records were not accessible, attempts were made to survey participants post-completion to obtain employment and earnings data.
We consider the data to be reliable. The intake form is simple, and we do not believe students struggled to fill it out accurately. College data is part of the ongoing business of an institution of higher learning, and given the relatively simple nature of the college data required, we believe this data is also reliable. Lastly, we have no reason to believe there are systematic inaccuracies in state wage data. Participant surveys were simple and response rates approached 50 percent.
Outcomes and Impacts Measured The outcomes measured are those that allow us to answer the research questions above (completion, credit hours, further education, and employment). The impact is the difference between the treatment group (grant participants) and the control group (comparison group individuals) after adjustment to make the groups as comparable as possible.
Implementation Findings
Capacity Building Capacity building took two different paths within the consortium. There was centrally developed and delivered capacity building related to the IMST. There was also a much more open-ended opportunity for capacity building within each participating college that could be used for any form of development, aimed at any staff through whose development the grant implementation might be enhanced. The implementation evaluation sought
Multi-State Advanced Manufacturing Consortium TAACCCT Round II Grant – FINAL EVALUATION REPORT 10
information about both of these paths in its summer of 2014 interviews and in the 2015 case studies. Probing questions were used to elicit perceptions on the capacity building efforts. Although, for many colleges, the simulator training came late in the grant process, it was highly regarded and seen as crucial to being able to use the simulators in actual course instruction. There were two rounds of this training. All colleges received the first wave of training and about half of the colleges received the second level of training.
Generally, capacity building was covered in-depth in the case studies showing a wide range of activities engaged in by the colleges from seminars to on-line learning, to focused industry developed training for their equipment. The case study summaries contain sections on professional development. Note that the local approaches for the open-ended development were indeed open-ended and took multiple paths according to the local college’s internally perceived needs.
Examples of strong capacity building at the individual college level include:
Based in large part on the increased focus and attention this grant brought to transforming instructional design and delivery systems to accelerate and contextualize learning, many partner colleges made dramatic improvements in their manufacturing education classroom and lab space including new multi-million dollar buildings, either built or started during the implementation period.
Henry Ford College’s Industrial Welding Associate’s Degree Program in 2014 is fully CBE based, providing 99% project focused, competency-based modular courses, flexible scheduling, rapid credit for prior learning processes and the ability for students to begin the lab based program at any point in the first twelve weeks of the 15 week semester. This program easily articulates with high school programs and other adult education welding programs to assign students competency-based credits and clear targets toward industry certifications and job entry or enhancement.
Following the two path approach described above, institutional capacity was developed along two different lines. First, all schools had access to industry standard equipment that most of them had never used. All schools received at least the first level of consortium developed and delivered training on how to use the equipment in an industry-like instructional environment (intentionally necessitated by the structural requirements of the trainer). This Level I Training covers 80% of the most common Manufacturing System faults found in sequencing machines common in advanced manufacturing systems. A second course “Level II Troubleshooting” was developed to cover the remaining 20% of common manufacturing faults, identified by manufacturers. This second training required Instructors to have prior, valid hands-on knowledge in Complex Logic, Robot Program Modification, Manual Programming with a Teach Pendant, and Controller Based Recovery of Machine Sequence. Even with these intense pre-requisites, over half the schools received the Level II Troubleshooting training, often with the support and participation of industry partners.
Second, all schools participated in one or more of the structured workgroups, called “Innovation Teams”, developing the models that would be provided to all schools for adoption or adaption, as fit their local context and priorities. This was the mechanism that facilitated the broad engagement of partner schools at the grant organizational level.
All schools received consortium-procured training on labor market analysis that was extremely highly regarded and was available to partners as well. The workforce system partners were especially complimentary of the training and, at some colleges, brought the trainers back for a second round. It appears that the consortium’s grant-funded efforts substantially helped the M-SAMC schools increase their ability to do their own labor market analysis in manufacturing occupations as defined by their local economy.
Examples of building institutional capacity at the individual college level include:
Dynamic Data Dashboard, a robust new labor market analysis tool, as an ongoing resource for updated information to drive appropriate program and course development.

Multi-State Advanced Manufacturing Consortium TAACCCT Round II Grant – FINAL EVALUATION REPORT 11
In regions where MSSC and Career Readiness Certificates are part of the public employment process for entry level manufacturing workers, these represented the standardized form of an “Accelerated Manufacturing Bridge”.
Building on the NSF AMTEC and M-SAMC partners work, Manufacturing Systems understanding, troubleshooting and repair, was determined as the highest priority basic skill for manufacturing workers at all partner colleges, and further, was refined into a short course eligible for all manufacturing students. The length of time necessary to achieve the basic level of system’s functional understanding was significantly reduced over the grant to 40 contact hours, and eligible for two college credits.
While no one competency-based education curriculum was developed by M-SAMC or utilized by all colleges consistently, all partners worked to identify and/or develop new online teaching and learning resources. Partners mentioned that the approach to online instruction utilized and promoted by the Innovation Team included many strategies that were described as “cutting-edge” by other college departments within their local campus community. This is significant as community college technology programs traditionally lag behind in the use of online or asynchronous learning.
An entire degree platform at HFC, “Multi-Skilled Maintenance Degree”, with over 50 new modular courses was created and added to the product inventory. This program was “field-tested” by students working as company maintenance personnel. In the words of these manufacturers the skills mastered by program students far exceeded any other Open Entry manufacturing maintenance skills programs at the Associate of Applied Science degree level.
HFC created an entirely new registration process for flexible scheduling and student driven skills attainment in college technology labs. These administrative improvements factor in financial aid requirements, student work and family schedules, and an economical approach (1 credit at a time) for student tuition expenses. Even is a student was not able to complete a course within the semester their repeat cost was only one credit.
A wide acceptance at partner colleges of the need to expand manufacturing specific student advising, specifically for competency based education student needs. The Performance Engagement Facilitators helped define a critical student services gap. Many partners are addressing this through their longer term institutional planning and resource allocation.
Important Partnerships Most important for M-SAMC partner colleges were the employer partnerships either developed or strengthened by participation in the consortium. Particularly where there were large employers working with the local colleges, there were opportunities realized to bring those employers’ needs to the table and to work with them to structure delivery that met their needs. This created a foundation for smaller company educational resource development. For example, General Motors Corporation developed over 1,400 individual PBO improvements. They did this utilizing all nodes of their manufacturing infrastructure.
In cases where local colleges used the PBO process, they were able to relate to smaller manufacturing employers in language that was commonly understood by manufacturers and educators, and could be used to have direct and relevant impact on how courses and curricula could be improved or re-structured or, in some cases, developed from scratch.
Other partnerships were significantly enhanced with the regional workforce systems, and community-based organizations and unions where the new approach to competency-based skills development was recognized as sorely needed, and in some areas, a new approach. There are different examples of each depending on the college.
Examples of strong partnerships at the individual college level include:

Multi-State Advanced Manufacturing Consortium TAACCCT Round II Grant – FINAL EVALUATION REPORT 12
All colleges in the consortium strengthened and improved their industrial partner relationships. Examples: TCAT: Amazon; Spartanburg: Waste water management companies across the State (also in partnership with Clemson and other colleges now in operation); Pellissippi: Advanced Manufacturing Suppliers; Henry Ford and Oakland Community College: German Automotive Suppliers; Rhodes State College: OEM and Supplier Base.
CREC (Center for Regional Economic Competitiveness) Dashboard, training, and integration with the public workforce systems throughout the Consortium states and the sharing of these tools with Workforce Boards regionally.
New apprenticeship models that facilitate refocused industrial maintenance occupations at companies including the General Motors Battery Plant, assemblers of the Chevrolet hybrid battery.
Program Implementation Fidelity to Design
As noted, the consortium envisioned, in its application to USDOL, development and implementation of new curriculum, new processes for administration, new student support mechanisms, and other elements noted in the 21 deliverables. They did achieve the common equipment structure but because what was ultimately produced were common models that were optional for local colleges to use, we cannot conclude that the entire consortium met all of the implementation objectives. Most assessments of organizational change indicate it takes at least five years to produce cultural change. These grants had about three years to get to that point. In this case, about a year was spent in trying to find the right ground to actualize the full potential of the consortium, using the AMTEC curricula, which proved not to be a complete solution for bringing the needed employer alignment, student support, and institutional change. When the consortium did decide on its path, the model development process was often quite time consuming. Thus many of the participants likely did not benefit from any of the consortium’s innovations since the innovations came after much of the grant supported instruction was completed. The default resulted in some excellent models but mostly as examples not put into general practice.
Examples of implementation at the individual college level include a wide range of activities not covered thus far in this report. They include:
The transition in the curriculum to newer, industry specific technology: not necessarily new courses. For example, HFC’s robot course, Spartanburg CC’s PLC courses, and Bridge Valley’s Process Technology courses are now taught on industry standard equipment. There are many other examples from other colleges and their improved assessment of lab equipment technology. This is significant when seen from the perspective that this industry based equipment has become part of the local program’s competency based skills formation model for their degrees, not simply additional equipment, seldom used in labs.
M-SAMC partner colleges chose a strategy to infuse new content into existing AA degrees. One major reason was the short research period of the grant, and the realization during the analysis period that existing curricula held the essential foundation content needed, and it could be reworked into competency-based modes of delivery, in a shorter period of time than going through the approval processes for new degrees.
Participant Impacts & Outcomes The impact research questions are based on the DOL reporting requirements for the annual performance report. Given the limitations in data availability, some questions were answerable to a greater or lesser extent. Here are direct answers to the questions posed in the evaluation plan. Further analysis is included in the Impact Evaluation section later in the report.
1. How many unique participants/comparisons have been served?
Multi-State Advanced Manufacturing Consortium TAACCCT Round II Grant – FINAL EVALUATION REPORT 13
In total, 4962 individuals were served by the grant.
2. How many individuals have completed a grant/comparison program of study?
a. Of those, how many are incumbent workers?
Over the course of the grant, 1635 participants completed a grant-affected program of study (629 of whom were incumbent workers). The completion rate for participants was generally similar to, or greater than, the completion rate for comparison individuals on a program-by-program basis. Program by program details on completion rates are included later in this report.
3. How many individuals are still retained in their program of study (or other grant-funded program)?
2,651 participants were still continuing with their grant-affected program of study at the completion of the grant.
4. How many individuals are retained in other education programs?
Only 5 participants were retained in other education programs.
5. How many credit hours have been completed?
a. How many students have completed credit hours?
In total, over 80,000 credit hours were completed by study participants (80,258), spread across 3,690 participants who completed credit hours. Other participants engaged in non-credit programs.
6. How many credentials have been earned by participants/ comparisons?
a. How many students have earned certificates (<1 year)?
b. How many students have earned certificates (>1 year)?
c. How many students have earned degrees?
Participants earned 2,524 certificates or degrees over the course of the grant. 1,357 students earned short-term certificates, 222 earned long-term certificates, and 352 earned degrees.
7. How many students are pursuing further education after program of study completion?
Of those who completed a grant-affected program of study, 237 continued on to further education after completion.
8. How many participants/comparisons are employed after program of study completion?
Of those who were non-incumbent workers at the time of entering, 311 participants who completed a grant-affected program gained employment in the semester after completion.
9. How many participants/ comparisons are retained in employment for three quarters after program of study completion?
Of those 311 employed, 121 were retained in employment through quarters two and three after completion. If longer follow-up was possible, we would expect more to be retained through three quarters.
10. What are the earnings of participants/ comparisons relative to before enrollment?
a. How many of those employed at enrollment received a wage increase post-enrollment?
Of those who were employed at study intake, 392 earned a wage increase in their employment.
Multi-State Advanced Manufacturing Consortium TAACCCT Round II Grant – FINAL EVALUATION REPORT 14
Conclusions
This was an extremely ambitious project in its original conception. It called for a group of colleges that had like needs – working with an increasingly complex automotive industry – to build on an existing model (AMTEC) and create improvements from that base. When it was found that AMTEC could not be a complete solution for bringing the needed employer alignment, student support, and institutional change in its current state, a new model with a preferred state development began. While the colleges worked together on the grant development and concepts for improved national models, implementing those concepts across the full range of participating colleges became quite challenging. However, a worthwhile and meaningful process for change to competency-based education to support regional manufacturers was enhanced and is potentially sustainable at each partner institution. This could only be achieved by looking at each institution as a system that could be improved, something found commonly in business, but much less so in higher education.
The intensity with which industry partners demanded use of AMTEC materials for improved CBE, showed very early on that the curricula had great promise, but was not yet ready for full implementation as a “Turn-key” CBE instructional product for manufacturing skills development. Yet, two schools worked intensively with the materials at hand, and supplemented them heavily with their own resources over the length of their two year programs. The pilots at these schools were small (approximately 30 students in each) but significant in that they afforded a “research” opportunity concerning full implementation of the AMTEC tools. These helped to codify the very high value of the simulators, the assessment rubrics, portions of curricula, and the skills focused modular design and delivery of courses and program elements recognized in industry through AMTEC’s creation and M-SAMC’s implementation. Industry level simulators in the college lab changes industry expectations and colleges’ capacity fundamentally.
Meanwhile, the push to increase enrollments came long before the consortium had time to develop its new strategies, refine them, and move to large scale implementation. The Performance Based Objectives (PBO) process, as a new defining tool for CBE, is still evolving. It has great potential within manufacturing and in unrelated fields. For example, there is work underway to utilize the PBO concept of applied skills descriptions to the area of how history learning outcomes are understood by faculty, students and community/employers. Also the National Association of Workforce Boards is looking at training workforce agency personnel in the use of PBOs as a new service to manufacturing employers in multiple manufacturing regions. That work and other elements are continuing using non-grant funds.
Sustainability is evident. In Michigan plans are in place for the Southeast Michigan-based Advance Michigan Center for Apprenticeship Innovation (AMCAI), of which two M-SAMC partners are members, to leverage M-SAMC’s PBO tools as the building blocks for registered apprenticeships, improving the alignment of employer needs with student skills. This project, funded by the American Apprenticeship Initiative through DOL, will help sustain and grow the innovation investment in this TAACCCT grant. In addition, the bar for CBE in advanced technological education in manufacturing is being raised in all 10 partner States, in part due to the M-SAMC examples, work and resources.
CBE in an Open lab environment was piloted and systematized in this TAACCCT grant. As a result, colleges in the M-SAMC, as well as those from other regions nationally, are convening to share “best practices” in Open lab, skills focused educational delivery models. This will continue to link innovative efforts in new CBE instruction and education nationally.
The PBO process, as noted above, is a major grant outcome. PBOs were an outgrowth of better processes to define CBE skills in partnership with local employers. PBOs are gaining recognition as easily understood and applied to translate industry needs into an educational environment. As on-going post-grant work, CREC is building a tool, “Skills Data”, to align skills targets with instruction. Research is underway to sustain this tool and its development. PBOs need more time to mature but they appear to be a very promising model.

Multi-State Advanced Manufacturing Consortium TAACCCT Round II Grant – FINAL EVALUATION REPORT 15
Multi-State Advanced Manufacturing Consortium (M-SAMC)
TAACCCT Grant
Final Evaluation Report
Overview
Corporation for a Skilled Workforce (CSW) and New Growth Group comprise the evaluation team for the Multi-State Advanced Manufacturing Consortium (M-SAMC). CSW was responsible for the implementation evaluation, and New Growth oversaw the outcomes and impact evaluation. Throughout, CSW and New Growth have collaborated closely with each other, with the consortium staff, and with the thirteen member colleges to assess progress against the grant expectations, as drawn from the funded project proposal and design, and to document examples of how the activities of individual colleges (or groups of colleges not constituting the total population) have advanced competency-based education. During the course of the grant, the evaluators met frequently with the project staff, primarily through video conference calls. These calls served to not only provide evaluation updates but also covered general consortium activities so that the evaluators were kept apprised of policy and product progress. The evaluators also conducted interviews and site visits, and participated in various consortium learning sessions to get a better perspective on the consortium’s achievements and challenges.
CSW and New Growth Planners are pleased to present this final evaluation report covering the evaluation work completed over the life of the grant. The format largely follows the recommended elements of the Executive Summary provided by the Department of Labor in its August 2016 guidance. Each section, in addition to discussing the consortium’s efforts as a whole, gives specific examples of how individual colleges were successful in implementing a specific deliverable. These examples do not necessarily represent implementation at all colleges.
TAACCCT Program/Intervention Description and Activities
The Multi-State Advanced Manufacturing Consortium (M-SAMC) represents a collaboration of 13 partner colleges across 10 states whose shared aim is to design innovative program models to improve manufacturing education. Led by Henry Ford College, the M-SAMC consortium partners include: Rock Valley College, Oakland Community College, Rhodes State College, Bluegrass Community & Technical College, Bridge Valley Community & Technical College, Danville Community College, Jefferson Community & Technical College, Spartanburg Community College, Pellissippi State Community College, Gadsden State Community College, Tennessee College of Applied Technology at Murfreesboro, and Alamo Colleges.
In their Project Abstract, the M-SAMC consortium described their TAACCCT grant effort as an aim to “bridge the disconnect between the needs of the workplace and the content of manufacturing curriculum in most colleges, transform the face of manufacturing education in their institutions and establish a model for program transformation applicable to many industries. The program aims to use a competency-based model to develop new and modified industry-driven manufacturing curricula and credentials, transform instructional design and delivery systems to accelerate and contextualize learning; redesign student support, success and placement strategies to increase credential attainment; and develop administrative structures to support instructional design.”
This TAACCCT-funded project was a continuation of work begun under a National Science Foundation grant that brought automotive employers together to collectively impact community colleges’ responsiveness to industry

Multi-State Advanced Manufacturing Consortium TAACCCT Round II Grant – FINAL EVALUATION REPORT 16
needs through competency-based education. That NSF grant was the beginning of a partnership among some, but not all, of the M-SAMC consortium members. The subsequent TAACCCT grant support expanded the work started under the NSF grant through deeper exploration of how competency-based education could be taught across a broad array of community colleges.
The M-SAMC consortium’s application for TAACCCT funding described their approach to achieving this aim through the following strategies.
Strategy 1 - Use a competency-based model to develop new and modified industry-driven manufacturing curriculum and credentials. Strategy 1 outlined eight deliverables that defined how the consortium intended to implement the overall strategy. These deliverables were:
Accelerated Manufacturing Bridge Program targeted to TAA eligible participants with developmental education needs;
Create Manufacturing System Certificate – an 18 credit stackable, entry-level technician credential;
Develop a new AA degree in Manufacturing Maintenance and Organizational Systems;
Modify curriculum and related assessments in 3 manufacturing sub-sectors: process-based, automotive, and aerospace/precision machining;
Deeply engage industry as it identifies the standards and competencies needed, and use competencies to develop related curriculum and assessments;
Develop a structured Workforce Information System to gather real time data on new, emerging, and changing labor market skills;
Map in detail and articulate manufacturing career pathways (job and education), standardized across the consortium; and
Utilize the NCRC model to document foundational skills in applied math, reading, and locating information.
Strategy 2 - Transform instructional design and delivery systems to accelerate and contextualize learning. Strategy 2 outlined five deliverables that defined how the consortium intended to implement the overall strategy. These deliverables were:
Develop on-line learning for M-SAMC’s new curriculum and expand delivery models for online/blended instruction;
Expand use of manufacturing simulators and other digital simulations;
Design and deliver accelerated cohort training to increase credential attainment;
Integrate new modalities of instructional design and delivery, e.g. modularization, materials and job contextualization, functional skills assessment & JIT (Just In Time) remediation, and team supported learning; and
Reconfigure Manufacturing Space (classroom) and labs to be more “industry like”.
Strategy 3 - Redesign student supports, success and placement strategies to increase credential attainment. Strategy 3 outlined five deliverables that defined how the consortium would implement the overall strategy. These deliverables were:
Integrate/embed intensive student supports into cohort model;
Enhance career navigation, intensive student supports, tutoring services;
Develop work-based learning including apprenticeships and paid internships;
Student Completion Toolkit; and

Multi-State Advanced Manufacturing Consortium TAACCCT Round II Grant – FINAL EVALUATION REPORT 17
Strengthen partnerships w/ public workforce system and CBOs to provide additional supportive services for students & enhanced job placement linkages.
Strategy 4 - Develop administrative structures to support instructional redesign. Strategy 4 outlined three deliverables that defined how the consortium intended to implement the overall strategy. These deliverables were:
Develop standard practices/models to award credit for prior learning and/or non-credit training;
Develop models to move non-credit to credit bearing courses; and
Redesign registration and student data systems to allow increasingly flexible scheduling options and easier navigation of college systems.
In total, the grant proposal outlined twenty-one separate deliverables. For the consortium, these deliverables represented the next steps in an ongoing effort to move manufacturing education to a competency-based delivery model. The work on this approach started with a previously mentioned National Science Foundation grant that had substantial industry input. Representative industries were important players in identifying the colleges that would make up the consortium. The original consortium model, as described in the approved proposal, was predicated on being able to build on the Automotive Manufacturing Technical Education Collaborative (AMTEC) related curricula development that was thought to be a good fit for the consortium’s objectives. Over a year was spent examining varying ways to actualize the AMTEC model.
The consortium ultimately faced the reality that the AMTEC model was not embraced by all colleges, and that as it was then structured it was not a good fit to transform manufacturing education to a competency-based delivery system. The consensus emerged that a new (improved) model was needed. This realization was the result of extensive examination of potential paths to follow and deep research by consortium workgroups and members. However, there was one key component of the AMTEC process that was uniformly supported by the consortium. It involved using the Integrated Manufacturing Systems Trainer (IMST) as a key vehicle to move to a competency-based model.
The consortium evolved to a somewhat bi-furcated implementation model, with a clear centralized emphasis on ensuring major industry standard equipment (the IMST) was purchased and in place at all colleges – a $4 million plus investment – and that, over the course of the grant, uniform training was provided to all colleges on how to incorporate that equipment into integrated manufacturing system simulations. The other key process the consortium followed was employing a de-centralized model aligned with the group’s motto of “National Innovation; Local Implementation”, designed prior to the group’s first meeting in 2012, to help consortium Implementation Facilitators understand their dual roles as both a Local Implementer, and a strategy team member in the development of national improved processes and tools to accelerate each local institution’s transition to competency-based education (CBE). This “National Innovation, Local Implementation” approach focused the central consortium work on research and development of general guidance and recommended approaches to achieve the proposed M-SAMC strategies. Each college was encouraged, but not required, to use the models developed. Much effort went into building on the successes of different colleges who were leaders in specific deliverables and ensuring all colleges were well acquainted with how those emerging models operated.
The consortium intentionally employed a collective approach to developing the models used as guidance. M-SAMC organized workgroups, representing all the member colleges, to develop the guidance and collaborative models. Three key central areas were identified: 1. Creating a better way to assess employer needs and potentially reflecting those needs in curricula decisions through development of Performance-Based Objectives (PBOs); 2. Incorporating integrated system troubleshooting at all colleges using the IMSTs; and 3. Improvements in student supports through the funding of newly created Participant Engagement Facilitators at each college. Each of these areas will be discussed in more depth later in this summary.

Multi-State Advanced Manufacturing Consortium TAACCCT Round II Grant – FINAL EVALUATION REPORT 18
While not adopted by all colleges during the life of the grant, the Performance Based Objectives have become the crowning innovative achievement of the consortium. This new tool for automotive manufacturing education and training continues to be refined, using other funds, and work is underway to expand the process to totally unrelated disciplines. The M-SAMC website, www.msamc.org contains multiple videos and stories related to the development, importance, and implementation of PBOs.
Population Served The original population to be served, as identified in the grant, was TAA-like individuals (older, less skilled adult learners). While a limited number of such individuals were served, as is the case with many TAACCCT grantees, the demands of manufacturing for highly skilled, multi-faceted industrial maintenance workers demanded high entry level skills in order to complete the courses of study for this field. The consortium faced a conundrum encountered by many others – the skill shortages in advanced manufacturing are in the highly technical industrial maintenance field, where a technician is expected to be able to deal with a wide variety of complex, inter-related problems involving hydraulics, electrical, pneumatics, automation and controls technology and other aspects of the sophisticated manufacturing machinery of today.
For the most part, the pool of individuals who can grasp these complex concepts and operate in that environment are those with high aptitudes and solid academic backgrounds. That is the typical profile of M-SAMC consortium participants. There have been notable exceptions with efforts made to develop more aggressive career pathways and to create models for bridge programs but, within the time available for implementation, higher skilled applicants have been the primary pool from which to draw.
As will be explored in more depth below, the third year evaluation process included visits to four colleges to assess implementation processes, successes, and challenges. These four were chosen by the consortium staff as representative of the wide range of implementation progress and differing local contexts within the consortium. Looking across the current data for participants (see comment below about ongoing efforts to update the participant pool; data was available for only three colleges at the time of this writing), the picture is one of more than half of the participants having some college or a degree, indicating a more educated pool of participants being served than the typical profile of TAA-like individuals.
The evaluation team notes that the above conclusion is grounded in data available at the time of writing this report. It uses the grant requirement that for participants to be counted in the grant they must be enrolled in the program overall and specifically enrolled in courses or courses of study that are included in the Inventory of Products, which is the repository for grant impacted courses. These are the courses that are used in the final impact evaluation. During the development of this final implementation evaluation, efforts were still underway to build up the Inventory with courses that had been developed with grant support but were not as yet on the Inventory. There is expectation that the Inventory may expand right up until the final days of the grant. But for now the analysis is based on what is on the Inventory as of early September 2016. The vast majority of courses of study on the Inventory now are AAS degree oriented or quite high level certificate programs.
It is worth noting that, beyond the specific boundaries of M-SAMC TAACCCT-funded activities that occurred uniformly across the consortium, there are many examples of approaches developed for and actively serving TAA-like populations. In addition to a solid bridge model developed by the consortium, such examples of services for TAA-like populations include:
A key grant sponsored program designed in partnership with industry and a workforce agency, SEMCA (South-East Community Alliance) is the UAW-Ford Welding Training program, designed specifically for displaced workers, Veterans, and unemployed and low income individuals at Henry Ford College. In a six week accelerated program, students learn how to set up, maintain and use various welding processes to permanently join metal parts, and to use an oxy-acetylene torch and plasma cutting tungsten rod for cutting metal. This program, facilitated by retired UAW welders, culminates with an opportunity for certification
Multi-State Advanced Manufacturing Consortium TAACCCT Round II Grant – FINAL EVALUATION REPORT 19
with the American Welding Society. UAW-Ford provides job placement services in the areas of production, construction and repair welding for successful students. Eighty-six have completed the program, and another cohort is forming that will run post grant using WIOA funds through SEMCA. Completers have been hired by Ford Motor Company, General Motors, the Air Force, IMA (Integrated Manufacturing & Assembly), and Tower Automotive
Rhodes State College (RSC) launched a program aimed at first time felons, as part of their rehabilitation process. The participants come to RSC in small cohorts (<15 students each) and complete a “Pathways to Manufacturing” program, followed by NCRC testing. From the pilot cohort in 2014, 3 of 8 students are now enrolled at RSC, and another 3 secured local employment. A second cohort of 12 students began in 2015.
Henry Ford College’s (HFC), Michigan Technology Education Center (M-TEC), in conjunction with a local Workforce Innovation and Opportunity Act (WIOA) service provider, developed an “Advanced Manufacturing Awareness Program”. Initially a Manufacturing Outreach effort, this effort grew into a program which became a requirement for those seeking employment with a large industry partner MAGNA, a worldwide engineering and production company supporting OEMs. This effort reached over 300 TAA-Like individuals, including (10) TAA individuals.
Summary of Evidence-Based/Promising Models Used for Design The importance of competency-based education has been well documented. The majority of the consortium efforts, both through the use of common industry respected simulators, and through the consortium developed models, have been aimed at fundamentally strengthening the delivery of competency-based education.
Examples of how competency-based education for manufacturing has grown systematically in Michigan and other states include:
Kentucky and Michigan: Blue Grass Community & Technical College and Henry Ford College created new or significantly updated versions of comprehensive modularized curricula. Both versions integrate actual industry tools, equipment and job contextualization. They utilize functional skills assessments to determine “Just-in-Time” remediation, a defining characteristic of competency-based education when employed as the primary instructional design. Individualized competency evaluations are found across the modular courses of the curricula to form the core and advanced program competencies. As the PBOs lead to “PBL” (project based learning), both individualized and team-based learning projects can be found across both models. The Kentucky model will be utilized statewide through the KCTCS System.
Michigan: M-SAMC partner colleges in Michigan designed and delivered a new accelerated cohort based training and education model which has become the statewide standard for competency-based education for occupational programs. The model is known as, “MAT2”, or the “Michigan Advanced Technician Training Program”. Early in the implementation of the program, strong endorsement by manufacturing employers lead the State to create the first statewide equipment grant for manufacturing skilled trades related lab instruction at community colleges, a $50 million statewide investment in competency based education. With only one cohort of 30 students able to complete in the grant period, there are 180 skills certificate completers, which covered six areas of industry recognized skills attainment, demonstrating the potential of short-term skills-based certifications, employing the competency driven educational strategy. The curricula and related instructional materials were developed, attributed through Creative Commons, and published on Skills Commons for all partners and others nationally to access and use. Michigan: Mat2 Mechatronics is primarily all CBE based, resulting in the development of more than twelve Mecha-practicums, or skills-demonstrating capstone projects defined by industry. These were developed with full assessment rubrics for both technical and essential skills. This became a defining programmatic characteristic for all MAT2 program areas including Precision Machining, Information Technology and Product Design/CAD programs statewide.

Multi-State Advanced Manufacturing Consortium TAACCCT Round II Grant – FINAL EVALUATION REPORT 20
South Carolina: Spartanburg Community College developed skills/task checkoff sheets in credit class labs to validate student skills in real-time demonstrating CBE based initially on general competencies, and later on PBO applications appended to existing curricula.
Tennessee: Nissan successfully used AMTEC curricula materials working closely with the NSF sponsored AMTEC staff in Kentucky, resulting in an intense CBE based educational partnership over three years. All current and new Nissan manufacturing technician training will use AMTEC and M-SAMC educational tools for future technician development, company-wide.
10 Partner States: Manufacturers and school districts have begun purchasing AMTEC Integrated Manufacturing Systems trainers at Toyota, Chrysler Corporation, UAW Ford National Training Center as well as Secondary School Districts including the Detroit Public Schools, Dearborn Charter Academies and DCTC, the Downriver Career Technical Consortium, serving nine School districts in SE Michigan, south of Detroit. Integrated Systems Training is now a keystone in manufacturing based competency based education.
10 Partner States: With tools for implementation created by M-SAMC, and those originally developed by AMTEC, schools using competency-based curricula, and the IMST manufacturing simulator, are employing comprehensive student evaluation and assessment rubrics for course completion, and they now have the working tools with local faculty and staff champions for manufacturing based Competency-Based Education implementation.
10 Partner States: “Industry-like labs”, each containing a 480 V electrical cabinet with the AIMS simulator, helped to create the reality of educational classrooms. Through the renovation and new construction of manufacturing education labs essential for this technology, M-SAMC and local industry partners have created new partnerships of communities, students and employees focused on current and future skills development.
M-SAMC Evaluation
As stated in the RFP for this evaluation released by Henry Ford Community College, the overall purpose of the evaluation is to collect, analyze, and interpret data pertaining to the project that will (a) lead to continuous improvement and (b) determine the extent to which various program components are associated with positive outcomes and impacts in the lives of program participants.
Continuous improvement is defined to include activities that occurred within and beyond the grant period and/or had impact at specific colleges (not necessarily the entire group). Examples include industry aligned topic areas, like Integrated Manufacturing Systems Troubleshooting on the new simulators at each school, represented a “disruptive innovation” at each school that over time begins to change the course or direction of programs. These require immediate and longer term staffing, course, and outcome evaluation for their full integration into programs to become a reality.
Through work with partners, new tools for systems instruction were developed through M-SAMC. This included a broad array of tool development including:- version controlled instructional resources at the M-SAMC website that include a myriad of training and “how-to” videos; the Manufacturing Education Institute or MEI tools of instructors and administrators talking about key success issues of competency-based education; skills data analysis tools for each college using the M-SAMC data dashboard; Performance Engagement Facilitator, or PEF training videos to engage communities and students in CBE manufacturing programs, ITRS the Interactive Training Reference System Modules and online !ARC Flash! Overview instruction modules that begin to bridge the gap between topic based instructional approaches and competency-based skills approaches using industry defined areas of expertise; access to these tools on PC’s, tablets and phones for “just-in-time” instructor and student utilization and reference.

Multi-State Advanced Manufacturing Consortium TAACCCT Round II Grant – FINAL EVALUATION REPORT 21
Overall, the key components of industry sustained engagement, faculty development, equipment acquisition, industry-like lab equipment, and particularly the Integrated Manufacturing Systems Trainer simulators and their utilization, which require a team approach between local industry and educational partners, provide the foundation for continuous improvement in competency-based manufacturing education at M-SAMC. This was evidenced to some degree at all partner locations.
Implementation Evaluation
The SGA included four key implementation questions that were to drive the implementation evaluation. Summarized, they were: 1) How was the particular curriculum selected?; 2) How were programs and program design improved or expanded using grant funds?; 3) Did the grantee conduct in-depth assessment to select participants?; and 4) What contributions did each of the partners make in terms of curriculum development, recruitment, training, placement, program management, leveraging resources, and commitment to program sustainability?
As a result of the consortium’s decision to recognize the AMTEC curriculum as one of several options to satisfy employer skills development requirements, many new approaches were developed. These focused on how to broaden the educational tools used to better engage and educationally service employers. The work of the consortium focused more on Competency Based Education (CBE) process modeling, organizational skills development, and instructional tool development instead of a set of specific and incomplete curricular mandates for member colleges to adopt the new CBE model.
Henry Ford College (the institution has transitioned to a new name since the grant was awarded) has been particularly aggressive in ensuring the deliverables have been implemented within its own structure and in sharing the lessons learned with other colleges. Based on the Inventory and the results of the evaluation products noted below, it has been a more mixed picture at other colleges - with movement on some of the deliverables, but not all. Based on the language in the grant, we interpret full achievement as all colleges having actually implemented the deliverables (i.e., students enrolled in grant supported courses, or put into practice local variations of the new operating models).
Some key examples of partial implementation include:
Two M-SAMC partner colleges, Tennessee College of Applied Technology (TCAT) in Murfreesboro and Pellissippi State Community College (PSCC) in Knoxville, developed articulation agreements through which students with non-credit bearing TCAT diplomas can earn PSCC credit towards a degree or certificate. This activity has sparked the interest of several other TCATs across the state of Tennessee, and is expected to become a statewide standard for articulation between TCATs and Tennessee colleges. This was no small achievement because up to this point TCAT learning outcomes were not recognized as college level. Through the use of more explicit competency-based skills strategies, articulations were possible. Inter-college articulations are a key dimension of effective CBE institutional collaboration, and standardization at the level of skills attainment.
While not fully implemented to the same degree at every college, the IMST Simulators, and newly developed conversion kits that address a broader array and application of industry specific equipment, improve programs by focusing on integrated technological systems understanding, and are a keystone for employer-college CBE program alignment in manufacturing. These are essential to set a new local standard for manufacturing technological education. To utilize these over the long run, deep partnerships between educational institutions and industry are required at a significantly deeper level than that required through Perkins related program advisory committees.
A clear trend demonstrating an increase in the companies and schools inside and outside M-SAMC utilizing PBOs as a basis for curricular skill outcomes, and as gap analysis tools for local employers and colleges,

Multi-State Advanced Manufacturing Consortium TAACCCT Round II Grant – FINAL EVALUATION REPORT 22
resulting in more focused skills based educational programming. Through their utilization the transition to skills based mastery is much more likely.
A look at how the consortium spent its TAACCCT grant funds is enlightening in understanding the way in which this grant influenced the development of competency-based education. The chart below represents final expenditures of the grant. While the biggest absolute expenditure was in Personnel, that includes both project staff and the local coordinators and their Participant Engagement Facilitators. The bulk of these funds were spent at the individual college level. The Contractor line item is made up of several support activities ranging from communication support to labor market intelligence expertise. The Equipment line item reflects the single largest investment – the centralized purchase of thirteen ISMTs that brought industry-like equipment to all schools. In many cases, these new equipment enhancements made the difference in whether industry would buy into the process. All expenditures worked together to further competency-based education within the consortium.
Area Expenditure % Comments Alignment
Personnel $4,522,195 30%
Fringe $1,239,371 8%
Travel $363,878 2%
Includes steering committee conferences Costs associated with the Multi-State
nature of the Grant.
Equipment $4,103,381
27%
Probably closer to 4.3M -- AMTEC Sim 197K --
Conversion Kits - 40K (at least, if you amortize design
costs) - and approx. 93K of individual school
purchases. Total = Approx. 29% Can generate a
detailed school by school list of equipment
purchased that reflects the current technology
employed in the plants
Aligned with the grant objective of moving
the institutions offerings closer to
Industries' needs. Sustainable at the
institutions after grant has ended.
Supplies $430,224
3%
Supplies include: seats in the Imerse2learn CNC
simulators for member institutions, computers,
Camtasia software, AMTEC simulator Tablets,
AMTEC module costs to be piloted at the consortium
schools, etc.
Aligned with the grant objective of moving
the institutions offerings closer to
Industries' needs. Sustainable at the
institutions after grant has ended. Reflects
costs associated with the implementation
of competency based Education.
Contractual $4,262,966
28%
Contractual deliverables include: CREC developed
Dashboard, MSAMC Website creation and
maintenance, PBO creation and subsequent database
development to enable on-line Industry and
Educational downloads, reviews and assessment.
Also included is the creation of additional on-line
tools to support the AMTEC Simulator Operation &
Troubleshooting and Arc Flash training (three
deliverables), IMST level one and two training
material for instructors and additional courses
available through the website. Grant evaluators are
also included. Costs associated with SKYPE
conference tools and maintenance are also included.
The costs to develop MEI and PEF courses are also
included, and SME reviews and final publishing for 6
months. Welding Project based learning and
Multiskilled Mechapracticums were developed and
published as examples of implemented PBLs.
The CREC dashboard allows institutions to
better understand the labor market data for
their geographic area. The PBO data base
allows for improved communications
between Industry and partner institutions.
The Amtec Simulator material allows
institutions to internalize the applications of
Industry like technology. All of this is
sustainable post grant and is aligned with
the original goals of the grant. The
Mechapracticums and PBLs are tools that
can be implemented to demonstrate
Competency Based Education.
Other $77,986 1%
Renovation costs associated with the
implementation of new equipment and CBT.
TOTAL $15,000,000 100%
For the duration of the grant, this included:
Facilitators and PEFs at the member institutions, and
Grant Project managers. (for 3 years) .
Project management costs associated with
the grant outcomes.

Multi-State Advanced Manufacturing Consortium TAACCCT Round II Grant – FINAL EVALUATION REPORT 23
Implementation Approach and Products
The implementation evaluation included four components:
2013
During start-up of the grant, CSW and New Growth Group observed and/or participated in many phone conferences across the M-SAMC workgroups to understand their implementation approach and assess progress. At the end of the year, CSW conducted in-depth interviews with all of the participating colleges, to assess how they were progressing on their local implementation strategies, their participation and support for the centralized model development and internal management of the consortium, and recommendations for going forward. These interviews resulted in an interim evaluation report to the consortium leadership on internal issues and participation in the evolving consortium structure and processes.
2014
In 2014, evaluators conducted a series of phone interviews and surveys of faculty, employers, and students. These focused on nine critical project elements that were selected by the project staff as the most important foci for grant success at that time. The consortium framed these as critical Stakeholder Elements:
Continually Verified Industry Deployable Skills – Competency Attainment
Integrated System Troubleshooting Skills
Valid Assessment of Demonstrated Skills and Learning Mastery
Rapidly Developed, Company Customizable, Credit Bearing Programs
National Standards Lean Education Models
Students with Skills for Self-Directed Lifelong Learning
Credit for Work Skills and On-the Job Training Delivery
Transferable Credits for Recognized Credentials
Non-proprietary, Cost-effective Educational Solutions
The surveys were administered by the schools. Response rates were quite low, and thus the evaluation team could not definitively say that the results were representative of the three populations. Nonetheless, there was some value in reviewing the findings from the surveys, reflected in the resulting interim evaluation report and a summary power point presentation to all of the colleges.
2015 Part One
The evaluators also facilitated learning network video conference calls during early 2015, focused on three key areas: use of PBOs, use of IMSTs, and assimilation and duties of Participant Engagement Facilitators (PEFs). PEFs were staff brought on to all colleges at varying points in 2015, to provide enhanced student supports and assist in other administrative duties primarily aimed at increasing the number of completed Personal Information Forms, the key document used to verify program participation. Representatives from selected colleges participated in each of these calls so that each college was represented in at least one network call. The products from each of these calls were PPT presentations that were provided to all colleges and presented during the weekly coordinator calls, organized by project staff as information and grant activity progress tracking mechanisms. These three areas represented the most critical implementation tracks, as defined by project staff at the beginning of 2015. They supplemented the other evaluation reports, combining shared learning with a PPT summary of where the consortium was on each. The PEF call summary was translated into a video by the developers of the consortium website and can be found at www.msamc.org.
Multi-State Advanced Manufacturing Consortium TAACCCT Round II Grant – FINAL EVALUATION REPORT 24
2015 Part Two
In the summer and fall of 2015, evaluators conducted a series of on-site case studies of four participating colleges to gather information about their progress on local implementation of the full array of grant deliverables. The colleges were selected by the consortium staff as a representative sample of differing stages of implementation and different approaches to utilization of the consortium signature products. The case study approach was chosen based on a series of factors. First, we learned from experience that the lengthy written reports were not as useful for readers (or potential readers) as hoped. Second, while the earlier efforts touched all colleges, they were done through phone interviews that generally only involved the local college facilitators. In some cases, the facilitators did not have access to all that was going in the colleges. They also had a point of view that represented the perspective of one individual. For these reasons, working with the project staff, the evaluation team proposed going deeper with a small sample of colleges using on-site case studies. These 2-3 day visits allowed interaction with a wide array of impacted individuals including the facilitators, faculty, students, administrators, and employers. Capturing the views of all of these groups allowed for a fuller picture of how the project was being implemented within these four colleges. The first major evaluation product from the case studies was a PowerPoint presentation to all the colleges on the results of the case studies and implications for their own college level implementation assessments. The presentation was intentionally generic in nature, not identifying the findings by college but rather giving an overall picture of how the group was doing. A later product, the evaluators’ own capstone project, is an assessment of each case study college against the 21 deliverables in the grant. This is presented in table format in order to capture a vast amount of information in as concise a way as possible. It also provided a picture of how each of the deliverables had or was rolling out within four different environments.
In addition, there were ongoing efforts to identify and capture information on selected colleges’ promising practices such as: participation in consortium learning forums, interviews with supporting partners who developed ways to support such efforts as labor market information dashboards, soft skills simulations, and equipment use innovations through virtual and on-line learning. Exploration of these efforts were all supplementary evaluation activities engaged in to ensure the evaluators were well versed in what the consortium was trying to accomplish.
M-SAMC Conceptual Framework The consortium’s logic model took two different forms. First was a proven change methodology model originating with Deming's Cycle, or a continuous quality improvement model consisting of a logical sequence of five repetitive steps for continuous improvement and learning: [1] IDENTIFY (Present & Preferred States), [2] ANALYZE (Best-Fit Innovations), [3] PLAN (Action Steps against Time), [4] IMPLEMENT (Monitor and Recognize), and [5] EVALUATE (Determine the Next Preferred State). [Below]
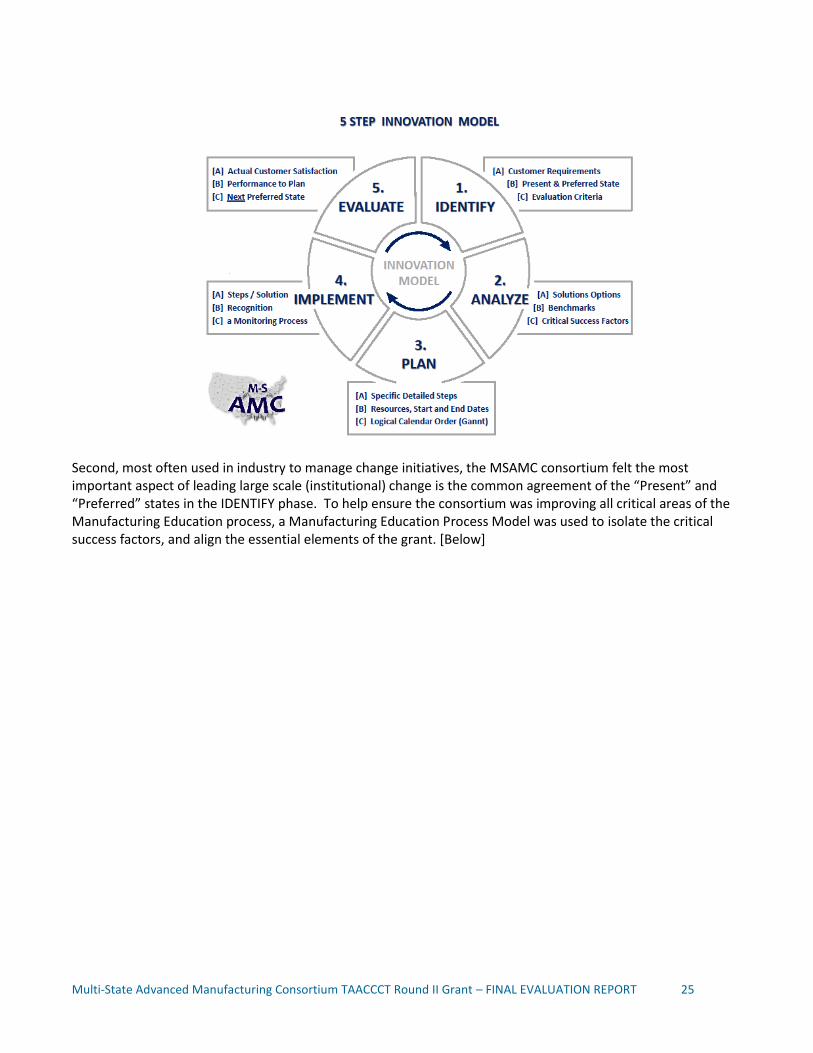
Multi-State Advanced Manufacturing Consortium TAACCCT Round II Grant – FINAL EVALUATION REPORT 25
Second, most often used in industry to manage change initiatives, the MSAMC consortium felt the most important aspect of leading large scale (institutional) change is the common agreement of the “Present” and “Preferred” states in the IDENTIFY phase. To help ensure the consortium was improving all critical areas of the Manufacturing Education process, a Manufacturing Education Process Model was used to isolate the critical success factors, and align the essential elements of the grant. [Below]
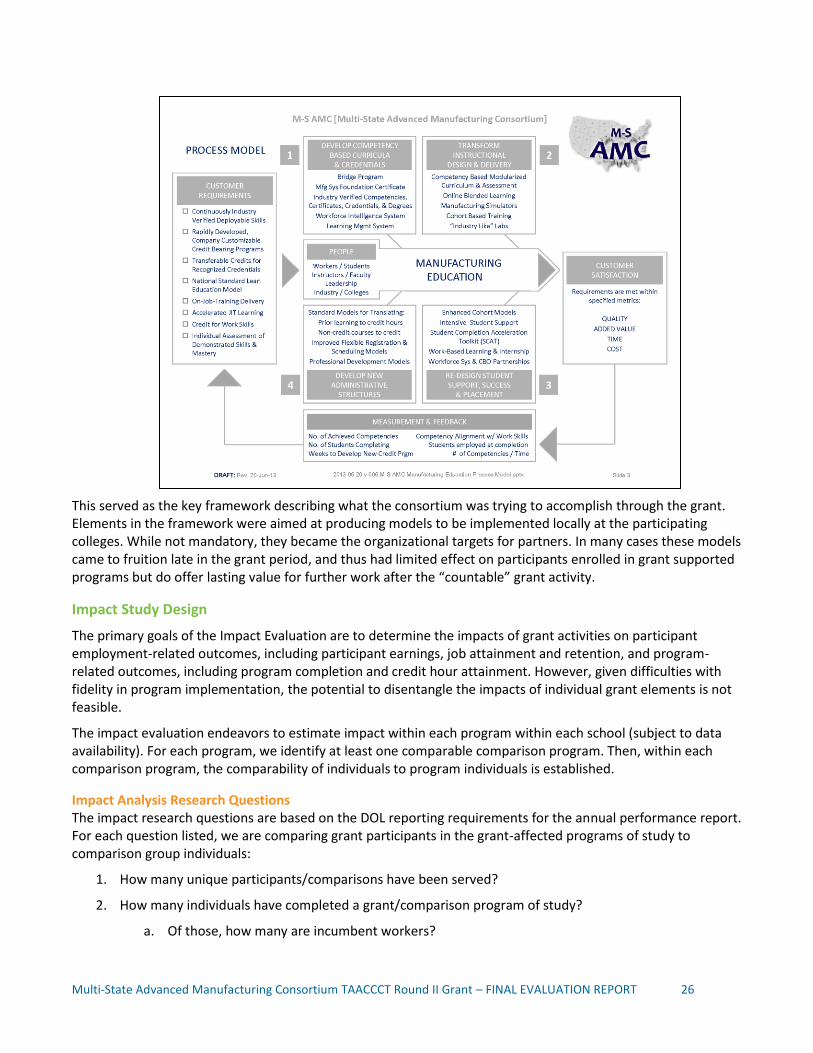
Multi-State Advanced Manufacturing Consortium TAACCCT Round II Grant – FINAL EVALUATION REPORT 26
This served as the key framework describing what the consortium was trying to accomplish through the grant. Elements in the framework were aimed at producing models to be implemented locally at the participating colleges. While not mandatory, they became the organizational targets for partners. In many cases these models came to fruition late in the grant period, and thus had limited effect on participants enrolled in grant supported programs but do offer lasting value for further work after the “countable” grant activity.
Impact Study Design
The primary goals of the Impact Evaluation are to determine the impacts of grant activities on participant employment-related outcomes, including participant earnings, job attainment and retention, and program-related outcomes, including program completion and credit hour attainment. However, given difficulties with fidelity in program implementation, the potential to disentangle the impacts of individual grant elements is not feasible.
The impact evaluation endeavors to estimate impact within each program within each school (subject to data availability). For each program, we identify at least one comparable comparison program. Then, within each comparison program, the comparability of individuals to program individuals is established.
Impact Analysis Research Questions The impact research questions are based on the DOL reporting requirements for the annual performance report. For each question listed, we are comparing grant participants in the grant-affected programs of study to comparison group individuals:
1. How many unique participants/comparisons have been served?
2. How many individuals have completed a grant/comparison program of study?
a. Of those, how many are incumbent workers?
Multi-State Advanced Manufacturing Consortium TAACCCT Round II Grant – FINAL EVALUATION REPORT 27
3. How many individuals are still retained in their program of study (or other grant-funded program)?
4. How many individuals are retained in other education programs?
5. How many credit hours have been completed?
a. How many students have completed credit hours?
6. How many credentials have been earned by participants/ comparisons?
a. How many students have earned certificates (<1 year)?
b. How many students have earned certificates (>1 year)?
c. How many students have earned degrees?
7. How many students are pursuing further education after program of study completion?
8. How many participants/comparisons are employed after program of study completion?
9. How many participants/ comparisons are retained in employment for three quarters after program of study completion?
10. What are the earnings of participants/ comparisons relative to before enrollment?
a. How many of those employed at enrollment received a wage increase post-enrollment?
Design Methodology The study design is quasi-experimental. A random-assignment research design was impractical because M-SAMC is comprised of open-access community colleges with limited resources to serve students in targeted programs. Randomly assigning those students to different systems of programs and services would have been resource-intensive and hindered the success of the programs.
Each program is included in an analysis comparing it to at least one comparison group. Every grant program is matched to one comparison program that is different but comparable to the grant program and housed at the same school and followed in parallel during the grant period. In some cases, comparison to the same program in a historical timeframe was possible. Comparability of the comparison program to the grant program is based on a) same department, b) same credit/non-credit status of program, c) similar duration of program, and d) similar demographics of individuals entering program. It was not expected that a comparison program would be identifiable that matches perfectly on all 4 qualities, but rather the best match overall is used. If necessary, grant programs are matched to other comparison programs. First, if the grant program is an established program prior to the grant (for at least 3 years) then the grant program itself serves as its own comparison program (historical comparison). Second, if another college in the consortium has a grant program that is the same as the grant program and is an established program prior to the grant (for at least 3 years) then the other college’s same program is used as a comparison program (again, historical comparison). Other comparison groups are only used if the primary comparison group is problematic.
At the conclusion of the comparison program selection process, each grant program has a parallel comparison program that is similar to it and is drawn from the same college or has an historical comparison program that is the same program, and is either drawn from the same college or from another college in the consortium.
Data Used and Its Reliability Data comes from many different sources:
Students: at intake, students fill out a participant intake form with demographic and other baseline data
Multi-State Advanced Manufacturing Consortium TAACCCT Round II Grant – FINAL EVALUATION REPORT 28
Colleges: on an ongoing basis, colleges submit data on their students, including information such as completions
State wage agencies: at the end of the grant period, state wage agencies are contacted to obtain wage data on students
Participant surveys: In states where quarterly earnings records were not accessible, attempts were made to survey participants post-completion to obtain employment and earnings data.
We consider the data to be reliable. The intake form is simple, and we do not believe students struggled to fill it out accurately. College data is part of the ongoing business of an institution of higher learning, and given the relatively simple nature of the college data required, we believe this data is also reliable. Lastly, we have no reason to believe there are systematic inaccuracies in state wage data. Participant surveys were simple and response rates approached 50 percent.
Efforts to obtain state earnings records
Data obtained from students and colleges was a project management issue within the control of the evaluators, lead college, and member colleges. In contrast, state earnings data was outside of the consortium’s direct control. Every effort was made to obtain the necessary records. The process and results are shown below:
In 2014, New Growth entered FERPA-compliant data sharing agreements with M-SAMC’s colleges to facilitate sharing of individual level participant and comparison data. Over the course of the evaluation term, significant efforts were made to procure state wage data from agencies across the ten M-SAMC states. New Growth sent TAACCCT grant overviews, FERPA guidelines, and data specifications to each agency and held multiple calls and lengthy email campaigns to open data channels for evaluation reporting. In certain states, data was made available to either New Growth or the colleges through negotiated data sharing agreements; however, other states had difficult and protracted request processes, or simply would not permit such data to be shared. Below is an overview of the efforts in each state.
Ohio (Rhodes State College) – Ohio Department of Jobs & Family Services (“ODJFS”) requires that colleges, instead of third party evaluators, make the records request and have a data sharing agreement with the state. As such, New Growth facilitated conversations between ODJFS and Rhodes State College regarding the necessary data specifications and the parties entered a Shared Data Agreement for the matching and transfer of individual level files in 2014.
West Virginia (BridgeValley Community and Technical College) – WorkForce West Virginia negotiated a Data Sharing Agreement with New Growth over the course of many months to get the correct data specifications and security precautions for this request. The parties entered an agreement in 2015.
Kentucky (Bluegrass and Jefferson Community and Technical Colleges) – The Kentucky Center for Education and Workforce (“KCEWS”) indicated that they will not provide individual level information, however they would provide aggregate, de-identified information to New Growth in furtherance of the evaluation requirement from USDOL. KCEWS and New Growth entered a data sharing memorandum in 2015.
Virginia (Danville Community College) – The Virginia Employment Commission (“VEC”) requires that colleges, instead of third party evaluators, make the records request and have a data sharing agreement with the state. New Growth provided Danville with the data specifications necessary for reporting and Danville has undertaken the requests to VEC.
South Carolina (Spartanburg Community College) – Spartanburg declined to enter a Data Sharing Agreement with the New Growth, and alternatively determined that it would share de-identified

Multi-State Advanced Manufacturing Consortium TAACCCT Round II Grant – FINAL EVALUATION REPORT 29
participant and comparison cohort data for the evaluation. Spartanburg procured state level data, de-identified it, and provided it to New Growth for evaluation and reporting.
Tennessee (TCAT Murfreesboro and Pellissippi State Community College) – New Growth spent the better part of two years working through channels at The Tennessee Department of Labor, Employment Security Division (“TDOL”). TDOL requires that colleges, instead of third party evaluators, make the records request and have a data sharing agreement with the state that permits the colleges to disclose the data to third party evaluators. After many conversations in 2014 with TDOL, New Growth provided TDOL with data specifications in April 2015. New Growth was informed of both staffing and policy changes at TDOL that paused the data request and resulting agreement. The first draft of the data sharing agreements were not shared with the colleges until July 2016. Efforts were made to negotiate the terms, but time ran out to complete the transaction in time to procure state data in time for the final report.
Illinois (Rock Valley College) – New Growth attempted to obtain data through an existing Shared Data Agreement executed in 2015 with Illinois Department of Economic Opportunity, which permitted unemployment data flow from the Illinois Department of Employment Security (“IDES”). New Growth was advised in 2016, however, during the renegotiation of the 2016 SDA, that IDES requires that colleges, instead of third party evaluators, make the records request and have a data sharing agreement with the state that permits the colleges to disclose the data to third party evaluators. Unfortunately, time ran out to complete the transaction between Rock Valley and IDES in time to procure state data in time for the final report.
Texas (Alamo Colleges) – The Texas Workforce Commission (“TWC”) requires that colleges, instead of third party evaluators, make the records request and have a data sharing agreement with the state that permits the colleges to disclose the data to third party evaluators. New Growth was not permitted to be a party to any resulting agreement. TWC’s data specifications were lengthy and New Growth was unable to successfully facilitate getting an agreement on behalf of Alamo Colleges through legal channels at TWC in time for the final report.
Alabama (Gadsden State Community College) – New Growth engaged with Alabama Department of Labor (“ADOL”) for close to a year in an attempt to procure state unemployment data for this evaluation. Attempts were made to supply the data specifications and, alternatively to join data sharing agreements that other TAACCCT winning colleges in Alabama had entered with the Alabama Department of Postsecondary Education. To our knowledge, those agreements were never executed, leaving little recourse for the project. We were eventually informed by ADOL that they would not provide data to New Growth and that the prospective data agreements were not finalized with other colleges.
Michigan (Henry Ford Community College, lead college and Oakland Community College) – Despite multiple conversations over the course of 2014, The Michigan Unemployment Insurance Agency’s Chief of Administrative Law & Rules eventually indicated to New Growth, that as a matter of data security and pursuant to Michigan Employment Security Act, Michigan cannot disclose personal level wage records to third parties or colleges, regardless of USDOL’s third party evaluation requirement. The state has a data policy that is stricter than FERPA and does not permit any disclosures in furtherance of TAACCCT evaluations.
Outcomes and Impacts Measured The outcomes measured are those that allow us to answer the research questions above (completion, credit hours, further education, and employment). The impact is the difference between the treatment group (grant
Multi-State Advanced Manufacturing Consortium TAACCCT Round II Grant – FINAL EVALUATION REPORT 30
participants) and the control group (comparison group individuals) after adjustment to make the groups as comparable as possible.
Implementation Findings
Capacity Building Capacity building took two different paths within the consortium. There was centrally developed and delivered capacity building related to the IMST. There was also a much more open-ended opportunity for capacity building within each participating college that could be used for any form of development, aimed at any staff through whose development the grant implementation might be enhanced. The implementation evaluation sought information about both of these paths in its summer of 2014 interviews and in the 2015 case studies. Probing questions were used to elicit perceptions on the capacity building efforts. Although, for many colleges, the simulator training came late in the grant process, it was highly regarded and seen as crucial to being able to use the simulators in actual course instruction. There were two rounds of this training. All colleges received the first wave of training and about half of the colleges received the second level of training.
Generally, capacity building was covered in-depth in the case studies showing a wide range of activities engaged in by the colleges from seminars to on-line learning, to focused industry developed training for their equipment. The case study summaries contain sections on professional development. Note that the local approaches for the open-ended development were indeed open-ended and took multiple paths according to the local college’s internally perceived needs.
Examples of strong capacity building at the individual college level include:
Based in large part on the increased focus and attention this grant brought to transforming instructional design and delivery systems to accelerate and contextualize learning, many partner colleges made dramatic improvements in their manufacturing education classroom and lab space, including new multi-million dollar buildings, either built or started during the implementation period. These included Pelissippi State Community College in Knoxville TN, Bluegrass Community and Technical College in Lexington KY, BridgeValley Community and Technical College in Charleston WV, Oakland Community College in Auburn Hills MI, Henry Ford College in Dearborn MI, and TCAT-Murfreesboro in Murfreesboro, TN.
Development of core groups of faculty and administrators dedicated to growing CBE within their institutions at multiple levels. Through the implementation of the IMST simulators, a new standard for more transparent and engaged manufacturing CBE has been structurally woven into each college’s organization.
Henry Ford College’s Industrial Welding Associate’s Degree Program in 2014 is a full CBE implementation providing 99% project focused, competency based modular courses, flexible scheduling, rapid credit for prior learning processes and the ability for students to begin the lab based program at any point in the first 12 weeks of the 15 week semester. This program easily articulates with high school programs and other adult education welding programs to assign students competency based credits and clear targets toward industry certifications and job entry or enhancement.
Following the two path approach described above, institutional capacity was developed along two different lines. First, all schools had access to industry standard equipment that most of them had never used. All schools received at least the first level of consortium developed and delivered training on how to use the equipment in an industry-like instructional environment (intentionally necessitated by the structural requirements of the trainer). This Level I Training covers 80% of the most common Manufacturing System faults found in sequencing machines common in advanced manufacturing systems. A second course “Level II Troubleshooting” was developed to cover the remaining 20% of common manufacturing faults, identified by manufacturers. This second training required Instructors to have prior, valid hands-on knowledge in Complex Logic, Robot Program Modification, Manual Programming with a Teach Pendant, and Controller Based Recovery of Machine Sequence.
Multi-State Advanced Manufacturing Consortium TAACCCT Round II Grant – FINAL EVALUATION REPORT 31
Even with these intense pre-requisites, over half the schools received the Level II Troubleshooting training, often with the support and participation of industry partners.
Second, all schools participated in one or more of the structured workgroups, called “Innovation Teams”, developing the models that would be provided to all schools for adoption or adaption, as fit their local context and priorities. This was the mechanism that facilitated the broad engagement of partner schools at the grant organizational level.
All schools received consortium-procured training on labor market analysis that was extremely highly regarded and was available to partners as well. The workforce system partners were especially complimentary of the training and, at some colleges, brought the trainers back for a second round. It appears that the consortium’s grant-funded efforts substantially helped the M-SAMC schools increase their ability to do their own labor market analysis in manufacturing occupations as defined by their local economy.
Examples of building institutional capacity at the individual college level include:
Dynamic Data Dashboard, a robust labor market analysis tool, is an ongoing resource for updated information to drive appropriate program and course development.
In regions where MSSC and Career Readiness Certificates are part of the public employment process for entry level manufacturing workers, these represented the standardized form of a “Accelerated Manufacturing Bridge”. In regions where these credentials are not widely used or recognized by employers, the selection process utilized by Workforce Agencies evaluates/provides manufacturing skills specific education. In these regions the value added educational experience included local employment opportunity analysis with employers and educators to determine potential occupational and educational career pathways in manufacturing.
Building on the NSF AMTEC and M-SAMC partners work, Manufacturing Systems understanding, troubleshooting and repair was determined as the highest priority basic skill of manufacturing workers at all partner colleges, and further, was refined into a short course eligible for all manufacturing students. The length of time necessary to achieve the basic level of system’s functional understanding was significantly reduced over the grant time period to 40 contact hours representing 2 college credits. There were no colleges awarding a 2 credit hour certificate at the start of the grant. This basic level of systems training was adopted by all partner colleges by the end of the grant period. Deeper level systems mastery requires significantly more time, as well as additional technological skills education, beyond 18 credit hours. One major curricular outcome of the grant is a deeper understanding of how to teach and the tools to teach integrated manufacturing systems. Multiple attempts were made to create one overall career pathway for manufacturing careers. But these draft pathways lost relevance when the consortium found that the job titles, wages, and certifications could not be “standardized” across partners and states. In the end, using M-SAMC developed tools, each school can create real-time versions of this information for their local regions, a much stronger outcome than that originally envisioned.
While no one competency-based education curriculum was developed by M-SAMC and utilized by all colleges consistently, all partners worked to identify and/or develop new online teaching and learning resources. The AMTEC curricula was tested by the partners, as originally envisioned in the proposal, but within the first 6 months of the grant college and industry partners alike found that it was not a “turn-key” online curriculum. AMTEC made great progress working with M-SAMC industry partner Nissan in improving the AMTEC curricula over the life of the grant. And partner colleges continued to work on utilizing more hands-on and competency based project-based instruction. Partners mentioned that the approach to online instruction utilized and promoted by the Innovation Team included many strategies that were described as “cutting-edge” by other college departments within their local campus community. This is significant as

Multi-State Advanced Manufacturing Consortium TAACCCT Round II Grant – FINAL EVALUATION REPORT 32
community college technology programs traditionally lag behind in the use of online or asynchronous learning.
An entire degree platform at HFC, “Multi-Skilled Maintenance Degree”, with over 50 new modular courses was created and added to the product inventory. This program was “field-tested” by students working as company maintenance personnel. In the words of these manufacturers, the skills mastered by program students far exceeded any other Open Entry manufacturing maintenance skills programs at the Associate of Applied Science degree level.
Most consortium partners created new credit course structures, often called “Special Topics” courses which allowed schools to create a new skills development related course, while determining how to structure the course for permanent inclusion in the schools’ taxonomy of courses.
HFC created an entirely new registration process for flexible scheduling and student driven skills attainment in college technology labs. These administrative improvements factor in financial aid requirements, student work and family schedules, and an economical approach (1 credit at a time) for student tuition expenses. Even if a student was not able to complete a course within the semester, their repeat cost was only one credit. In the Fall, 2014, the HFC Manufacturing Welding program began their 100% modularized and project-based degree program. This program allows any student to begin at their own level of welding skills, from basic to advanced, and begin working on projects the same day as their registration. Further, students work in “Open” labs where all levels of students can work together simultaneously, from beginning to advanced, with up to 32 hours of lab time available to all students in both daytime and evening scheduling. The program in the traditional model would number less than 40 students per semester. In the improved “Open Flexible Lab” environment, 200 students per semester are completing projects in a competency-based program facilitated by the same size instructional staff.
A wide acceptance at partner colleges for the need of expanding manufacturing specific student advising, specifically for competency based education student needs. The Performance Engagement Facilitators helped define a critical student services gap. Many partners are addressing this through their longer term institutional planning and resource allocation.
Important Partnerships Most important for M-SAMC partner colleges were the employer partnerships either developed or strengthened by participation in the consortium. Particularly where there were large employers working with the local colleges, there were opportunities realized to bring those employers’ needs to the table and to work with them to structure delivery that met their needs. This created a foundation for smaller company educational resource development. For example, General Motors Corporation developed over 1,400 individual PBO improvements. They did this utilizing all nodes of their manufacturing infrastructure.
In cases where local colleges used the PBO process, they were able to relate to smaller manufacturing employers in language that was commonly understood by manufacturers and educators, and could be used to have direct and relevant impact on how courses and curricula could be improved or re-structured or, in some cases, developed from scratch.
Other partnerships were significantly enhanced with the regional workforce systems, and community-based organizations and unions where the new approach to competency-based skills development was recognized as sorely needed, and in some areas, a new approach. There are different examples of each depending on the college.
Examples of strong partnerships at the individual college level include:
All colleges in the consortium strengthened and improved their industrial partner relationships. Examples: TCAT: Amazon; Spartanburg: Waste water management companies across the State (also in partnership with

Multi-State Advanced Manufacturing Consortium TAACCCT Round II Grant – FINAL EVALUATION REPORT 33
Clemson and other colleges now in operation). ); Pellissippi: Advanced Manufacturing Suppliers; Henry Ford College and Oakland Community College with Tier One and Two automotive suppliers through the Michigan Talent Investment Agency of the State of Michigan; Rhodes State College: OEM and Supplier Base.
CREC (Center for Regional Economic Competitiveness) Dashboard, training, and integration with the public workforce systems throughout the Consortium states and the sharing of these tools with Workforce Development Boards regionally.
New apprenticeship models that facilitate refocused industrial maintenance occupations at companies including the General Motors Battery Plant, assemblers of the Chevrolet hybrid battery.
Program Implementation Fidelity to Design
As noted, the consortium envisioned, in its application to USDOL, development and implementation of new curriculum, new processes for administration, new student support mechanisms, and other elements noted in the 21 deliverables. They did achieve the common equipment structure but because what was ultimately produced were common models that were optional for local colleges to use, we cannot conclude that the entire consortium met all of the implementation objectives. Most assessments of organizational change indicate it takes at least five years to produce cultural change. These grants had about three years to get to that point. In this case, about a year was spent in trying to find the right ground to actualize the full potential of the consortium, using the AMTEC curricula, which proved not to be a complete solution for bringing the needed employer alignment, student support, and institutional change. When the consortium did decide on its path, the model development process was often quite time consuming. Thus many of the participants likely did not benefit from any of the consortium’s innovations since the innovations came after much of the grant supported instruction was completed. The default resulted in some excellent models but mostly as examples not put into general practice.
Examples of implementation at the individual college level include a wide range of activities not covered thus far in this report. They include:
The transition in the curriculum to newer, industry specific technology: not necessarily new courses. For example, HFC’s robot course, Spartanburg CC’s PLC courses, and Bridge Valley’s Process Technology courses are now taught on industry standard equipment. New equipment purchased for each school specifically for their identified needs, rated with the PBO data, and GAP – i.e. T-CAT purchased “Fenceless Robots”, a new, more sophisticated way to assess and meet technological skill needs. This is significant when seen from the perspective that this industry based-equipment has become part of the local program’s competency based skills formation model for their degrees, not simply additional equipment, seldom used in labs.
The consortium did not introduce a new program of study per se. The consortium did seek wholescale change in how manufacturing education was delivered, but approached this through model development. Local efforts related to new programs of study include:
M-SAMC partner colleges chose a strategy to infuse new content into existing AA degrees. One major reason was the short research period of the grant, and the realization during the analysis period that existing curricula held the essential foundation content needed, and it could be reworked into competency-based modes of delivery, in a shorter period of time than going through the approval processes for new degrees. Through this new curricular and assessment approach a robust assessment model for prior learning and skills assessment was created. It offers a “system” for evaluation based upon courseware and skills assessment rubrics, rather than tasking individual faculty and students to create “one-off” approaches to prior learning assessment. At HFC these strategies resulted in new
Multi-State Advanced Manufacturing Consortium TAACCCT Round II Grant – FINAL EVALUATION REPORT 34
policies and procedures for prior learning assessment including a much reduced cost model where students receive credit based upon the assessment performed and not the cost of tuition credit.
The national Performance Based Objectives tool, and associated learning objects, create improved assessments for all areas of manufacturing education curricula.
State of Michigan (2 partner colleges) Automotive manufacturing maintenance technology and precision machining technology.
State of South Carolina (1 partner college) Process Based Manufacturing for Water treatment/purification technology.
Fidelity to Design – Case Studies As mentioned earlier, the final implementation evaluation activity involved developing an in-depth understanding of the status and progress of implementation at four particular M-SAMC colleges. In tracking fidelity to the original commitments outlined in the grant proposal, a summary table (see Appendix) was developed to capture the status at each of these four colleges. As is the case in virtually all TAACCCT grants, there have been major shifts in strategic direction and implementation. The list of strategies for this consortium is quite extensive, literally beyond reality. The consortium agreed to narrow its focus and change the implementation approach based on what was important and what was feasible. Of critical importance in understanding this case study summary is the gradual movement the consortium made away from a centralized model of developing common curricula, timelines, and other important aspects of competency based education reform. Ultimately, the consortium took on the role of guidance developer, using the input of workgroups comprised of all thirteen college staff, to create direction setting overviews of all of the deliverables.
Because member colleges were at different places at different times, as well as having differing local priorities, implementation devolved to the local level. This occurred to such a degree that the consortium’s logo became “National Innovation, Local Implementation”. This had enormous impact on the role of the consortium staff and the workgroups. Further, it should be noted that this direction was finally set after well over a year of trying to find common ground to move on a collective agenda. The consortium lost valuable time in valiantly trying to achieve the common strategies, only to have to eventually recognize the reality of its members’ varying readiness to implement.
It should also be noted that the four colleges selected for case studies were considered to be a good barometer of the diversity within the membership. Having said that, there are examples of movement on certain strategies within colleges not selected as case study participants. Such other accomplishments (while frequently outlined above) are not captured in the table, as they do not fit within the case study approach.
Finally, in narrowing the consortium’s priorities, performance-based objectives (PBOs), integrated system curricula, and the emergence of Participant Engagement Facilitators (PEFs) as a critical gap filler role were the key strategies emphasized by all colleges, and the focus of the consortium’s central policy development work. In fact, the PBOs continue to be honed and expanded to meet the needs of new audiences. Using other funding sources, work continues to refine and promote PBOs as the key to meeting employer needs. The PBO process is extensively covered on the consortium’s website, www.msamc.org.

Multi-State Advanced Manufacturing Consortium TAACCCT Round II Grant – FINAL EVALUATION REPORT 35
Participant Impacts & Outcomes
Impact Evaluation Data Analysis
Overall consortium summary
The starting point of the impact evaluation is the impact research questions, which are based on the DOL reporting requirements for the annual performance report. Given the limitations in data availability, some question were answerable to a greater or lesser extent. Given that implementation strategies, programs, and details were so varied from college to college, there is no attempt to present an overall consortium comparison of participants and comparisons. However, comparison analyses are done for each college and program.
Overall, many colleges were able to accomplish gains in enrollment numbers over the course of the grant period. Several colleges accomplished increases in diversity in terms of gender, race, incumbent workers, or Pell-eligible students. Generally, completion rates were similar or out-performed comparison group completion rates. Employment outcomes were not subject to comparison analyses due to availability of employment data for comparison group members.
Here are direct answers, at the consortium-level, to the questions posed in the evaluation plan. Of note, due to gaps in data, especially employment data, many of the outcome numbers are lower than might be expected. Indeed, with complete data, it is expected that many of these counts would be higher.
1. How many unique participants/comparisons have been served?
In total, 4962 individuals were served by the grant.
2. How many individuals have completed a grant/comparison program of study?
a. Of those, how many are incumbent workers?
Over the course of the grant, 1635 participants completed a grant-affected program of study (629 of whom were incumbent workers). The completion rate for participants was generally similar to, or greater than, the completion rate for comparison individuals on a program-by-program basis.
3. How many individuals are still retained in their program of study (or other grant-funded program)?
2,651 participants were still continuing with their grant-affected program of study at the completion of the grant.
4. How many individuals are retained in other education programs?
Only 5 participants were retained in other education programs.
5. How many credit hours have been completed?
a. How many students have completed credit hours?
In total, over 80,000 credit hours were completed by study participants (80,258), spread across 3,690 participants who completed credit hours. Other participants engaged in non-credit programs.
6. How many credentials have been earned by participants/ comparisons?
a. How many students have earned certificates (<1 year)?
b. How many students have earned certificates (>1 year)?
c. How many students have earned degrees?

Multi-State Advanced Manufacturing Consortium TAACCCT Round II Grant – FINAL EVALUATION REPORT 36
Participants earned 2,524 certificates or degrees over the course of the grant. 1,357 students earned short-term certificates, 222 earned long-term certificates, and 352 earned degrees.
7. How many students are pursuing further education after program of study completion?
Of those who completed a grant-affected program of study, 237 continued on to further education after completion.
8. How many participants/comparisons are employed after program of study completion?
Of those who were non-incumbent workers at the time of entering, 311 participants who completed a grant-affected program gained employment in the semester after completion.
9. How many participants/ comparisons are retained in employment for three quarters after program of study completion?
Of those 311 employed, 121 were retained in employment through quarters two and three after completion. If longer follow-up was possible, we would expect more to be retained through three quarters.
10. What are the earnings of participants/ comparisons relative to before enrollment?
a. How many of those employed at enrollment received a wage increase post-enrollment?
Of those who were employed at study intake, 392 earned a wage increase in their employment.
College-by-college results
The following analyses give college-by-college and program-by-program data for all demographics and outcomes that are available. Because the most data is available for answering the research question about completion rates, that is the question where the analysis goes the deepest. In addition to raw data, a statistical analysis of completion rates and an estimate of the program effect on completion rate is calculated.
Detailed descriptions of each outcome can be found in the Outcomes/Impact Study Design portion of this report.
Alamo Colleges (Alamo)
The first two columns in the table below list the programs that the college included in the project along with certificates, degrees, or awards that students could potentially earn. Grant participants were individuals enrolled in these programs. The third column lists the programs from which comparison group members were drawn.
Table 1: Grant-Affected and Comparison Programs, Alamo
Program Certificate Comparison
Advanced Manufacturing Technology
Advanced Manufacturing Technology AAS Instrumentation Technology AAS
Just in Time Production / Machinist
AWS Certificate
Heavy Equipment Operator Certificate
Holt CAT Certificate
JIT IT Certificate
JIT Network IT Certificate
JIT-Network Security Certificate
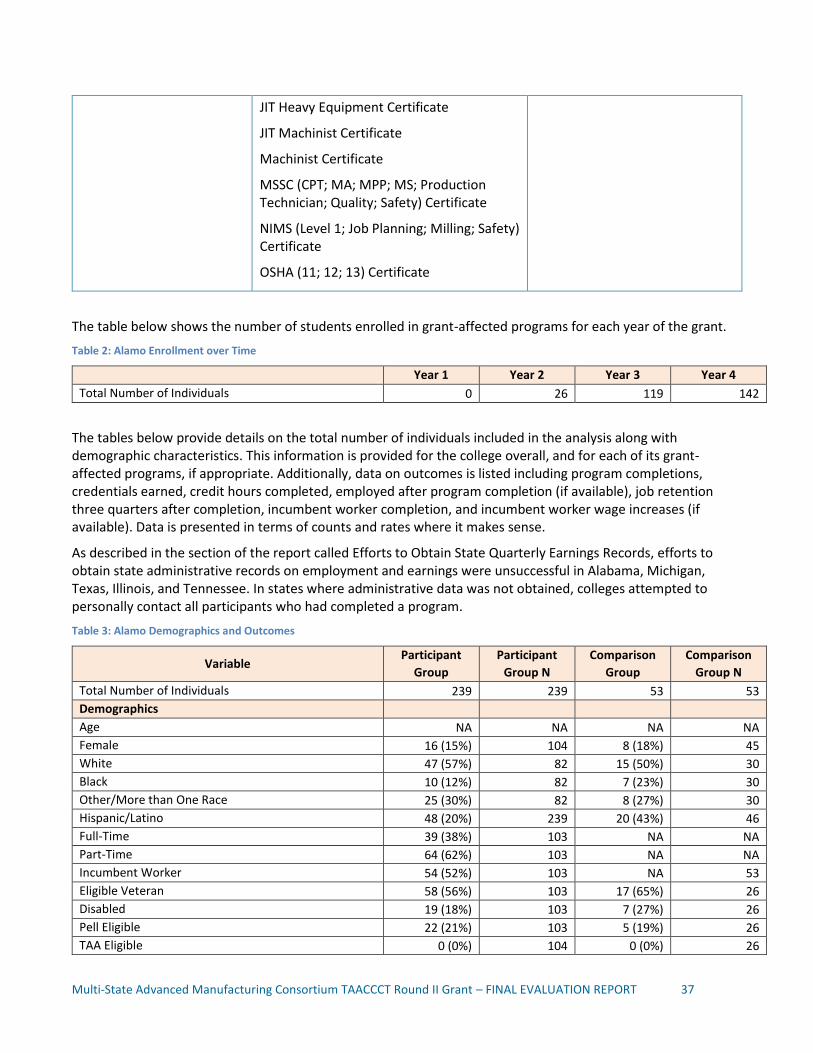
Multi-State Advanced Manufacturing Consortium TAACCCT Round II Grant – FINAL EVALUATION REPORT 37
JIT Heavy Equipment Certificate
JIT Machinist Certificate
Machinist Certificate
MSSC (CPT; MA; MPP; MS; Production Technician; Quality; Safety) Certificate
NIMS (Level 1; Job Planning; Milling; Safety) Certificate
OSHA (11; 12; 13) Certificate
The table below shows the number of students enrolled in grant-affected programs for each year of the grant.
Table 2: Alamo Enrollment over Time
Year 1 Year 2 Year 3 Year 4
Total Number of Individuals 0 26 119 142
The tables below provide details on the total number of individuals included in the analysis along with demographic characteristics. This information is provided for the college overall, and for each of its grant-affected programs, if appropriate. Additionally, data on outcomes is listed including program completions, credentials earned, credit hours completed, employed after program completion (if available), job retention three quarters after completion, incumbent worker completion, and incumbent worker wage increases (if available). Data is presented in terms of counts and rates where it makes sense.
As described in the section of the report called Efforts to Obtain State Quarterly Earnings Records, efforts to obtain state administrative records on employment and earnings were unsuccessful in Alabama, Michigan, Texas, Illinois, and Tennessee. In states where administrative data was not obtained, colleges attempted to personally contact all participants who had completed a program.
Table 3: Alamo Demographics and Outcomes
Variable Participant
Group
Participant
Group N
Comparison
Group
Comparison
Group N
Total Number of Individuals 239 239 53 53
Demographics
Age NA NA NA NA
Female 16 (15%) 104 8 (18%) 45
White 47 (57%) 82 15 (50%) 30
Black 10 (12%) 82 7 (23%) 30
Other/More than One Race 25 (30%) 82 8 (27%) 30
Hispanic/Latino 48 (20%) 239 20 (43%) 46
Full-Time 39 (38%) 103 NA NA
Part-Time 64 (62%) 103 NA NA
Incumbent Worker 54 (52%) 103 NA 53
Eligible Veteran 58 (56%) 103 17 (65%) 26
Disabled 19 (18%) 103 7 (27%) 26
Pell Eligible 22 (21%) 103 5 (19%) 26
TAA Eligible 0 (0%) 104 0 (0%) 26
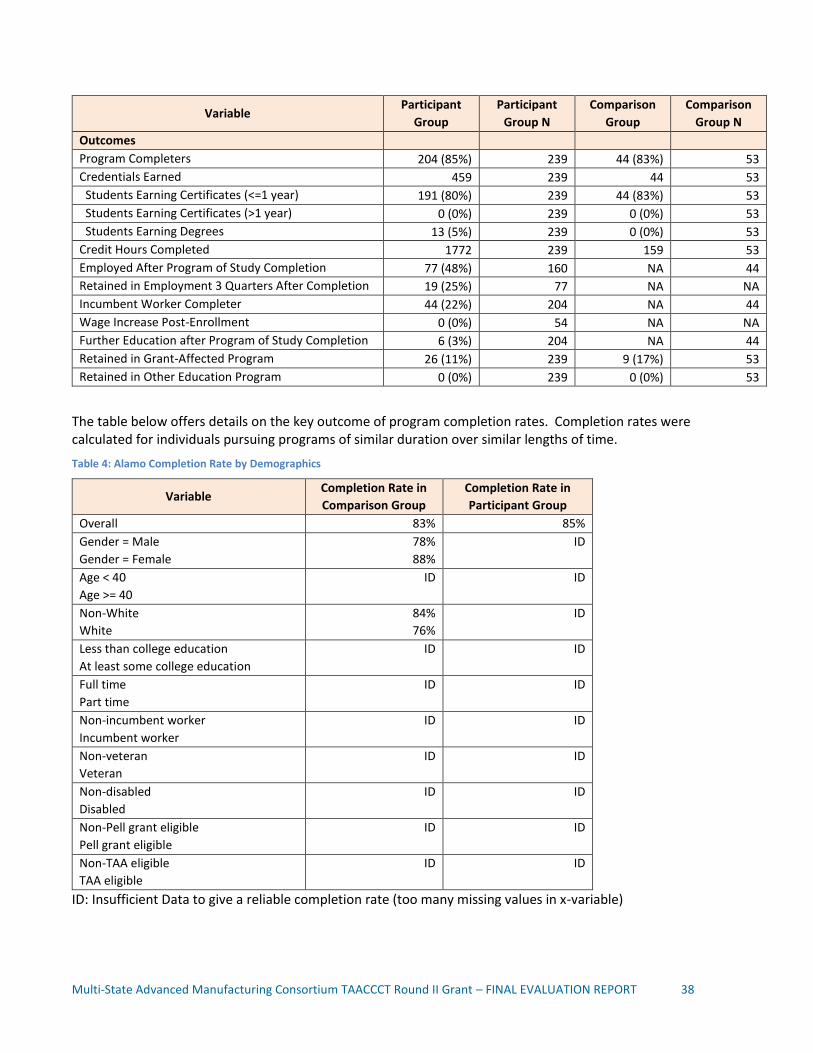
Multi-State Advanced Manufacturing Consortium TAACCCT Round II Grant – FINAL EVALUATION REPORT 38
Variable Participant
Group
Participant
Group N
Comparison
Group
Comparison
Group N
Outcomes
Program Completers 204 (85%) 239 44 (83%) 53
Credentials Earned 459 239 44 53
Students Earning Certificates (<=1 year) 191 (80%) 239 44 (83%) 53
Students Earning Certificates (>1 year) 0 (0%) 239 0 (0%) 53
Students Earning Degrees 13 (5%) 239 0 (0%) 53
Credit Hours Completed 1772 239 159 53
Employed After Program of Study Completion 77 (48%) 160 NA 44
Retained in Employment 3 Quarters After Completion 19 (25%) 77 NA NA
Incumbent Worker Completer 44 (22%) 204 NA 44
Wage Increase Post-Enrollment 0 (0%) 54 NA NA
Further Education after Program of Study Completion 6 (3%) 204 NA 44
Retained in Grant-Affected Program 26 (11%) 239 9 (17%) 53
Retained in Other Education Program 0 (0%) 239 0 (0%) 53
The table below offers details on the key outcome of program completion rates. Completion rates were calculated for individuals pursuing programs of similar duration over similar lengths of time.
Table 4: Alamo Completion Rate by Demographics
Variable Completion Rate in
Comparison Group
Completion Rate in
Participant Group
Overall 83% 85%
Gender = Male
Gender = Female
78%
88%
ID
Age < 40
Age >= 40
ID ID
Non-White
White
84%
76%
ID
Less than college education
At least some college education
ID ID
Full time
Part time
ID ID
Non-incumbent worker
Incumbent worker
ID ID
Non-veteran
Veteran
ID ID
Non-disabled
Disabled
ID ID
Non-Pell grant eligible
Pell grant eligible
ID ID
Non-TAA eligible
TAA eligible
ID ID
ID: Insufficient Data to give a reliable completion rate (too many missing values in x-variable)

Multi-State Advanced Manufacturing Consortium TAACCCT Round II Grant – FINAL EVALUATION REPORT 39
Estimation of Completion Rate Treatment Effect for Alamo
The crude, unadjusted odds ratio (the odds of completion in the participant group relative to the odds in the comparison group) is 1.2 (p=0.73). A propensity score model (estimating the probability of being a member of the participant group) is fit using gender, age, race, veteran, disabled, and Pell eligible. The propensity score adjusted odds ratio is 1.1 (p=0.83).
Table 5: AAS Advanced Manufacturing Technology vs. AAS Instrumentation Technology
Variable Participant
Group
Participant
Group N
Comparison
Group
Comparison
Group N
Total Number of Individuals 46 46 9 9
Demographics
Age NA NA NA NA
Female 12 (26%) 46 1 (11%) 9
White 22 (65%) 34 4 (67%) 6
Black 3 (9%) 34 0 (0%) 6
Other/More than One Race 9 (26%) 34 2 (33%) 6
Hispanic/Latino 18 (100%) 18 4 (44%) 9
Full-Time 39 (100%) 39 NA NA
Part-Time 0 (0%) 39 NA NA
Incumbent Worker 11 (28%) 39 NA 9
Eligible Veteran 2 (5%) 39 1 (11%) 9
Disabled 0 (0%) 39 0 (0%) 9
Pell Eligible 15 (38%) 39 2 (22%) 9
TAA Eligible 0 (0%) 46 0 (0%) 9
Outcomes
Program Completers 13 (28%) 46 0 (0%) 9
Credentials Earned 13 46 0 9
Students Earning Certificates (<=1 year) 0 (0%) 46 0 (0%) 9
Students Earning Certificates (>1 year) 0 (0%) 46 0 (0%) 9
Students Earning Degrees 13 (28%) 46 0 (0%) 9
Credit Hours Completed 1772 46 159 9
Employed After Program of Study Completion NA 12 NA 0
Retained in Employment 3 Quarters After Completion NA NA NA NA
Incumbent Worker Completer 1 (8%) 13 NA 0
Wage Increase Post-Enrollment NA NA NA NA
Further Education after Program of Study Completion NA NA NA NA
Retained in Grant-Affected Program 26 (57%) 46 9 (100%) 9
Retained in Other Education Program 0 (0%) 46 0 (0%) 9
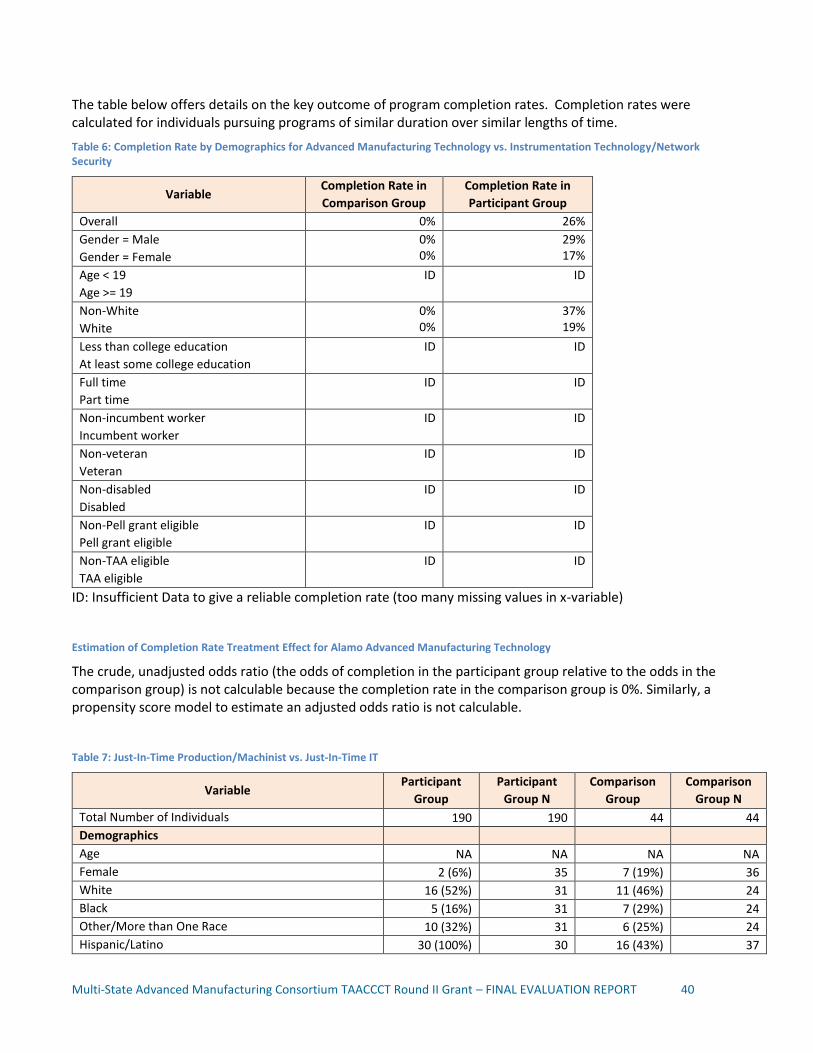
Multi-State Advanced Manufacturing Consortium TAACCCT Round II Grant – FINAL EVALUATION REPORT 40
The table below offers details on the key outcome of program completion rates. Completion rates were calculated for individuals pursuing programs of similar duration over similar lengths of time.
Table 6: Completion Rate by Demographics for Advanced Manufacturing Technology vs. Instrumentation Technology/Network Security
Variable Completion Rate in
Comparison Group
Completion Rate in
Participant Group
Overall 0% 26%
Gender = Male
Gender = Female
0% 0%
29% 17%
Age < 19
Age >= 19
ID ID
Non-White
White
0% 0%
37% 19%
Less than college education
At least some college education
ID ID
Full time
Part time
ID ID
Non-incumbent worker
Incumbent worker
ID ID
Non-veteran
Veteran
ID ID
Non-disabled
Disabled
ID ID
Non-Pell grant eligible
Pell grant eligible
ID ID
Non-TAA eligible
TAA eligible
ID ID
ID: Insufficient Data to give a reliable completion rate (too many missing values in x-variable)
Estimation of Completion Rate Treatment Effect for Alamo Advanced Manufacturing Technology
The crude, unadjusted odds ratio (the odds of completion in the participant group relative to the odds in the comparison group) is not calculable because the completion rate in the comparison group is 0%. Similarly, a propensity score model to estimate an adjusted odds ratio is not calculable.
Table 7: Just-In-Time Production/Machinist vs. Just-In-Time IT
Variable Participant
Group
Participant
Group N
Comparison
Group
Comparison
Group N
Total Number of Individuals 190 190 44 44
Demographics
Age NA NA NA NA
Female 2 (6%) 35 7 (19%) 36
White 16 (52%) 31 11 (46%) 24
Black 5 (16%) 31 7 (29%) 24
Other/More than One Race 10 (32%) 31 6 (25%) 24
Hispanic/Latino 30 (100%) 30 16 (43%) 37

Multi-State Advanced Manufacturing Consortium TAACCCT Round II Grant – FINAL EVALUATION REPORT 41
Variable Participant
Group
Participant
Group N
Comparison
Group
Comparison
Group N
Full-Time 0 (0%) 64 NA NA
Part-Time 64 (100%) 64 NA NA
Incumbent Worker 43 (67%) 64 NA 44
Eligible Veteran 56 (88%) 64 16 (94%) 17
Disabled 19 (30%) 64 7 (41%) 17
Pell Eligible 7 (11%) 64 3 (18%) 17
TAA Eligible 0 (0%) 35 0 (0%) 17
Outcomes
Program Completers 190 (100%) 190 44 (100%) 44
Credentials Earned 446 190 44 44
Students Earning Certificates (<=1 year) 190 (100%) 190 44 (100%) 44
Students Earning Certificates (>1 year) 0 (0%) 190 0 (0%) 44
Students Earning Degrees 0 (0%) 190 0 (0%) 44
Credit Hours Completed 0 190 0 44
Employed After Program of Study Completion NA 147 NA 44
Retained in Employment 3 Quarters After Completion NA NA NA NA
Incumbent Worker Completer 43 (23%) 190 NA 44
Wage Increase Post-Enrollment NA NA NA NA
Further Education after Program of Study Completion NA NA NA NA
Retained in Grant-Affected Program 0 (0%) 190 0 (0%) 44
Retained in Other Education Program 0 (0%) 190 0 (0%) 44
The table below offers details on the key outcome of program completion rates. Completion rates were calculated for individuals pursuing programs of similar duration over similar lengths of time.
Table 8: Alamo Completion Rate by Demographics for Just-In-Time Production/Machinist vs. Just-In-Time IT
Variable Completion Rate in
Comparison Group
Completion Rate in
Participant Group
Overall 100% 99%
Gender = Male
Gender = Female
100% 100%
100% 100%
Age < 44
Age >= 44
ID ID
Non-White
White
100% 100%
100% 100%
Less than college education
At least some college education
ID ID
Full time
Part time
ID ID
Non-incumbent worker
Incumbent worker
ID ID
Non-veteran
Veteran
ID ID
Non-disabled
Disabled
ID ID

Multi-State Advanced Manufacturing Consortium TAACCCT Round II Grant – FINAL EVALUATION REPORT 42
Variable Completion Rate in
Comparison Group
Completion Rate in
Participant Group
Non-Pell grant eligible
Pell grant eligible
ID ID
Non-TAA eligible
TAA eligible
ID ID
ID: Insufficient Data to give a reliable completion rate (too many missing values in x-variable)
Estimation of Completion Rate Treatment Effect for Alamo Just-In-Time Production/Machinist
The crude, unadjusted odds ratio (the odds of completion in the participant group relative to the odds in the comparison group) is not calculable because the completion rate in the comparison group is 100%. Similarly, a propensity score model to estimate an adjusted odds ratio is not calculable.
Alamo Summary
Bluegrass Community and Technical College (Bluegrass)
The first two columns in the table below list the programs that the college included in the project along with certificates, degrees, or awards that students could potentially earn. Each program includes short-term certificates, stacking up to an AAS. Overlap occurs between the four programs. For example, many students declare one program, yet complete certifications in other programs. Because of this overlap, the four program groups have been combined into one participant group for the purpose of the evaluation.
Noted in the third column, the comparison group consists of students who were enrolled in, or taking coursework in, the four programs starting three years prior to the usage of grant funds. Data was collected for
Items of note: The M-SAMC project theorizes the grant intervention will promote improved program accessibility, completion, and post-completion employment. These outcomes are summarized below
Accessibility:
The racial, gender, veteran, disabled, and Pell-eligible demographics are similar among participant and comparison group members.
52 percent of participants were incumbent workers; No data is available on incumbent worker status among comparisons.
Capacity of programs increased as demonstrated by increased enrollment over the course of the grant.
Program Completion:
Overall program completions among participants (85%) occurred at a similar rate to comparisons (83%)
Post-completion Employment:
48 percent of unemployed participants reported they became employed post-completion.
No data is available on post-completion employment for comparison group members.

Multi-State Advanced Manufacturing Consortium TAACCCT Round II Grant – FINAL EVALUATION REPORT 43
participants starting in the Fall 2012 semester through the Spring 2016 semester. Data was collected for comparison students starting in the Fall 2009 semester through the Summer 2012 semester.
Table 9: Grant-Affected and Comparison Programs, Bluegrass
Program Certificate Comparison
Integrated Engineering Technology
Industrial Maintenance Technology
Electrical Technology
Engineering and Electronics Technology
Integrated Engineering Technology (Certificate; Diploma; AAS)
Industrial Maintenance Technology (Certificate; Diploma; AAS)
Electrical Technology (Certificate; Diploma; AAS)
Engineering and Electronics Technology (Certificate; Diploma; AAS)
Historical
The table below shows the number of students enrolled in grant-affected programs for each year of the grant.
Table 10: Bluegrass Enrollment over Time
Year 1 Year 2 Year 3 Year 4
Total Number of Individuals 728 990 1141 1446
The tables below provide details on the total number of individuals included in the analysis along with demographic characteristics. This information is provided for the college overall, and for each of its grant-affected programs, if appropriate. Additionally, data on outcomes is listed including program completions, credentials earned, credit hours completed, employed after program completion (if available), job retention three quarters after completion, incumbent worker completion, and incumbent worker wage increases (if available). Data is presented in terms of counts and rates where it makes sense.
As described in the section of the report called Efforts to Obtain State Quarterly Earnings Records, efforts to obtain state administrative records on employment and earnings were unsuccessful in Alabama, Michigan, Texas, Illinois, and Tennessee. In states where administrative data was not obtained, colleges attempted to personally contact all participants who had completed a program.
Table 11: Bluegrass Demographics and Outcomes
Variable Participant
Group
Participant
Group N
Comparison
Group
Comparison
Group N
Total Number of Individuals 1630 1630 965 965
Demographics
Age 30.3 ± 11.3 1630 28.6 ± 9.4 965
Female 109 (7%) 1629 44 (5%) 965
White 1249 (87%) 1442 791 (85%) 936
Black 149 (10%) 1442 123 (13%) 936
Other/More than One Race 44 (3%) 1442 22 (2%) 936
Hispanic/Latino 58 (4%) 1630 20 (2%) 965
Full-Time 30 (88%) 34 NA NA
Part-Time 4 (12%) 34 NA NA

Multi-State Advanced Manufacturing Consortium TAACCCT Round II Grant – FINAL EVALUATION REPORT 44
Variable Participant
Group
Participant
Group N
Comparison
Group
Comparison
Group N
Incumbent Worker 118 (63%) 186 119 (55%) 215
Eligible Veteran 113 (7%) 1630 50 (5%) 965
Disabled 29 (2%) 1630 20 (2%) 965
Pell Eligible 674 (41%) 1630 489 (51%) 965
TAA Eligible 57 (3%) 1630 NA NA
Outcomes
Program Completers 193 (12%) 1630 216 (22%) 965
Credentials Earned 713 1630 925 965
Students Earning Certificates (<=1 year) 187 (11%) 1630 205 (21%) 965
Students Earning Certificates (>1 year) 123 (8%) 1630 178 (18%) 965
Students Earning Degrees 148 (9%) 1630 170 (18%) 965
Credit Hours Completed 32311 1630 27990 965
Employed After Program of Study Completion 37 (63%) 59 64 (67%) 96
Retained in Employment 3 Quarters After Completion 35 (95%) 37 51 (80%) 64
Incumbent Worker Completer 0 (0%) 193 NA 216
Wage Increase Post-Enrollment 115 (98%) 118 118 (99%) 119
Further Education after Program of Study Completion 114 (68%) 169 140 (65%) 215
Retained in Grant-Affected Program (%) 1630 (%) 965
Retained in Other Education Program (%) 1630 (%) 965
The table below offers details on the key outcome of program completion rates. Completion rates were calculated for individuals pursuing programs of similar duration over similar lengths of time.
Table 12: Bluegrass Completion Rate by Demographics
Variable Completion Rate in
Comparison Group
Completion Rate in
Participant Group
Overall 22% 12%
Gender = Male
Gender = Female
23% 18%
12% 6%
Age < 27
Age >= 27
22% 23%
13% 11%
Non-White
White
14% 24%
5% 14%
Less than college education
At least some college education
ID ID
Full time
Part time
ID ID
Non-incumbent worker
Incumbent worker
ID ID
Non-veteran
Veteran
23% 18%
11% 19%
Non-disabled
Disabled
22% 20%
12% 7%
Non-Pell grant eligible
Pell grant eligible
28% 17%
10% 15%

Multi-State Advanced Manufacturing Consortium TAACCCT Round II Grant – FINAL EVALUATION REPORT 45
Variable Completion Rate in
Comparison Group
Completion Rate in
Participant Group
Non-TAA eligible
TAA eligible
ID ID
ID: Insufficient Data to give a reliable completion rate (too many missing values in x-variable)
Estimation of Completion Rate Treatment Effect for Bluegrass
The crude, unadjusted odds ratio (the odds of completion in the participant group relative to the odds in the comparison group) is 0.5 (p<0.01). A propensity score model (estimating the probability of being a member of the participant group) is fit using gender, age, race, veteran, disabled, and Pell eligible. The propensity score adjusted odds ratio is 0.5 (p=0.01).
Incumbent worker status for students was identified through state wage data, not self-attestation.
Bluegrass Summary
BridgeValley Community & Technical College (BridgeValley)
The participant group for BridgeValley includes one program stack: Advanced Manufacturing Technology. This program stack includes a Welding Skill Set Certificate and an AAS in Advanced Manufacturing Technology. Although the Welding Skill Set Certificate can be completed separately from the Advanced Manufacturing Technology program, many students who have declared a program of study in Advanced Manufacturing Technology have also completed the Welding Skill Set. Due to the overlap between the two programs, the two program groups have been combined into one cohesive participant group for the purpose of the evaluation. Data was collected for participants starting in the fall semester of 2012 through the spring semester of 2016. BridgeValley was unable to provide comparison data for this analysis, so the Gadsden State Community College comparison groups were included as a benchmark. Gadsden’s programs were selected as the benchmark due to similarities in program type and duration.
Items of note: The M-SAMC project theorizes the grant intervention will promote improved program accessibility, completion, and post-completion employment. These outcomes are summarized below
Accessibility:
The age, racial, gender, veteran, disabled, and Pell-eligible demographics are similar among participant and comparison group members.
Capacity of programs increased as demonstrated by increased enrollment over the course of the grant.
Program Completion:
Overall program completions among participants (12%) occurred at a slightly lower rate to comparisons (22%)
Post-completion Employment:
Post-completion job attainment among non-incumbent workers is similar among participants (63%) and comparisons (67%).
The share of incumbent workers that receive a wage increase post-enrollment is similar between participants (98%) and comparisons (99%)

Multi-State Advanced Manufacturing Consortium TAACCCT Round II Grant – FINAL EVALUATION REPORT 46
Table 13: Grant-Affected and Comparison Programs, BridgeValley
Program Certificate Comparison
Advanced Manufacturing Technology
Welding Skill Set
Advanced Manufacturing Technology AAS
Welding Skill Set Certificate
Gadsden State Community College comparison group
The table below shows the number of students enrolled in grant-affected programs for each year of the grant.
Table 14: BridgeValley Enrollment over Time
Year 1 Year 2 Year 3 Year 4
Total Number of Individuals 21 18 34 31
The tables below provide details on the total number of individuals included in the analysis along with demographic characteristics. This information is provided for the college overall, and for each of its grant-affected programs, if appropriate. Additionally, data on outcomes is listed including program completions, credentials earned, credit hours completed, employed after program completion (if available), job retention three quarters after completion, incumbent worker completion, and incumbent worker wage increases (if available). Data is presented in terms of counts and rates where it makes sense.
As described in the section of the report called Efforts to Obtain State Quarterly Earnings Records, efforts to obtain state administrative records on employment and earnings were unsuccessful in Alabama, Michigan, Texas, Illinois, and Tennessee. In states where administrative data was not obtained, colleges attempted to personally contact all participants who had completed a program.
Table 15: BridgeValley Demographics and Outcomes
Variable Participant
Group
Participant
Group N
Total Number of Individuals 77 77
Demographics
Age 23.5 ± 6.2 60
Female 4 (5%) 77
White 74 (97%) 76
Black 2 (3%) 76
Other/More than One Race 0 (0%) 76
Hispanic/Latino 0 (0%) 77
Full-Time 46 (96%) 48
Part-Time 2 (4%) 48
Incumbent Worker 54 (95%) 57
Eligible Veteran 1 (1%) 74
Disabled 1 (2%) 58
Pell Eligible 21 (37%) 57
TAA Eligible 1 (1%) 77
Outcomes
Program Completers 32 (42%) 77
Credentials Earned 32 77
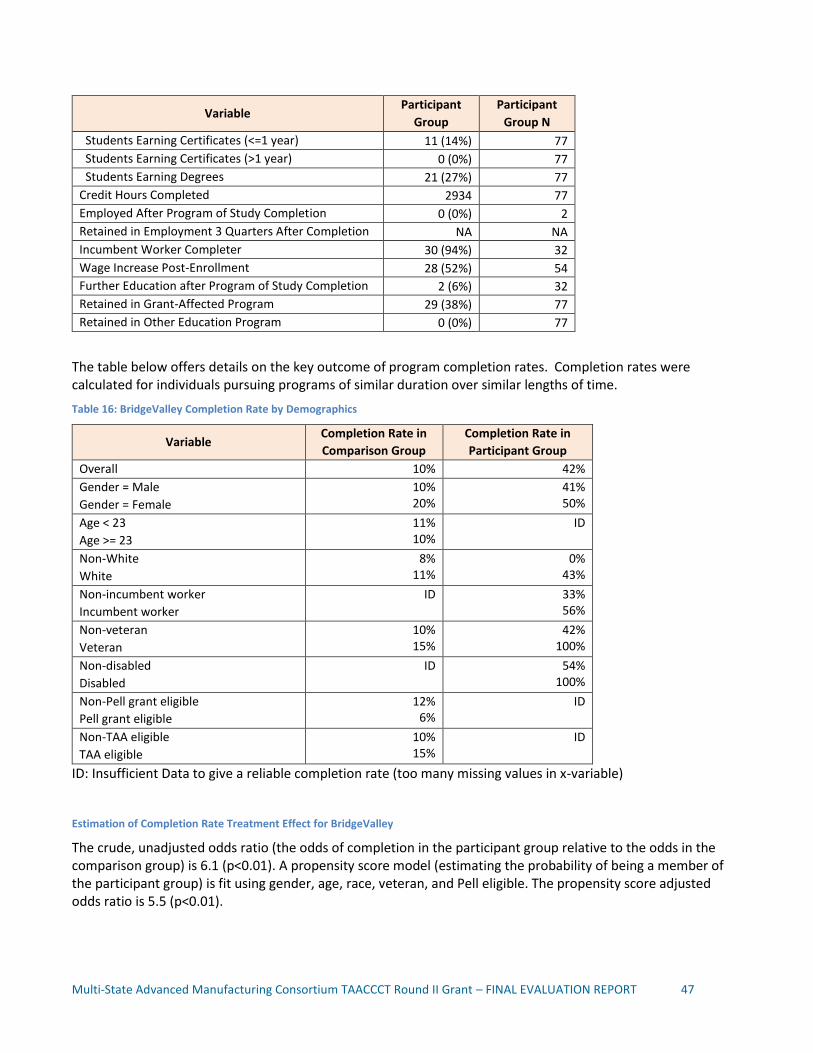
Multi-State Advanced Manufacturing Consortium TAACCCT Round II Grant – FINAL EVALUATION REPORT 47
Variable Participant
Group
Participant
Group N
Students Earning Certificates (<=1 year) 11 (14%) 77
Students Earning Certificates (>1 year) 0 (0%) 77
Students Earning Degrees 21 (27%) 77
Credit Hours Completed 2934 77
Employed After Program of Study Completion 0 (0%) 2
Retained in Employment 3 Quarters After Completion NA NA
Incumbent Worker Completer 30 (94%) 32
Wage Increase Post-Enrollment 28 (52%) 54
Further Education after Program of Study Completion 2 (6%) 32
Retained in Grant-Affected Program 29 (38%) 77
Retained in Other Education Program 0 (0%) 77
The table below offers details on the key outcome of program completion rates. Completion rates were calculated for individuals pursuing programs of similar duration over similar lengths of time.
Table 16: BridgeValley Completion Rate by Demographics
Variable Completion Rate in
Comparison Group
Completion Rate in
Participant Group
Overall 10% 42%
Gender = Male
Gender = Female
10% 20%
41% 50%
Age < 23
Age >= 23
11% 10%
ID
Non-White
White
8% 11%
0% 43%
Non-incumbent worker
Incumbent worker
ID 33% 56%
Non-veteran
Veteran
10% 15%
42% 100%
Non-disabled
Disabled
ID 54% 100%
Non-Pell grant eligible
Pell grant eligible
12% 6%
ID
Non-TAA eligible
TAA eligible
10% 15%
ID
ID: Insufficient Data to give a reliable completion rate (too many missing values in x-variable)
Estimation of Completion Rate Treatment Effect for BridgeValley
The crude, unadjusted odds ratio (the odds of completion in the participant group relative to the odds in the comparison group) is 6.1 (p<0.01). A propensity score model (estimating the probability of being a member of the participant group) is fit using gender, age, race, veteran, and Pell eligible. The propensity score adjusted odds ratio is 5.5 (p<0.01).

Multi-State Advanced Manufacturing Consortium TAACCCT Round II Grant – FINAL EVALUATION REPORT 48
BridgeValley Summary
Danville Community College (Danville)
The participant group for Danville includes two program stacks: Integrated Systems Technology and Maintenance Mechanics. These program stacks include numerous short-term certificates and diplomas relating to mechanics and electronics/electrical systems, which are listed in the table below along with certificates, degrees, or awards participants may receive. Due to the small sample size of the Maintenance Mechanics certificate program, it has been grouped with the larger Integrated Systems Technology program stack.
Listed in the third columns, a historical comparison group was determined consisting of students who were enrolled in, or taking coursework in, Maintenance Mechanics, Manufacturing Technology, or Industrial Maintenance Technology programs starting four semesters prior to the usage of grant funds. Data collected for the Fall 2014 semester through the Fall 2015 semester are for grant-affected students, and data collected for the Fall 2012 semester through the Fall 2013 semester are for students in the historical comparison group.
Table 17: Grant-Affected and Comparison Programs, Danville
Program Certificate Comparison
Maintenance Mechanics
Integrated Systems Technology
Maintenance Mechanics Certificate
Industrial Electronic/Electrical Principles Certificate
Electronic/Electrical Service Diploma
Maintenance Mechanics Certificate
Manufacturing Technician Certificate
Technical Studies – Industrial Maintenance Technician
Items of note: The M-SAMC project theorizes the grant intervention will promote improved program accessibility, completion, and post-completion employment. These outcomes are summarized below
Accessibility:
95 percent of individuals who reported indicated that they were incumbent workers upon becoming participants
Program Completion:
Overall 42 percent of participants became completers, which was higher than the selected benchmark program (Gadsden, 10 percent completion rate).
Post-completion Employment:
Given the high percentage of incumbent worker participants, there were no unemployed individuals who obtained employment after completion.
52 percent of incumbent worker participants reported a wage increase after enrollment.

Multi-State Advanced Manufacturing Consortium TAACCCT Round II Grant – FINAL EVALUATION REPORT 49
The table below shows the number of students enrolled in grant-affected programs for each year of the grant.
Table 18: Danville Enrollment over Time
Year 1 Year 2 Year 3 Year 4
Total Number of Individuals 0 0 32 52
The tables below provide details on the total number of individuals included in the analysis along with demographic characteristics. This information is provided for the college overall, and for each of its grant-affected programs, if appropriate. Additionally, data on outcomes is listed including program completions, credentials earned, credit hours completed, employed after program completion (if available), job retention three quarters after completion, incumbent worker completion, and incumbent worker wage increases (if available). Data is presented in terms of counts and rates where it makes sense.
As described in the section of the report called Efforts to Obtain State Quarterly Earnings Records, efforts to obtain state administrative records on employment and earnings were unsuccessful in Alabama, Michigan, Texas, Illinois, and Tennessee. In states where administrative data was not obtained, colleges attempted to personally contact all participants who had completed a program.
Table 19: Danville Demographics and Outcomes
Variable Participant
Group
Participant
Group N
Comparison
Group
Comparison
Group N
Total Number of Individuals 53 53 61 61
Demographics
Age 27.5 ± 10.2 53 33.2 ± 11.8 61
Female 4 (8%) 53 5 (8%) 61
White 37 (70%) 53 33 (55%) 60
Black 16 (30%) 53 27 (45%) 60
Other/More than One Race 0 (0%) 53 0 (0%) 60
Hispanic/Latino 0 (0%) 53 1 (2%) 61
Full-Time 47 (90%) 52 NA NA
Part-Time 5 (10%) 52 NA NA
Incumbent Worker 31 (58%) 53 0 (0%) 61
Eligible Veteran 5 (10%) 52 NA NA
Disabled 1 (2%) 53 NA NA
Pell Eligible 18 (34%) 53 37 (61%) 61
TAA Eligible 1 (2%) 53 NA NA
Outcomes
Program Completers 6 (11%) 53 25 (41%) 61
Credentials Earned 6 53 25 61
Students Earning Certificates (<=1 year) 4 (8%) 53 23 (38%) 61
Students Earning Certificates (>1 year) 2 (4%) 53 2 (3%) 61
Students Earning Degrees 0 (0%) 53 0 (0%) 61
Credit Hours Completed 1257 53 1344 61
Employed After Program of Study Completion NA 0 NA 25
Retained in Employment 3 Quarters After Completion NA NA NA NA
Incumbent Worker Completer 6 (100%) 6 0 (0%) 25
Wage Increase Post-Enrollment 0 (0%) 31 NA NA
Further Education after Program of Study Completion 1 (17%) 6 NA 25

Multi-State Advanced Manufacturing Consortium TAACCCT Round II Grant – FINAL EVALUATION REPORT 50
Variable Participant
Group
Participant
Group N
Comparison
Group
Comparison
Group N
Retained in Grant-Affected Program 46 (87%) 53 36 (59%) 61
Retained in Other Education Program 0 (0%) 53 0 (0%) 61
The table below offers details on the key outcome of program completion rates. Completion rates were calculated for individuals pursuing programs of similar duration over similar lengths of time.
Table 20: Danville Completion Rate by Demographics
Variable Completion Rate in
Comparison Group
Completion Rate in
Participant Group
Overall 41% 11%
Gender = Male
Gender = Female
43% 20%
12% 0%
Age < 25
Age >= 25
31% 49%
3% 23%
Non-White
White
43% 39%
12% 11%
Non-incumbent worker
Incumbent worker
ID 0% 19%
Non-veteran
Veteran
ID 13% 0%
Non-disabled
Disabled
ID 12% 0%
Non-Pell grant eligible
Pell grant eligible
38% 43%
6% 22%
Non-TAA eligible
TAA eligible
ID 12% 0%
ID: Insufficient Data to give a reliable completion rate (too many missing values in x-variable)
Estimation of Completion Rate Treatment Effect for Danville
The crude, unadjusted odds ratio (the odds of completion in the participant group relative to the odds in the comparison group) is 0.2 (p<0.01). A propensity score model (estimating the probability of being a member of the participant group) is fit using gender, age, race, and Pell eligible. The propensity score adjusted odds ratio is 0.2 (p=0.01).
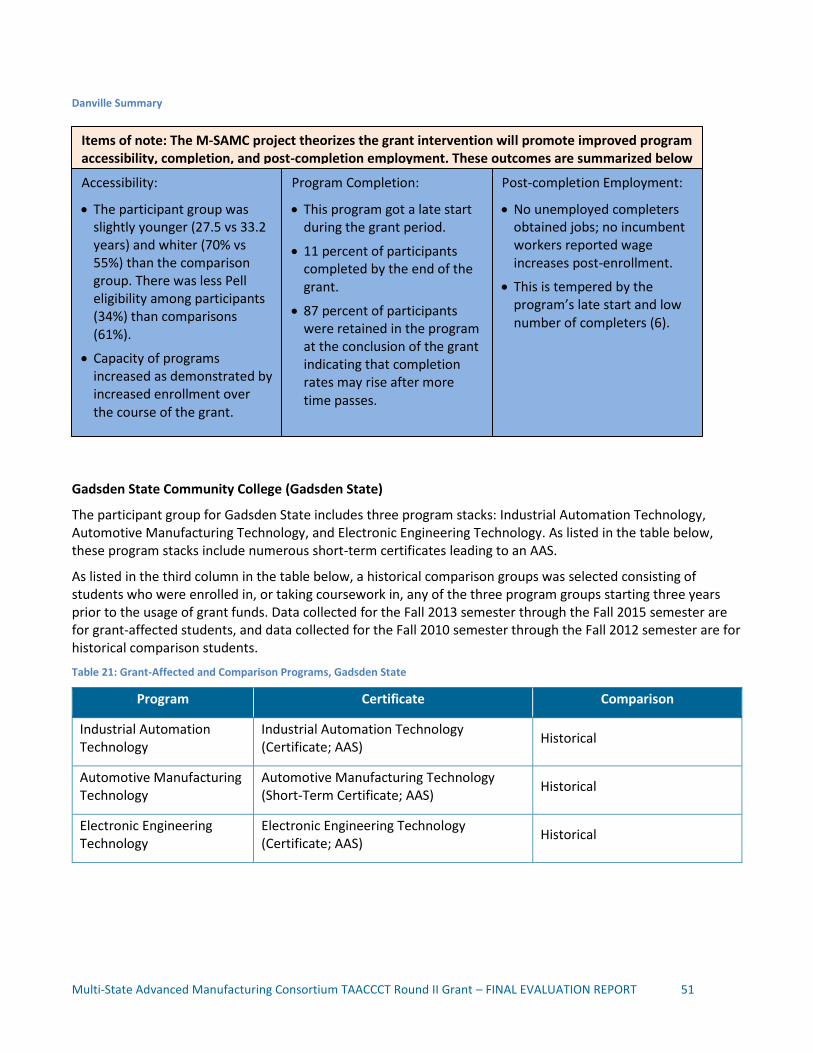
Multi-State Advanced Manufacturing Consortium TAACCCT Round II Grant – FINAL EVALUATION REPORT 51
Danville Summary
Gadsden State Community College (Gadsden State)
The participant group for Gadsden State includes three program stacks: Industrial Automation Technology, Automotive Manufacturing Technology, and Electronic Engineering Technology. As listed in the table below, these program stacks include numerous short-term certificates leading to an AAS.
As listed in the third column in the table below, a historical comparison groups was selected consisting of students who were enrolled in, or taking coursework in, any of the three program groups starting three years prior to the usage of grant funds. Data collected for the Fall 2013 semester through the Fall 2015 semester are for grant-affected students, and data collected for the Fall 2010 semester through the Fall 2012 semester are for historical comparison students.
Table 21: Grant-Affected and Comparison Programs, Gadsden State
Program Certificate Comparison
Industrial Automation Technology
Industrial Automation Technology (Certificate; AAS)
Historical
Automotive Manufacturing Technology
Automotive Manufacturing Technology (Short-Term Certificate; AAS)
Historical
Electronic Engineering Technology
Electronic Engineering Technology (Certificate; AAS)
Historical
Items of note: The M-SAMC project theorizes the grant intervention will promote improved program accessibility, completion, and post-completion employment. These outcomes are summarized below
Accessibility:
The participant group was slightly younger (27.5 vs 33.2 years) and whiter (70% vs 55%) than the comparison group. There was less Pell eligibility among participants (34%) than comparisons (61%).
Capacity of programs increased as demonstrated by increased enrollment over the course of the grant.
Program Completion:
This program got a late start during the grant period.
11 percent of participants completed by the end of the grant.
87 percent of participants were retained in the program at the conclusion of the grant indicating that completion rates may rise after more time passes.
Post-completion Employment:
No unemployed completers obtained jobs; no incumbent workers reported wage increases post-enrollment.
This is tempered by the program’s late start and low number of completers (6).

Multi-State Advanced Manufacturing Consortium TAACCCT Round II Grant – FINAL EVALUATION REPORT 52
The table below shows the number of students enrolled in grant-affected programs for each year of the grant.
Table 32: Gadsden State Enrollment over Time
Year 1 Year 2 Year 3 Year 4
Total Number of Individuals 0 121 185 286
The tables below provide details on the total number of individuals included in the analysis along with demographic characteristics. This information is provided for the college overall, and for each of its grant-affected programs, if appropriate. Additionally, data on outcomes is listed including program completions, credentials earned, credit hours completed, employed after program completion (if available), job retention three quarters after completion, incumbent worker completion, and incumbent worker wage increases (if available). Data is presented in terms of counts and rates where it makes sense.
As described in the section of the report called Efforts to Obtain State Quarterly Earnings Records, efforts to obtain state administrative records on employment and earnings were unsuccessful in Alabama, Michigan, Texas, Illinois, and Tennessee. In states where administrative data was not obtained, colleges attempted to personally contact all participants who had completed a program.
Not all students were able to be grouped into three distinct program groups. As a result, the sum of the three program groups will not equal the Gadsden State totals.
Table 23: Gadsden State Demographics and Outcomes
Variable Participant
Group
Participant
Group N
Comparison
Group
Comparison
Group N
Total Number of Individuals 315 315 765 765
Demographics
Age 25.9 ± 9.4 313 27.2 ± 10.2 765
Female 17 (5%) 315 59 (8%) 765
White 251 (80%) 313 553 (74%) 748
Black 51 (16%) 313 181 (24%) 748
Other/More than One Race 11 (4%) 313 14 (2%) 748
Hispanic/Latino 0 (0%) 313 23 (3%) 763
Full-Time 193 (77%) 252 NA NA
Part-Time 59 (23%) 252 NA NA
Incumbent Worker 141 (63%) 223 NA NA
Eligible Veteran 21 (8%) 280 40 (5%) 765
Disabled 11 (4%) 279 3 (1%) 241
Pell Eligible 156 (50%) 315 175 (23%) 765
TAA Eligible 6 (2%) 279 13 (2%) 765
Outcomes
Program Completers 35 (11%) 312 80 (10%) 762
Credentials Earned 41 312 89 762
Students Earning Certificates (<=1 year) 1 (0%) 312 0 (0%) 762
Students Earning Certificates (>1 year) 3 (1%) 312 3 (0%) 762
Students Earning Degrees 34 (11%) 312 77 (10%) 762
Credit Hours Completed 6166 312 19513 762
Employed After Program of Study Completion 7 (41%) 17 NA 80
Retained in Employment 3 Quarters After Completion 0 (0%) 7 NA NA

Multi-State Advanced Manufacturing Consortium TAACCCT Round II Grant – FINAL EVALUATION REPORT 53
Variable Participant
Group
Participant
Group N
Comparison
Group
Comparison
Group N
Incumbent Worker Completer 18 (51%) 35 NA 80
Wage Increase Post-Enrollment 1 (1%) 141 NA NA
Further Education after Program of Study Completion 4 (11%) 35 NA 80
Retained in Grant-Affected Program 277 (88%) 315 196 (26%) 762
Retained in Other Education Program 0 (0%) 312 0 (0%) 762
The table below offers details on the key outcome of program completion rates. Completion rates were calculated for individuals pursuing programs of similar duration over similar lengths of time.
Table 24: Gadsden State Completion Rate by Demographics
Variable Completion Rate in
Comparison Group
Completion Rate in
Participant Group
Overall 10% 11%
Gender = Male
Gender = Female
10% 20%
12% 0%
Age < 22
Age >= 22
12% 10%
11% 11%
Non-White
White
8% 11%
4% 13%
Non-incumbent worker
Incumbent worker
ID ID
Non-veteran
Veteran
10% 15%
9% 22%
Non-disabled
Disabled
ID 10% 20%
Non-Pell grant eligible
Pell grant eligible
12% 6%
13% 10%
Non-TAA eligible
TAA eligible
10% 15%
10% 33%
ID: Insufficient Data to give a reliable completion rate (too many missing values in x-variable)
Estimation of Completion Rate Treatment Effect for Gadsden State
The crude, unadjusted odds ratio (the odds of completion in the participant group relative to the odds in the comparison group) is 1.1 (p=0.73). A propensity score model (estimating the probability of being a member of the participant group) is fit using gender, age, race, veteran, disabled, Pell eligible, and TAA eligible. The propensity score adjusted odds ratio is 1.1 (p=0.76).
Table 25: Gadsden State Electronic Engineering Technology
Variable Participant
Group
Participant
Group N
Comparison
Group
Comparison
Group N
Total Number of Individuals 122 122 259 259
Demographics
Age 24.4 ± 8.2 118 26.7 ± 10.1 258

Multi-State Advanced Manufacturing Consortium TAACCCT Round II Grant – FINAL EVALUATION REPORT 54
Variable Participant
Group
Participant
Group N
Comparison
Group
Comparison
Group N
Female 8 (7%) 122 23 (9%) 259
White 92 (75%) 122 183 (72%) 253
Black 23 (19%) 122 65 (26%) 253
Other/More than One Race 7 (6%) 122 5 (2%) 253
Hispanic/Latino 0 (0%) 121 8 (3%) 258
Full-Time 69 (75%) 92 NA NA
Part-Time 23 (25%) 92 NA NA
Incumbent Worker 51 (62%) 82 NA NA
Eligible Veteran 6 (5%) 113 22 (8%) 259
Disabled 5 (5%) 111 2 (2%) 101
Pell Eligible 72 (59%) 122 74 (29%) 259
TAA Eligible 3 (3%) 111 2 (1%) 259
Outcomes
Program Completers 26 (22%) 120 77 (30%) 258
Credentials Earned 29 120 86 258
Students Earning Certificates (<=1 year) 0 (0%) 120 0 (0%) 258
Students Earning Certificates (>1 year) 2 (2%) 120 3 (1%) 258
Students Earning Degrees 26 (22%) 120 74 (29%) 258
Credit Hours Completed 2353 120 7391 258
Employed After Program of Study Completion 5 (38%) 13 NA 77
Retained in Employment 3 Quarters After Completion 0 (0%) 5 NA NA
Incumbent Worker Completer 13 (50%) 26 NA 77
Wage Increase Post-Enrollment 1 (2%) 51 NA NA
Further Education after Program of Study Completion 3 (12%) 26 NA 77
Retained in Grant-Affected Program 95 (78%) 122 72 (28%) 258
Retained in Other Education Program 0 (0%) 120 0 (0%) 258
The table below offers details on the key outcome of program completion rates. Completion rates were calculated for individuals pursuing programs of similar duration over similar lengths of time.
Table 26: Gadsden State Completion Rate by Demographics for Electronic Engineering Technology
Variable Completion Rate in
Comparison Group
Completion Rate in
Participant Group
Overall 30% 22%
Gender = Male
Gender = Female
28% 52%
23% 0%
Age < 21
Age >= 21
31% 29%
22% 22%
Non-White
White
23% 33%
4% 26%
Non-incumbent worker
Incumbent worker
ID ID
Non-veteran
Veteran
30% 27%
18% 75%
Non-disabled ID 20%
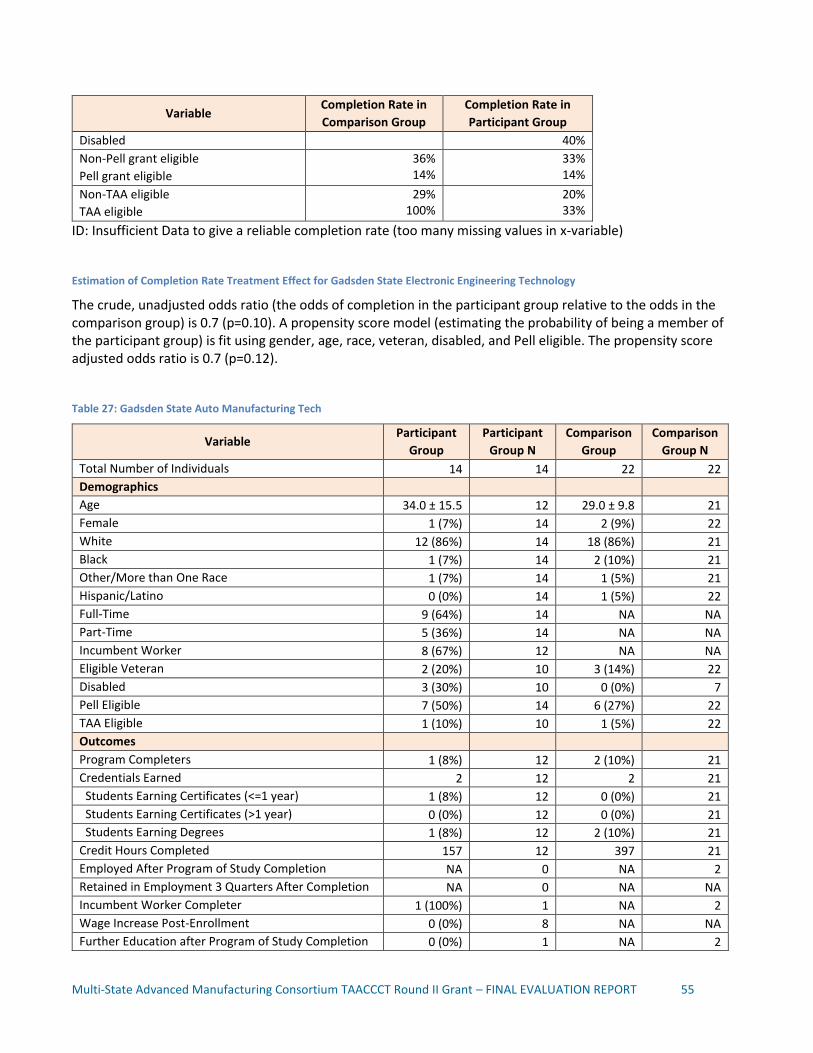
Multi-State Advanced Manufacturing Consortium TAACCCT Round II Grant – FINAL EVALUATION REPORT 55
Variable Completion Rate in
Comparison Group
Completion Rate in
Participant Group
Disabled 40%
Non-Pell grant eligible
Pell grant eligible
36% 14%
33% 14%
Non-TAA eligible
TAA eligible
29% 100%
20% 33%
ID: Insufficient Data to give a reliable completion rate (too many missing values in x-variable)
Estimation of Completion Rate Treatment Effect for Gadsden State Electronic Engineering Technology
The crude, unadjusted odds ratio (the odds of completion in the participant group relative to the odds in the comparison group) is 0.7 (p=0.10). A propensity score model (estimating the probability of being a member of the participant group) is fit using gender, age, race, veteran, disabled, and Pell eligible. The propensity score adjusted odds ratio is 0.7 (p=0.12).
Table 27: Gadsden State Auto Manufacturing Tech
Variable Participant
Group
Participant
Group N
Comparison
Group
Comparison
Group N
Total Number of Individuals 14 14 22 22
Demographics
Age 34.0 ± 15.5 12 29.0 ± 9.8 21
Female 1 (7%) 14 2 (9%) 22
White 12 (86%) 14 18 (86%) 21
Black 1 (7%) 14 2 (10%) 21
Other/More than One Race 1 (7%) 14 1 (5%) 21
Hispanic/Latino 0 (0%) 14 1 (5%) 22
Full-Time 9 (64%) 14 NA NA
Part-Time 5 (36%) 14 NA NA
Incumbent Worker 8 (67%) 12 NA NA
Eligible Veteran 2 (20%) 10 3 (14%) 22
Disabled 3 (30%) 10 0 (0%) 7
Pell Eligible 7 (50%) 14 6 (27%) 22
TAA Eligible 1 (10%) 10 1 (5%) 22
Outcomes
Program Completers 1 (8%) 12 2 (10%) 21
Credentials Earned 2 12 2 21
Students Earning Certificates (<=1 year) 1 (8%) 12 0 (0%) 21
Students Earning Certificates (>1 year) 0 (0%) 12 0 (0%) 21
Students Earning Degrees 1 (8%) 12 2 (10%) 21
Credit Hours Completed 157 12 397 21
Employed After Program of Study Completion NA 0 NA 2
Retained in Employment 3 Quarters After Completion NA 0 NA NA
Incumbent Worker Completer 1 (100%) 1 NA 2
Wage Increase Post-Enrollment 0 (0%) 8 NA NA
Further Education after Program of Study Completion 0 (0%) 1 NA 2

Multi-State Advanced Manufacturing Consortium TAACCCT Round II Grant – FINAL EVALUATION REPORT 56
Variable Participant
Group
Participant
Group N
Comparison
Group
Comparison
Group N
Retained in Grant-Affected Program 12 (86%) 14 6 (29%) 21
Retained in Other Education Program 0 (0%) 12 0 (0%) 21
The table below offers details on the key outcome of program completion rates. Completion rates were calculated for individuals pursuing programs of similar duration over similar lengths of time.
Table 28: Gadsden State Completion Rate by Demographics for Auto Manufacturing Tech
Variable Completion Rate in
Comparison Group
Completion Rate in
Participant Group
Overall 10% 8%
Gender = Male
Gender = Female
11% 0%
9% 0%
Age < 25
Age >= 25
20% 0%
17% 0%
Non-White
White
0% 11%
0% 9%
Non-incumbent worker
Incumbent worker
ID ID
Non-veteran
Veteran
11% 0%
0% 50%
Non-disabled
Disabled
ID 10% 0%
Non-Pell grant eligible
Pell grant eligible
12% 0%
0% 20%
Non-TAA eligible
TAA eligible
10% 0%
10% 0%
ID: Insufficient Data to give a reliable completion rate (too many missing values in x-variable)
Estimation of Completion Rate Treatment Effect for Gadsden State Auto Manufacturing Tech
The crude, unadjusted odds ratio (the odds of completion in the participant group relative to the odds in the comparison group) is 0.9 (p=0.91). A propensity score model (estimating the probability of being a member of the participant group) is fit using gender, age, veteran, and Pell eligible. The propensity score adjusted odds ratio is 1.2 (p=0.89).
Table 29: Gadsden State Industrial Automation Tech
Variable Participant
Group
Participant
Group N
Comparison
Group
Comparison
Group N
Total Number of Individuals 56 56 34 34
Demographics
Age 26.0 ± 9.5 55 27.9 ± 11.1 29
Female 2 (4%) 56 0 (0%) 34
White 48 (86%) 56 29 (85%) 34
Black 7 (12%) 56 5 (15%) 34

Multi-State Advanced Manufacturing Consortium TAACCCT Round II Grant – FINAL EVALUATION REPORT 57
Variable Participant
Group
Participant
Group N
Comparison
Group
Comparison
Group N
Other/More than One Race 1 (2%) 56 0 (0%) 34
Hispanic/Latino 0 (0%) 56 1 (3%) 34
Full-Time 40 (83%) 48 NA NA
Part-Time 8 (17%) 48 NA NA
Incumbent Worker 24 (56%) 43 NA 34
Eligible Veteran 3 (6%) 49 2 (6%) 34
Disabled 2 (4%) 48 NA (NA%) 34
Pell Eligible 27 (48%) 56 12 (35%) 34
TAA Eligible 1 (2%) 48 NA (NA%) 34
Outcomes
Program Completers 10 (18%) 56 1 (3%) 29
Credentials Earned 10 56 1 29
Students Earning Certificates (<=1 year) 0 (0%) 56 0 (0%) 29
Students Earning Certificates (>1 year) 1 (2%) 56 0 (0%) 29
Students Earning Degrees 9 (16%) 56 1 (3%) 29
Credit Hours Completed 1129 56 916 29
Employed After Program of Study Completion 2 (50%) 4 NA 1
Retained in Employment 3 Quarters After Completion 0 (0%) 2 NA NA
Incumbent Worker Completer 6 (60%) 10 NA 1
Wage Increase Post-Enrollment 1 (4%) 24 NA NA
Further Education after Program of Study Completion 1 (10%) 10 NA 1
Retained in Grant-Affected Program 45 (80%) 56 19 (66%) 29
Retained in Other Education Program 0 (0%) 56 0 (0%) 29
The table below offers details on the key outcome of program completion rates. Completion rates were calculated for individuals pursuing programs of similar duration over similar lengths of time.
Table 30: Gadsden State Completion Rate by Demographics for Industrial Automation Tech
Variable Completion Rate in
Comparison Group
Completion Rate in
Participant Group
Overall 3% 18%
Gender = Male
Gender = Female
3% NA
19% 0%
Age < 25
Age >= 25
7% 0%
15% 21%
Non-White
White
0% 4%
12% 19%
Non-incumbent worker
Incumbent worker
ID 7% 24%
Non-veteran
Veteran
4% 0%
12% 33%
Non-disabled
Disabled
ID ID
Non-Pell grant eligible
Pell grant eligible
5% 0%
17% 19%

Multi-State Advanced Manufacturing Consortium TAACCCT Round II Grant – FINAL EVALUATION REPORT 58
Variable Completion Rate in
Comparison Group
Completion Rate in
Participant Group
Non-TAA eligible
TAA eligible
ID 14% 100%
ID: Insufficient Data to give a reliable completion rate (too many missing values in x-variable)
NA: no females in the comparison group
Estimation of Completion Rate Treatment Effect for Gadsden State Industrial Automation Tech
The crude, unadjusted odds ratio (the odds of completion in the participant group relative to the odds in the comparison group) is 6.1 (p<0.01). A propensity score model (estimating the probability of being a member of the participant group) is fit using gender, age, race, veteran, disabled, and Pell eligible. The propensity score adjusted odds ratio is 6.7 (p=0.08).
Gadsden State Summary
Henry Ford College (Henry Ford)
As listed in the table below, the participant group for Henry Ford includes nine program stacks: CNC, Electrical Technology, Manufacturing Trades, Multi-Skilled Facility Maintenance Technology, Plant Maintenance Trades, Process Technology, Welding Technology, Industrial Sewing, and Advanced Manufacturing Awareness. Most program stacks include numerous short-term certificates leading up to an AAS.
A historical comparison group strategy was selected consisting of students who were enrolled in, or taking coursework in, any of the nine program groups starting three years prior to the usage of grant funds.
Items of note: The M-SAMC project theorizes the grant intervention will promote improved program accessibility, completion, and post-completion employment. These outcomes are summarized below
Accessibility:
The age, racial, gender, veteran, and disability demographics are similar among participant and comparison group members.
Participants had more Pell-eligibility (50%) than comparisons (23%)
These findings hold for each program and its comparison.
Capacity of programs increased as demonstrated by increased enrollment over the course of the grant.
Program Completion:
Overall program completions among participants (11%) occurred at a similar rate to comparisons (10%).
Each program has performed similarly to its historical comparison in terms of completion rate. One exception is Industrial Automation Technology, which increased its participant completion rate to 18% from its historical 3% mark.
Post-completion Employment:
Employment data for comparison group members was not attainable.
41 percent of unemployed participants who completed were able to obtain employment.
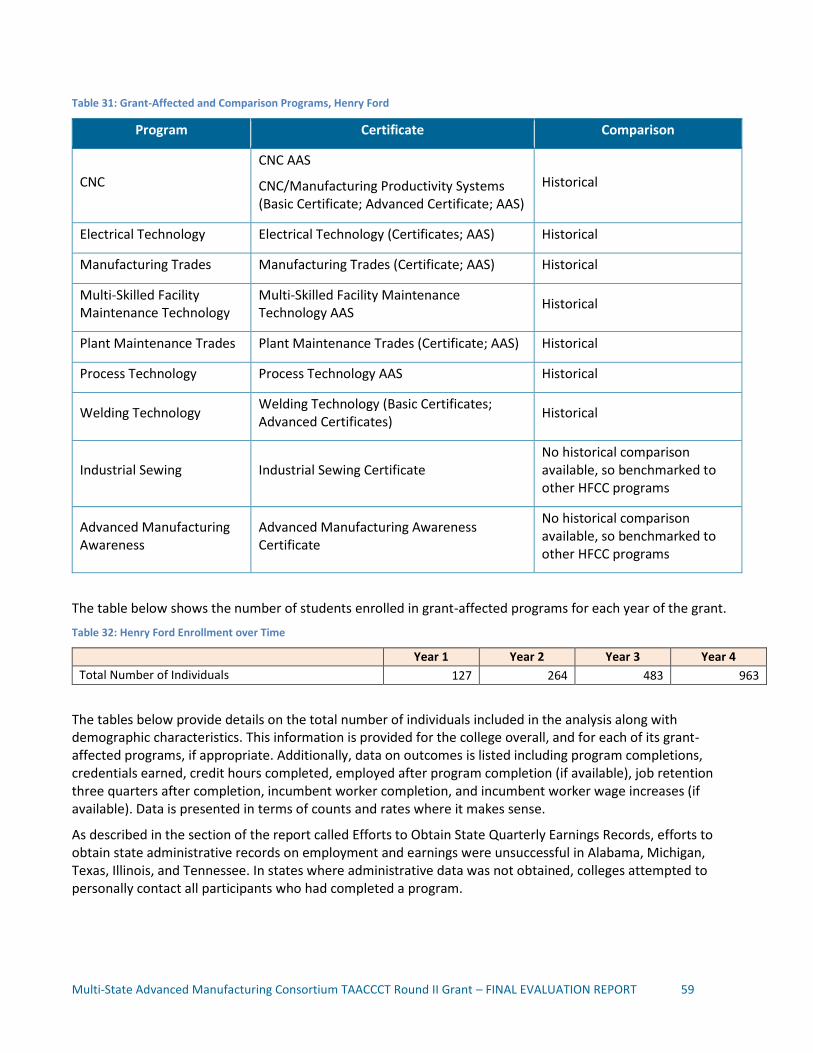
Multi-State Advanced Manufacturing Consortium TAACCCT Round II Grant – FINAL EVALUATION REPORT 59
Table 31: Grant-Affected and Comparison Programs, Henry Ford
Program Certificate Comparison
CNC
CNC AAS
CNC/Manufacturing Productivity Systems (Basic Certificate; Advanced Certificate; AAS)
Historical
Electrical Technology Electrical Technology (Certificates; AAS) Historical
Manufacturing Trades Manufacturing Trades (Certificate; AAS) Historical
Multi-Skilled Facility Maintenance Technology
Multi-Skilled Facility Maintenance Technology AAS
Historical
Plant Maintenance Trades Plant Maintenance Trades (Certificate; AAS) Historical
Process Technology Process Technology AAS Historical
Welding Technology Welding Technology (Basic Certificates; Advanced Certificates)
Historical
Industrial Sewing Industrial Sewing Certificate No historical comparison available, so benchmarked to other HFCC programs
Advanced Manufacturing Awareness
Advanced Manufacturing Awareness Certificate
No historical comparison available, so benchmarked to other HFCC programs
The table below shows the number of students enrolled in grant-affected programs for each year of the grant.
Table 32: Henry Ford Enrollment over Time
Year 1 Year 2 Year 3 Year 4
Total Number of Individuals 127 264 483 963
The tables below provide details on the total number of individuals included in the analysis along with demographic characteristics. This information is provided for the college overall, and for each of its grant-affected programs, if appropriate. Additionally, data on outcomes is listed including program completions, credentials earned, credit hours completed, employed after program completion (if available), job retention three quarters after completion, incumbent worker completion, and incumbent worker wage increases (if available). Data is presented in terms of counts and rates where it makes sense.
As described in the section of the report called Efforts to Obtain State Quarterly Earnings Records, efforts to obtain state administrative records on employment and earnings were unsuccessful in Alabama, Michigan, Texas, Illinois, and Tennessee. In states where administrative data was not obtained, colleges attempted to personally contact all participants who had completed a program.

Multi-State Advanced Manufacturing Consortium TAACCCT Round II Grant – FINAL EVALUATION REPORT 60
Table 33: Henry Ford Demographics and Outcomes
Variable Participant
Group
Participant
Group N
Comparison
Group
Comparison
Group N
Total Number of Individuals 1132 1132 2450 2450
Demographics
Age 35.5 ± 13.4 1082 32.1 ± 11.7 2439
Female 212 (20%) 1075 0 (0%) 2145
White 372 (37%) 1007 931 (55%) 1697
Black 593 (59%) 1007 726 (43%) 1697
Other/More than One Race 42 (4%) 1007 40 (2%) 1697
Hispanic/Latino 0 (0%) 895 53 (2%) 2450
Full-Time 534 (79%) 677 NA NA
Part-Time 143 (21%) 677 NA NA
Incumbent Worker 281 (47%) 592 NA 2450
Eligible Veteran 75 (11%) 682 62 (3%) 2450
Disabled 11 (2%) 660 133 (5%) 2450
Pell Eligible 196 (27%) 721 112 (5%) 2450
TAA Eligible 22 (17%) 126 NA NA
Outcomes
Program Completers 558 (49%) 1132 103 (4%) 2450
Credentials Earned 565 1132 149 2450
Students Earning Certificates (<=1 year) 531 (47%) 1132 41 (2%) 2450
Students Earning Certificates (>1 year) 0 (0%) 1132 7 (0%) 2450
Students Earning Degrees 28 (2%) 1132 69 (3%) 2450
Credit Hours Completed 11394 1132 44255 2450
Employed After Program of Study Completion 108 (28%) 391 NA 103
Retained in Employment 3 Quarters After Completion 4 (4%) 108 NA NA
Incumbent Worker Completer 167 (30%) 558 0 (0%) 103
Wage Increase Post-Enrollment 7 (2%) 281 NA NA
Further Education after Program of Study Completion 47 (8%) 558 NA NA
Retained in Grant-Affected Program 491 (43%) 1132 1336 (55%) 2450
Retained in Other Education Program 0 (0%) 1132 0 (0%) 2450
The table below offers details on the key outcome of program completion rates. Completion rates were calculated for individuals pursuing programs of similar duration over similar lengths of time.
Table 34: Henry Ford Completion Rate by Demographics
Variable Completion Rate in
Comparison Group
Completion Rate in
Participant Group
Overall 4% 49%
Gender = Male
Gender = Female
ID 40% 95%
Age < 31
Age >= 31
2% 7%
37% 54%
Non-White
White
4% 5%
65% 14%
Less than college education 0% ID

Multi-State Advanced Manufacturing Consortium TAACCCT Round II Grant – FINAL EVALUATION REPORT 61
Variable Completion Rate in
Comparison Group
Completion Rate in
Participant Group
At least some college education 8%
Full time
Part time
14% 0%
89% 22%
Non-incumbent worker
Incumbent worker
ID ID
Non-veteran
Veteran
4% 8%
ID
Non-disabled
Disabled
4% 3%
46% 55%
Non-Pell grant eligible
Pell grant eligible
4% 1%
ID
Non-TAA eligible
TAA eligible
ID ID
ID: Insufficient Data to give a reliable completion rate (too many missing values in x-variable)
Estimation of Completion Rate Treatment Effect for Henry Ford
The crude, unadjusted odds ratio (the odds of completion in the participant group relative to the odds in the comparison group) is 22.2 (p<0.01). A propensity score model (estimating the probability of being a member of the participant group) is fit using age, race, veteran, disabled, and Pell eligible. The propensity score adjusted odds ratio is 20.6 (p<0.01).
Table 35: Henry Ford Electrical Technology
Variable Participant
Group
Participant
Group N
Comparison
Group
Comparison
Group N
Total Number of Individuals 133 133 557 557
Demographics
Age 27.7 ± 9.1 131 31.0 ± 11.5 551
Female 1 (1%) 128 0 (0%) 507
White 70 (61%) 115 214 (51%) 417
Black 40 (35%) 115 194 (47%) 417
Other/More than One Race 5 (4%) 115 9 (2%) 417
Hispanic/Latino 0 (0%) 133 19 (3%) 557
Full-Time 8 (50%) 16 NA NA
Part-Time 8 (50%) 16 NA NA
Incumbent Worker 4 (57%) 7 0 (0%) 557
Eligible Veteran 9 (7%) 133 20 (4%) 557
Disabled 3 (2%) 133 29 (5%) 557
Pell Eligible 35 (26%) 133 20 (4%) 557
TAA Eligible 0 (0%) 133 0 (0%) 557
Outcomes
Program Completers 2 (2%) 133 33 (6%) 557
Credentials Earned 3 133 43 557
Students Earning Certificates (<=1 year) 1 (1%) 133 5 (1%) 557

Multi-State Advanced Manufacturing Consortium TAACCCT Round II Grant – FINAL EVALUATION REPORT 62
Variable Participant
Group
Participant
Group N
Comparison
Group
Comparison
Group N
Students Earning Certificates (>1 year) 0 (0%) 133 0 (0%) 557
Students Earning Degrees 1 (1%) 133 30 (5%) 557
Credit Hours Completed 2742 133 8958 557
Employed After Program of Study Completion 0 (0%) 2 NA 33
Retained in Employment 3 Quarters After Completion NA 0 NA NA
Incumbent Worker Completer NA 2 NA 33
Wage Increase Post-Enrollment 0 (0%) 4 NA NA
Further Education after Program of Study Completion 0 (0%) 2 NA NA
Retained in Grant-Affected Program 131 (100%) 133 257 (46%) 557
Retained in Other Education Program 0 (0%) 133 0 (%) 557
The table below offers details on the key outcome of program completion rates. Completion rates were calculated for individuals pursuing programs of similar duration over similar lengths of time.
Table 36: Henry Ford Completion Rate by Demographics for Electrical Technology
Variable Completion Rate in
Comparison Group
Completion Rate in
Participant Group
Overall 6% 2%
Gender = Male
Gender = Female
ID 2% 0%
Age < 27
Age >= 27
4% 8%
1% 2%
Non-White
White
4% 9%
2% 1%
Less than college education
At least some college education
ID ID
Full time
Part time
ID ID
Non-incumbent worker
Incumbent worker
ID ID
Non-veteran
Veteran
6% 10%
2% 0%
Non-disabled
Disabled
6% 3%
2% 0%
Non-Pell grant eligible
Pell grant eligible
6% 0%
1% 3%
Non-TAA eligible
TAA eligible
ID ID
ID: Insufficient Data to give a reliable completion rate (too many missing values in x-variable)
Estimation of Completion Rate Treatment Effect for Henry Ford Electrical Technology
The crude, unadjusted odds ratio (the odds of completion in the participant group relative to the odds in the comparison group) is 0.2 (p=0.05). A propensity score model (estimating the probability of being a member of
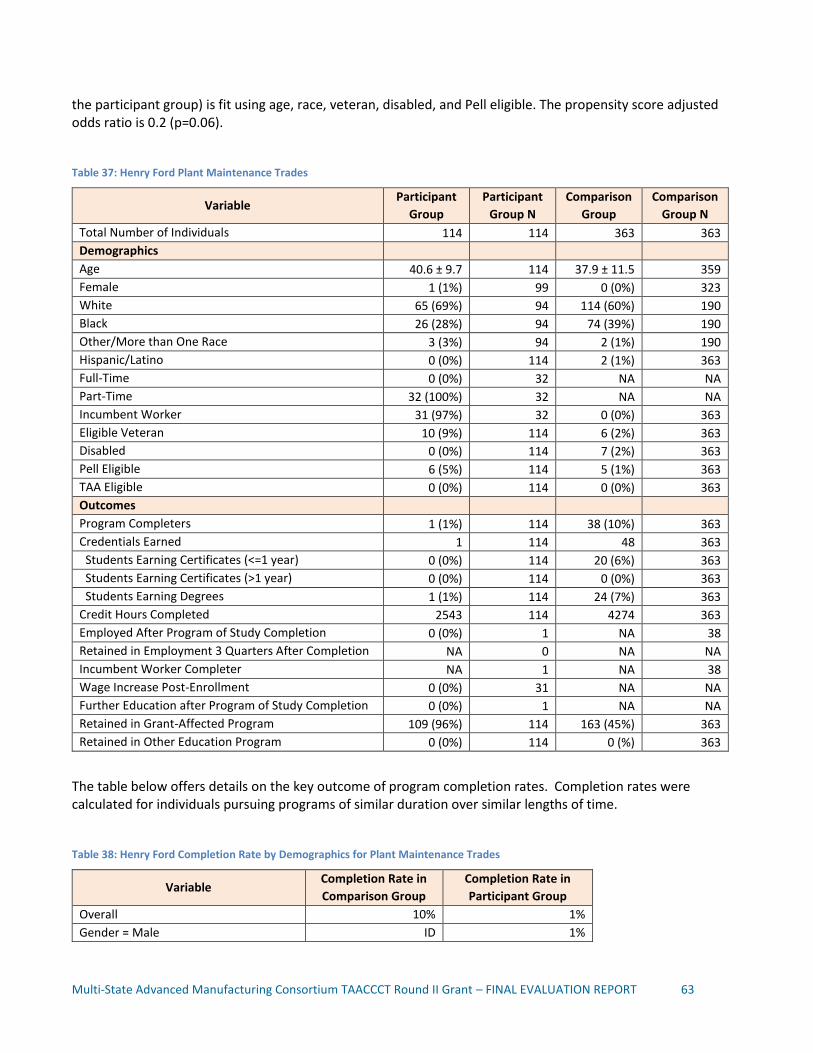
Multi-State Advanced Manufacturing Consortium TAACCCT Round II Grant – FINAL EVALUATION REPORT 63
the participant group) is fit using age, race, veteran, disabled, and Pell eligible. The propensity score adjusted odds ratio is 0.2 (p=0.06).
Table 37: Henry Ford Plant Maintenance Trades
Variable Participant
Group
Participant
Group N
Comparison
Group
Comparison
Group N
Total Number of Individuals 114 114 363 363
Demographics
Age 40.6 ± 9.7 114 37.9 ± 11.5 359
Female 1 (1%) 99 0 (0%) 323
White 65 (69%) 94 114 (60%) 190
Black 26 (28%) 94 74 (39%) 190
Other/More than One Race 3 (3%) 94 2 (1%) 190
Hispanic/Latino 0 (0%) 114 2 (1%) 363
Full-Time 0 (0%) 32 NA NA
Part-Time 32 (100%) 32 NA NA
Incumbent Worker 31 (97%) 32 0 (0%) 363
Eligible Veteran 10 (9%) 114 6 (2%) 363
Disabled 0 (0%) 114 7 (2%) 363
Pell Eligible 6 (5%) 114 5 (1%) 363
TAA Eligible 0 (0%) 114 0 (0%) 363
Outcomes
Program Completers 1 (1%) 114 38 (10%) 363
Credentials Earned 1 114 48 363
Students Earning Certificates (<=1 year) 0 (0%) 114 20 (6%) 363
Students Earning Certificates (>1 year) 0 (0%) 114 0 (0%) 363
Students Earning Degrees 1 (1%) 114 24 (7%) 363
Credit Hours Completed 2543 114 4274 363
Employed After Program of Study Completion 0 (0%) 1 NA 38
Retained in Employment 3 Quarters After Completion NA 0 NA NA
Incumbent Worker Completer NA 1 NA 38
Wage Increase Post-Enrollment 0 (0%) 31 NA NA
Further Education after Program of Study Completion 0 (0%) 1 NA NA
Retained in Grant-Affected Program 109 (96%) 114 163 (45%) 363
Retained in Other Education Program 0 (0%) 114 0 (%) 363
The table below offers details on the key outcome of program completion rates. Completion rates were calculated for individuals pursuing programs of similar duration over similar lengths of time.
Table 38: Henry Ford Completion Rate by Demographics for Plant Maintenance Trades
Variable Completion Rate in
Comparison Group
Completion Rate in
Participant Group
Overall 10% 1%
Gender = Male ID 1%

Multi-State Advanced Manufacturing Consortium TAACCCT Round II Grant – FINAL EVALUATION REPORT 64
Variable Completion Rate in
Comparison Group
Completion Rate in
Participant Group
Gender = Female 0%
Age < 39
Age >= 39
9% 13%
2% 0%
Non-White
White
10% 11%
2% 0%
Less than college education
At least some college education
ID ID
Full time
Part time
ID ID
Non-incumbent worker
Incumbent worker
ID ID
Non-veteran
Veteran
11% 0%
1% 0%
Non-disabled
Disabled
10% 14%
1% NA
Non-Pell grant eligible
Pell grant eligible
10% 20%
1% 0%
Non-TAA eligible
TAA eligible
ID ID
ID: Insufficient Data to give a reliable completion rate (too many missing values in x-variable)
Estimation of Completion Rate Treatment Effect for Henry Ford Plant Maintenance Trades
The crude, unadjusted odds ratio (the odds of completion in the participant group relative to the odds in the comparison group) is 0.1 (p=0.01). A propensity score model (estimating the probability of being a member of the participant group) is fit using age, race, veteran, and Pell eligible. The propensity score adjusted odds ratio is 0.1 (p=0.01).
Table 39: Henry Ford CNC
Variable Participant
Group
Participant
Group N
Comparison
Group
Comparison
Group N
Total Number of Individuals 35 35 105 105
Demographics
Age 31.9 ± 12.8 34 36.5 ± 11.2 105
Female 1 (3%) 34 0 (0%) 93
White 17 (55%) 31 43 (59%) 73
Black 10 (32%) 31 28 (38%) 73
Other/More than One Race 4 (13%) 31 2 (3%) 73
Hispanic/Latino 0 (0%) 35 1 (1%) 105
Full-Time 1 (50%) 2 NA NA
Part-Time 1 (50%) 2 NA NA
Incumbent Worker 1 (50%) 2 0 (0%) 105
Eligible Veteran 6 (17%) 35 2 (2%) 105
Disabled 0 (0%) 35 9 (9%) 105
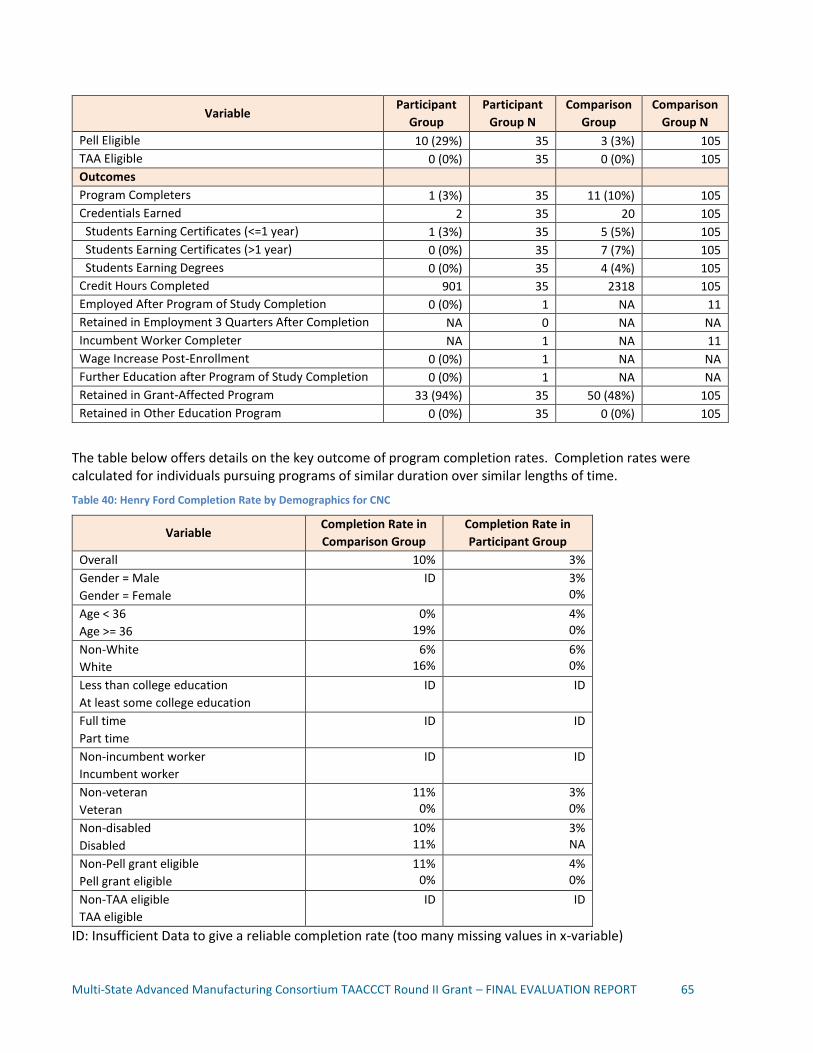
Multi-State Advanced Manufacturing Consortium TAACCCT Round II Grant – FINAL EVALUATION REPORT 65
Variable Participant
Group
Participant
Group N
Comparison
Group
Comparison
Group N
Pell Eligible 10 (29%) 35 3 (3%) 105
TAA Eligible 0 (0%) 35 0 (0%) 105
Outcomes
Program Completers 1 (3%) 35 11 (10%) 105
Credentials Earned 2 35 20 105
Students Earning Certificates (<=1 year) 1 (3%) 35 5 (5%) 105
Students Earning Certificates (>1 year) 0 (0%) 35 7 (7%) 105
Students Earning Degrees 0 (0%) 35 4 (4%) 105
Credit Hours Completed 901 35 2318 105
Employed After Program of Study Completion 0 (0%) 1 NA 11
Retained in Employment 3 Quarters After Completion NA 0 NA NA
Incumbent Worker Completer NA 1 NA 11
Wage Increase Post-Enrollment 0 (0%) 1 NA NA
Further Education after Program of Study Completion 0 (0%) 1 NA NA
Retained in Grant-Affected Program 33 (94%) 35 50 (48%) 105
Retained in Other Education Program 0 (0%) 35 0 (0%) 105
The table below offers details on the key outcome of program completion rates. Completion rates were calculated for individuals pursuing programs of similar duration over similar lengths of time.
Table 40: Henry Ford Completion Rate by Demographics for CNC
Variable Completion Rate in
Comparison Group
Completion Rate in
Participant Group
Overall 10% 3%
Gender = Male
Gender = Female
ID 3% 0%
Age < 36
Age >= 36
0% 19%
4% 0%
Non-White
White
6% 16%
6% 0%
Less than college education
At least some college education
ID ID
Full time
Part time
ID ID
Non-incumbent worker
Incumbent worker
ID ID
Non-veteran
Veteran
11% 0%
3% 0%
Non-disabled
Disabled
10% 11%
3% NA
Non-Pell grant eligible
Pell grant eligible
11% 0%
4% 0%
Non-TAA eligible
TAA eligible
ID ID
ID: Insufficient Data to give a reliable completion rate (too many missing values in x-variable)

Multi-State Advanced Manufacturing Consortium TAACCCT Round II Grant – FINAL EVALUATION REPORT 66
NA: no disabled in participant group
Estimation of Completion Rate Treatment Effect for Henry Ford CNC
The crude, unadjusted odds ratio (the odds of completion in the participant group relative to the odds in the comparison group) is 0.3 (p=0.19). A propensity score model (estimating the probability of being a member of the participant group) is fit using age, race, veteran, and Pell eligible. The propensity score adjusted odds ratio is 0.6 (p=0.59).
Table 41: Henry Ford Manufacturing Trades
Variable Participant
Group
Participant
Group N
Comparison
Group
Comparison
Group N
Total Number of Individuals 91 91 75 75
Demographics
Age 37.9 ± 10.9 90 34.7 ± 9.8 74
Female 0 (0%) 84 0 (0%) 63
White 67 (80%) 84 22 (44%) 50
Black 14 (17%) 84 25 (50%) 50
Other/More than One Race 3 (4%) 84 3 (6%) 50
Hispanic/Latino 0 (0%) 91 2 (3%) 75
Full-Time 9 (47%) 19 NA NA
Part-Time 10 (53%) 19 NA NA
Incumbent Worker 18 (95%) 19 0 (0%) 75
Eligible Veteran 10 (11%) 91 0 (0%) 75
Disabled 0 (0%) 91 2 (3%) 75
Pell Eligible 2 (2%) 91 0 (0%) 75
TAA Eligible 0 (0%) 91 0 (0%) 75
Outcomes
Program Completers 0 (0%) 91 7 (9%) 75
Credentials Earned 0 91 7 75
Students Earning Certificates (<=1 year) 0 (0%) 91 2 (3%) 75
Students Earning Certificates (>1 year) 0 (0%) 91 0 (0%) 75
Students Earning Degrees 0 (0%) 91 5 (7%) 75
Credit Hours Completed 1424 91 802 75
Employed After Program of Study Completion NA 0 NA 7
Retained in Employment 3 Quarters After Completion NA NA NA NA
Incumbent Worker Completer NA 0 NA 7
Wage Increase Post-Enrollment 0 (0%) 18 NA NA
Further Education after Program of Study Completion NA 0 NA NA
Retained in Grant-Affected Program 82 (90%) 91 41 (55%) 75
Retained in Other Education Program 0 (0%) 91 0 (0%) 75

Multi-State Advanced Manufacturing Consortium TAACCCT Round II Grant – FINAL EVALUATION REPORT 67
The table below offers details on the key outcome of program completion rates. Completion rates were calculated for individuals pursuing programs of similar duration over similar lengths of time.
Table 42: Henry Ford Completion Rate by Dfor Manufacturing Trades
Variable Completion Rate in
Comparison Group
Completion Rate in
Participant Group
Overall 9% 0%
Gender = Male
Gender = Female
ID ID
Age < 38
Age >= 38
9% 11%
0% 0%
Non-White
White
4% 23%
0% 0%
Less than college education
At least some college education
ID 0% 0%
Full time
Part time
ID 0% 0%
Non-incumbent worker
Incumbent worker
ID ID
Non-veteran
Veteran
9% NA
0% 0%
Non-disabled
Disabled
10% 0%
0% NA
Non-Pell grant eligible
Pell grant eligible
9% NA
0% 0%
Non-TAA eligible
TAA eligible
ID ID
ID: Insufficient Data to give a reliable completion rate (too many missing values in x-variable)
NA: no veterans or Pell-eligible in the comparison group and no disabled in the participant group
Estimation of Completion Rate Treatment Effect for Henry Ford Manufacturing Trades
The crude, unadjusted odds ratio (the odds of completion in the participant group relative to the odds in the comparison group) is not calculable because the completion rate in the participant group is 0%. Similarly, a propensity score model to estimate an adjusted odds ratio is not calculable.
Table 43: Henry Ford Process Technology
Variable Participant
Group
Participant
Group N
Comparison
Group
Comparison
Group N
Total Number of Individuals 25 25 31 31
Demographics
Age 35.3 ± 10.5 25 38.9 ± 10.0 31
Female 1 (5%) 22 0 (0%) 26
White 7 (35%) 20 5 (23%) 22
Black 13 (65%) 20 17 (77%) 22
Other/More than One Race 0 (0%) 20 0 (0%) 22

Multi-State Advanced Manufacturing Consortium TAACCCT Round II Grant – FINAL EVALUATION REPORT 68
Variable Participant
Group
Participant
Group N
Comparison
Group
Comparison
Group N
Hispanic/Latino 0 (0%) 25 0 (0%) 31
Full-Time 4 (33%) 12 NA NA
Part-Time 8 (67%) 12 NA NA
Incumbent Worker 2 (8%) 25 0 (0%) 31
Eligible Veteran 0 (0%) 25 1 (3%) 31
Disabled 0 (0%) 25 0 (0%) 31
Pell Eligible 9 (36%) 25 2 (6%) 31
TAA Eligible 0 (0%) 25 0 (0%) 31
Outcomes
Program Completers 3 (12%) 25 1 (3%) 31
Credentials Earned 3 25 1 31
Students Earning Certificates (<=1 year) 0 (0%) 25 0 (0%) 31
Students Earning Certificates (>1 year) 0 (0%) 25 0 (0%) 31
Students Earning Degrees 3 (12%) 25 1 (3%) 31
Credit Hours Completed 466 25 768 31
Employed After Program of Study Completion 0 (0%) 3 NA 1
Retained in Employment 3 Quarters After Completion NA 0 NA NA
Incumbent Worker Completer NA 3 NA 1
Wage Increase Post-Enrollment 0 (0%) 2 NA NA
Further Education after Program of Study Completion 0 (0%) 3 NA NA
Retained in Grant-Affected Program 13 (52%) 25 26 (84%) 31
Retained in Other Education Program 0 (0%) 25 0 (0%) 31
The table below offers details on the key outcome of program completion rates. Completion rates were calculated for individuals pursuing programs of similar duration over similar lengths of time.
Table 44: Henry Ford Completion Rate by Demographics for Process Technology
Variable Completion Rate in
Comparison Group
Completion Rate in
Participant Group
Overall 3% 0%
Gender = Male
Gender = Female
ID 0% 0%
Age < 38
Age >= 38
8% 0%
0% 0%
Non-White
White
4% 0%
0% 0%
Less than college education
At least some college education
ID 0% 0%
Full time
Part time
ID 0% 0%
Non-incumbent worker
Incumbent worker
ID ID
Non-veteran
Veteran
3% 0%
0% NA
Non-disabled 3% 0%
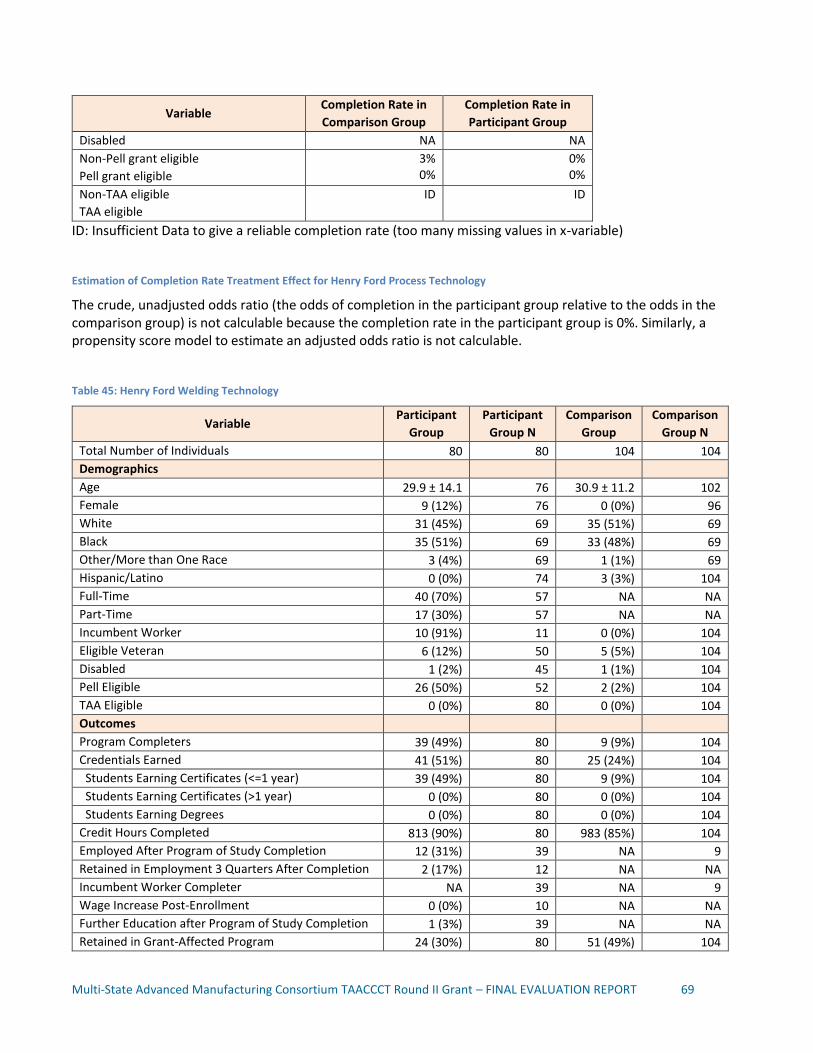
Multi-State Advanced Manufacturing Consortium TAACCCT Round II Grant – FINAL EVALUATION REPORT 69
Variable Completion Rate in
Comparison Group
Completion Rate in
Participant Group
Disabled NA NA
Non-Pell grant eligible
Pell grant eligible
3% 0%
0% 0%
Non-TAA eligible
TAA eligible
ID ID
ID: Insufficient Data to give a reliable completion rate (too many missing values in x-variable)
Estimation of Completion Rate Treatment Effect for Henry Ford Process Technology
The crude, unadjusted odds ratio (the odds of completion in the participant group relative to the odds in the comparison group) is not calculable because the completion rate in the participant group is 0%. Similarly, a propensity score model to estimate an adjusted odds ratio is not calculable.
Table 45: Henry Ford Welding Technology
Variable Participant
Group
Participant
Group N
Comparison
Group
Comparison
Group N
Total Number of Individuals 80 80 104 104
Demographics
Age 29.9 ± 14.1 76 30.9 ± 11.2 102
Female 9 (12%) 76 0 (0%) 96
White 31 (45%) 69 35 (51%) 69
Black 35 (51%) 69 33 (48%) 69
Other/More than One Race 3 (4%) 69 1 (1%) 69
Hispanic/Latino 0 (0%) 74 3 (3%) 104
Full-Time 40 (70%) 57 NA NA
Part-Time 17 (30%) 57 NA NA
Incumbent Worker 10 (91%) 11 0 (0%) 104
Eligible Veteran 6 (12%) 50 5 (5%) 104
Disabled 1 (2%) 45 1 (1%) 104
Pell Eligible 26 (50%) 52 2 (2%) 104
TAA Eligible 0 (0%) 80 0 (0%) 104
Outcomes
Program Completers 39 (49%) 80 9 (9%) 104
Credentials Earned 41 (51%) 80 25 (24%) 104
Students Earning Certificates (<=1 year) 39 (49%) 80 9 (9%) 104
Students Earning Certificates (>1 year) 0 (0%) 80 0 (0%) 104
Students Earning Degrees 0 (0%) 80 0 (0%) 104
Credit Hours Completed 813 (90%) 80 983 (85%) 104
Employed After Program of Study Completion 12 (31%) 39 NA 9
Retained in Employment 3 Quarters After Completion 2 (17%) 12 NA NA
Incumbent Worker Completer NA 39 NA 9
Wage Increase Post-Enrollment 0 (0%) 10 NA NA
Further Education after Program of Study Completion 1 (3%) 39 NA NA
Retained in Grant-Affected Program 24 (30%) 80 51 (49%) 104

Multi-State Advanced Manufacturing Consortium TAACCCT Round II Grant – FINAL EVALUATION REPORT 70
Variable Participant
Group
Participant
Group N
Comparison
Group
Comparison
Group N
Retained in Other Education Program 0 (0%) 80 0 (0%) 104
The table below offers details on the key outcome of program completion rates. Completion rates were calculated for individuals pursuing programs of similar duration over similar lengths of time.
Table 46: Henry Ford Completion Rate by Demographics for Welding Technology
Variable Completion Rate in
Comparison Group
Completion Rate in
Participant Group
Overall 9% 49%
Gender = Male
Gender = Female
7% 25%
45% 89%
Age < 26
Age >= 26
10% 7%
28% 67%
Non-White
White
12% 3%
ID
Less than college education
At least some college education
ID ID
Full time
Part time
ID 90%
18%
Non-incumbent worker
Incumbent worker
ID ID
Non-veteran
Veteran
7% 40%
9% 83%
Non-disabled
Disabled
9% 0%
ID
Non-Pell grant eligible
Pell grant eligible
9% 0%
ID
Non-TAA eligible
TAA eligible
ID ID
ID: Insufficient Data to give a reliable completion rate (too many missing values in x-variable)
Estimation of Completion Rate Treatment Effect for Henry Ford Welding Technology
The crude, unadjusted odds ratio (the odds of completion in the participant group relative to the odds in the comparison group) is 10.0 (p<0.01). A propensity score model (estimating the probability of being a member of the participant group) is fit using age, race, veteran, disabled, and Pell eligible. The propensity score adjusted odds ratio is 14.5 (p<0.01).
Table 47: Henry Ford Multi-Skilled Facility Maintenance Technology
Variable Participant
Group
Participant
Group N
Comparison
Group
Comparison
Group N
Total Number of Individuals 54 54 48 48
Demographics
Age 28.0 ± 10.5 54 34.7 ± 9.4 48

Multi-State Advanced Manufacturing Consortium TAACCCT Round II Grant – FINAL EVALUATION REPORT 71
Variable Participant
Group
Participant
Group N
Comparison
Group
Comparison
Group N
Female 0 (0%) 52 0 (0%) 43
White 30 (75%) 40 18 (51%) 35
Black 6 (15%) 40 17 (49%) 35
Other/More than One Race 4 (10%) 40 0 (0%) 35
Hispanic/Latino 0 (0%) 54 0 (0%) 48
Full-Time 15 (75%) 20 NA NA
Part-Time 5 (25%) 20 NA NA
Incumbent Worker 18 (33%) 54 0 (0%) 48
Eligible Veteran 5 (9%) 54 2 (4%) 48
Disabled 0 (0%) 54 4 (8%) 48
Pell Eligible 11 (20%) 54 2 (4%) 48
TAA Eligible 0 (0%) 54 0 (0%) 48
Outcomes
Program Completers 2 (4%) 54 5 (10%) 48
Credentials Earned 3 (6%) 54 5 (10%) 48
Students Earning Certificates (<=1 year) 0 (0%) 54 0 (0%) 48
Students Earning Certificates (>1 year) 0 (0%) 54 0 (0%) 48
Students Earning Degrees 2 (4%) 54 5 (10%) 48
Credit Hours Completed 1342 (95%) 54 1296 (93%) 48
Employed After Program of Study Completion 0 (0%) 2 NA 5
Retained in Employment 3 Quarters After Completion NA 0 NA NA
Incumbent Worker Completer NA 2 NA 5
Wage Increase Post-Enrollment 0 (0%) 18 NA NA
Further Education after Program of Study Completion 0 (0%) 2 NA NA
Retained in Grant-Affected Program 42 (78%) 54 0 (0%) 48
Retained in Other Education Program 0 (0%) 54 0 (0%) 48
The table below offers details on the key outcome of program completion rates. Completion rates were calculated for individuals pursuing programs of similar duration over similar lengths of time.
Table 48: Henry Ford Completion Rate by Demographics for Multi-Skilled Facility Maintenance Technology
Variable Completion Rate in
Comparison Group
Completion Rate in
Participant Group
Overall 10% 4%
Gender = Male
Gender = Female
ID 4% NA
Age < 31
Age >= 31
8% 1%
3% 6%
Non-White
White
10% 11%
8% 0%
Less than college education
At least some college education
ID 0% 8%
Full time
Part time
ID 0% 20%
Non-incumbent worker ID ID

Multi-State Advanced Manufacturing Consortium TAACCCT Round II Grant – FINAL EVALUATION REPORT 72
Variable Completion Rate in
Comparison Group
Completion Rate in
Participant Group
Incumbent worker
Non-veteran
Veteran
9% 50%
4% 0%
Non-disabled
Disabled
9% 25%
4% NA
Non-Pell grant eligible
Pell grant eligible
11% 0%
5% 0%
Non-TAA eligible
TAA eligible
ID ID
ID: Insufficient Data to give a reliable completion rate (too many missing values in x-variable)
NA: no disabled in participant group
Estimation of Completion Rate Treatment Effect for Henry Ford Multi-Skilled Facility Maintenance Technology
The crude, unadjusted odds ratio (the odds of completion in the participant group relative to the odds in the comparison group) is 0.3 (p=0.20). A propensity score model (estimating the probability of being a member of the participant group) is fit using age, race, veteran, and Pell eligible. The propensity score adjusted odds ratio is 0.4 (p=0.35).
Table 49: Henry Ford Industrial Sewing
Variable Participant
Group
Participant
Group N
Total Number of Individuals 44 44
Demographics
Age 40.5 ± 14.2 41
Female 29 (83%) 35
White 11 (37%) 30
Black 15 (50%) 30
Other/More than One Race 4 (13%) 30
Hispanic/Latino 0 (0%) 15
Full-Time 33 (89%) 37
Part-Time 4 (11%) 37
Incumbent Worker 13 (81%) 16
Eligible Veteran 1 (2%) 44
Disabled 2 (5%) 44
Pell Eligible 2 (5%) 44
TAA Eligible 0 (0%) 44
Outcomes
Program Completers 37 (84%) 44
Credentials Earned 38 (86%) 44
Students Earning Certificates (<=1 year) 37 (84%) 44
Students Earning Certificates (>1 year) 0 (0%) 44
Students Earning Degrees 0 (0%) 44
Credit Hours Completed 0 (0%) 44

Multi-State Advanced Manufacturing Consortium TAACCCT Round II Grant – FINAL EVALUATION REPORT 73
Variable Participant
Group
Participant
Group N
Employed After Program of Study Completion 7 (19%) 37
Retained in Employment 3 Quarters After Completion 0 (0%) 7
Incumbent Worker Completer NA 37
Wage Increase Post-Enrollment 0 (0%) 13
Further Education after Program of Study Completion 0 (0%) 37
Retained in Grant-Affected Program 7 (16%) 44
Retained in Other Education Program 0 (0%) 44
Table 50: Henry Ford Advanced Manufacturing Awareness
Variable Participant
Group
Participant
Group N
Total Number of Individuals 453 453
Demographics
Age 38.9 ± 13.8 419
Female 163 (37%) 445
White 21 (5%) 443
Black 414 (93%) 443
Other/More than One Race 8 (2%) 443
Hispanic/Latino 0 (0%) 252
Full-Time 397 (100%) 397
Part-Time 0 (0%) 397
Incumbent Worker 158 (35%) 453
Eligible Veteran 23 (30%) 76
Disabled 4 (7%) 58
Pell Eligible 70 (62%) 112
TAA Eligible 22 (29%) 75
Outcomes
Program Completers 453 (100%) 453
Credentials Earned 453 (100%) 453
Students Earning Certificates (<=1 year) 453 (100%) 453
Students Earning Certificates (>1 year) 0 (0%) 453
Students Earning Degrees 0 (0%) 453
Credit Hours Completed 0 (0%) 453
Employed After Program of Study Completion 87 (19%) 453
Retained in Employment 3 Quarters After Completion 2 (2%) 87
Incumbent Worker Completer NA 453
Wage Increase Post-Enrollment 7 (4%) 158
Further Education after Program of Study Completion 1 (0%) 453
Retained in Grant-Affected Program 0 (0%) 453
Retained in Other Education Program 0 (0%) 453
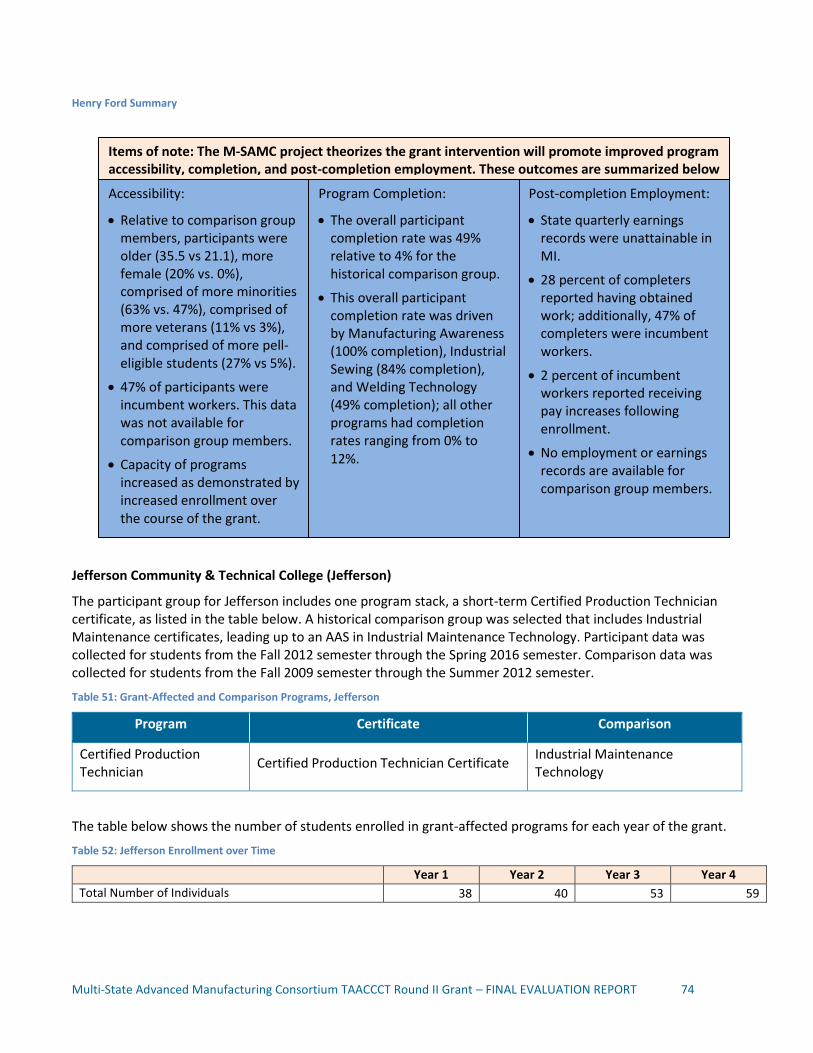
Multi-State Advanced Manufacturing Consortium TAACCCT Round II Grant – FINAL EVALUATION REPORT 74
Henry Ford Summary
Jefferson Community & Technical College (Jefferson)
The participant group for Jefferson includes one program stack, a short-term Certified Production Technician certificate, as listed in the table below. A historical comparison group was selected that includes Industrial Maintenance certificates, leading up to an AAS in Industrial Maintenance Technology. Participant data was collected for students from the Fall 2012 semester through the Spring 2016 semester. Comparison data was collected for students from the Fall 2009 semester through the Summer 2012 semester.
Table 51: Grant-Affected and Comparison Programs, Jefferson
Program Certificate Comparison
Certified Production Technician
Certified Production Technician Certificate Industrial Maintenance Technology
The table below shows the number of students enrolled in grant-affected programs for each year of the grant.
Table 52: Jefferson Enrollment over Time
Year 1 Year 2 Year 3 Year 4
Total Number of Individuals 38 40 53 59
Items of note: The M-SAMC project theorizes the grant intervention will promote improved program accessibility, completion, and post-completion employment. These outcomes are summarized below
Accessibility:
Relative to comparison group members, participants were older (35.5 vs 21.1), more female (20% vs. 0%), comprised of more minorities (63% vs. 47%), comprised of more veterans (11% vs 3%), and comprised of more pell-eligible students (27% vs 5%).
47% of participants were incumbent workers. This data was not available for comparison group members.
Capacity of programs increased as demonstrated by increased enrollment over the course of the grant.
Program Completion:
The overall participant completion rate was 49% relative to 4% for the historical comparison group.
This overall participant completion rate was driven by Manufacturing Awareness (100% completion), Industrial Sewing (84% completion), and Welding Technology (49% completion); all other programs had completion rates ranging from 0% to 12%.
Post-completion Employment:
State quarterly earnings records were unattainable in MI.
28 percent of completers reported having obtained work; additionally, 47% of completers were incumbent workers.
2 percent of incumbent workers reported receiving pay increases following enrollment.
No employment or earnings records are available for comparison group members.
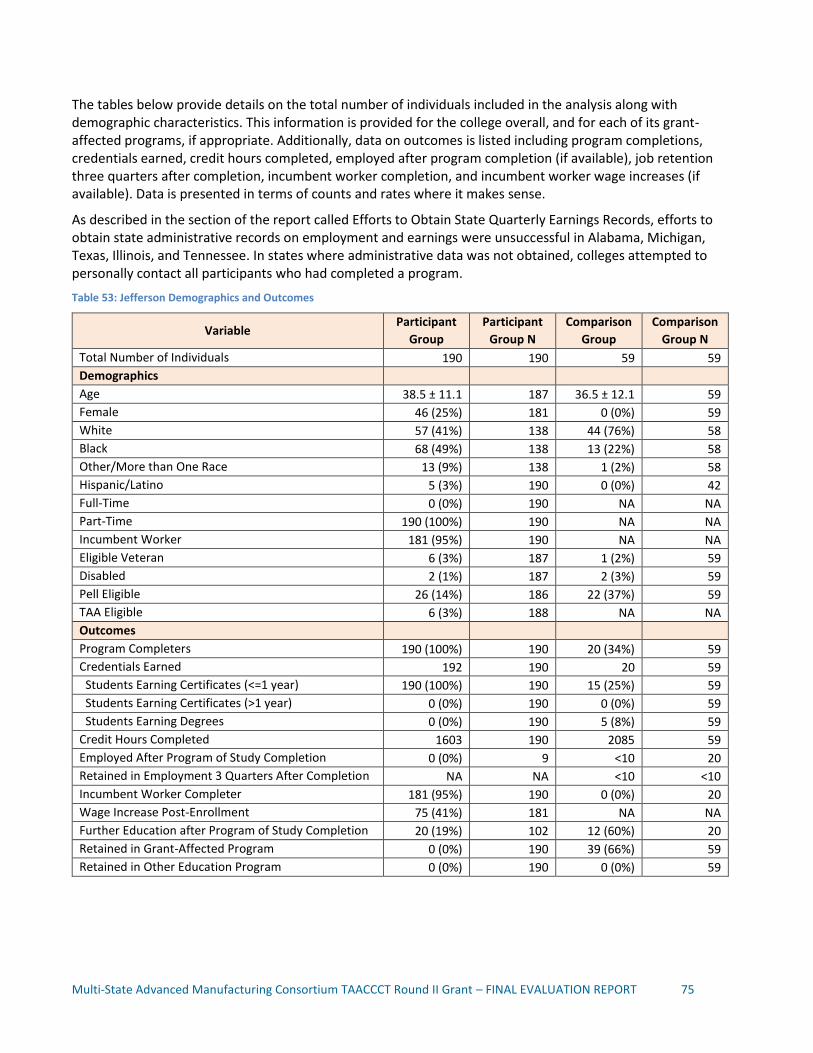
Multi-State Advanced Manufacturing Consortium TAACCCT Round II Grant – FINAL EVALUATION REPORT 75
The tables below provide details on the total number of individuals included in the analysis along with demographic characteristics. This information is provided for the college overall, and for each of its grant-affected programs, if appropriate. Additionally, data on outcomes is listed including program completions, credentials earned, credit hours completed, employed after program completion (if available), job retention three quarters after completion, incumbent worker completion, and incumbent worker wage increases (if available). Data is presented in terms of counts and rates where it makes sense.
As described in the section of the report called Efforts to Obtain State Quarterly Earnings Records, efforts to obtain state administrative records on employment and earnings were unsuccessful in Alabama, Michigan, Texas, Illinois, and Tennessee. In states where administrative data was not obtained, colleges attempted to personally contact all participants who had completed a program.
Table 53: Jefferson Demographics and Outcomes
Variable Participant
Group
Participant
Group N
Comparison
Group
Comparison
Group N
Total Number of Individuals 190 190 59 59
Demographics
Age 38.5 ± 11.1 187 36.5 ± 12.1 59
Female 46 (25%) 181 0 (0%) 59
White 57 (41%) 138 44 (76%) 58
Black 68 (49%) 138 13 (22%) 58
Other/More than One Race 13 (9%) 138 1 (2%) 58
Hispanic/Latino 5 (3%) 190 0 (0%) 42
Full-Time 0 (0%) 190 NA NA
Part-Time 190 (100%) 190 NA NA
Incumbent Worker 181 (95%) 190 NA NA
Eligible Veteran 6 (3%) 187 1 (2%) 59
Disabled 2 (1%) 187 2 (3%) 59
Pell Eligible 26 (14%) 186 22 (37%) 59
TAA Eligible 6 (3%) 188 NA NA
Outcomes
Program Completers 190 (100%) 190 20 (34%) 59
Credentials Earned 192 190 20 59
Students Earning Certificates (<=1 year) 190 (100%) 190 15 (25%) 59
Students Earning Certificates (>1 year) 0 (0%) 190 0 (0%) 59
Students Earning Degrees 0 (0%) 190 5 (8%) 59
Credit Hours Completed 1603 190 2085 59
Employed After Program of Study Completion 0 (0%) 9 <10 20
Retained in Employment 3 Quarters After Completion NA NA <10 <10
Incumbent Worker Completer 181 (95%) 190 0 (0%) 20
Wage Increase Post-Enrollment 75 (41%) 181 NA NA
Further Education after Program of Study Completion 20 (19%) 102 12 (60%) 20
Retained in Grant-Affected Program 0 (0%) 190 39 (66%) 59
Retained in Other Education Program 0 (0%) 190 0 (0%) 59

Multi-State Advanced Manufacturing Consortium TAACCCT Round II Grant – FINAL EVALUATION REPORT 76
The table below offers details on the key outcome of program completion rates. Completion rates were calculated for individuals pursuing programs of similar duration over similar lengths of time.
Table 54: Jefferson Completion Rate by Demographics
Variable Completion Rate in
Comparison Group
Completion Rate in
Participant Group
Overall 34% 100%
Gender = Male
Gender = Female
34% NA
100% 100%
Age < 38
Age >= 38
24% 43%
100% 100%
Non-White
White
0% 45%
100% 100%
Less than college education
At least some college education
ID 100% 100%
Full time
Part time
ID 100% 100%
Non-incumbent worker
Incumbent worker
ID 100% NA
Non-veteran
Veteran
33% 100%
100% 100%
Non-disabled
Disabled
33% 50%
100% 100%
Non-Pell grant eligible
Pell grant eligible
38% 27%
100% 100%
Non-TAA eligible
TAA eligible
ID 100% 100%
ID: Insufficient Data to give a reliable completion rate (too many missing values in x-variable)
NA: no females in the comparison group and no incumbent workers in the participant group
Estimation of Completion Rate Treatment Effect for Jefferson
The crude, unadjusted odds ratio (the odds of completion in the participant group relative to the odds in the comparison group) is not calculable because the completion rate in the participant group is 100%. Similarly, a propensity score model to estimate an adjusted odds ratio is not calculable.
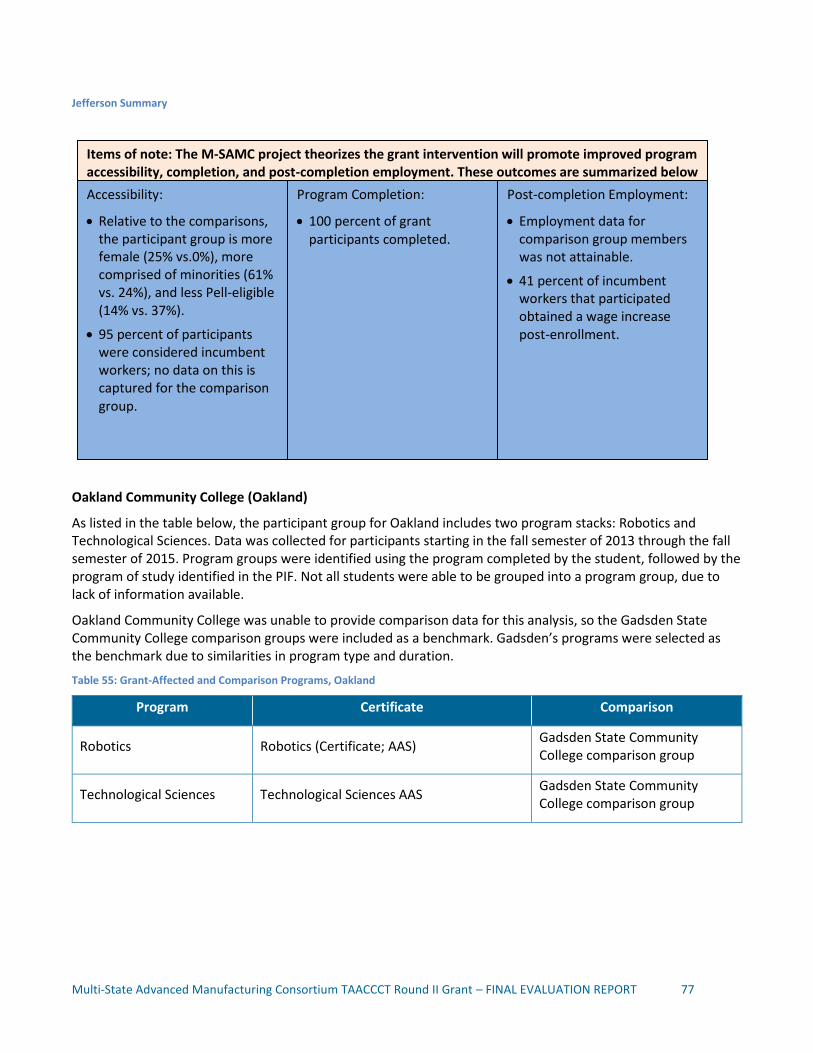
Multi-State Advanced Manufacturing Consortium TAACCCT Round II Grant – FINAL EVALUATION REPORT 77
Jefferson Summary
Oakland Community College (Oakland)
As listed in the table below, the participant group for Oakland includes two program stacks: Robotics and Technological Sciences. Data was collected for participants starting in the fall semester of 2013 through the fall semester of 2015. Program groups were identified using the program completed by the student, followed by the program of study identified in the PIF. Not all students were able to be grouped into a program group, due to lack of information available.
Oakland Community College was unable to provide comparison data for this analysis, so the Gadsden State Community College comparison groups were included as a benchmark. Gadsden’s programs were selected as the benchmark due to similarities in program type and duration.
Table 55: Grant-Affected and Comparison Programs, Oakland
Program Certificate Comparison
Robotics Robotics (Certificate; AAS) Gadsden State Community College comparison group
Technological Sciences Technological Sciences AAS Gadsden State Community College comparison group
Items of note: The M-SAMC project theorizes the grant intervention will promote improved program accessibility, completion, and post-completion employment. These outcomes are summarized below
Accessibility:
Relative to the comparisons, the participant group is more female (25% vs.0%), more comprised of minorities (61% vs. 24%), and less Pell-eligible (14% vs. 37%).
95 percent of participants were considered incumbent workers; no data on this is captured for the comparison group.
Program Completion:
100 percent of grant participants completed.
Post-completion Employment:
Employment data for comparison group members was not attainable.
41 percent of incumbent workers that participated obtained a wage increase post-enrollment.
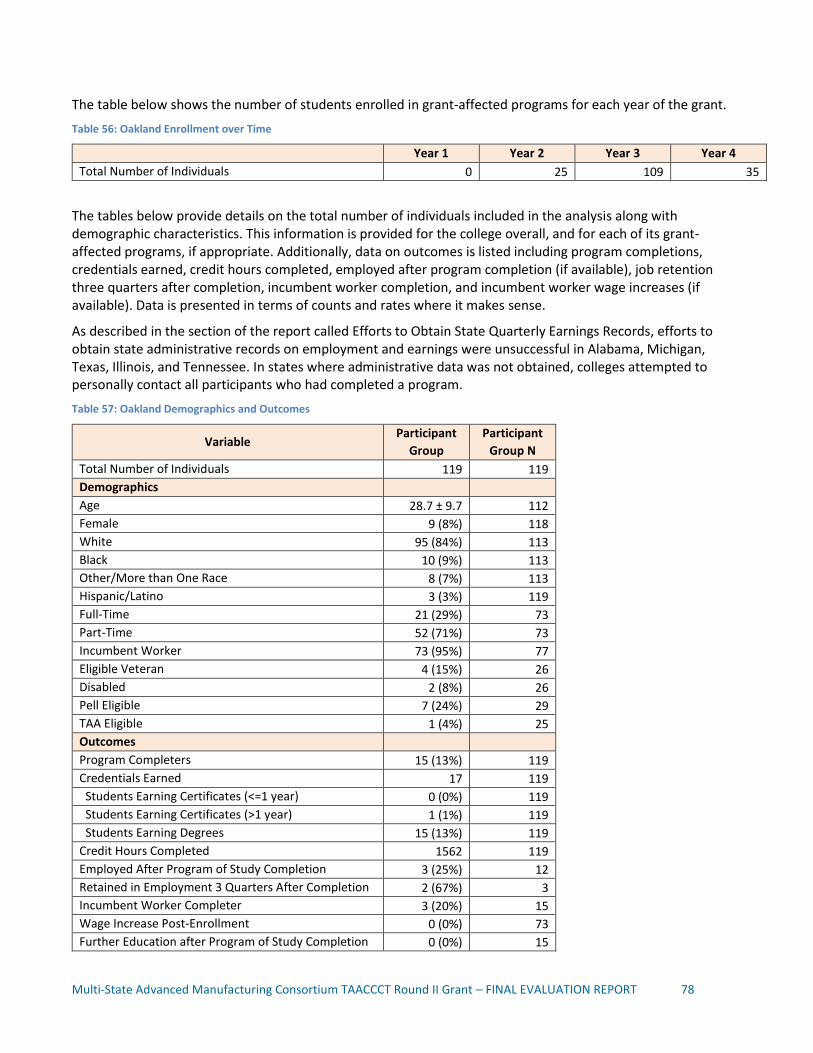
Multi-State Advanced Manufacturing Consortium TAACCCT Round II Grant – FINAL EVALUATION REPORT 78
The table below shows the number of students enrolled in grant-affected programs for each year of the grant.
Table 56: Oakland Enrollment over Time
Year 1 Year 2 Year 3 Year 4
Total Number of Individuals 0 25 109 35
The tables below provide details on the total number of individuals included in the analysis along with demographic characteristics. This information is provided for the college overall, and for each of its grant-affected programs, if appropriate. Additionally, data on outcomes is listed including program completions, credentials earned, credit hours completed, employed after program completion (if available), job retention three quarters after completion, incumbent worker completion, and incumbent worker wage increases (if available). Data is presented in terms of counts and rates where it makes sense.
As described in the section of the report called Efforts to Obtain State Quarterly Earnings Records, efforts to obtain state administrative records on employment and earnings were unsuccessful in Alabama, Michigan, Texas, Illinois, and Tennessee. In states where administrative data was not obtained, colleges attempted to personally contact all participants who had completed a program.
Table 57: Oakland Demographics and Outcomes
Variable Participant
Group
Participant
Group N
Total Number of Individuals 119 119
Demographics
Age 28.7 ± 9.7 112
Female 9 (8%) 118
White 95 (84%) 113
Black 10 (9%) 113
Other/More than One Race 8 (7%) 113
Hispanic/Latino 3 (3%) 119
Full-Time 21 (29%) 73
Part-Time 52 (71%) 73
Incumbent Worker 73 (95%) 77
Eligible Veteran 4 (15%) 26
Disabled 2 (8%) 26
Pell Eligible 7 (24%) 29
TAA Eligible 1 (4%) 25
Outcomes
Program Completers 15 (13%) 119
Credentials Earned 17 119
Students Earning Certificates (<=1 year) 0 (0%) 119
Students Earning Certificates (>1 year) 1 (1%) 119
Students Earning Degrees 15 (13%) 119
Credit Hours Completed 1562 119
Employed After Program of Study Completion 3 (25%) 12
Retained in Employment 3 Quarters After Completion 2 (67%) 3
Incumbent Worker Completer 3 (20%) 15
Wage Increase Post-Enrollment 0 (0%) 73
Further Education after Program of Study Completion 0 (0%) 15

Multi-State Advanced Manufacturing Consortium TAACCCT Round II Grant – FINAL EVALUATION REPORT 79
Variable Participant
Group
Participant
Group N
Retained in Grant-Affected Program 24 (20%) 119
Retained in Other Education Program 0 (0%) 119
The table below offers details on the key outcome of program completion rates. Completion rates were calculated for individuals pursuing programs of similar duration over similar lengths of time.
Table 58: Oakland Completion Rate by Demographics
Variable Completion Rate in
Comparison Group
Completion Rate in
Participant Group
Overall 10% 13%
Gender = Male
Gender = Female
10% 20%
13% 11%
Age < 24
Age >= 24
11% 10%
17% 9%
Non-White
White
8% 11%
0% 15%
Non-incumbent worker
Incumbent worker
ID ID
Non-veteran
Veteran
10% 15%
ID
Non-disabled
Disabled
ID ID
Non-Pell grant eligible
Pell grant eligible
12% 6%
ID
Non-TAA eligible
TAA eligible
10% 15%
ID
ID: Insufficient Data to give a reliable completion rate (too many missing values in x-variable)
Estimation of Completion Rate Treatment Effect for Oakland
The crude, unadjusted odds ratio (the odds of completion in the participant group relative to the odds in the comparison group) is 1.2 (p=0.49). A propensity score model (estimating the probability of being a member of the participant group) is fit using gender, age, race, veteran, and Pell eligible. The propensity score adjusted odds ratio is 1.2 (p=0.53).
Table 59: Oakland Robotics
Variable Participant
Group
Participant
Group N
Total Number of Individuals 23 23
Demographics
Age 31.1 ± 10.6 22
Female 1 (4%) 23
White 20 (87%) 23
Black 2 (9%) 23
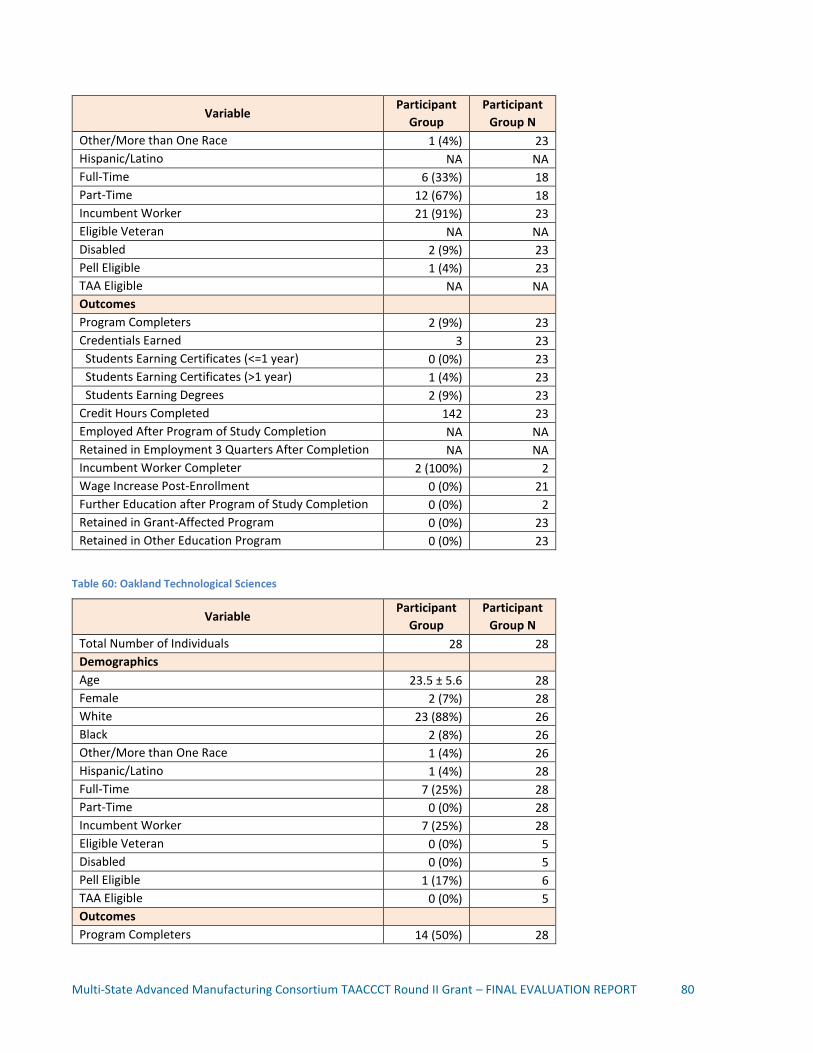
Multi-State Advanced Manufacturing Consortium TAACCCT Round II Grant – FINAL EVALUATION REPORT 80
Variable Participant
Group
Participant
Group N
Other/More than One Race 1 (4%) 23
Hispanic/Latino NA NA
Full-Time 6 (33%) 18
Part-Time 12 (67%) 18
Incumbent Worker 21 (91%) 23
Eligible Veteran NA NA
Disabled 2 (9%) 23
Pell Eligible 1 (4%) 23
TAA Eligible NA NA
Outcomes
Program Completers 2 (9%) 23
Credentials Earned 3 23
Students Earning Certificates (<=1 year) 0 (0%) 23
Students Earning Certificates (>1 year) 1 (4%) 23
Students Earning Degrees 2 (9%) 23
Credit Hours Completed 142 23
Employed After Program of Study Completion NA NA
Retained in Employment 3 Quarters After Completion NA NA
Incumbent Worker Completer 2 (100%) 2
Wage Increase Post-Enrollment 0 (0%) 21
Further Education after Program of Study Completion 0 (0%) 2
Retained in Grant-Affected Program 0 (0%) 23
Retained in Other Education Program 0 (0%) 23
Table 60: Oakland Technological Sciences
Variable Participant
Group
Participant
Group N
Total Number of Individuals 28 28
Demographics
Age 23.5 ± 5.6 28
Female 2 (7%) 28
White 23 (88%) 26
Black 2 (8%) 26
Other/More than One Race 1 (4%) 26
Hispanic/Latino 1 (4%) 28
Full-Time 7 (25%) 28
Part-Time 0 (0%) 28
Incumbent Worker 7 (25%) 28
Eligible Veteran 0 (0%) 5
Disabled 0 (0%) 5
Pell Eligible 1 (17%) 6
TAA Eligible 0 (0%) 5
Outcomes
Program Completers 14 (50%) 28
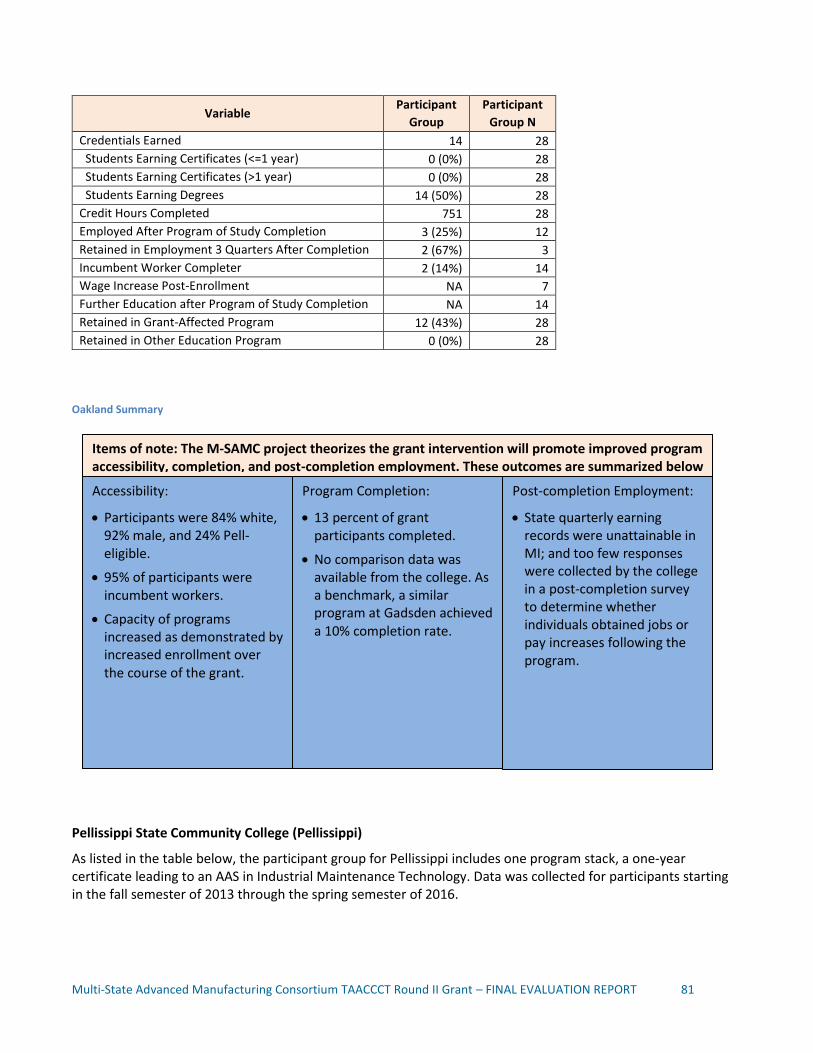
Multi-State Advanced Manufacturing Consortium TAACCCT Round II Grant – FINAL EVALUATION REPORT 81
Variable Participant
Group
Participant
Group N
Credentials Earned 14 28
Students Earning Certificates (<=1 year) 0 (0%) 28
Students Earning Certificates (>1 year) 0 (0%) 28
Students Earning Degrees 14 (50%) 28
Credit Hours Completed 751 28
Employed After Program of Study Completion 3 (25%) 12
Retained in Employment 3 Quarters After Completion 2 (67%) 3
Incumbent Worker Completer 2 (14%) 14
Wage Increase Post-Enrollment NA 7
Further Education after Program of Study Completion NA 14
Retained in Grant-Affected Program 12 (43%) 28
Retained in Other Education Program 0 (0%) 28
Oakland Summary
Pellissippi State Community College (Pellissippi)
As listed in the table below, the participant group for Pellissippi includes one program stack, a one-year certificate leading to an AAS in Industrial Maintenance Technology. Data was collected for participants starting in the fall semester of 2013 through the spring semester of 2016.
Items of note: The M-SAMC project theorizes the grant intervention will promote improved program accessibility, completion, and post-completion employment. These outcomes are summarized below
Accessibility:
Participants were 84% white, 92% male, and 24% Pell-eligible.
95% of participants were incumbent workers.
Capacity of programs increased as demonstrated by increased enrollment over the course of the grant.
Program Completion:
13 percent of grant participants completed.
No comparison data was available from the college. As a benchmark, a similar program at Gadsden achieved a 10% completion rate.
Post-completion Employment:
State quarterly earning records were unattainable in MI; and too few responses were collected by the college in a post-completion survey to determine whether individuals obtained jobs or pay increases following the program.
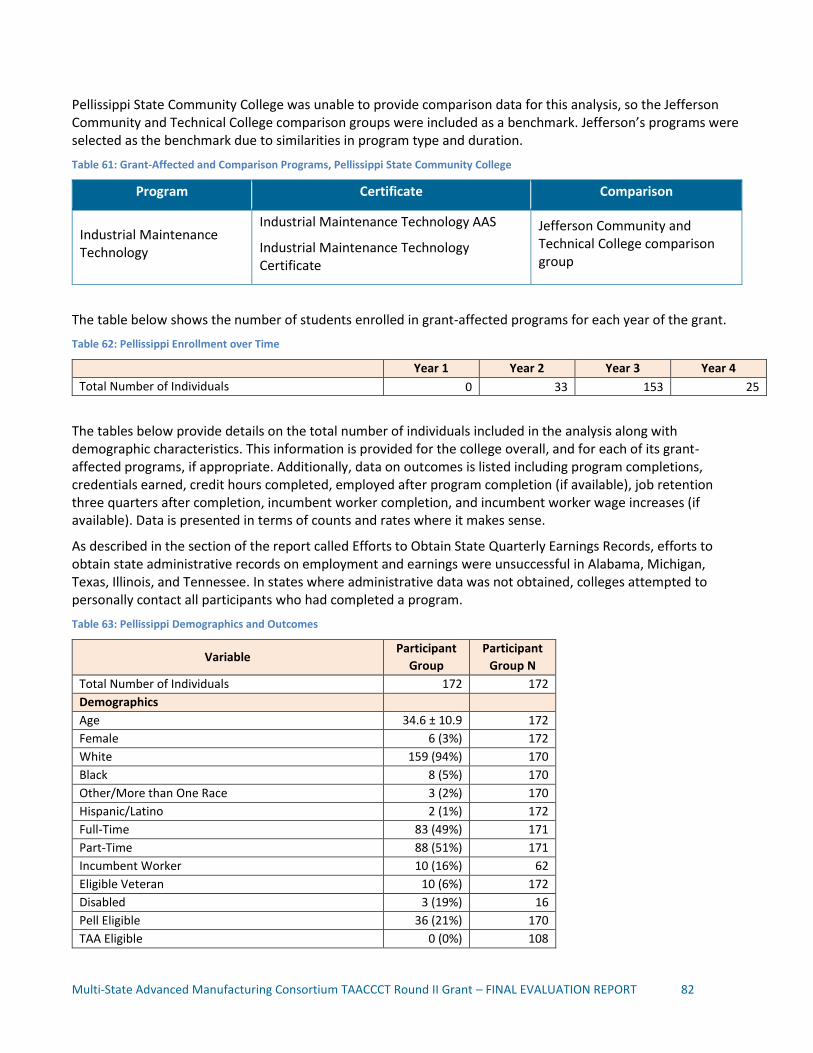
Multi-State Advanced Manufacturing Consortium TAACCCT Round II Grant – FINAL EVALUATION REPORT 82
Pellissippi State Community College was unable to provide comparison data for this analysis, so the Jefferson Community and Technical College comparison groups were included as a benchmark. Jefferson’s programs were selected as the benchmark due to similarities in program type and duration.
Table 61: Grant-Affected and Comparison Programs, Pellissippi State Community College
Program Certificate Comparison
Industrial Maintenance Technology
Industrial Maintenance Technology AAS
Industrial Maintenance Technology Certificate
Jefferson Community and Technical College comparison group
The table below shows the number of students enrolled in grant-affected programs for each year of the grant.
Table 62: Pellissippi Enrollment over Time
Year 1 Year 2 Year 3 Year 4
Total Number of Individuals 0 33 153 25
The tables below provide details on the total number of individuals included in the analysis along with demographic characteristics. This information is provided for the college overall, and for each of its grant-affected programs, if appropriate. Additionally, data on outcomes is listed including program completions, credentials earned, credit hours completed, employed after program completion (if available), job retention three quarters after completion, incumbent worker completion, and incumbent worker wage increases (if available). Data is presented in terms of counts and rates where it makes sense.
As described in the section of the report called Efforts to Obtain State Quarterly Earnings Records, efforts to obtain state administrative records on employment and earnings were unsuccessful in Alabama, Michigan, Texas, Illinois, and Tennessee. In states where administrative data was not obtained, colleges attempted to personally contact all participants who had completed a program.
Table 63: Pellissippi Demographics and Outcomes
Variable Participant
Group
Participant
Group N
Total Number of Individuals 172 172
Demographics
Age 34.6 ± 10.9 172
Female 6 (3%) 172
White 159 (94%) 170
Black 8 (5%) 170
Other/More than One Race 3 (2%) 170
Hispanic/Latino 2 (1%) 172
Full-Time 83 (49%) 171
Part-Time 88 (51%) 171
Incumbent Worker 10 (16%) 62
Eligible Veteran 10 (6%) 172
Disabled 3 (19%) 16
Pell Eligible 36 (21%) 170
TAA Eligible 0 (0%) 108

Multi-State Advanced Manufacturing Consortium TAACCCT Round II Grant – FINAL EVALUATION REPORT 83
Variable Participant
Group
Participant
Group N
Outcomes
Program Completers 22 (13%) 172
Credentials Earned 23 172
Students Earning Certificates (<=1 year) 1 (1%) 172
Students Earning Certificates (>1 year) 0 (0%) 172
Students Earning Degrees 21 (12%) 172
Credit Hours Completed 1793 172
Employed After Program of Study Completion 11 (69%) 16
Retained in Employment 3 Quarters After Completion 11 (100%) 11
Incumbent Worker Completer 6 (27%) 22
Wage Increase Post-Enrollment 0 (0%) 10
Further Education after Program of Study Completion 0 (0%) 22
Retained in Grant-Affected Program 14 (8%) 172
Retained in Other Education Program 0 (0%) 172
The table below offers details on the key outcome of program completion rates. Completion rates were calculated for individuals pursuing programs of similar duration over similar lengths of time.
Table 64: Pellissipi Completion Rate by Demographics
Variable Completion Rate in
Comparison Group
Completion Rate in
Participant Group
Overall 34% 13%
Gender = Male
Gender = Female
34% NA
13% 0%
Non-White
White
0% 45%
100% 13%
Less than college education
At least some college education
ID 14% 13%
Full time
Part time
ID 8% 17%
Non-incumbent worker
Incumbent worker
ID 10% 60%
Non-veteran
Veteran
33% 100%
14% 0%
Non-disabled
Disabled
33% 50%
ID
Non-Pell grant eligible
Pell grant eligible
38% 27%
ID
Non-TAA eligible
TAA eligible
ID ID
ID: Insufficient Data to give a reliable completion rate (too many missing values in x-variable)
NA: no females in the comparison group
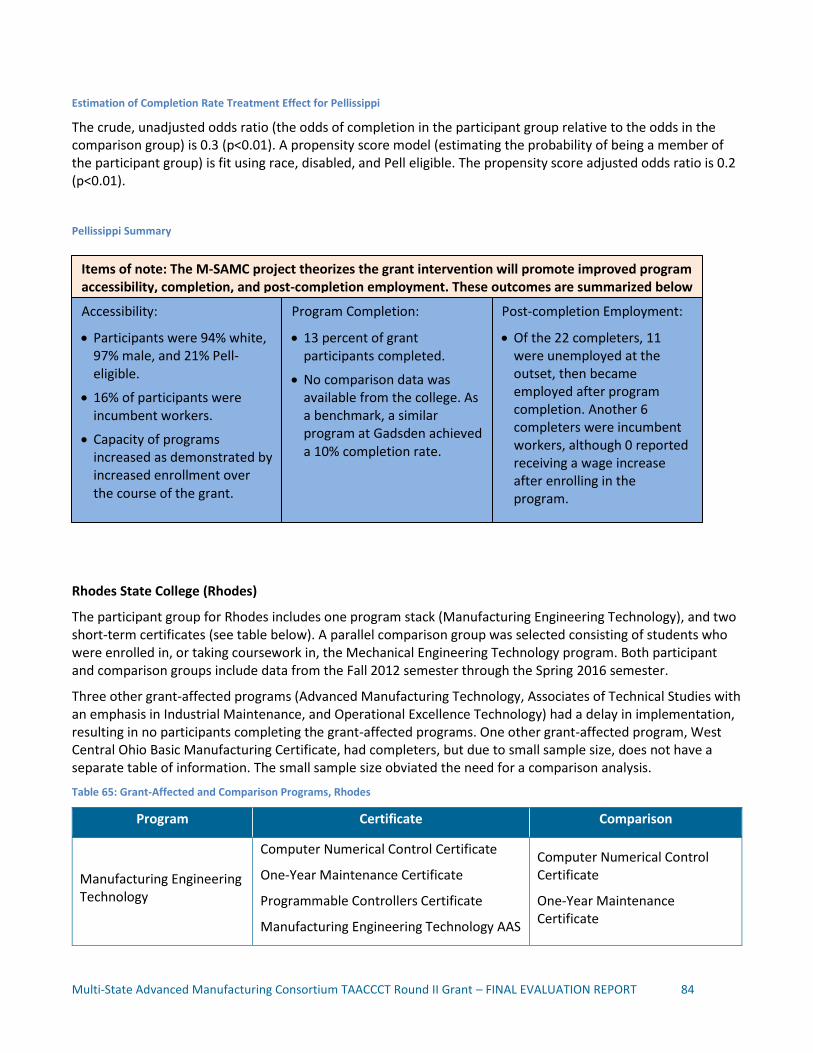
Multi-State Advanced Manufacturing Consortium TAACCCT Round II Grant – FINAL EVALUATION REPORT 84
Estimation of Completion Rate Treatment Effect for Pellissippi
The crude, unadjusted odds ratio (the odds of completion in the participant group relative to the odds in the comparison group) is 0.3 (p<0.01). A propensity score model (estimating the probability of being a member of the participant group) is fit using race, disabled, and Pell eligible. The propensity score adjusted odds ratio is 0.2 (p<0.01).
Pellissippi Summary
Rhodes State College (Rhodes)
The participant group for Rhodes includes one program stack (Manufacturing Engineering Technology), and two short-term certificates (see table below). A parallel comparison group was selected consisting of students who were enrolled in, or taking coursework in, the Mechanical Engineering Technology program. Both participant and comparison groups include data from the Fall 2012 semester through the Spring 2016 semester.
Three other grant-affected programs (Advanced Manufacturing Technology, Associates of Technical Studies with an emphasis in Industrial Maintenance, and Operational Excellence Technology) had a delay in implementation, resulting in no participants completing the grant-affected programs. One other grant-affected program, West Central Ohio Basic Manufacturing Certificate, had completers, but due to small sample size, does not have a separate table of information. The small sample size obviated the need for a comparison analysis.
Table 65: Grant-Affected and Comparison Programs, Rhodes
Program Certificate Comparison
Manufacturing Engineering Technology
Computer Numerical Control Certificate
One-Year Maintenance Certificate
Programmable Controllers Certificate
Manufacturing Engineering Technology AAS
Computer Numerical Control Certificate
One-Year Maintenance Certificate
Items of note: The M-SAMC project theorizes the grant intervention will promote improved program accessibility, completion, and post-completion employment. These outcomes are summarized below
Accessibility:
Participants were 94% white, 97% male, and 21% Pell-eligible.
16% of participants were incumbent workers.
Capacity of programs increased as demonstrated by increased enrollment over the course of the grant.
Program Completion:
13 percent of grant participants completed.
No comparison data was available from the college. As a benchmark, a similar program at Gadsden achieved a 10% completion rate.
Post-completion Employment:
Of the 22 completers, 11 were unemployed at the outset, then became employed after program completion. Another 6 completers were incumbent workers, although 0 reported receiving a wage increase after enrolling in the program.
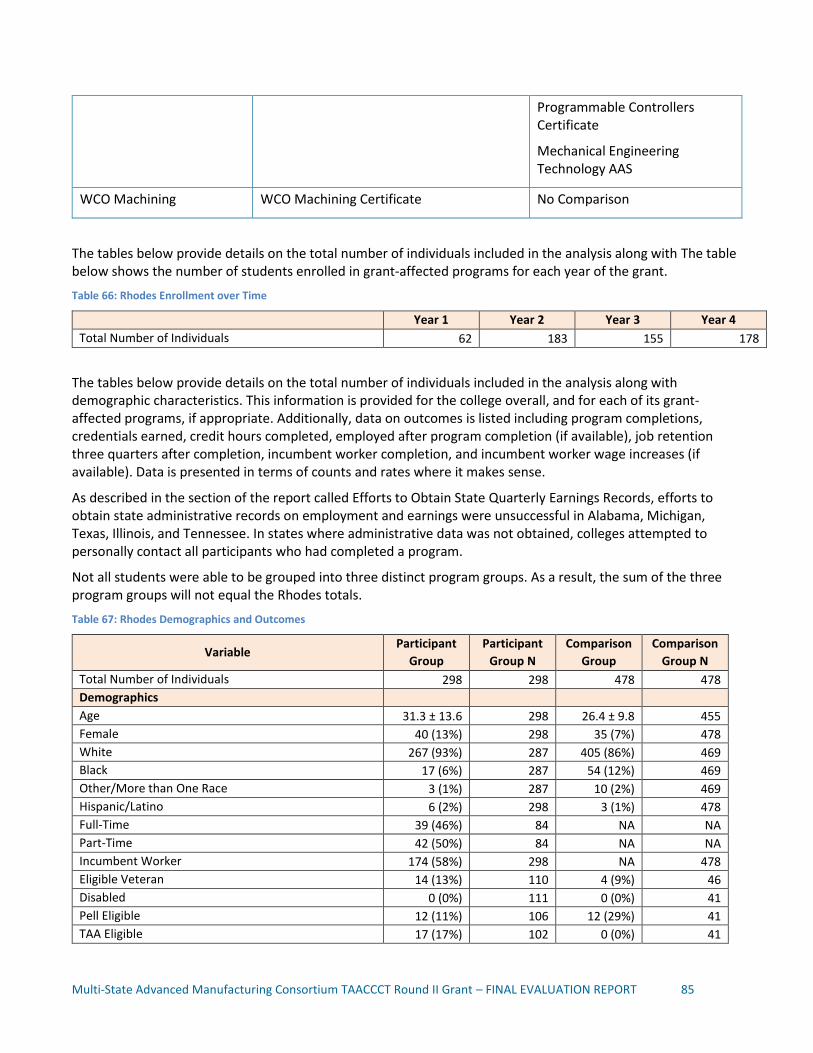
Multi-State Advanced Manufacturing Consortium TAACCCT Round II Grant – FINAL EVALUATION REPORT 85
Programmable Controllers Certificate
Mechanical Engineering Technology AAS
WCO Machining WCO Machining Certificate No Comparison
The tables below provide details on the total number of individuals included in the analysis along with The table below shows the number of students enrolled in grant-affected programs for each year of the grant.
Table 66: Rhodes Enrollment over Time
Year 1 Year 2 Year 3 Year 4
Total Number of Individuals 62 183 155 178
The tables below provide details on the total number of individuals included in the analysis along with demographic characteristics. This information is provided for the college overall, and for each of its grant-affected programs, if appropriate. Additionally, data on outcomes is listed including program completions, credentials earned, credit hours completed, employed after program completion (if available), job retention three quarters after completion, incumbent worker completion, and incumbent worker wage increases (if available). Data is presented in terms of counts and rates where it makes sense.
As described in the section of the report called Efforts to Obtain State Quarterly Earnings Records, efforts to obtain state administrative records on employment and earnings were unsuccessful in Alabama, Michigan, Texas, Illinois, and Tennessee. In states where administrative data was not obtained, colleges attempted to personally contact all participants who had completed a program.
Not all students were able to be grouped into three distinct program groups. As a result, the sum of the three program groups will not equal the Rhodes totals.
Table 67: Rhodes Demographics and Outcomes
Variable Participant
Group
Participant
Group N
Comparison
Group
Comparison
Group N
Total Number of Individuals 298 298 478 478
Demographics
Age 31.3 ± 13.6 298 26.4 ± 9.8 455
Female 40 (13%) 298 35 (7%) 478
White 267 (93%) 287 405 (86%) 469
Black 17 (6%) 287 54 (12%) 469
Other/More than One Race 3 (1%) 287 10 (2%) 469
Hispanic/Latino 6 (2%) 298 3 (1%) 478
Full-Time 39 (46%) 84 NA NA
Part-Time 42 (50%) 84 NA NA
Incumbent Worker 174 (58%) 298 NA 478
Eligible Veteran 14 (13%) 110 4 (9%) 46
Disabled 0 (0%) 111 0 (0%) 41
Pell Eligible 12 (11%) 106 12 (29%) 41
TAA Eligible 17 (17%) 102 0 (0%) 41
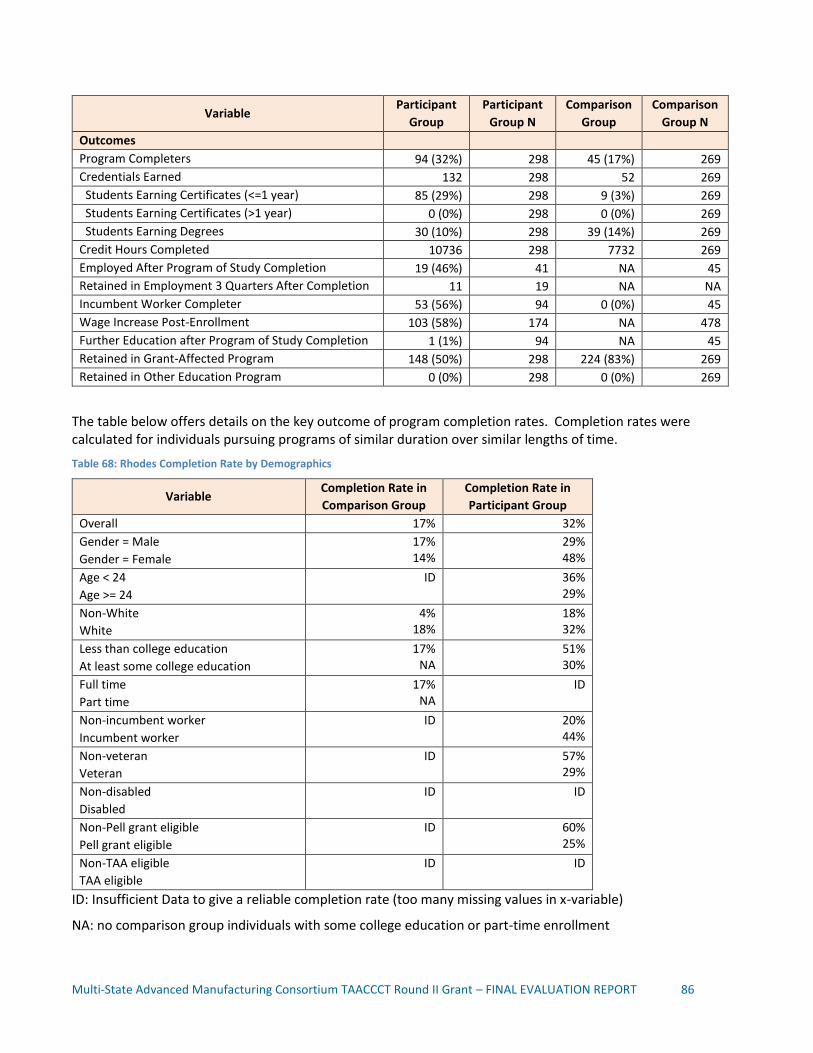
Multi-State Advanced Manufacturing Consortium TAACCCT Round II Grant – FINAL EVALUATION REPORT 86
Variable Participant
Group
Participant
Group N
Comparison
Group
Comparison
Group N
Outcomes
Program Completers 94 (32%) 298 45 (17%) 269
Credentials Earned 132 298 52 269
Students Earning Certificates (<=1 year) 85 (29%) 298 9 (3%) 269
Students Earning Certificates (>1 year) 0 (0%) 298 0 (0%) 269
Students Earning Degrees 30 (10%) 298 39 (14%) 269
Credit Hours Completed 10736 298 7732 269
Employed After Program of Study Completion 19 (46%) 41 NA 45
Retained in Employment 3 Quarters After Completion 11 19 NA NA
Incumbent Worker Completer 53 (56%) 94 0 (0%) 45
Wage Increase Post-Enrollment 103 (58%) 174 NA 478
Further Education after Program of Study Completion 1 (1%) 94 NA 45
Retained in Grant-Affected Program 148 (50%) 298 224 (83%) 269
Retained in Other Education Program 0 (0%) 298 0 (0%) 269
The table below offers details on the key outcome of program completion rates. Completion rates were calculated for individuals pursuing programs of similar duration over similar lengths of time.
Table 68: Rhodes Completion Rate by Demographics
Variable Completion Rate in
Comparison Group
Completion Rate in
Participant Group
Overall 17% 32%
Gender = Male
Gender = Female
17% 14%
29% 48%
Age < 24
Age >= 24
ID 36% 29%
Non-White
White
4% 18%
18% 32%
Less than college education
At least some college education
17% NA
51% 30%
Full time
Part time
17% NA
ID
Non-incumbent worker
Incumbent worker
ID 20% 44%
Non-veteran
Veteran
ID 57% 29%
Non-disabled
Disabled
ID ID
Non-Pell grant eligible
Pell grant eligible
ID 60% 25%
Non-TAA eligible
TAA eligible
ID ID
ID: Insufficient Data to give a reliable completion rate (too many missing values in x-variable)
NA: no comparison group individuals with some college education or part-time enrollment
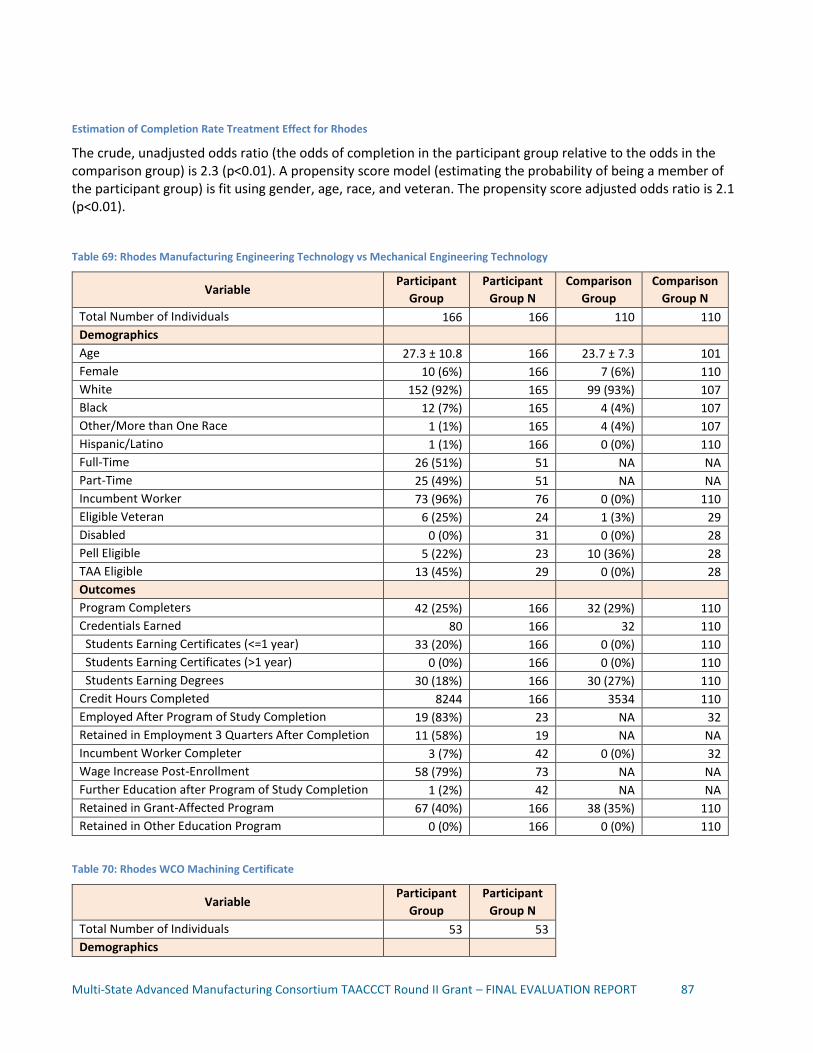
Multi-State Advanced Manufacturing Consortium TAACCCT Round II Grant – FINAL EVALUATION REPORT 87
Estimation of Completion Rate Treatment Effect for Rhodes
The crude, unadjusted odds ratio (the odds of completion in the participant group relative to the odds in the comparison group) is 2.3 (p<0.01). A propensity score model (estimating the probability of being a member of the participant group) is fit using gender, age, race, and veteran. The propensity score adjusted odds ratio is 2.1 (p<0.01).
Table 69: Rhodes Manufacturing Engineering Technology vs Mechanical Engineering Technology
Variable Participant
Group
Participant
Group N
Comparison
Group
Comparison
Group N
Total Number of Individuals 166 166 110 110
Demographics
Age 27.3 ± 10.8 166 23.7 ± 7.3 101
Female 10 (6%) 166 7 (6%) 110
White 152 (92%) 165 99 (93%) 107
Black 12 (7%) 165 4 (4%) 107
Other/More than One Race 1 (1%) 165 4 (4%) 107
Hispanic/Latino 1 (1%) 166 0 (0%) 110
Full-Time 26 (51%) 51 NA NA
Part-Time 25 (49%) 51 NA NA
Incumbent Worker 73 (96%) 76 0 (0%) 110
Eligible Veteran 6 (25%) 24 1 (3%) 29
Disabled 0 (0%) 31 0 (0%) 28
Pell Eligible 5 (22%) 23 10 (36%) 28
TAA Eligible 13 (45%) 29 0 (0%) 28
Outcomes
Program Completers 42 (25%) 166 32 (29%) 110
Credentials Earned 80 166 32 110
Students Earning Certificates (<=1 year) 33 (20%) 166 0 (0%) 110
Students Earning Certificates (>1 year) 0 (0%) 166 0 (0%) 110
Students Earning Degrees 30 (18%) 166 30 (27%) 110
Credit Hours Completed 8244 166 3534 110
Employed After Program of Study Completion 19 (83%) 23 NA 32
Retained in Employment 3 Quarters After Completion 11 (58%) 19 NA NA
Incumbent Worker Completer 3 (7%) 42 0 (0%) 32
Wage Increase Post-Enrollment 58 (79%) 73 NA NA
Further Education after Program of Study Completion 1 (2%) 42 NA NA
Retained in Grant-Affected Program 67 (40%) 166 38 (35%) 110
Retained in Other Education Program 0 (0%) 166 0 (0%) 110
Table 70: Rhodes WCO Machining Certificate
Variable Participant
Group
Participant
Group N
Total Number of Individuals 53 53
Demographics
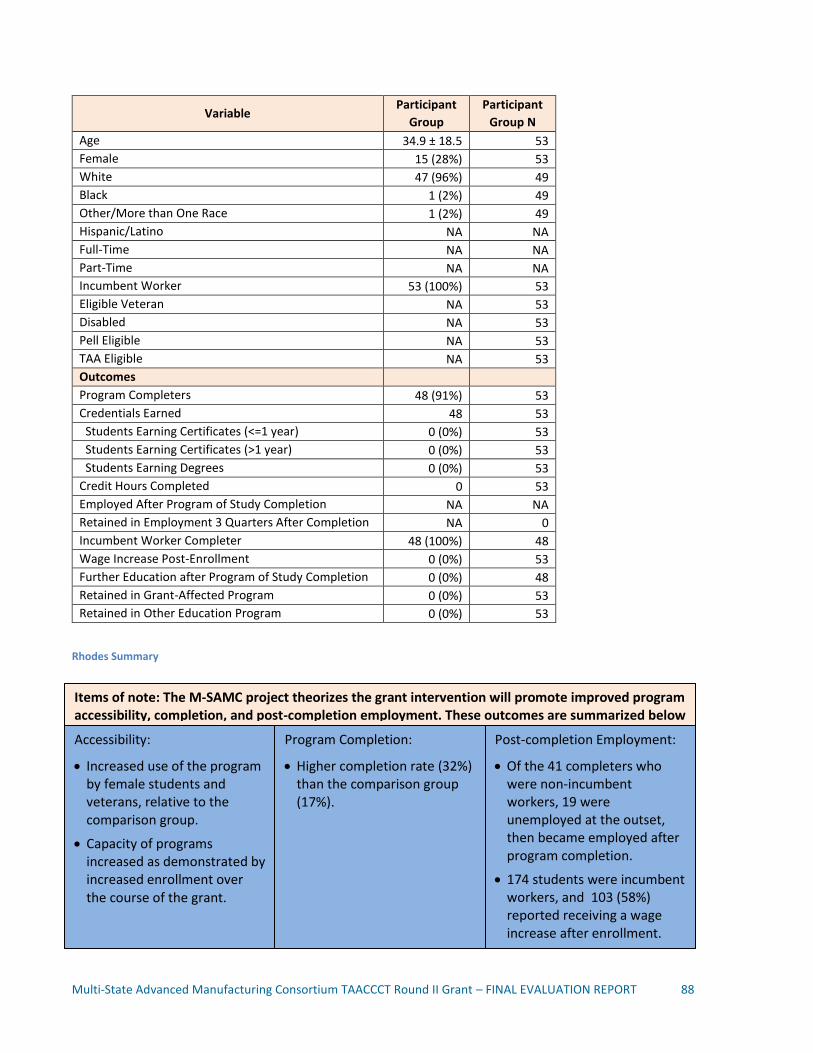
Multi-State Advanced Manufacturing Consortium TAACCCT Round II Grant – FINAL EVALUATION REPORT 88
Variable Participant
Group
Participant
Group N
Age 34.9 ± 18.5 53
Female 15 (28%) 53
White 47 (96%) 49
Black 1 (2%) 49
Other/More than One Race 1 (2%) 49
Hispanic/Latino NA NA
Full-Time NA NA
Part-Time NA NA
Incumbent Worker 53 (100%) 53
Eligible Veteran NA 53
Disabled NA 53
Pell Eligible NA 53
TAA Eligible NA 53
Outcomes
Program Completers 48 (91%) 53
Credentials Earned 48 53
Students Earning Certificates (<=1 year) 0 (0%) 53
Students Earning Certificates (>1 year) 0 (0%) 53
Students Earning Degrees 0 (0%) 53
Credit Hours Completed 0 53
Employed After Program of Study Completion NA NA
Retained in Employment 3 Quarters After Completion NA 0
Incumbent Worker Completer 48 (100%) 48
Wage Increase Post-Enrollment 0 (0%) 53
Further Education after Program of Study Completion 0 (0%) 48
Retained in Grant-Affected Program 0 (0%) 53
Retained in Other Education Program 0 (0%) 53
Rhodes Summary
Items of note: The M-SAMC project theorizes the grant intervention will promote improved program accessibility, completion, and post-completion employment. These outcomes are summarized below
Accessibility:
Increased use of the program by female students and veterans, relative to the comparison group.
Capacity of programs increased as demonstrated by increased enrollment over the course of the grant.
Program Completion:
Higher completion rate (32%) than the comparison group (17%).
Post-completion Employment:
Of the 41 completers who were non-incumbent workers, 19 were unemployed at the outset, then became employed after program completion.
174 students were incumbent workers, and 103 (58%) reported receiving a wage increase after enrollment.

Multi-State Advanced Manufacturing Consortium TAACCCT Round II Grant – FINAL EVALUATION REPORT 89
Rock Valley College (Rock Valley)
The participant group for Rock Valley includes two program stacks: Integrated Systems Technology, which includes a handful of short-term certificates; and a combined Manufacturing Engineering Technology (MET)/Electronics Engineering Technology (EET) program, which includes a handful of short-term certifications leading to an AAS in either MET or EET. Participant data was collected for students from the Spring 2014 semester through the Fall 2015 semester.
Rock Valley was not able to provide comparison data for this analysis due to its student record confidentiality policy, so the Gadsden State Community College comparison groups were included as a benchmark. Gadsden’s programs were selected as the benchmark due to similarities in program type and duration.
Table 71: Grant-Affected and Comparison Programs, Rock Valley
Program Certificate Comparison
Integrated Systems Technology
Introduction to Electrical Controls Circuits Certificate
Electrical Control Circuits II Certificate
Pneumatics for the Integrated Systems Technologist Certificate
Introduction to Programming the Allen-Bradley SLC 500 Series Certificate
Programmable Logic Controller (PLC) Certificate
Intro to Mechanical Drive Systems Certificate
Gadsden State Community College comparison group
Manufacturing Engineering Technology
Electronics Engineering Technology
Manufacturing Engineering Technology AAS
Electronics Engineering Technology AAS
Hydraulics, Pneumatics, and PLCs Certificate
Basic Electronics Certificate
Gadsden State Community College comparison group
The table below shows the number of students enrolled in grant-affected programs for each year of the grant.
Table 72: Rock Valley Enrollment over Time
Year 1 Year 2 Year 3 Year 4
Total Number of Individuals 0 22 60 32
The tables below provide details on the total number of individuals included in the analysis along with demographic characteristics. This information is provided for the college overall, and for each of its grant-affected programs, if appropriate. Additionally, data on outcomes is listed including program completions, credentials earned, credit hours completed, employed after program completion (if available), job retention three quarters after completion, incumbent worker completion, and incumbent worker wage increases (if available). Data is presented in terms of counts and rates where it makes sense.
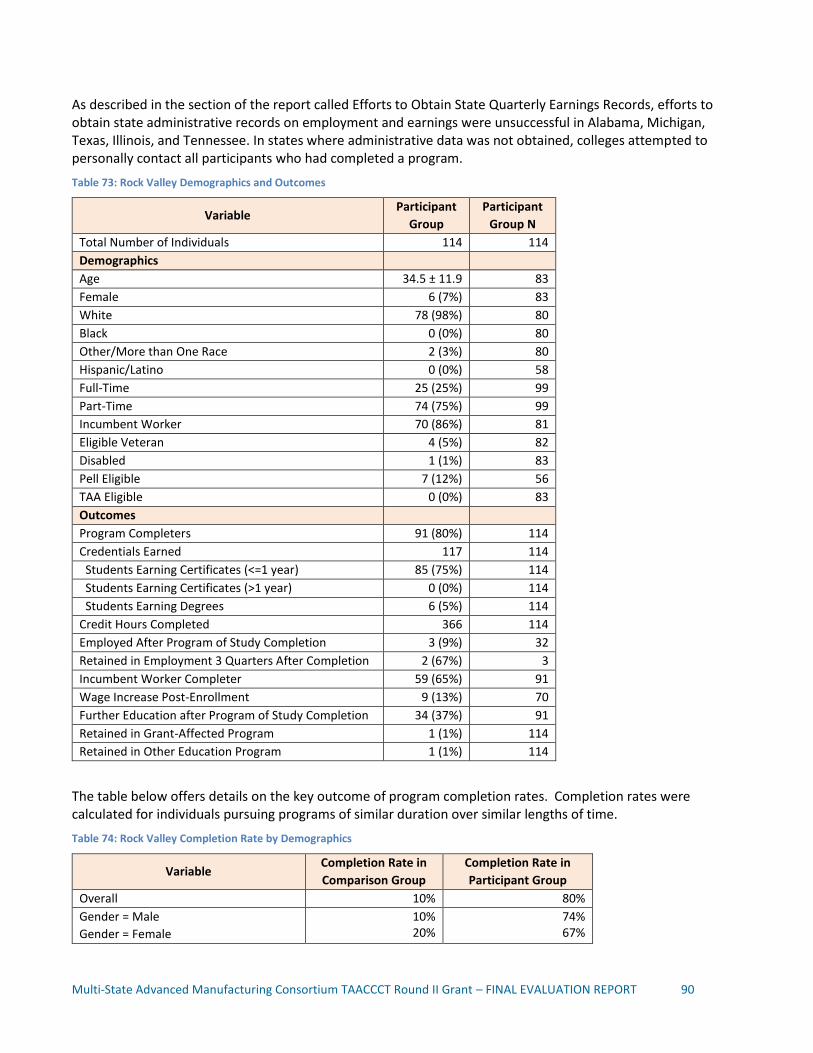
Multi-State Advanced Manufacturing Consortium TAACCCT Round II Grant – FINAL EVALUATION REPORT 90
As described in the section of the report called Efforts to Obtain State Quarterly Earnings Records, efforts to obtain state administrative records on employment and earnings were unsuccessful in Alabama, Michigan, Texas, Illinois, and Tennessee. In states where administrative data was not obtained, colleges attempted to personally contact all participants who had completed a program.
Table 73: Rock Valley Demographics and Outcomes
Variable Participant
Group
Participant
Group N
Total Number of Individuals 114 114
Demographics
Age 34.5 ± 11.9 83
Female 6 (7%) 83
White 78 (98%) 80
Black 0 (0%) 80
Other/More than One Race 2 (3%) 80
Hispanic/Latino 0 (0%) 58
Full-Time 25 (25%) 99
Part-Time 74 (75%) 99
Incumbent Worker 70 (86%) 81
Eligible Veteran 4 (5%) 82
Disabled 1 (1%) 83
Pell Eligible 7 (12%) 56
TAA Eligible 0 (0%) 83
Outcomes
Program Completers 91 (80%) 114
Credentials Earned 117 114
Students Earning Certificates (<=1 year) 85 (75%) 114
Students Earning Certificates (>1 year) 0 (0%) 114
Students Earning Degrees 6 (5%) 114
Credit Hours Completed 366 114
Employed After Program of Study Completion 3 (9%) 32
Retained in Employment 3 Quarters After Completion 2 (67%) 3
Incumbent Worker Completer 59 (65%) 91
Wage Increase Post-Enrollment 9 (13%) 70
Further Education after Program of Study Completion 34 (37%) 91
Retained in Grant-Affected Program 1 (1%) 114
Retained in Other Education Program 1 (1%) 114
The table below offers details on the key outcome of program completion rates. Completion rates were calculated for individuals pursuing programs of similar duration over similar lengths of time.
Table 74: Rock Valley Completion Rate by Demographics
Variable Completion Rate in
Comparison Group
Completion Rate in
Participant Group
Overall 10% 80%
Gender = Male
Gender = Female
10% 20%
74% 67%

Multi-State Advanced Manufacturing Consortium TAACCCT Round II Grant – FINAL EVALUATION REPORT 91
Variable Completion Rate in
Comparison Group
Completion Rate in
Participant Group
Age < 24
Age >= 24
11% 10%
45% 92%
Non-White
White
8% 11%
64% 85%
Non-incumbent worker
Incumbent worker
ID 64% 84%
Non-veteran
Veteran
10% 15%
83% 25%
Non-disabled
Disabled
ID 80% 100%
Non-Pell grant eligible
Pell grant eligible
12% 6%
80% 29%
Non-TAA eligible
TAA eligible
10% 15%
ID
ID: Insufficient Data to give a reliable completion rate (too many missing values in x-variable)
Estimation of Completion Rate Treatment Effect for Rock Valley
The crude, unadjusted odds ratio (the odds of completion in the participant group relative to the odds in the comparison group) is 33.7 (p<0.01). A propensity score model (estimating the probability of being a member of the participant group) is fit using gender, age, race, veteran, and Pell eligible. The propensity score adjusted odds ratio is 30.6 (p<0.01).
Table 75: Rock Valley IST
Variable Participant
Group
Participant
Group N
Total Number of Individuals 55 55
Demographics
Age 34.2 ± 11.8 40
Female 4 (15%) 27
White 40 (95%) 42
Black 0 (0%) 42
Other/More than One Race 2 (12%) 16
Hispanic/Latino 0 (0%) 20
Full-Time 25 (57%) 44
Part-Time 19 (43%) 44
Incumbent Worker 33 (77%) 43
Eligible Veteran 4 (9%) 44
Disabled 1 (2%) 44
Pell Eligible 7 (35%) 20
TAA Eligible 0 (0%) 44
Outcomes
Program Completers 34 (62%) 55
Credentials Earned 34 55
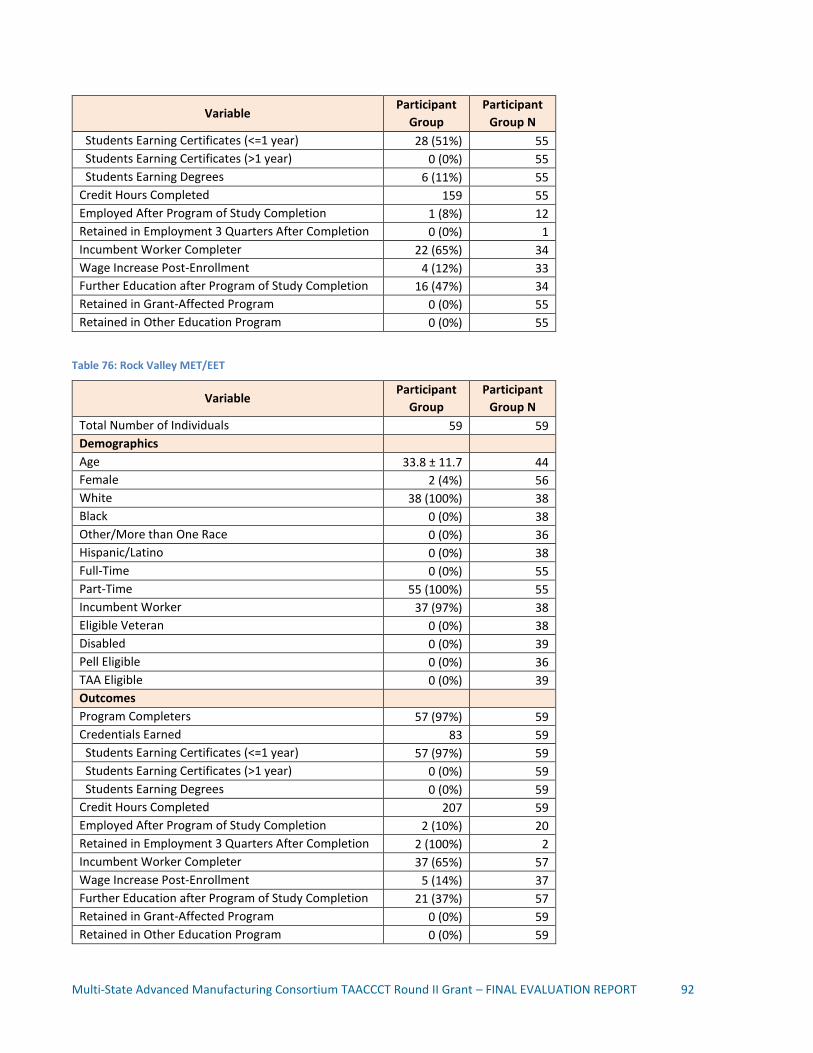
Multi-State Advanced Manufacturing Consortium TAACCCT Round II Grant – FINAL EVALUATION REPORT 92
Variable Participant
Group
Participant
Group N
Students Earning Certificates (<=1 year) 28 (51%) 55
Students Earning Certificates (>1 year) 0 (0%) 55
Students Earning Degrees 6 (11%) 55
Credit Hours Completed 159 55
Employed After Program of Study Completion 1 (8%) 12
Retained in Employment 3 Quarters After Completion 0 (0%) 1
Incumbent Worker Completer 22 (65%) 34
Wage Increase Post-Enrollment 4 (12%) 33
Further Education after Program of Study Completion 16 (47%) 34
Retained in Grant-Affected Program 0 (0%) 55
Retained in Other Education Program 0 (0%) 55
Table 76: Rock Valley MET/EET
Variable Participant
Group
Participant
Group N
Total Number of Individuals 59 59
Demographics
Age 33.8 ± 11.7 44
Female 2 (4%) 56
White 38 (100%) 38
Black 0 (0%) 38
Other/More than One Race 0 (0%) 36
Hispanic/Latino 0 (0%) 38
Full-Time 0 (0%) 55
Part-Time 55 (100%) 55
Incumbent Worker 37 (97%) 38
Eligible Veteran 0 (0%) 38
Disabled 0 (0%) 39
Pell Eligible 0 (0%) 36
TAA Eligible 0 (0%) 39
Outcomes
Program Completers 57 (97%) 59
Credentials Earned 83 59
Students Earning Certificates (<=1 year) 57 (97%) 59
Students Earning Certificates (>1 year) 0 (0%) 59
Students Earning Degrees 0 (0%) 59
Credit Hours Completed 207 59
Employed After Program of Study Completion 2 (10%) 20
Retained in Employment 3 Quarters After Completion 2 (100%) 2
Incumbent Worker Completer 37 (65%) 57
Wage Increase Post-Enrollment 5 (14%) 37
Further Education after Program of Study Completion 21 (37%) 57
Retained in Grant-Affected Program 0 (0%) 59
Retained in Other Education Program 0 (0%) 59

Multi-State Advanced Manufacturing Consortium TAACCCT Round II Grant – FINAL EVALUATION REPORT 93
Rock Valley Summary
Spartanburg Community College (Spartanburg)
The participant group for Spartanburg includes three program stacks: Automated Manufacturing Technology, Industrial Electronics Technology, and Mechatronics (see table below). Data was collected in the Spring 2014 semester through the Fall 2015 semester for grant-affected students. A historical comparison group consisting of students in the same programs was selected for which data was collected in the Spring 2012 semester through the Fall 2013 semester. Program groups are identified using the declared program listed in the Participant Intake Form. If a program is not listed, the program declared or the program completed in the On-Going spreadsheet is used.
Program groups were identified using the program completed by the student, followed by the program of study identified in the PIF, followed by the declared program specified in the OG. Not all students were able to be grouped into a program group, due to lack of information available.
Table 77: Grant-Affected and Comparison Programs, Spartanburg
Program Certificate Comparison
Automated Manufacturing Technology
Automated Manufacturing Technology AAS Historical
Industrial Electronics Technology
Industrial Electronics Technology (Certificate; AAS)
Historical
Mechatronics Mechatronics (Certificate; AAS) Historical
Items of note: The M-SAMC project theorizes the grant intervention will promote improved program accessibility, completion, and post-completion employment. These outcomes are summarized below
Accessibility:
Participants were 98% white, 93% male, and 12% Pell-eligible.
86% of participants were incumbent workers.
Capacity of programs increased as demonstrated by increased enrollment over the course of the grant.
Program Completion:
80 percent of grant participants completed; this is driven by the IST program (62% completion), and the MET program (97% completion)
No comparison data was available from the college.
Post-completion Employment:
Of the 91 completers, 3 were unemployed at the outset, then became employed after program completion. Another 59 completers were incumbent workers, and 9 reported receiving a wage increase after enrolling in the program.
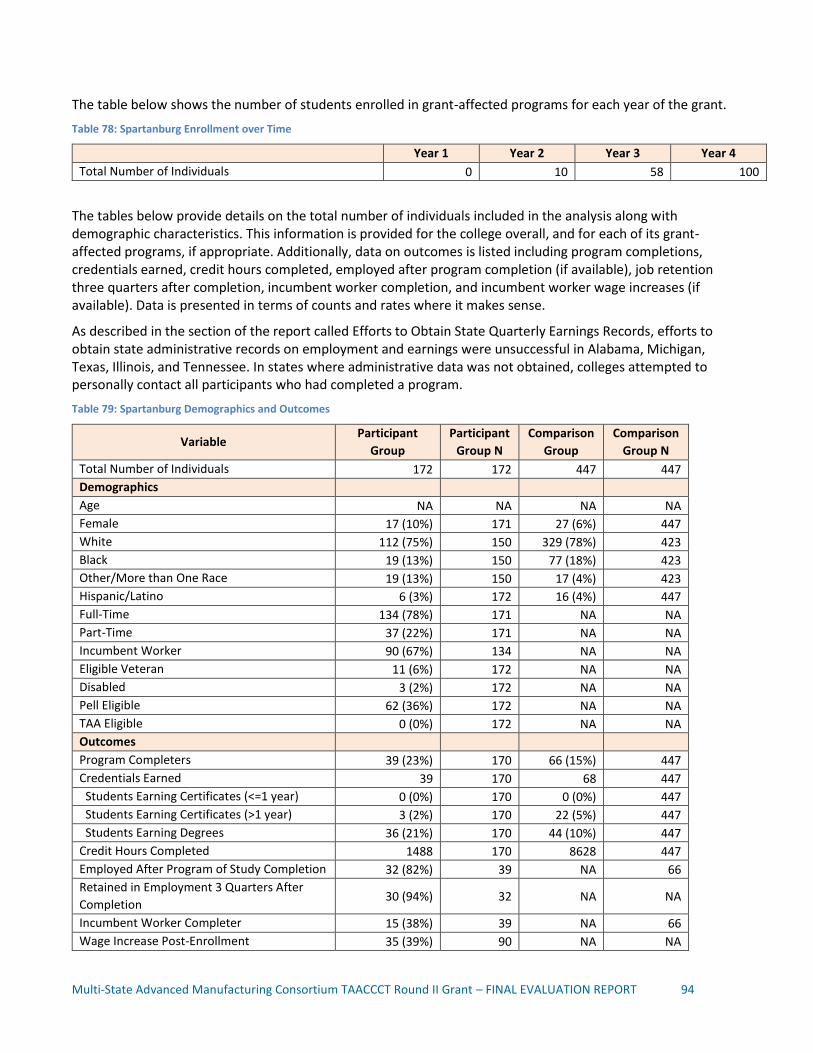
Multi-State Advanced Manufacturing Consortium TAACCCT Round II Grant – FINAL EVALUATION REPORT 94
The table below shows the number of students enrolled in grant-affected programs for each year of the grant.
Table 78: Spartanburg Enrollment over Time
Year 1 Year 2 Year 3 Year 4
Total Number of Individuals 0 10 58 100
The tables below provide details on the total number of individuals included in the analysis along with demographic characteristics. This information is provided for the college overall, and for each of its grant-affected programs, if appropriate. Additionally, data on outcomes is listed including program completions, credentials earned, credit hours completed, employed after program completion (if available), job retention three quarters after completion, incumbent worker completion, and incumbent worker wage increases (if available). Data is presented in terms of counts and rates where it makes sense.
As described in the section of the report called Efforts to Obtain State Quarterly Earnings Records, efforts to obtain state administrative records on employment and earnings were unsuccessful in Alabama, Michigan, Texas, Illinois, and Tennessee. In states where administrative data was not obtained, colleges attempted to personally contact all participants who had completed a program.
Table 79: Spartanburg Demographics and Outcomes
Variable Participant
Group
Participant
Group N
Comparison
Group
Comparison
Group N
Total Number of Individuals 172 172 447 447
Demographics
Age NA NA NA NA
Female 17 (10%) 171 27 (6%) 447
White 112 (75%) 150 329 (78%) 423
Black 19 (13%) 150 77 (18%) 423
Other/More than One Race 19 (13%) 150 17 (4%) 423
Hispanic/Latino 6 (3%) 172 16 (4%) 447
Full-Time 134 (78%) 171 NA NA
Part-Time 37 (22%) 171 NA NA
Incumbent Worker 90 (67%) 134 NA NA
Eligible Veteran 11 (6%) 172 NA NA
Disabled 3 (2%) 172 NA NA
Pell Eligible 62 (36%) 172 NA NA
TAA Eligible 0 (0%) 172 NA NA
Outcomes
Program Completers 39 (23%) 170 66 (15%) 447
Credentials Earned 39 170 68 447
Students Earning Certificates (<=1 year) 0 (0%) 170 0 (0%) 447
Students Earning Certificates (>1 year) 3 (2%) 170 22 (5%) 447
Students Earning Degrees 36 (21%) 170 44 (10%) 447
Credit Hours Completed 1488 170 8628 447
Employed After Program of Study Completion 32 (82%) 39 NA 66
Retained in Employment 3 Quarters After
Completion 30 (94%) 32 NA NA
Incumbent Worker Completer 15 (38%) 39 NA 66
Wage Increase Post-Enrollment 35 (39%) 90 NA NA

Multi-State Advanced Manufacturing Consortium TAACCCT Round II Grant – FINAL EVALUATION REPORT 95
Variable Participant
Group
Participant
Group N
Comparison
Group
Comparison
Group N
Further Education after Program of Study
Completion 4 (10%) 39 NA 66
Retained in Grant-Affected Program 90 (53%) 170 254 (57%) 447
Retained in Other Education Program 4 (24%) 170 0 (0%) 447
The table below offers details on the key outcome of program completion rates. Completion rates were calculated for individuals pursuing programs of similar duration over similar lengths of time.
Table 80: Spartanburg Completion Rate by Demographics
Variable Completion Rate in
Comparison Group
Completion Rate in
Participant Group
Overall 15% 23%
Gender = Male
Gender = Female
15% 7%
24% 18%
Non-White
White
18% 14%
17% 26%
Less than college education
At least some college education
ID 6% 30%
Full time
Part time
ID 26% 14%
Non-incumbent worker
Incumbent worker
ID ID
Non-veteran
Veteran
ID 21% 45%
Non-disabled
Disabled
ID ID
Non-Pell grant eligible
Pell grant eligible
ID 23% 24%
Non-TAA eligible
TAA eligible
ID ID
ID: Insufficient Data to give a reliable completion rate (too many missing values in x-variable)
Estimation of Completion Rate Treatment Effect for Spartanburg
The crude, unadjusted odds ratio (the odds of completion in the participant group relative to the odds in the comparison group) is 1.7 (p=0.02). A propensity score model (estimating the probability of being a member of the participant group) is fit using gender, race, education, enrollment status, incumbent worker, veteran, and Pell eligible. The propensity score adjusted odds ratio is 1.5 (p=0.07).
Table 81: Spartanburg AMT
Variable Participant
Group
Participant
Group N
Comparison
Group
Comparison
Group N
Total Number of Individuals 43 43 95 95
Demographics

Multi-State Advanced Manufacturing Consortium TAACCCT Round II Grant – FINAL EVALUATION REPORT 96
Variable Participant
Group
Participant
Group N
Comparison
Group
Comparison
Group N
Age NA NA NA NA
Female 5 (14%) 36 6 (7%) 87
White 24 (67%) 36 65 (80%) 81
Black 6 (17%) 36 11 (14%) 81
Other/More than One Race 6 (17%) 36 5 (6%) 81
Hispanic/Latino 2 (5%) 43 5 (6%) 87
Full-Time 39 (91%) 43 NA NA
Part-Time 4 (9%) 43 NA NA
Incumbent Worker 24 (67%) 36 NA NA
Eligible Veteran 4 (11%) 37 NA NA
Disabled 0 (0%) 37 NA NA
Pell Eligible 14 (38%) 37 NA NA
TAA Eligible 0 (0%) 42 NA NA
Outcomes
Program Completers 8 (19%) 42 11 (12%) 95
Credentials Earned 8 42 11 95
Students Earning Certificates (<=1 year) 0 (0%) 42 0 (0%) 95
Students Earning Certificates (>1 year) 0 (0%) 42 0 (0%) 95
Students Earning Degrees 8 (19%) 42 11 (12%) 95
Credit Hours Completed 420 42 1821 95
Employed After Program of Study Completion NA 5 NA 11
Retained in Employment 3 Quarters After
Completion NA NA NA NA
Incumbent Worker Completer 3 (38%) 8 0 (0%) 11
Wage Increase Post-Enrollment NA 24 NA NA
Further Education after Program of Study
Completion NA 8 NA 11
Retained in Grant-Affected Program 23 (62%) 37 55 (58%) 95
Retained in Other Education Program 1 (2%) 42 0 (0%) 95
The table below offers details on the key outcome of program completion rates. Completion rates were calculated for individuals pursuing programs of similar duration over similar lengths of time.
Table 82: Spartanburg Completion Rate by Demographics for AMT
Variable Completion Rate in
Comparison Group
Completion Rate in
Participant Group
Overall 12% 19%
Gender = Male
Gender = Female
12% 0%
23% 0%
Non-White
White
4% 14%
13% 22%
Less than college education
At least some college education
ID 0% 29%
Full time
Part time
ID 21% 0%

Multi-State Advanced Manufacturing Consortium TAACCCT Round II Grant – FINAL EVALUATION REPORT 97
Variable Completion Rate in
Comparison Group
Completion Rate in
Participant Group
Non-incumbent worker
Incumbent worker
ID ID
Non-veteran
Veteran
ID 16% 50%
Non-disabled
Disabled
ID ID
Non-Pell grant eligible
Pell grant eligible
ID 22% 13%
Non-TAA eligible
TAA eligible
ID ID
ID: Insufficient Data to give a reliable completion rate (too many missing values in x-variable)
Estimation of Completion Rate Treatment Effect for Spartanburg AMT
The crude, unadjusted odds ratio (the odds of completion in the participant group relative to the odds in the comparison group) is 1.8 (p=0.25). A propensity score model (estimating the probability of being a member of the participant group) is fit using gender, race, education, enrollment status, incumbent worker, veteran, and Pell eligible. The propensity score adjusted odds ratio is 1.5 (p=0.46).
Table 83: Spartanburg MEC
Variable Participant
Group
Participant
Group N
Comparison
Group
Comparison
Group N
Total Number of Individuals 100 100 251 251
Demographics
Age NA NA NA NA
Female 7 (8%) 84 13 (6%) 231
White 61 (77%) 79 171 (78%) 220
Black 6 (8%) 79 40 (18%) 220
Other/More than One Race 12 (15%) 79 9 (4%) 220
Hispanic/Latino 4 (4%) 100 7 (3%) 231
Full-Time 84 (84%) 100 NA NA
Part-Time 16 (16%) 100 NA NA
Incumbent Worker 58 (70%) 83 NA NA
Eligible Veteran 5 (6%) 84 NA NA
Disabled 2 (2%) 84 NA NA
Pell Eligible 33 (39%) 84 NA NA
TAA Eligible 0 (0%) 99 NA NA
Outcomes
Program Completers 26 (26%) 99 35 (14%) 251
Credentials Earned 26 99 35 251
Students Earning Certificates (<=1 year) 0 (0%) 99 0 (0%) 251
Students Earning Certificates (>1 year) 0 (0%) 99 19 (8%) 251
Students Earning Degrees 26 (26%) 99 16 (6%) 251
Credit Hours Completed 905 99 5157 251

Multi-State Advanced Manufacturing Consortium TAACCCT Round II Grant – FINAL EVALUATION REPORT 98
Variable Participant
Group
Participant
Group N
Comparison
Group
Comparison
Group N
Employed After Program of Study Completion NA 17 NA 35
Retained in Employment 3 Quarters After
Completion NA NA NA NA
Incumbent Worker Completer 9 (35%) 26 0 (0%) 35
Wage Increase Post-Enrollment NA 58 NA NA
Further Education after Program of Study
Completion NA 26 NA NA
Retained in Grant-Affected Program 46 (55%) 84 157 (63%) 251
Retained in Other Education Program 1 (1%) 99 0 (0%) 251
The table below offers details on the key outcome of program completion rates. Completion rates were calculated for individuals pursuing programs of similar duration over similar lengths of time.
Table 84: Spartanburg Completion Rate by Demographics for MEC
Variable Completion Rate in
Comparison Group
Completion Rate in
Participant Group
Overall 14% 26%
Gender = Male
Gender = Female
14% 7%
25% 43%
Non-White
White
19% 12%
21% 28%
Less than college education
At least some college education
ID 9% 35%
Full time
Part time
ID 27% 20%
Non-incumbent worker
Incumbent worker
ID ID
Non-veteran
Veteran
ID 25% 43%
Non-disabled
Disabled
ID ID
Non-Pell grant eligible
Pell grant eligible
ID 25% 28%
Non-TAA eligible
TAA eligible
ID ID
ID: Insufficient Data to give a reliable completion rate (too many missing values in x-variable)
Estimation of Completion Rate Treatment Effect for Spartanburg MEC
The crude, unadjusted odds ratio (the odds of completion in the participant group relative to the odds in the comparison group) is 2.2 (p=0.01). A propensity score model (estimating the probability of being a member of the participant group) is fit using gender, race, education, enrollment status, incumbent worker, veteran, and Pell eligible. The propensity score adjusted odds ratio is 2.2 (p=0.01).

Multi-State Advanced Manufacturing Consortium TAACCCT Round II Grant – FINAL EVALUATION REPORT 99
Table 85: Spartanburg IE
Variable Participant
Group
Participant
Group N
Comparison
Group
Comparison
Group N
Total Number of Individuals 15 15 96 96
Demographics
Age NA NA NA NA
Female 0 (0%) 12 4 (4%) 94
White 8 (67%) 12 69 (78%) 89
Black 3 (25%) 12 19 (21%) 89
Other/More than One Race 1 (8%) 12 1 (1%) 89
Hispanic/Latino 0 (0%) 15 3 (3%) 94
Full-Time 10 (71%) 14 NA NA
Part-Time 4 (29%) 14 NA NA
Incumbent Worker 8 (62%) 13 NA NA
Eligible Veteran 0 (0%) 12 NA NA
Disabled 0 (0%) 12 NA NA
Pell Eligible 4 (33%) 12 NA NA
TAA Eligible 0 (0%) 15 NA NA
Outcomes
Program Completers 5 (33%) 15 22 (23%) 96
Credentials Earned 5 15 22 96
Students Earning Certificates (<=1 year) 0 (0%) 15 0 (0%) 96
Students Earning Certificates (>1 year) 3 (20%) 15 3 (3%) 96
Students Earning Degrees 2 (13%) 15 19 (20%) 96
Credit Hours Completed 142 15 1601 96
Employed After Program of Study Completion NA 2 NA 22
Retained in Employment 3 Quarters After
Completion NA NA NA NA
Incumbent Worker Completer 3 (60%) 5 0 (0%) 22
Wage Increase Post-Enrollment NA 8 NA NA
Further Education after Program of Study
Completion NA 5 NA NA
Retained in Grant-Affected Program 6 (50%) 12 42 (44%) 96
Retained in Other Education Program 1 (7%) 15 0 (0%) 96
The table below offers details on the key outcome of program completion rates. Completion rates were calculated for individuals pursuing programs of similar duration over similar lengths of time.
Table 86: Spartanburg Completion Rate by Demographics for IE
Variable Completion Rate in
Comparison Group
Completion Rate in
Participant Group
Overall 23% 33%
Gender = Male
Gender = Female
23% 25%
33% NA
Non-White
White
28% 21%
50% 27%
Less than college education ID 0%

Multi-State Advanced Manufacturing Consortium TAACCCT Round II Grant – FINAL EVALUATION REPORT 100
Variable Completion Rate in
Comparison Group
Completion Rate in
Participant Group
At least some college education 38%
Full time
Part time
ID 30% 50%
Non-incumbent worker
Incumbent worker
ID ID
Non-veteran
Veteran
ID 33% NA
Non-disabled
Disabled
ID ID
Non-Pell grant eligible
Pell grant eligible
ID 36% 25%
Non-TAA eligible
TAA eligible
ID ID
ID: Insufficient Data to give a reliable completion rate (too many missing values in x-variable)
Estimation of Completion Rate Treatment Effect for Spartanburg IE
The crude, unadjusted odds ratio (the odds of completion in the participant group relative to the odds in the comparison group) is 1.7 (p=0.39). A propensity score model (estimating the probability of being a member of the participant group) is fit using race, education, enrollment status, incumbent worker, and Pell eligible. The propensity score adjusted odds ratio is 2.1 (p=0.25).
Spartanburg Summary
Items of note: The M-SAMC project theorizes the grant intervention will promote improved program accessibility, completion, and post-completion employment. These outcomes are summarized below
Accessibility:
Relative to historical comparisons, participants were very similar in terms of race and gender.
67% of participants were incumbent workers; 36% were Pell-eligible. These data were not available for comparison groups.
Capacity of programs increased as demonstrated by increased enrollment over the course of the grant.
Program Completion:
23% of grant participants completed relative to 15% for historical comparisons.
This slightly higher completion rate for participants relative to historical comparisons is true in all grant-affected programs.
Post-completion Employment:
Of the 39 completers, 32 were unemployed at the outset, then became employed after program completion (82%). 15 completers were incumbent workers.
Of the 90 participants that were incumbent workers, 35 reported a wage increase following enrollment in the program.

Multi-State Advanced Manufacturing Consortium TAACCCT Round II Grant – FINAL EVALUATION REPORT 101
Tennessee College of Applied Technology at Murfreesboro (TTC-Murfreesboro)
The participant group for TTC-Murfreesboro includes two program stacks (Industrial Electrical Maintenance and Machine Tool Technology), and five short-term supplemental certificates (see table below). Overlap occurs between the Industrial Electrical Maintenance and Machine Tool Technology students. For example, many students declare one program, yet take coursework in the other program. Because of this overlap, the two program groups have been combined into one cohesive participant group for the purpose of the evaluation. A historical comparison group was selected consisting of students who were enrolled in, or taking coursework in, the Industrial Electrical Maintenance and Machine Tool Technology programs starting three years prior to the usage of grant funds. Data collected for the Fall 2012 semester through the Spring 2016 semester are for grant-affected students, and data collected for the Fall 2009 semester through Summer 2012 semester are for students in the historical comparison group.
Table 87: Grant-Affected and Comparison Programs, TTC-Murfreesboro
Program Certificate Comparison
Industrial Electrical Maintenance
Electrician Helper Certificate (432 hours)
Maintenance Apprentice Certificate (864 hours)
Electrical Repairer Diploma (1296 hours)
Industrial Maintenance Technician Diploma (1728 hours)
Mechatronics Technician Diploma (2160 hours)
Historical
Machine Tool Technology
Production Machine Operator Certificate (432 hours)
Machine Set-Up Operator Certificate (864 hours)
General Machinist Diploma (1296 hours)
Machinist I Diploma (1728 hours)
Historical
Supplemental Certificates
Electric Motor Control Certificate (78 hours)
Machine Shop I Certificate (78 hours)
PLC Certificate (56 hours)
Welding I Certificate (78 hours)
Welding II Certificate (78 hours)
Historical

Multi-State Advanced Manufacturing Consortium TAACCCT Round II Grant – FINAL EVALUATION REPORT 102
The table below shows the number of students enrolled in grant-affected programs for each year of the grant.
Table 88: TTC-Murfreesboro Enrollment over Time
Year 1 Year 2 Year 3 Year 4
Total Number of Individuals 116 157 142 131
The tables below provide details on the total number of individuals included in the analysis along with demographic characteristics. This information is provided for the college overall, and for each of its grant-affected programs, if appropriate. Additionally, data on outcomes is listed including program completions, credentials earned, credit hours completed, employed after program completion (if available), job retention three quarters after completion, incumbent worker completion, and incumbent worker wage increases (if available). Data is presented in terms of counts and rates where it makes sense.
As described in the section of the report called Efforts to Obtain State Quarterly Earnings Records, efforts to obtain state administrative records on employment and earnings were unsuccessful in Alabama, Michigan, Texas, Illinois, and Tennessee. In states where administrative data was not obtained, colleges attempted to personally contact all participants who had completed a program.
Program groups were identified using the program completed by the student, followed by the program of study identified in the PIF, followed by the declared program specified in the OG. Not all students were able to be grouped into a program group, due to lack of information available.
Table 89: TTC-Murfreesboro Demographics and Outcomes
Variable Participant
Group
Participant
Group N
Comparison
Group
Comparison
Group N
Total Number of Individuals 451 451 360 360
Demographics
Age 31.1 ± 10.6 450 33.6 ± 12.6 360
Female 19 (4%) 451 14 (4%) 360
White 384 (87%) 443 300 (85%) 355
Black 37 (8%) 443 39 (11%) 355
Other/More than One Race 22 (5%) 443 16 (5%) 355
Hispanic/Latino 9 (2%) 451 2 (1%) 347
Full-Time 134 (30%) 451 NA NA
Part-Time 317 (70%) 451 NA NA
Incumbent Worker 26 (6%) 451 2 (1%) 360
Eligible Veteran NA (NA%) 451 1 (0%) 360
Disabled 3 (1%) 451 5 (1%) 360
Pell Eligible 68 (15%) 451 25 (7%) 360
TAA Eligible NA NA NA NA
Outcomes
Program Completers 156 (35%) 451 134 (37%) 360
Credentials Earned 188 451 139 360
Students Earning Certificates (<=1 year) 71 (16%) 451 32 (9%) 360
Students Earning Certificates (>1 year) 90 (20%) 451 105 (29%) 360
Students Earning Degrees 0 (0%) 451 0 (0%) 360
Credit Hours Completed 6876 451 6829 360
Employed After Program of Study Completion 17 (13%) 132 NA 132
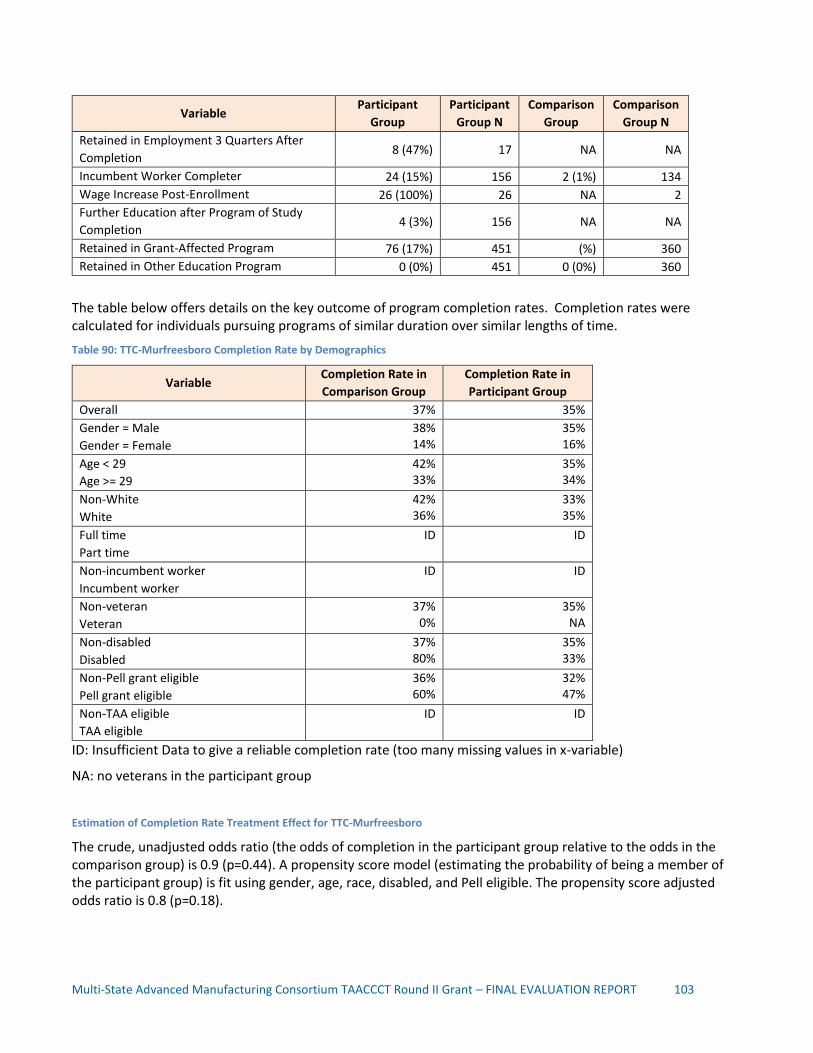
Multi-State Advanced Manufacturing Consortium TAACCCT Round II Grant – FINAL EVALUATION REPORT 103
Variable Participant
Group
Participant
Group N
Comparison
Group
Comparison
Group N
Retained in Employment 3 Quarters After
Completion 8 (47%) 17 NA NA
Incumbent Worker Completer 24 (15%) 156 2 (1%) 134
Wage Increase Post-Enrollment 26 (100%) 26 NA 2
Further Education after Program of Study
Completion 4 (3%) 156 NA NA
Retained in Grant-Affected Program 76 (17%) 451 (%) 360
Retained in Other Education Program 0 (0%) 451 0 (0%) 360
The table below offers details on the key outcome of program completion rates. Completion rates were calculated for individuals pursuing programs of similar duration over similar lengths of time.
Table 90: TTC-Murfreesboro Completion Rate by Demographics
Variable Completion Rate in
Comparison Group
Completion Rate in
Participant Group
Overall 37% 35%
Gender = Male
Gender = Female
38% 14%
35% 16%
Age < 29
Age >= 29
42% 33%
35% 34%
Non-White
White
42% 36%
33% 35%
Full time
Part time
ID ID
Non-incumbent worker
Incumbent worker
ID ID
Non-veteran
Veteran
37% 0%
35% NA
Non-disabled
Disabled
37% 80%
35% 33%
Non-Pell grant eligible
Pell grant eligible
36% 60%
32% 47%
Non-TAA eligible
TAA eligible
ID ID
ID: Insufficient Data to give a reliable completion rate (too many missing values in x-variable)
NA: no veterans in the participant group
Estimation of Completion Rate Treatment Effect for TTC-Murfreesboro
The crude, unadjusted odds ratio (the odds of completion in the participant group relative to the odds in the comparison group) is 0.9 (p=0.44). A propensity score model (estimating the probability of being a member of the participant group) is fit using gender, age, race, disabled, and Pell eligible. The propensity score adjusted odds ratio is 0.8 (p=0.18).

Multi-State Advanced Manufacturing Consortium TAACCCT Round II Grant – FINAL EVALUATION REPORT 104
Table 91: TTC-Murfreesboro IEM
Variable Participant
Group
Participant
Group N
Comparison
Group
Comparison
Group N
Total Number of Individuals 319 319 291 291
Demographics
Age 31.1 ± 10.5 319 34.4 ± 12.7 291
Female 14 (4%) 319 10 (3%) 291
White 268 (86%) 313 241 (84%) 286
Black 29 (9%) 313 34 (12%) 286
Other/More than One Race 16 (5%) 313 11 (4%) 286
Hispanic/Latino 7 (2%) 319 2 (1%) 278
Full-Time 99 (31%) 319 NA NA
Part-Time 220 (69%) 319 NA NA
Incumbent Worker 25 (8%) 319 2 (1%) 291
Eligible Veteran 0 (0%) 319 1 (0%) 291
Disabled 3 (1%) 319 3 (1%) 291
Pell Eligible 49 (15%) 319 14 (5%) 291
TAA Eligible NA NA NA NA
Outcomes
Program Completers 86 (27%) 319 94 (32%) 291
Credentials Earned 97 319 98 291
Students Earning Certificates (<=1 year) 13 (4%) 319 24 (8%) 291
Students Earning Certificates (>1 year) 74 (23%) 319 72 (25%) 291
Students Earning Degrees 0 (0%) 319 0 (0%) 291
Credit Hours Completed 5549 319 4405 291
Employed After Program of Study Completion 12 (19%) 63 NA 94
Retained in Employment 3 Quarters After
Completion 5 (42%) 12 NA NA
Incumbent Worker Completer 23 (27%) 86 0 (0%) 94
Wage Increase Post-Enrollment 24 (96%) 25 NA 6
Further Education after Program of Study
Completion 1 (1%) 86 NA NA
Retained in Grant-Affected Program 74 (23%) 319 50 (17%) 291
Retained in Other Education Program 0 (0%) 319 0 (0%) 291
The table below offers details on the key outcome of program completion rates. Completion rates were calculated for individuals pursuing programs of similar duration over similar lengths of time.
Table 92: TTC-Murfreesboro Completion Rate by Demographics for IEM
Variable Completion Rate in
Comparison Group
Completion Rate in
Participant Group
Overall 32% 27%
Gender = Male
Gender = Female
33% 10%
28% 7%
Age < 30
Age >= 30
39% 26%
29% 25%
Non-White 38% 25%

Multi-State Advanced Manufacturing Consortium TAACCCT Round II Grant – FINAL EVALUATION REPORT 105
Variable Completion Rate in
Comparison Group
Completion Rate in
Participant Group
White 31% 27%
Full time
Part time
ID ID
Non-incumbent worker
Incumbent worker
ID ID
Non-veteran
Veteran
32% 0%
27% NA
Non-disabled
Disabled
32% 100%
27% 33%
Non-Pell grant eligible
Pell grant eligible
31% 64%
23% 51%
Non-TAA eligible
TAA eligible
ID ID
ID: Insufficient Data to give a reliable completion rate (too many missing values in x-variable)
NA: no veterans in the participant group
Estimation of Completion Rate Treatment Effect for TTC-Murfreesboro IEM
The crude, unadjusted odds ratio (the odds of completion in the participant group relative to the odds in the comparison group) is 0.8 (p=0.15). A propensity score model (estimating the probability of being a member of the participant group) is fit using gender, age, race, disabled, and Pell eligible. The propensity score adjusted odds ratio is 0.6 (p=0.01).
Table 93: TTC-Murfreesboro Machine Tool
Variable Participant
Group
Participant
Group N
Comparison
Group
Comparison
Group N
Total Number of Individuals 42 42 58 58
Demographics
Age 25.5 ± 8.7 41 29.0 ± 11.3 58
Female 2 (5%) 42 3 (5%) 58
White 34 (85%) 40 49 (84%) 58
Black 0 (0%) 40 4 (7%) 58
Other/More than One Race 6 (15%) 40 5 (9%) 58
Hispanic/Latino 2 (5%) 42 0 (0%) 58
Full-Time 36 (86%) 42 NA NA
Part-Time 6 (14%) 42 NA NA
Incumbent Worker 1 (2%) 42 0 (0%) 58
Eligible Veteran 0 (0%) 42 0 (0%) 58
Disabled 0 (0%) 42 1 (2%) 58
Pell Eligible 20 (48%) 42 9 (16%) 58
TAA Eligible NA NA NA NA
Outcomes
Program Completers 22 (52%) 42 40 (69%) 58
Credentials Earned 27 42 41 58

Multi-State Advanced Manufacturing Consortium TAACCCT Round II Grant – FINAL EVALUATION REPORT 106
Variable Participant
Group
Participant
Group N
Comparison
Group
Comparison
Group N
Students Earning Certificates (<=1 year) 7 (17%) 42 8 (14%) 58
Students Earning Certificates (>1 year) 17 (40%) 42 33 (57%) 58
Students Earning Degrees 0 (0%) 42 0 (0%) 58
Credit Hours Completed 1005 42 2261 58
Employed After Program of Study Completion 2 (10%) 21 NA 40
Retained in Employment 3 Quarters After
Completion 1 (50%) 2 NA NA
Incumbent Worker Completer 1 (5%) 22 0 (0%) 40
Wage Increase Post-Enrollment 1 (100%) 1 NA NA
Further Education after Program of Study
Completion 0 (0%) 22 NA NA
Retained in Grant-Affected Program 18 (43%) 42 (%) 58
Retained in Other Education Program 0 (0%) 42 0 (0%) 58
The table below offers details on the key outcome of program completion rates. Completion rates were calculated for individuals pursuing programs of similar duration over similar lengths of time.
Table 94: TTC-Murfreesboro Completion Rate by Demographics for Machine Tool
Variable Completion Rate in
Comparison Group
Completion Rate in
Participant Group
Overall 69% 52%
Gender = Male
Gender = Female
71% 33%
55% 0%
Age < 23
Age >= 23
50% 84%
43% 67%
Non-White
White
67% 69%
50% 53%
Full time
Part time
ID ID
Non-incumbent worker
Incumbent worker
ID ID
Non-veteran
Veteran
69% NA
52% NA
Non-disabled
Disabled
68% 100%
52% NA
Non-Pell grant eligible
Pell grant eligible
69% 67%
55% 50%
Non-TAA eligible
TAA eligible
ID ID
ID: Insufficient Data to give a reliable completion rate (too many missing values in x-variable)
Estimation of Completion Rate Treatment Effect for TTC-Murfreesboro Machine Tool
The crude, unadjusted odds ratio (the odds of completion in the participant group relative to the odds in the comparison group) is 0.5 (p=0.09). A propensity score model (estimating the probability of being a member of

Multi-State Advanced Manufacturing Consortium TAACCCT Round II Grant – FINAL EVALUATION REPORT 107
the participant group) is fit using gender, age, race, and Pell eligible. The propensity score adjusted odds ratio is 0.6 (p=0.28).
Table 95: TTC-Murfreesboro Welding I
Variable Participant
Group
Participant
Group N
Total Number of Individuals 30 30
Demographics
Age 29.9 ± 9.9 30
Female 1 (3%) 30
White 26 (90%) 29
Black 3 (10%) 29
Other/More than One Race 0 (0%) 29
Hispanic/Latino 1 (3%) 30
Full-Time 0 (0%) 30
Part-Time 30 (100%) 30
Incumbent Worker 0 (0%) 30
Eligible Veteran 0 (0%) 30
Disabled 0 (0%) 30
Pell Eligible 0 (0%) 30
TAA Eligible NA NA
Outcomes
Program Completers 30 (100%) 30
Credentials Earned 30 30
Students Earning Certificates (<=1 year) 30 (100%) 30
Students Earning Certificates (>1 year) 0 (0%) 30
Students Earning Degrees 0 (0%) 30
Credit Hours Completed 83 30
Employed After Program of Study Completion 0 (0%) 30
Retained in Employment 3 Quarters After
Completion NA 0
Incumbent Worker Completer 0 (0%) 30
Wage Increase Post-Enrollment NA NA
Further Education after Program of Study
Completion 0 (0%) 30
Retained in Grant-Affected Program 0 (0%) 30
Retained in Other Education Program 0 (0%) 30
Table 96: TTC-Murfreesboro Welding II
Variable Participant
Group
Participant
Group N
Comparison
Group
Comparison
Group N
Total Number of Individuals 19 19 1 1
Demographics
Age 34.2 ± 12.6 19 48.3 ± 0 1
Female 1 (5%) 19 1 (100%) 1

Multi-State Advanced Manufacturing Consortium TAACCCT Round II Grant – FINAL EVALUATION REPORT 108
Variable Participant
Group
Participant
Group N
Comparison
Group
Comparison
Group N
White 17 (94%) 18 1 (100%) 1
Black 1 (6%) 18 0 (0%) 1
Other/More than One Race 0 (0%) 18 0 (0%) 1
Hispanic/Latino 1 (5%) 19 0 (0%) 1
Full-Time 0 (0%) 19 NA NA
Part-Time 19 (100%) 19 NA NA
Incumbent Worker 1 (5%) 19 0 (0%) 1
Eligible Veteran 0 (0%) 19 0 (0%) 1
Disabled 0 (0%) 19 0 (0%) 1
Pell Eligible 0 (0%) 19 0 (0%) 1
TAA Eligible NA NA NA NA
Outcomes
Program Completers 19 (100%) 19 0 (0%) 1
Credentials Earned 20 19 0 1
Students Earning Certificates (<=1 year) 19 (100%) 19 0 (0%) 1
Students Earning Certificates (>1 year) 0 (0%) 19 0 (0%) 1
Students Earning Degrees 0 (0%) 19 0 (0%) 1
Credit Hours Completed 113 19 10 1
Employed After Program of Study Completion 1 (6%) 18 NA 0
Retained in Employment 3 Quarters After
Completion 1 (100%) 1 NA NA
Incumbent Worker Completer 1 (5%) 19 NA 0
Wage Increase Post-Enrollment 1 (100%) 1 NA NA
Further Education after Program of Study
Completion 1 (5%) 19 NA NA
Retained in Grant-Affected Program 0 (0%) 19 1 (100%) 1
Retained in Other Education Program 0 (0%) 19 0 (0%) 1
Table 97: TTC-Murfreesboro Machine Shop I
Variable Participant
Group
Participant
Group N
Total Number of Individuals 10 10
Demographics
Age 36.7 ± 9.2 10
Female 0 (0%) 10
White 9 (90%) 10
Black 1 (10%) 10
Other/More than One Race 0 (0%) 10
Hispanic/Latino 0 (0%) 10
Full-Time 0 (0%) 10
Part-Time 10 (100%) 10
Incumbent Worker 0 (0%) 10
Eligible Veteran 0 (0%) 10
Disabled 0 (0%) 10
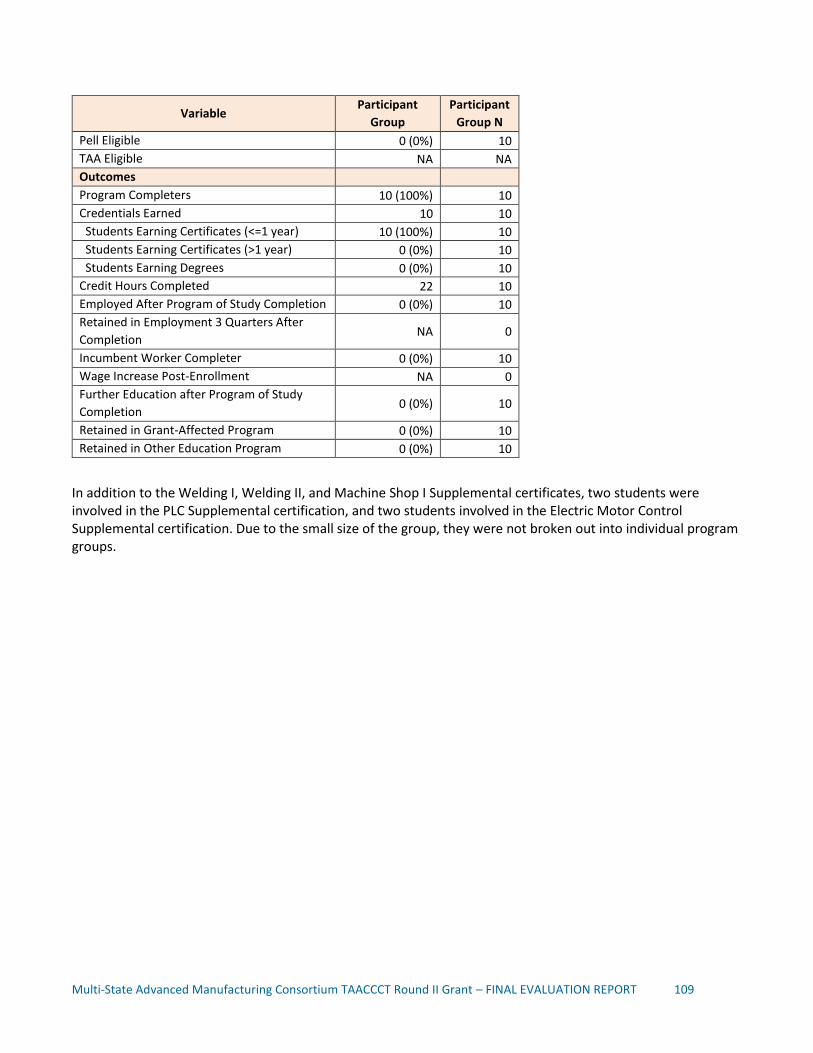
Multi-State Advanced Manufacturing Consortium TAACCCT Round II Grant – FINAL EVALUATION REPORT 109
Variable Participant
Group
Participant
Group N
Pell Eligible 0 (0%) 10
TAA Eligible NA NA
Outcomes
Program Completers 10 (100%) 10
Credentials Earned 10 10
Students Earning Certificates (<=1 year) 10 (100%) 10
Students Earning Certificates (>1 year) 0 (0%) 10
Students Earning Degrees 0 (0%) 10
Credit Hours Completed 22 10
Employed After Program of Study Completion 0 (0%) 10
Retained in Employment 3 Quarters After
Completion NA 0
Incumbent Worker Completer 0 (0%) 10
Wage Increase Post-Enrollment NA 0
Further Education after Program of Study
Completion 0 (0%) 10
Retained in Grant-Affected Program 0 (0%) 10
Retained in Other Education Program 0 (0%) 10
In addition to the Welding I, Welding II, and Machine Shop I Supplemental certificates, two students were involved in the PLC Supplemental certification, and two students involved in the Electric Motor Control Supplemental certification. Due to the small size of the group, they were not broken out into individual program groups.
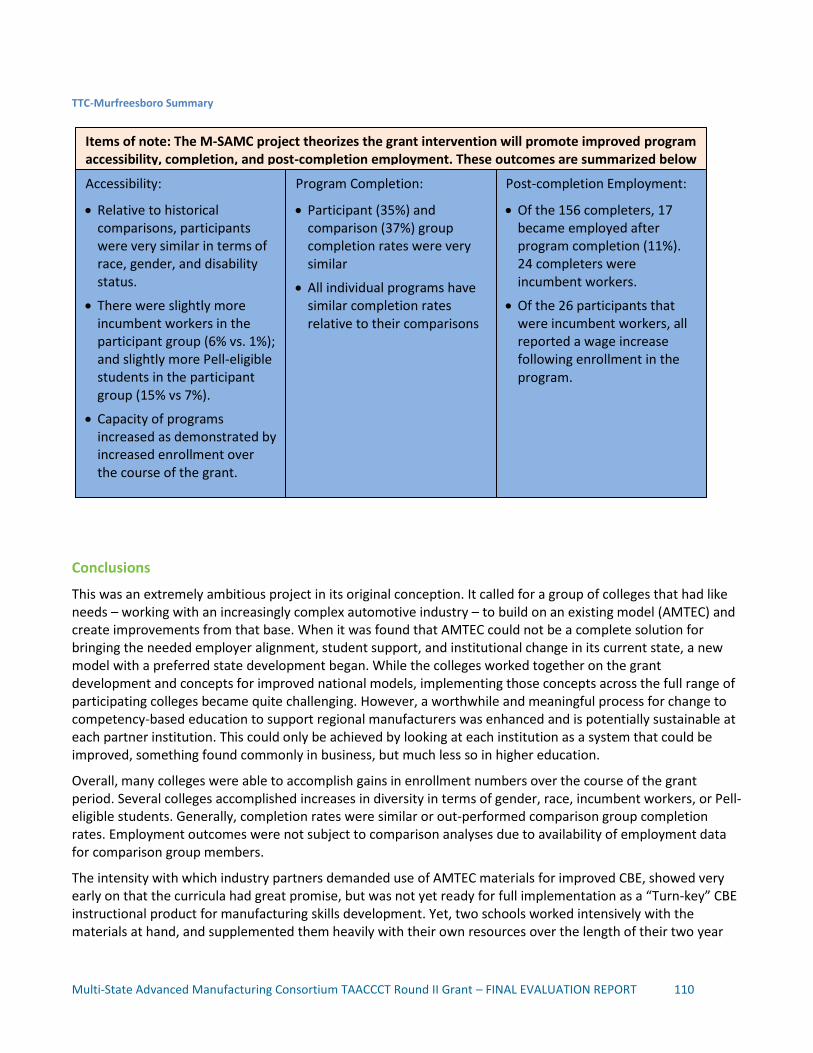
Multi-State Advanced Manufacturing Consortium TAACCCT Round II Grant – FINAL EVALUATION REPORT 110
TTC-Murfreesboro Summary
Conclusions
This was an extremely ambitious project in its original conception. It called for a group of colleges that had like needs – working with an increasingly complex automotive industry – to build on an existing model (AMTEC) and create improvements from that base. When it was found that AMTEC could not be a complete solution for bringing the needed employer alignment, student support, and institutional change in its current state, a new model with a preferred state development began. While the colleges worked together on the grant development and concepts for improved national models, implementing those concepts across the full range of participating colleges became quite challenging. However, a worthwhile and meaningful process for change to competency-based education to support regional manufacturers was enhanced and is potentially sustainable at each partner institution. This could only be achieved by looking at each institution as a system that could be improved, something found commonly in business, but much less so in higher education.
Overall, many colleges were able to accomplish gains in enrollment numbers over the course of the grant period. Several colleges accomplished increases in diversity in terms of gender, race, incumbent workers, or Pell-eligible students. Generally, completion rates were similar or out-performed comparison group completion rates. Employment outcomes were not subject to comparison analyses due to availability of employment data for comparison group members.
The intensity with which industry partners demanded use of AMTEC materials for improved CBE, showed very early on that the curricula had great promise, but was not yet ready for full implementation as a “Turn-key” CBE instructional product for manufacturing skills development. Yet, two schools worked intensively with the materials at hand, and supplemented them heavily with their own resources over the length of their two year
Items of note: The M-SAMC project theorizes the grant intervention will promote improved program accessibility, completion, and post-completion employment. These outcomes are summarized below
Accessibility:
Relative to historical comparisons, participants were very similar in terms of race, gender, and disability status.
There were slightly more incumbent workers in the participant group (6% vs. 1%); and slightly more Pell-eligible students in the participant group (15% vs 7%).
Capacity of programs increased as demonstrated by increased enrollment over the course of the grant.
Program Completion:
Participant (35%) and comparison (37%) group completion rates were very similar
All individual programs have similar completion rates relative to their comparisons
Post-completion Employment:
Of the 156 completers, 17 became employed after program completion (11%). 24 completers were incumbent workers.
Of the 26 participants that were incumbent workers, all reported a wage increase following enrollment in the program.

Multi-State Advanced Manufacturing Consortium TAACCCT Round II Grant – FINAL EVALUATION REPORT 111
programs. The pilots at these schools were small (approximately 30 students in each) but significant in that they afforded a “research” opportunity concerning full implementation of the AMTEC tools. These helped to codify the very high value of the simulators, the assessment rubrics, portions of curricula, and the skills focused modular design and delivery of courses and program elements recognized in industry through AMTEC’s creation and M-SAMC’s implementation. Industry level simulators in the college lab changes industry expectations and colleges’ capacity fundamentally.
Meanwhile, the push to increase enrollments came long before the consortium had time to develop its new strategies, refine them, and move to large scale implementation. The Performance Based Objectives (PBO) process, as a new defining tool for CBE, is still evolving. It has great potential within manufacturing and in unrelated fields. For example, there is work underway to utilize the PBO concept of applied skills descriptions to the area of how history learning outcomes are understood by faculty, students and community/employers. Also the National Association of Workforce Boards is looking at training workforce agency personnel in the use of PBOs as a new service to manufacturing employers in multiple manufacturing regions. That work and other elements are continuing using non-grant funds.
Sustainability is evident. In Michigan plans are in place for the Southeast Michigan-based Advance Michigan Center for Apprenticeship Innovation (AMCAI), of which two M-SAMC partners are members, to leverage M-SAMC’s PBO tools as the building blocks for registered apprenticeships, improving the alignment of employer needs with student skills. This project, funded by the American Apprenticeship Initiative through DOL, will help sustain and grow the innovation investment in this TAACCCT grant. In addition, the bar for CBE in advanced technological education in manufacturing is being raised in all 10 partner States, in part due to the M-SAMC examples, work and resources.
CBE in an Open lab environment was piloted and systematized in this TAACCCT grant. As a result, colleges in the M-SAMC, as well as those from other regions nationally, are convening to share “best practices” in Open lab, skills focused educational delivery models. This will continue to link innovative efforts in new CBE instruction and education nationally.
The PBO process, as noted above, is a major grant outcome. PBOs were an outgrowth of better processes to define CBE skills in partnership with local employers. PBOs are gaining recognition as easily understood and applied to translate industry needs into an educational environment. As on-going post-grant work, CREC is building a tool, “Skills Data”, to align skills targets with instruction. Research is underway to sustain this tool and its development. PBOs need more time to mature but they appear to be a very promising model.

Multi-State Advanced Manufacturing Consortium TAACCCT Round II Grant – FINAL EVALUATION REPORT 112
Appendices
Year One Evaluation Summary
Consortium-Wide Findings and Themes
Implementation Outlook A common theme about implementation focused on timing and expectations. Colleges noted that they had originally envisioned a common implementation plan with a shared timeline that would largely result in all colleges moving in “lock step” together, but they now feel that in reality this uniform implementation is not likely to happen across the consortium. In general, at this point in implementation, the colleges report viewing the overall grant timeline (on the national consortium level) as a guide or gauge for reasonable implementation expectations at the local level. They noted that each school is implementing on a different schedule based on their own strengths, policies, schedules, and priorities. As one interviewee noted, “We have to stick to the timeline as best we can, but ultimately we can’t do everything at the same time and in the same way as the other colleges.” Another reflected that “we are doing what is needed at our school within this area, which will likely help to craft the national agenda.”
Mechanics of Collaboration The colleges are still figuring out how to best contribute to and gain from the national consortium. They are all interested in learning about and sharing relevant models, materials, etc. – but struggle to know just how best to engage in order to both share and find the needed information. One interviewee complained that “we've been in this for a year, and are still sort of groping in the dark one year later.” Another noted that “we are trying to formulate the [best] working mechanism to contribute to the national consortium.”
Overall, a number of colleges spoke to both challenges and opportunities related to collaboration among the consortium.
National template. Colleges reported finding the national template to be “too complicated” and “academic,” calling it overwhelming to read - much less to implement fully. The Smartsheet as a tool gets mixed reviews, for a variety of reasons. Interviewees take issue with the fact that there is not a validation or approval process of what colleges contribute to the Smartsheet. Additionally, the language and descriptions are not meaningful or accessible to everyone. As one respondent noted, "admittedly, some of the topics in the SmartSheet -- I don't even know what its saying. It's worded in bureaucratic language. What do you actually want? What are the goals for us by the summer, etc.?"
Communication Colleges wanted to see the number of meetings streamlined, as well as simplification of the technology used for meetings and communication about consortium activities. They felt that too much time has been spent trying to figure out who is on each call, how to use technology for the calls, who else should be on calls, what is to be covered, etc. Respondents reflected that knowing what everyone is doing and responsible for is dependent on the team leaders, and some do better than others at communication. They also worried that there will be challenges among Innovation Teams because of overlap of the Teams’ priorities, making communication all the more critical. As one interviewee noted, “Somewhere in here there has to be a decision tree.”
Progress That said, most colleges also noted that the speed and efficiency with which the project is being implemented appears to be picking up. They all indicated that it had been a slow start (with many noting that this is par for the course with such a large and widespread consortium) but indicated that they saw improvements and felt

Multi-State Advanced Manufacturing Consortium TAACCCT Round II Grant – FINAL EVALUATION REPORT 113
that the pace of implementation was definitely increasing. It seemed that the overall feeling of the consortium is that they are getting into their stride.
Application of AMTEC model Many or most colleges appear to be approaching the AMTEC curriculum as an adjunct or supplement to what they already have in place – not wholesale implementation. The degree to which they each intend to fully implement the AMTEC curriculum appears somewhat in question, though some noted an intention to ensure their learning outcomes cover “at least” what is covered by AMTEC and/or to implement specific modules that they feel are missing in their current offerings. Generally speaking, AMTEC appears to be treated as a model or guide, as opposed to a specific and pre-existing curriculum to implement wholly at each campus. One interviewee noted that, “we use AMTEC mostly as a supplement. AMTEC is not yet finished, not competency-based yet.” Some colleges reported that AMATROL provides them with better tools to prepare students online for what they will do in classroom than AMTEC.
Campus-Based and Administrative Issues The consortium colleges are also figuring out how to balance focus on the national innovation team work with operationalizing the grant’s aims at the individual college level. A few are experiencing difficulty with implementation broadly. Most are experiencing issues in particular areas.
Buy-in. Nearly all colleges noted that achieving faculty (and beyond) buy-in for the new curricula and delivery methods is very challenging. They talked about the “sage on the stage” model, and that faculty who have been teaching a certain way for many years may be loath to radically change the manner in which they deliver materials. In particular, the changes to online delivery can be difficult for faculty – used to lecture as the primary teaching tool – to support. Implementation Facilitators often feel that they are the primary voice of support for these new methods, and struggle to win over the trust and willingness of their instructor colleagues. Additionally, many colleges reported at best delays and in some cases, great difficulty with getting buy-in from administrators who would need to approve changes to curricula and schedules before full implementation could occur.
Professional development
With regard to professional development, member colleges are also encountering challenges engaging and appropriately training faculty, especially given that many are working with a limited number of instructors. Some member colleges felt that it is very difficult to “take them out of the classroom and send to seminars [and] would rather pay for a week or days, compensate them and pay for seminar during the semester breaks, when they are not teaching.” Other colleges noted that most, and in a few cases, all of their faculty are also teaching or are otherwise employed elsewhere so scheduling additional time for professional development proves nearly impossible. A faculty interviewee who functions as the only instructor for a member college’s program noted that only webinars were accessible because travel or time off-campus “is almost impossible.”
Adjuncts
With so many of the faculty positions that teach these curricula filled by adjuncts, it can very difficult for the colleges to fully engage the instructors in professional development and/or overall planning efforts. In some cases, the adjuncts are seen as being a positive factor in implementation, as they might be more eager and “hungry” for new approaches and technology. In other situations, the adjunct positions can be a detriment to implementation because they do not have the time, resources (or, perhaps, commitment to the school and its transformation goals) to fully engage in the planning needed to implement curricula and delivery changes. Further, as noted above, colleges indicated that it can be very challenging for all instructors, but in particular for adjuncts, to travel to offsite professional development opportunities.

Multi-State Advanced Manufacturing Consortium TAACCCT Round II Grant – FINAL EVALUATION REPORT 114
Workforce vs. academic ideology
Most of the Implementation Facilitators approach their positions from a workforce development mindset and usually are positioned in the workforce development department in their schools. Some of the colleges noted a “culture clash” between their view of needed learning outcomes (relevancy to the labor market, validation by industry, credentials based on competencies, etc.) and the traditional academic view of needed learning outcomes. This clash seems likely to only exacerbate the “buy-in” issue noted above, further preventing whole-hearted implementation - or even enthusiastic piloting - of new curricula and delivery efforts.
“One man shows”
Many Implementation Facilitators feel they are working uphill at their campuses to implement the new curricula and delivery methods. A few colleges are limited to the Implementation Facilitator as the project staff person. This is largely because of limited resources and/or the buy-in issues noted above. They are the sole “owners” of the strategies and struggle to sufficiently champion and implement the models simultaneously. Many feel this as an obstacle to their implementation of the grant, and a substantial burden in addition to their other responsibilities on campus.
Reflections on External Engagement Not surprisingly, a number of respondents shared particularly salient impressions on the engagement of external actors (evaluators, industry/employers and other partners.)
Resistance/disinterest in evaluation. Not everyone is particularly committed to collecting and reporting outcomes data. While a few member colleges expressed no concerns about evaluation because they already collect and report a fair amount of data due to involvement in previous rounds of TAACCCT or other DOL and NSF grants, some colleges expressed serious concerns about their capacity to actively participate in data sharing and reporting activities. One Implementation Facilitator noted that "there are elements of the grant that I feel are "fringe" that take a fair amount of doing and are grant requirements, but don't add value to the programs and offerings. For example - the data collection. As the Facilitator, while I'm responsible for that aspect, I'm not interested in it. I'm interested in actually developing the programs and getting things squared away.” Further, some colleges are anticipating a fair amount of resistance on their campus to some of the data collection goals.
Employers and industry
Most member colleges reported success in either creating or enhancing productive relationships with local and national employer and industry partners. Consensus among member colleges seems to be that use of the AMTEC curriculum, though challenging for many, will ultimately better align student competencies with industry needs. However, one Implementation Facilitator noted difficulty “selling education to employers,” asking “[w]hat is the true value of an employee to the employer?” With regard to college-employer relationships, Facilitators reported feeling that they need to (1) better understand the skill levels and knowledge that employers are looking for, (2) learn more about the assessment processes that employers are using, and (3) solidify relationships with employers in order to measure placement and retention.
Opportunities/Recommendations for Continuous Improvement As noted above, the themes reported present unique opportunities for the consortium to both reflect on the progress to date and explore methods to most appropriately and effectively respond. With regard to progress, the member colleges expressed confidence in the project going forward. In addition to creating space and opportunity to (re)define technical and competency-based education and focus on grant priorities, one facilitator summarized that progress to date could best be observed as “[employers] are extremely interested in working with education, and education is listening and steps are being taken to identify the specific skills needed and fit with educational structures (or restructure education to meet these needs).”

Multi-State Advanced Manufacturing Consortium TAACCCT Round II Grant – FINAL EVALUATION REPORT 115
Nearly all of the Facilitators said that the past year of work with the grant and consortium had indeed created real prospects for meaningful change at their individual institutions, though this change is yet to be realized fully. As such, a few specific areas for improvement emerged from the interviews.
1. Leverage progress with enhanced collaboration
As implementation proceeds, the project should invest time and resources in opportunities to collaboratively frame future planning, proactively address challenges, and potentially increase efficiencies. Though seemingly time-consuming and somewhat initially confusing, a well-developed and operational infrastructure has been created to support collaborative activities. Consistently and coherently applying these or other technologies, extant communication tools, and the forthcoming project management consultants could effectively enhance the success of project activities.
2. Clarify expectations
While the leadership and overall focus for each Innovation Team has been defined, there remain areas of potential overlap and confusion. Further, many colleges struggled to describe plans for and/or coherently relate their own institution’s efforts with those of the Innovation Teams. Developing separate, coherent plans of action for each Innovation Team, with manageable deliverables and a clear timeline per academic year, academic semester (or other timing as appropriate) would enhance the effectiveness of this structure.
3. Develop coherent implementation support structures in alignment with expectations
A resounding theme from the Facilitator interviews centered on issues with both communication and project management. As the project leadership plans to actively focus on refining project management resources and tools during the next quarter, these issues will likely be addressed. Nevertheless, nearly all of the consortia member colleges reported significant interest in working with and learning from other colleges; many consider the latter to be essential for their individual colleges’ success. The project management resources developed should give some attention to documenting and sharing best practices and lessons learned, particularly those learned by consortia members who have successfully implemented new curricula, recruited and enrolled student cohorts, engaged and trained faculty, or addressed challenges with their institutions’ administrative structures.
Implementation support structures should include:
Communication and coordination of consortium resources. Use the developed consortium infrastructure to ensure sufficient support is in place to help colleges meet the Innovation Teams’ expectations. As noted above, colleges described being eager for the opportunity to share their models, tools, curricula and approaches but did not see a clear way to do so. They also reported equal or greater need for access to other colleges’ materials, advice and models. Identification of such needs and timely sharing of related resources could be a central function of the Innovation Teams, and at least should become part and parcel of the communication infrastructure and project management approach. Ideally, each institution need not develop its own models, tools, materials, documents, etc.
Support for college-level “case-making”. Help Implementation Facilitators to build support within their institutions, both at the faculty and the executive/administrative levels, by developing marketing/educational materials aimed at these audiences. Use these materials, as well as the testimonials of credible champions, to more effectively describe and make the case for the M-SAMC consortium goals and efforts, and to build momentum beyond the life of the grant.
Identification of effective coaches and advisors with relevant experience. As the consortium colleges develop and implement the new curricula and delivery models, questions and obstacles will naturally arise. Especially in colleges with limited internal support for the new approaches, such obstacles could easily threaten progress without identified resources to help. A cadre of individuals who have relevant experience and credible expertise

Multi-State Advanced Manufacturing Consortium TAACCCT Round II Grant – FINAL EVALUATION REPORT 116
should be identified and “on tap” to work with each individual college as needed on their implementation issues. This should go beyond more general professional development to help Implementation Facilitators work through the unique issues at their campus. These coaches or advisors should be educated about the overall goals of the grant implementation and prepared to work individually with each college in order to avoid requiring off campus travel for professional development.
Year Two Evaluation Summary
Consortium-Wide Findings and Themes
As noted in the Introduction, the consortium has centered its activities around a core set of stakeholder elements based on its definition of present and future states. As such, these stakeholder elements and present and future states formed the basis for the implementation evaluation.
At the start of each interview, the colleges responded to general questions about the status of implementation and any implementation challenges. Significant progress has been made toward a common understanding of the competency-based education model embodied by the stakeholder elements. However, some colleges have experienced major obstacles to enrolling students and as yet do not have any participants. (Note that participants are defined as students in (1) project-funded programs, (2) courses supported by faculty who have received professional development funded by the grant, or (3) courses using equipment purchased with grant funds.) In other cases in which students have been enrolled, participating students began their training in the fall of 2014. Even in the case of schools with participants already enrolled, the experience of students and faculty with the program has only just begun and thus there is scant information on effectiveness or impact. Nonetheless, all colleges are in some state of implementation on each of the stakeholder requirements, even if that state is “still planning”.
The following provides a summary of the general updates from colleges about implementation progress and challenges, with some specific examples included to illustrate common themes and findings.
Current State of Implementation
In the discussion of their “current state”, colleges were mainly asked to reflect on where they were with regards to student enrollment. Most colleges (ten of the thirteen participating schools) have enrolled students, leaving three who have not yet enrolled any students in project funded courses. A key reason cited for the lack of enrollment was the inability to hire instructors. The funding for instructors has been available, but the local college hiring processes have been cumbersome. For example, one college recognized they needed full-time instruction in order to be able to implement the new way of teaching and to provide the project with the faculty development and continuity that comes with dedicated staff. In this case, the obstacles to obtaining full-time staff have been significant. The human resource office had concerns about the liability it will assume with a full-time position, including unemployment insurance. Further, with the project located in the workforce division -- which only uses adjunct faculty -- a full-time instructor represents a significant shift. To manage this, the project leads met several times with the college president to ensure there was a full understanding of the project’s importance and the grant commitments. With the President’s intervention and support, implementation and student enrollment could move forward. While enrollment is now underway at that particular school, similar roadblocks to student enrollment existed in the other colleges.
There were also differing approaches to defining enrollment across schools. In a strict interpretation we would expect to find that enrollment meant not only having students, but that they were being taught using all the stakeholder elements. Some colleges have been teaching similar courses to those included in the project. These

Multi-State Advanced Manufacturing Consortium TAACCCT Round II Grant – FINAL EVALUATION REPORT 117
colleges have continued counting the students enrolled in those legacy courses as “in the project” while such things as facilities upgrades are taking place – for example, one consortia member noted working closely with a local plant where much of the instruction takes place on-site. The plant cannot accommodate the level of internet access needed by a cohort of students who are training online and thus needing significant bandwidth. A new training facility is being built but won’t be ready for another year or two. This has hampered full implementation of the new model envisioned by the consortium.
There are also variances in the size of the cohorts and when they started enrollments. A few colleges report good progress with enrollment -- about half of the participating colleges were able to start enrollments last year. In some cases of enrollment, the courses are underway but the program of study has not been approved by the college or state board as yet. For example, approval of a new program of study at one institution involves a three step process with each of three different entities being involved in a sequential process that takes months. Fortunately, those in the separate courses can be brought into the new program when it is finally approved without loss of credit, but the project cannot call their grant activities a “program” until the approval process is completed. Others reported similar challenges with their program approval process. They can get courses into motion fairly easily, but programs of study are hampered by a lengthy approval process.
The issues noted above demonstrate implementation variation among colleges that naturally arise when a set of partners operates in different states and under differing processes. There is also a notable distinction between what happens on the credit side of the colleges verses what happens on the non-credit workforce side. Courses and programs are much easier to develop and implement within the workforce divisions, but this eases comes with the challenge of then meeting the consortium objective to implement a uniform, credit-bearing program of study in advanced manufacturing.
Another complication impeding progress was noted by a consortia member who reported that they have everything in place for a certificate program -- instructor, space, simulator, and curriculum -- but do not have approval from USDOL on other equipment purchases and thus cannot start operations. They are planning on a January 2015 enrollment start for the certificate program. In the meantime, they have students in a bridge program that is developing basic skills but does not include the technical skills of an advanced manufacturing program.
Challenges
We asked colleges to discuss what challenges to implementation they are encountering. Some of those challenges are noted above, such as faculty hiring and equipment approval. Other challenges mentioned included insufficient funds to purchase all the equipment needed for this highly technical program, and finding instructors with the right skills to teach in the new environment and at the technical level expected of an advanced manufacturing program.
Further challenges relate to internal college issues. As one facilitator describes it, marketing is a barrier to acceptance and support of the program within the college structure. The consortium is working on centrally developed marketing materials that are expected to be helpful in moving their message. While still in the planning stages with enrollments targeted for January 2015, others report that getting faculty buy-in to the new approach to teaching has been difficult, as has developing the internal flexibility to teach in a new way. A similar challenge was noted with inculcating competency-based teaching in a faculty that has spent thirty years teaching based on “seat time”.
In some schools, activity has been underway longer, and as such the issues arise at a deeper level of program development. For example, some consortia members noted that pilots for blended learning have been difficult to make work just right. Though colleges are trying hard to develop a teaching approach that creates students who are self-directed, quality learners. Self-direction, by its very nature, requires freedom in completing tasks,

Multi-State Advanced Manufacturing Consortium TAACCCT Round II Grant – FINAL EVALUATION REPORT 118
while quality requires close oversight and often rejection of work products. In the new model students are expected to operate independently and strive for top grade production. The older paradigm of “just getting by in courses is enough” is a tough mindset to overcome.
We saw two additional (and not uncommon) dimensions of internal challenges emerge at a few institutions. In one instance, it was noted that faculty are resistant to changing their teaching methods and adapting to a new teaching model which is not the traditional set schedule of classes on specific days using the semester calendar. In another, students were ready to move into a new mode and employers were anxious to be part of the new dynamic, but faculty are resistant to the needed changes -- thus impeding the project’s ability to grow.
One college highlighted another challenge to the transformation envisioned through the project. They reported that the project is well on track with new models of teaching using new faculty to operate much differently from the rest of the college. However, they recognized that the intent of the grant is to change the whole college’s mentality, not just the project operation. Their challenge is a more advanced one than some others – how to use the project to create a new way for the entire college to deliver quality education. This shift may start with the general education courses required for students in the project, since these general education courses are taught in the traditional seat time mode. We interviewed a group of twenty students to get their feedback on the survey questions we wanted to ask. They volunteered that we had to look at those courses inside the project in a totally different light than the courses such as English, math, and physics, which were taught outside the project parameters. Inside the project, their advanced manufacturing courses were fully compliant with all aspects of the project design, while none of their required general education courses had changed from the traditional teaching model of seat and lecture time.
On a final note, one theme became an undercurrent of most of the discussions we had with all colleges -- there simply isn’t enough time to do it all. One college described their efforts to prepare for a gap analysis to determine how closely their project offerings matched industry demands. They were readying a process to get employer feedback on their computer literacy, integrated systems, welding, and mechanical tool operations offerings as those most important to their employer partners. As a critical and large task, it requires a substantial time commitment that they were grappling with how to fit into the ongoing grant implementation efforts.
Finally, more than one college mentioned the progress the consortium leadership has made in communications and clarity of purpose, expectations, targets, and timelines. While there is always room for further improvement, several pointed out substantial effort and responsiveness on the part of M-SAMC leadership.
Use of Labor Market Information
The M-SAMC consortium had recently engaged the Center for Regional Economic Competitiveness (CRER) to assist participating colleges in strengthening their understanding and use of Labor Market Information (LMI), and so the colleges were asked how they are now using LMI.
There was a wide range of responses to this question. Colleges which are working with one or two key employers in their projects rely primarily on the data they obtain directly from those employers about demand and needed skills. This was described as mostly an informal process that emerges from deep interaction with the employers on an ongoing basis. For these colleges and a handful of others, working directly with employers in their areas is the best means they see of knowing what is happening and what employers want. From the interviews, it was clear that these colleges make frequent visits to employers, have employers attend events, and seek their input formally and informally. It was described as a normal and natural part of doing business at the college. They saw that level of deep employer engagement as the only means they had of ensuring they were keeping up with emerging trends and employment cycles. In few of these cases was formal LMI resources mentioned.

Multi-State Advanced Manufacturing Consortium TAACCCT Round II Grant – FINAL EVALUATION REPORT 119
In other cases, there was a blend of using LMI resources, primarily through the connections with Workforce Investment Boards, and employer interaction. For example, many colleges reported working directly with employers to get feedback on what the company wants to see in the students being trained, and also gathering data from local sources and the local Workforce Investment Board. In many cases these data sources are vetted with industry partners and course selection is made in partnership with the industry representatives.
Even in cases where there may be multiple industries in a local area, colleges are constantly interacting with employers to gauge industry trends and needs. There are a few formal gatherings, but generally speaking they describe visiting, talking with, and taking the pulse of local industries as part and parcel of all of their activities. In one case, the facilitator was soon to be visited by CREC and was waiting to see what they had to offer.
Both of the colleges in Michigan are closely linked with a state program that organizes input from multiple manufacturers in the automotive industry. This information is used to help shape the college offerings, but again in all cases the data are vetted with the college industry partners. A current issue revolves around the use of the German apprenticeship model that has some different elements than the current state program. The colleges will work out the differences with those German suppliers and make adjustments as needed.
This is one area where there was clear consensus among the colleges. Interacting with employers frequently and integrally to everyday operations is the key to being able to respond to their ever-changing skill and employment needs.
Stakeholder Elements
Colleges were asked about nine stakeholder elements in the interviews (the tenth was covered in a survey to employers). During the course of the interviews the colleges tended to speak of the elements of their programs in the aggregate rather than parsing out each individual element. The responses became less robust and more generic as the interviews progressed through a discussion of each element of the overall model. Each section provides a brief summary intended for learning and reflection about the progress made to date.
1. Continuously Verified Industry Deployable Skills – Competency Attainment
Many factors determine how much information is gleaned from a telephone or video conference interview. The time on-board with the project for the facilitator is a critical variable. In a handful of instances, the facilitators were quite new to their jobs and were still finding their way through the project. Similarly, it has taken the evaluation team some time to grasp the project objectives and therefore discern what is intended and how far colleges are achieving those intentions.
In fairness to the colleges interviewed, the strategy they have agreed to follow for competency-based education was only recently fully articulated. Conceptually, competency-based education has been an objective from day one of M-SAMC’s existence, but exactly how that would be deployed using Performance-based Objectives through checklists is a relatively recent development. Many colleges are just now assimilating this approach and haven’t figured out exactly how they will deploy it. Other colleges have been doing variations of this model for some time. The challenge for them is shifting their old techniques to align with the common standard of the consortium.
Finally, there were varying pictures presented of how the colleges engage with employers. This again may be a factor of the facilitator’s experience but those who described working with employers as an integral part of the way they do business appear to have the strongest ties to their employer bases and have deep working relationships built over time.

Multi-State Advanced Manufacturing Consortium TAACCCT Round II Grant – FINAL EVALUATION REPORT 120
2. Integrated System Troubleshooting Skills
Again the experience of the coordinators has a role to play in the depth of information and the level of understanding of expectations. Overall the successes noted include: having the simulator in place and being used in course delivery, using the Performance Based Objectives as the cornerstone for developing locally relevant counterparts and applying those local PBOs in course instruction. Of the eleven colleges in our current sample, six reported either now using the simulator or intent to incorporate it into courses by the end of the first quarter of 2015. Eight colleges reported that they use some variation of PBOs (typically referred to as checklists) to assess performance in troubleshooting courses, whether using the simulator or not.
Overall there seems to be good progress on the key elements of this section. All colleges have the simulators and will be incorporating them into their instructional processes within the next year. The PBOs specific to the project were recently released. The fact that many colleges were already using similar processes is encouraging. Several colleges cited the gap analysis necessary to modify the generic PBOs to their local context as either about to start or underway. Full adoption of the core PBOs will be assessed during the upcoming year.
3. Valid Assessment of Demonstrated Skills and Learning Mastery
At this stage of the interviews, the responses began to become repetitive, shorter, and make reference to previous answers. As such, most of the responses for this section noted “see the response for the previous section” or included an editorial comment but did not differ substantially from the responses to the previous sections.
4. Rapidly Developed, Company Customizable, Credit Bearing Programs
More than half of the colleges interviewed said that meeting this element was either not done at their institutions or was only done on the non-credit side of the house. In a few cases, the respondents were emphatic that they were not going to try to change this model and the credit side would remain as it is. There were a few innovative efforts to take non-credit work and convert it to credit bearing courses, but these were the exceptions and not the rule. The cumbersome approval process for new programs of study was a crucial factor in not pursuing this element in most cases. In others, expanding any work done in the non-credit side to the credit side was viewed an impossible to achieve due to internal resistance to change.
Ultimately, this element is highly resisted in many colleges and simply ignored in others. It seems it would require a great deal of effort and attention to move this element substantially within the colleges beyond the workforce services divisions.
5. National Standard Lean Education Model
Though it was clear that the respondents were not familiar with this term, it was quite obvious that some elements of the model are in fact present among the consortia members. Only two interviewees seemed confident of both their definition and operationalization of the term at their college. As such, some focus could be spent on creating a common understanding around the terminology used to describe processes that are very much either underway or being planned for at the colleges.
6. Students with Skills for Self-Directed Lifelong Learning
While the interviewees were more familiar with this term, results about progress to implement self-directed life-long learning project elements at each college were mixed. Because the term seems to be defined generally as an approach, few of the colleges appear to have a firm grasp of how this could or should be operationalized particular to their institution’s context.

Multi-State Advanced Manufacturing Consortium TAACCCT Round II Grant – FINAL EVALUATION REPORT 121
7. Credit for Work Skills & On-the-Job Training Delivery
Interviewees noted great variance in processes and procedures regarding awarding credit for both prior work skills and training and credentials (see below). In most cases, the process for work skills and training mirrored that for credentials where the process existed.
8. Transferable Credits for Recognized Credentials
This was a difficult area to get interviewees to understand, even with some explanation or prompting. Some respondents focused on how to award credit but did not even mention articulation agreements, even after opening prompts. The confusion about this element offers an opportunity for discussion, consensus and possible technical assistance.
9. Non-Proprietary, Cost-Effective Educational Solutions
Here, interviewees demonstrated a general, conceptual understanding of non-proprietary cost effective solutions. The colleges are largely awaiting direction from the consortium as to how to proceed with selecting and using such materials.
Interview Findings and Analyses
Implementation Milestones
In addition to the nine stakeholder elements that frame the vision and goals for the project, some notable milestones have been achieved by the member colleges. Perhaps as a shorthand for noting project achievements, these milestones could be observed along the dimensions of: use of the simulator, performance-based objectives, participant enrollment, project work being advanced as credit-bearing (vs. non-credit bearing).
The table below visually captures the colleges’ progress toward implementation in each of these areas:
Fall 2014 Milestones
Have Simulator*
Performance-Based
Objectives**
Participants enrolled***
Alamo Community College
Bluegrass Community and Technical College
BridgeValley Community College
Danville Community College
Gadsden State Community College
Henry Ford Community College

Multi-State Advanced Manufacturing Consortium TAACCCT Round II Grant – FINAL EVALUATION REPORT 122
Jefferson Community and Technical College
Oakland Community College
Pellissippi State Community College
Rhodes State College
Rock Valley Community College
Spartanburg Community College
TTC-Murfreesboro Community College
*simulator is in place; being used or will be used in next semester in most colleges.
**PBOs are used but they are more typically local version that have not been built off the consortium developed template. Moving through the gap analysis expected to modify the common PBOs was noted by some colleges but not many.
***This data was cross-walked with the New Growth quantitative DOL report in which all colleges reported participants enrolled. This in not wholly consistent with our interviews where we found some colleges that were planning enrollments to start next semester. Upon reflection we surmise that enrollees in courses have been reported to New Growth, while programs of study were referenced in our interviews.
Differing Participant Definitions
Though all of the colleges reported both understanding and use of the new participant definition, uniformity among the colleges application of the definition, particularly for reporting purposes varies. Practically speaking, this may be necessary, as some colleges’ comparison groups could not be constructed without such differences. Nevertheless, an area for consideration and further inquiry, particularly of need for the success of the impact evaluation may exist with regard to this difference. Comparisons between groups at colleges will certainly be accessible, but such comparison between colleges with differing approaches to participant definitions may at best be greatly nuanced, and possibly limited. Anticipating an interest in further comparison and generalizability beyond individual colleges and the consortia as a whole, the project may want to consider an early approach to documenting and analyzing these differences in definition.
Opportunities for Improvement
Revisit and Consolidate Stakeholder Elements
Few responses were echoed more frequently and concisely from the facilitator interviews than lack of clarity around the stakeholder elements. While notably most of the colleges seemed familiar with most of the elements, few were absolutely confident in their understanding of the elements AND felt that they had implemented them well. Reasonably so, a number of barriers to successful implementation limited their realization – recent re-conceptualization/definition of the project’s elements, individual college contexts

Multi-State Advanced Manufacturing Consortium TAACCCT Round II Grant – FINAL EVALUATION REPORT 123
and markets, and limited resources and staffing. Additionally, given the number and breadth of elements, it could be possible, and helpful to consider where elements could be clarified or consolidated. For example, the first and third elements (Competency Attainment and Valid Assessment of Demonstrated Skills and Learning Mastery) seemed to garner very similar conceptualizations and therefore interview responses. The elements related to awarding of credit (Credit for Work Skills & On-the-Job Training Delivery and Transferable Credits for Recognized Credentials) also solicited similar responses as most of the colleges approached such efforts in very similar ways, often as dictated by their colleges’ administrative or governance policies, not the project’s design or process.
Similarly, a worthwhile exercise might also consider standardizing the manner in which the elements are approached. For example, some of the elements are focused at the project level while others necessarily require change and even innovation at the college or even state level.1 Streamlining or collapsing elements into similar levels of inquiry could help clarify their intended implementation approach. Additionally, Nonproprietary, Cost-Effective Solutions seemed to be an area where facilitators were looking to the project lead at HFCC to carry out this element.
Areas for Further Inquiry and Consideration
Leverage Collaboration
The project has well established a structure and operative frameworks for communication and collaboration. As it has served to propel the project activities beyond baseline implementation into actualizing the vision for the project through the stakeholder elements, that structure should be used to leverage additional opportunities. Some of the colleges have excelled in most areas of project implementation thus far. Where appropriate and applicable, the consortium could benefit from investigating opportunities for colleges who have successfully implemented best or successful practices to share them and take responsibility for leading collaborative efforts, and/or providing technical support, advice and resources to other members.2
Some facilitators felt that they could greatly benefit from the resources and knowledge developed by others, providing a natural environment to test the introduction of nonproprietary, cost effective solutions within the consortium. A few specific opportunities could be prioritized to significantly advance project activities and support member colleges:
Sharing assessment tools and processes for implementing the PBOs
Making the case/soliciting buy-in and support from faculty and administration at individual institutions
1 For example, the lean standard education element seems to have been conceptualized as an approach philosophy about how competency-based education should be implemented, while valid assessment of demonstrated skills and learning mastery seems to have been understood as a strategy, and students with skills for self-directed life-long learning has been operationalized as an outcome with varying approaches to achieving and even measuring its implementation.
2 Focusing this inquiry on the facilitators bore out their interpretation of the project and this inquiry did not similarly approach the innovation teams’ work. Doing so yielded results suggesting that facilitators who were not members of a particular team did not yet feel that they were receiving the benefit of that team’s efforts though they may be aware of them. It may be the case that this will change as team members rotate. A repository or other

Multi-State Advanced Manufacturing Consortium TAACCCT Round II Grant – FINAL EVALUATION REPORT 124
Knowledge Management
There is substantial reason for the project to both boast and pause given the ever evolving nature of the project. That the project’s core elements, strategies and activities are being constantly revisited is indeed laudable. Such an undertaking not only serves to continuously improve the consortia’s offerings but also maintains its responsiveness to the needs of industry, partners, consortia members and ultimately students. It is also worth noting however that there is some difficulty in keeping up with a project that is evolving. Communication and tracking between and among moving parts can prove challenging in such an environment given the multiple demands placed on schedules and resources. The project may want to consider marshalling attention to attend to how modifications and changes are communicated. Modest resources could be used to implement processes or systems dedicated to documenting how the model and project activities are translated into action and transmitted.
Year Three Evaluation Part 1
M‐SAMC Evaluation PPT 12/2014 Summary
M‐SAMC Evaluation Workshop December 2‐4, 2014
Implementation Evaluation
• Combination of interviews and surveys
• Focused on stakeholder elements and present and future state
• Showed significant movement from winter of 2103 report
• Solid understanding of competency‐based education at all colleges
• Simulator either in use or in place (soon to be used) at all colleges
• All colleges reported some level of enrollment – total 1590 before reconciliation (to be completed by Feb 2015) Note: some differences in interview results and data submissions
• Performance‐based objectives generally understood but implemented differently at time of interview, from model expectations
Implementation Evaluation ‐ Reflections
• There appear to be too many stakeholder elements to really focus attention on what is important.
• There are differing definitions from the central model
• If this project is intended to impact teaching processes at the whole
college level, there is a long way to go before that will be realized, if at all.
• Survey responses were very limited – need another way to test how project perceived for future
• One-time assessment of very fluid project may not be best use of evaluation energy
Final Evaluation – Cases Studies Summary
M‐SAMC Case Study
Case Study Process
• Selecting Sites – Representative
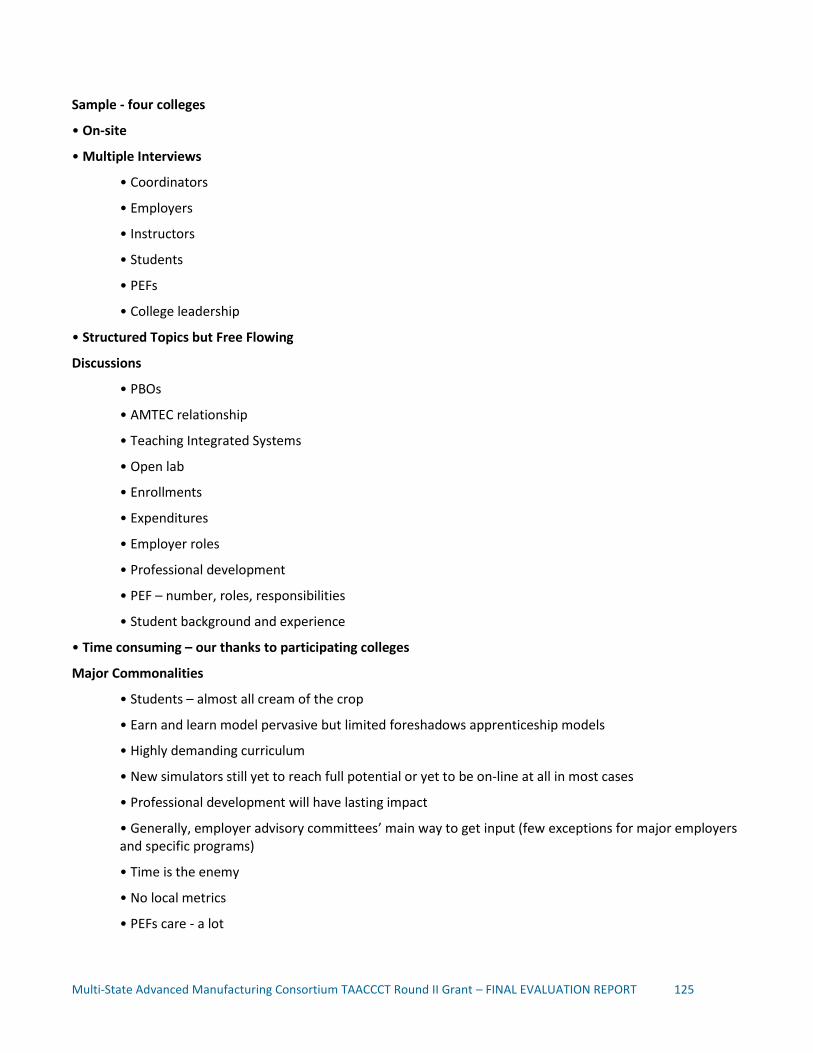
Multi-State Advanced Manufacturing Consortium TAACCCT Round II Grant – FINAL EVALUATION REPORT 125
Sample ‐ four colleges
• On‐site
• Multiple Interviews
• Coordinators
• Employers
• Instructors
• Students
• PEFs
• College leadership
• Structured Topics but Free Flowing
Discussions
• PBOs
• AMTEC relationship
• Teaching Integrated Systems
• Open lab
• Enrollments
• Expenditures
• Employer roles
• Professional development
• PEF – number, roles, responsibilities
• Student background and experience
• Time consuming – our thanks to participating colleges
Major Commonalities
• Students – almost all cream of the crop
• Earn and learn model pervasive but limited foreshadows apprenticeship models
• Highly demanding curriculum
• New simulators still yet to reach full potential or yet to be on‐line at all in most cases
• Professional development will have lasting impact
• Generally, employer advisory committees’ main way to get input (few exceptions for major employers and specific programs)
• Time is the enemy
• No local metrics
• PEFs care ‐ a lot

Multi-State Advanced Manufacturing Consortium TAACCCT Round II Grant – FINAL EVALUATION REPORT 126
Major Differences
• Part of State System – 2 yes; 2 no
• AMTEC driving force on grant related activities – 2 yes; 2 no
• PBO’s embedded in curriculum – 2 yes; 2 no
• Major curricula innovations – 3 yes; 1 no
Differences (con’t)
• Equipment acquisition major fund use – 1 yes; 3 no
• Participants – 2 high numbers (900‐1800); 2 average (100 – 300)
• PEF staff – range of 1 @ 19hrs/wk to 2 @ 32 hrs/wk
• Disruptive change – 2 yes; 1 no; 1 evolutionary (admittedly subjective)
National Innovation, Local Implementation – puts demands on time
Final Evaluation – Case Studies Reflecting Status of Grant Commitments
See table below for a summary of grant deliverable status at four M-SAMC colleges, as developed through intensive case study analysis.

Multi-State Advanced Manufacturing Consortium TAACCCT Round II Grant – FINAL EVALUATION REPORT 127
M-SAMC Case Studies: Summary of Status of Grant Deliverables at Four Member Colleges
Grant Commitment
Explanation from grant application
General Spartanburg Gadsden Bluegrass HFC Notes from grantee staff
Target Occupations – college data found in Inventory of Products and review of college catalogues
Mechatronics-maintenance techs
Skilled tradesmen
Team leaders
Production staff
Machine operators
AAS in:
Mechatronics
Robotics
PLCs
Technical Troubleshooting
Applied Troubleshooting
Certificate in:
Industrial Electricity (42 wks; 34 credit hrs)
AAS in:
Industrial Automation Technology
Electronic Engineering Technology (2 specializations)
Automotive Manufacturing Technology
Certificates in:
Industrial Automation Tech (28 credits)
Mechatronics
Automotive Manufacturing Technology – short term (23 credits)
Automotive Manufacturing Technology
AAS in:
Integrated Engineering Technology
Certificate in:
Integrated Engineering Technology (53 credit hours)
AAS in:
Multi-skilled Manufacturing Maintenance
Manufacturing trades
Manufacturing Production Specialist (listed on Inventory as AAS program but in catalogue as certificate program – description is more certificate like)
Plant Maintenance Trade
CNC
Process Technology
Electrical Technology
Welding Technology
Certificates in:

Multi-State Advanced Manufacturing Consortium TAACCCT Round II Grant – FINAL EVALUATION REPORT 128
Industrial Sewing (5-6 wks)
CNC/Man Productivity Systems (2 basic & Advanced – no longer active per catalogue)
Process Technology (2 basic and advanced 8 -24 months per catalogue)
Welding Technology (2 basic and advanced 5 – 24 mos)
Welding Technology GTAW-GMAW (no longer available per catalogue)
Welding Technology – Tool & Die (18 mos 32 credits)
Who Served TAA-like -unemployed workers – typically low educational level older workers
All data comes from New Growth’s latest APR inputs.
4 (2.3%) students – less than h.s.; 47% h.s. or equivalent; 57% some college;
3 (1.0%) students –less than h.s.; 26% h.s. or equivalent; 43.8% some
No information available. Bluegrass does not have PIF’s on most
2 (1.1% students – le3ss than h.s.; 41.6% h.s or equivalent; 44.9% some
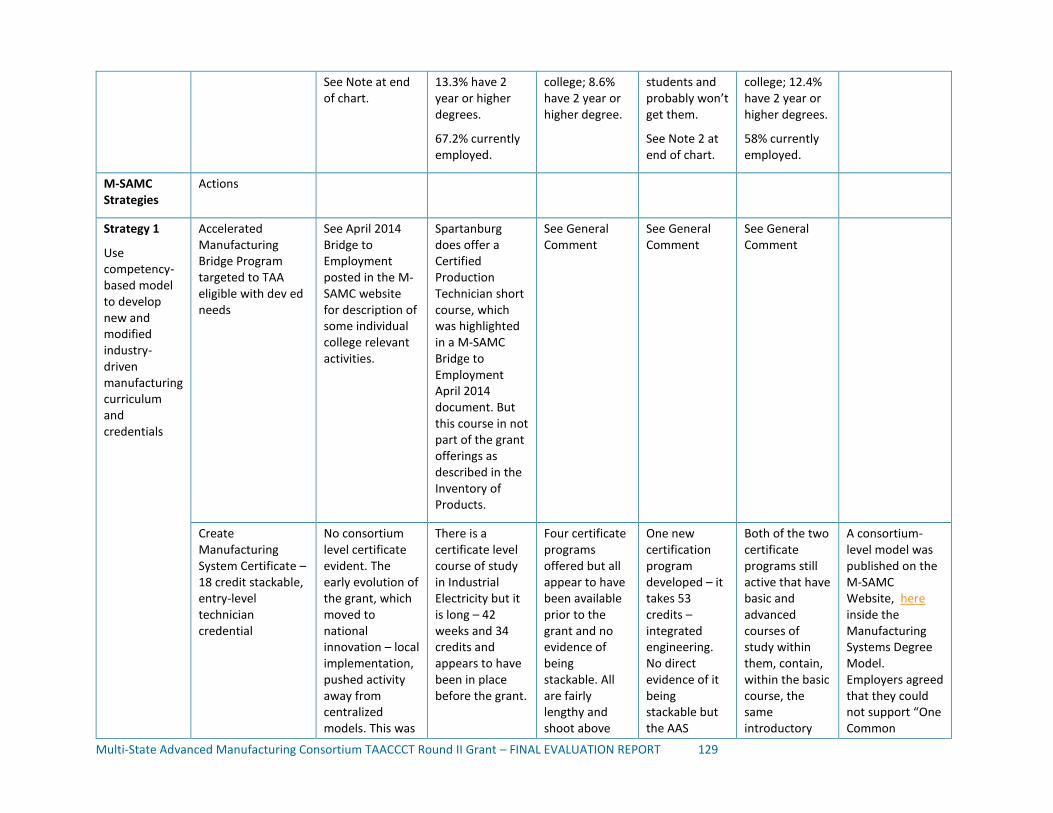
Multi-State Advanced Manufacturing Consortium TAACCCT Round II Grant – FINAL EVALUATION REPORT 129
See Note at end of chart.
13.3% have 2 year or higher degrees.
67.2% currently employed.
college; 8.6% have 2 year or higher degree.
students and probably won’t get them.
See Note 2 at end of chart.
college; 12.4% have 2 year or higher degrees.
58% currently employed.
M-SAMC Strategies
Actions
Strategy 1
Use competency-based model to develop new and modified industry-driven manufacturing curriculum and credentials
Accelerated Manufacturing Bridge Program targeted to TAA eligible with dev ed needs
See April 2014 Bridge to Employment posted in the M-SAMC website for description of some individual college relevant activities.
Spartanburg does offer a Certified Production Technician short course, which was highlighted in a M-SAMC Bridge to Employment April 2014 document. But this course in not part of the grant offerings as described in the Inventory of Products.
See General Comment
See General Comment
See General Comment
Create Manufacturing System Certificate – 18 credit stackable, entry-level technician credential
No consortium level certificate evident. The early evolution of the grant, which moved to national innovation – local implementation, pushed activity away from centralized models. This was
There is a certificate level course of study in Industrial Electricity but it is long – 42 weeks and 34 credits and appears to have been in place before the grant.
Four certificate programs offered but all appear to have been available prior to the grant and no evidence of being stackable. All are fairly lengthy and shoot above
One new certification program developed – it takes 53 credits – integrated engineering. No direct evidence of it being stackable but the AAS
Both of the two certificate programs still active that have basic and advanced courses of study within them, contain, within the basic course, the same introductory
A consortium-level model was published on the M-SAMC Website, here inside the Manufacturing Systems Degree Model. Employers agreed that they could not support “One Common

Multi-State Advanced Manufacturing Consortium TAACCCT Round II Grant – FINAL EVALUATION REPORT 130
a reasoned decision based on where the member colleges were and what they were willing to commit to. However, it remained in the grant documents as a commitment and is thus cited here as such. While this applies to all grant commitments, it is only discussed in this section. The consortium did publish a policy paper on this topic to help guide colleges with their local implementation strategies.
No evidence of it being stackable.
entry-level jobs – entry level defined in this analysis as line worker for lack of a better term.
program in same course of study is only 64 credits so we can assume one can go from the certificate level to the AAS easily.
courses included in the advanced program. These are clearly stackable examples. From what can be gleaned from the catalogue, they were in existence prior to the grant becoming active (2009 and 2003). It is therefore not likely that the grant had any impact on them.
certificate”, as local needs varied by employer, and manufacturing segment.
Develop new AA degree in Manufacturing Maintenance and Organizational Systems
Work continues on developing new degree programs at several colleges. The consortium published a model for these areas. Work continues post-grant activities using other funding sources.
These courses of study were in existence prior to the grant.
These courses of study were in place prior to the grant based on the CARCAM work.
Both the AAS level and certificate level courses of study were developed from old courses and were directly attributable to the grant but were not in Manufacturing Maintenance
A new degree program was started using the 1 credit hour chunking and the PBO process. The full approval process will take some time to run through the colleges
A consortium-level model was published on the M-SAMC Website, here

Multi-State Advanced Manufacturing Consortium TAACCCT Round II Grant – FINAL EVALUATION REPORT 131
and Organization Systems. From the visit report, these two course of study are amalgamations of older less integrated programs. They are very new.
system but the program is in place and on pace.
Modify curriculum and related assessments in 3 manufacturing sub-sectors: process-based; automotive; aerospace/precision machining
The courses of study at the member colleges have different names by institution. However, there was work at all colleges on one or more of these and work at the consortium level to develop new approaches included access to “Immerse2Learn” efforts that were the forerunners of PBOs and used by several colleges to develop early competency
Curricula were modified to append the PBOs and the PBO process, which includes assessments, unto existing courses to avoid having to go through curriculum approval process.
No evidence of curricula modification. Main use of grant was for equipment to supplement existing courses and for some faculty development.
Integrated Engineering Technology is new course of study that evolved under the grant and is built on older, less integrated courses of study. The college reported that they were testing out the AMTEC assessment process in these and many other courses – this is one of biggest reasons for the very high participant
Two big examples emerged from the case study – MAT2 is constantly being revised to meet new and changing employer needs; the welding program has a beta section with fully modified approach using PBOs ; open lab; and other project-based learning. PBOs were coming to other courses at time of the visit. The state of implementation
Curriculum and related assessments were modified impacting education in these three sub-sectors, however, not obvious in the evaluation of these 4 schools?

Multi-State Advanced Manufacturing Consortium TAACCCT Round II Grant – FINAL EVALUATION REPORT 132
based education models.
levels at Bluegrass – but interestingly only the two Integrated Engineering Technology programs are on the Inventory of Products – raises the question of how the final evaluation can cover all the participants.
has likely accelerated since then.
Deeply engage industry as it identifies the standards and competencies needed, use competencies to develop related curriculum and assessments
This is what the PBOs are all about and this is a clear win at the consortium level. Mixed results in how implemented but some form of this work is evident at all colleges. Consortium is building closer relationships with AMTEC which has good employer involvement model too.
SCC has excellent relationships with local employers – general perception from employers is SCC has improved greatly in the “products” (trained students it produces. Employer interaction is one on one with larger employer in auto supply chain. Used PBO’s with employers for validation.
Very good relationship with employers: one-on-one relationships with major employers in auto industry for individual courses. CARCAM has employer input to through its advisory group and its connections with employers statewide.
Employer relations are one-on-one but there is a very working relationship with Toyota a huge force, in the state. No PBO use but closely aligned with AMTEC, with which the consortium is strengthening ties.
PBOs were born here and tested here. Employer relations with MAT2 auto suppliers is excellent. There are solid interactions with both the big auto makers and the suppliers. Good example is employer participation in industrial sewing program re-vamp where they had full

Multi-State Advanced Manufacturing Consortium TAACCCT Round II Grant – FINAL EVALUATION REPORT 133
voice in curriculum.
Develop structured Workforce Information System to gather real time data on new, emerging, and changing labor market skills
CREC engaged to create LMI course and databases. There were being rolled out during the visits and had received high praise from multiple partners. Very useful dashboard on M-SAMC website.
Has had CREC training. Well received by college and partners.
Has had CREC training. Well received by college and partners.
Has had CREC training. Well received by college and partners.
Has had CREC training. Well received by college and partners.
Map in detail and articulate manufacturing career pathway (job & education) standardized across consortium
Consortium intentionally moved off of any standardized model when it went to “National Innovation – Local Implementation”.
Some mapping is done at college level.
While not having a direct grant relationship SCC does have a career ladder program for TAA recipients, vets, and other adult learners. It is called SCACCELERATE.
The college has articulation agreements that allow students to progress to higher degrees.
Articulation agreements ease transition from the grant supported course to higher degrees. Most students interviewed indicated an interest in more schooling after their current program of study was completed.
No mention during the visit. College website references “several” articulation agreements but none listed for manufacturing related programs of study. There may be more there but it is not evident from available information.
An interactive and localized career pathway tool (select a college, select “educational pathways”) was developed and launched which includescareer pathway information for all M-SAMC partner colleges. This tool may have not resided online, in a released version, during the Case Study site visits.
Utilize NCRC model to document
There is a document from
Spartanburg does offer the
There are a few events for
No reference on Bluegrass
There is one reference on

Multi-State Advanced Manufacturing Consortium TAACCCT Round II Grant – FINAL EVALUATION REPORT 134
foundational skills in applied math, reading, and locating information
April 2014 about Bridge to Employment programs that indicates work was done in this area by Team 1. It contains examples of NCRC related activities at Alamo. This serves as an excellent guide to colleges working in this area.
NCRC but it does not appear to be linked to any of the offerings in the Inventory of Products.
NCRC on various Gadsden calendars but they all appear to relate to National Court Reporting and Captioning – their NCRC.
website for the NCRC. But KY is big into NCRC as separate effort. Does not appear to have any grant connection.
the HFCC website for NCRC testing available at the college testing center but it does not appear to be connected to the grant in any way.
Strategy 2
Transform instructional design & delivery systems to accelerate & contextualize learning
Dev on-line learning for M-SAMC’s new curriculum and expand delivery models for online/blended instruction
There is an 8/15 PPT on the M-SAMC website highlighting a on-line learning efforts including Spartanburg, HFC, and Bluegrass. These represent good examples of individual college initiatives in this area.
On-line and virtual learning were emerging aspects of the grant program at the time of the case study visit. Both were getting new equipment and expanding ability of students to access more content remotely, clearly all grant related but coming toward end of the grant period.
On-line learning is part of the Gadsden overall college menu but nothing was indicated in the case study visit as to whether on-line activity was any part of the grant structure.
On-line learning is a large scale initiative at the state level. Since Bluegrass is part of a tight state system, all of its courses, including the grant related courses, were expected to have on-line components. There were issues with the
HFC was featured in the PPT referenced in the General Section. Students referenced some on-line content in the MAT2 program. It appears HFC was not as far along as Spartanburg or Bluegrass in fully embracing on-line learning into the grant program.

Multi-State Advanced Manufacturing Consortium TAACCCT Round II Grant – FINAL EVALUATION REPORT 135
platform to be used but students reported that labs had on-line components and that the colleges was experimenting with how to integrate on-line in a highly hands-on environment. It was evolving but was definitely moving along and expected.
Expand use of manufacturing simulators and other digital simulations
A key central decision made was purchase of the AMTEC simulators for all schools in the consortium. As the grant program progressed, the consortium saw and filled the gap on simulator instructor training and technical assistance.
Simulator in use and had video support to allow more students to see the process while one or two actually had the hands-on experience. The coordinator noted there was more room for the simulator to be more fully used but training was in progress and the simulator was front and center
Simulator was part of one classroom. Training was coming. It was important but not central to any changes in curriculum. There were few changes in any case since the curriculum was already place under CARCAM, which has been around for five years.
In reality, Bluegrass was probably the furthest ahead in integrating the simulator into at least one key program of study. Bluegrass already one simulator, housed at the Toyota training site. The students were up to practicing taking it apart
HFC, as the lead college, had a clear understanding of the value of the simulator and had the faculty expertise to get good use out of it. The faculty expertise was being provided to other colleges at the time of the visits.
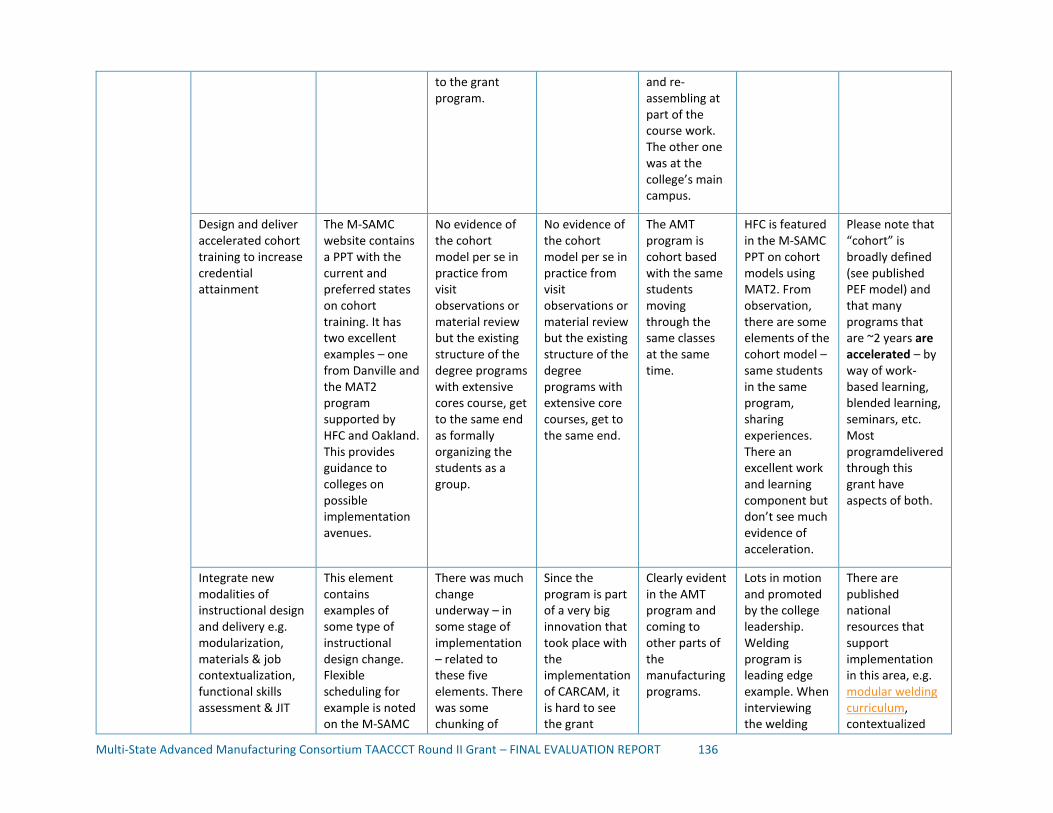
Multi-State Advanced Manufacturing Consortium TAACCCT Round II Grant – FINAL EVALUATION REPORT 136
to the grant program.
and re-assembling at part of the course work. The other one was at the college’s main campus.
Design and deliver accelerated cohort training to increase credential attainment
The M-SAMC website contains a PPT with the current and preferred states on cohort training. It has two excellent examples – one from Danville and the MAT2 program supported by HFC and Oakland. This provides guidance to colleges on possible implementation avenues.
No evidence of the cohort model per se in practice from visit observations or material review but the existing structure of the degree programs with extensive cores course, get to the same end as formally organizing the students as a group.
No evidence of the cohort model per se in practice from visit observations or material review but the existing structure of the degree programs with extensive core courses, get to the same end.
The AMT program is cohort based with the same students moving through the same classes at the same time.
HFC is featured in the M-SAMC PPT on cohort models using MAT2. From observation, there are some elements of the cohort model – same students in the same program, sharing experiences. There an excellent work and learning component but don’t see much evidence of acceleration.
Please note that “cohort” is broadly defined (see published PEF model) and that many programs that are ~2 years are accelerated – by way of work-based learning, blended learning, seminars, etc. Most programdelivered through this grant have aspects of both.
Integrate new modalities of instructional design and delivery e.g. modularization, materials & job contextualization, functional skills assessment & JIT
This element contains examples of some type of instructional design change. Flexible scheduling for example is noted on the M-SAMC
There was much change underway – in some stage of implementation – related to these five elements. There was some chunking of
Since the program is part of a very big innovation that took place with the implementation of CARCAM, it is hard to see the grant
Clearly evident in the AMT program and coming to other parts of the manufacturing programs.
Lots in motion and promoted by the college leadership. Welding program is leading edge example. When interviewing the welding
There are published national resources that support implementation in this area, e.g. modular welding curriculum, contextualized

Multi-State Advanced Manufacturing Consortium TAACCCT Round II Grant – FINAL EVALUATION REPORT 137
remediation, team supported learning
website under instructional design present and future states. The paper advises colleges on what are some positive things to consider in looking at this element. In many of the colleges visited or interviewed over the course of the entire evaluation period indicated that these elements are part of their delivery models. The core product of the consortium, PBOs, clearly exemplifies all of the sample sub-elements.
courses; much contextualization (actual doing); a definite evolving change in skills assessments with reliance on the PBO’s And some team learning.
having had much impact here.
instruction, he described himself as doing something very leading edge, and the jury was out on whether any other instructors would follow.
curriculum like the integrated systems materials, and cohort model (see above). M-SAMC’s purchase of AMTEC seats and Immerse 2 Learn, and support of instructor training, most notably in Integrated Manufacturing Systems Troubleshooting; , a state of the art online reference system supporting both students and instructors in HTML5 formats to run well on PC’s, Tablets, and Mobile Phones! ew New equipment facilitates contextualization; and programs or courses with a work element (nearly all of our colleges developed these) is job contextualization.
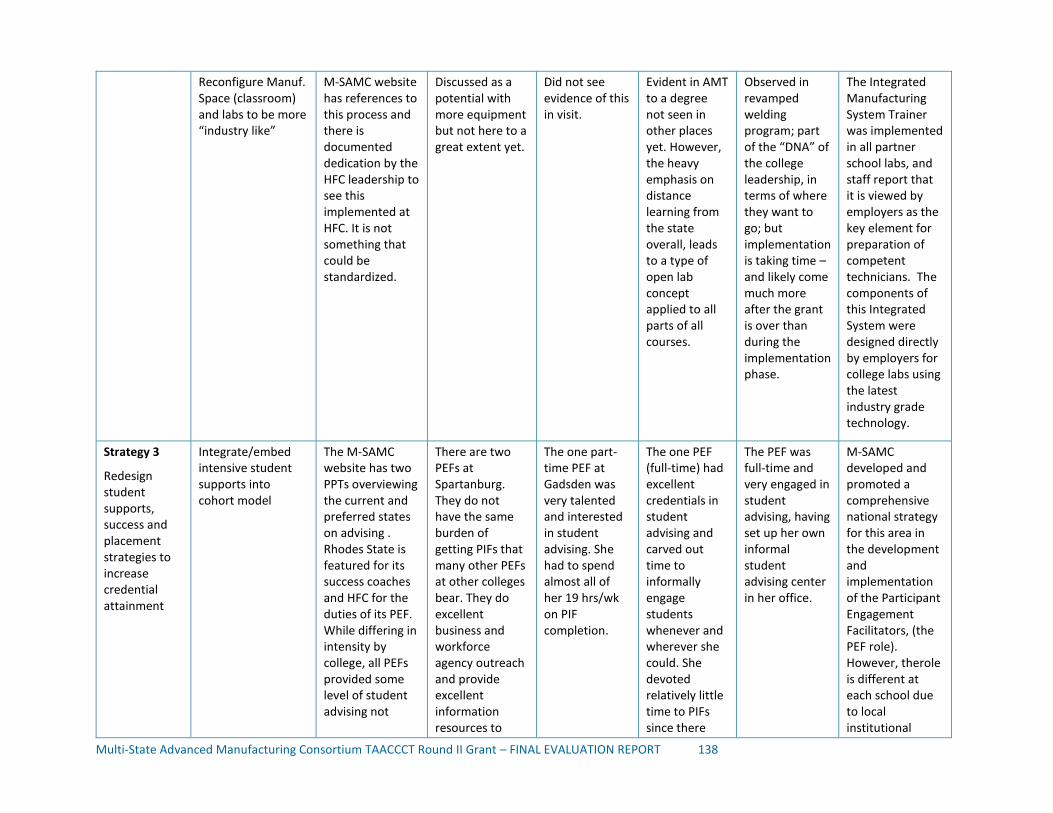
Multi-State Advanced Manufacturing Consortium TAACCCT Round II Grant – FINAL EVALUATION REPORT 138
Reconfigure Manuf. Space (classroom) and labs to be more “industry like”
M-SAMC website has references to this process and there is documented dedication by the HFC leadership to see this implemented at HFC. It is not something that could be standardized.
Discussed as a potential with more equipment but not here to a great extent yet.
Did not see evidence of this in visit.
Evident in AMT to a degree not seen in other places yet. However, the heavy emphasis on distance learning from the state overall, leads to a type of open lab concept applied to all parts of all courses.
Observed in revamped welding program; part of the “DNA” of the college leadership, in terms of where they want to go; but implementation is taking time – and likely come much more after the grant is over than during the implementation phase.
The Integrated Manufacturing System Trainer was implemented in all partner school labs, and staff report that it is viewed by employers as the key element for preparation of competent technicians. The components of this Integrated System were designed directly by employers for college labs using the latest industry grade technology.
Strategy 3
Redesign student supports, success and placement strategies to increase credential attainment
Integrate/embed intensive student supports into cohort model
The M-SAMC website has two PPTs overviewing the current and preferred states on advising . Rhodes State is featured for its success coaches and HFC for the duties of its PEF. While differing in intensity by college, all PEFs provided some level of student advising not
There are two PEFs at Spartanburg. They do not have the same burden of getting PIFs that many other PEFs at other colleges bear. They do excellent business and workforce agency outreach and provide excellent information resources to
The one part-time PEF at Gadsden was very talented and interested in student advising. She had to spend almost all of her 19 hrs/wk on PIF completion.
The one PEF (full-time) had excellent credentials in student advising and carved out time to informally engage students whenever and wherever she could. She devoted relatively little time to PIFs since there
The PEF was full-time and very engaged in student advising, having set up her own informal student advising center in her office.
M-SAMC developed and promoted a comprehensive national strategy for this area in the development and implementation of the Participant Engagement Facilitators, (the PEF role). However, therole is different at each school due to local institutional
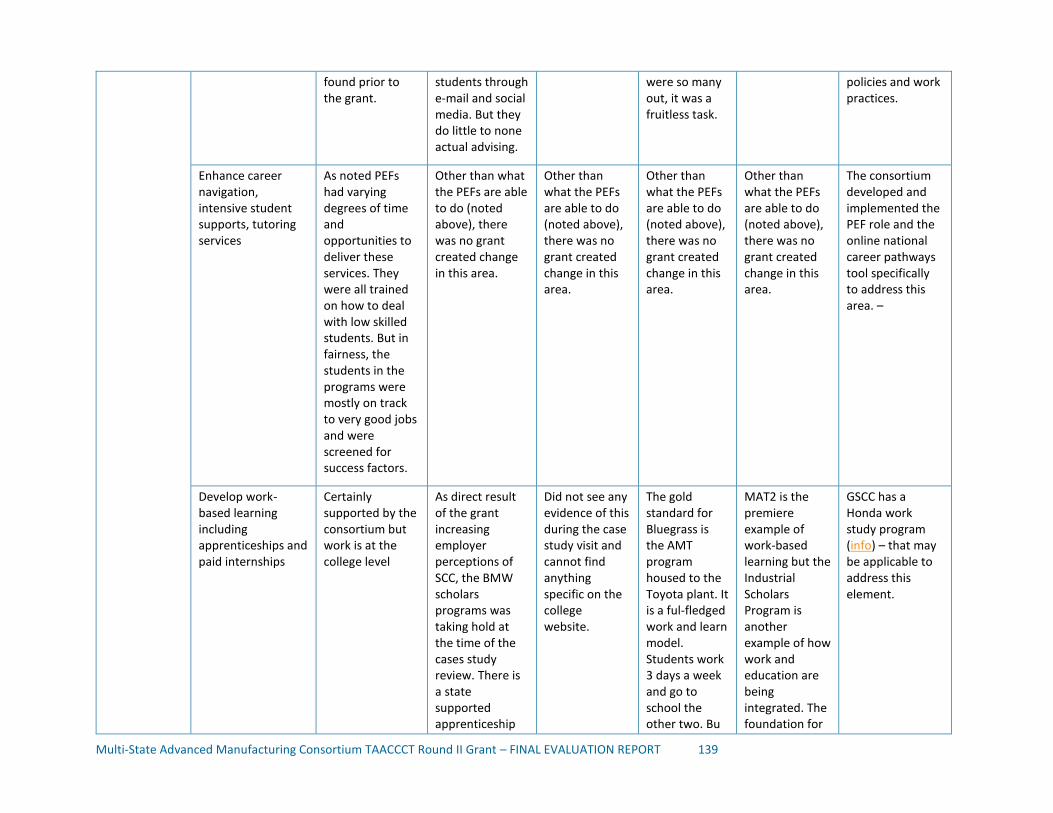
Multi-State Advanced Manufacturing Consortium TAACCCT Round II Grant – FINAL EVALUATION REPORT 139
found prior to the grant.
students through e-mail and social media. But they do little to none actual advising.
were so many out, it was a fruitless task.
policies and work practices.
Enhance career navigation, intensive student supports, tutoring services
As noted PEFs had varying degrees of time and opportunities to deliver these services. They were all trained on how to deal with low skilled students. But in fairness, the students in the programs were mostly on track to very good jobs and were screened for success factors.
Other than what the PEFs are able to do (noted above), there was no grant created change in this area.
Other than what the PEFs are able to do (noted above), there was no grant created change in this area.
Other than what the PEFs are able to do (noted above), there was no grant created change in this area.
Other than what the PEFs are able to do (noted above), there was no grant created change in this area.
The consortium developed and implemented the PEF role and the online national career pathways tool specifically to address this area. –
Develop work-based learning including apprenticeships and paid internships
Certainly supported by the consortium but work is at the college level
As direct result of the grant increasing employer perceptions of SCC, the BMW scholars programs was taking hold at the time of the cases study review. There is a state supported apprenticeship
Did not see any evidence of this during the case study visit and cannot find anything specific on the college website.
The gold standard for Bluegrass is the AMT program housed to the Toyota plant. It is a ful-fledged work and learn model. Students work 3 days a week and go to school the other two. Bu
MAT2 is the premiere example of work-based learning but the Industrial Scholars Program is another example of how work and education are being integrated. The foundation for
GSCC has a Honda work study program (info) – that may be applicable to address this element.
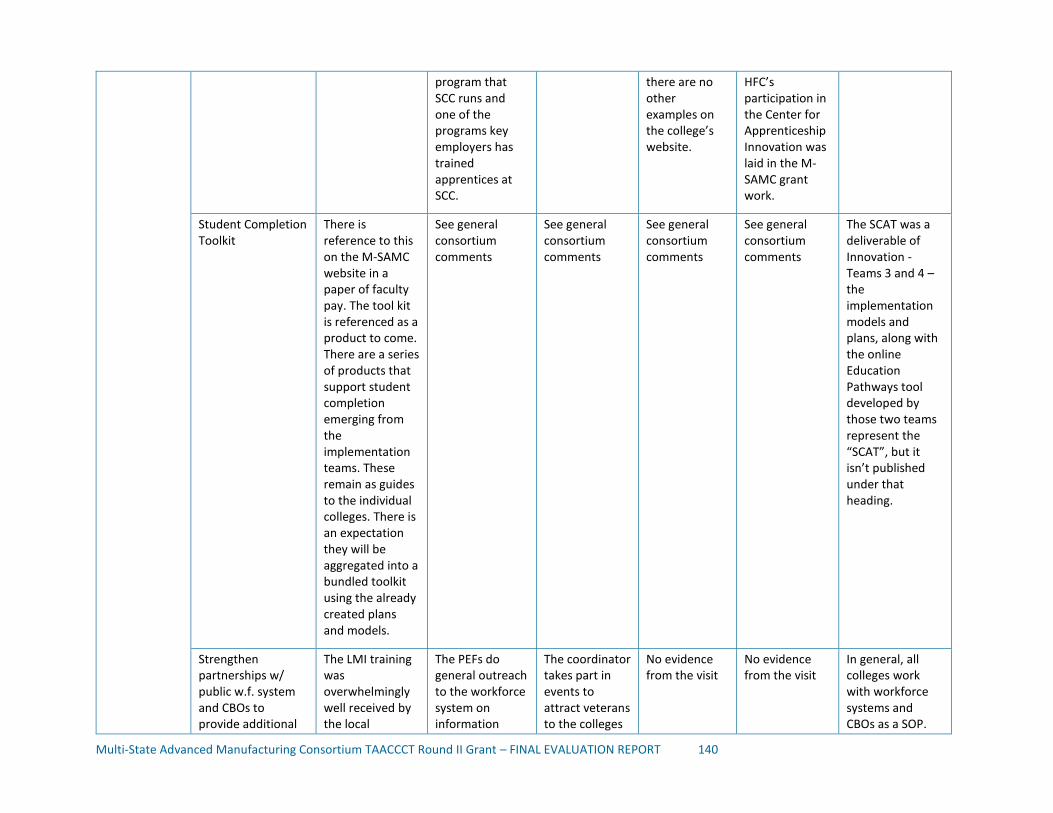
Multi-State Advanced Manufacturing Consortium TAACCCT Round II Grant – FINAL EVALUATION REPORT 140
program that SCC runs and one of the programs key employers has trained apprentices at SCC.
there are no other examples on the college’s website.
HFC’s participation in the Center for Apprenticeship Innovation was laid in the M-SAMC grant work.
Student Completion Toolkit
There is reference to this on the M-SAMC website in a paper of faculty pay. The tool kit is referenced as a product to come. There are a series of products that support student completion emerging from the implementation teams. These remain as guides to the individual colleges. There is an expectation they will be aggregated into a bundled toolkit using the already created plans and models.
See general consortium comments
See general consortium comments
See general consortium comments
See general consortium comments
The SCAT was a deliverable of Innovation -Teams 3 and 4 – the implementation models and plans, along with the online Education Pathways tool developed by those two teams represent the “SCAT”, but it isn’t published under that heading.
Strengthen partnerships w/ public w.f. system and CBOs to provide additional
The LMI training was overwhelmingly well received by the local
The PEFs do general outreach to the workforce system on information
The coordinator takes part in events to attract veterans to the colleges
No evidence from the visit
No evidence from the visit
In general, all colleges work with workforce systems and CBOs as a SOP.

Multi-State Advanced Manufacturing Consortium TAACCCT Round II Grant – FINAL EVALUATION REPORT 141
supportive services for students & enhanced job placement linkages
workforce system with frequent requests for more in-depth training for their staff. External supportive services and drawing students from the workforce system was not evident. However, all colleges have relationships with the local workforce systems on such activities as career days emphasizing manufacturing. There are connections with CBOs, particularly at HFC.
sharing and planning job fairs but there was no evidence of service coordination for recruitment or supports.
– noted in the visit and on the M-SAMC website. There are virtually no TAA or TAA-like students in the program
While grant activities did intentionally increase focus in this area, for those directly impacted, the long term impact was designed to be from the invested effort into PBOs and the online interface. For this reason, PBO training was included in every LMI training session significantly increasing the value of each following interaction with workforce entities.
Strategy 4
Develop administrative structures to support instructional redesign
Develop standard practices/models to award credit for prior learning and/or non-credit training
The M-SAMC website contains a fairly lengthy paper on approaches to PLA, citing three different models and highlighting the potential of PBOs for this process.. There are also three
SCC is moving as an institution to emphasize PLA. A key is a policy change that was imminent at the time of the visit to allow up to 75% of courses “to be waived” base on PLA – this was moving
This was not cited in the visit. The college website references the potential for PLA but ties it back to standardized tests in order for the PL to count toward
No mention in the visit of either PLA or non-credit to credit but Bluegrass had the strongest workforce division of any in the sample and there was general
Did not come up in visit and can’t find anything on HFC website about either PLA or non-credit to credit actions. This does not mean the school has not been
PLA occurs at all colleges in some form (and almost always, on a case by case basis, as instructors need to be involved in the process by contract. The primary approach was to arrive with a standard or

Multi-State Advanced Manufacturing Consortium TAACCCT Round II Grant – FINAL EVALUATION REPORT 142
documents on non-credit to credit practices – done in April 2015 – as guidance to the colleges. Further all of the work on PBOs supports totally re-designed systems and serve as guides, supported by training and extensive information sharing on their implementation process that can help colleges move forward.
up from 25%. Also the grant program itself saw the potential for a shift from assessment by interview to use of PBOs as the means of assessing ability to actually perform and thus making PLA more fact based.
credits. No specific reference in the manufacturing classes observed or discussed.
Non-credit to credit did not seem to be applicable since the skills training division worked separately with businesses for the limited incumbent worker training provided.
discussion of incumbent workers taking classes to advance themselves. Can’t find any policy reference to either point on the college website.
working on it simply it was not noted in the visit and can’t be located through web searches.
model that could be followed universally. Our approach was to create and continually improve the PBOs and to help instructors, and administrators become familiar with them. The positives and negatives of this approach have been well documented in this report.
Models to move non-credit to credit bearing courses
See above See above See above See above See above See above
Redesign registration and student data systems to allow increasing flexible scheduling options and easier navigation of college systems
This is referenced in a July 2015 PPT on student advising in general: good summaries of where colleges might go (future state).
See general comment
See general comment
See general comment
See general comment
Note 1: The education levels give us some indication of the types of students entering the grant programs. Overall, there are very few (1.4%) who are below the high school completion level. The largest group is “Some College” at 46.4% but that is a very wide ranging group which can include anywhere from someone who tried to take one course and withdrew right away to someone who was very close to a degree but did not finish. Age levels give some insights as well with 24.4% of all the participants for whom we have data (have none for Spartanburg at this time) were in the 18-19 range. There are some below that age

Multi-State Advanced Manufacturing Consortium TAACCCT Round II Grant – FINAL EVALUATION REPORT 143
bracket but they cannot legally be considered participants. Still about a quarter of the participants would likely have little to no work history, pushing them further away from TAA-like individuals.
Note 2: For Bluegrass, it is perplexing that they have the smallest number of courses of study – two – yet have the highest, by far, number of participants. We know from the visit that the vast majority of the Bluegrass participants come from courses for which the AMTEC assessments were purchased with grant funds. Thus they do meet the definition of grant impacted and help enormously in meeting the overall enrollment targets. But there will be very limited impact since the touch was so light. Further there is some question whether these lightly touched individuals should be counted at all. A participant has to be in a program of study on the Inventory of Products to be counted as such. It appears most of the Bluegrass identified participants were in the two courses of study on the Inventory.