multi-use arena pre-feasibility study: christchurch...forsyth barr stadium’s dominant design...
TRANSCRIPT

Multi-Use Arena Pre-Feasibility Study: Christchurch
1
DRAFT FOR DISCUSSION

To
Mayor Lianne Dalziel Hon Nicky Wagner
Christchurch City Council Minister supporting Greater
Christchurch Regeneration
On 2 May 2017, the Christchurch Stadium Trust was commissioned to
develop and present a pre-feasibility study for a new multi-use arena in
Christchurch.
The Stadium Trust established a subcommittee to oversee the production of
this report, chaired by Neville Harris, including trustees Lauren Semple, Tim
Scandrett (Councillor) and myself.
It is my pleasure to submit this pre-feasibility study report to you for your
consideration.
The report was prepared by Sarah Burnett, who was the Project Director for
the construction of the current AMI Stadium. Sarah was supported by expert
advisers:
• KPMG (Peter Ball and Chad Gardiner, Brisbane office)
• Populous (Richard Breslin and Chris Paterson)
• Resource Co-ordination Partnership (Waren Warfield)
• WT Partnership (Pete Sammons).
The stakeholder consultation process was led by Adam Feeley.
We acknowledge the support and assistance provided by Mary Richardson
(General Manager Citizens and Community),Christchurch City Council, and
Kelvan Smith (Director Greater Christchurch Group), Department of the Prime
Minister and Cabinet.
We also would like to thank the many people who were consulted and gave
their time to answer questions and provide insight.
Trevor Thornton
For the Christchurch Stadium Trust
Trustees: Jim Anderton, Trevor Thornton, Neville Harris, Lauren Semple, Tim
Wood, John Filsell, David East.
Foreword
2

Contents Page
1. Executive summary 4
2. Background 15
3. Vision for an Arena in Christchurch 21
4. Arena Content 25
5. Arena Design Concepts and Trends 37
6. Arena Options 49
Appendices Page
A Designation 64
B Pre-feasibility Study Consultees 66
C Operating and financial assumptions 68
D Financial performance 83
E 10 year financial projections 89
3

1. Executive Summary
4

Introduction
Lancaster Park was severely damaged in the 2010/2011 Christchurch
earthquakes.
The Christchurch Stadium Trust (the Stadium Trust) was established to
develop and own a replacement temporary stadium in Addington, now known
as AMI Stadium. Construction was completed in March 2012.
It was originally anticipated that AMI Stadium would only be required for five
years, however significant upgrades and maintenance have been carried out
to achieve the necessary regulatory consents to operate until 2022.
In 2012, the Christchurch Central Recovery Plan (the Recovery Plan) was
issued and it included a new permanent 35,000 seat multi-purpose sports and
entertainment venue as an anchor project within a scheme for a future city
vision.
The designated site for this facility is a 6 hectare block bounded by Tuam,
Madras, Hereford and Barbadoes Streets. The Crown has taken responsibility
for acquiring the land across three city blocks adjacent to the Christchurch
CBD and intends completing this process imminently.
The Christchurch City Council’s Long Term Plan (LTP) 2015-2025 currently
has made financial provision for a new stadium, with funding of $253 million
allocated over the final three financial years of the LTP, being 2022-25.
Purpose and scope of this report
The Stadium Trust has been requested by the Minister supporting Greater
Christchurch Regeneration and the Christchurch City Council to develop and
present a pre-feasibility study for the development of a new multi-use arena
(MUA/Arena) which addresses the vision, ambition and principles of the
Recovery Plan.
The Stadium Trust was asked to analyse and test the scope and potential of
the MUA precinct, identify a shortlist of Arena options, and provide
recommendations on the most promising options for the facilities, amenities
and precinct infrastructure necessary to deliver the vision for the site.
The following assumptions were agreed for the purposes of this report:
• that the Blueprint provided the decision on the strategic need for a MUA in
Christchurch; and
• that the site for the MUA is as chosen in the Recovery Plan.
Project Team
The following specialist consultants were engaged to assist this work:
• KPMG (financial and commercial)
• Populous (design)
• RCP (construction, buildability and programme)
• WT Partnership (cost consultant).
Executive summary
5

Approach
Consultation was undertaken with 50 organisations and individuals who could
provide both a local and national perspective on the issues which were within
the scope of the pre-feasibility study. Those consulted included:
— City business and hospitality interests;
— National and local event promoters and venue managers;
— National and local sporting codes;
— Event industry specialists; and
— Property development interests.
To inform the report findings, the study also conducted and undertook:
— A review of relevant materials held by CERA and Otakaro Ltd;
— Consultation on the Christchurch event ‘environment’ and how
Christchurch is perceived as an event destination;
— Construction cost appraisal and financial modelling; and
— A review of
• regional facilities and venues and the functions and current/future state
of those venues;
• national and regional sports, entertainment and event trends;
• Australasia and international event arena design settings and thinking;
and
• third party investment opportunities and precinct investment scope.
Arena Events and Content
The performance, success and financial viability of an MUA or stadium
complex is driven solely by its use, or content and event calendar. To
understand what this might look like for a new venue, reference was had to
Christchurch’s event inventory and also that of New Zealand’s other major
venues.
AMI Stadium has hosted an average of 19 event days per year. Regular hirers
include:
• Crusaders (avg. of 8 events per annum);
• Canterbury Rugby (avg. of 6-7 events per annum);
• Canterbury Rugby League (avg. of 2-3 events per annum); and
• International Rugby (avg. of 1 event per annum) – although no tests have
been scheduled for the 2018 or 2019 international seasons.
The venue has also hosted approximately 1-2 other one-off major events per
year (e.g. NRL, A-League, FIFA U20 World Cup, concerts, Nitro Circus).
Given the city’s current event calendar and destination strategies, and the
temporary stadium’s limitations, the major event calendar at best might
remain at these levels, but will more likely decline over the foreseeable future.
The event activity and potential revenue opportunities a future Christchurch
MUA might contemplate are:
• Turf based sports – predominantly rugby;
• Non-turf based sports and events – concerts, Nitro Circus; and
• Non-event day functions such as dinners, social events, seminars,
meetings.
Executive summary (cont.)
6

Turf-based sports
At the time of the Blueprint, there was a belief that any new MUA needed a
capacity of 35,000 seats in order to attract tier-1 rugby tests. That is an
expectation, not a requirement.
The process for allocation of major sports events by sports bodies and event
owners has, however, undergone significant change in recent years. Cities
rather than venues are now invited to bid on a tendered list of fixtures for one
or two seasons. New Zealand Cricket and New Zealand Rugby now both
adopt this method of fixture allocation. Christchurch has fallen behind other
cities and venues in seeking to attract All Black tests, due to the current AMI
Stadium not representing a strong commercial proposition for NZ Rugby.
Capacity
A covered MUA in Christchurch with a capacity of 30,000 and rectangular field
would offer a financially attractive venue for the All Blacks, despite not having
NZ Rugby’s desired seating capacity.
Consultation with Canterbury Rugby confirmed their intent to be a cornerstone
hirer of the MUA. Their preferred MUA is a covered minimum 30,000 seat
capacity, rectangular facility. A roof is considered essential for rugby given
Christchurch’s climate.
Canterbury and NZ Rugby consider their status to be one of hirer or tenant,
and neither body believes it should commit any capital contribution to the
MUA.
Consultation with other major sports codes confirmed that the MUA, at a
covered 25,000-30,000 seat capacity, would be an attractive location for
international rugby league, NRL and football internationals.
Rectangular v Oval
Cricket is established at Hagley Oval. Cricket interests would like a venue that
has a capacity to ensure allocation of future tier 1 international fixtures and
has floodlights for day/night cricket. However, accommodating oval and
rectangular sports in one venue has proven to be problematic and there is a
very strong consensus amongst consultees that any MUA be rectangular in
configuration.
Executive summary (cont.)
7

Concerts and other large-crowd entertainment events
Concerts will be the MUA’s most profitable events, and deliver significant city-
wide benefits. Concert promoters indicated Christchurch has a number of
natural advantages for hosting concert events. These include:
• A large resident population;
• An international airport which reduces the cost of transportation of concert
infrastructure; and
• A substantial hotel accommodation inventory in the central city.
There was unanimity amongst promoters that a covered venue with a concert
capacity of 35,000 - 40,000 would offer a compelling proposition as a New
Zealand venue, particularly where a second location outside of Auckland was
sought. Concert promoters and venue operators also commented on the huge
advantage in terms of cost, event turnaround times and risk which a hard
surface (concrete, timber etc) enjoys over a sports-based turf surface.
Concerts present significant risk to a sports turf venue due to the need to use
the playing field to host stage infrastructure and overlay, and accommodate
many thousands of concert goers. This risk is significantly greater with venues
exposed to the weather elements.
Exhibitions
Exhibitions such as home and garden shows and food, wine and craft beer
festivals are a growth market for venues in New Zealand. These events
typically have modest budgets and would not look to be hosted in premium
Convention Centre facilities.
Other forms of stadium events in New Zealand have included:
• Moto-cross/Nitro Circus/X-Games/exhibition sport events (eg. visiting
English Premiership League team, LA Galaxy at Westpac Stadium); and
• Major public parades, gatherings.
Not all of these events can work on a turf surface. However, a roof and multi-
purpose flooring system would add significant flexibility, opening up a wide
range of additional use options.
Non event day functions and activation
Most major stadia and arenas in New Zealand have non-event day activity in
the form of hosting functions, business meetings, seminars and small scale
events. The proposed MUA is well located within proximity of the CBD and will
likely be an attractive destination for functions and events. It might be
expected that professional services connected to sport, merchandise outlets
and sports bodies could be potential tenants within the MUA. However these
opportunities have been ear-marked for the Metro Sports Facility in the short-
term. New opportunities of this type however are likely to emerge over time.
Event and destination strategy
The viability and success of a major venue is not simply defined by its
attributes and performance. Cities in Australasia have over the last 20 years
developed economic development strategies around their event hosting.
Melbourne and Adelaide are stand-out examples of what is possible. Success
in future event tender processes will require an aligned venue and
event/destination strategy for the city.
ChristchurchNZ is a recently established (July 2017) tourism, events, city
promotion and economic development agency. How it shapes and delivers the
city’s event and destination strategy will be influential to the success of the
MUA.
Executive summary (cont.)
8

Arena Design Concepts
The most resounding and unequivocal feedback received from event
owners/hirers, promoters, industry experts and locals alike is that the MUA
needs to be weather-proof. In the past year, a number of concerts and
sporting events around the country have been adversely affected by bad
weather, both in terms of event attendances and the quality of experience for
the fans attending.
ETFE Roof option
Forsyth Barr Stadium’s dominant design driver was to ensure the turf would
receive sufficient light and air circulation to meet the required grass growth
requirements. The stadium therefore sits on the site in an east-west
configuration, with the height and profile of the north and south stands
adapted to ensure the appropriate sunlight requirements in winter can be met.
The translucent roof is made of plastic-like material, ETFE. It does allow for
the turf surface to flourish in the enclosed venue. Further testing as to how
this option might actually work in Christchurch, and any additional cost to
manage turf maintenance risks will be required, with a particular focus on:
• Ventilation – mechanical ventilation might be required in the MUA seating
bowl in Christchurch’s summer climate.
• Acoustics - Concert promoters confirmed acoustic challenges exist with an
ETFE roof as the sound is negatively amplified by the ETFE material at
concerts.
• Roof loading – ETFE roof structures tend to be lighter load bearing and
there are limits to the lighting, sound and related event equipment which
can be supported from the roof.
Multi-Use
Multi-use functionality is considered by all to be the single most important
objective of any future Christchurch MUA.
The challenge is to create a MUA with the widest possible utilisation potential,
within which sport can be played, noting that this will be on average about 20
times a year. The predominant “mode” should be of an indoor arena, not a
sports field or a stadium within which other events need to be tolerated.
A venue with a turf surface cannot deliver full multi-use or optimal functionality
as the turf is the “show floor “and must be protected. Significant time and cost
is involved in staging events such as a concert on the turf. This impacts on the
frequency of events and significantly restricts what events or uses can be
hosted in the facility. There are considerable costs in laying a turf protection
system over the field of play. As a general rule, protection is not left down for
more than 5 days.
Retractable roof
Using a part-retractable roof like Millennium Stadium in Cardiff (to let in light
and air for grass) will still restrict multi-use functionality, and the MUA would
still primarily be a stadium or sports arena. Retractable roofs are expensive
solutions and produce quite mixed outcomes in terms of quality of fields of
play.
Covered Arena with a retractable pitch
The most effective and successful means of achieving multi-use is use of a
retractable pitch system where the natural turf is removed from the venue on a
motorised tray. Moving the turf outside the seating bowl also allows the field to
enjoy optimal natural growing conditions.
The inclusion of a concrete pad below the retractable natural turf playing
surface enables considerably more frequent use of the venue and a greater
variety of events to be held. The technology required to deliver a retractable
pitch is now well-established with both the University of Phoenix and more
recently Tottenham Hotspur FC adopting this technology.
Executive summary (cont.)
9

Arena Design options
The design options shortlisted for costing and financial modelling in this report
are:
The seating capacity proposed is 25,000 permanent plus 5,000 temporary, to
reflect the occasional requirement to install 30,000 (eg. an All Black test,
Super Rugby final or local derby). A concert capacity, utilising the field of play
would be 35,000-40,000.
Other Arena options
Three other MUA options were looked at but not taken through a detailed cost
and financial modelling process.
$253 million Arena
The Council Long Term Plan has an allocation of $253 million for a new
stadium in Christchurch. Analysis suggests that for this cost, only a very
modest venue, with the following amenity and attributes, would be achievable:
- 17,500 seats;
- 60% roof coverage of seating bowl;
This option was not considered to support the vision people have for a MUA in
Christchurch and it would in effect establish in permanent-mode what is the
temporary stadium capacity model.
35,000 seats and retractable roof
The roof is prohibitively expensive at $100 million, as is the total cost of this
option at $690 million. The wider community did not support such a large
venue.
Blueprint Option – 35,000 permanent seats and 4,000 temporary seats
This option was not included in the shortlist as it would be too expensive and
the general consensus among stakeholders (Rugby excepted) was that the
capacity was higher than Christchurch needed. Referring to indicative costing
done in 2014, this option today could cost circa $600 million.
Executive summary (cont.)
Option 1 25,000 permanent seats, 5,000 temp seats, 75-80% of seats
under roof cover
Option 2 25,000 permanent seats, 5000 temp seats, Forsyth Barr
Stadium roof
Option 3 25,000 permanent seats, 5,000 temp seats, Solid roof,
retractable pitch
Option 4 30,000 permanent seats, 5,000 temp seats, Solid roof,
retractable pitch
10

The following table presents :
• a breakdown of the costs for each MUA option – assuming a construction start date of January 2019;
• the projected financial performance of each MUA option for the first three years of operation (in real 2017 NZD terms).
These financial projections represent average year attendances and financial performance given the associated event calendar. A number of other operating
model and project assumptions have been made in the course of modelling these projections, particularly in relation to:
• the MUA event calendar and average-year crowd attendances;
• the MUA management model;
• commercial rights allocation and venue memberships; and
• construction cost.
Those assumptions are set out in more detail at Appendix C and Appendix D. Appendix E presents 10-year financial performance projections.
Operations under Options 1 and 2 are projected to generate losses in all years.
Only Options 3 and 4 are projected to record profitable operations at an EBITDA level (earnings before interest, tax, depreciation and amortisation).
Executive summary (cont.)
Option
Total Construction and
Project Cost
(NZ$million)
Design and
Construction time
(years)
EBITDA
$2017 $000
Year 1
Year 2
Year 3
Option 1 - 25,000 seats , 5,000 temp seats
75-80% roof cover
368 4 (933) (1508) (1,313)
Option 2 - 25,000 seats, 5,000 temp seats
Forsyth Barr roof
465 4.8 (377) (464) (377)
Option 3 - 25,000 seats, 5,000 temp seats
Full solid Roof, Retractable pitch
496 5 635 549 635
Option 4 - 30,000 seats, 5,000 temp seats
Full solid roof, Retractable pitch
584 5.5 233 147 233
11

Funding Sources
The Christchurch City Council has an allocation of $253 million in the Long
Term Plan for the development of the venue. This is significantly short of the
estimated capital funding requirement under all options.
Typically there can be a range of funding options available for infrastructure of
this nature including:
• Debt funding - The returns projected for the MUA would be insufficient to
support repayment of debt and using this as a mechanism to fund the MUA
would place significant ongoing financial stress on venue operations.
• Application of regional rate – It is not uncommon in New Zealand for
regional councils to apply a special regional rate to assist with funding
major projects which will benefit the entire region. For example, this
approach was taken for Westpac Stadium and similarly for Forsyth Barr
Stadium.
• Pre-sales of commercial rights - If these rights were pre-sold it would
significantly impact the ongoing operational financial performance of the
venue. Capitalising these future revenues is not recommended.
Other precinct opportunities
In the longer term there may be opportunities within the precinct, or spaces
within the MUA, for alternative commercial developments. A number of
potential complementary associated uses were referred to in the consultative
process. Proponents speculated that private sector investment in these
commercial opportunities might assist with reducing the cost of the project, as
well as generating increased activation and use of the MUA and surrounding
areas. A high level supply and demand assessment by Telfer Young
supported the following conclusions:
— Apartments: Residential accommodation is not likely to be feasible within
the MUA precinct as a complementary development in the short, medium
or potentially longer term.
— Hotel: There is no private sector investor interest in the concept of an
integrated hotel on the MUA site. The economics of hotel developments
are challenging and the reality is that any development of this type
integrated into the MUA would require the MUA precinct owner (the
Council) to take the development risk.
— Retail/ hospitality: There has been an over-investment in this sector in
the city. The emphasis should be on building connections to the existing
and proposed hospitality precincts in Christchurch, rather than integrating
these types of developments within the MUA itself.
— Commercial / office space: Due to over-supply in the city, office or
commercial accommodation is not commercially viable in the short to
medium term, however, this may become viable over the longer term.
— Car parking: Likely to be a longer term demand given the current
availability of vacant land sites of which many are being used for
temporary ‘open’ car parks.
Overall, there appears limited short to medium term demand for the majority
of the identified commercial development opportunities. Discussion with
stakeholders also suggested that while there may have been an opportunity to
co-locate a number of these uses early in the CBD rebuild, much of this
opportunity no longer exists as projects have subsequently been progressed
on other CBD sites. The prevailing view was that any development risk for
these development options would need to be underwritten by the MUA
owner/developer, namely the Council.
Corporate sponsorship or investment
The sponsorship market within the sports sector, and specifically within
Christchurch, is currently subdued when compared to historical levels. The
reality is that in an Australian and New Zealand context there is little evidence
of support for equity investment into stadium or arena projects by private
sector investment funds, corporates or high-net worth individuals. Public
ownership and development is the predominant model.
Executive summary (cont.)
12

Arena options
In summary, the review points to two options which meet the criteria and the
wider objectives held for a MUA:
Model Arena for Christchurch – Covered Arena with a retractable pitch
(option 3)
If there is a preference to confine further analysis to one option, a covered
Arena with a retractable pitch is the stronger proposition.
This option, with a retractable pitch, has a price premium of $31 million over a
Forsyth Barr Stadium model. But the versatility, potential utilisation and event
opportunities this option offers presents a positive financial performance. Also
the retractable pitch provides the character of an arena as opposed to a
stadium, which is still the predominant mode of Forsyth Barr Stadium.
Executive summary (cont.)
13
Option 2 25,000 permanent seats, 5000 temp seats, Forsyth Barr
$465 million Stadium roof
Option 3 25,000 permanent seats, 5,000 temp seats, solid roof,
$496 million retractable pitch

14

2. Background
15

Project background
In the 2010/2011 Christchurch earthquakes, the city’s main outdoor sporting
and entertainment venue, Lancaster Park, was severely damaged. The
Christchurch Stadium Trust (the Stadium Trust) was established to develop
and own a new temporary stadium in Addington, now known as AMI Stadium.
Construction was completed by March 2012.
As part of the recovery planning, the Christchurch Central Recovery Plan (the
Recovery Plan) included the development of a new permanent 35,000 seat
multi-purpose sports and entertainment venue as an anchor project. This
facility was to be part of the new spatial blueprint for the central city. The
Recovery Plan’s vision for this facility was for it to be a world-class venue for
hosting regional, national and international level sporting (e.g. rugby union,
rugby league and football) and entertainment (e.g. concerts) events.
The Crown has acquired land for this facility across three city blocks adjacent
to the CBD (the site). To date, however, no progress on the development has
occurred.
The Christchurch City Council’s Long Term Plan (LTP) 2015-2025 currently
has made financial provision for a new stadium with funding of $253 million
allocated over the final three financial years of the LTP, 2022-25.
The temporary AMI Stadium was originally considered to be required for a
period of approximately five years before being replaced by a permanent
stadium. It currently has building and resource consents which expire in 2022.
Purpose
In May 2017, the Stadium Trust was requested by the Minister supporting
Greater Christchurch Regeneration and the Christchurch City Council to
develop and present a pre-feasibility study for a new multi-use arena
(MUA/Arena) which addresses the vision, ambition and principles of the
Recovery Plan. This document presents the findings of the pre-feasibility
study.
The Stadium Trust was established in January 2012 by the Crown (Minister
for Earthquake Recovery and Minister of Finance) and includes government
and Christchurch City Council appointed trustees. The current trustees are
Jim Anderton (Chair), Trevor Thornton, Neville Harris, Lauren Semple, Tim
Wood, John Filsell and David East.
Scope of this report
This report has been prepared in accordance with the Terms of Reference.
Purpose:
• Undertake a preliminary study to determine, analyse and test the scope
and potential of the MUA precinct, which has regard to Christchurch’s
recovery progress and current event/entertainment trends;
• Identify a shortlist of options, and provide guidance and some
recommendations on the most promising options for the facilities,
amenities and precinct infrastructure necessary to deliver the vision of the
site;
• Address and consider the operational and financial viability of a “model
arena”, with economic attributes to spread the financial burden;
• Consider the MUA business model’s sustainability, including the likely
utilisation profile, its ability to attract events and generate non-event day
revenue (current, future, potential), manage operating costs, draw
events/crowds and increase opportunities for commercial investment; and
• In light of current committed funding, identify the key trade-offs and any
determinative factors that may influence the scope and scale of the project.
Project background, purpose and scope
16

Key considerations:
• An assessment of the right size and configuration of a MUA in the
Canterbury and New Zealand context, taking account of competition
effects from other venues — regional, national and international.
• Objectives for the project, critical success factors, and relative importance
of key trade-offs.
• Opportunities for the wider MUA precinct and additional investment scope
— e.g. sports science/innovation hub, hotel, apartment/ commercial office
mixed use.
• Connections to the vision and the city itself, and integration with the wider
Christchurch Central Recovery Plan.
• Current committed funding (Council $253m and Crown land contribution)
and potential “ballpark” costs.
The following assumptions were agreed for the purposes of this report:
• That the Blueprint provided the decision on the strategic need for a MUA in
Christchurch; and
• That the site for the MUA is as chosen in the Recovery Plan.
Out of Scope:
Much of the analysis undertaken is understandably high-level given the
project is only at the pre-feasibility stage. Specifically, consideration of the
following matters was also out-of-scope for the study:
• Venue and event-specific economics and analysis;
• The MUA construction or delivery mechanism and leadership,
procurement approach and funding model;
• The MUA’s ownership, operating and management structures; and
• Formal market sounding or expressions of interest.
Project team
Specialist consultants were engaged to provide expert advice, and to facilitate
and assist the Stadium Trust to develop and deliver the pre-feasibility study.
The contributing consultants are:
Project background, purpose and scope (cont.)
KPMG
Peter Ball
Chad Gardiner
(Brisbane)
Financial
analysis and
modelling
International consultancy practice with
previous experience in stadia and
arena/event centre business cases.
Dedicated sports advisory practice.
Published ‘A Blueprint for Successful
Stadium Development’.
Populous
Richard Breslin
Chris Paterson
Design
concepts and
advice
Internationally renowned stadium and event
arena designers. Projects include:
ANZ Stadium (Sydney), Etihad Stadium,
MCG, (Melbourne), Suncorp Stadium,
(Brisbane), ICC Sydney Theatre, Eden
Park Redevelopment, Westpac Stadium,
AMI Stadium, Forsyth Barr Stadium,
Emirates Stadium, London Olympic Park,
Wembley, O2 Centre (London).
RCP
Waren Warfield
Construction
Buildability
Programme
Feasibility study and construction
management/risk advisers. NZ projects incl
Eden Park Redevelopment, Westpac Trust
Stadium, Northern Events Centre, Hagley
Oval.
WTP
Pete Sammons
Construction
cost advice
Extensive cost planning and project
feasibility expertise. Major projects –
Auckland Queens Wharf redevelopment,
Sky City Convention Centre, Eden Park
Redevelopment, AMI Stadium project, 2018
Commonwealth Games feasibility report.
17

Approximately 6 hectares of land in the central city has been designated for
the MUA development in the Christchurch District Plan, being the blocks
defined by Tuam, Madras, Hereford and Barbadoes Streets.
The site is well located, within close proximity to the Christchurch CBD,
including:
- The bus interchange;
- Retail and food precincts; and
- Hotel accommodation.
The designated site
MUA Site
Source: Blueprint
18

Permitted designation
activities listed at
Appendix A
19

MUA site – land ownership
This site map indicates the land currently owned by the Crown and the remaining
parcels still in private ownership.
We have identified a number of site issues in addition to land acquisition which
would need to be further investigated in the course of a next stage business case.
These matters include:
• Ground conditions and contaminated material removal;
• Geotechnical engineering and foundation design requirements;
• Ownership and relocation of substations;
• Consenting and designation rules and requirements (including neighbours);
• Vodafone cabling through or near the site;
• Registered easements (if any) and Council/third party underground
infrastructure;
• Relocation of underground services if necessary; and
• Heritage NZ orders associated with remaining /neighbouring buildings (if any).
20
Key
Owned by the Crown
Privately owned

3. Vision for an Arena in Christchurch
21

The Recovery Plan
The Recovery Plan was developed in 2012 by the Christchurch City Council
(CCC), the Canterbury Earthquake Recovery Authority (CERA), and Te
Runanga o Ngai Tahu. The Recovery Plan sets out three key principles which
underpin the strategy for the city’s recovery:
“Canterbury is a powerhouse” to the NZ economy, with a population of over
560,000 residents and contributing around 12 percent of national gross
domestic product (GDP).
“Christchurch is crucial” with 70 percent of the region’s economic output.
“The central city is the heart of greater Christchurch” and is critical to the
recovery of greater Christchurch. Therefore it “…needs to offer the facilities,
services and amenities that would be expected in any equivalent city
worldwide.”
The Recovery Plan identifies the opportunity for the central business district
(CBD) as:
“…a bold vision, commitment from central and local government to invest in
public facilities and to collaborate with other key partners, and a focus on
creating the conditions for private sector reinvestment. The result will be a
dynamic, productive and beautiful city that is worthy of the people of greater
Christchurch.”
The Blueprint Spatial Plan and the anchor projects
Incorporated within the Recovery Plan, the Blueprint Spatial Plan (the
Blueprint) called for “…leading urban design principles to shape the new city
and locate anchor projects that will encourage investment and growth… [and]
allow private investors to undertake development opportunities.”
The anchor projects include a “…large multi-purpose sports and entertainment
venue” which “…will position central Christchurch as a world-class option for
attracting and hosting events.” The proposed features for a Christchurch
stadium were stated to be:
— 35,000 seat capacity (with an additional 4,300 temporary seats);
— Corporate suites and lounge spaces for up to 4,000 people;
— A fixed, transparent roof to allow natural turf growth and enable multiple
uses; and
— Optimum spectator viewing through a rectangular field of play.
Within the Recovery Plan, there was also reference to other anchor projects
which complement or have a connection with the development of the MUA.
They include:
— The Convention Centre Precinct: The Convention Centre will provide
the premier conferencing and exhibition space in Christchurch.
— The Metro Sports Facility: In addition to a wide range of aquatic and
indoor community sports, the facility will also be a host venue for some
elite sports including the Mainland Tactix.
— The Bus Interchange: Provides a major point of public transport access
within two blocks of the MUA site.
Christchurch Central Recovery Plan
22

The MUA development also provides an opportunity to support a number of
goals for Christchurch that are identified by the Christchurch City Council in
several of their key strategic documents, including:
— Christchurch Long Term Plan 2015-2025;
— Christchurch Visitor Strategy 2016;
— Christchurch Economic Development Strategy 2014; and
— Christchurch Events Strategy 2007-2017.
The relevant goals and priorities of each of these documents are presented
below:
Christchurch Long Term Plan 2015-2025
The Strategic Framework for the Long Term Plan currently identifies two
Community Outcomes for Christchurch that may be considered relevant to a
MUA proposal:
1. Strong Communities (including):
- A strong sense of community; and
- Celebration of identity through arts, culture, heritage and sport.
2. A Liveable City (including):
- A vibrant and thriving central city; and
- A well-connected and accessible city.
An additional, relevant Outcome is proposed in the draft Strategic Framework
for the 2018-2028 Long Term Plan, namely:
3. A Prosperous Economy (including):
- A great place for people, business and investment; and
- Modern and robust city infrastructure and community facilities.
Christchurch Visitor Strategy 2016
The aim of the Visitor Strategy is to reclaim Christchurch’s pre-earthquake
role in national tourism, and to use visitor numbers to drive the city and
region’s social and economic development. Key priorities identified in the
Strategy to do this include:
— Increasing shoulder and off-peak visitor numbers;
— Enabling a bigger range of events to enhance liveability, encourage
investment, and attract visitors;
— Prioritising development of the major visitor attractions; and
— Strongly advocating for timely delivery of catalytic anchor projects.
Christchurch Economic Development Strategy 2014
The Economic Development Strategy identifies the main opportunities to
make step-changes to Christchurch’s economy. Key actions include:
— Creating a culturally attractive and vibrant city centre that attracts new
businesses and people, and improves productivity; and
— Delivering the anchor projects.
Christchurch Events Strategy 2007-2017
This strategy was developed by Tourism Resource Consultants and Sports
Impact Ltd, working with the Christchurch City Council Events Strategy
Project Group. Goals of the Events Strategy include:
— Having a vibrant calendar of events that enhances Christchurch’s
reputation as a place to live and visit; and
— Increasing the capability of Christchurch to host major events.
A new Events Strategy for Christchurch is in draft and likely to be published in
the near future by ChristchurchNZ, the City’s new events, tourism and
economic development agency.
Alignment with Council Goals and Strategies
23

We consulted with a number of groups and organisations who could provide
both a local and national perspective on the issues which were within the
scope of the pre-feasibility study, including
— Local councils;
— City business and hospitality interests;
— National and local event promoters and managers;
— National and local sporting codes;
— Event industry specialists; and
— Property development interests.
The list of consultees is attached at Appendix B.
There was broad support for the goals identified in the Recovery Plan and the
Council’s strategic documents, and that the way a MUA might contribute to
these goals would be best achieved by a development that:
1. Is a fitting replacement for lost heritage: Christchurch has not had a
permanent sports and concert venue since damage to Lancaster Park.
There was a clear consensus that the new venue should be viewed, not as
a “nice to have,” but as an essential piece of community infrastructure built
to a 21st Century standard.
2. Re-establishes Christchurch’s identity as a sporting capital: The
Christchurch Visitor Strategy recognises that the earthquakes robbed
Christchurch of the three themes that makes up its external identity – a
Garden City; its English Heritage (anchored by the Cathedral); and a
Sporting Capital. All three need to be reclaimed, and a major sporting
facility is an essential element of this.
3. Is embraced by the community: The MUA needs to be able to capture the
hearts of the Christchurch community and be a reflection of the city and
region.
Community Value – a Liveable City
A consistent message was delivered by many people in our consultation group,
that the non-quantifiable social benefits of a MUA in Christchurch should be
considered along with any economic analysis. These include:
• The ‘liveability’ of Christchurch and its reputation as a 21st century
city with “things to do”. Almost everyone spoken to observed that
Christchurch currently lacks the volume of major sport, concerts and other
events to be the kind of vibrant city that attracts people to visit, live and
work.
• Ability to attract major events. Many people cited the Ed Sheeran
concerts in Dunedin, and Adele concerts in Auckland, as an example of
Christchurch’s current struggle to compete for musical and sporting events.
• The attraction and retention of young people to the city who are
currently choosing to study and work elsewhere.
• Return of city and regional pride and recognition.
• Keeping expenditure in the city and within the Canterbury region.
We were told that the days leading up to the Adele concert in Auckland in
March 2017 were the busiest of the year at Christchurch airport, as locals
travelled to attend the event.
• The return of private sector investment confidence to the city.
Delivery of the committed anchor projects in the Blueprint is generally
considered to be critical to the continued momentum of the recovery.
Desired Outcomes for Christchurch
24

4. Arena Content
25

AMI Stadium event calendar
Event calendar (excl. community events)
Event type 2014 2015 2016 2017
International Rugby 1 1 1 1
Super Rugby 9 7 8 9
Mitre 10 Cup 5 7 7 6-8
Rugby League 0 4 4 2
Football 0 6 1 0
Concert 0 1 0 1
Other 0 1 0 0
Total 15 27 21 19-21
Designed and built in 100 days, AMI Stadium was constructed using
modular buildings, a fabric roof and a scaffolding seat system. It was
always intended to be temporary, with an anticipated life of 5 years.
While the stadium amenity is quite basic, it has nonetheless hosted a
reasonably strong event calendar in the 2012-2016 period. More recently,
however, it has missed out on potential stadium concert opportunities
and future international rugby tests.
Given the city’s current event calendar and destination strategies, and
the temporary stadium’s limitations, the major event calendar at best
might remain at these levels, but is more likely to decline over the
foreseeable future.
The stadium has hosted an average of 19 event days per year over the
three years from 2014 to 2016 (excluding community events and the U20
FIFA World Cup matches in 2015). Regular hirers include:
• Crusaders (avg. of 8 events per annum);
• Canterbury Rugby (avg. of 6-7 events per annum);
• Canterbury Rugby League (avg. of 2-3 events per annum); and
• International Rugby (avg. of 1 event per annum) – although no tests
have been scheduled for the 2018 or 2019 international seasons.
The event calendar, and that of other New Zealand stadia, does provide
a telling insight into the very few days of the year sport and turf-based
events are actually played.
The venue has also hosted approximately 1-2 other one-off major events
per year (e.g. NRL, A-League, FIFA U20 World Cup, concerts, Nitro
Circus).
In 2017, AMI Stadium will host 21 events, assuming Canterbury make
the play offs in the Mitre 10 Cup. The stadium will host 2 matches in the
Rugby League World Cup.
Opened March 2012, Cost $34 million
Capacity 17,956 (21,268 with additional temporary seating)
Key hirers Crusaders (Super Rugby), Canterbury Rugby, Mitre 10 Cup
26
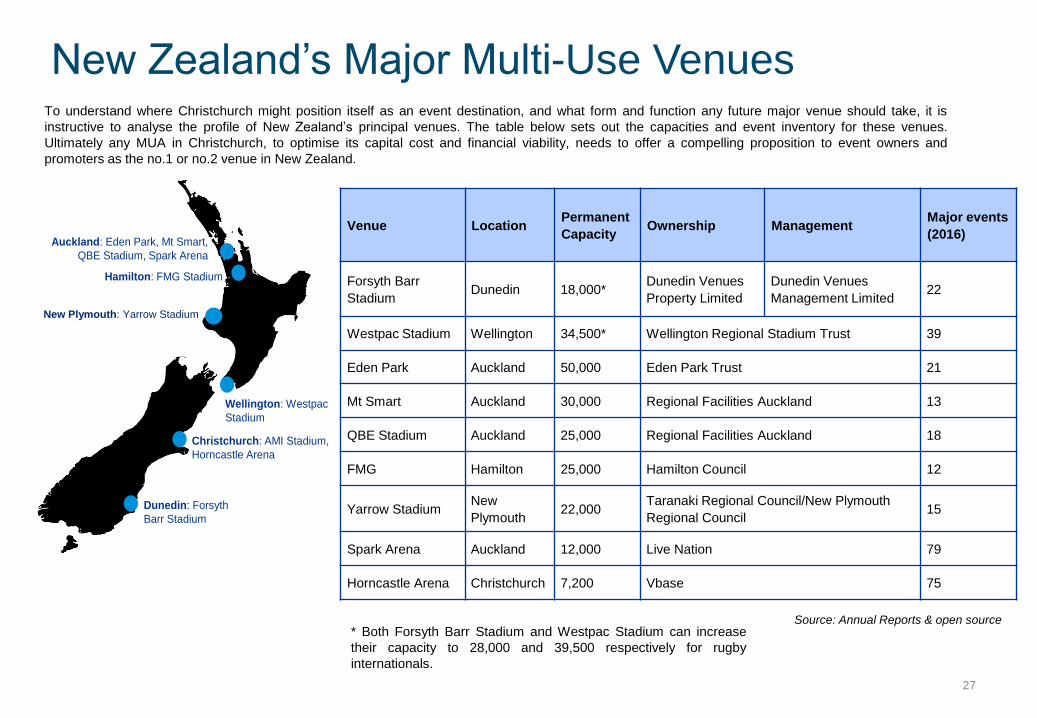
To understand where Christchurch might position itself as an event destination, and what form and function any future major venue should take, it is
instructive to analyse the profile of New Zealand’s principal venues. The table below sets out the capacities and event inventory for these venues.
Ultimately any MUA in Christchurch, to optimise its capital cost and financial viability, needs to offer a compelling proposition to event owners and
promoters as the no.1 or no.2 venue in New Zealand.
New Zealand’s Major Multi-Use Venues
Venue Location Permanent
Capacity Ownership Management
Major events
(2016)
Forsyth Barr
Stadium Dunedin 18,000*
Dunedin Venues
Property Limited
Dunedin Venues
Management Limited 22
Westpac Stadium Wellington 34,500* Wellington Regional Stadium Trust 39
Eden Park Auckland 50,000 Eden Park Trust 21
Mt Smart Auckland 30,000 Regional Facilities Auckland 13
QBE Stadium Auckland 25,000 Regional Facilities Auckland 18
FMG Hamilton 25,000 Hamilton Council 12
Yarrow Stadium New
Plymouth 22,000
Taranaki Regional Council/New Plymouth
Regional Council 15
Spark Arena Auckland 12,000 Live Nation 79
Horncastle Arena Christchurch 7,200 Vbase 75
Source: Annual Reports & open source
Christchurch: AMI Stadium,
Horncastle Arena
Dunedin: Forsyth
Barr Stadium
Wellington: Westpac
Stadium
Auckland: Eden Park, Mt Smart,
QBE Stadium, Spark Arena
Hamilton: FMG Stadium
New Plymouth: Yarrow Stadium
* Both Forsyth Barr Stadium and Westpac Stadium can increase
their capacity to 28,000 and 39,500 respectively for rugby
internationals.
27

The event activity and potential revenue opportunities a Christchurch MUA
might contemplate are:
1. Turf based sports – predominantly rugby;
2. Non-turf based sports and events – concerts, Nitro Circus; and
3. Non-event day functions such as dinners, social events, seminars,
meetings.
Sports Events
The process for allocation of major turf sports events by sports bodies and
event owners has undergone significant change in recent years.
Mega event owners such as World Rugby (formerly the IRB), the ICC, FIFA
and the Rugby League World Cup (2017) have for some time allocated their
fixtures through a tendering and bid process to cities, rather than negotiate
and deal solely with the city’s stadium. Domestically, since Rugby World Cup
2011, this model has been adopted by the major codes when allocating their
international fixtures. Cities, rather than venues, are now invited to bid on a
tendered list of fixtures for one or two seasons. New Zealand Cricket and New
Zealand Rugby now both adopt this method of fixture allocation.
There is genuine competition and cities, particularly where a stadium has
limited capacity, are expected to offer a cash incentive or other value to the
event owner in order to present a city plus venue revenue proposition.
Christchurch, because of more pressing priorities, and its small stadium
capacity has been challenged to lift its competitiveness in this tender
environment. New Zealand Rugby has not awarded any test matches to
Christchurch for the 2018 and 2019 seasons.
While a new MUA with a high seat yield would offer significant advantage in
such negotiations going forward, ultimately success in future tender processes
will also require the city to develop an aligned venue and event/destination
strategy which is mandated and resourced to secure an ambitious event
calendar for the city.
Arena events and content
NZ v Tahiti, AMI Stadium
16 October 2012
Source: Fifa.com
28

Christchurch, as the largest city in the South Island, has traditionally hosted
one All Black’s test match each year. In recent years, however, AMI Stadium
has only attracted tier 2 tests (apart from the South Africa test in 2016).
AMI Stadium offers by some margin the lowest financial return to NZ Rugby,
due to the costs of installing additional temporary seats, the venue’s modest
capacity and relatively poor amenity. At the time of the construction of the
stadium in 2011, NZ Rugby committed to play tests each year for the then
intended 5 year life of the stadium, 2012 to 2016. It is unlikely the venue would
have been allocated fixtures on its merits.
Increasingly Christchurch is falling behind other cities and venues in seeking
to attract All Black tests, due to a number of factors:
• The venue is too small and does not represent a strong commercial
proposition for NZ Rugby;
• Christchurch as a city has been less willing or able to provide financial and
value-in-kind incentives to attract All Black tests when compared to other
cities/regions;
• A number of other cities have increased the competitive nature of their bids
with some augmenting their stadium seat yield with significant cash or
contributions to the costs NZ Rugby would normally incur in its staging of
the event (eg. temporary infrastructure and event overlay); and
• Christchurch is facing strong competition from Dunedin given Forsyth Barr
Stadium has a capacity reaching 28,000, has a roof and Dunedin City
Council has been willing to invest in events for the stadium.
Capacity
At the time of the Blueprint, there was a belief that any new MUA in
Christchurch needed a capacity of 35,000 seats in order to attract tier 1 tests.
That seems to no longer be an absolute pre-requisite, although the venue
must be able to offer a highly competitive return to New Zealand Rugby.
Forsyth Barr Stadium with 28,000 seats has hosted several tier 1 tests and
QBE Stadium (Albany) will host South Africa in September, with a capacity of
25,000 seats.
NZ Rugby indicated a strong preference for a seating capacity of at least
35,000 for All Blacks tests. They did recognise, however, that there is
currently only one venue in New Zealand that meets this criterion, namely
Eden Park (two venues if Westpac Stadium installs its temporary seating).
One of the key commercial drivers for All Blacks events is total ticket yield (i.e.
gross ticketing revenue). Seating capacity is a strong contributor to this metric,
however, ticket pricing is equally important. For example, it is understood that
the ticket yield for Westpac Stadium and Forsyth Barr is comparable despite
Westpac Stadium having an additional 6,500 seats available for sale. This is
due to the larger proportion of higher value seats available for sale at Forsyth
Barr given both the configuration of the venue (rectangular) and the fact that
all seats are under cover.
A covered MUA in Christchurch with a capacity of 30,000 therefore would
offer an attractive venue for the All Blacks, despite not having NZ Rugby’s
desired seating capacity.
A 30,000 seat, covered, and rectangular MUA would offer the best seat yield
in New Zealand after Eden Park, and therefore make a compelling case for
annual tier 1 test matches. Strengthening this proposition are factors such as:
• Christchurch has the largest population in the South Island;
• Christchurch has an international airport;
• Christchurch has greater accommodation and entertainment options when
compared to other competitive locations in the South Island; and
• Canterbury is New Zealand’s most successful rugby province.
NZ Rugby saw its role solely as one of hirer. However an annual test match is
significant in terms of the financial model for any venue in New Zealand and
NZ Rugby could be expected to support a new MUA in Christchurch with a
firm commitment of test matches. It has previously made such commitments
to Eden Park for the Rugby World Cup redevelopment in 2010 and the AMI
Stadium in 2012.
New Zealand Rugby
29
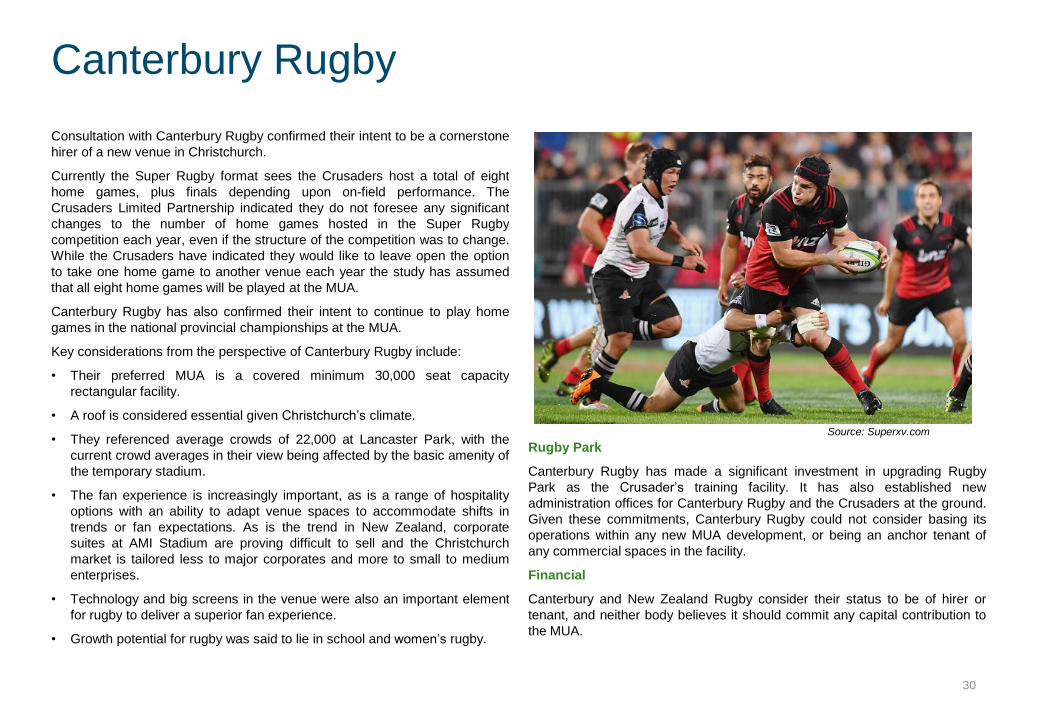
Consultation with Canterbury Rugby confirmed their intent to be a cornerstone
hirer of a new venue in Christchurch.
Currently the Super Rugby format sees the Crusaders host a total of eight
home games, plus finals depending upon on-field performance. The
Crusaders Limited Partnership indicated they do not foresee any significant
changes to the number of home games hosted in the Super Rugby
competition each year, even if the structure of the competition was to change.
While the Crusaders have indicated they would like to leave open the option
to take one home game to another venue each year the study has assumed
that all eight home games will be played at the MUA.
Canterbury Rugby has also confirmed their intent to continue to play home
games in the national provincial championships at the MUA.
Key considerations from the perspective of Canterbury Rugby include:
• Their preferred MUA is a covered minimum 30,000 seat capacity
rectangular facility.
• A roof is considered essential given Christchurch’s climate.
• They referenced average crowds of 22,000 at Lancaster Park, with the
current crowd averages in their view being affected by the basic amenity of
the temporary stadium.
• The fan experience is increasingly important, as is a range of hospitality
options with an ability to adapt venue spaces to accommodate shifts in
trends or fan expectations. As is the trend in New Zealand, corporate
suites at AMI Stadium are proving difficult to sell and the Christchurch
market is tailored less to major corporates and more to small to medium
enterprises.
• Technology and big screens in the venue were also an important element
for rugby to deliver a superior fan experience.
• Growth potential for rugby was said to lie in school and women’s rugby.
Rugby Park
Canterbury Rugby has made a significant investment in upgrading Rugby
Park as the Crusader’s training facility. It has also established new
administration offices for Canterbury Rugby and the Crusaders at the ground.
Given these commitments, Canterbury Rugby could not consider basing its
operations within any new MUA development, or being an anchor tenant of
any commercial spaces in the facility.
Financial
Canterbury and New Zealand Rugby consider their status to be of hirer or
tenant, and neither body believes it should commit any capital contribution to
the MUA.
Canterbury Rugby
Source: Superxv.com
30
International Rugby League
New Zealand Rugby League (NZRL) has only hosted five major international
rugby league matches in New Zealand since 2010 (outside of Rugby League
World Cup events), with none of these matches being hosted in Christchurch.
Going forward, however, the international calendar has been scheduled such
that New Zealand will host an average of two home rugby league test
matches each year.
Consultation with NZRL suggests that a new venue with a capacity of 25,000-
30,000 seats in Christchurch would make it an attractive location for test
matches.
National Rugby League (NRL)
AMI Stadium hosted an NRL event between the Panthers and the Warriors in
2016 and is looking to continue to host NRL events in the future.
Consultation with the NRL and one NRL club suggest there is an appetite for
clubs to take home games to alternative venues (including venues in New
Zealand) for a range of reasons, including securing a guaranteed financial
return and engaging with a new market – for fans, corporates and playing
talent.
Key criteria for securing events include:
• Financial return;
• Hosting the event towards the start of the season;
• Quality of the venue and playing surface;
• Reasonable population size and corporate market;
• A general predisposition to enjoyment of rugby league; and
• Appropriate event management expertise at the venue.
A new venue with a minimum seat capacity of 25,000 and the wider attributes
of Christchurch more generally was considered by NRL stakeholders to offer
a favourable proposition for clubs to consider.
Football
Consultation with NZ Football indicated an MUA with a capacity of 25,000
could attract:
• international football;
• A-League events. (This event could be either a pre-season friendly or a
regular season game.)
The venue could also host local / provincial football events, however, it was
generally considered the venue would be too large and cost-prohibitive for
such events.
Five-aside football, known as futsal, is a rapidly growing format of football and
could be played at the MUA, dependent on its final design.
World Cups or Tournament Events
All codes have marquee events, such as World Cups or regional
tournaments which can include international qualifying fixtures (eg.
Confederations Cup, League Four Nations Cup and age group World
Cups). AMI Stadium will host 2 Rugby League World Cup matches in
November 2017 and hosted matches in the 2015 FIFA U-20 Men’s
Football World Cup.
All codes are developing and promoting new formats and competitions
within their sport.
While attracting some of these marquee events can require significant
financial contributions from a venue or host city, having a modern high
quality venue can be compelling in its own right to secure top level or play-
off games in these events. For example, FIFA requested Forsyth Barr
Stadium be included as a venue for the Men’s U20 Football World Cup in
2015 even though the venue did not initially put itself forward to host
games. The quality and covered nature of the venue was the appeal for
FIFA.
A 30,000 seat capacity would be a minimum size for ensuring the best
games in these tournaments were secured.
31

Ngai Puna Wai The new Ngai Puna Wai development in Christchurch will host the following
turf-based sporting codes in future:
• Canterbury Rugby League
• Hockey
• Athletics
Cricket Cricket is established at Hagley Oval.
Cricket interests would like a venue that has a capacity to ensure its allocation
of future tier 1 international fixtures and has floodlights for day/night cricket.
Cricket’s international broadcasting market requires day/night fixtures to be
played in New Zealand and Hagley Oval does not allow that.
Endeavouring to accommodate oval and rectangular sports in one venue has
proven to be problematic, expensive and unsatisfactory in the past. Inevitably
the compromise required to be made leaves no one satisfied and presents
considerable challenges for a venue to manage.
The Recovery Plan proposed a rectangular venue and there remains a very
strong consensus any new MUA be rectangular in shape.
32

Concerts have always, by some margin, been a stadium or arena’s most
profitable events. Not only does the stadium enjoy significant benefits but
there are city-wide effects. Retail and accommodation interests in
Christchurch report the Bruce Springsteen concert weekend was the busiest
period for them in recent years. AMI Stadium has held just two major concerts
since opening in 2012, being the Foo Fighters in 2015 and Bruce Springsteen
in 2017. This compares to the five concerts hosted at Forsyth Barr Stadium
across 2015 and 2016 alone.
The size and quality of AMI Stadium has made attracting concerts very
difficult, particularly when competing with Forsyth Barr Stadium which can
guarantee that weather will not impact the event. Promoters consulted,
however, indicated Christchurch has a number of natural advantages for
hosting concert events over Dunedin (and other locations in the South Island).
These include:
• A large resident population;
• An international airport which makes it more efficient and lower cost for the
promoter to transport the infrastructure and overlay required to host a
major concert; and
• A substantial hotel accommodation inventory in close proximity to venues
and other entertainment precincts.
Consultation with concert promoters observed that a roofed venue with a
concert capacity of 40,000 (including standing areas on the field), would very
quickly attract the major concert events looking for a South Island venue. AMI
Stadium hosted 25,000 (in the stands and on the field) for the Foo Fighters
and 32,000 for the Springsteen concert.
Indoor/Outdoor
When discussing the value of a covered venue which removed the weather
elements from their financial risk, promoters also noted the importance of the
roof structure being capable of carrying the sound and lighting systems. In this
regard, Spark Arena (formerly Vector Arena) in Auckland was considered
favourably. Forsyth Barr much less so. It was observed that getting the roof
structure and accessibility to it right can save a concert promoter up to
$200,000 and provide a significant competitive edge when bidding for a
concert.
Promoters also noted that typically they would look to place a stadium concert
in Auckland and one other location in New Zealand. Christchurch would
compete with Wellington (Westpac Stadium) or Dunedin for the second
concert. A covered MUA capable of hosting 35,000-40,000 concert goers
would therefore be expected to be in a very strong position to secure any
second New Zealand concert.
Turf v hard surfaces
Concert promoters and venue operators also commented on the advantage in
terms of cost, event turnaround times and risk which a hard surface (concrete,
timber etc) enjoys over a sports-based turf surface. There is significant risk to
a sports turf venue which hosts a concert due to the need to use the playing
field to host stage infrastructure and overlay and accommodate many
thousands of concert goers. Recently the effects of the Adele concert at an
Australian venue led to the cancellation of the remaining AFL games
scheduled at that venue. All venue operators referred to the risks to the turf
and the additional set up costs as being challenging issues to factor into the
hosting of a concert. This risk is significantly greater with venues exposed to
the weather elements.
Operating model
There are new dynamics at play in the operating model for the major
Australasian concert promoters. Frontier Touring, Live Nation Entertainment
(merged with Ticketmaster) and TEG Live (Ticketek) have all sought
alignment to, or vertical integration with, a ticketing company. Many venues in
Australasia contract and allocate their ticketing rights to one company.
Concert promoters are believed to be motivated to place concerts in venues
where either their ticket agent has the ticketing rights, or the venue will allow
the promoters preferred ticketing agent to manage ticketing to the concert.
Forsyth Barr is a Ticketmaster venue and Live Nation, which owns
Ticketmaster, would see advantage in that venue over others when allocating
concerts. Ideally a venue should look for an agnostic ticketing system which
allows it to plug in any ticketing agency system. Venue capacity and amenity
are important but equally a venue’s operating and business model ought to be
flexible enough to adapt to concert industry trends.
Concerts
33
Exhibitions
Review of the event calendar of other New Zealand venues has identified
exhibition events as a growth market for venues.
Westpac Stadium, and to a degree Forsyth Barr, host a wide range of
exhibitions and shows each year including the Home and Garden Show,
Beervana, the Food Show, the Better Home & Living Show and the
Armageddon Expo. Daily attendances are reported at between 2,000 and
10,000.
On average Westpac Stadium has hosted six such exhibitions per year over
the past three years. Forsyth Barr Stadium has also hosted between two and
three exhibitions per year over this period.
Westpac Stadium largely uses the concourse of the venue to host these
events, however, the field can also be used as required.
These events typically have modest budgets and would not look to be hosted
in premium Convention Centre facilities.
Other events
In addition to concerts, other forms of stadium entertainment and events can
include:
• Moto-cross/Nitro Circus (which has been held twice at AMI Stadium);
• X-Games;
• Classic car gatherings, boat shows;
• Military Tattoos;
• Kapa haka competitions;
• Exhibition sports events (eg an English Premiership League team);
• Major public gatherings, parades and celebrations/staging post for large
community events eg. marathons, triathalons, fun runs; and
• Pop-up warehouse shopping / sale events.
These events are important to how a community embraces the venue
because often the audience is of a different character to the conventional
sports fan.
Not all of these events can work on a turf surface. However, a roof and multi-
purpose flooring system would add significant flexibility in type and frequency
of use, and would open up a wide range of additional utilisation options.
Christchurch hosts a number of large community and festival events in Hagley
Park, the success and enjoyment of which is too often weather-dependent.
It could be expected that some of these occasions would be more successful
if set up in a covered arena, eg, the night noodle market, Lantern festival,
Diwali Festival.
E-Sports
Arenas around the world are now hosting computer gaming competitions with
large prize pools, which can draw large crowds. This sport is growing in
popularity, particularly in South East Asia, and Vector Arena is the only venue
in New Zealand at the moment that can cater to the NZ E-Sports Federation’s
requirements. Christchurch could potentially attract an event with a covered
MUA.
Other large-crowd entertainment events
34

In addition to the turf-based sport, non-turf events and concerts, there is a
further source of potential revenue for the MUA – functions and small scale
events in and around the venue.
Given that most stadia and arenas do not host major sporting or entertainment
events every day, venues typically attempt to generate non-event day activity
at the venue through hosting functions, business meetings, seminars and
small scale events. Such events are held in the corporate suites and function
rooms which are otherwise only in use on game days.
The success of function and hosting activities at stadia is varied and is
dependent upon a number of key factors, including:
• Location – whether the venue is central to other amenities and key
business and population centres;
• The style and flexibility of facilities;
• Competition from surrounding facilities (e.g. hotels, conference centres);
• The quality and cost of what is offered;
• The venue’s point of difference; and
• Transport and parking.
Venues such as Eden Park and Westpac Stadium have strong functions and
events businesses. The proposed MUA is well located within proximity to the
CBD and will likely be an attractive destination for functions and events. There
is a possibility of additional revenue from these events, and these can provide
a steady income stream for the venue caterer – which strengthens the value
proposition for that provider.
It should be noted there are several local venues which offer similar facilities
and services to the MUA’s potential non-event day functions, meetings and
seminars.
Most hirers or users will look to the venue which works best for their occasion
and purpose, so competition effects may be minimised. However, a
complementary management approach to the utilisation of these venues will
be beneficial to their viability and success.
Community Use
The vision for the MUA is to be more than just a venue hosting sporting,
entertainment and other commercial events. It is expected to be a venue that
the community of Christchurch and greater Canterbury are proud of, one that
they call their own and one which they can use and interact with on a regular
basis. The MUA ought to be made be available for a wide range of community
uses (for example school sports competitions and junior grade sports) but it is
acknowledged that at times there can be tensions because:
• Community users are often unable to pay for use of the venue and its
associated services on the day (such as cleaning costs.). The venue
owner will often have to subsidise.
• Community use can clash with other uses such as training sessions or
designated event days.
Invariably one of the key determinants of the level of community access to a
venue is the impact of any damage to the grass playing surface. If this risk is
removed or managed, then the community use availability increases
significantly.
Non-event day opportunities
AMI Stadium, Chch
Stadium challenge
Source: stadiumchallenge.co.nz
35

The viability and success of a major venue is not simply defined by the
venue’s attributes and performance. Cities in Australasia have over the last 20
years developed economic development strategies around their event hosting.
Melbourne is a stand-out example of what is possible, having built a strategic
and economic vision around delivering a year-round calendar of sport and
performing arts in the city.
The redevelopment of Adelaide Oval and that city’s integration of the venue
into a wider event and destination strategy also offers insights into what a
modern, iconic venue can offer to a city’s economic and destination
development strategies. Recent economic impact studies of a number of
major events in New Zealand indicate the scale of national and regional
benefits these have delivered:
Within a New Zealand context, Auckland’s Tourism, Events and Economic
Development agency (ATEED) has been very effective in building an events
and entertainment calendar which has integrated the relevant venues and
wider city aspirations to present Auckland as a successful event hosting
destination.
Given the tendering and bid processes sports event owners have now
adopted, and the competitive nature of the concert and entertainment sector,
the success of a MUA in Christchurch can only be assured if there is a well-
resourced and effective city agency driving a highly coordinated destination
and events strategy.
ChristchurchNZ is a recently established (July 2017) tourism, events, city
promotion and economic development agency. How it shapes and delivers the
city’s economic development vision will be influential to the success of the
MUA and Christchurch’s many other entertainment and hospitality venues.
ChristchurchNZ will also be the city’s event procurer and negotiator and its
effectiveness in this role will have a significant impact on whether any MUA
truly delivers the potential and aspiration the city expects. The business case
for a MUA cannot be considered in isolation from the city’s event and
destination strategy.
Event and Destination Strategy - ChristchurchNZ
Auckland 7 summer concerts in 2017
Including Adele, Guns N’ Roses,
Justin Bieber
$37 million and 126,000 visitors
(Source: Regional Facilities Auckland)
Wellington 2016 Wellington International
Arts Festival
Royal Edinburgh MilitaryTattoo
$10 million and 100,000+ visitors
(Source: BERL)
Christchurch Cricket World Cup 2015
Bruce Springsteen concert 2017
$15 million (Source: PWC report 2015)
$10 million ( Source: Vbase)
Dunedin Forysth Barr Stadium – 6 years $165 million
(Source: Dunedin Venues Ltd)
New Zealand Cricket World Cup 2015
World Masters Games 2017
$110 million & 2,300 jobs
(Source: PWC report 2015)
$53 million and 266,000 visitor nights
(Source: ATEED)
Bruce Springsteen, AMI Stadium 36

5. Arena Design Concepts and Trends
37

In addition to providing comments on how a MUA could support Christchurch’s strategic goals for regeneration, consultees were asked to identify operational
attributes that were essential in a modern MUA. The comments provided were from the perspective of:
• spectators seeking the best possible experience;
• hirers and users of the venue seeking quality, ease of operation and strong financial returns; and
• venue operators seeking an operationally efficient and cost-effective facility.
There were differences of opinion on relative priorities and on some issues, however, overall there was high-level agreement on many of the features that a new
MUA would need. These included:
Venue design concept
Attribute Why it is important
Design The MUA will be a highly visible building in the heart of the city and as such should add visual interest to the
environment. It must engage with its surroundings, have active edges and not be a defensive concrete structure.
The MUA must be an arena within which rectangular sport can be played.
Covered The sentiment and support for a roof was so strong that many commentators and consultees believe that if the
MUA is not covered, the city should not commit to the facility. Concert promoters and sports interests reflected
the same views, and all referenced the success of Forsyth Barr Stadium. Without the roof, the MUA simply
couldn’t be a competitive, attractive or successful venue. It would be a provincial stadium.
Capacity The MUA needs to be big enough to secure major events (e.g. concerts and All Black tests), but not so large that
it loses atmosphere for smaller events. The MUA should be placed behind only Eden Park for concerts, rugby
and other international sport. Many referred to the need for Christchurch to have a larger venue than Dunedin’s
Forsyth Barr Stadium and to be the South Island’s premier venue. Concert promoters said a capacity of 35,000 to
40,000, and sports interests all referred to 30,000 being sufficient. A strong consensus formed around the
proposition of a permanent seating capacity of 25,000, with 5,000 temporary seats.
Multi-use The MUA must be ‘multi-use’ i.e. flexible and adaptable for a wide range of uses to ensure its utilisation is
maximised wherever possible. This includes utilisation at a minimum for sports events, major concerts and
entertainment events, smaller sports and community events. The scale of the investment was considered to
require more than a sports stadium. Many people felt the narrative should be “Christchurch wants an Arena within
which rugby can be played, not a rugby stadium.”
38
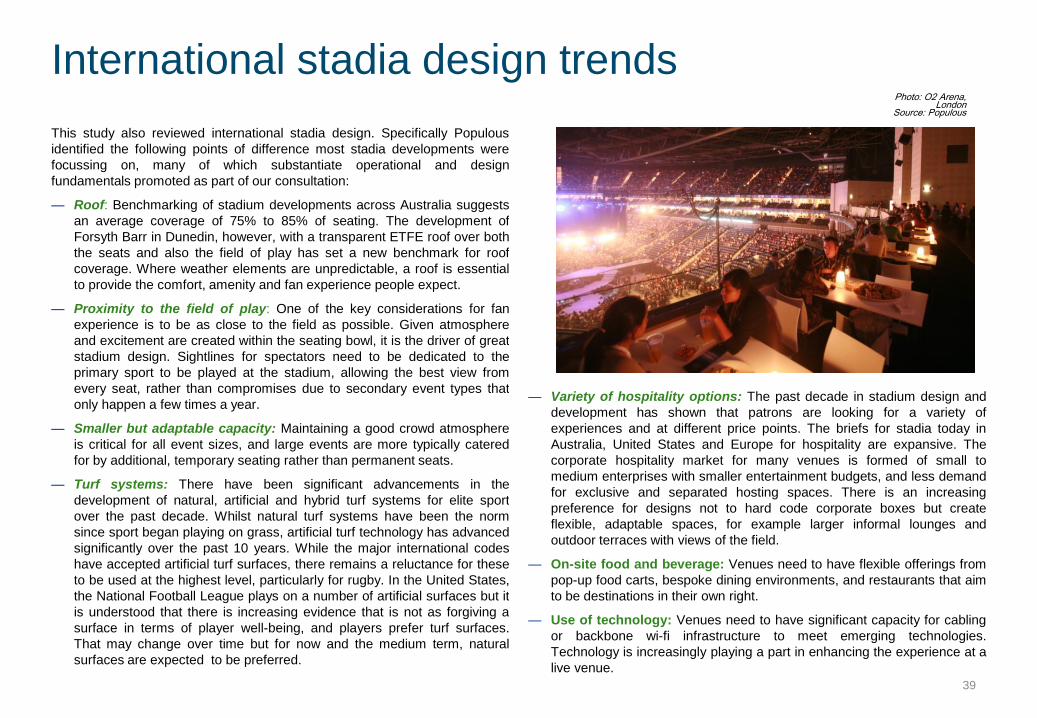
This study also reviewed international stadia design. Specifically Populous
identified the following points of difference most stadia developments were
focussing on, many of which substantiate operational and design
fundamentals promoted as part of our consultation:
— Roof: Benchmarking of stadium developments across Australia suggests
an average coverage of 75% to 85% of seating. The development of
Forsyth Barr in Dunedin, however, with a transparent ETFE roof over both
the seats and also the field of play has set a new benchmark for roof
coverage. Where weather elements are unpredictable, a roof is essential
to provide the comfort, amenity and fan experience people expect.
— Proximity to the field of play: One of the key considerations for fan
experience is to be as close to the field as possible. Given atmosphere
and excitement are created within the seating bowl, it is the driver of great
stadium design. Sightlines for spectators need to be dedicated to the
primary sport to be played at the stadium, allowing the best view from
every seat, rather than compromises due to secondary event types that
only happen a few times a year.
— Smaller but adaptable capacity: Maintaining a good crowd atmosphere
is critical for all event sizes, and large events are more typically catered
for by additional, temporary seating rather than permanent seats.
— Turf systems: There have been significant advancements in the
development of natural, artificial and hybrid turf systems for elite sport
over the past decade. Whilst natural turf systems have been the norm
since sport began playing on grass, artificial turf technology has advanced
significantly over the past 10 years. While the major international codes
have accepted artificial turf surfaces, there remains a reluctance for these
to be used at the highest level, particularly for rugby. In the United States,
the National Football League plays on a number of artificial surfaces but it
is understood that there is increasing evidence that is not as forgiving a
surface in terms of player well-being, and players prefer turf surfaces.
That may change over time but for now and the medium term, natural
surfaces are expected to be preferred.
— Variety of hospitality options: The past decade in stadium design and
development has shown that patrons are looking for a variety of
experiences and at different price points. The briefs for stadia today in
Australia, United States and Europe for hospitality are expansive. The
corporate hospitality market for many venues is formed of small to
medium enterprises with smaller entertainment budgets, and less demand
for exclusive and separated hosting spaces. There is an increasing
preference for designs not to hard code corporate boxes but create
flexible, adaptable spaces, for example larger informal lounges and
outdoor terraces with views of the field.
— On-site food and beverage: Venues need to have flexible offerings from
pop-up food carts, bespoke dining environments, and restaurants that aim
to be destinations in their own right.
— Use of technology: Venues need to have significant capacity for cabling
or backbone wi-fi infrastructure to meet emerging technologies.
Technology is increasingly playing a part in enhancing the experience at a
live venue.
International stadia design trends Photo: O2 Arena,
London Source: Populous
39
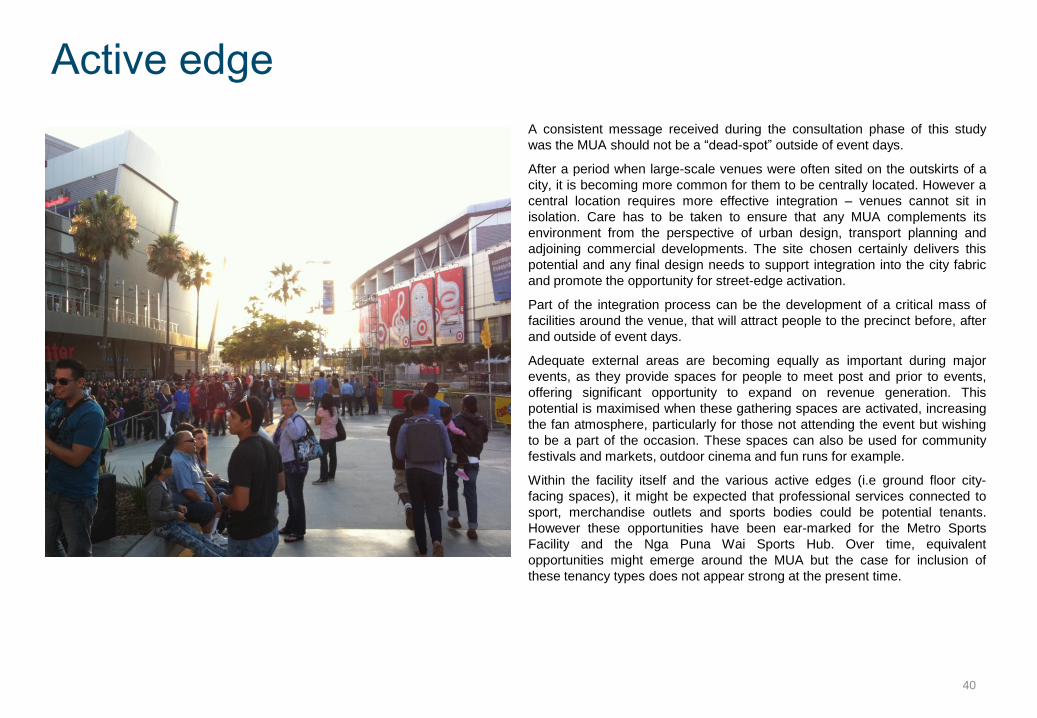
A consistent message received during the consultation phase of this study
was the MUA should not be a “dead-spot” outside of event days.
After a period when large-scale venues were often sited on the outskirts of a
city, it is becoming more common for them to be centrally located. However a
central location requires more effective integration – venues cannot sit in
isolation. Care has to be taken to ensure that any MUA complements its
environment from the perspective of urban design, transport planning and
adjoining commercial developments. The site chosen certainly delivers this
potential and any final design needs to support integration into the city fabric
and promote the opportunity for street-edge activation.
Part of the integration process can be the development of a critical mass of
facilities around the venue, that will attract people to the precinct before, after
and outside of event days.
Adequate external areas are becoming equally as important during major
events, as they provide spaces for people to meet post and prior to events,
offering significant opportunity to expand on revenue generation. This
potential is maximised when these gathering spaces are activated, increasing
the fan atmosphere, particularly for those not attending the event but wishing
to be a part of the occasion. These spaces can also be used for community
festivals and markets, outdoor cinema and fun runs for example.
Within the facility itself and the various active edges (i.e ground floor city-
facing spaces), it might be expected that professional services connected to
sport, merchandise outlets and sports bodies could be potential tenants.
However these opportunities have been ear-marked for the Metro Sports
Facility and the Nga Puna Wai Sports Hub. Over time, equivalent
opportunities might emerge around the MUA but the case for inclusion of
these tenancy types does not appear strong at the present time.
Active edge
40

Venues today have to compete with the comfort and quality of the experience
provided at home by the greatly expanded content of broadcast and digital
media, and the affordability of home entertainment systems.
Creating a sense of atmosphere and emotion is what differentiates the live
experience from the home experience. The expectation of a live venue today
is one of “no compromise” when it comes to proximity to the action, levels of
comfort and levels of service.
The most resounding and unequivocal feedback received from event hirers,
promoters, industry experts and locals alike is that the MUA needs to be
weatherproof. The Highlanders recently enjoyed dry, open running rugby
against the British & Irish Lions under cover at Forsyth Barr Stadium despite
miserable winter conditions outside. The week before at AMI Stadium, fog
threatened and the wet ground under foot made for challenging conditions for
the Crusaders. The America’s Cup parade was also a celebration affected by
harsh weather conditions.
Eliminating weather (particularly winter conditions and the Christchurch
easterly) provides certainty of experience, greater confidence around crowd
numbers and the opportunity to secure more weather-dependent events.
Many non-turf events currently occur within the relatively short summer
period, and more activity is needed through the shoulder and off-peak
seasons. Both the Christchurch Visitor Strategy and the Christchurch Events
Strategy highlight the difficultly in maintaining a calendar of events throughout
the year. A major venue which is unaffected by wet or cold weather and
therefore able to successfully host year-round events will be a significant
factor in supporting strategies for visitor growth.
Compromising on the fan experience is viewed as the biggest risk to the
success of the MUA. In order to get fans out of their homes or watching in
bars, there is a clear expectation that the venue needs to offer “home theatre
in a live environment.”
Take the elements out of play
41
Photo top left: Adele concert , Mt Smart Stadium 26 March 2017
Source: Dailymail.co.uk
Photo top right: Jade Stadium Chch, Super Rugby Final 27 May 2006
Photo above: Crowd queuing for Guns n Roses concert, Westpac Stadium,
2 Feb 2017 Source: Stuff.co.nz

Forsyth Barr Stadium’s dominant design driver was to ensure the turf would
receive sufficient light and air circulation to meet the required grass growth
requirements. The stadium therefore sits on the site in an east-west
configuration, with the height and profile of the north and south stands
adapted to ensure the appropriate sunlight requirements in winter can be met.
The translucent roof is made of plastic-like material, ETFE. It does allow for
the turf surface to flourish in the enclosed venue.
An in-situ turf surface however cannot deliver full multi-use or functionality as
the turf is the venue’s “show floor” and must be protected. Significant time and
cost is involved in staging events such as a concert on the turf. This impacts
on the frequency of events and significantly restricts what events or uses can
be hosted in the facility. Multi-use in this option is sub-ordinate to the
requirement to preserve and protect the sports turf.
A number of other matters also require consideration with this option in a
Christchurch setting. They are:
Ventilation
In Dunedin’s climatic conditions, Forsyth Barr Stadium does not need
mechanical ventilation in the seating bowl. Christchurch’s summer climate and
temperature variations are likely to create significant heat build up in this
mode and require expensive mechanical treatment of the environment.
Equally the turf maintenance risks are understood to increase with the more
intense glass house effects induced by these higher temperatures.
Acoustics
Quality acoustic performance is a vital requirement to make a venue
successful, both in terms of the internal environment, and in limiting the
amount of noise that can escape into the surrounding environment.
A steel roof will generally contain noise well, and can produce acceptable
internal acoustic performance for concerts if a perforated steel liner is applied
to the roof surface. An ETFE roof will provide an excellent acoustic outcome
for sport, but very negatively impacts on entertainment events such as music
concerts as the sound is amplified by the material. Concert promoters
confirmed these sound challenges exist under an ETFE roof structure.
Roof loading
ETFE roof structures tend to be lighter load bearing and there are some limits
to the lighting, sound and related event equipment which can be supported
from the roof.
ETFE Roof option
Forsyth Barr Stadium, Dunedin
Source: Populous
42

43

Multi-use functionality is considered by all to be the single most important
objective of any future Christchurch arena. Sport, and rugby in particular, are
acknowledged to be the cornerstone hirer and user of the facility, however
both to drive its financial viability, and ensure it is an active, vibrant space in
the city, the MUA must be able to host a large number and wide variety of
events. It must also play to a wider community than the sports sector. There
is a risk that the facility, whilst capable of hosting a wider range of events, will
compromise its main uses to an extent that the venue does nothing well. In
developing a level of flexibility, it is essential therefore to understand the
primary, secondary and occasional or ancillary uses of the MUA .
In stadium-mode, the challenge is to create a MUA with the widest possible
utilisation potential, within which sport can be played (noting that this will be
on average about 20 times a year), not a stadium within which other events
need to be tolerated. The following features define the degree to which an
option can be considered “multi-use”:
— Adaptability and versatility: An adaptable arena can host a variety of
events with different surface requirements. Venues with a turf-only
surface that host events such as concerts, Nitro Circus or X-games need
to place a protective surface over the pitch for the duration of these
events. Where additional materials such as soil are required as a base
for the event, then there is very limited scope for a turf-based venue to
host an event. In addition to the operational costs of doing this, there are
limitations to the number and type of events that can be held in this
manner without significant damage to the condition of the turf. Harder
surfaces such as concrete and timber offer almost unlimited scope for
events, particularly motorcycle, car or other vehicle displays or
competitions. Turf-based venues typically require considerable time and
cost to set up for events, which carry a risk of damage to the turf.
— Effectively operates in all weather conditions: An open-air stadium,
even one with 100% roof coverage of the seating bowl, will be affected by
rain on the playing surface as well as rain drifting to parts of the seating
bowl. The effects of rain, wind chill, and temperature extremes diminish
the experience for those attending, adversely impact on crowd
attendances, and potentially affect or compromise the hosting of an
event. In contrast, a fully enclosed MUA provides a consistent year-round
experience and removes weather effects from all elements of an event.
Promoters and event owners also put a premium on venues which take
the elements out of play and reduce their financial risk.
— Scalability: Scalability refers to the ability of a venue to increase or
reduce its capacity to suit each event. For example, venues which are not
scalable often suffer a loss of atmosphere when the crowd in attendance
is significantly below full capacity. A scalable venue can accommodate
additional spectators for major events by installing temporary (or
“demountable”) seats as well as reducing the capacity for smaller events
– most commonly by “curtaining” off the upper seating tiers (e.g. Spark
Arena in Auckland is scalable from 1,800-12,000).
— Flexible configuration: A flexible venue will be able to be configured
differently for events other than the “standard” rectangular configuration
for football, rugby, etc. This includes reducing the event surface area for
events such as court-based sport, or providing different orientations for
concerts such as situating a stage along the side-line of one stand.
— Ease of event set-up: Concerts and similar entertainment events will
usually require good accessibility in order to quickly bump in and bump
out large volumes of equipment, as well as good back of house facilities.
A venue without these features can find it more difficult to successfully
secure events which require substantial overlay or temporary
infrastructure requirements.
Retractable roof
Using a part-retractable roof like Millennium Stadium in Cardiff (to let in light
and air for grass) will still restrict multi-use functionality, and the MUA would
still primarily be a stadium or sports arena. This option was considered for
the purposes of this report but ruled out as prohibitively expensive.
Multi-use
44

An alternative to covering a turf surface is to have a grassed playing pitch for
turf-based sports which can be retracted, leaving a concrete pad beneath it
for all other events. The inclusion of a concrete pad below the retractable
natural turf playing surface enables considerably more frequent use of the
venue and a greater variety of events to be held. The technology required to
deliver a retractable pitch is now well-established with both the University of
Phoenix and Tottenham Hotspur Football Club adopting this technology.
Other venues include the Sopporo Dome in Japan and the Gelre Dome in
The Netherlands.
Whether natural or artificial, turf for sporting events requires ongoing
maintenance. Of primary concern to venue and grounds keeping staff is the
risk of damage, to what is an elite playing surface, from point loads from
stages, heavy vehicles and simply having many people at an event on the
turf. There are considerable costs in laying a turf protection system over the
field of play. There is also a limit as to how long the grass can be covered. As
a general rule, protection is not left down for more than 5 days. To address
this issue, a number of venues internationally have implemented a
retractable pitch system where the natural turf is removed from the venue on
a motorised tray to allow non-sporting events to be hosted within the stadium
without impacting the natural turf surface. Moving the turf outside the seating
bowl also allows the field to enjoy optimal growing conditions.
The agility and adaptability of this technology means events turnaround times
are quicker, leaving more events days to offer promoters. The turf manager
for the University of Phoenix Stadium was consulted on the performance,
cost and feasibility of this technology. He particularly referenced the
retractable pitch’s ability to allow the stadium to host a large number of
events of a wide variety, and for the venue to swap event modes very
quickly, increasing its utilisation well beyond what a natural turf venue could
achieve.
Retractable Field of Play – a point of difference
Top right: University of Phoenix Stadium
Above: Exterior view of retractable pitch
Opposite: Interior view of the show floor
Source: Populous
Opposite: Sapporo Dome, Japan
Source: Youtube.com and
japantimes.co.jp
45
University of Phoenix Stadium

46
University of Phoenix Stadium retractable pitch
Field within stadium Field retracting Field retracted - outside

There are three turf removal systems that are in use, two of which use a
mechanical system-
(1) The single tray option, as per University of Phoenix Stadium – see
over
This is a single tray the size of the field of play and grass surrounds. It slides
out of the arena on a series of rails embedded into the concrete platform. The
end of the stadium, which has minimal seats and structure, has roller shutters
running the width of the façade which are opened when the tray is moving in
or out. There are also props that are swung up whilst the tray is moving that
help support the façade. This system takes 65 minutes to relocate in or out,
requiring four staff to supervise.
Our cost consultants WT Partnership have indicatively priced the single tray
option for the MUA at approximately $24 million (NZD).
(2) The multi- tray option, as per Tottenham Hotspur – see opposite
This is multi tray system where the field of play is divided into several
trays. With Tottenham it is being broken into three equal trays, along its
width. When the trays are retracted it exposes a synthetic American Football
field of play. It has been developed as a multi- tray system because the arena
has a complete 360 degree seating bowl. The two outer trays move to the
side first to the clearance required around the columns, with all three sliding
under the stand and under the external public plaza. There is no natural
daylight, however there is a network of grow lights to maintain grass growth as
well as irrigation and air movement. The field is able to be fully maintained
when parked under the plaza. This system is anticipated to take 3.5 hours
with four staff to prepare for the movement, two hours to move the pitch, then
four hours for pitch finalisation.
(3) The palletised pitch, as originally proposed for Millennium Stadium
Cardiff.
This is a fairly straight forward system where the field of play is made up of a
series of 1m by 1m trays. It is a ‘carpet tile’ approach. The trays sit on a
concrete pad. The trays are either rotated around within the arena, or
removed and replaced as needed from a grow yard outside of the arena. The
principles of this system are sound, however it requires considerable time and
labour to move or replace the individual trays. This cost is significant when an
event requires full use of the concrete pad. There is also considerable cost in
having a nursery farm for the palletised tray system. The ongoing operational
costs have impacted on the use of this system as a regular turf management
and protection option. While originally proposed, this system is not used by
Millennium Stadium Cardiff. They have insitu turf which is replaced
periodically.
Retractable pitch technology
47

48

6. Arena Options
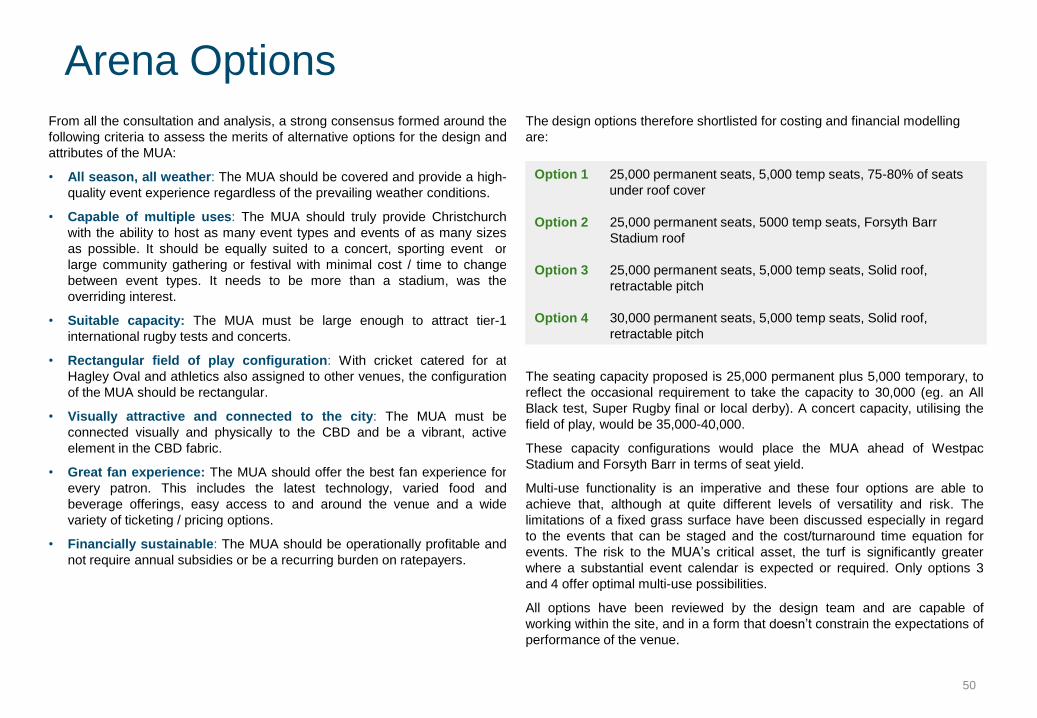
From all the consultation and analysis, a strong consensus formed around the
following criteria to assess the merits of alternative options for the design and
attributes of the MUA:
• All season, all weather: The MUA should be covered and provide a high-
quality event experience regardless of the prevailing weather conditions.
• Capable of multiple uses: The MUA should truly provide Christchurch
with the ability to host as many event types and events of as many sizes
as possible. It should be equally suited to a concert, sporting event or
large community gathering or festival with minimal cost / time to change
between event types. It needs to be more than a stadium, was the
overriding interest.
• Suitable capacity: The MUA must be large enough to attract tier-1
international rugby tests and concerts.
• Rectangular field of play configuration: With cricket catered for at
Hagley Oval and athletics also assigned to other venues, the configuration
of the MUA should be rectangular.
• Visually attractive and connected to the city: The MUA must be
connected visually and physically to the CBD and be a vibrant, active
element in the CBD fabric.
• Great fan experience: The MUA should offer the best fan experience for
every patron. This includes the latest technology, varied food and
beverage offerings, easy access to and around the venue and a wide
variety of ticketing / pricing options.
• Financially sustainable: The MUA should be operationally profitable and
not require annual subsidies or be a recurring burden on ratepayers.
The design options therefore shortlisted for costing and financial modelling
are:
The seating capacity proposed is 25,000 permanent plus 5,000 temporary, to
reflect the occasional requirement to take the capacity to 30,000 (eg. an All
Black test, Super Rugby final or local derby). A concert capacity, utilising the
field of play, would be 35,000-40,000.
These capacity configurations would place the MUA ahead of Westpac
Stadium and Forsyth Barr in terms of seat yield.
Multi-use functionality is an imperative and these four options are able to
achieve that, although at quite different levels of versatility and risk. The
limitations of a fixed grass surface have been discussed especially in regard
to the events that can be staged and the cost/turnaround time equation for
events. The risk to the MUA’s critical asset, the turf is significantly greater
where a substantial event calendar is expected or required. Only options 3
and 4 offer optimal multi-use possibilities.
All options have been reviewed by the design team and are capable of
working within the site, and in a form that doesn’t constrain the expectations of
performance of the venue.
Arena Options
Option 1 25,000 permanent seats, 5,000 temp seats, 75-80% of seats
under roof cover
Option 2 25,000 permanent seats, 5000 temp seats, Forsyth Barr
Stadium roof
Option 3 25,000 permanent seats, 5,000 temp seats, Solid roof,
retractable pitch
Option 4 30,000 permanent seats, 5,000 temp seats, Solid roof,
retractable pitch
50

Option 1 is a 25,000 permanent seat rectangular MUA with north-south
orientation.
The capacity of the stadium could be increased to 30,000 to cater for
blockbuster events (e.g. All Blacks test) through the use of temporary seating
at the open end of the stadium.
The venue will include:
— A fixed (hybrid) grass playing surface suitable for rugby, league and
football events;
— Roof coverage of 75%-80% (to the drip line) of permanent seats;
— A diverse, modern and flexible premium product offering;
— Facilities and services largely in line with comparable modern second tier
stadia (e.g. video screens, food and beverage, etc.); and
— Player and officials facilities in line with major international sporting code
requirements.
The estimated capital cost for this option is $368 million.
Option 1 – 25,000 permanent seats, 5,000 temp seats, 75-80% of seats under roof cover
Project details
Capacity
Sports mode - 25,000 (plus 5,000 temporary
seating)
Concert mode – 40,000 (includes use of field for
concert -goers)
Reduced mode – not available
Premium seating 2,500 (10% of total)
Roof coverage 75%-80% of seating, no roof over field of play
Retractable field of play No
Technology Video screens only
Construction cost (escalated
on completion $) $368m (source: WT Partnership)
51

Option 2 is a 25,000 permanent seat rectangular MUA with a east-west
orientation.
The capacity of the stadium could be increased to 30,000 to cater for
blockbuster events (e.g. All Blacks test) through the use of temporary seating
at the open end of the stadium. Under this Option the venue would have a full
fixed ETFE roof, similar to that of Forsyth Barr Stadium. The inclusion of the
roof under this Option will provide a superior event experience and increased
functionality when compared to Option 1.
The venue will also include:
— A fixed (hybrid) grass playing surface suitable for rugby, league and
football events;
— A diverse, modern and flexible premium product offering;
— Facilities and services in line with comparable modern second tier stadia
(e.g. video screens, food and beverage, technology, etc.); and
— Player and officials facilities in line with major international sporting code
requirements.
The estimated capital cost for this option is $465 million.
Option 2 – 25,000 permanent seats, 5000 temp seats, Forsyth Barr Stadium roof
Project details
Capacity
Sports mode - 25,000 (plus 5,000 temporary
seating)
Concert mode – 40,000 (includes use of field for
concert-goers)
Reduced mode – not available
Premium seating 2,500 (10% of total)
Roof coverage 100% of seating and field of play (transparent
ETFE)
Retractable field of play No
Technology Video screens plus industry standard technology
Construction cost (escalated
on completion $) $465m (source: WT Partnership)
52

Option 3 is a flexible, multi-use, roofed MUA designed to facilitate the widest
possible utilisation for sporting and non-sporting events. The venue will
include a fixed steel roof, including over the field of play, with 170 ton loading
at the open end to cater for major indoor arena style concerts.
— Capacity: Permanent capacity of 25,000 for sporting events (increasing to
30,000 with temporary seating) and capacity for 40,000 for concert events
(including standing areas on the field).
— Reduced mode: Designed to enable the hosting of smaller events (eg.
10,000 guests).
— Retractable pitch: Retractable (hybrid) grass playing surface which can
be moved outside to ensure appropriate sunlight and growing conditions.
— Concrete pad: A concrete slab will be laid to enable a high degree of
flexibility for a wide range of events to be hosted when the turf pitch is
outside the venue.
The venue will also include:
— A diverse, modern and flexible premium product offering;
— Facilities and services in line with comparable modern second tier stadia
(e.g. video screens, food and beverage, technology, etc.); and
— Player and officials facilities in line with major international sporting code
requirements.
The estimated capital cost for this option is $496 million.
Option 3 – 25,000 permanent seats, 5,000 temp seats, solid roof, retractable pitch
Project details
Capacity
Sports mode - 25,000 (plus 5,000 temp. seating)
Concert mode – 40,000 (includes use of field for
concert –goers)
Reduced mode – 10,000
Premium seating 2,500 (10% of total)
Roof coverage 100% of seating and field of play (solid)
Retractable field of play Yes
Technology Video screens plus industry standard technology
Construction cost
(escalated on completion $) $496m (source: WT Partnership)
53

Option 4 is a flexible, multi-use, roofed MUA designed to facilitate the widest
possible utilisation for sporting and non-sporting events.
The venue will include a fixed steel roof, including over the field of play, with
170 ton loading at the open end to cater for major indoor arena style concerts.
— Capacity: Permanent capacity of 30,000 for sporting events (increasing to
35,000 with temporary seating) and capacity for 45,000 for concert events
(including standing areas on the field).
— Reduced mode: Designed to enable the hosting of smaller events (eg.
10,000 guests).
— Retractable pitch: Retractable (hybrid) grass playing surface which can
be moved outside to ensure appropriate sunlight and growing conditions.
— Concrete pad: A concrete slab will be laid to enable a high degree of
flexibility for a wide range of events to be hosted when the turf pitch is
outside the venue.
The venue will also include:
— A diverse, modern and flexible premium product offering;
— Facilities and services in line with comparable modern second tier stadia
(e.g. video screens, food and beverage, technology, etc.); and
— Player and officials facilities in line with major international sporting code
requirements.
The estimated capital cost for this option is $584 million.
Option 4 – 30,000 permanent seats, 5,000 temp seats, solid roof, retractable pitch
Project details
Capacity
Sports mode - 30,000 (plus 5,000 temp. seating)
Concert mode – 45,000 (includes use of field for
concert-goers)
Reduced mode – 10,000
Premium seating 3,000 (10% of total)
Roof coverage 100% of seating and field of play (solid)
Retractable field of play Yes
Technology Video screens plus industry standard technology
Construction cost (escalated
on completion $) $584m (source: WT Partnership)
54

The following table presents a breakdown of the costs for each MUA option.
Cost include escalation.
Capital cost comparison
Cost item ($NZmillion)
Option 1
25,000 seats
5,000 temp seats
80% roof cover
Option 2
25,000 seats
5,000 temp seats
Forsyth Barr roof
Option 3
25,000 seats
5,000 temp seats
Full Solid Roof
Retractable pitch
Option 4
30,000 seats
5,000 temp seats
Full solid roof
Retractable pitch
Enabling and site preparation works 11 11 11 11
Site remediation, services, concrete
pad 29 28 45 51
Main stands and seating bowl 146 169 178 213
Roof options
Roof over 80% seating bowl
Full Transparent roof (ETFE)
Full roof
44
115
104
125
Pitch options
Pitch-natural
Pitch under ETFE roof
Retractable pitch
3
4
3
24
3
24
FF&E Fit Out, ICT, technology, lights 99 100 104 135
External concourses 36 38 27 22
Total Construction and Project Cost Source: WT Partnership 368 465 496 584
*The above costs assume a construction start date of January 2019 and includes professional fees, contingency, delivery project team and escalation. Excludes land price.
Assumes piling foundation system.
Design and Construction time (years) 4 4.8 5 5.5
55

The following table presents the projected financial performance of each MUA Option for the first three years of operation (in real 2017 NZD terms).
These financial projections represent average year attendances and financial performance given the associated event calendar. A number of other operating
model and project assumptions have been made in the course of modelling these projections, particularly in relation to:
• the MUA event calendar and average-year crowd attendances;
• the MUA management model;
• commercial rights allocation and venue memberships; and
• construction cost.
Those assumptions are set out in more detail at Appendix C and Appendix D.
Appendix E presents 10 year financial performance projections.
Operations under Options 1 and 2 are projected to generate losses in all years. Only Options 3 and 4 are projected to record profitable operations at an EBITDA
level. While Options 3 and 4 are projected to generate operating cash surpluses, these surpluses are not sufficient to fully fund estimated longer term asset
refurbishment costs (e.g. a 20-25 year venue refresh).
Projected financial performance - summary
Christchurch Financial projections ($000's, real 2017$ terms)
Year 1 Year 2 Year 3 Year 1 Year 2 Year 3 Year 1 Year 2 Year 3 Year 1 Year 2 Year 3
Revenue
Event revenue - core sports 2,204 1,819 2,204 2,556 2,470 2,556 2,556 2,470 2,556 2,650 2,563 2,650
Event revenue - other 380 190 - 1,263 1,263 1,263 2,589 2,589 2,589 2,839 2,839 2,839
Other revenue 1,100 1,100 1,100 1,475 1,475 1,475 1,685 1,685 1,685 1,685 1,685 1,685
Total revenue 3,684 3,109 3,304 5,294 5,208 5,294 6,830 6,744 6,830 7,174 7,087 7,174
Expenses
Staffing cost 553 553 553 794 794 794 1,025 1,025 1,025 1,076 1,076 1,076
Repairs & maintenance 1,899 1,899 1,899 2,510 2,510 2,510 2,664 2,664 2,664 3,219 3,219 3,219
Other expenses 2,165 2,165 2,165 2,368 2,368 2,368 2,507 2,507 2,507 2,645 2,645 2,645
Total expenses 4,617 4,617 4,617 5,672 5,672 5,672 6,195 6,195 6,195 6,940 6,940 6,940
EBITDA (933) (1,508) (1,313) (377) (464) (377) 635 549 635 233 147 233
Events 18 18 17 24 23 24 36 35 36 36 35 36
Option 2 Option 3 Option 4Option 1
Option 1 25,000 + 5,000, 75-80% of seats under roof cover
Option 2 25,000 + 5000, Forsyth Barr Stadium roof
Option 3 25,000 + 5,000, solid roof, retractable pitch
Option 4 30,000 + 5,000, solid roof, retractable pitch
56

Three other MUA options were looked at but not taken through a detailed cost
and financial modelling process. They are, however, options which could be
expected to be part of any debate about a future MUA and therefore some
commentary about them can inform that debate.
A $253 million Arena
The Council Long Term Plan has an allocation of $253m for a new stadium in
Christchurch. Analysis suggests that for this cost, only a very modest
provincial venue, with the following amenity and attributes, would be
achievable:
- 17,500 seats;
- 60% roof coverage of seating bowl;
- 1 video screen, no ribbon advertising boards; and
- Reduced amenities and premium product.
This option, although within the available budget, was not considered to
support any of the city planning objectives or the vision people have for a
MUA in Christchurch. It would in effect establish in permanent-mode what is
the temporary stadium capacity, set up and model. It would fail badly any test
of multi-use and simply not compete for All Black tests, major sporting fixtures
and concerts.
35,000 seats and a retractable roof
This option was considered (at the capacity rugby interests favoured), using a
part-retractable roof like Millennium Stadium in Cardiff to allow light and air to
the turf field. It would have restricted multi-use functionality and be primarily a
stadium or sports arena. The roof is prohibitively expensive at $100 million, as
is the total cost for this option of $690 million. The wider community did not
support such a large venue.
Blueprint option
The Central City Recovery Plan envisaged a 35,000 permanent capacity
venue (with 4,000 additional temporary seating) with a transparent ETFE roof
across the entire venue, similar to the roof at Forsyth Barr Stadium. This
option was not included in the shortlist as it would be too expensive and the
general consensus among stakeholders (Rugby excepted) was that the
capacity was higher than Christchurch needed. Referring to indicative costing
done in 2014, this option today could cost circa $600 million.
Other Arena Options
57

Option 1
This design fails much of the aspiration and expectation the city has for a new
MUA. It has the least potential to achieve the multi use objectives, being
principally a sports stadium design. With marginally more roof cover, it has a
limited point of difference to Lancaster Park. It also has returned the weakest
financial performance of the options. From all consultation, it is unlikely to find
any favour with major event hirers and the community. While new, it would
nevertheless be seen as a provincial venue competing with the likes of
Hamilton, Napier and New Plymouth for tier-2 type events. It’s reliance on a
turf surface would also limit its utilisation and wider appeal to the community.
Certainly the cost is prohibitive at $368 million for what the venue delivers.
Option 2
The Forsyth Barr Stadium equivalent option offers the capacity and potential
financial attractiveness to rugby and concert promoters. There are potential
risks and cost implications around turf management and heat build-up in the
Christchurch environment which would need closer investigation. It has
significant limitations in relation to its versatility and variety of use because of
the need to protect the turf. It is essentially a covered sports stadium.
Because of these limitations, its projected use and event opportunities affect
its financial performance, which is not as strong as the preferred model. The
cost to build at $465 million is $30 million less than the preferred option, but
noting any mechanical requirement to treat the air will potentially eliminate this
cost differential.
Option 4
A covered 35,000 MUA with a retractable pitch provides Christchurch with the
best opportunity to secure events, and offer a financial return to an event
promoter or owner potentially equivalent to Eden Park. It would present
credentials of an order to be considered New Zealand’s premier venue.
However, the cost of providing the additional 5,000 permanent seat capacity is
questionable when these seats are likely to be used one or twice, at most, a
year.
Model Arena for Christchurch – Option 3
58
Option 3
This covered Arena with a retractable pitch fulfils the “Arena within which
rugby is occasionally played” objective. The retractable pitch has a price
premium of $31 million over a Forsyth Barr Stadium model. But the versatility,
potential utilisation and frequency of events this option offers presents a more
compelling forecast financial performance. A fixed roof with good load-
bearing systems and a concrete surface provides unlimited potential to host
the fullest range of events and uses. Importantly, it allows the venue to open
itself to year round use at community level and in a form which is
demonstrably not a sports stadium. As such, it ought to engender wider
public appeal as a facility capturing the vision and aspiration the Recovery
Plan espoused. More than that, the retractable field technology is a proven
game-changing innovation and if included in a striking MUA design, will set
the venue apart as one of a kind.
The capacity of 25,000 plus 5,000 temporary seats resonated with a
significant majority of people, including sport and event promoters.
Atmosphere and fan experience are increasingly valued by events and the
consensus was 25,000 seats would retain this character for most events.
Very few times of the year would the extended 30,000 seat capacity be
required. This option’s rectangular configuration and roof would provide an
extremely competitive seat yield proposition to rugby and other major sports
codes. It would carry a strong expectation of securing annual tier-1 test
matches.

The Christchurch City Council has an allocation of $253 million in the Long
Term Plan for the development of the venue. This is significantly short of the
estimated capital funding requirement under all options. The following table
presents the estimated funding shortfall under each option.
Note: The $253 million from Council is allocated in the last three years of the
Long Term Plan – 2022/23-2024/2025. If the MUA was not to be built until this
time, the cost escalation would result in higher capital costs and a larger
shortfall.
A range of funding options were referred to in the consultation phase. These
included:
— Debt funding: Many stadia across New Zealand have been funded partly
through borrowings. In most instances, however, the operating surpluses
of the venue are insufficient to repay the principal or even cover interest
payments. There is evidence of Councils repaying loans on behalf of
venues as it becomes apparent the venue will not have sufficient means to
do so from operational returns. Similarly the returns projected for the MUA
would be insufficient to support repayment of debt and using this as a
mechanism to fund the MUA would place significant ongoing financial
stress on venue operations. For example, a loan of $30m at an interest
rate of 5% would result in annual interest payments in the order or $1.5m.
This would exhaust the operating surplus of the venue with no ability to
repay principal.
— Application of a regional rate: It is not uncommon in New Zealand for
regional councils to apply a special regional rate to assist with funding
major projects which will benefit the entire region. This approach was
taken for Westpac Stadium and for Forsyth Barr Stadium.
— Pre-sales of commercial rights: Wellington Regional Stadium Trust
generated up-front revenue of approximately $45m from the pre-sale of
commercial rights at the venue including venue memberships, corporate
suites, and naming and sponsorship rights. Consultation suggests the
commercial market in Christchurch could not support such an aggressive
pre-sale of commercial rights. In addition, capitalisation of future revenue
would significantly impact the ongoing operational financial performance
of the MUA.
Corporate sponsorship or investment
The sponsorship market within the sports sector, and specifically within
Christchurch, is currently subdued when compared to historical levels. A
number of factors are driving this trend:
• High levels of competition for sponsorship dollars within the sports sector;
• Higher expectations of the 'return' on a sponsorship investment;
• Increasing opportunities and preference for sponsorship outside the sport
sector (e.g. arts and cultural activities, social and environmental initiatives,
charitable endeavours);
• Sponsors looking at Christchurch have moved on from the earthquake
sentiment factor and are now applying a commercial lens to their
commitment to this market; and
• Christchurch’s business profile is dominated by SMEs, so limited large
locally-based corporates with the capacity to be major sponsors.
The reality is that in an Australian and New Zealand context there is little
evidence of support for equity investment into stadium or arena projects by
private sector investment funds, corporates or high-net worth individuals.
Public ownership and development is the predominant model.
Funding sources
Current funding shortfall ($m)
Option 1 Option 2 Option 3 Option 4
Development cost 368.0 465.0 496.0 584.0
Council contribution 253.0 253.0 253.0 253.0
Shortfall 115.0 212.0 243.0 331.0
Source: WT Partnership, Christchurch City Council Long Term Plan
59

There is anticipated to be the potential for some land to be available on the
designated site (the precinct) or spaces within the MUA for alternative or
complementary commercial developments. These opportunities across the
precinct have been widely discussed during the consultation phase.
Proponents speculated that private sector investment in these commercial
opportunities might assist with reducing the cost of the project, as well as
generating increased activation and use of the MUA and surrounding areas. A
number of potential complementary associated uses (often based on
precedents from other stadium development projects internationally) were
referred to in the consultative process, including:
— Residential apartments built around the venue perimeter;
— A hotel built within the MUA itself, and potentially sharing facilities
(kitchens, hospitality spaces);
— Retail, hospitality and mixed-use;
— Commercial / office spaces; and
— Car parking.
Property development interests noted that to be successful, adjacent
developments of this nature need to demonstrate the market has sufficient
demand in its own right prior to consideration of demand generated by the
venue. Importantly, it is not the demand from the venue that typically drives
the feasibility of associated developments. However, any associated/adjacent
development should also ideally be complementary to the MUA’s operations
to maximise utilisation/activation and return. Most importantly, any adjacent or
integrated development must not compromise the utility or functions of the
MUA. Many stadia and arena globally suffer compromise or constraint to their
use by neighbouring developments and occupiers. Ownership or control of
these complementary developments therefore, whether apartments, hotel or
retail, is almost always vested in the MUA owner so measures can be put in
place to meet event hirers’ requirements.
Precinct co-investment potential
ARA Institute of Canterbury
Ara has over 17,000 enrolled students
at its campus, which is one block from
the MUA site. Discussions with Ara
highlighted a number of potential
synergies with the MUA, including:
Student Accommodation: Ara
currently can offer accommodation to
a limited number of students. The lack
of nearby accommodation is a barrier
to Ara attracting out of town students,
international students in particular.
While a number of property developers
have approached Ara with student
apartment proposals, all have asked
Ara to underwrite the financial risk,
which it is unwilling to do.
Use of facilities: There may be some
potential for Ara students to train at or
use the MUA, including Ara’s sports
science and recreation programme,
event management and hospitality
courses.
Car parking: Ara has approx 700
grade car parks which are primarily
used weekdays between 9-5. These
could potentially become available for
use by the MUA for evening or
weekend events.
MUA Site
60

Telfer Young, a national valuation and property advisory firm, provided a high-
level supply and demand assessment of the key commercial opportunities for
the precinct. This review took into account the desirability of the designated
site when compared to other sites available in the Christchurch CBD, and
noted with some emphasis that there is still significant available affordable
land for private development opportunities. The following commentary
presents the key findings from their analysis, by development type.
Residential accommodation
While the earthquake did significantly impact the city’s available residential
stock, building activity since has largely restored the supply/demand balance,
with house prices stabilising. Further, some proposed projects have not
progressed due to not being feasible (e.g. Residential Demonstration Project).
Fletcher Living has been engaged to develop a total of 900 units in the East
Frame, adjacent to the MUA site, and this has some way to go to achieve
traction. While it is understood that central-city apartment living is standard for
most major cities around the world, those consulted suggested Cantabrians
are still hesitant to move into apartment accommodation, especially when they
can secure modern houses on well-located, good-sized sections for the same
or lower prices. Further, the MUA site, to the east of the CBD is considered to
be in a less preferred location than land on the western side of the CBD.
Given these factors and the dwelling preferences, for now, of Christchurch
people, Telfer Young concluded residential accommodation is not likely to be
feasible within the MUA precinct as a complementary development in the
short, medium or potentially longer term.
Unlike Auckland where housing affordability, proximity to work and city living
attraction are driving apartment developments, for the moment Christchurch
has yet to offer a compelling case for significant numbers of people to prefer
CBD apartment living.
Apartment living rarely sits comfortably with an arena or stadium complex.
Residential neighbours of stadia expect quiet enjoyment of their homes and
tend to lead to a venue’s night events, concerts and operating hours being
restricted. Eden Park’s viability is tested by this very issue, as are many other
stadia globally.
Hotel
Central hotel / accommodation stock in Christchurch was significantly
impacted by the earthquakes (75% loss). This, combined with the
accommodation pressures from the general rebuild and the establishment of
an international airport in Queenstown, has resulted in fewer visitor nights in
Christchurch. Much of the lost stock is in the process of being replaced,
however, some industry observers suggested vacancy rates are still soft as
Christchurch re-establishes itself as a viable destination and key gateway
South Island centre. A number of stakeholders in the accommodation industry
suggested planned and ‘under development’ hotel facilities are likely to lead to
excess capacity in the short to medium term. Should there be a resurgence in
visitor activity (i.e. Christchurch returning to its ‘fair’ share) there is likely to be
ongoing demand for hotel accommodation across the City into the future.
However the development of a hotel on the MUA site would be in direct
competition with all other CBD hotels which are within walking distance to the
site and potentially in more desirable tourist or visitor locations across the
CBD.
Those promoting the concept of an integrated hotel/MUA scheme point to
similar developments at Twickenham and a small number of other venues.
However, these venues exist in densely populated areas where there is
significant weekly demand for the hotel’s services beyond the stadium’s event
days and attractions. The economics of hotel developments are challenging
and the reality is that any development of this type integrated into the MUA
would require the MUA precinct owner (the Council) to take the development
risk. The Press has recently reported market soundings done by hotel
consultant Howarth Ltd in relation to the Christchurch Convention Centre
project found “little enthusiasm among hoteliers to get involved in an
integrated development”. The overwhelming consensus of those consulted
was that there is no private sector investor interest in the concept of an
integrated hotel on the MUA site. In the few cases where this form of
development has occurred, the stadium owner has controlled the
development and effectively underwritten it. Private developers do not see the
business case for co-investment in a stadium complex.
Precinct co-investment potential (cont.)
61

Retail / hospitality:
The Blueprint identified a core retail / hospitality precinct to the south of
Cathedral Square which has had the effect of compressing development into
that area, including the BNZ Centre, the ANZ Centre, the Crossing and The
Terrace. Similarly, most new buildings within the CBD have a component of
ground floor retail / hospitality and a number of proposed developments may
also include similar amenity (e.g. Town Hall, Convention Centre, Court
Theatre). There is evidence to suggest a current oversupply of this
development type with higher than equilibrium vacancy levels. Overall, small
scale retail / hospitality could be considered within the site, however, would
need to positioned well to engage the broader CBD (e.g. frontage on the
western fringe to Madras Street).
Among many business people there was an often expressed concern that
there has been an over-investment in the retail and food and beverage sector
and some rationalisation will occur until an equilibrium settles. They argued
the emphasis should be on building connections to the existing and proposed
hospitality precincts in Christchurch, rather than integrating these types of
developments within the MUA itself and risking cannibalisation of the
opportunities to no-one’s advantage.
Commercial / office
Analysis by Telfer Young suggests that the current level of commercial / office
accommodation (incl. committed projects and projects under construction) has
almost reached pre-earthquake levels with a significant increase in the
proportion of A grade building stock. Telfer Young forecasts a reduction in
development activity of this nature as supply and demand normalise. Further,
there will be other projects competing for ‘aligned’ sports and entertainment
tenants including the Metro Sports Facility. Overall, Telfer Young do not
consider office / commercial accommodation on the site to be commercially
viable in the short to medium term, however, this may become viable over the
longer term. Market surveys report an oversupply of commercial space in the
order of 20-25% and which may take 5-8 years and longer to be absorbed.
A number of developer interests reported they are not looking at new or
further opportunities. The commercial and office market is changing, with
rents reducing and there is no case for integrating such a development in the
MUA concept.
Car parking
As the central city is re-established, there is demand for additional short-term
car parking. In relation to the potential for this on the MUA site, it is likely to be
a longer term demand given the current availability of vacant land sites of
which many are being used for temporary ‘open’ car parks. Further, key
parking demand drivers such as the new hospital are located on the other side
of town. While the stadium itself would drive demand for parking (largely
outside of peak business hours), leading practice stadium development is to
have minimal car parking on-site and to encourage patrons to use public
transport. Further, discussions with surrounding activities suggest event
parking could be available outside of typical business hours (e.g. the Ara
Institute of Canterbury has student and staff parking (700 spaces) which could
be available for stadium patrons).
Conclusion
Overall, there appears limited-to-nil short to medium term interest in the
majority of the identified commercial development opportunities. Discussion
with stakeholders also suggested that while there may have been an
opportunity to co-locate a number of these uses early in the CBD rebuild,
much of this opportunity no longer exists as projects have subsequently been
progressed on other CBD sites. The prevailing view was that any
development risk would need to be underwritten by the MUA
owner/developer, namely the Council.
In the longer term, 15-20 years, as the MUA precinct is built up around and its
place in the city is understood, there may arise opportunities for unlocking the
value of any commercial space for the purposes of diversifying revenue
streams or re-investment. Numerous race courses in Australia are pursuing
this strategy, and at a local level Addington Raceway, Riccarton Raceway,
Ellerslie and Alexandra Park in Auckland have successfully exploited
commercial development opportunities with surplus land in their larger
footprint.
Precinct co-investment potential (cont.)
62

63

Appendix A: Designation
64

Stadium (incorporating spectator events facility).
• Rectangular field for sporting events, training and practice (such as
rugby, rugby league, football)
• Multiple use for concerts/ events
• Up to 35,000 fixed seat capacity including removable seats to create
stage
• Roof cover
• Event lighting
• Player/entertainer facilities
• Corporate suites/lounges/conference facilities
• Broadcasting, technology and other services
• External plazas and circulation concourse
• Offices
• Retail/food and beverage
• Amenities
• Kitchen and catering facilities
• Car parks
• Signage
• Storage sheds, workshops and ground keeping facilities
• Visitor attraction facilities (such as hall of fame or museum)
• Ancillary activities
Conditions
N/A
Christchurch District Plan: Designation H4 Stadium (incorporating Spectator Events Facility)
65

Appendix B: Pre-feasibility Study Consultees
66

Multi- Use Arena Pre-Feasibility Study: Consultation
1 Christchurch City Council 18 Mainland Football 35 Bryan Pearson
2 Development Chch Ltd 19 Canterbury Rugby League 36 Christchurch & Canterbury Tourism
3 Otakaro Ltd 20 Netball NZ 37 Hospitality NZ
4 Waimakairiri District
Council
21 Netball Mainland 38 ATEED
5 Selwyn District Council 22 Canterbury Hockey
Association
39 Conventions & Incentives NZ
6 Regenerate Chch 23 Sport Canterbury 40 Frontier Touring
7 Sport New Zealand 24 National Sports Museum Trust 41 Spark Arena/Live Nation
8 NZ Rugby 25 ESports Federation 42 Tourism Industry Aotearoa
9 Crusaders Limited
Partnership
26 AMI Stadium 43 Christchurch International Airport
10 Canterbury Rugby Football
Union
27 Canterbury Cricket 44 Central City Business Assn
11 Westpac Stadium 28 NZ Warriors 45 Peter Guthrey
12 Auckland Regional
Facilities
29 NZ Rugby League – Southern
Zone
46 Multi Purpose Arena Trust
13 NZ Cricket 30 V Base
47 Employers Chamber of Commerce
14 NZ Football 31 Colliers
48 Ngai Tahu Property
15 ARA 32 Peter Grumley
49 Fletcher Residential – East Frame
16 Addington Raceway 33 Andy Levy, Arizona Cardinals
50 Lauren Semple
17 Wests Tigers 34 NRL
67

Appendix C: Operating and financial assumptions
68

The following sections present the key overarching operating model and
project assumptions.
Average year: As per the discussion further articulated in relation to
attendance, to some degree the operating performance of sporting venues is
dependent on the on-field performance and therefore crowd support of the key
hirers. Further, on-field performance and crowd support is likely to vary year
by year and is therefore difficult to predict with any degree of certainty.
Accordingly, for the purposes of this analysis we considered the “average
year” of operation of the venue taking into account the characteristics and
capacity of the proposed venue.
Venue management: The scope of works for this pre-feasibility study
explicitly excludes consideration of a preferred management model for the
MUA. For the purposes of the analysis, however, a number of implicit
assumptions have been made regarding venue management, including:
— The venue is assumed to be managed by the venue owner (e.g. a
charitable trust or Council entity) – therefore no private sector venue
management fee has been included; and
— The venue manager is assumed to outsource many of the key operating
activities to specialist third parties including ticketing, cleaning and
security, which is common practice across the industry.
Coordination with other venues: The event calendar presented in this report
is based on the assumption that the venue is to complement and not compete
with other venues in Christchurch, including:
— The Convention Centre;
— Metro Sports Complex;
— Nga Puna Wai;
— And other Council facilities (e.g. Town Hall).
It should be noted, however, that for these venues to avoid cannibalising each
others event calendar there will need to be some degree of coordination of
ownership and / or management across the venues. Evidence in other
jurisdictions indicates the absence of this coordination may lead to self-
defeating competition for events.
Catering model: There are two general models for the delivery of catering
services at major venues, either an in-house model or an outsourced model.
There does not appear to be any general consensus in relation to a preferred
model across Australia and New Zealand venues with some venues
considering catering as a specialist offering outside their scope of expertise
and other venues undertaking catering in-house to retain the entirety of the
profits from this activity.
For the purposes of this study an outsourced arrangement has been assumed
whereby the venue will transfer the catering rights at the venue to an external
catering company in exchange for a commission on gross catering revenue.
Venue memberships: Venue membership is not a new product in the New
Zealand market and the event calendar of the proposed MUA does appear
favourable for such a product, assuming the diversified event calendar can be
secured. This assumption would need to be tested further during the next
stage of analysis of this project.
For the purposes of the pre-feasibility study modelling, however, no venue
membership product has been assumed. Venue memberships, however, may
not generate a significant increase in revenue to that presented in the financial
performance section due to the assumed structure of hiring and commercial
agreements.
Operating model and project assumptions
69

Project timing
The following table presents the assumed construction timing for the project.
Based on these timings, the venue opening under each option is assumed to
be (approximately):
— Option 1: August-September 2021;
— Option 2: April-May 2022;
— Option: June-July 2022; and
— Option 4: December 2022-January 2023.
The remainder of this section presents the key assumptions relating to the
event calendar, average attendances, and commercial rights.
Operating model and project assumptions (cont.)
Project timing
Pre-construction
(months)
Construction
(months)
Total
(years)
Option 1 18 32 4
Option 2 18 40 4.8
Option 3 18 42 5
Option 4 18 48 5.5
Source: WT Partnership
70

Event calendar
The event calendar is perhaps the single most important driver of a venue’s
financial performance. The event calendar is the key driver of annual
attendance levels and therefore key event day revenue streams such as
ticketing and catering revenue. The number of event days (and annual event
attendance) is also a key driver of other revenue streams such as naming
rights, sponsorship, signage and supply rights (e.g. pourage rights). The value
of the majority of these revenue streams rests largely in the level of exposure
to event day patronage (and broadcast levels) and therefore the event
calendar. The calendar of events has been developed with the following key
assumptions in place:
• The MUA will not host events currently earmarked for other Christchurch
venues
• Canterbury and New Zealand Rugby will be important venue users, and as
such would be party to a long-term hire agreement prior to developing the
MUA.
Rugby
• It has been assumed that under Options 2, 3 and 4 the MUA will attract 1
All Blacks event each year. Under Option 1 it is assumed that the MUA will
attract 1 All Blacks event every second year given the venue is not fully
roofed. .
• Super Rugby – it has been assumed that all eight home games will be
played at the MUA.
• National Provincial Competition - A total of six home events per year has
been assumed under all project options.
• No finals have been assumed for the purposes of the financial modelling
as these events are at risk each year and dependent upon the on-field
performance of the team.
Rugby League
Assuming one test match each year would be played in Auckland, it has been
assumed that Christchurch could attract the other test match every second
year under Options 2, 3 and 4. Under Option 1 it has been assumed the
venue will attract an international rugby league test match every 3 years.
No local / provincial rugby league events have been assumed for the new
MUA.
Football
Consultation with NZ Football suggest the venue could attract between one
international football event every year and one event every 2 years. To be
conservative one event every two years has been assumed.
Concerts
• One concert every three years has been assumed under Option 1 given it
does not have a roof.
• Two stadium concerts per year have been assumed under Option 2 and
three stadium concerts per year under Options 3 and 4.
Exhibitions
This type of event will be a key target of a new Christchurch MUA, particularly
under Options 3 and 4 where the pitch can be removed from the venue to
expose a flexible concrete pad. For the purposes of the modelling it has been
assumed the venue will host no exhibitions under Option 1, two exhibitions
per year under Option 2 and six exhibitions per year under Options 3 and 4.
The additional events under Option 3 and 4 are due to the ability to remove
the pitch and use the concrete pad.
Event Calendar (cont.)
71

Major International Events
The right to host such events is competitive and subject to many
considerations, of which venues just one. As such, the financial modelling
does not incorporate any such events. If New Zealand was to secure such
events and host games in Christchurch this would further improve the financial
viability of the venue.
Other major commercial events
A roof and the ability to remove the playing surface would add significant
flexibility in type and frequency use, and would open up a wide range of
additional utilisation options.
It would be unrealistic to assume the venue would host each of these events
on an annual basis, however, it would be reasonable to assume the venue will
host a number of such events each year, with the mix of events changing
each year.
For the purpose of this pre-feasibility study, it has been assumed that one
additional major commercial event will be hosted every two years under
Option 1, two additional major commercial events will be hosted each year
under Option 2 and four additional major commercial events will be hosted
each year under Options 3 and 4. The additional events under Option 3 and 4
are due to the ability to remove the pitch and use the concrete pad.
Other events – reduced mode
Options 3 and 4 are designed to allow the venue to be reconfigured into a
10,000 seat MUA capable of hosting smaller concerts and entertainment
events.
Analysis of the event calendar at Horncastle Arena over the period since
January 2014 suggests a total of approximately 6-7 such events each year
have attendances in excess of 6,500 (over one or multiple shows). Further we
understand that the venue has turned away multiple events each year due to
high utilisation levels.
For the purposes of this study, a total of 5 commercial indoor reduced mode
events will be attracted to the venue each year. Many other community events
of this nature will also likely be attracted to the venue.
Community Use
It is assumed that community use will be moderate under Option 1, high under
Option 2 and very high under Options 3 and 4 due to the increased flexibility
of the venue and the fact many events can be hosted under these Options
without impacting the turf.
Event Calendar (cont.)
72

Summary of event calendar
The adjacent table presents the proposed event calendar in the average year
for the new MUA under each project option. The number of events is
projected to range from approximately 15-21 events per year under Option 1
(i.e. very limited uplift from the current event calendar at AMI Stadium) to up to
34-37 events under Options 3 and 4. The key difference between the
projected event calendar under each Option is the number of non-sporting
(e.g. rugby, league and football) events with Options 3 and 4 providing the
highest degree of flexibility to host a varied event calendar.
The event calendar projected under Options 3 and 4 is marginally below that
of Westpac Stadium in Wellington, however, Wellington also hosts between
two and three cricket events each year which will not be able to be hosted at
the Christchurch venue. The projected event calendar also compares
favourably to that of Eden Park under Options 2, 3 and 4, given the
restrictions on concerts and other events at Eden Park as it is located within a
residential area.
The event calendar under Option 1 is comparable (in total event days) to that
of Forsyth Barr Stadium before consideration of community utilisation,
although the Forsyth Barr event calendar is superior in quality with more
concerts and likelihood of an annual All Blacks test. The proposed event
calendar under Options 2, 3 and 4 would be favourable in both quantity and
quality of events when compared to Forsyth Barr Stadium, particularly given it
is assumed a number of events would be transferring to the new Christchurch
venue from Forsyth Barr under these three Options.
Options 3 and 4 also allow for reduced mode events and are also likely to
support the highest community utilisation given the playing surface can be
protected outside during community events.
It should be noted that there is not expected to be a difference between the
event calendar under Option 3 and Option 4.
The forecast event calendar presented in the adjacent table outlines the
average number of major events anticipated to be held at the venue each
year. In reality, the event calendar may vary (higher or lower) from the
estimate provided.
Event calendar (cont.) Projected event calendar
Option 1 Option 2 Option 3 Option 4
Rugby
International
0-1 (1 every 2
years) 1 1 1
Super Rugby 8 8 8 8
Domestic 6 6 6 6
Subtotal 14-15 15 15 15
Rugby League
International
0-1 (1 every 3
years)
0-1 (1 every 2
years)
0-1 (1 every
2 years)
0-1 (1 every 2
years)
NRL 1 1 1 1
Domestic Nil Nil Nil Nil
Subtotal 1-2 1-2 1-2 1-2
Football
International
0-1 (1 every 2
years)
0-1 (1 every 2
years)
0-1 (1 every
2 years)
0-1 (1 every 2
years)
A-League
0-1 (1 every 2
years)
0-1 (1 every 2
years)
0-1 (1 every
2 years)
0-1 (1 every 2
years)
Domestic Nil Nil Nil Nil
Subtotal 0-2 0-2 0-2 1
Other events
Concerts
0-1 (1 every 3
years) 2 3 3
Exhibitions Nil 2 6 6
Other major events
0-1 (1 every 2
years) 2 4 4
Subtotal 0-2 6 13 13
Subtotal events –
Capacity mode 15-21 22-25 29-32 29-32
Other events –
Reduced mode Nil Nil 5 5
Total events 15-21 22-25 34-37 34-37
Community
utilisation Moderate High Very High Very High 73

Understanding of industry trends and stakeholder consultation has identified
two key activities which will be important to ensuring the previously outlined
event calendar can be achieved and sustained. These include:
— Developing a wider events strategy for Christchurch; and
— Securing key content prior to development of the venue.
Events strategy
Increasingly event promoters, including sporting event promoters (e.g.
national sporting codes), are entering formal or informal tendering processes
for those venues and cities seeking to attract events. For example, NZ Rugby
undertakes a formal tender process in relation to where it will host
international test match events whereby it considers the entire offering,
including event yield and other financial incentives provided by the host venue
and city.
Similarly, cities are increasingly viewing major events as an opportunity to
attract tourists / visitors to their communities which in turn generates
increased economic activity. Many cities have therefore developed and
implemented strategies around event retention and attraction which are
aligned to their broader economic development activities.
Dunedin is a good example of this with anecdotal evidence suggesting the
Dunedin City Council has offered significant financial incentives to attract
events – including All Blacks games and concerts - to Forsyth Barr Stadium to
both increase utilisation of the venue and to attract new visitation from outside
the City. Specifically, the annual report for Dunedin Venues Management
Limited for the 12 months to August 2016 suggests that approximately 60% of
those attending the two concerts hosted in that year were from outside
Dunedin.
Securing content
One of the lessons from other stadium development projects across Australia
and New Zealand is that key event content, particularly sporting content,
should be secured prior to committing to the development. Venues of this
nature represent significant cost and are often funded by governments,
however, tenants also benefit greatly without (in most cases) contributing to
the cost.
In this context, it is important for government to secure long term content for a
venue prior to committing to the development cost. Without this commitment,
the government is placed in an inferior bargaining position when negotiating
use of a new venue. For example, the Western Australian Government is
currently developing a new 60,000 seat stadium in Perth which will
predominantly host the city’s two AFL teams, along with other major cricket,
rugby, football and entertainment events. The cost of the project is in excess
of $AUD 1bn. The Australian government is yet (at the date of writing), to
finalise the hiring agreement with the AFL teams who are using the veiled
threat of not moving to the new venue to seek an improved arrangement for
use of the venue.
Prior to commitment of funds to the project, it would be essential practice for
the project to secure long term hire agreements with cornerstone tenants. An
All Blacks test is perhaps the most critical event to secure, especially given
that the hosting of this event is a prime consideration when assessing the
most appropriate capacity of the venue. NZ Rugby has contractually
committed to test matches to Eden Park for 10 years to 2020 as part of the
package to upgrade Eden Park in preparation for the 2011 Rugby World Cup.
Supporting the event calendar
74
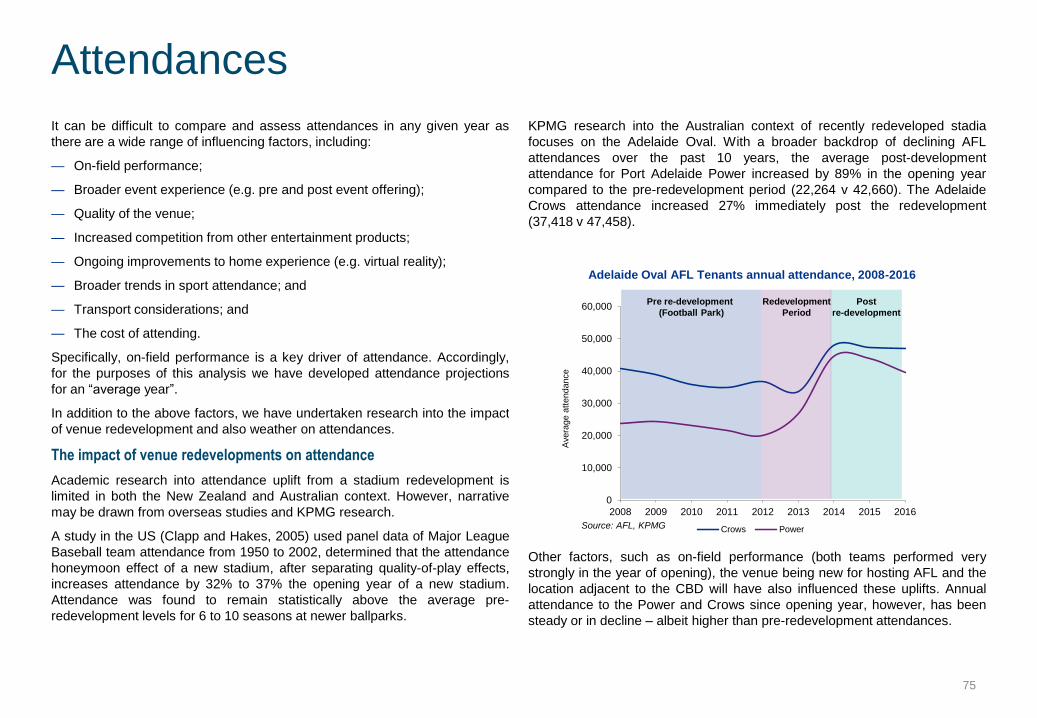
It can be difficult to compare and assess attendances in any given year as
there are a wide range of influencing factors, including:
— On-field performance;
— Broader event experience (e.g. pre and post event offering);
— Quality of the venue;
— Increased competition from other entertainment products;
— Ongoing improvements to home experience (e.g. virtual reality);
— Broader trends in sport attendance; and
— Transport considerations; and
— The cost of attending.
Specifically, on-field performance is a key driver of attendance. Accordingly,
for the purposes of this analysis we have developed attendance projections
for an “average year”.
In addition to the above factors, we have undertaken research into the impact
of venue redevelopment and also weather on attendances.
The impact of venue redevelopments on attendance
Academic research into attendance uplift from a stadium redevelopment is
limited in both the New Zealand and Australian context. However, narrative
may be drawn from overseas studies and KPMG research.
A study in the US (Clapp and Hakes, 2005) used panel data of Major League
Baseball team attendance from 1950 to 2002, determined that the attendance
honeymoon effect of a new stadium, after separating quality-of-play effects,
increases attendance by 32% to 37% the opening year of a new stadium.
Attendance was found to remain statistically above the average pre-
redevelopment levels for 6 to 10 seasons at newer ballparks.
KPMG research into the Australian context of recently redeveloped stadia
focuses on the Adelaide Oval. With a broader backdrop of declining AFL
attendances over the past 10 years, the average post-development
attendance for Port Adelaide Power increased by 89% in the opening year
compared to the pre-redevelopment period (22,264 v 42,660). The Adelaide
Crows attendance increased 27% immediately post the redevelopment
(37,418 v 47,458).
Other factors, such as on-field performance (both teams performed very
strongly in the year of opening), the venue being new for hosting AFL and the
location adjacent to the CBD will have also influenced these uplifts. Annual
attendance to the Power and Crows since opening year, however, has been
steady or in decline – albeit higher than pre-redevelopment attendances.
Attendances
Adelaide Oval AFL Tenants annual attendance, 2008-2016
Post
re-development
Pre re-development
(Football Park)
0
10,000
20,000
30,000
40,000
50,000
60,000
2008 2009 2010 2011 2012 2013 2014 2015 2016
Avera
ge a
ttendance
Crows Power
Redevelopment
Period
Source: AFL, KPMG
75

Based on this analysis, the ‘honeymoon’ effect appears to be substantial. As
discussed, however, there are a number of other factors at play when
analysing attendances. Therefore, and also to be conservative, a ‘honeymoon’
uplift of 15% could be achievable for the new venue.
The impact of weather on attendance
Using data available to KPMG, it is possible to interrogate the impact of
weather conditions on attendances for a major Australian sporting code. The
results from this analysis allow an understanding of the impact of weather on
sporting event attendances which can be applied similarly in the context of
Christchurch.
The data available covers all events since 2012 with each event being
categorised as a being played in ‘dry’ conditions, ‘showers’ or ‘rain’. Analysis
suggests the attendance differential between the average attendance for all
event types and the average attendance for when there is ‘showers’ or ‘rain’ is
in the order of 16%. The average ‘dry’ conditions attendance was
approximately 2% higher than the overall average.
This analysis for events held in New Zealand demonstrates a similar trend
with an attendance differential between the average attendance for all event
types and the average attendance for when there is ‘showers’ or ‘rain’ is in the
order of 13%. The average ‘dry’ conditions attendance was approximately 3%
higher than the overall average.
In addition, stakeholder feedback has been unanimous that the weather in
Christchurch can have a significant impact on attendances and that being able
to protect events from the weather would result in significantly improved event
attendance.
Therefore it is expected that under Options with a full roof, there will be a
positive impact on the average attendance relative to partial-roof options.
For the purposes of the pre-feasibility study it has been assumed that an
attendance uplift of 5% (in addition to the uplift due to a new venue) could be
achievable under Option 2, 3 and 4.
Combined impact
In total, the combined impact on attendances is assumed to be in the order of
20% (for Options 2, 3 and 4). This does represent a significant increase on
current attendance levels, however, stakeholders suggest the temporary
nature and quality of the current venue, along with the weather in
Christchurch, have a major impact on attendances and therefore this uplift
does not appear unreasonable.
The general consensus from stakeholders consulted in the development of
this study, however, suggested the impact of the roof would be at least, if not
more, sizeable than the impact of a new venue in its own right. As such, for
the purposes of this study it has been assumed that the average attendance
uplift associated with a new MUA is 10%. In addition, the further uplift
associated with a roof is assumed to be 10% (only applicable for Options 2, 3
and 4).
These uplifts have been applied to regular sporting events at the venue e.g.
Super Rugby and Mitre 10 Cup. Other events are more one-off in nature and
attendance uplifts have been considered separately.
Attendances (cont.)
76

International rugby
The majority of international rugby tests in New Zealand achieve average
attendances that are 95% or greater of capacity. The chart opposite shows the
recent average attendances as a proportion of total capacity for Westpac
Stadium and Eden Park. The four following columns show the average
attendances to AMI Stadium for the four most recent All-Black test matches.
Fixtures against Ireland, France and South Africa were sell-out (or close to
sell-out), with the exception of Argentina – an opposition with a relatively low
world ranking (9th in World).
It is expected that under all Options Christchurch will attract a good quality
test and therefore attendances for All Blacks games will reach the capacity
(including temporary seating) of the new MUA. This will result in attendances
of 30,000 under Options 1, 2 and 3, and 35,000 under Option 4.
Super Rugby
Average attendance in New Zealand to Super Rugby games in 2016 was
approximately 15,300 - slightly higher than the average attendance to AMI
Stadium over the past five years (12,200). The chart opposite shows the
declining trend in attendances from an average crowd of 16,400 in 2012 to
10,500 in 2016. There has been an improvement in 2017 to an average
attendance of 11,600 (6 out of 8 games played).
Average attendances to the Hurricanes (Wellington) and Blues (Auckland)
over the past three years were both in the order of 14,700.
An uplift of 10% on the five year average attendance (i.e. 12,200) would result
in an average attendance of approximately 13,400. This has been assumed
under Option 1. A 20% uplift would result in average attendances of
approximately 14,600. This has been assumed under Options 2, 3 and 4.
Attendances (cont.)
98% 96%100% 100%
75%
94%
0%
10%
20%
30%
40%
50%
60%
70%
80%
90%
100%
WestpacStadium
Eden Park Ireland France Argentina SouthAfrica
% o
f sta
diu
m c
apacity
% of capacity sold at venues for All-Black test matches
Matches hosted at AMI Stadium
16,442
12,977
14,077
11,752
10,537
11,583
0
2,000
4,000
6,000
8,000
10,000
12,000
14,000
16,000
18,000
2012 2013 2014 2015 2016 2017
Avera
ge a
ttendnace
5yr Avg =
12,200
Crusaders average attendance, 2012-2017*
* 6/8 games played in season
Source: Christchurch Stadium Trust
Source: NZ Rugby, Christchurch Stadium Trust
77
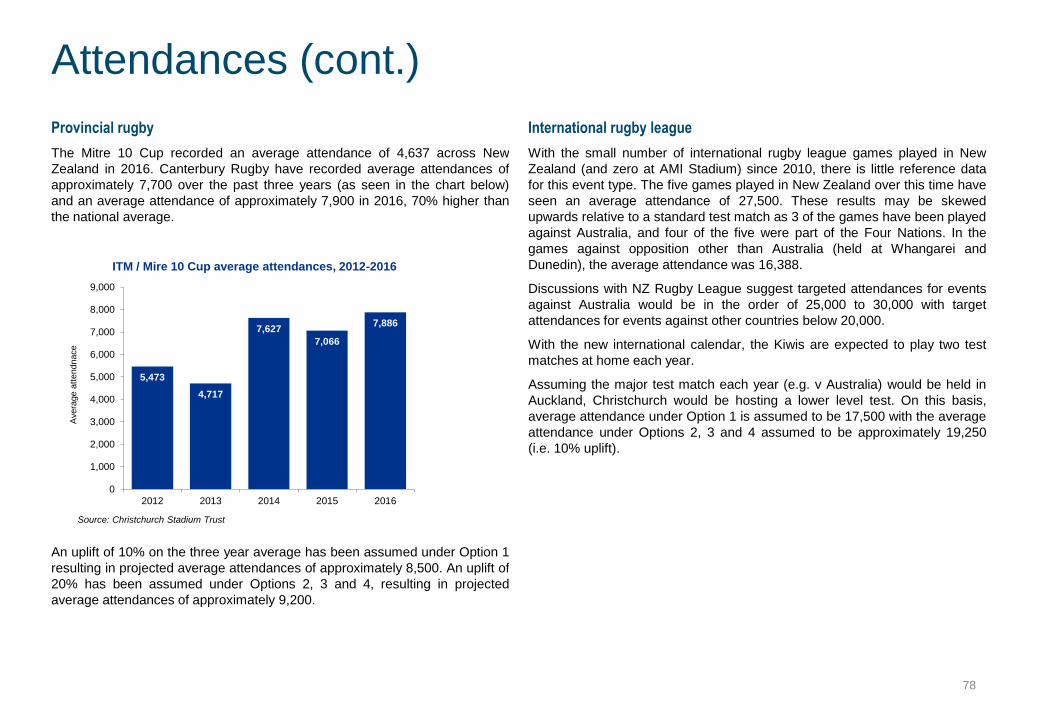
Provincial rugby
The Mitre 10 Cup recorded an average attendance of 4,637 across New
Zealand in 2016. Canterbury Rugby have recorded average attendances of
approximately 7,700 over the past three years (as seen in the chart below)
and an average attendance of approximately 7,900 in 2016, 70% higher than
the national average.
An uplift of 10% on the three year average has been assumed under Option 1
resulting in projected average attendances of approximately 8,500. An uplift of
20% has been assumed under Options 2, 3 and 4, resulting in projected
average attendances of approximately 9,200.
International rugby league
With the small number of international rugby league games played in New
Zealand (and zero at AMI Stadium) since 2010, there is little reference data
for this event type. The five games played in New Zealand over this time have
seen an average attendance of 27,500. These results may be skewed
upwards relative to a standard test match as 3 of the games have been played
against Australia, and four of the five were part of the Four Nations. In the
games against opposition other than Australia (held at Whangarei and
Dunedin), the average attendance was 16,388.
Discussions with NZ Rugby League suggest targeted attendances for events
against Australia would be in the order of 25,000 to 30,000 with target
attendances for events against other countries below 20,000.
With the new international calendar, the Kiwis are expected to play two test
matches at home each year.
Assuming the major test match each year (e.g. v Australia) would be held in
Auckland, Christchurch would be hosting a lower level test. On this basis,
average attendance under Option 1 is assumed to be 17,500 with the average
attendance under Options 2, 3 and 4 assumed to be approximately 19,250
(i.e. 10% uplift).
Attendances (cont.)
5,473
4,717
7,627
7,066
7,886
0
1,000
2,000
3,000
4,000
5,000
6,000
7,000
8,000
9,000
2012 2013 2014 2015 2016
Avera
ge a
ttendnace
ITM / Mire 10 Cup average attendances, 2012-2016
Source: Christchurch Stadium Trust
78

International Football
As with international rugby league, there have been few international games
played in New Zealand in recent years.
Attendance to international football fixtures vary significantly based on a range
of factors including (but not limited to):
— Importance of game;
— Opposition fan base within the region;
— Anticipated team selection (i.e. Premier League players may attract higher
attendances).
The most recent game held in New Zealand (v Fiji) was held at Westpac
Stadium and recorded an attendance of 8,332. This is in contrast to an earlier
game against Mexico played at Westpac Stadium in 2013 that attracted a
crowd of 33,626. The one game played at AMI Stadium since 2012 was
against Tahiti, with a crowd of 10,751 in attendance.
Consultation with NZ Football suggests they are targeting average
attendances in the order of 15,000 to 20,000, with larger attendance for major
matches e.g. world cup qualifiers. Therefore, it has been assumed that the
average attendance for a NZ Football event at the new venue will be 15,000
under Option 1. The average under Options 2, 3 and 4 is assumed to be
16,500 (a further 10% uplift).
Concerts
Attendances at concerts vary depending on the popularity of the performing
artist. For example Adele’s recent 2017 appearances at Mt Smart Stadium
saw sell-out attendances of approximately 45,000 per night over the three
nights.
A roofed venue is of more value to concert organisers than to sports events.
This is on account of the improved fan experience as those viewing from the
pitch are covered from the elements and weather proofs the event.
If a venue is reputed for its fan experience (through better viewing, better
comfort, protection from the elements, etc), there is likely to be some increase
in the average attendance.
For the purposes of the modelling, concerts are projected to sell out (i.e.
average attendance of 40,000 or 45,000 respectively) under Options 2, 3 and
4. A marginally lower attendance of 38,000 has been assumed for concerts
under Option 1.
Review of Horncastle Arena events suggest concerts typically only do one
show in Christchurch. As such, events are only likely to go to this MUA if they
cannot be accommodated at Horncastle Arena (i.e. likely attendance is in
excess of Horncastle Arena capacity of 8,000-9,000). Average attendances
for entertainment events in arena mode is assumed to be 8,000.
Attendances (cont.)
79
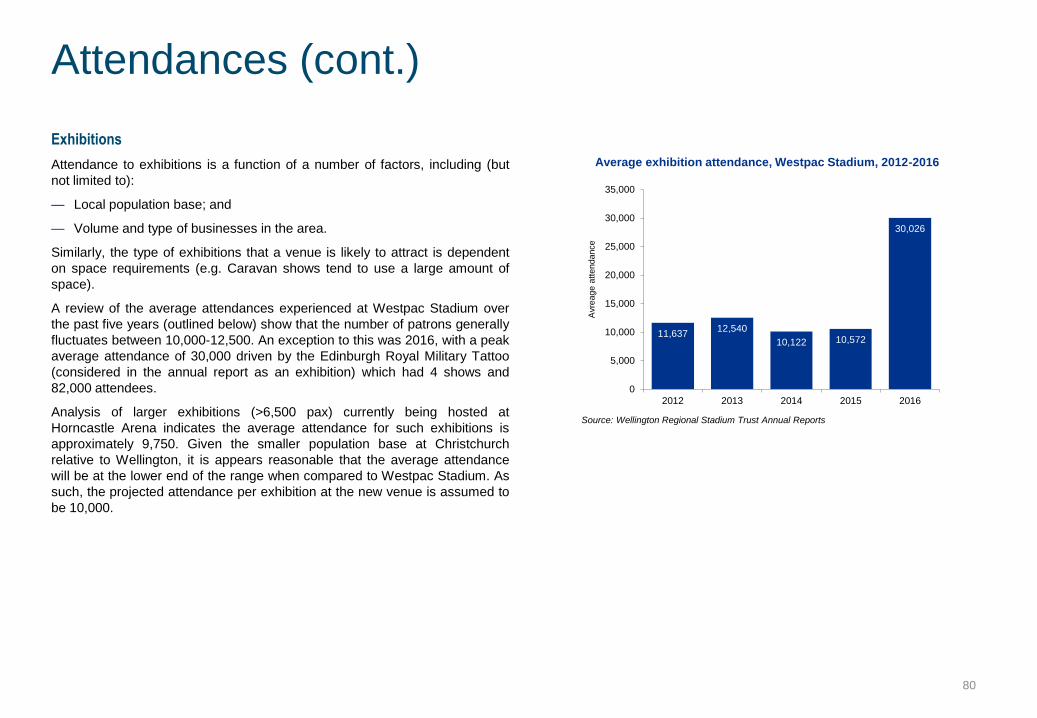
Exhibitions
Attendance to exhibitions is a function of a number of factors, including (but
not limited to):
— Local population base; and
— Volume and type of businesses in the area.
Similarly, the type of exhibitions that a venue is likely to attract is dependent
on space requirements (e.g. Caravan shows tend to use a large amount of
space).
A review of the average attendances experienced at Westpac Stadium over
the past five years (outlined below) show that the number of patrons generally
fluctuates between 10,000-12,500. An exception to this was 2016, with a peak
average attendance of 30,000 driven by the Edinburgh Royal Military Tattoo
(considered in the annual report as an exhibition) which had 4 shows and
82,000 attendees.
Analysis of larger exhibitions (>6,500 pax) currently being hosted at
Horncastle Arena indicates the average attendance for such exhibitions is
approximately 9,750. Given the smaller population base at Christchurch
relative to Wellington, it is appears reasonable that the average attendance
will be at the lower end of the range when compared to Westpac Stadium. As
such, the projected attendance per exhibition at the new venue is assumed to
be 10,000.
Attendances (cont.)
Average exhibition attendance, Westpac Stadium, 2012-2016
11,63712,540
10,122 10,572
30,026
0
5,000
10,000
15,000
20,000
25,000
30,000
35,000
2012 2013 2014 2015 2016
Avre
age a
ttendance
Source: Wellington Regional Stadium Trust Annual Reports
80

Summary of attendances
The following table presents the potential attendances in an average year for
the new venue under each project option.
*Sensitivity analysis – Super Rugby attendances
While this analysis has made assumptions in relation to the average
attendances that could be expected at each event type, we appreciate others
will have a differing view. Those views are likely to argue for higher average
attendances on the basis that recent attendance figures are affected by the
basic amenity of the temporary stadium. On this basis, we have undertaken
an additional sensitivity focused exclusively on uplifting the attendance
assumptions for Super Rugby games. The sensitivity has assumed the
following average attendances for Super Rugby games played at a fully
roofed venue (i.e. Options 2, 3 and 4):
— 17,500 (i.e. 70% of total capacity); and
— 20,000 (i.e. 80% of total capacity).
The projected results of the analysis assume no change in overhead
expenses resulting from this increase in average attendances and are
presented below.
Overall, an increase in attendances from the base assumption of 14,600 to
17,500 is projected to result in an increase in EBITDA of approximately
$230,000. If this were to be the case, it is projected that Option 2 would still
continue to generate an operating deficit each year. The EBITDA of Option 3
and Option 4 is projected to increase to approximately $865,000 and
$463,000 respectively.
An increase in attendance levels to 20,000 is projected to result in an increase
in EBITDA of approximately $411,000. Under this sensitivity it is projected that
Option 2 would achieve a marginal operating surplus. The EBITDA of Option 3
and Option 4 is projected to increase to approximately $1.0m and $645,000
respectively.
Attendances (cont.)
Projected average attendances
Option 1 Option 2 Option 3 Option 4
International Rugby 30,000 30,000 30,000 35,000
Super Rugby 13,400 *14,600 *14,600 *14,600
Provincial Rugby 8,500 9,200 9,200 9,200
International Rugby League 17,500 19,250 19,250 19,250
International Football 15,000 16,500 16,500 16,500
Concerts – Capacity mode 38,000 40,000 40,000 45,000
Exhibitions na 10,000 10,000 10,000
Concerts – Reduced mode na na 8,000 8,000
Source: KPMG
Super Rugby sensitivity - Incremental EBITDA analysis - Year 1 (NZ$'s, real 2017 terms)
Option 1 Option 2 Option 3 Option 4
Base Case
Revenue 3,684 5,294 6,830 7,174
Expenses 4,617 5,672 6,195 6,940
EBITDA (933) (377) 635 233
17.5k Option
Revenue 3,684 5,524 7,060 7,403
Expenses 4,617 5,672 6,195 6,940
EBITDA (933) (148) 865 463
Incremental EBITDA - 230 230 230
20k Option
Revenue 3,684 5,706 7,242 7,585
Expenses 4,617 5,672 6,195 6,940
EBITDA (933) 34 1,047 645
Incremental EBITDA - 411 411 411
81

The hiring agreement between the event owner / organiser and the venue
owner / manager is a critical driver of the financial performance of the venue.
There are a range of potential revenue sources that both the venue manager
and hirers can derive from the operations of major venues. Likewise, venue
managers and hirers face a range of associated costs. The table below
presents the primary event revenue and cost sources along with the typical
allocation of such items between the venue manager and hirer.
While there are some generally accepted industry benchmarks for rental
levels and cost apportionment (e.g. GA, premium product, etc.) and the
treatment of venue related event costs, most hiring arrangements are complex
and will depend on the facilities available to the hirer to sell, the size of the
venue and the competition between venues.
Ultimately the final agreement between the hirer and the manager is the
outcome of negotiations, where the deal may be made in a number of different
ways to provide returns, and share risks and incentives across both parties,
recognising that a manager and hirer relationship is a mutually beneficial
agreement.
A review of current hiring agreements at AMI Stadium demonstrate the
following key characteristics:
— Venue receiving a fixed hiring fee;
— Venue retaining the catering commission;
— Hirer retaining the majority of premium seating product;
— Hirer retaining all ticketing revenue;
— Hirer retaining the majority of key commercial rights e.g. pourage,
ticketing, signage, etc.; and
— Venue responsible for event day costs.
Our experience of similar hiring agreements, particularly in an Australian
context, suggests there could be a higher degree of revenue, cost and risk
sharing. Under this approach the venue is able to participate in times of
success, but also shares the pain with hirers during more challenging times. It
is clearly in the interest of the venue to ensure the hirer is financially
sustainable (otherwise the venue has no content), however, the significant
expense of developing and operating a stadium also requires the venue
manager to receive an appropriate share of venue revenues.
The analysis presented in this report represents contemporary hiring
arrangements with a higher degree of sharing of revenue, costs and risks.
Commercial rights
Potential sources of revenues / expenses associated with stadium and arena
operations
Revenues Expenses
Item Owner Hirer Item Owner Hirer
Premium seating X / Event Day Expenses X / X /
GA seating X / Overhead Expenses X
Food & beverage X / Merchandise Costs X
Ticketing fees X / X / Rent / tenancy X
Merchandise X /
Naming Rights X /
Signage / Advertising X /
Supplier Rights X / X /
Venue Memberships X /
X /
X
= Primary Allocation
= Potential Revenue Sharing
= No Allocation
82

Appendix D: Financial Performance
83

Revenues
Stadia and arena have a wide range of potential revenue streams, including:
— Gate / ticket revenue;
— Food and beverage;
— Ticketing rights and ticketing fees;
— Naming rights sponsorship;
— Other signage and sponsorship rights for ‘spaces’ within an arena;
— Pourage rights (alcoholic and non-alcoholic);
— Other supplier rights (specifically food and beverage, audio visual.)
— Merchandise;
— Non-event day functions and events;
— Car parking; and
— Office / storage lease revenue.
Expenses
There are also a range of expenses resulting from management and utilisation
of major venues, including:
— Event day expenses - all expenses directly related to hosting an event,
including (but not limited to) security, event cleaning, ushers, traffic
management, and event presentation.
— Venue overhead expenses - all other venue operating costs which cannot
be directly attributable to an individual event including employee
expenses, regular repairs and maintenance, turf maintenance expenses,
insurances, promotion and marketing, legal and accounting, and general
administrative expenses.
It should be noted that this analysis is only based on true ‘cash’ operating
costs and does not include any provisions for depreciation and amortisation,
debt repayment or life cycle costs. These costs are covered separately later in
the report.
Adopted assumptions
Basis of assumptions
The financial projections are based on assumptions for each of these key
revenues and expenses. These assumptions have been developed based on
historical data for AMI Stadium (where available), benchmarks from other
comparable Australian and New Zealand venues available to KPMG and
publicly available information.
The benchmark data supporting many of the assumptions is available to
KPMG as commercial-in-confidence, and as such, the sources of exact data
points remain confidential.
Financial results are presented in FY17 real New Zealand dollar terms and
are exclusive of GST.
Average year
As per the discussion in relation to attendance, to some degree the financial
results of sporting venues are dependent on the on-field performance and
therefore crowd support of the key hirers. Further, on-field performance and
crowd support is likely to vary year by year and is therefore difficult to predict
with any degree of certainty. Accordingly, for the purposes of this analysis we
have provided financial projections for the “average year” of operation of the
venue taking into account the characteristics and capacity of the proposed
venue.
Basis of financial performance projections
84

The table on the following page presents the projected financial performance
of each Option for the first three years post opening. Values are presented in
real 2017 NZD terms.
As outlined earlier, financial projections represent average year attendances
and financial performance given the associated event calendar.
Key observations from the projections include:
— Revenue is projected to be highest under Option 4 ($7.1m-$7.2m
depending upon the event calendar): approximately 5% higher than
Option 3, 35% higher than Option 2 and between 95% and 130% higher
than Option 1 (depending upon the year). The event calendar and
attendances are the key drivers of this performance.
— In particular, other net event returns (e.g. concerts and entertainment
events) are projected to be significantly higher under Option 3 ($2.6m)
and Option 4 ($2.8m) when compared to Option 1 and Option 2 given the
higher number of concerts and other events that can be hosted as a result
of the retractable pitch and concrete pad.
— Venue overhead expenditure is also projected to be highest under Option
4 ($7.0m): approximately 12% higher than Option 3, 22% higher than
Option 2 and 50% higher than Option 1. Staffing, repairs & maintenance,
and insurance expenditure is the key difference between options.
— Overall, Options 3 ($0.5m-$0.6m) and 4 ($0.1m-$0.2m) are the only
Options projected to generate an operating surplus, presented as earnings
before interest, tax, depreciation and amortisation (EBITDA).
— Operations under Options 1 and 2 are projected to generate losses in all
years.
In summary the analysis projects that only Options 3 and 4 will be able to
record profitable operations at an EBITDA level, with Options 1 and 2 failing to
break-even.
Appendix E presents 10 year financial performance projections under each
Option, in nominal NZD terms.
Projected financial performance
85

Christchurch Financial projections ($000's, real 2017$ terms)
Year 1 Year 2 Year 3 Year 1 Year 2 Year 3 Year 1 Year 2 Year 3 Year 1 Year 2 Year 3
Revenue
Event revenue - core sports 2,204 1,819 2,204 2,556 2,470 2,556 2,556 2,470 2,556 2,650 2,563 2,650
Event revenue - other 380 190 - 1,263 1,263 1,263 2,589 2,589 2,589 2,839 2,839 2,839
Other revenue 1,100 1,100 1,100 1,475 1,475 1,475 1,685 1,685 1,685 1,685 1,685 1,685
Total revenue 3,684 3,109 3,304 5,294 5,208 5,294 6,830 6,744 6,830 7,174 7,087 7,174
Expenses
Staffing cost 553 553 553 794 794 794 1,025 1,025 1,025 1,076 1,076 1,076
Repairs & maintenance 1,899 1,899 1,899 2,510 2,510 2,510 2,664 2,664 2,664 3,219 3,219 3,219
Other expenses 2,165 2,165 2,165 2,368 2,368 2,368 2,507 2,507 2,507 2,645 2,645 2,645
Total expenses 4,617 4,617 4,617 5,672 5,672 5,672 6,195 6,195 6,195 6,940 6,940 6,940
EBITDA (933) (1,508) (1,313) (377) (464) (377) 635 549 635 233 147 233
Events 18 18 17 24 23 24 36 35 36 36 35 36
Option 2 Option 3 Option 4Option 1
Projected financial performance (cont.)
86

Christchurch Stadium - Sensitivity analysis on EBITDA (Year 1)
-10% Base +10% -10% Base +10% -10% Base +10% -10% Base +10%
-10% (782) (471) (160) (331) 84 710 580 1,255 1,929 219 927 1,636
Base (1,244) (933) (622) (898) (377) 143 (39) 635 1,310 (475) 233 942
+10% (1,706) (1,395) (1,084) (1,465) (839) (424) (659) 16 690 (1,169) (461) 248
Option 3 Option 4
Co
st
Revenue
Option 1 Option 2
Another consideration for decision makers is the inherent uncertainty
surrounding the project and the assumptions, inputs and analysis undertaken
at the pre-feasibility stage. To assess the potential impact of changes in key
variables, sensitivity analysis has been conducted to evaluate the effect on the
operating performance (EBITDA) of the venue given potential changes to
revenue and expenditure. This analysis is important as an option with a higher
net operating result may also suffer from higher potential variance, making the
option less desirable depending on the risk appetite of decision makers.
Results can be found in the table below, which represents the first year of
operations for the venue.
Revenue
The first of the two variables considered in the sensitivity analysis is revenue,
which considers the effects of a decrease of 10% and an increase of 10% in
the overall revenue line item (no change to expenditure).
— A 10% increase in revenue levels is projected to result in a positive
operating result for Options 2, 3 and 4. Option 1 is projected to have a
negative EBITDA of $0.6m.
— A 10% decrease in revenue levels will result in all Options incurring an
operating loss. Option 3 will have the smallest loss (approximately
$39,000).
Expenditure
The second variable considered in the sensitivity analysis is expenditure,
which considers the effects of a decrease of 10% and an increase of 10% in
the overall expenditure line item (no change to revenue).
— A 10% increase in expenditure levels is projected to result in a negative
operating result under all Options, with the exception of Option 3 is
projected to essentially breakeven.
— A 10% decrease in expenditure levels is projected to result in Options 2, 3
and 4 recording an operating surplus. Option 1 is projected to record a
loss of $0.5m.
Combined effects of revenue and expenditure increases / decreases
Finally, the following table presents an overall “high” and “low” scenario by
combining increases and decreases in revenue and expenditure.
— In the “high” scenario (top right corner of each Option in table below), the
greatest operating surplus is projected to be recorded under Option 3
($1.9m), with surpluses also projected under Options 2 and 4. Option 1 is
still projected to record a negative operating result (-$0.2m).
— In the “low” scenario (lower left corner of each Option in table below), all
Options are expected to record a negative operating result, with the
smallest loss projected to be incurred under Option 3 (-$0.7m)
In summary, Option 3 is expected to record a surplus under all but two of the
nine sensitivity combinations. Option 1 is the only option projected to record a
negative operating result under all sensitivity combinations.
Sensitivity analysis
87

In addition to regular repairs and maintenance (included in the financial
performance projections), major infrastructure assets such as stadia and
arena have an ongoing requirement for major capital replacement to keep the
venue fit-for-purpose as elements within the venue come to the end of their
economic useful lives.
These costs are referred to as life cycle costs. Typically, life cycle costs are
‘lumpy’ across the life of the asset. For example, there may be minimal spend
in the early years of the venue, followed by a major refurbishment / upgrade in
years 10 to 15.
Our experience suggests that on average life cycle costs range from between
1.5% to 3.5% of the asset replacement value (ARV) per year over the life of
the venue. Asset replacement value reflects the cost to replace the asset,
excluding the value of enabling and site preparation works and external works
(and associated fees, contingency and escalation) which would not be
incurred again.
The following table provides an indicative assessment of the average annual
lifecycle cost provision that would be required assuming a rate of 1.5%.
As presented in the table, life cycle costs can be significant. Specifically, the
projected operating loss at the venue would range from -$5.5m under Option
1 to -$7.4m under Option 4 if these costs were incurred in year 1 (figures are
nominal NZD terms in year 1 of operations).
This is not uncommon for venues of this nature. We understand that in the
Australian and New Zealand context very few stadia generate sufficient
operating surpluses to fully fund life cycle costs. It is good practice, however,
to ensure that operating surpluses are retained in a ‘sinking fund’ to assist
with future capital replacement activities. This is strongly recommended for
the operations of the MUA.
Life cycle costs
Indicative average annual life cycle costs ($m)
Option 1 Option 2 Option 3 Option 4
Asset replacement value (ARV) 299.5 395.7 420.1 507.6
Life cycle costs (1.5%) 4.5 5.9 6.3 7.6
Source: WT Partnership, KPMG
88

Appendix E: 10 year financial projections
89

Option 1: 10 year - Christchurch Financial projections ($000's, nominal terms)
Option 1 Year 1 Year 2 Year 3 Year 4 Year 5 Year 6 Year 7 Year 8 Year 9 Year 10
Revenue
Event revenue - core sports 2,433 2,059 2,556 1,884 2,971 1,979 2,821 2,387 2,964 2,184
Event revenue - other 419 215 - 678 - 237 486 249 - 786
Other revenue 1,214 1,245 1,276 1,308 1,340 1,374 1,408 1,443 1,479 1,516
Total revenue 4,066 3,518 3,832 3,869 4,312 3,590 4,716 4,080 4,443 4,487
Expenses
Staffing cost 610 625 641 657 673 690 707 725 743 762
Repairs & maintenance 2,096 2,149 2,202 2,257 2,314 2,372 2,431 2,492 2,554 2,618
Other expenses 2,390 2,450 2,511 2,574 2,638 2,704 2,772 2,841 2,912 2,985
Total expenses 5,096 5,224 5,354 5,488 5,626 5,766 5,910 6,058 6,210 6,365
EBITDA (1,030) (1,706) (1,523) (1,620) (1,314) (2,176) (1,195) (1,978) (1,766) (1,878)
Life cycle costs 4,492 4,604 4,719 4,837 4,958 5,082 5,209 5,340 5,473 5,610
Operating result (5,522) (6,310) (6,242) (6,457) (6,272) (7,258) (6,404) (7,318) (7,239) (7,488)
Option 1
90

Option 2: 10 year - Christchurch Financial projections ($000's, nominal terms)
Option 2 Year 1 Year 2 Year 3 Year 4 Year 5 Year 6 Year 7 Year 8 Year 9 Year 10
Revenue
Event revenue - core sports 2,822 2,795 2,964 2,936 3,115 3,085 3,272 3,241 3,438 3,405
Event revenue - other 1,394 1,429 1,465 1,501 1,539 1,577 1,617 1,657 1,699 1,741
Other revenue 1,628 1,669 1,711 1,753 1,797 1,842 1,888 1,935 1,984 2,033
Total revenue 5,844 5,892 6,140 6,191 6,451 6,504 6,777 6,833 7,120 7,179
Expenses
Staffing cost 877 898 921 944 968 992 1,017 1,042 1,068 1,095
Repairs & maintenance 2,770 2,839 2,910 2,983 3,058 3,134 3,213 3,293 3,375 3,460
Other expenses 2,614 2,679 2,746 2,815 2,885 2,957 3,031 3,107 3,185 3,264
Total expenses 6,261 6,417 6,577 6,742 6,910 7,083 7,260 7,442 7,628 7,819
EBITDA (417) (525) (438) (551) (460) (579) (483) (609) (508) (639)
Life cycle costs 5,936 6,084 6,237 6,392 6,552 6,716 6,884 7,056 7,232 7,413
Operating result (6,353) (6,609) (6,674) (6,944) (7,012) (7,295) (7,367) (7,665) (7,740) (8,053)
Option 2
91
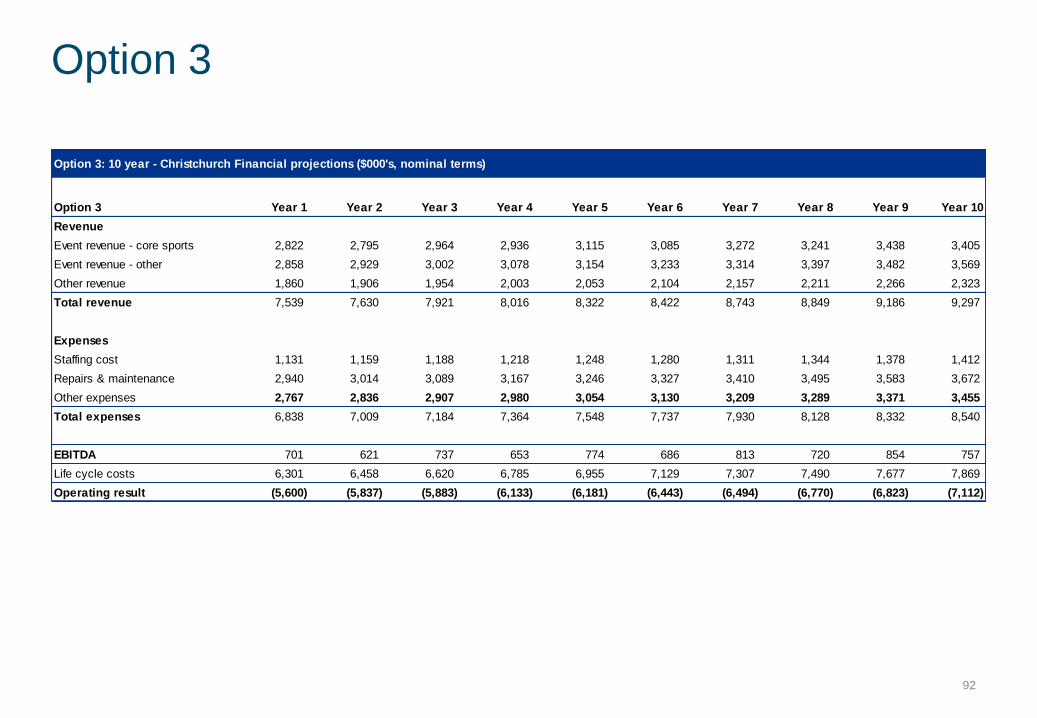
Option 3: 10 year - Christchurch Financial projections ($000's, nominal terms)
Option 3 Year 1 Year 2 Year 3 Year 4 Year 5 Year 6 Year 7 Year 8 Year 9 Year 10
Revenue
Event revenue - core sports 2,822 2,795 2,964 2,936 3,115 3,085 3,272 3,241 3,438 3,405
Event revenue - other 2,858 2,929 3,002 3,078 3,154 3,233 3,314 3,397 3,482 3,569
Other revenue 1,860 1,906 1,954 2,003 2,053 2,104 2,157 2,211 2,266 2,323
Total revenue 7,539 7,630 7,921 8,016 8,322 8,422 8,743 8,849 9,186 9,297
Expenses
Staffing cost 1,131 1,159 1,188 1,218 1,248 1,280 1,311 1,344 1,378 1,412
Repairs & maintenance 2,940 3,014 3,089 3,167 3,246 3,327 3,410 3,495 3,583 3,672
Other expenses 2,767 2,836 2,907 2,980 3,054 3,130 3,209 3,289 3,371 3,455
Total expenses 6,838 7,009 7,184 7,364 7,548 7,737 7,930 8,128 8,332 8,540
EBITDA 701 621 737 653 774 686 813 720 854 757
Life cycle costs 6,301 6,458 6,620 6,785 6,955 7,129 7,307 7,490 7,677 7,869
Operating result (5,600) (5,837) (5,883) (6,133) (6,181) (6,443) (6,494) (6,770) (6,823) (7,112)
Option 3
92

Option 4: 10 year - Christchurch Financial projections ($000's, nominal terms)
Option 4 Year 1 Year 2 Year 3 Year 4 Year 5 Year 6 Year 7 Year 8 Year 9 Year 10
Revenue
Event revenue - core sports 2,925 2,900 3,073 3,047 3,228 3,201 3,392 3,363 3,563 3,533
Event revenue - other 3,134 3,212 3,292 3,375 3,459 3,546 3,634 3,725 3,818 3,914
Other revenue 1,860 1,906 1,954 2,003 2,053 2,104 2,157 2,211 2,266 2,323
Total revenue 7,918 8,019 8,319 8,424 8,740 8,851 9,183 9,299 9,648 9,770
Expenses
Staffing cost 1,188 1,217 1,248 1,279 1,311 1,344 1,377 1,412 1,447 1,483
Repairs & maintenance 3,553 3,642 3,733 3,826 3,922 4,020 4,120 4,223 4,329 4,437
Other expenses 2,920 2,993 3,068 3,144 3,223 3,304 3,386 3,471 3,558 3,647
Total expenses 7,661 7,852 8,048 8,250 8,456 8,667 8,884 9,106 9,334 9,567
EBITDA 258 166 271 175 284 184 299 193 314 203
Life cycle costs 7,613 7,804 7,999 8,199 8,404 8,614 8,829 9,050 9,276 9,508
Operating result (7,356) (7,637) (7,728) (8,024) (8,119) (8,430) (8,530) (8,857) (8,962) (9,305)
Option 4
93

94