multicomponent - cgg · lithology identification, ... many acronyms and abbreviations used in the...
TRANSCRIPT

MulticomponentCompressional, Shear and Converted Wave Seismic
09B-PI-374-V1_Multicomponent.indd 1 12/11/09 16:15:41

Multicomponent2
MulticomponentIntroduction
CGGVeritas has been a leader in the use of multicomponent seismic for more than 30 years. During this time, multicomponent has evolved from its origins in small-scale land surveys to the latest high-density, wide-azimuth 3C onshore and 4C ocean bottom surveys.
As the industry turns towards higher-risk conventional reservoirs and unconventional sources of hydrocarbons, such as heavy oil deposits, multicomponent seismic has truly come of age. It provides valuable insights for reservoirs where conventional seismic fails to deliver.
Why Use Multicomponent Seismic?The purpose of multicomponent seismic is to record and utilize both compressional (P) and shear (S) wave modes. Recording both wave modes captures more information related to rock properties. P-waves are influenced by all three bulk rock properties (compressibility, rigidity and density) while S-waves are influenced by rigidity and density only. Combining these observations allows more accurate estimation of key reservoir characteristics.
Multicomponent has many vital uses including lithology identification, fluid discrimination, imaging through gas, fracture and stress-field characterization and density estimation. Multicomponent provides important complementary seismic information for comparison with conventional P-wave images and AVO results.
Multicomponent Experts
CGGVeritas has been a significant driver of advances in multicomponent technologies throughout the past decades. During this time we have developed market-leading expertise in acquisition, processing and interpretation. This has opened the way for use of the full elastic wavefield in processing and reservoir characterization.
Getting full value from multicomponent technology requires the marriage of high-quality acquisition with excellence in processing and imaging. As important is the smooth integration between all groups within CGGVeritas to ensure survey design, data acquisition, processing flows and interpretation are optimally co-ordinated.
Lower Your RiskThe realities of modern hydrocarbon exploration and production are that the commercial success of a field can depend on very fine margins. Recovery-rate improvement of a few percentage points can have a crucial impact on a reservoir’s economic viability and its production longevity. Multicomponent is a significant tool in allowing a fuller understanding of your reservoir and
enabling the right development decisions to be made.
Multicomponent Milestones
1970s Pioneered the acquisition and •processing of 3C data
1980s Promoted the use of converted •waves
1987 Acquired and processed first 9C •survey
1990s Advent of 4C ocean bottom •recording
1999 Processed industry’s first time-•lapse 4C survey
2000s Introduction of MEMS digital •sensors
2006 Development of Optowave•2010 Industry-first optical LoFS •
deployment
CGGVeritas has developed the necessary expertise and tools for advanced multicomponent processing and interpretation.
Reservoir characterization, such as fracture analysis, can yield better results when using multicomponent data.
CGGVeritas has the resources to acquire the largest of surveys, with over 18,000 multicomponent DSUs*.
*Please refer to the back cover for a glossary explaining the many acronyms and abbreviations used in the discussion of multicomponent.
09B-PI-374-V1_Multicomponent.indd 2 12/11/09 16:15:42
cggveritas.com 3
Lithology DiscriminationIdentify Your Reservoir Rocks
Better Lithology DiscriminationP- and S-waves provide complementary information about the rock matrix properties, pore fluids and pressures. From early laboratory rock physics studies to recent seismic surveys, the combined use of P- and S-wave data helps in discriminating lithology.
Seismic inversion provides estimates of rock properties used to identify lithologies and fluids. P-wave data alone requires the use of long offsets and AVO techniques to derive S-wave impedances and velocities. Joint PP and PS inversion provides S-wave properties directly and hence better fluid and lithology identification than either one alone.
A key step towards successful inversion is ensuring the S-wave image is of the highest possible resolution.
Use of multicomponent data can help discriminate between:
sand, shale, carbonates and volcanics• fluid, temperature and pressure changes during production• gas and lithology bright spots.•
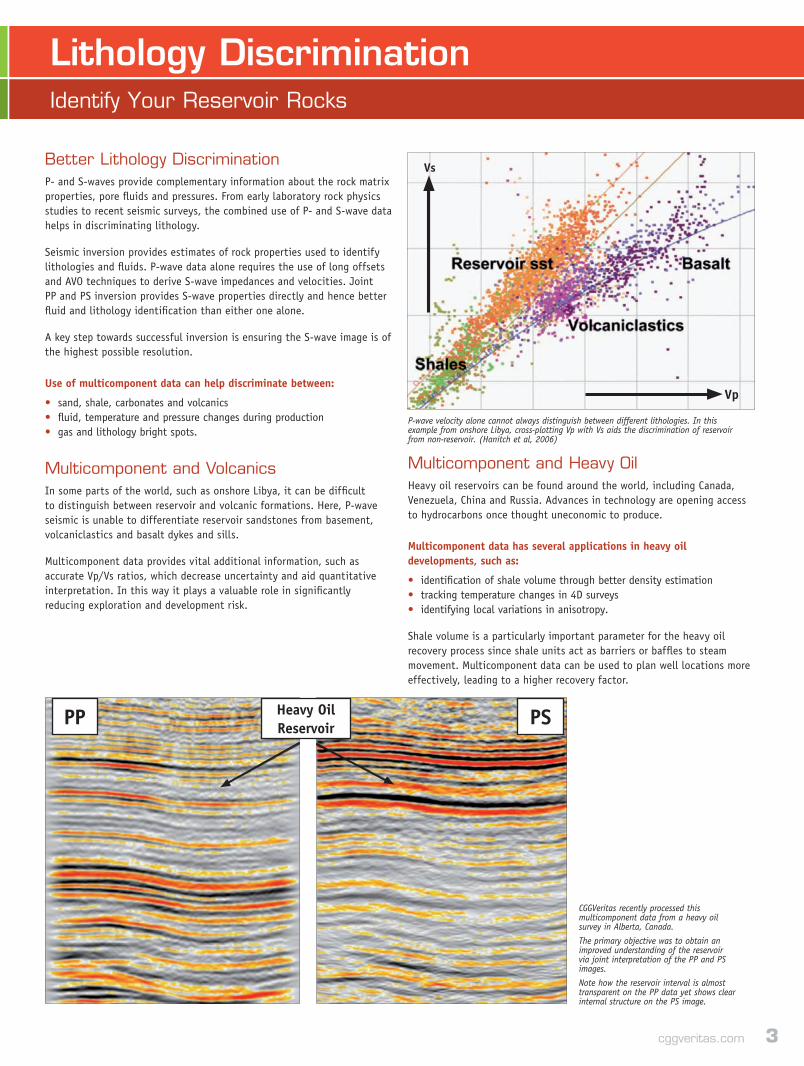
Multicomponent and VolcanicsIn some parts of the world, such as onshore Libya, it can be difficult to distinguish between reservoir and volcanic formations. Here, P-wave seismic is unable to differentiate reservoir sandstones from basement, volcaniclastics and basalt dykes and sills.
Multicomponent data provides vital additional information, such as accurate Vp/Vs ratios, which decrease uncertainty and aid quantitative interpretation. In this way it plays a valuable role in significantly reducing exploration and development risk.
Multicomponent and Heavy OilHeavy oil reservoirs can be found around the world, including Canada, Venezuela, China and Russia. Advances in technology are opening access to hydrocarbons once thought uneconomic to produce.
Multicomponent data has several applications in heavy oil developments, such as:
identification of shale volume through better density estimation• tracking temperature changes in 4D surveys• identifying local variations in anisotropy.•
Shale volume is a particularly important parameter for the heavy oil recovery process since shale units act as barriers or baffles to steam movement. Multicomponent data can be used to plan well locations more effectively, leading to a higher recovery factor.
P-wave velocity alone cannot always distinguish between different lithologies. In this example from onshore Libya, cross-plotting Vp with Vs aids the discrimination of reservoir from non-reservoir. (Hanitch et al, 2006)
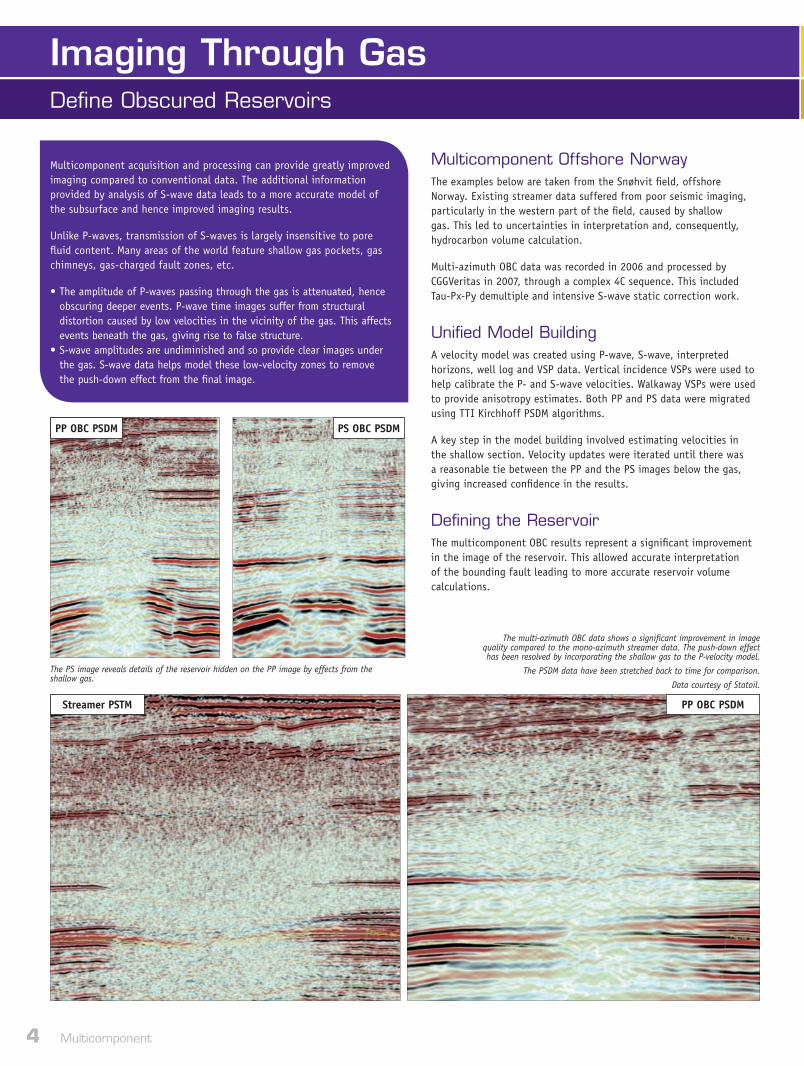
CGGVeritas recently processed this multicomponent data from a heavy oil survey in Alberta, Canada.
The primary objective was to obtain an improved understanding of the reservoir via joint interpretation of the PP and PS images.
Note how the reservoir interval is almost transparent on the PP data yet shows clear internal structure on the PS image.
Vs
Vp
PP PSHeavy Oil Reservoir
09B-PI-374-V1_Multicomponent.indd 3 12/11/09 16:15:43
Multicomponent4
Imaging Through GasDefine Obscured Reservoirs
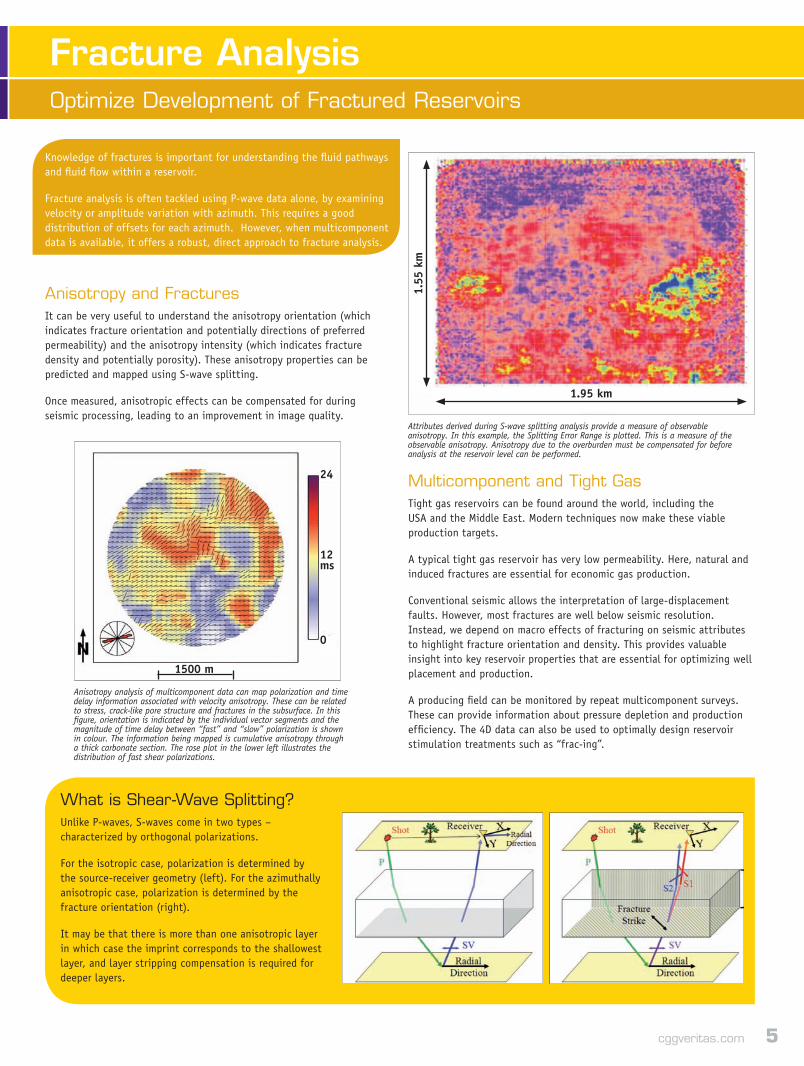
Multicomponent Offshore NorwayThe examples below are taken from the Snøhvit field, offshore Norway. Existing streamer data suffered from poor seismic imaging, particularly in the western part of the field, caused by shallow gas. This led to uncertainties in interpretation and, consequently, hydrocarbon volume calculation.
Multi-azimuth OBC data was recorded in 2006 and processed by CGGVeritas in 2007, through a complex 4C sequence. This included Tau-Px-Py demultiple and intensive S-wave static correction work.
Unified Model BuildingA velocity model was created using P-wave, S-wave, interpreted horizons, well log and VSP data. Vertical incidence VSPs were used to help calibrate the P- and S-wave velocities. Walkaway VSPs were used to provide anisotropy estimates. Both PP and PS data were migrated using TTI Kirchhoff PSDM algorithms.
A key step in the model building involved estimating velocities in the shallow section. Velocity updates were iterated until there was a reasonable tie between the PP and the PS images below the gas, giving increased confidence in the results.
Defining the ReservoirThe multicomponent OBC results represent a significant improvement in the image of the reservoir. This allowed accurate interpretation of the bounding fault leading to more accurate reservoir volume calculations.
The multi-azimuth OBC data shows a significant improvement in image quality compared to the mono-azimuth streamer data. The push-down effect has been resolved by incorporating the shallow gas to the P-velocity model.
The PSDM data have been stretched back to time for comparison.
Data courtesy of Statoil.
The PS image reveals details of the reservoir hidden on the PP image by effects from the shallow gas.
PP OBC PSDM
Streamer PSTM PP OBC PSDM
PS OBC PSDM
Multicomponent acquisition and processing can provide greatly improved imaging compared to conventional data. The additional information provided by analysis of S-wave data leads to a more accurate model of the subsurface and hence improved imaging results.
Unlike P-waves, transmission of S-waves is largely insensitive to pore fluid content. Many areas of the world feature shallow gas pockets, gas chimneys, gas-charged fault zones, etc.
The amplitude of P-waves passing through the gas is attenuated, hence •obscuring deeper events. P-wave time images suffer from structural distortion caused by low velocities in the vicinity of the gas. This affects events beneath the gas, giving rise to false structure. S-wave amplitudes are undiminished and so provide clear images under •the gas. S-wave data helps model these low-velocity zones to remove the push-down effect from the final image.
09B-PI-374-V1_Multicomponent.indd 4 12/11/09 16:15:45
cggveritas.com 5
Fracture AnalysisOptimize Development of Fractured Reservoirs
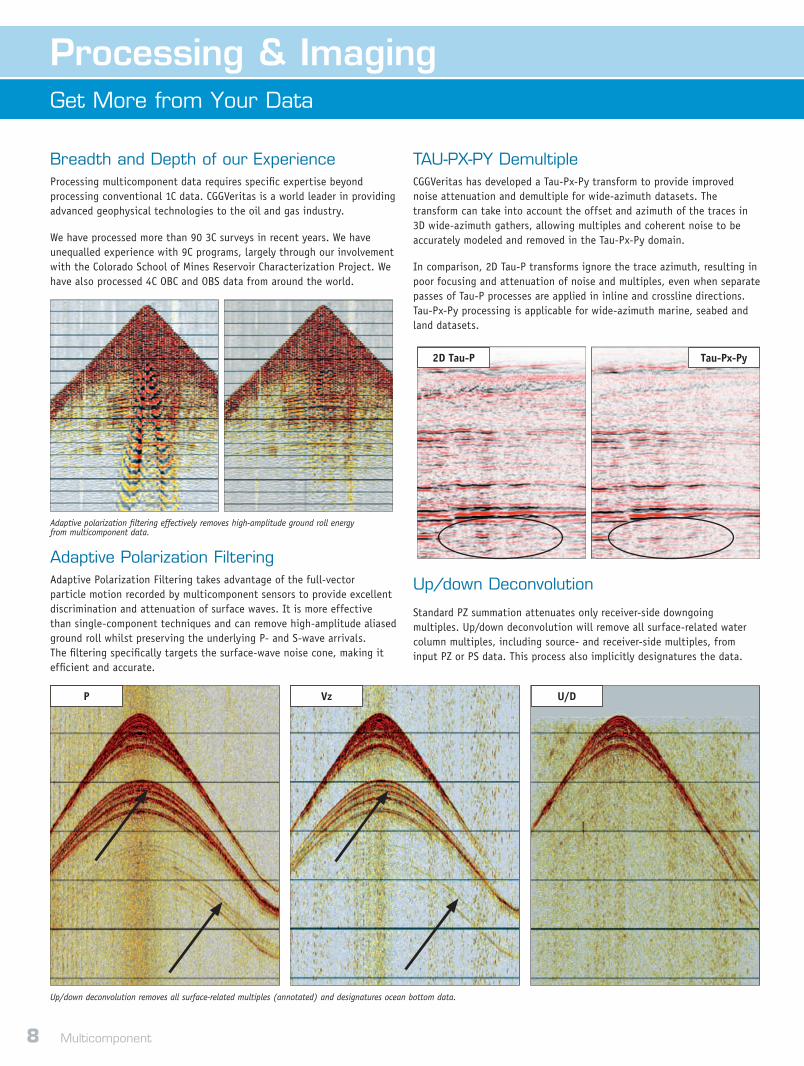
Anisotropy analysis of multicomponent data can map polarization and time delay information associated with velocity anisotropy. These can be related to stress, crack-like pore structure and fractures in the subsurface. In this figure, orientation is indicated by the individual vector segments and the magnitude of time delay between “fast” and “slow” polarization is shown in colour. The information being mapped is cumulative anisotropy through a thick carbonate section. The rose plot in the lower left illustrates the distribution of fast shear polarizations.
Attributes derived during S-wave splitting analysis provide a measure of observable anisotropy. In this example, the Splitting Error Range is plotted. This is a measure of the observable anisotropy. Anisotropy due to the overburden must be compensated for before analysis at the reservoir level can be performed.
Knowledge of fractures is important for understanding the fluid pathways and fluid flow within a reservoir.
Fracture analysis is often tackled using P-wave data alone, by examining velocity or amplitude variation with azimuth. This requires a good distribution of offsets for each azimuth. However, when multicomponent data is available, it offers a robust, direct approach to fracture analysis.
Anisotropy and FracturesIt can be very useful to understand the anisotropy orientation (which indicates fracture orientation and potentially directions of preferred permeability) and the anisotropy intensity (which indicates fracture density and potentially porosity). These anisotropy properties can be predicted and mapped using S-wave splitting.
Once measured, anisotropic effects can be compensated for during seismic processing, leading to an improvement in image quality.
Multicomponent and Tight GasTight gas reservoirs can be found around the world, including the USA and the Middle East. Modern techniques now make these viable production targets.
A typical tight gas reservoir has very low permeability. Here, natural and induced fractures are essential for economic gas production.
Conventional seismic allows the interpretation of large-displacement faults. However, most fractures are well below seismic resolution. Instead, we depend on macro effects of fracturing on seismic attributes to highlight fracture orientation and density. This provides valuable insight into key reservoir properties that are essential for optimizing well placement and production.
A producing field can be monitored by repeat multicomponent surveys. These can provide information about pressure depletion and production efficiency. The 4D data can also be used to optimally design reservoir stimulation treatments such as “frac-ing”.
What is Shear-Wave Splitting?Unlike P-waves, S-waves come in two types – characterized by orthogonal polarizations.
For the isotropic case, polarization is determined by the source-receiver geometry (left). For the azimuthally anisotropic case, polarization is determined by the fracture orientation (right).
It may be that there is more than one anisotropic layer in which case the imprint corresponds to the shallowest layer, and layer stripping compensation is required for deeper layers.
1.55
km
24
12 ms
0
1.95 km
1500 m
09B-PI-374-V1_Multicomponent.indd 5 12/11/09 16:15:45

Multicomponent6
Land AcquisitionInvest in the Full Elastic Wavefield
CGGVeritas has been at the forefront of multicomponent land seismic throughout its development and has acquired over 120 3C surveys and recently processed over 90 3C and 9C projects.
Multicomponent – “The New Standard”The development of 3C MEMS digital sensor units has revolutionized receiver technology. Through state-of-the-art equipment, led by Sercel’s DSU suite of sensors, data gathering now features:
single 3C receiver recording•high-fidelity, broadband, digital multicomponent data•more efficient field operations due to lighter units and reduced power •consumption.
Single 3C MEMS point-receivers can now replace conventional arrays. The lowering of a survey’s logistical complexity sees important rewards both in costs and in the environmental and HSE benefits of needing less people in the field.
For All EnvironmentsHydrocarbons are increasingly likely to be found in some of the world’s most awkward and complex terrains. CGGVeritas is uniquely positioned to overcome the difficulties of conducting surveys in these challenging locations:
dense forest and jungle •urban•swamp •lowland•salt plain•
Our resources combine with our expertise and experience to enable us to be the company of choice for those seeking to explore in sensitive or difficult environments. We design and implement surveys that respond both to clients’ needs and to the geographical, geological and geophysical demands of a survey site.
9C: 3C x 3CMost multicomponent land data records three components, using a P-wave source and 3C receivers. It is possible to use one vertical and two orthogonal S-wave vibrators, or one tri-axial vibrator, as sources. When recorded by the same 3C receivers this gives a total of 9 components for analysis.
The advantage of 9C over 3C is that 9C data allow all elastic modes to be utilized and analyzed. 9C is also key for 2D acquisition when birefringence (related to anisotropy) is an issue. In the isotropic case, the transverse component has much lower noise levels.
Land Equipment OptionsSercel UNITE Digital: •- cable-free - ease of layout in difficult terrain or situations - autonomous or real-time recording.Sercel DSU3-428: •- 3C MEMS accelerometers - Omni-Tilt automatic orientation correction - system capacity up to 100,000 channels.
mountain•transition zone•desert•arctic.•
CGGVeritas – Acquiring Multicomponent in All Environments
Sercel’s UNITE Digital system offers unprecedented levels of flexibility, reactivity and productivity.
09B-PI-374-V1_Multicomponent.indd 6 12/11/09 16:15:47

cggveritas.com 7
Seabed AcquisitionGo Beyond Streamer Acquisition
Shallow Water ExpertsThe so-called “transition zone” between land and marine seismic operations encompasses some of the most remote, sensitive and at times the most congested environments on the planet. To operate successfully within these constraints requires specialist expertise and resources. With over 100 transition zone surveys recorded worldwide, CGGVeritas is the partner of choice to deliver high-quality seismic results and excellent HSE performance.
Seamless AcquisitionNow more than ever, the boundaries between “land”, “transition zone” and “marine” are blurred. From Vibroseis trucks and 3C receivers on land to airguns and 4C cable in the sea, CGGVeritas can provide the full spectrum of acquisition technologies. Careful processing allows the creation of a single seismic volume, incorporating data from all types of source and receiver.
Ocean Bottom vs Towed StreamerOcean bottom acquisition, either cables or nodes, provides wide-azimuth multicomponent data with great advantages for exploration, reservoir characterization and identification of drilling hazards:
Lower noise environment gives improved data quality.•Working around and beneath surface and subsea infrastructure for •improved survey coverage.Recording multicomponent S-wave data using geophone sensors in •addition to hydrophones, provides:
additional information from the converted wave (PS) data -improved P-wave data. -
Ability to record data with all azimuths and large offsets, improving •illumination.
Marine Equipment OptionsSercel SeaRay 4C: •- up to 300 m water depth, or 500 m with specific handling - system capacity up to 100,000 channels.OYO Geospace 4C: •- up to 3000 m water depth - subsea receiver cable connected to the recording vessel via high-speed fiber-optic lead-in.Fully containerized source, cable and cable-handling equipment for •flexible mobilization. Dedicated source equipment coupled with a suite of 4D QC tools provides for real-time optimal source repeatability.
In this survey, 2C cables were used up to a depth of 15 m. A deepwater 4C cable was used for the remainder of the survey to depths of up to 230 m. The survey was carefully planned and successfully conducted around local fishing communities, strong river mouth currents and offshore infrastructure.
SeaRay is a new-generation 4C ocean bottom cable featuring the latest Sercel 428 digital MEMS technology.
09B-PI-374-V1_Multicomponent.indd 7 12/11/09 16:15:50
Multicomponent8
Processing & ImagingGet More from Your Data
Adaptive polarization filtering effectively removes high-amplitude ground roll energy from multicomponent data.
Up/down deconvolution removes all surface-related multiples (annotated) and designatures ocean bottom data.
2D Tau-P
P Vz U/D
Tau-Px-Py
Breadth and Depth of our ExperienceProcessing multicomponent data requires specific expertise beyond processing conventional 1C data. CGGVeritas is a world leader in providing advanced geophysical technologies to the oil and gas industry.
We have processed more than 90 3C surveys in recent years. We have unequalled experience with 9C programs, largely through our involvement with the Colorado School of Mines Reservoir Characterization Project. We have also processed 4C OBC and OBS data from around the world.
Adaptive Polarization FilteringAdaptive Polarization Filtering takes advantage of the full-vector particle motion recorded by multicomponent sensors to provide excellent discrimination and attenuation of surface waves. It is more effective than single-component techniques and can remove high-amplitude aliased ground roll whilst preserving the underlying P- and S-wave arrivals. The filtering specifically targets the surface-wave noise cone, making it efficient and accurate.
TAU-PX-PY DemultipleCGGVeritas has developed a Tau-Px-Py transform to provide improved noise attenuation and demultiple for wide-azimuth datasets. The transform can take into account the offset and azimuth of the traces in 3D wide-azimuth gathers, allowing multiples and coherent noise to be accurately modeled and removed in the Tau-Px-Py domain.
In comparison, 2D Tau-P transforms ignore the trace azimuth, resulting in poor focusing and attenuation of noise and multiples, even when separate passes of Tau-P processes are applied in inline and crossline directions. Tau-Px-Py processing is applicable for wide-azimuth marine, seabed and land datasets.
Up/down Deconvolution
Standard PZ summation attenuates only receiver-side downgoing multiples. Up/down deconvolution will remove all surface-related water column multiples, including source- and receiver-side multiples, from input PZ or PS data. This process also implicitly designatures the data.
09B-PI-374-V1_Multicomponent.indd 8 12/11/09 16:15:51

cggveritas.com 9
Mirror migration provides improved P-wave imaging of shallow events. This example shows sparse ocean bottom acquisition using five nodes. The upper images are timeslices, as annotated on the seismic sections.
True 3D SRME for Ocean Bottom DataStandard convolutional methods of SRME do not easily apply to ocean bottom data, as the sources and receivers are at different depths. Alternately, PZ summation can be effective for removing seabed pegleg multiples, but only where a 1D assumption is valid.
Using the CGGVeritas wavefield modeling approach, 3D SRME can be achieved even for sparse OBS data, and rugose waterbottoms. It requires the migration of the multiple generators at and around the sea floor for use as a model. Where receiver information is sparse the best model is obtained using mirror migration. Wavefield modeling 3D SRME is applied to common receivers, and so is effective even for very sparse node acquisition, as long as there are sufficient shots to avoid aliasing.
Comprehensive Imaging ToolboxCGGVeritas is at the forefront of advanced imaging technology and offers a comprehensive range of algorithms to suit land, marine and ocean bottom data, with VTI, HTI or TTI anisotropy:
Kirchhoff•One-Way Wave Equation•Controlled Beam•Reverse Time.•
In particular, for PS-wave data, we have developed Kirchhoff PSTM and PSDM imaging algorithms and velocity analysis tools. We can combine P- and S-wave information during model building to generate improved images.
Mirror MigrationLarge receiver intervals tend to be used in OBS acquisition, providing poor illumination of shallow targets. This problem affects both OBS nodes and the crossline spacing of ocean bottom cables. Mirror migration solves this problem by separation of the seabed hydrophone and geophone data into upgoing and downgoing waves. We then image the downgoing waves, or ghost reflections, as though they had been recorded as high as the sea is deep above the sea surface. This generates better P-wave images than those produced conventionally from the primary upgoing waves.
The main reasons for the improvement in P-wave imaging are:
The illumination of the downgoing wave has a larger aperture than that •of the upgoing waves.The ghosts are travelling closer to vertical than the primaries.•The ghosts travel twice through the water after going through any seabed •anomalies and so are proportionally less sensitive to them.The seabed can be imaged with the ghosts but not at all with the •upgoing waves.
Conventional imaging Mirror migration
09B-PI-374-V1_Multicomponent.indd 9 12/11/09 16:15:51

Multicomponent10
4D and Life-of-Field SeismicReduce Uncertainty in Reservoir Monitoring
Permanent LoFS SystemsWe provide comprehensive integrated solutions for Life-of–Field reservoir monitoring. We offer the complete range of services from feasibility studies including planning and design, through supply and installation of equipment to acquisition, processing and reservoir characterization.
Where reservoir conditions indicate that frequent monitor surveys would be beneficial, permanently installed systems are the cost-effective alternative to conventional surveys. Permanently installed systems also offer enhanced repeatability compared to conventional acquisition.
Multicomponent at Weyburn and RulisonCGGVeritas participated in the Colorado School of Mines Reservoir Characterization Project (RCP) relating to the processing of 9C 4D multicomponent data from the Weyburn field in Saskatchewan, Canada. A CO2 injection program, using horizontal wells, was initiated to sweep bypassed pay zones in the reservoir and improve production rates.
Multicomponent surveying was required, due to the nature of the Weyburn reservoir rock fabric. A high-porosity “Marly” unit is more sensitive to P-waves while the underlying “Vuggy” is more sensitive to S-waves. Hence both could be studied simultaneously using multicomponent.
The resulting 4D anomaly maps clearly showed the CO2 fingering and were extremely valuable in facilitating reservoir management decisions.
CGGVeritas also processed the 9C 4D project for RCP at Rulison Field in Colorado, USA. In this multicomponent, time-lapse research project, changes in shear wave anisotropy were related to reservoir pressure depletion in a “tight-gas” sandstone reservoir.
Multicomponent West of ShetlandsIn 2006, BP trenched 40 km of cables over a 13 km2 pilot area of the Clair field, west of the Shetland Islands. The extremely hard water-bottom in the Clair field area means that conventional towed streamer seismic suffers from severe water-bottom multiples. The multicomponent data recorded from the OBC acquisition allows additional processing techniques to be used to overcome these problems.
CGGVeritas is processing the Clair data, using many of our advanced processing techniques, including directional designature, Tau-Px-Py deconvolution and TTI depth imaging.
SeisMovieSeisMovie was developed by CGGVeritas, GDF SUEZ and IFP in the late 1990s as a reservoir-oriented tool to provide high-resolution continuous seismic monitoring of reservoirs used for the seasonal storage of natural gas. Recently it has also proved highly effective in monitoring steam-assisted heavy oil production.
Uniquely, the system is designed to allow on-demand and continuous acquisition over extended periods of time, with outstanding repeatability. The resulting seismic “movie” facilitates the monitoring of the reservoir on a daily basis, capturing all the details of the production effects which could easily be missed by conventional 4D seismic acquisition.
The key features of SeisMovie are:
buried vertical arrays and areal grids of single- or multicomponent •receiversburied low-energy piezoelectric vibrator sources (10-500 Hz)•remotely-controlled onsite systems to allow autonomous recording, •processing and data transmissionboth active and passive seismic can be recorded using the same •monitoring infrastructure.
Optowave Fiber Optic TechnologyFor water depths up to 500 m we offer the Sercel Optowave system which consists of fiber optic cables and 4C sensor stations with topside laser interrogation instrumentation. The main advantages of Optowave are:
subsea components are completely passive, providing greater durability •and reliability compared with systems that use electronic or moving-coil sensorsno subsea power requirements making this system inherently safer•broad bandwidth with inherently low system noise from 1-200 Hz•precise and stable signals due to uniform ground-station coupling of •accelerometers.
Successful pilot studies on the Ekofisk and Snorre fields in 2008, at 70 m and 300 m water depths, have resulted in a full-scale installation being planned on Ekofisk in 2010.
The largest area yet for a permanent installation is planned for Ekofisk in 2010: 4000 x 4C channels, 200 km of seismic cables, covering 60 km2.
09B-PI-374-V1_Multicomponent.indd 10 12/11/09 16:15:53
cggveritas.com 11
Interpretation & ReservoirDe-risk Exploration, Optimize Production
Interpretation BenefitsThe additional information recorded by multicomponent surveys allows for better interpretation of reservoir properties:
lithology discrimination• fracture and stress identification and characterization• fluid identification.•
PP-PS Interpretative ProcessingBy its nature, joint processing of PP and PS data has an interpretative element. It requires specialist applications to enable the data to be interpreted.
Due to the basic reflectivity differences between PP and PS data, as well as variations in PS arrival times, the final processed PS data can be difficult to work with independently. Therefore, it is necessary to register the PP and PS data with their respective synthetic seismograms, and convert the PS data into PP time.
Alternatively both the PP and PS data can be converted to depth, which requires dipole sonic logs or multicomponent VSP data. The registered sections can be QC’d by visually observing consistent structure and stratigraphic characteristics.
Registration is not only a necessary process for interpretation, it also provides interval Vp/Vs ratio estimates useful for lithology discrimination.
PP-PS Joint InversionPP- and PS-AVO and joint PP- and PS-inversion offer tremendous capacity for reducing drilling risk. The inversion process allows rock property information to be extrapolated from known well locations to yet-to-be drilled prospects. Having both PP and PS inversions available allows for non-boundary-driven Vp/Vs ratio computation.
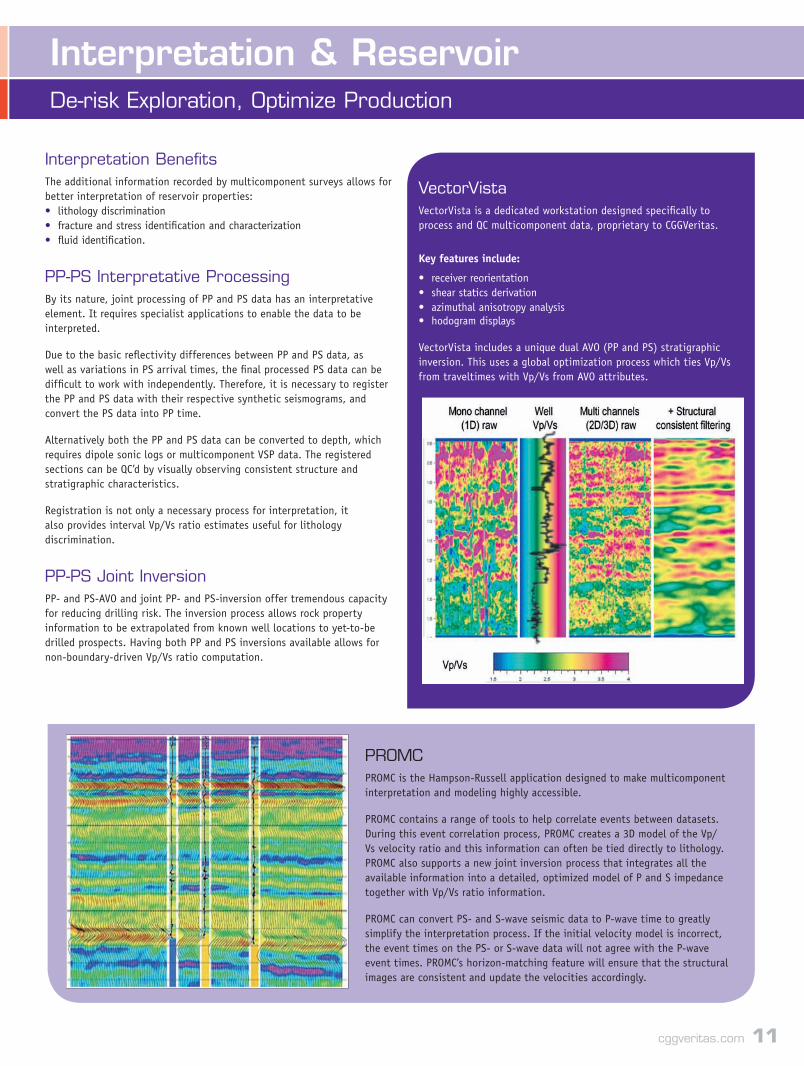
VectorVistaVectorVista is a dedicated workstation designed specifically to process and QC multicomponent data, proprietary to CGGVeritas.
Key features include:
receiver reorientation• shear statics derivation• azimuthal anisotropy analysis• hodogram displays•
VectorVista includes a unique dual AVO (PP and PS) stratigraphic inversion. This uses a global optimization process which ties Vp/Vs from traveltimes with Vp/Vs from AVO attributes.
PROMCPROMC is the Hampson-Russell application designed to make multicomponent interpretation and modeling highly accessible.
PROMC contains a range of tools to help correlate events between datasets. During this event correlation process, PROMC creates a 3D model of the Vp/Vs velocity ratio and this information can often be tied directly to lithology. PROMC also supports a new joint inversion process that integrates all the available information into a detailed, optimized model of P and S impedance together with Vp/Vs ratio information.
PROMC can convert PS- and S-wave seismic data to P-wave time to greatly simplify the interpretation process. If the initial velocity model is incorrect, the event times on the PS- or S-wave data will not agree with the P-wave event times. PROMC’s horizon-matching feature will ensure that the structural images are consistent and update the velocities accordingly.
09B-PI-374-V1_Multicomponent.indd 11 12/11/09 16:15:54

cggveritas.com09
B-P
I-37
4-V
1
Worldwide HeadquartersParis, France Tour Maine-Montparnasse
33, Avenue du Maine B.P. 191
75755 Paris Cedex 15 FRANCE
Tel: +33 1 64 47 45 00
Fax: +33 1 64 47 34 31
Massy, France 1, rue Léon Migaux
91341 Massy Cedex FRANCE
Tel: +33 1 64 47 30 00
Fax: +33 1 64 47 39 70
Houston, USA 10300 Town Park Drive
Houston, TX 77072 U.S.A.
Tel: +1 832 351 8300
Fax: +1 832 351 8701
Regional Offices Bergen +47 56 11 31 00
Calgary +1 403 205 6000
London +44 1293 683000
Singapore +65 6723 5500
Multicomponent Glossary
How Many Components?
1C traditional single geophone or hydrophone
2C (PZ) hydrophone (P) and vertical geophone (Z)
3C 3-component sensor (X, Y, Z)
4C 3C plus hydrophone (P)
9C 3C shear source recorded by 3C sensor (X, Y, Z)
4D time-lapse data resulting from surveying the same area at different stages in a reservoir’s production (not specific to multicomponent)
Anisotropy (the dependence of any property on direction)
TI Transverse isotropy, the generic case
TTI Tilted TI
HTI Horizontal TI, also known as azimuthal anisotropy e.g. vertical fracture planes
VTI Vertical TI, also known as polar anisotropy e.g. horizontally layered shales
Acquisition Hardware
MEMS Micro electro mechanical system
DSU Digital sensor unit
DSU3 3C digital sensor unit
OBC Ocean bottom cable
OBS Ocean bottom seismometer (node)
LoFS Life-of-field seismic
Seismic Waves
P-wave Compressional wave
S-wave Shear wave
PS-wave Converted wave (P-wave converted to S-wave at the reflection point)
The realities of modern hydrocarbon exploration and production are that the commercial success of a field can depend on very fine margins. Recovery-rate improvement of a few percentage points can have a crucial impact on a reservoir’s economic viability and its production longevity. Multicomponent is a significant tool in allowing a fuller understanding of your reservoir and enabling the right development decisions to be made.
09B-PI-374-V1_Multicomponent.indd 12 12/11/09 16:15:54