multidimensional representation of ultrasonic data
TRANSCRIPT
Multidimensional Representation of Ultrasonic DataProcessed by Reconfigurable Ultrasonic
System-on-Chip Using OpenCL High-LevelSynthesis
Spenser Gilliland, Clementine Boulet, Thomas Gonnot and Jafar SaniieDepartment of Electrical and Computer Engineering
Illinois Institute of Technology, Chicago, Illinois, USA
Abstract—Ultrasonic non-destructive testing has been widelyused to determine the properties of materials, and more impor-tantly their integrity. However, these techniques often requirecapturing massive amounts of data and intensive signal processingfor processes such as image formation, analysis, characterization,classification and diagnosis. Our study is focused around utilizinga Reconfigurable Ultrasonic System-on-Chip Hardware (RUSH)platform to process ultrasonic signals in real-time. To this end,OpenCL has been utilized in the RUSH platform to provide ameans to accelerate computation using the FPGA fabric whileproviding consistent memory and execution models to enableportability. To visualize the ultrasound data, a Graphical UserInterface (GUI) for the Analysis of Multidimensional Ultrasonicdata on RUSH (GAMUR) has been incorporated. GAMURutilizes C++/QT and OpenGL to enable enhanced visualizationand control features within the RUSH platform. The interfacenot only features the ability to view the ultrasound signals inone dimension, two dimensions, or three dimensions; but also tocommand and configure the hardware accelerators built usingOpenCL. Therefore, the system provides a means for analyzing,visualizing and accelerating the extraction of information frommulti-dimensional ultrasound data.
I. INTRODUCTION
In industry, material quality can be of critical importanceto safety and efficiency. Small cracks or fatigue in airplanes orsubmarines can lead to significant damage when placed understress. Therefore, the testing of the materials from the insideout is of great importance to guarantee the reliability of thestructure. However, it is neither practical nor reliable to cuta material in order to test it’s integrity. So, industry relies onultrasonic probing, a non-invasive, non-destructive techniqueto test materials. Submerged ultrasonic testing is commonlyused to maximize the energy transmitted to the material undertest. However, the principle of submerged ultrasonic probingutilizes ever increasing ultrasonic frequencies to penetrate deepinto the material [1]. Therefore, these tests require high speeddata acquisition techniques and signal processing that can onlyreasonably be achieved using System-on-Chip (SOC) designwith FPGAs or ASICs.
The use of hardware design for signal acquisition andprocessing normally requires knowledge of languages such asVHDL or Verilog. However, recent developments in high-levelsynthesis let us use languages such as C and C++ to designhardware. OpenCL is a vendor neutral standard maintained
by the Khronos Foundation. It was originally created as thealternative to the NVIDIA CUDA programming environmentfor AMD based GPUs; however, it has quickly been adoptedby other vendors including Intel, Qualcomm, and Texas In-struments. Originality created for use by GPUs, OpenCL hasrecently started to receive attention on FPGAs by Altera [2]and Xilinx [3]. OpenCL allows a designer to portably createC programs which target various types of accelerators.
OpenCL solves a unique problem with respect to the cur-rently available heterogeneous parallel programming APIs. Atits core, the standard provides common methods for memorymanagement, and execution control. This alleviates the need toproduce a custom kernel driver for each accelerator and ensuresthat memory management occurs in a consistent manner acrossdevices from many different vendors. This greatly increases theportability of the platform from one generation to the next andalleviates the need to implement several of the plumbing layerscommonly required in accelerator development.
QT and OpenGL are commonly used together to producegraphical user interfaces (GUI). QT provides common two di-mensional layout and windowing support while OpenGL addshardware accelerated three dimensional rendering capabilities.Using these libraries it is possible to build advanced userinterfaces that accurately portray data in both two and threedimensions.
In section II, we present the base system for the submergedultrasonic testing, using a reconfigurable architecture for signalprocessing. Section III and IV detail the implementation ofthese algorithms and their interfacing with the microprocessorusing OpenCL High-Level Synthesis (HLS). Then section Vpresents the GUI in charge of presenting the acquired datausing multidimensional graphics. Finally, section VI concludesthis paper.
II. SYSTEM DESCRIPTION
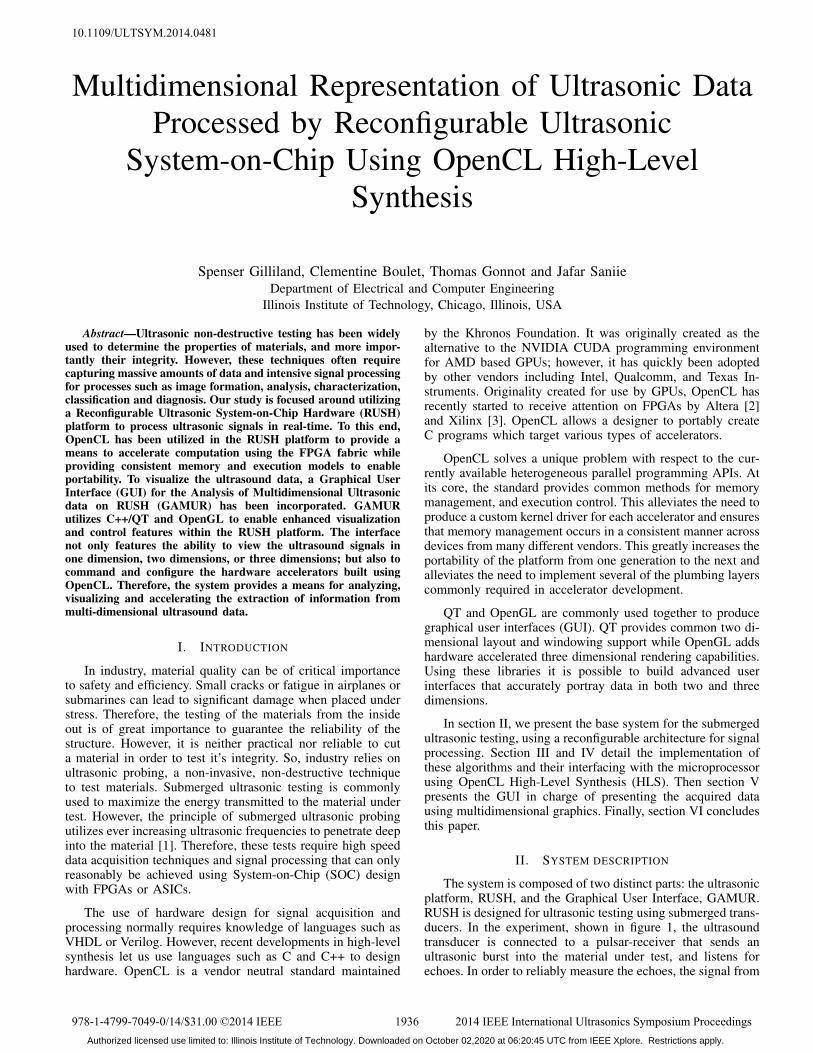
The system is composed of two distinct parts: the ultrasonicplatform, RUSH, and the Graphical User Interface, GAMUR.RUSH is designed for ultrasonic testing using submerged trans-ducers. In the experiment, shown in figure 1, the ultrasoundtransducer is connected to a pulsar-receiver that sends anultrasonic burst into the material under test, and listens forechoes. In order to reliably measure the echoes, the signal from
1936978-1-4799-7049-0/14/$31.00 ©2014 IEEE 2014 IEEE International Ultrasonics Symposium Proceedings
10.1109/ULTSYM.2014.0481
Authorized licensed use limited to: Illinois Institute of Technology. Downloaded on October 02,2020 at 06:20:45 UTC from IEEE Xplore. Restrictions apply.
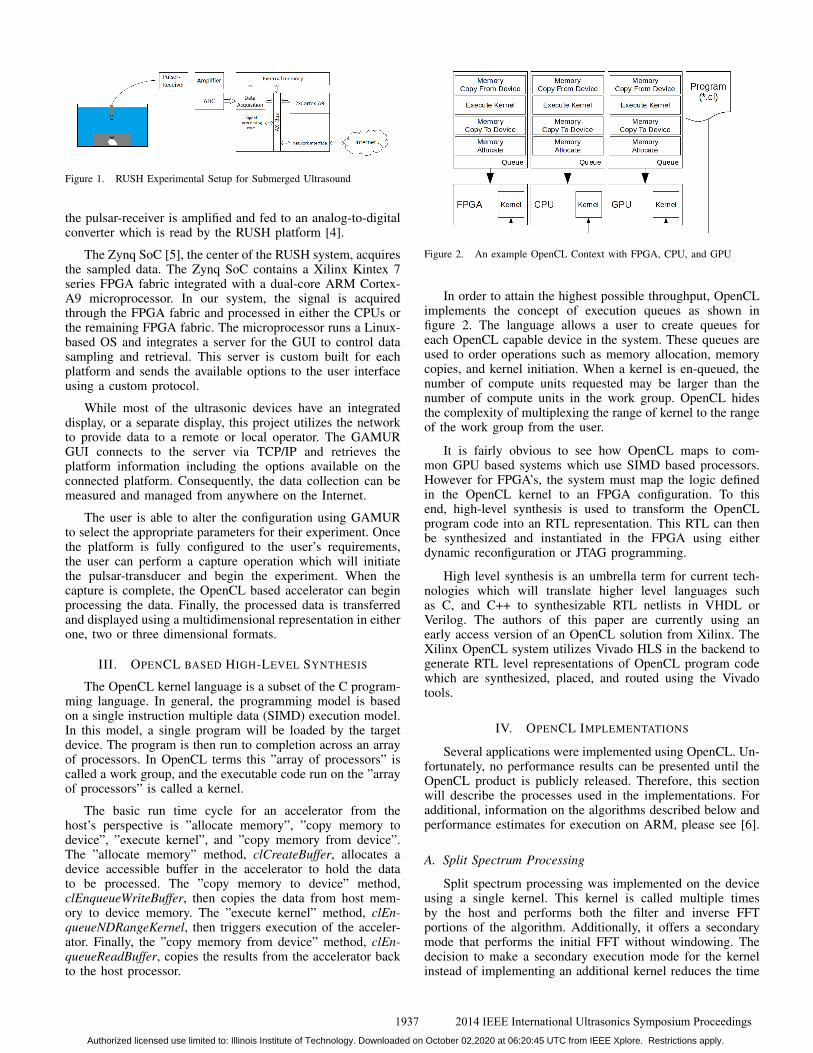
Figure 1. RUSH Experimental Setup for Submerged Ultrasound
the pulsar-receiver is amplified and fed to an analog-to-digitalconverter which is read by the RUSH platform [4].
The Zynq SoC [5], the center of the RUSH system, acquiresthe sampled data. The Zynq SoC contains a Xilinx Kintex 7series FPGA fabric integrated with a dual-core ARM Cortex-A9 microprocessor. In our system, the signal is acquiredthrough the FPGA fabric and processed in either the CPUs orthe remaining FPGA fabric. The microprocessor runs a Linux-based OS and integrates a server for the GUI to control datasampling and retrieval. This server is custom built for eachplatform and sends the available options to the user interfaceusing a custom protocol.
While most of the ultrasonic devices have an integrateddisplay, or a separate display, this project utilizes the networkto provide data to a remote or local operator. The GAMURGUI connects to the server via TCP/IP and retrieves theplatform information including the options available on theconnected platform. Consequently, the data collection can bemeasured and managed from anywhere on the Internet.
The user is able to alter the configuration using GAMURto select the appropriate parameters for their experiment. Oncethe platform is fully configured to the user’s requirements,the user can perform a capture operation which will initiatethe pulsar-transducer and begin the experiment. When thecapture is complete, the OpenCL based accelerator can beginprocessing the data. Finally, the processed data is transferredand displayed using a multidimensional representation in eitherone, two or three dimensional formats.
III. OPENCL BASED HIGH-LEVEL SYNTHESIS
The OpenCL kernel language is a subset of the C program-ming language. In general, the programming model is basedon a single instruction multiple data (SIMD) execution model.In this model, a single program will be loaded by the targetdevice. The program is then run to completion across an arrayof processors. In OpenCL terms this ”array of processors” iscalled a work group, and the executable code run on the ”arrayof processors” is called a kernel.
The basic run time cycle for an accelerator from thehost’s perspective is ”allocate memory”, ”copy memory todevice”, ”execute kernel”, and ”copy memory from device”.The ”allocate memory” method, clCreateBuffer, allocates adevice accessible buffer in the accelerator to hold the datato be processed. The ”copy memory to device” method,clEnqueueWriteBuffer, then copies the data from host mem-ory to device memory. The ”execute kernel” method, clEn-queueNDRangeKernel, then triggers execution of the acceler-ator. Finally, the ”copy memory from device” method, clEn-queueReadBuffer, copies the results from the accelerator backto the host processor.
Figure 2. An example OpenCL Context with FPGA, CPU, and GPU
In order to attain the highest possible throughput, OpenCLimplements the concept of execution queues as shown infigure 2. The language allows a user to create queues foreach OpenCL capable device in the system. These queues areused to order operations such as memory allocation, memorycopies, and kernel initiation. When a kernel is en-queued, thenumber of compute units requested may be larger than thenumber of compute units in the work group. OpenCL hidesthe complexity of multiplexing the range of kernel to the rangeof the work group from the user.
It is fairly obvious to see how OpenCL maps to com-mon GPU based systems which use SIMD based processors.However for FPGA’s, the system must map the logic definedin the OpenCL kernel to an FPGA configuration. To thisend, high-level synthesis is used to transform the OpenCLprogram code into an RTL representation. This RTL can thenbe synthesized and instantiated in the FPGA using eitherdynamic reconfiguration or JTAG programming.
High level synthesis is an umbrella term for current tech-nologies which will translate higher level languages suchas C, and C++ to synthesizable RTL netlists in VHDL orVerilog. The authors of this paper are currently using anearly access version of an OpenCL solution from Xilinx. TheXilinx OpenCL system utilizes Vivado HLS in the backend togenerate RTL level representations of OpenCL program codewhich are synthesized, placed, and routed using the Vivadotools.
IV. OPENCL IMPLEMENTATIONS
Several applications were implemented using OpenCL. Un-fortunately, no performance results can be presented until theOpenCL product is publicly released. Therefore, this sectionwill describe the processes used in the implementations. Foradditional, information on the algorithms described below andperformance estimates for execution on ARM, please see [6].
A. Split Spectrum Processing
Split spectrum processing was implemented on the deviceusing a single kernel. This kernel is called multiple timesby the host and performs both the filter and inverse FFTportions of the algorithm. Additionally, it offers a secondarymode that performs the initial FFT without windowing. Thedecision to make a secondary execution mode for the kernelinstead of implementing an additional kernel reduces the time
1937 2014 IEEE International Ultrasonics Symposium ProceedingsAuthorized licensed use limited to: Illinois Institute of Technology. Downloaded on October 02,2020 at 06:20:45 UTC from IEEE Xplore. Restrictions apply.

Figure 3. GUI showing one dimensional data
Figure 4. GUI showing two dimensional data
spent performing FPGA reconfiguration while allowing themaximum possible FFT size in the fabric.
B. Chirplet Signal Decomposition
The chirplet signal decomposition algorithm was imple-mented on the device using a single kernel for similar reasonsas the FFT. This kernel simply generates a chirplet withspecified parameters and compares the result to the originalsignal. The host is then responsible for altering the chirpletparameters to attain a higher correlation.
V. MULTIDIMENSIONAL DATA REPRESENTATION
The GUI receives data directly from the RUSH platformvia a network connection. The data can be of one, two or threedimensional and is represented accordingly. For instance, thetwo dimensional data can be displayed using a two dimensionalplot, or the user can select a one dimensional waveform byfixing a value in the x direction. This same principle appliesfor three dimensional data that can be displayed as one, twoor three dimensional data.
Figure 5. GUI showing three dimensional data
Figure 6. 3D representation of the data for different threshold values. Fromright to left: T=53, 71, 99, 127
A. One-Dimensional Representation
The one dimensional data usually represents the acquisitionof the signal corresponding to a depth of an ultrasonic echo,called an A-scan. The result is a curve containing the amplitudeof different echoes representing potential flaws along the depthof the material.
In figure 3, we can see the raw signal provided by theacquisition board. Additionally, we can see the interface withthe signal processing and acquisition options of the platform.Note that only the one dimensional plot is available for onedimensional data.
B. Two-Dimensional Representation
In two dimensions, there are two ways of observing thedata, a B-Scan or a C-Scan. For a B-Scan, the two dimensionaldata represents the echoes from different pulses along a x ory axis where the z vector represents the depth of the material.The B-scan is obtained by combining many single axis A-scans. In a C-scan, samples are shown at constant depth acrossboth x and y axis. The C-scan requires a scan in both the x andy directions using either a two dimensional pulsar transducerarray or a two-axis CNC scanner.
In figure 4, we can see an example of two dimensional plot,more specifically a B-scan. We can see the echoes in red andblue colors representing the positive and negative extremes ofthe signal.
C. Three-Dimensional Representation
The three dimensional data representation is designed toshow the localization and intensity of the different echoesmeasured from the material. Arising from this representation,there is the possibility that echoes will occlude each other fromthe view of the user. To minimize this byproduct, the GUImakes use of the OpenGL transparency properties. Therefore,
1938 2014 IEEE International Ultrasonics Symposium ProceedingsAuthorized licensed use limited to: Illinois Institute of Technology. Downloaded on October 02,2020 at 06:20:45 UTC from IEEE Xplore. Restrictions apply.

if an echo is strong, it will show as solid red. However, ifthe echo is faint, it will be shown in a light blue color withrepresentative transparency. All echoes between these extremeswill be represented using the full color spectrum from red toblue, and the full range from solid to completely transparent.
In order to optimize the representation, the informationneeds to be simplified. This simplification requires two mainoperations to take place. First the data undergoes a sub-sampling process. Among the thousands of samples in anA-scan for example, only about a hundred discrete positionsare displayed. The second operation is to determine the peakenergy of the echo and display it as cubes, representing theenergy in that location. In addition, a threshold parameterallows the user to limit the display to the echoes with sufficientenergy to make the flaws more visible.
Figure 5 shows the user interface when displaying data inthree dimensions. We can clearly distinguish the high echoenergy areas in solid red from the lower ones in translucentblue. We can see in the interface a selection slider to changethe threshold for displaying echoes. Figure 6 shows the repre-sentation of the same data for different values of the threshold.
VI. CONCLUSION
In this paper, we presented a complete framework for sub-merged ultrasonic testing. The design relies on OpenCL basedhigh-level synthesis for the implementation and utilization ofhardware signal processing algorithms and is complementedby a networked GUI application that allows multidimensionalrepresentation of the acquired data and control of the captureparameters.
REFERENCES
[1] S. MacIntosh, D. N. Sinha, G. Kaduchak, ”Noninvasive noncontactfluid detection in submerged containers using swept frequency ultrasonictechnique,” Ultrasonics Symposium, 2001 IEEE, vol. 1, pp. 689-692vol. 1, 2001
[2] Altera, ”Altera Opens the World of FPGAs to Software Program-mers with Broad Availability of SDK and Off-the-Shelf Boardsfor OpenCL,” available at http://newsroom.altera.com/press-releases/nr-altera-sdk-opencl-conformance.pdf
[3] Xilinx, ”Software-based system realization with C/C++ and OpenCL”,[Online]. http://www.xilinx.com/content/xilinx/en/products/design-tools/all-programmable-abstractions/#software-based
[4] Gilliland, S.; Saniie, J.; Aslan, S., ”Linux based reconfigurable platformfor high speed ultrasonic imaging,” Circuits and Systems (MWSCAS),2012 IEEE 55th International Midwest Symposium on , vol., no.,pp.486,489, 5-8 Aug. 2012
[5] Xilinx, ”Zynq-7000 All Programmable SoC Technical ReferenceManual”, UG585 (v1.5) March 7, 2013 [Online]. Available:http://www.xilinx.com/support/documentation/user-guides/ug585-Zynq-7000-TRM.pdf
[6] Gilliland, S.; Govindan, P.; Gonnot, T.; Saniie, J., ”Performance evalua-tion of FPGA based embedded ARM processor for ultrasonic imaging,”Ultrasonics Symposium (IUS), 2013 IEEE International , vol., no.,pp.519,522, 21-25 July 2013
1939 2014 IEEE International Ultrasonics Symposium ProceedingsAuthorized licensed use limited to: Illinois Institute of Technology. Downloaded on October 02,2020 at 06:20:45 UTC from IEEE Xplore. Restrictions apply.