multifamily report - westlake · pdf filemultifamily report viewpoint 2017 / commercial real...
TRANSCRIPT

MULTIFAMILY REPORTVIEWPOINT 2017 / COMMERCIAL REAL ESTATE TRENDS
With the exception of a few high-end markets that have gotten over their skis in the past year or two, the displacement of demand from the single-family ownership market to the multifamily residential market is making the rental apartment sector by
far the stronger of the housing market segments. The key element is this: for the balance of this decade, at least, the fundamentals for rental housing are vastly superior to the fundamentals for homeownership.
By: Hugh F. Kelly, PhD, CRE
Demographic Trends Supporting the Multifamily Sector
An Integra Realty Resources Publication irr.com

The real question is how will demographic trends drive housing demand? Here’s the shorthand answer. The age cohort 18 – 44 years will expand from roughly 116 million to about 128 million by 2040. Virtually every one of those additional 12 million residents will, at one point or another, be a renter.
In 2017, though, the market faces some tensions. There is strong motivation for builders to overweight development toward upper-income units, reflecting both higher profit margins and the increasing cost of construction. But, new jobs have been largely in low - and moderate - income occupations, and the “diverted demand” of former homeowners comes with budgetary and credit constraints. The challenge for multifamily will be to broaden its range of offerings to match the full spectrum of demand.
Many question the durability of Millennials as a demand segment. With 83 million in the generation, some will remain urban-oriented; others will find the suburbs attractive. Some will be life-long renters; others will move into ownership. Debating—or rather, guessing—what Millennials will do is fun, but not really enlightening.
The issue is more this: how will the overall population trends drive housing demand? Here’s the shorthand answer. The age cohort 18 – 44 years will expand from roughly 116 million to about 128 million by 2040. Virtually every one of those additional 12 million residents will, at one point or another, be a renter.
In 2017, though, the market faces some tensions. There is strong motivation for builders to overweight development toward upper-income units, reflecting both higher profit margins and the increasing cost of construction. But, new jobs have been largely in low - and moderate - income occupations, and the “diverted demand” of former homeowners comes with budgetary and credit constraints. The challenge for multifamily will be to broaden its range of offerings to match the full spectrum of demand.
Transaction VolumeAs other property types saw their overall transaction volume pull back, the multifamily sector saw its investment surge push forward. By the end of 3Q 2016, overall apartment investment was up 22.4% from the prior year, to a historic high level of $163.7 billion. The East saw a breathtaking 47.7% growth in volume, followed by a 29% increase in the West. The South and the Central states had more modest gains of 8.2% and 1.7%, respectively.
2
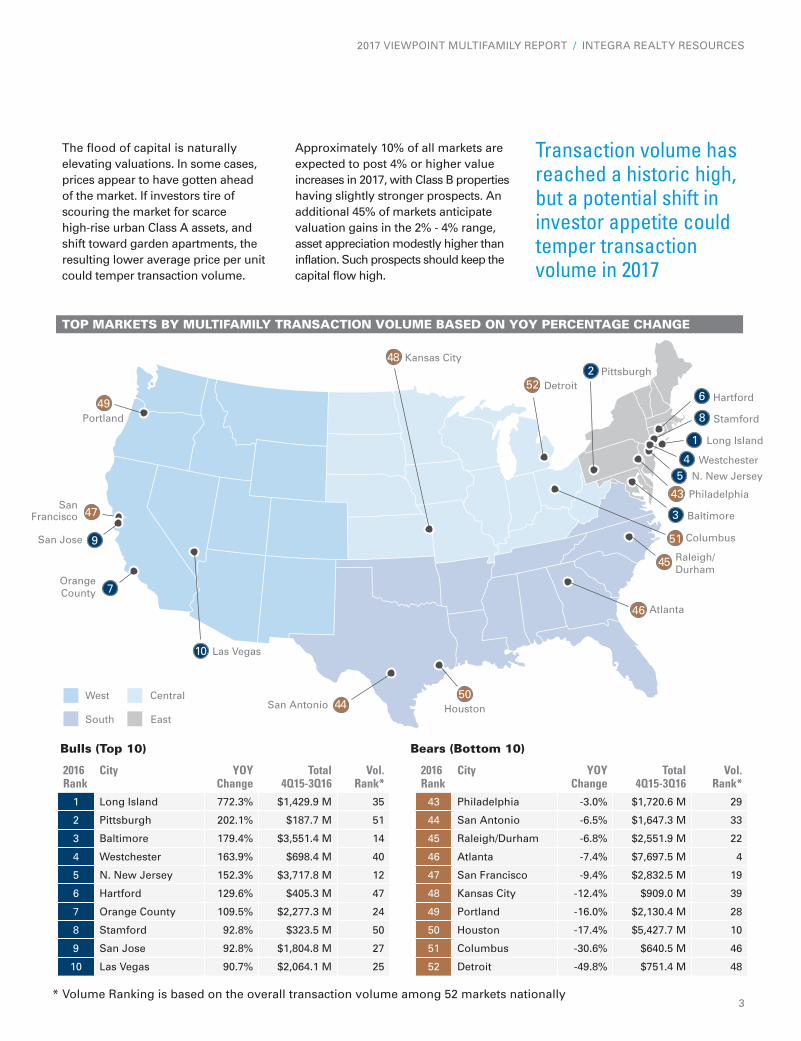
TOP MARKETS BY MULTIFAMILY TRANSACTION VOLUME BASED ON YOY PERCENTAGE CHANGE
2016 Rank
City YOY Change
Total 4Q15-3Q16
Vol. Rank*
1 Long Island 772.3% $1,429.9 M 35
2 Pittsburgh 202.1% $187.7 M 51
3 Baltimore 179.4% $3,551.4 M 14
4 Westchester 163.9% $698.4 M 40
5 N. New Jersey 152.3% $3,717.8 M 12
6 Hartford 129.6% $405.3 M 47
7 Orange County 109.5% $2,277.3 M 24
8 Stamford 92.8% $323.5 M 50
9 San Jose 92.8% $1,804.8 M 27
10 Las Vegas 90.7% $2,064.1 M 25
2016 Rank
City YOY Change
Total 4Q15-3Q16
Vol. Rank*
43 Philadelphia -3.0% $1,720.6 M 29
44 San Antonio -6.5% $1,647.3 M 33
45 Raleigh/Durham -6.8% $2,551.9 M 22
46 Atlanta -7.4% $7,697.5 M 4
47 San Francisco -9.4% $2,832.5 M 19
48 Kansas City -12.4% $909.0 M 39
49 Portland -16.0% $2,130.4 M 28
50 Houston -17.4% $5,427.7 M 10
51 Columbus -30.6% $640.5 M 46
52 Detroit -49.8% $751.4 M 48
Bulls (Top 10) Bears (Bottom 10)
West
South East
Central
48 Kansas City
45 Raleigh/Durham
43 Philadelphia
44San Antonio
47San
Francisco
49Portland
52 Detroit
51 Columbus
50Houston
46 Atlanta
1 Long Island
5 N. New Jersey
8 Stamford
6 Hartford
2 Pittsburgh
7OrangeCounty
9San Jose
10 Las Vegas
3 Baltimore
4 Westchester
Transaction volume has reached a historic high, but a potential shift in investor appetite could temper transaction volume in 2017
The flood of capital is naturally elevating valuations. In some cases, prices appear to have gotten ahead of the market. If investors tire of scouring the market for scarce high-rise urban Class A assets, and shift toward garden apartments, the resulting lower average price per unit could temper transaction volume.
Approximately 10% of all markets are expected to post 4% or higher value increases in 2017, with Class B properties having slightly stronger prospects. An additional 45% of markets anticipate valuation gains in the 2% - 4% range, asset appreciation modestly higher than inflation. Such prospects should keep the capital flow high.
* Volume Ranking is based on the overall transaction volume among 52 markets nationally3
2017 VIEWPOINT MULTIFAMILY REPORT / INTEGRA REALTY RESOURCES

MULTIFAMILY MARKET CYCLE
RECOVERYHYPERSUPPLYEXPANSION
Decreasing Vacancy RatesLow New ConstructionModerate AbsorptionLow/Moderate Employment GrowthNeg/Low Rental Rate Growth
Increasing Vacancy RatesModerate/High New ConstructionLow/Negative AbsorptionModerate/Low Employment GrowthMed/Low Rental Rate Growth
Decreasing Vacancy RatesModerate/High New ConstructionHigh AbsorptionModerate/High Employment GrowthMed/High Rental Rate Growth
Increasing Vacancy RatesModerate/Low New ConstructionLow AbsorptionLow/Negative Employment GrowthLow/Neg Rental Rate Growth
RECESSION
Dayton, OHDetroit, MIJackson, MSLas Vegas, NVProvidence, RISacramento, CA
Atlanta, GABaltimore, MDDenver, CO
Houston, TXRaleigh, NC
Washington, DC
Austin, TXCleveland, OHColumbia, SCGreensboro, NCGreenville, SCHartford, CTIndianapolis, IN
Long Island, NYLos Angeles, CAMemphis, TNNaples, FLNew York, NYOrange County, CAOrlando, FL
Birmingham, ALBoise, IDBoston, MABroward-PB, FLCharleston, SCCharlotte, NCChicago, ILCincinnati, OHColumbus, OHDallas, TXFort Worth, TX
Jacksonville, FLKansas City, MO/KSLouisville, KYMiami, FLMinneapolis, MNNashville, TNNew Jersey, CoastalNew Jersey, No.Oakland, CAPhiladelphia, PAPhoenix, AZ
Pittsburgh, PAPortland, ORRichmond, VASalt Lake City, UTSan Francisco, CASan Jose, CASeattle, WASyracuse, NYTampa, FL
HYPERSUPPLY
RECESSION
EXPANSION
RECOVERY
San Diego, CASarasota, FLSt. Louis, MOTulsa, OKWilmington, DE
Market CycleAll signs point to a cyclical peak in the next year or two, as most apartment markets are in expansion. Ten percent of U.S. markets are already in hypersupply, where new construction is getting ahead of sustainable demand. Downtown Class A vacancies are in the double-digits in markets like Baltimore, Hartford, Charlotte, Nashville,
Oakland, and Portland. Supply/demand balance is superior in the suburbs, and for Class B markets in urban areas.
The pace of construction is accelerating, ramping up to a 2.7% expansion of inventory nationally. In individual markets, the numbers do suggest over-enthusiasm. Charleston and Charlotte in the Carolinas, Orlando and Naples in
The challenge for Multifamily will be to broaden its range of offerings to match the full spectrum of demand
4
Florida, Dallas and Austin in Texas, and Denver and Seattle in the West stand out as examples. Houston, Atlanta, and Raleigh are in hypersupply, joined by Baltimore and Washington DC in the East.
On a more positive note, some markets that were slow to join the expansion are now enjoying stronger conditions, notably Coastal New Jersey, Wilmington, and Hartford.
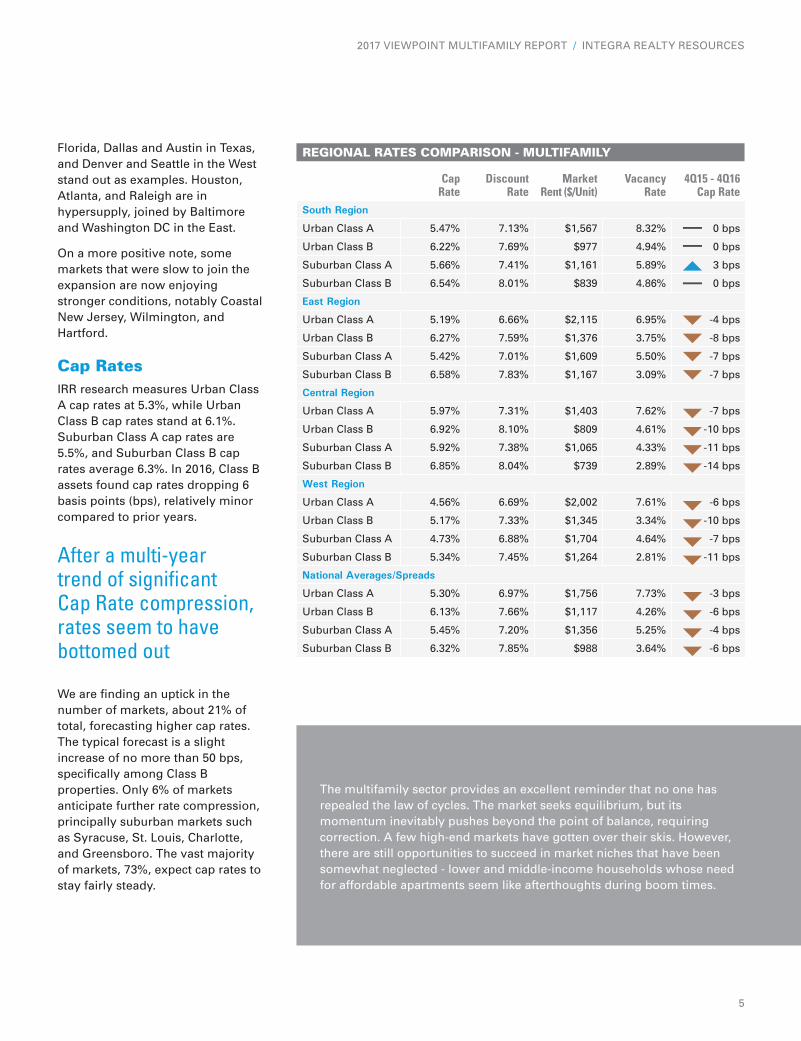
Cap RatesIRR research measures Urban Class A cap rates at 5.3%, while Urban Class B cap rates stand at 6.1%. Suburban Class A cap rates are 5.5%, and Suburban Class B cap rates average 6.3%. In 2016, Class B assets found cap rates dropping 6 basis points (bps), relatively minor compared to prior years.
After a multi-year trend of significant Cap Rate compression, rates seem to have bottomed out
We are finding an uptick in the number of markets, about 21% of total, forecasting higher cap rates. The typical forecast is a slight increase of no more than 50 bps, specifically among Class B properties. Only 6% of markets anticipate further rate compression, principally suburban markets such as Syracuse, St. Louis, Charlotte, and Greensboro. The vast majority of markets, 73%, expect cap rates to stay fairly steady.
Conclusion
REGIONAL RATES COMPARISON - MULTIFAMILY
Cap Rate
Discount Rate
Market Rent ($/Unit)
Vacancy Rate
4Q15 - 4Q16 Cap Rate
South Region
Urban Class A 5.47% 7.13% $1,567 8.32% 0 bps
Urban Class B 6.22% 7.69% $977 4.94% 0 bps
Suburban Class A 5.66% 7.41% $1,161 5.89% 3 bps
Suburban Class B 6.54% 8.01% $839 4.86% 0 bps
East Region
Urban Class A 5.19% 6.66% $2,115 6.95% -4 bps
Urban Class B 6.27% 7.59% $1,376 3.75% -8 bps
Suburban Class A 5.42% 7.01% $1,609 5.50% -7 bps
Suburban Class B 6.58% 7.83% $1,167 3.09% -7 bps
Central Region
Urban Class A 5.97% 7.31% $1,403 7.62% -7 bps
Urban Class B 6.92% 8.10% $809 4.61% -10 bps
Suburban Class A 5.92% 7.38% $1,065 4.33% -11 bps
Suburban Class B 6.85% 8.04% $739 2.89% -14 bps
West Region
Urban Class A 4.56% 6.69% $2,002 7.61% -6 bps
Urban Class B 5.17% 7.33% $1,345 3.34% -10 bps
Suburban Class A 4.73% 6.88% $1,704 4.64% -7 bps
Suburban Class B 5.34% 7.45% $1,264 2.81% -11 bps
National Averages/Spreads
Urban Class A 5.30% 6.97% $1,756 7.73% -3 bps
Urban Class B 6.13% 7.66% $1,117 4.26% -6 bps
Suburban Class A 5.45% 7.20% $1,356 5.25% -4 bps
Suburban Class B 6.32% 7.85% $988 3.64% -6 bps
The multifamily sector provides an excellent reminder that no one has repealed the law of cycles. The market seeks equilibrium, but its momentum inevitably pushes beyond the point of balance, requiring correction. A few high-end markets have gotten over their skis. However, there are still opportunities to succeed in market niches that have been somewhat neglected - lower and middle-income households whose need for affordable apartments seem like afterthoughts during boom times.
5
2017 VIEWPOINT MULTIFAMILY REPORT / INTEGRA REALTY RESOURCES

About IRRIntegra Realty Resources (IRR) is the largest independent commercial real estate valuation and consulting firm in North America, with over 191 MAI-designated members of the Appraisal Institute among over 600 professionals based in our 49 offices throughout the United States and the Caribbean. Founded in 1999, the firm specializes in real estate appraisals, feasibility and market studies, expert testimony, and related property consulting services across all local and national markets. Our valuation and counseling services span all commercial property types and locations, from individual properties to large portfolio assignments.
About ViewpointIRR’s Viewpoint represents the compilation and presentation of Commercial Real Estate (CRE) rates, market conditions, and forecast data. The rates, market conditions, and forecast data is generated via IRR’s Viewpoint Survey. IRR’s Viewpoint Survey requests market experts consisting of Appraisers and Consultants, each of whom have deep CRE expertise, to provide insights on over 60 U.S. markets. Viewpoint data is collected across five asset classes including Multifamily, Office, Retail, Industrial, and Hospitality.
Viewpoint’s rates data (Cap Rates, Discount Rates, Reversion Rates, Vacancy Rates, etc.) reflects an expert’s opinion based on recent market activity experienced in the past 6 months. Viewpoint forecast data represents a 12-month outlook based on current market conditions. The data in Viewpoint reflects rates data and forecasts based on stabilized properties in the respective U.S. marketplace. Where referenced, all regional and national averages are based on simple average calculations and are not weighted.
IRR’s Viewpoint Survey is conducted through a proprietary data survey tool, and all data is checked both manually and by a specially designed computer editing procedure. While we do not guarantee that the survey is statistically accurate, the Viewpoint data provides, what we believe, is the best, clear-sighted insights into the CRE marketplace.
SourcesWritten By: Hugh F. Kelly, PhD, CRE
Top Markets by Multifamily Transaction Volume Based on YOY Percentage Change Source: Real Capital Analytics
Market Cycle Source: Integra Realty Resources
Regional Rates Comparison Source: Integra Realty Resources
Comprehensive Commercial Real Estate Market Research, Valuation and Advisory Services
Integra Realty Resources, Inc.
2000 S. Colorado Boulevard Suite 10800 Denver, CO 80222
irr.com
This publication includes analyses and opinions provided by third parties, and while the available data is presumed to be accurate, no representation or warranty is made regarding the accuracy of the information contained in this publication. This publication does not render legal, accounting, appraisal, counseling, investment or other professional advice. Should such services or other expert assistance be needed, it is recommended that the services of a competent person or firm, having access to the details of the situation, be employed.